Article

Impacts of Dam Operation on Vegetation Dynamics of Mid-Channel Bars in the Mid-Lower Yangtze River, China

1
Key Laboratory of Reservoir Aquatic Environment, Chongqing Institute of Green and Intelligent Technology, Chinese Academy of Sciences, Chongqing 400714, China
2
College of Architecture and Urban Planning, Chongqing Jiaotong University, Chongqing 400074, China
3
Chongqing School, University of Chinese Academy of Sciences, Chongqing 400714, China
4
Observation and Research Station of Ecological Restoration for Chongqing Typical Mining Areas, Ministry of Natural Resources, Chongqing Institute of Geology and Mineral Resources, Chongqing 401120, China
*
Author to whom correspondence should be addressed.
Remote Sens. 2021, 13(20), 4190; https://0-doi-org.brum.beds.ac.uk/10.3390/rs13204190
Submission received: 14 September 2021 / Revised: 12 October 2021 / Accepted: 15 October 2021 / Published: 19 October 2021
(This article belongs to the Special Issue Remote Sensing of Floodplain Rivers and Freshwater Ecosystems)

Abstract

:
Vegetation dynamics on mid-channel bars (MCBs) is essential for supporting ecosystem functions and associated services in river systems, especially in dammed large rivers. Generally, there are two possible changing patterns that vegetation of MCBs downstream a dam would experience. On one hand, the vegetation area may shrink because of a decrease in the MCB area in the post-dam period, which has been observed in many rivers around the world. On the other hand, the MCB vegetation area may expand because flood disturbances would be weakened by dam operation. However, little evidence has been reported to clarify such confusion. Therefore, vegetation dynamics of MCBs in the mid-lower Yangtze River downstream the Three Gorges Dam (TGD; the world’s largest dam) is selected as a case study to address the issue. Using long-term (1987–2017) Landsat archive images, this study reveals the spatiotemporal variations of vegetation area change intensities (VACIs; indicated by dynamic trends) on MCBs in the mid-lower Yangtze River. Results show that an overall VACI in the post-dam period (2003–2017) is about three times faster than that in the pre-dam period (1987–2002). In other words, the rate of vegetation colonization accelerated after the TGD operation began in 2003. Moreover, the VACIs in the post-dam period are size dependent, where large size MCBs are likely to gain higher VACIs: Small-sized MCBs (0.33 km2/yr), medium-sized MCBs (1.23 km2/yr), large-sized MCBs (1.49 km2/yr). In addition, VACIs of individual MCBs in the post-dam period are distance dependent, where the further a MCB was from the TGD, the higher the VACI. It is also suggested that the weakened flood disturbances in the post-dam could explain the rapid vegetation growth and colonization. This work is not only beneficial for managing and protecting MCBs downstream the TGD after its operation, but is also helpful in understanding vegetation dynamics of MCBs in other dammed river systems around the world.

1. Introduction

Mid-channel bars (MCBs) are elevated regions of sediment (such as sand or gravel) that has been deposited by water flow [1]. They are commonly present in various sized rivers around the world [2,3]. As a typical fluvial landform, MCBs are often focused on by engineering projects, such as maintaining channel stability and navigation safety [4,5]. In recent decades the ecological functions of MCBs have been gradually recognized thanks to their characteristics of isolation and edge effects [6,7]. For example, they can function as spawning habitats for endangered species [8] and provide stepping stones for migratory birds [9].
Vegetation (referring here to natural vegetation, including trees, shrubs, grasses etc., which is not disturbed by human activities) plays a key role in maintaining MCBs’ ecological functions [10,11]. Vegetation can increase sediment deposition by reducing overflow rate, which in turn could expand or elevate MCBs [12], while the roots of vegetation can stabilize MCBs by reducing soil erosion during floods [13]. Therefore, understanding vegetation dynamic patterns in MCBs is important for predicting MCB evolutions in river systems. This is particularly important for rivers where sediment regimes have been heavily altered by anthropogenic activities such as damming [14,15].
Constructing dams is a typical way to regulate rivers to meet many needs of human well-being [16], such as flood control, power generation, waterway dredging, and agricultural irrigation [17,18]. There are 58,713 river dams worldwide [19] and their ecological impacts have attracted people’s attention in recent decades [20,21]. Dams isolate rivers from floodplains and wetlands and cause significant changes to downstream riparian habitats (including MCBs) by altering hydrological regimes [22,23,24]. In the Colorado River, the annual flood peak was greatly reduced and the sediment regime was changed due to the construction of canyon dams [25]. As a result, riparian vegetation expanded rapidly in the dams downstream and swamps formed in the lower reach [26,27,28]. Further studies have shown that the regulation of dams could significantly change vegetation dynamics in the downstream riparian zones [29,30,31]. For MCBs, however, the responses of vegetation dynamics to dam operation becomes complicated because the shape and area of MCBs [32] are often impacted by dam operations as well. This is especially the case for MCBs downstream of large dams; however, few studies on the relevant topic have been reported.
The Three Gorges Dam (TGD) in the upper reaches of the Yangtze River is the largest dam in the world [33]. It provides important services such as flood control, electricity generation, and shipping [34]. Nevertheless, its ecological impacts, such as downstream MCBs’ dynamics, have received much attention in recent years [35]. Before the closure of the TGD in 2003 [36], the dynamics of downstream MCBs were generally governed by natural hydrological regimes. However, the hydrological regimes were altered after the closure of the TGD, which caused significant changes to the morphological dynamics of MCBs [37,38]. Take area as an example; most MCBs (of middle and small sizes) were detected experiencing decreasing trends after dam operation began in 2003 [39].
Two possible changing patterns that vegetation of MCBs downstream a dam would be expected to follow are: (1) The vegetation area may shrink [3,40]; according to the classical species–area relationship, the reduction of the MCB area could result in vegetation decreasing [41,42]; (2) the MCB vegetation area may expand because flood disturbances (in terms of flooding time and frequency) would be weakened by dam operation [43,44,45]. Yet, little evidence has been reported to date on this. Therefore, this work tries to clarify these uncertainties. More specifically, the goals of this study are: (1) Explicating the spatiotemporal vegetation dynamics for MCBs of downstream TGD during pre-dam (1987–2002) and post-dam (2003–2017) periods, and (2) exploring potential impact factors of the dam operation on such vegetation dynamics. The results are expected to be helpful in understanding the dynamics of downstream MCBs and developing MCB protection measurements and management for both local and global applications.

2. Materials and Methods
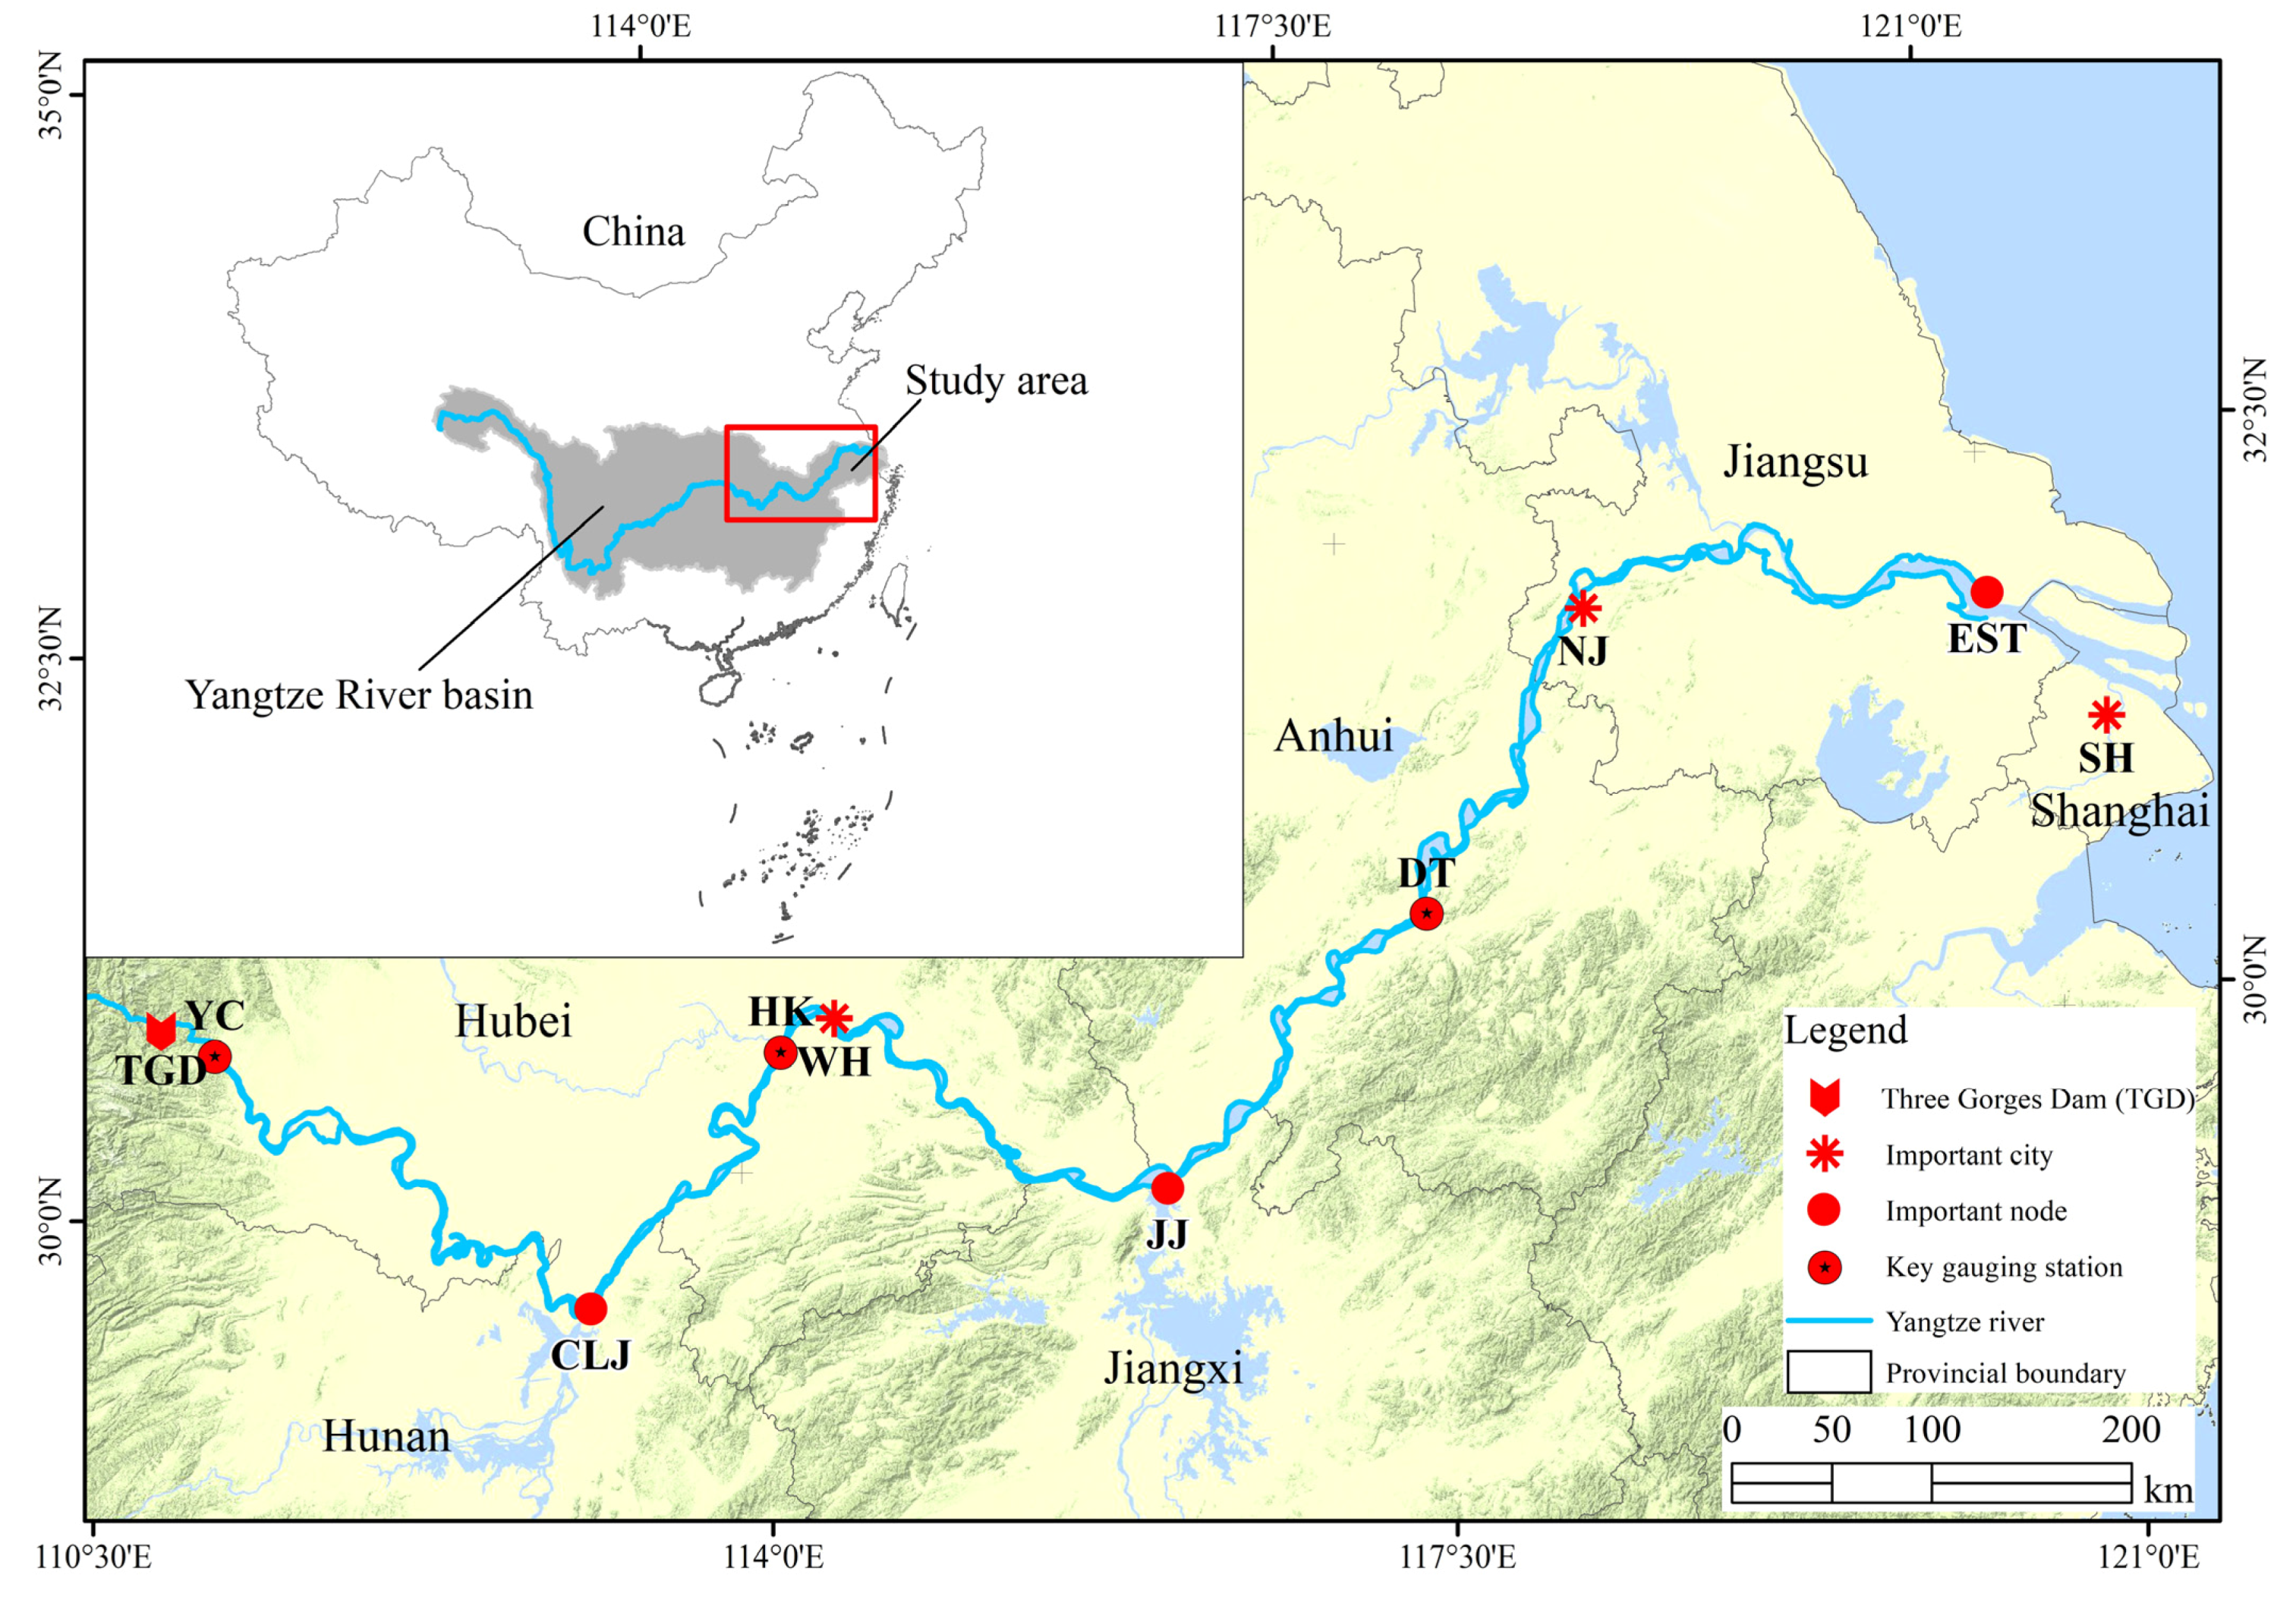
2.1. Study Area

The study area consists of MCBs downstream of the TGD located at the junction of the upper and middle reaches of the Yangtze River (Figure 1). The Yangtze River is the third longest river in the world. It originates in the Qinghai-Tibet Plateau and flows eastward to the East China Sea; the main stream is 6387 km long [46]. The downstream of the TGD flows through six provinces (Hubei, Hunan, Jiangxi, Anhui, Jiangsu, and Shanghai) and three provincial capitals (Wuhan (WH), Nanjing (NJ), and Shanghai City (SH)) all with dense population and fast economic growth [47]. Yichang (YC), Hankou (HK), and Datong (DT) are the key gauging stations in the study area and Chenglinji (CLJ), Jiujiang (JJ), and the estuary of the Yangtze River (EST) are important nodes when describing the study area, as seen in Figure 1. The climate of the study area is characterized by hot and humid summers with annual average temperature between 14 ℃–18 ℃ and annual average precipitation between 1000 mm–1400 mm [37]. It is a typical braided river and hosts hundreds of MCBs which play an important role in maintaining river system biodiversity and river channel stability [34,48].

2.2. Data Sources and Processing Methods

2.2.1. Data Sources

In order to obtain the long-term vegetation dataset of MCBs, Landsat series images from 1987 to 2017 were used as the data source to extract vegetation patches. The Landsat series images consist of Landsat-5 TM (1987–2011), Landsat-7 ETM+SLC-ON (1999–2003), Landsat-7 ETM+SLC-OFF (2009–2012), and Landsat-8 OLI (2013–2017). The image spatial resolution is 30 m. The product level of these images is level-2, which means images have been processed with atmospheric correction and geometric correction. Since each pixel value represents surface reflectance, the images are suitable for long-term comparative research. All images were ordered from the Earth Explorer of the United States Geological Survey (USGS) (https://earthexplorer.usgs.gov/, accessed on 18 October 2021) and downloaded from the USGS’s Earth Resources Observation and Science (EROS) Center Science Processing Architecture on Demand Interface (https://espa.cr.usgs.gov/, accessed on 18 October 2021).
Since vegetation in the MCBs is focused, the MCB polygon vector dataset generated in a previous study [38] was used to clip the spatial extent of the area for extracting vegetation. Moreover, some high spatial resolution images (3 m) obtained from the Planet Scope satellite constellation were collected. These images were employed to extract vegetation patches using visual interpretation to assess the accuracy of vegetation extracted from Landsat images using an automatic method as described in the following section. Therefore, the high spatial resolution images and the corresponding Landsat images were carefully selected to make sure they are spatially and temporally matched within eight days (see Table 1).

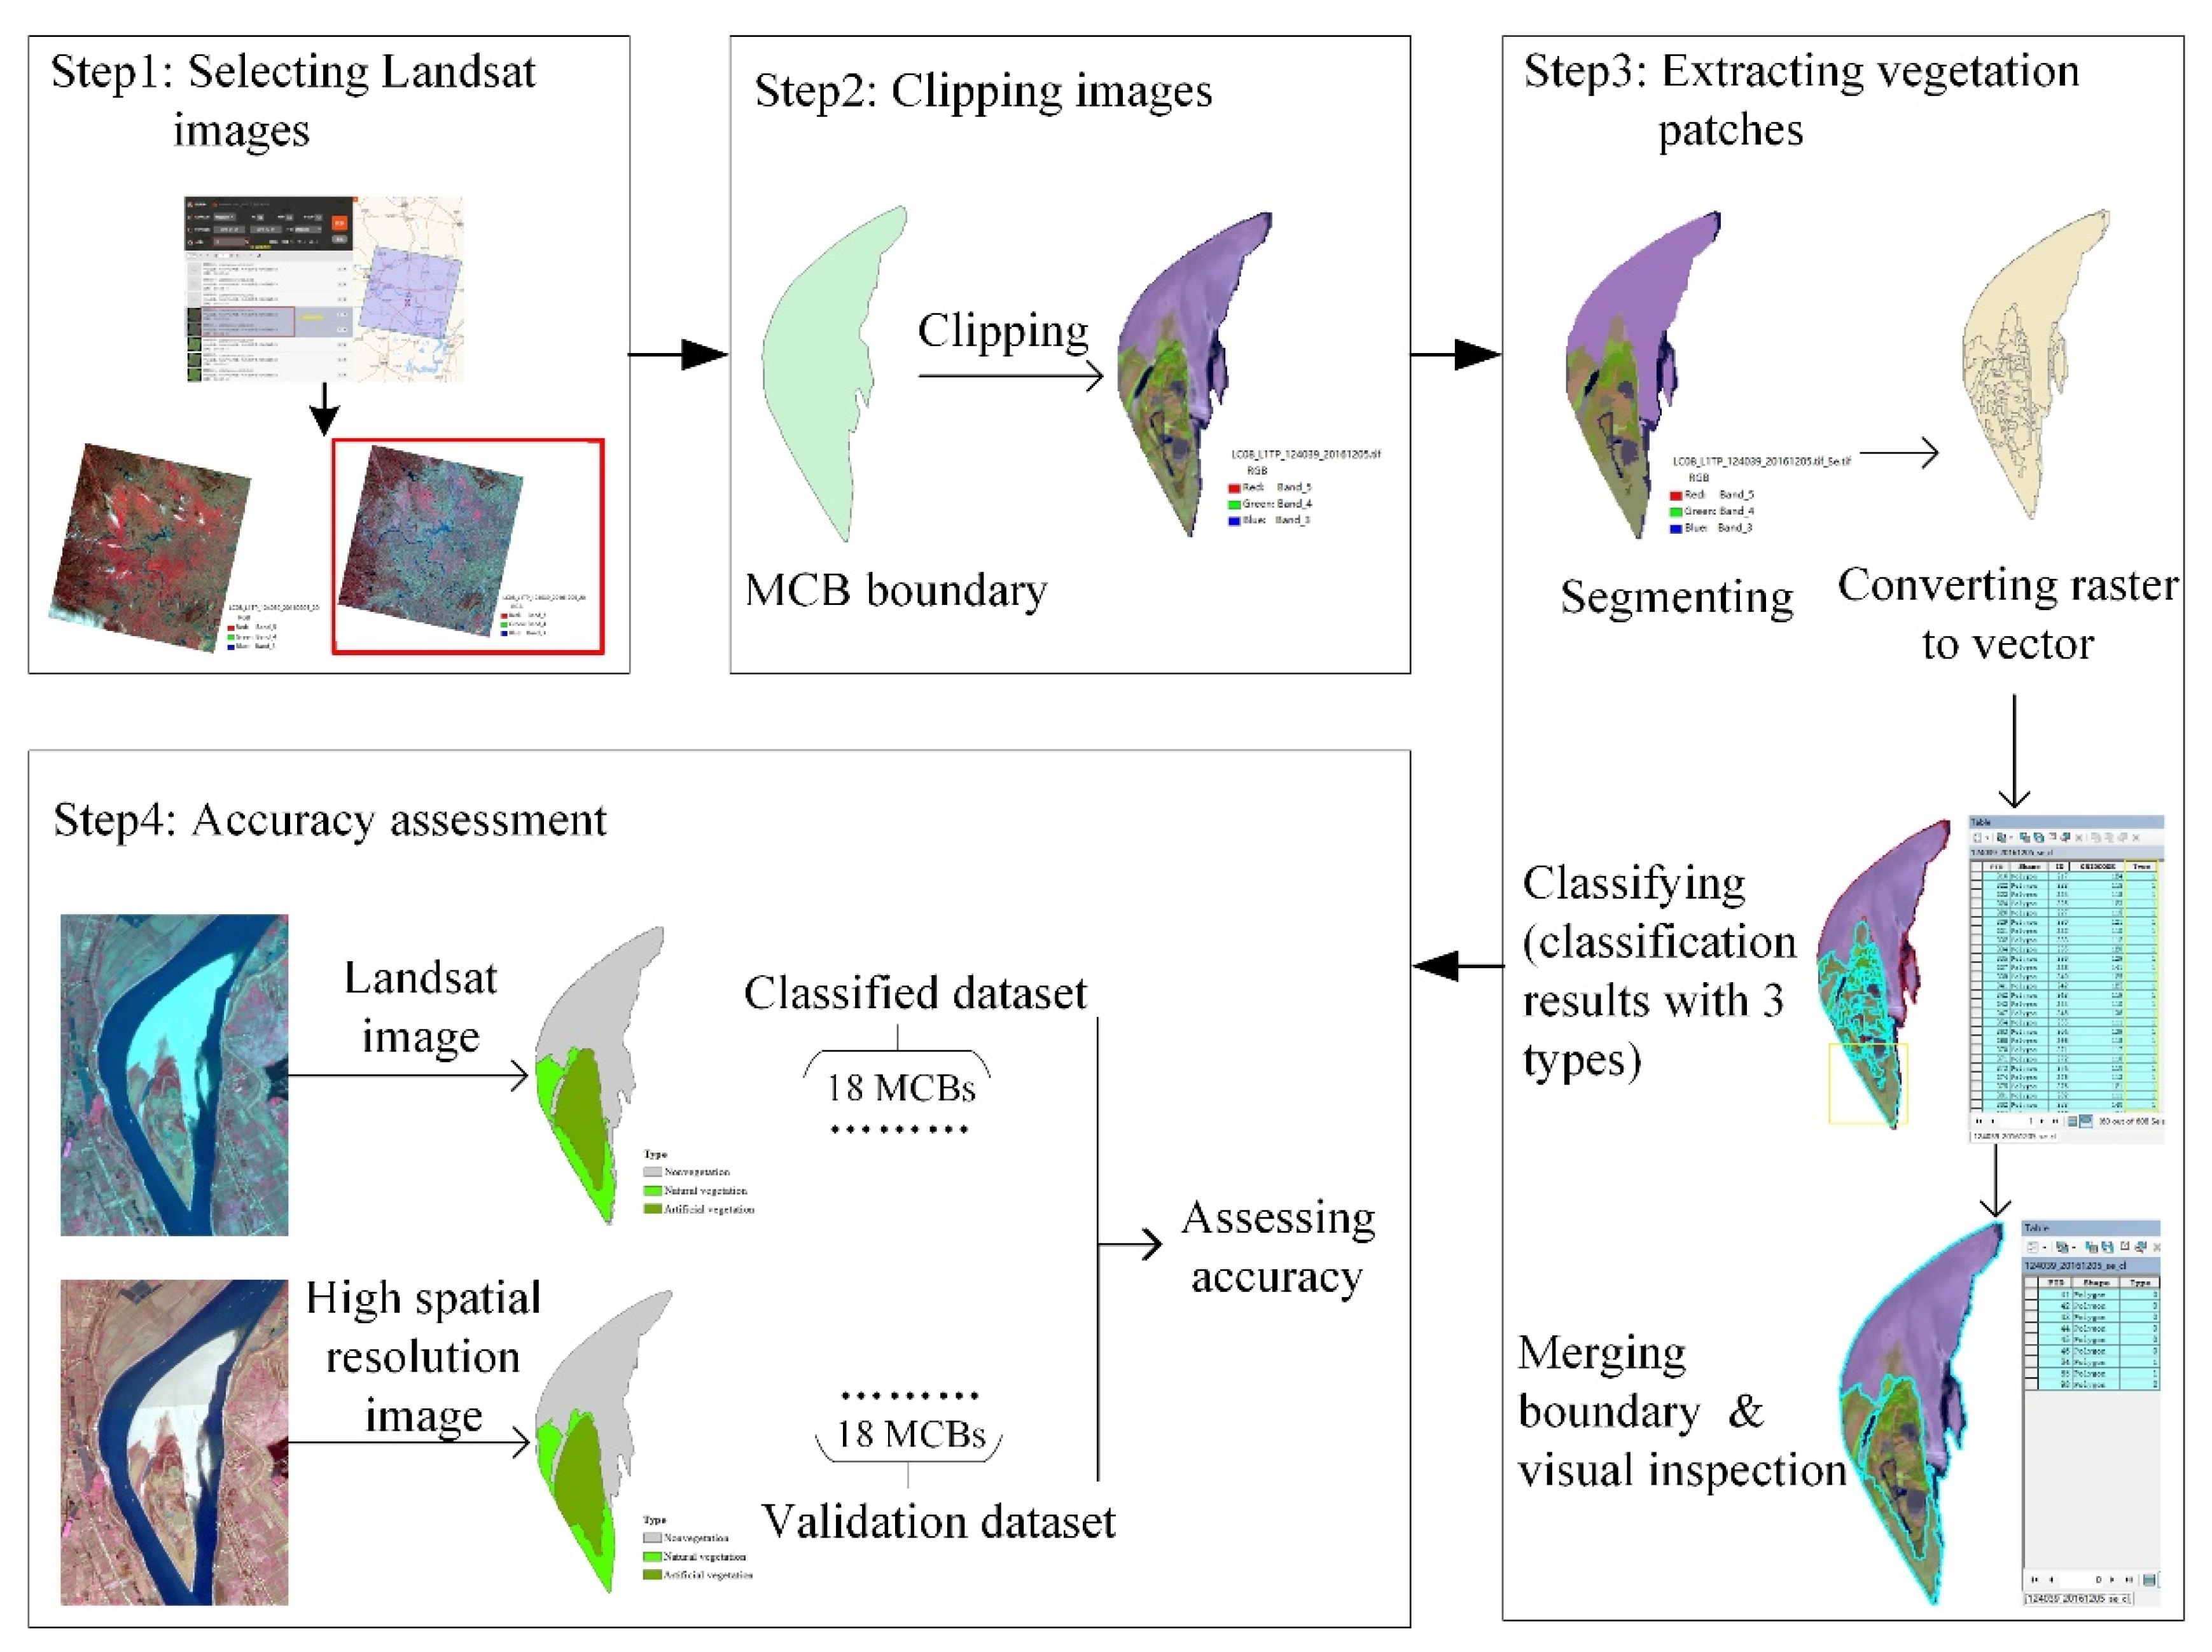
2.2.2. Extracting Vegetation Patches

As mentioned above, the vegetation patches of MCBs were extracted from Landsat images. This process is detailed in the following steps (Figure 2).
  • Step 1: Selecting Landsat images
Firstly, candidate images should meet two criteria: (1) Image acquisition dates were in the dry season (i.e., November to March) to reduce the area variation of MCBs caused by water level fluctuation [49,50]; and (2) cloud covers of images were less than 10%. Secondly, if several candidate images were selected in the same year, they were further screened manually by experts to make sure that only the image with the best vegetation growth condition was selected. Ultimately, 236 Landsat images were selected for extracting vegetation patches (see Supplementary Table S1).
  • Step 2: Clipping images
The MCB vector polygon was used to clip the focused area from Landsat images of this study to reduce the computational burden under ArcGIS environment (version: 10.4.0.5524).
  • Step 3: Extracting vegetation patches
Firstly, the image segmentation tool in ArcGIS environment was used to segment clipped Landsat images. The parameters of the segmentation procedure were determined by the trial-and-error approach. The segmentation procedure is detailed as follows: (1) We used the “Segment Mean Shift” tool in ArcGIS environment to segment the image, and the segmentation parameters were determined after many experiments (i.e., Spectral Detail: 15, Spatial Detail: 15, Minimum Segment Size in Pixels: 10 and Band Indexes: (band SWIR1, band NIR, and band Red)), and then converted the segmented raster data into vector format, i.e., segmented patches. Secondly, according to prior knowledge and visual interpretation, the segmented patches were classified manually into three types: Natural vegetation (i.e., trees, shrubs, and grasses, as defined in the introduction section), artificial vegetation (e.g., crops and plantations), and non-vegetation (e.g., sand land, water, built-up land, roads, etc.). Thirdly, the connected patches classified as the same type were merged. Finally, the boundaries of processed patches were further inspected and adjusted manually by comparing them to the corresponding raw images to improve the final classification accuracy.
  • Step 4: Accuracy assessment
As this study focused on dynamics of the natural vegetation in MCBs, the classified artificial vegetation patches were excluded in the accuracy assessment. We randomly selected 18 MCBs with different sizes and distribution locations along the downstream channel of the TGR. The classified natural vegetation patches (obtained from Landsat images) on these MCBs were extracted. The validation dataset (“true” natural vegetation patches) was obtained through visual interpretation from spatially and temporally matched high spatial resolution images (i.e., Planet Scope images). The area of MCBs and the area of the total natural vegetation were calculated for accuracy assessment.

2.2.3. Data Analysis Methods

This study attempts to: (1) Indicate temporal dynamics of natural vegetation patches in MCBs of downstream TGD; and (2) explore their potential impacting factors. To this end, two analysis methods were adopted.
(1) Characterizing temporal dynamics of natural vegetation
To detect temporal dynamics of natural vegetation area change intensities (VACIs, indicated by dynamic trends), a least square linear regression model was applied.
y = a + b t + ε
where y is the dependent variable representing the time series of the vegetation area and t is an independent variable representing years; a is the regression intercept; b is the regression trend (VACI); and ε is the error term of the regression. The significance of b was tested by F-test at a significance level of 95%.
To evaluate the effect of dam closure on vegetation dynamics, the difference between VACIs in pre-dam (1987–2002) and post-dam (2003–2017) periods was determined, see Equation (2).
D V A C I = b P o s t- d a m b P r e- d a m
where DVACI is an indicator of the dam closure effect on vegetation dynamics.
(2) Exploring the impact of potential factors on vegetation dynamics
The development of MCBs is usually scale dependent, which means the vegetation dynamics on different sizes of MCBs may vary. Therefore, MCB size could cause different trends in vegetation dynamics. To evaluate the effect of this factor, MCBs were grouped into three sizes according to previous studies [38]: Small size (SS, area < 2km2), medium size (MS, 2km2 < area < 7km2), and large size (LS, 7km2 < area < 33km2).
The effect of dam operation is also commonly considered as an important factor on environmental changes downstream of the dam [51]. Because the intensity of the dam operation effect diminishes longitudinally [32], we used the distance to the TGD as an indirect indicator of the dam operation effect.

3. Results

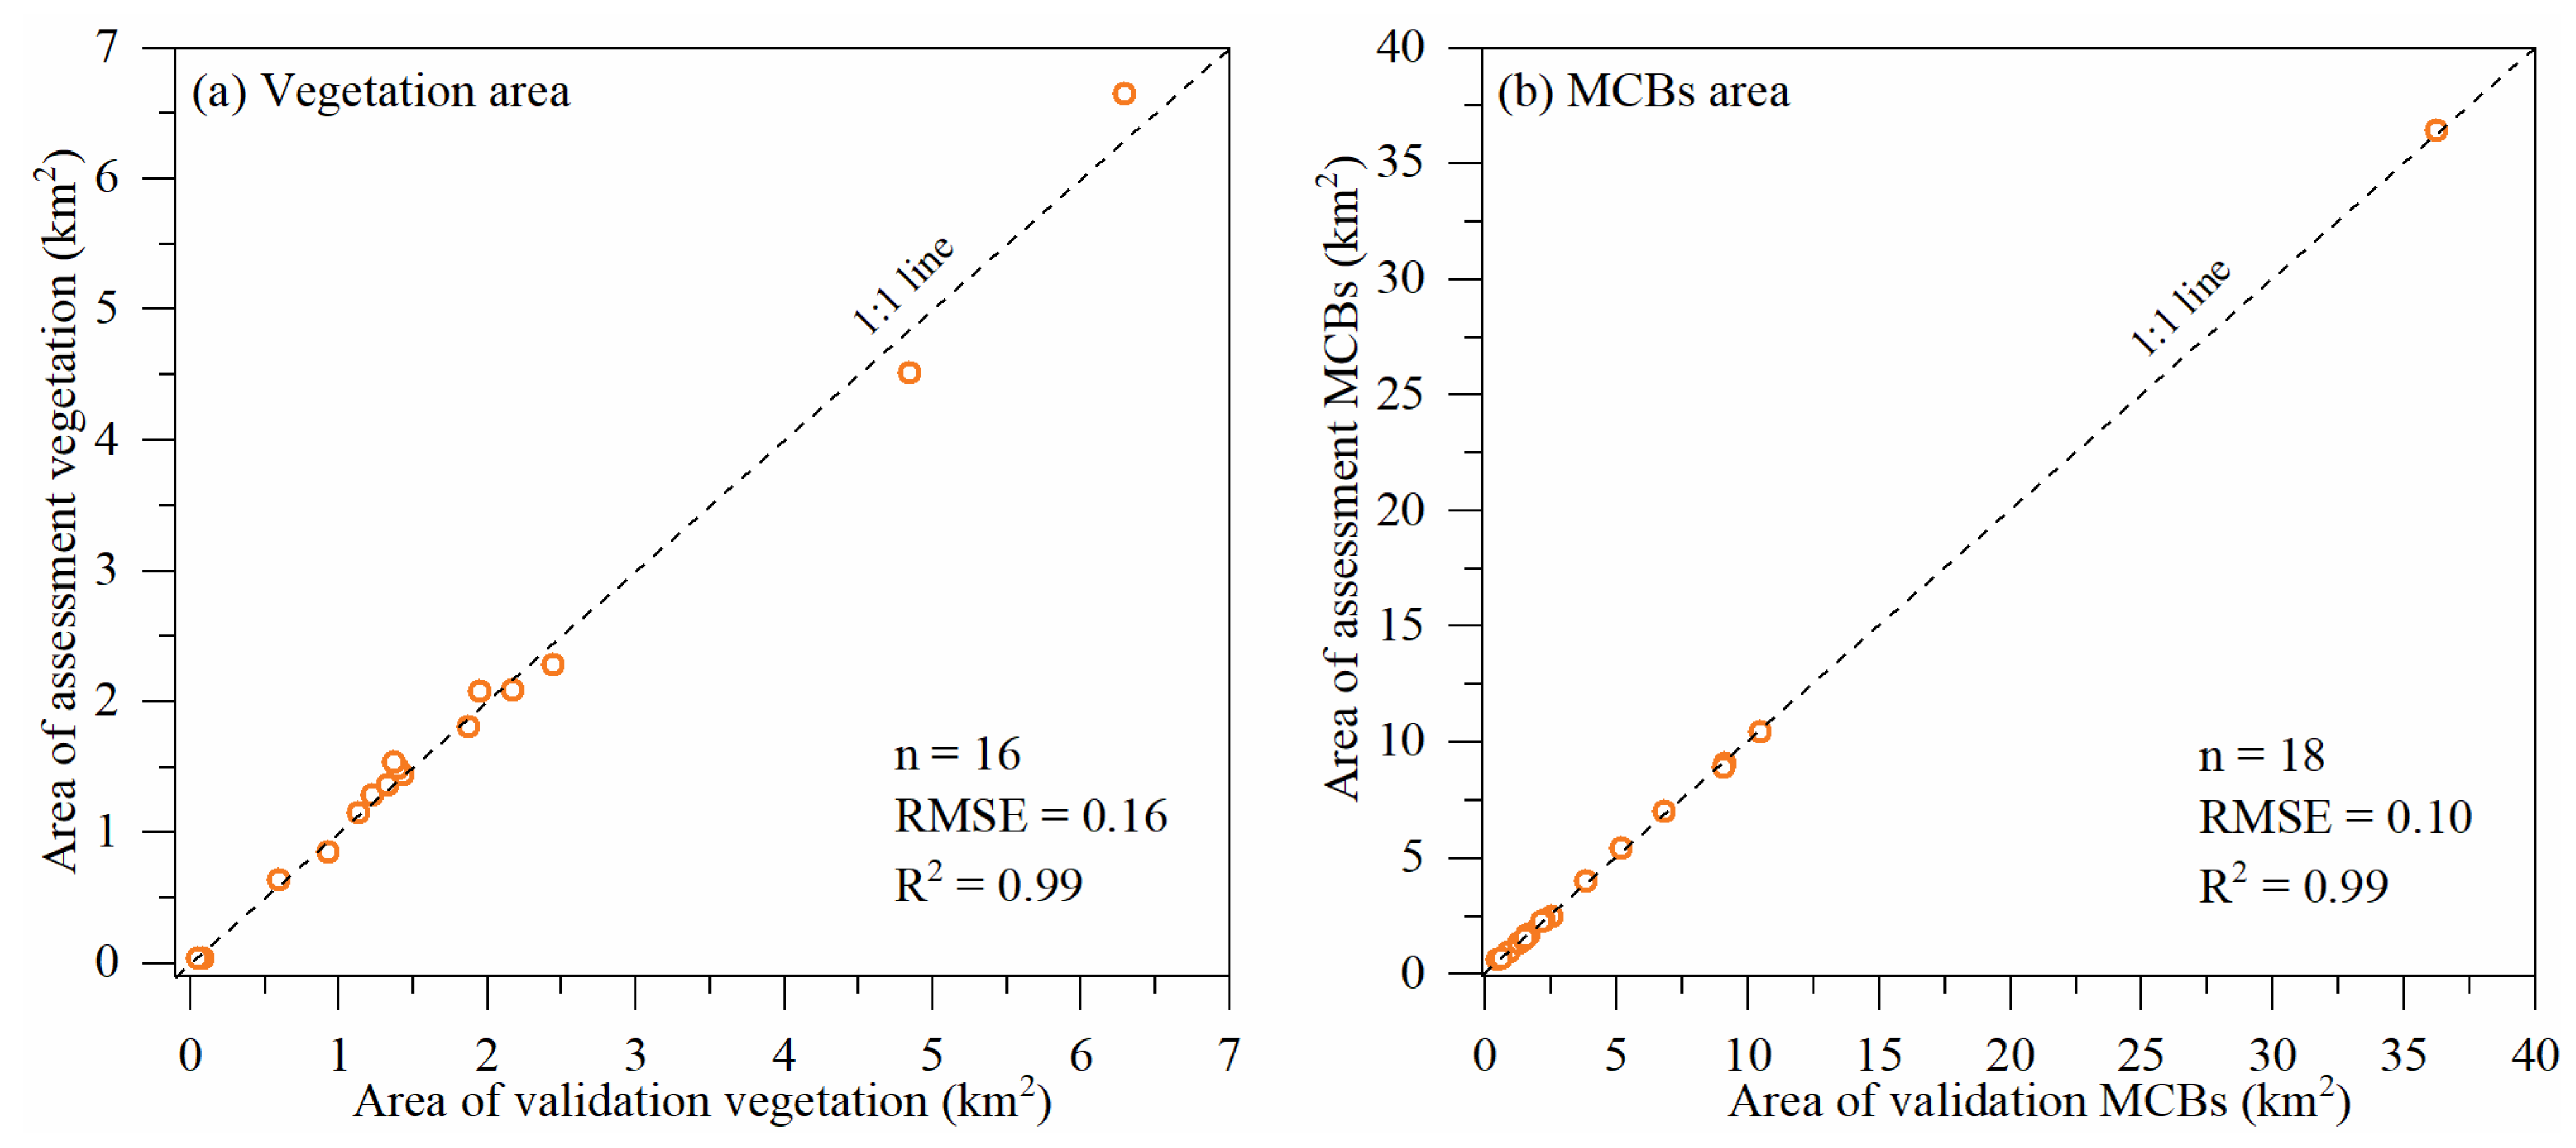
3.1. Accuracy Assessment of Extracted MCBs Dataset

The “ground-truth” datasets (vegetation area and MCB area) were obtained from Planet Scope high spatial resolution images. The evaluated datasets were extracted from temporally and spatially matched Landsat images. It is noteworthy that the relationship between the evaluated vegetation area and the “ground-truth” vegetation area show high consistency with R2 = 0.99 and RMSE = 0.16. The MCB area has similar results (R2 = 0.99 and RMSE = 0.10) (Figure 3). These observations imply that the data extraction method in this study is valid, and the extracted datasets are credible and accurate.

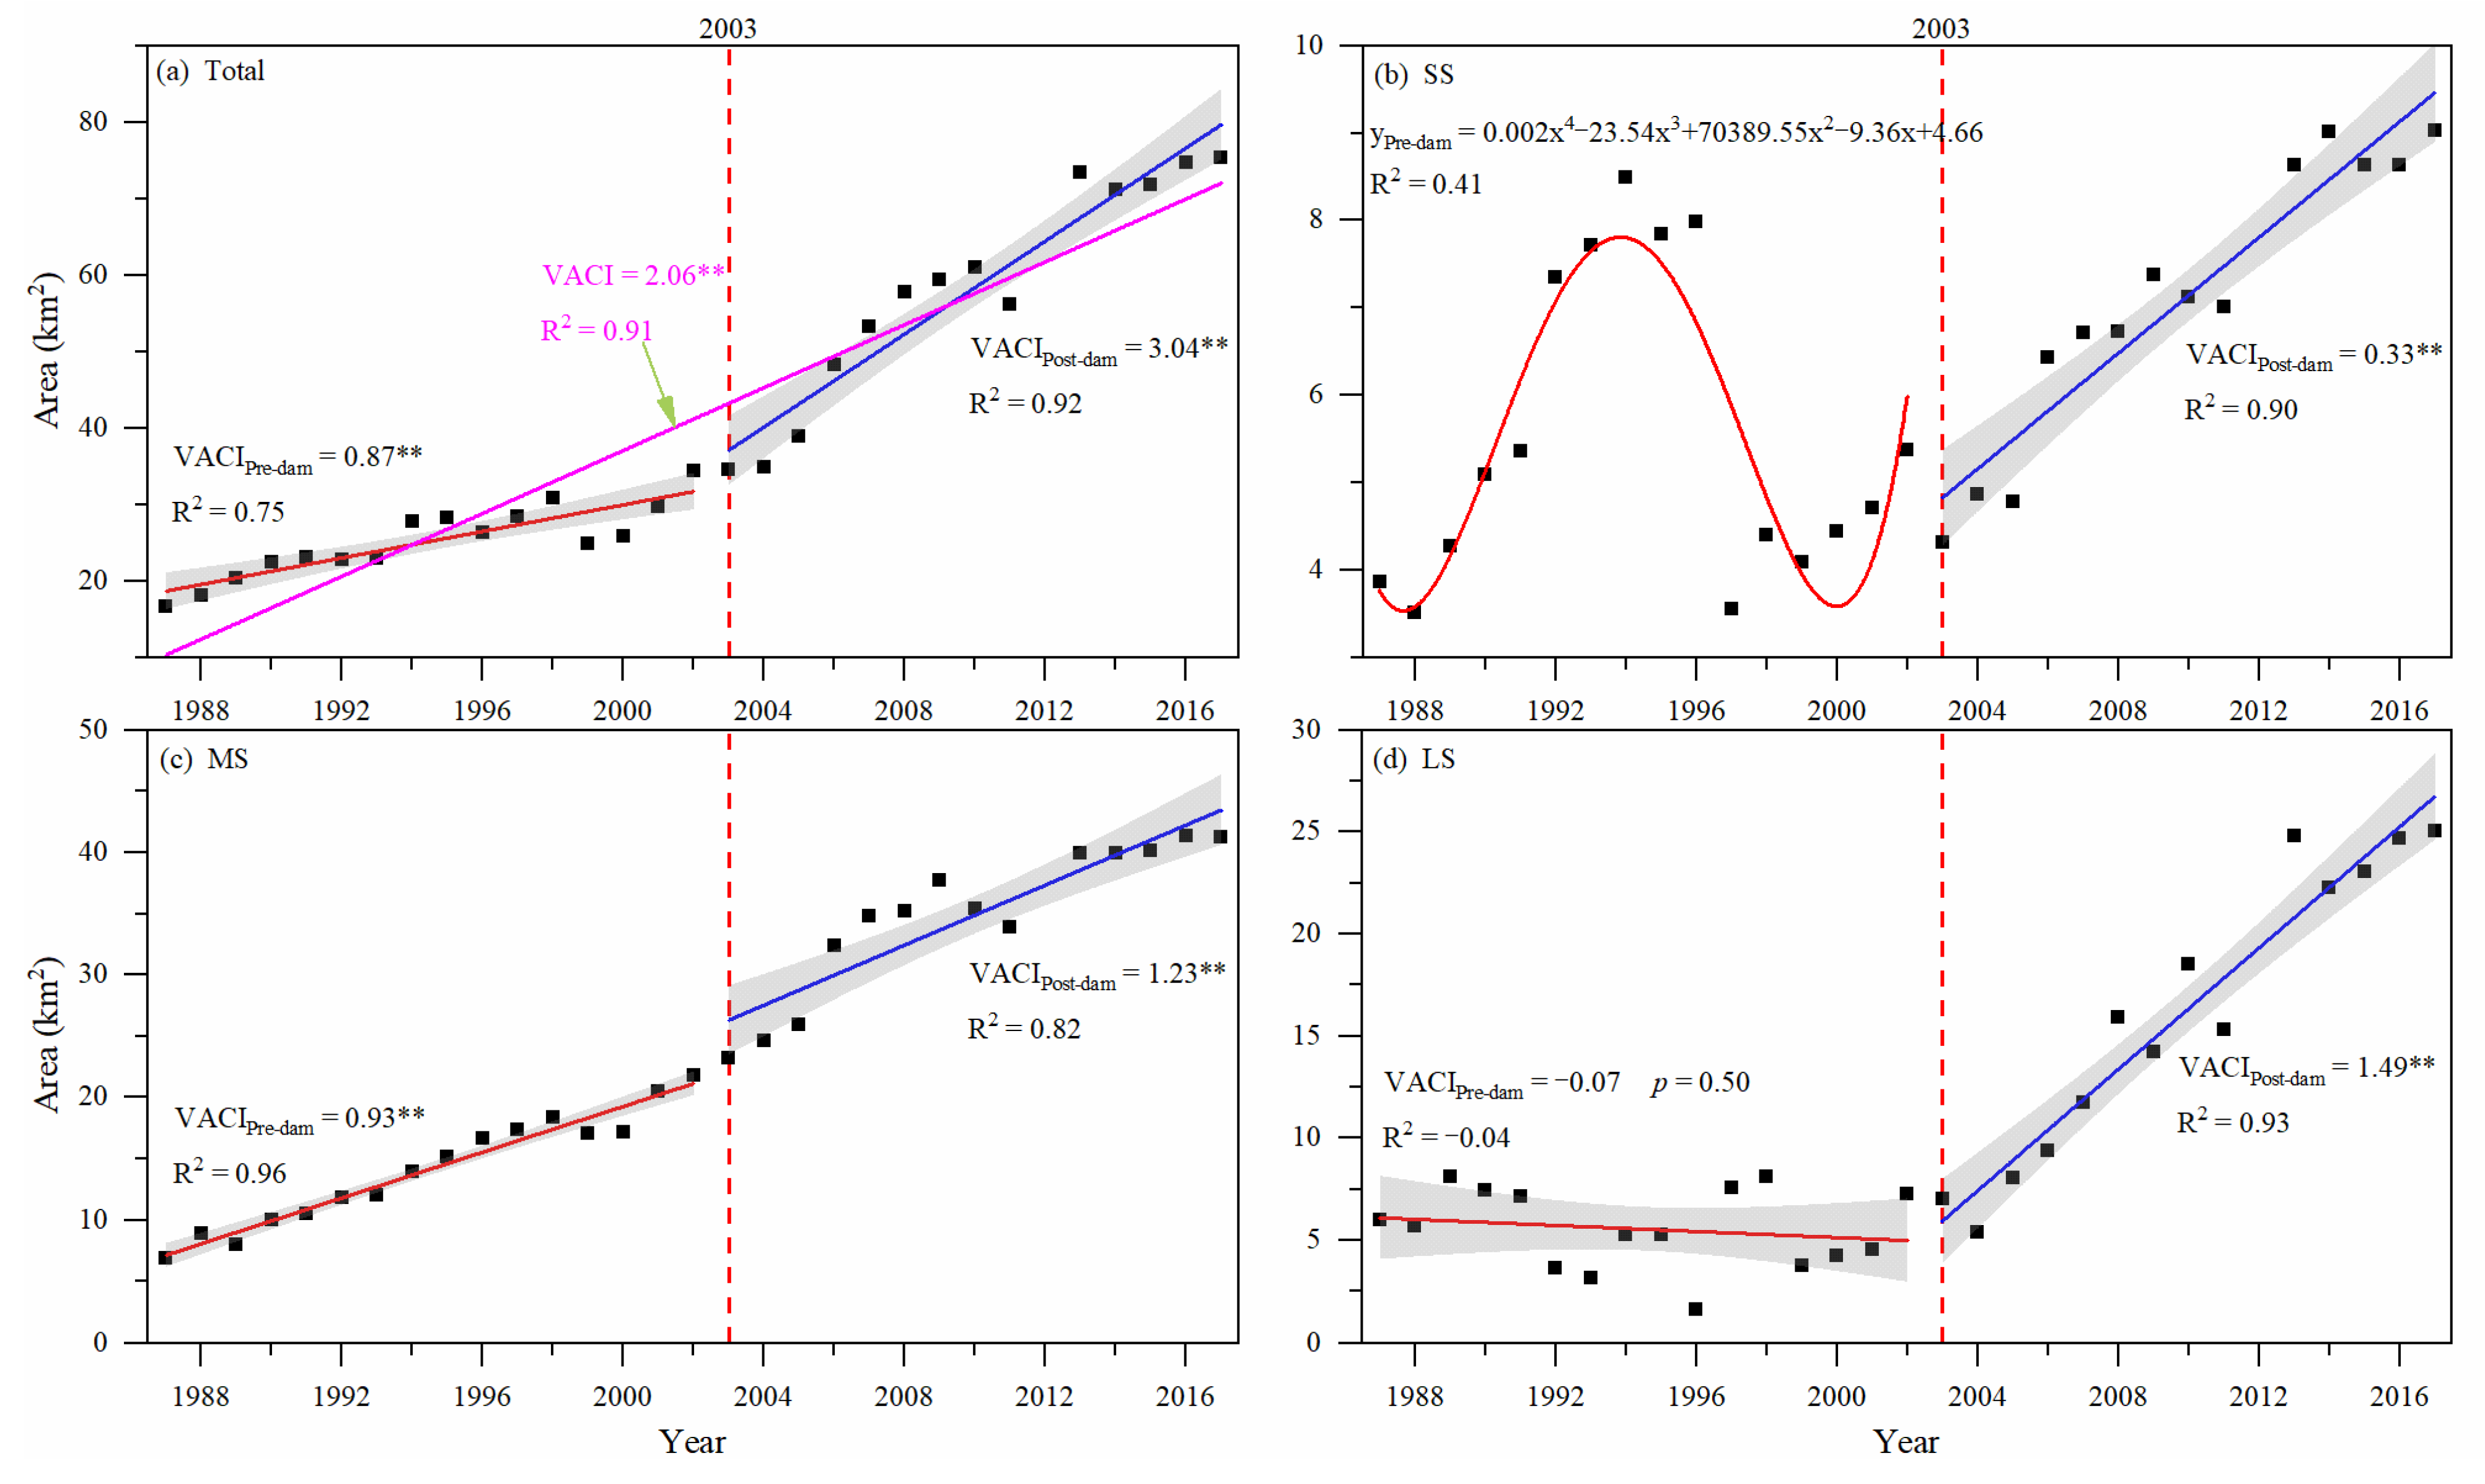
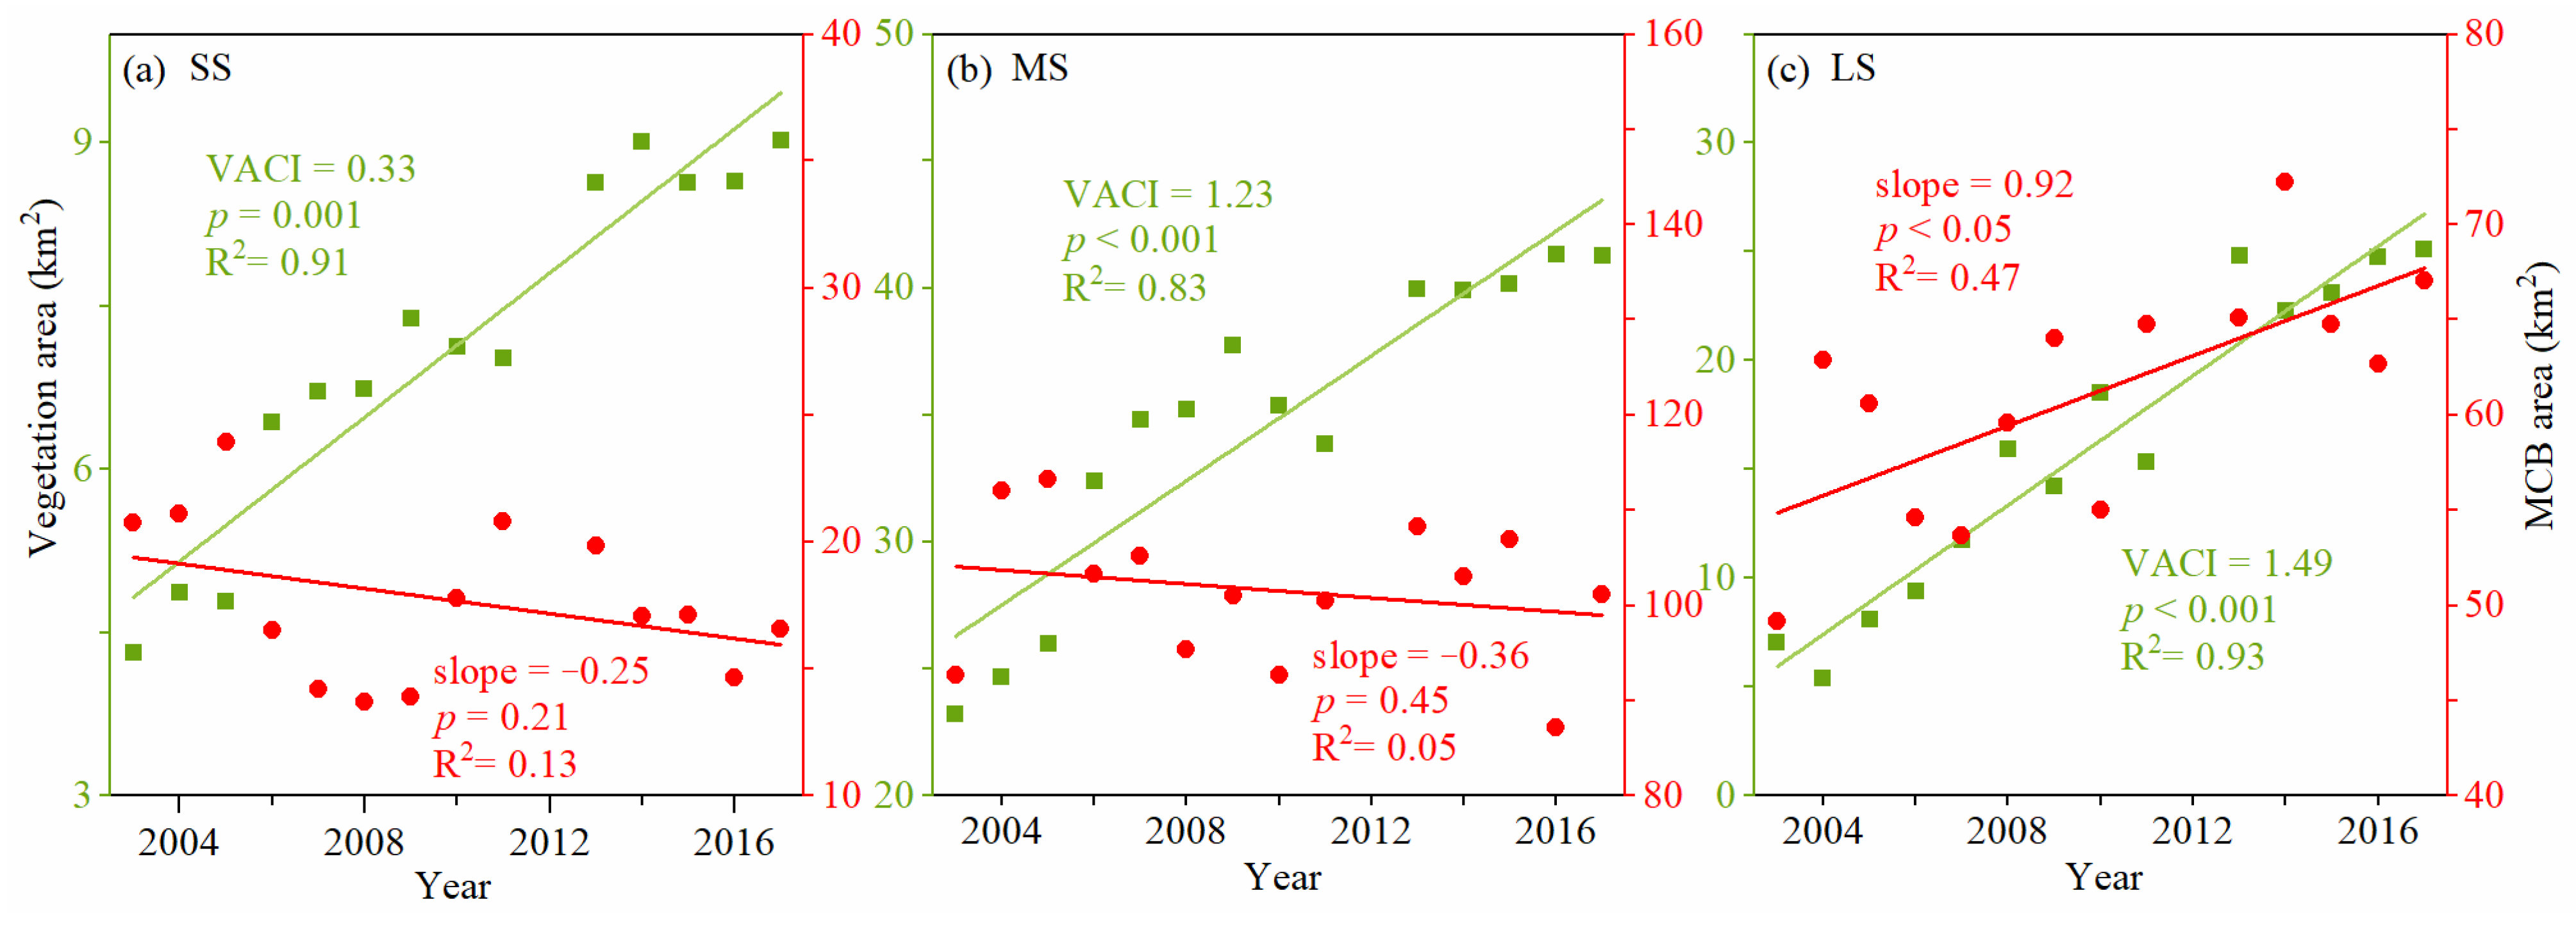
3.2. Overall VACIs in MCBs

From 1987 to 2017, the VACIs in the downstream MCBs of TGD were generally positive (Figure 4a). The total area of vegetation in 1987 was 16.73 km2. In 2017, it reached 75.39 km2 with an increase rate of 2.06 km2/yr (p < 0.001). Moreover, the overall VACI seems to involve two distinct periods: Pre-dam (1987–2002) and post-dam (2003–2017). Moreover, the VACI in the post-dam period is much higher (3.04 km2/yr, p < 0.001) than that in the pre-dam period (0.91 km2/yr, p < 0.001).
The scale effects of MCBs on vegetation dynamics were observed. For small-sized MCBs (Figure 4b), VACIs showed remarkable fluctuation in the pre-dam period, and exhibited an increase (0.33 km2/yr, p < 0.001) in the post-dam period. For medium-sized MCBs (Figure 4c), the vegetation area showed a positive increase in pre- and post-dam periods, but the VACI in the post-dam period was slightly larger than that in the pre-dam period (1.23 km2/yr vs. 0.93 km2/yr, p < 0.001 for both). When it comes to large-sized MCBs (Figure 4d), there was no statistically significant change of VACI in pre-dam period (p = 0.50). In the post-dam period, however, the VACIs showed a large increase (1.49 km2/yr, p < 0.001). Moreover, it is worth noting that as MCB sizes increase, the VACIs generally become larger (higher) in the post-dam period: 0.33 km2/yr (SS) < 1.23 km2/yr (MS) < 1.49 km2/yr (LS).

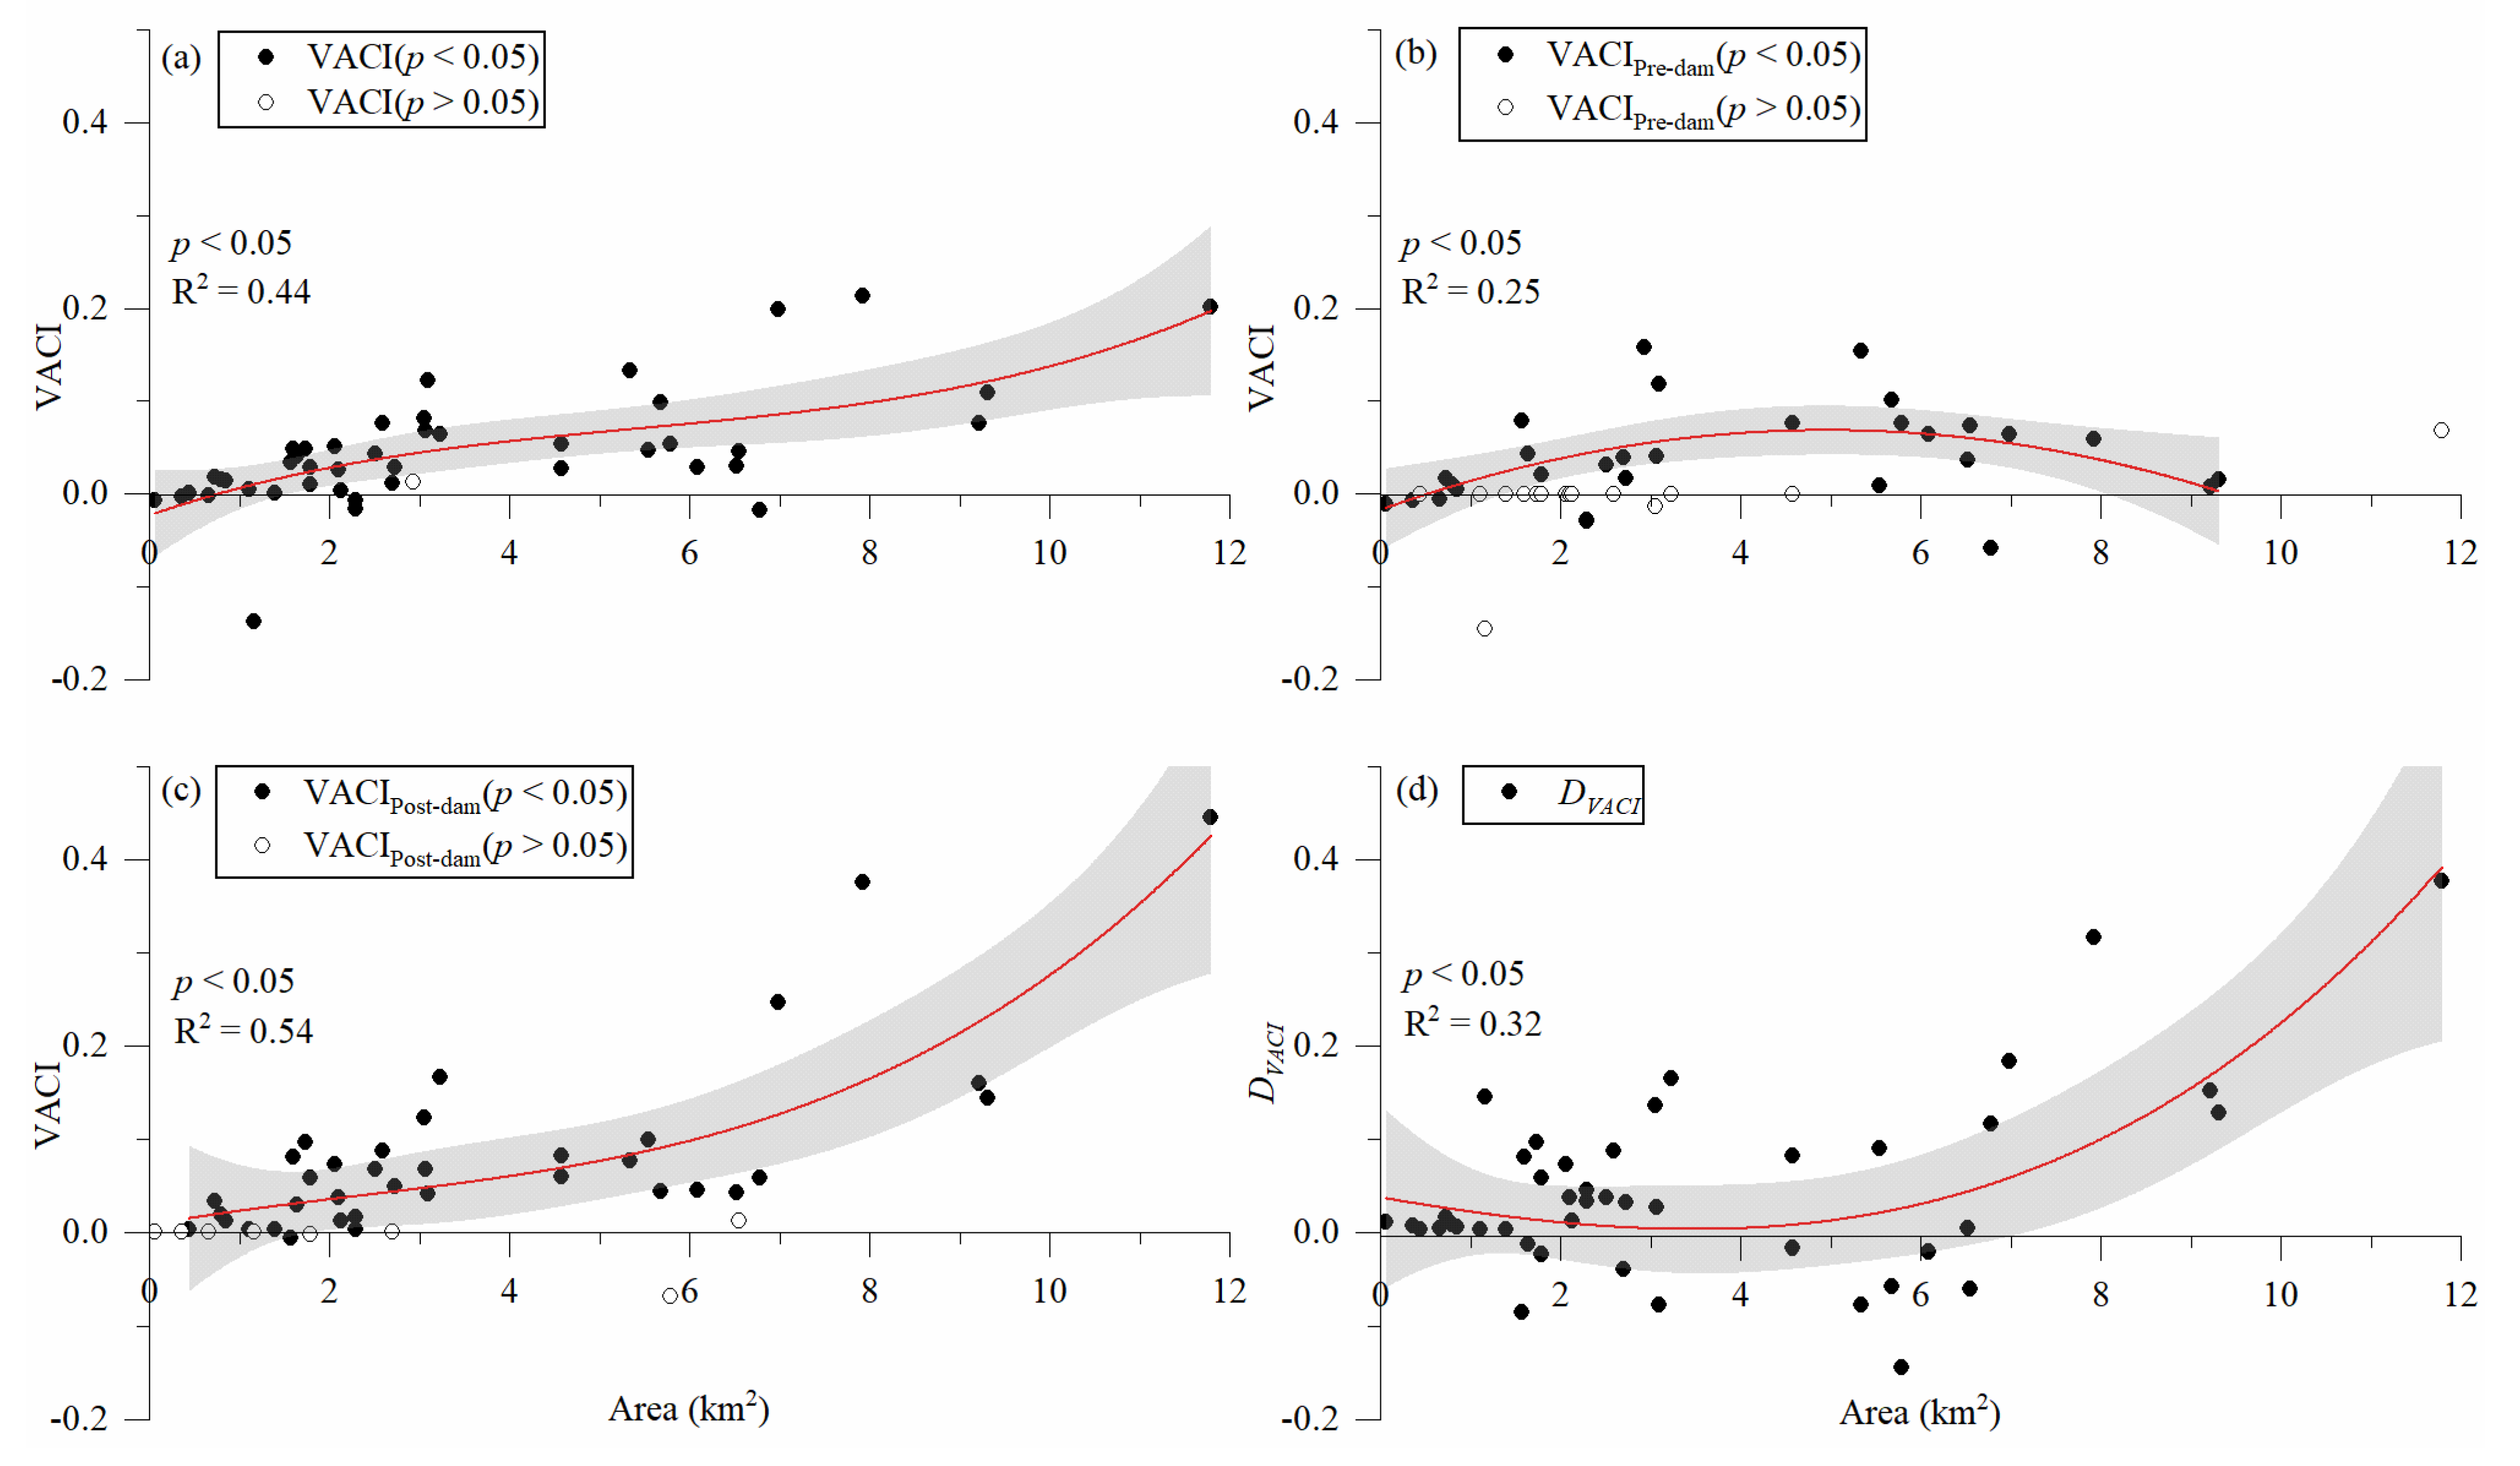
3.3. Relationship between the VACI and the Size of MCBs

From the perspective of the three MCB groups, the above findings suggest that MCBs with larger size could experience higher increasing VACIs in post-dam periods. This led us to investigate another question, that being, is there a relationship between the size of individual MCB and the VACI. Nonlinear regression analyses were used to reveal such a relationship.
For most MCBs, the VACIs in the three distinct periods (whole period: 1987–2017; pre-dam: 1987–2002; and post-dam: 2003–2017) are significantly positive (Figure 5a–c). The VACIs in the whole period (Figure 5a) increased as the MCBs’ size increased. The VACIs in the pre-dam period (Figure 5b) did not show linear trend changes but an up-and-down change pattern with increasing MCB sizes (p < 0.05). However, the VACIs in the post-dam period (Figure 5c) showed an increasing pattern (p < 0.05, R2 = 0.54) with increasing MCB sizes. The difference of VACIs post- and pre-dam period (Figure 5d) also showed an increasing changing pattern with increasing MCB sizes (p < 0.05, R2 = 0.32).

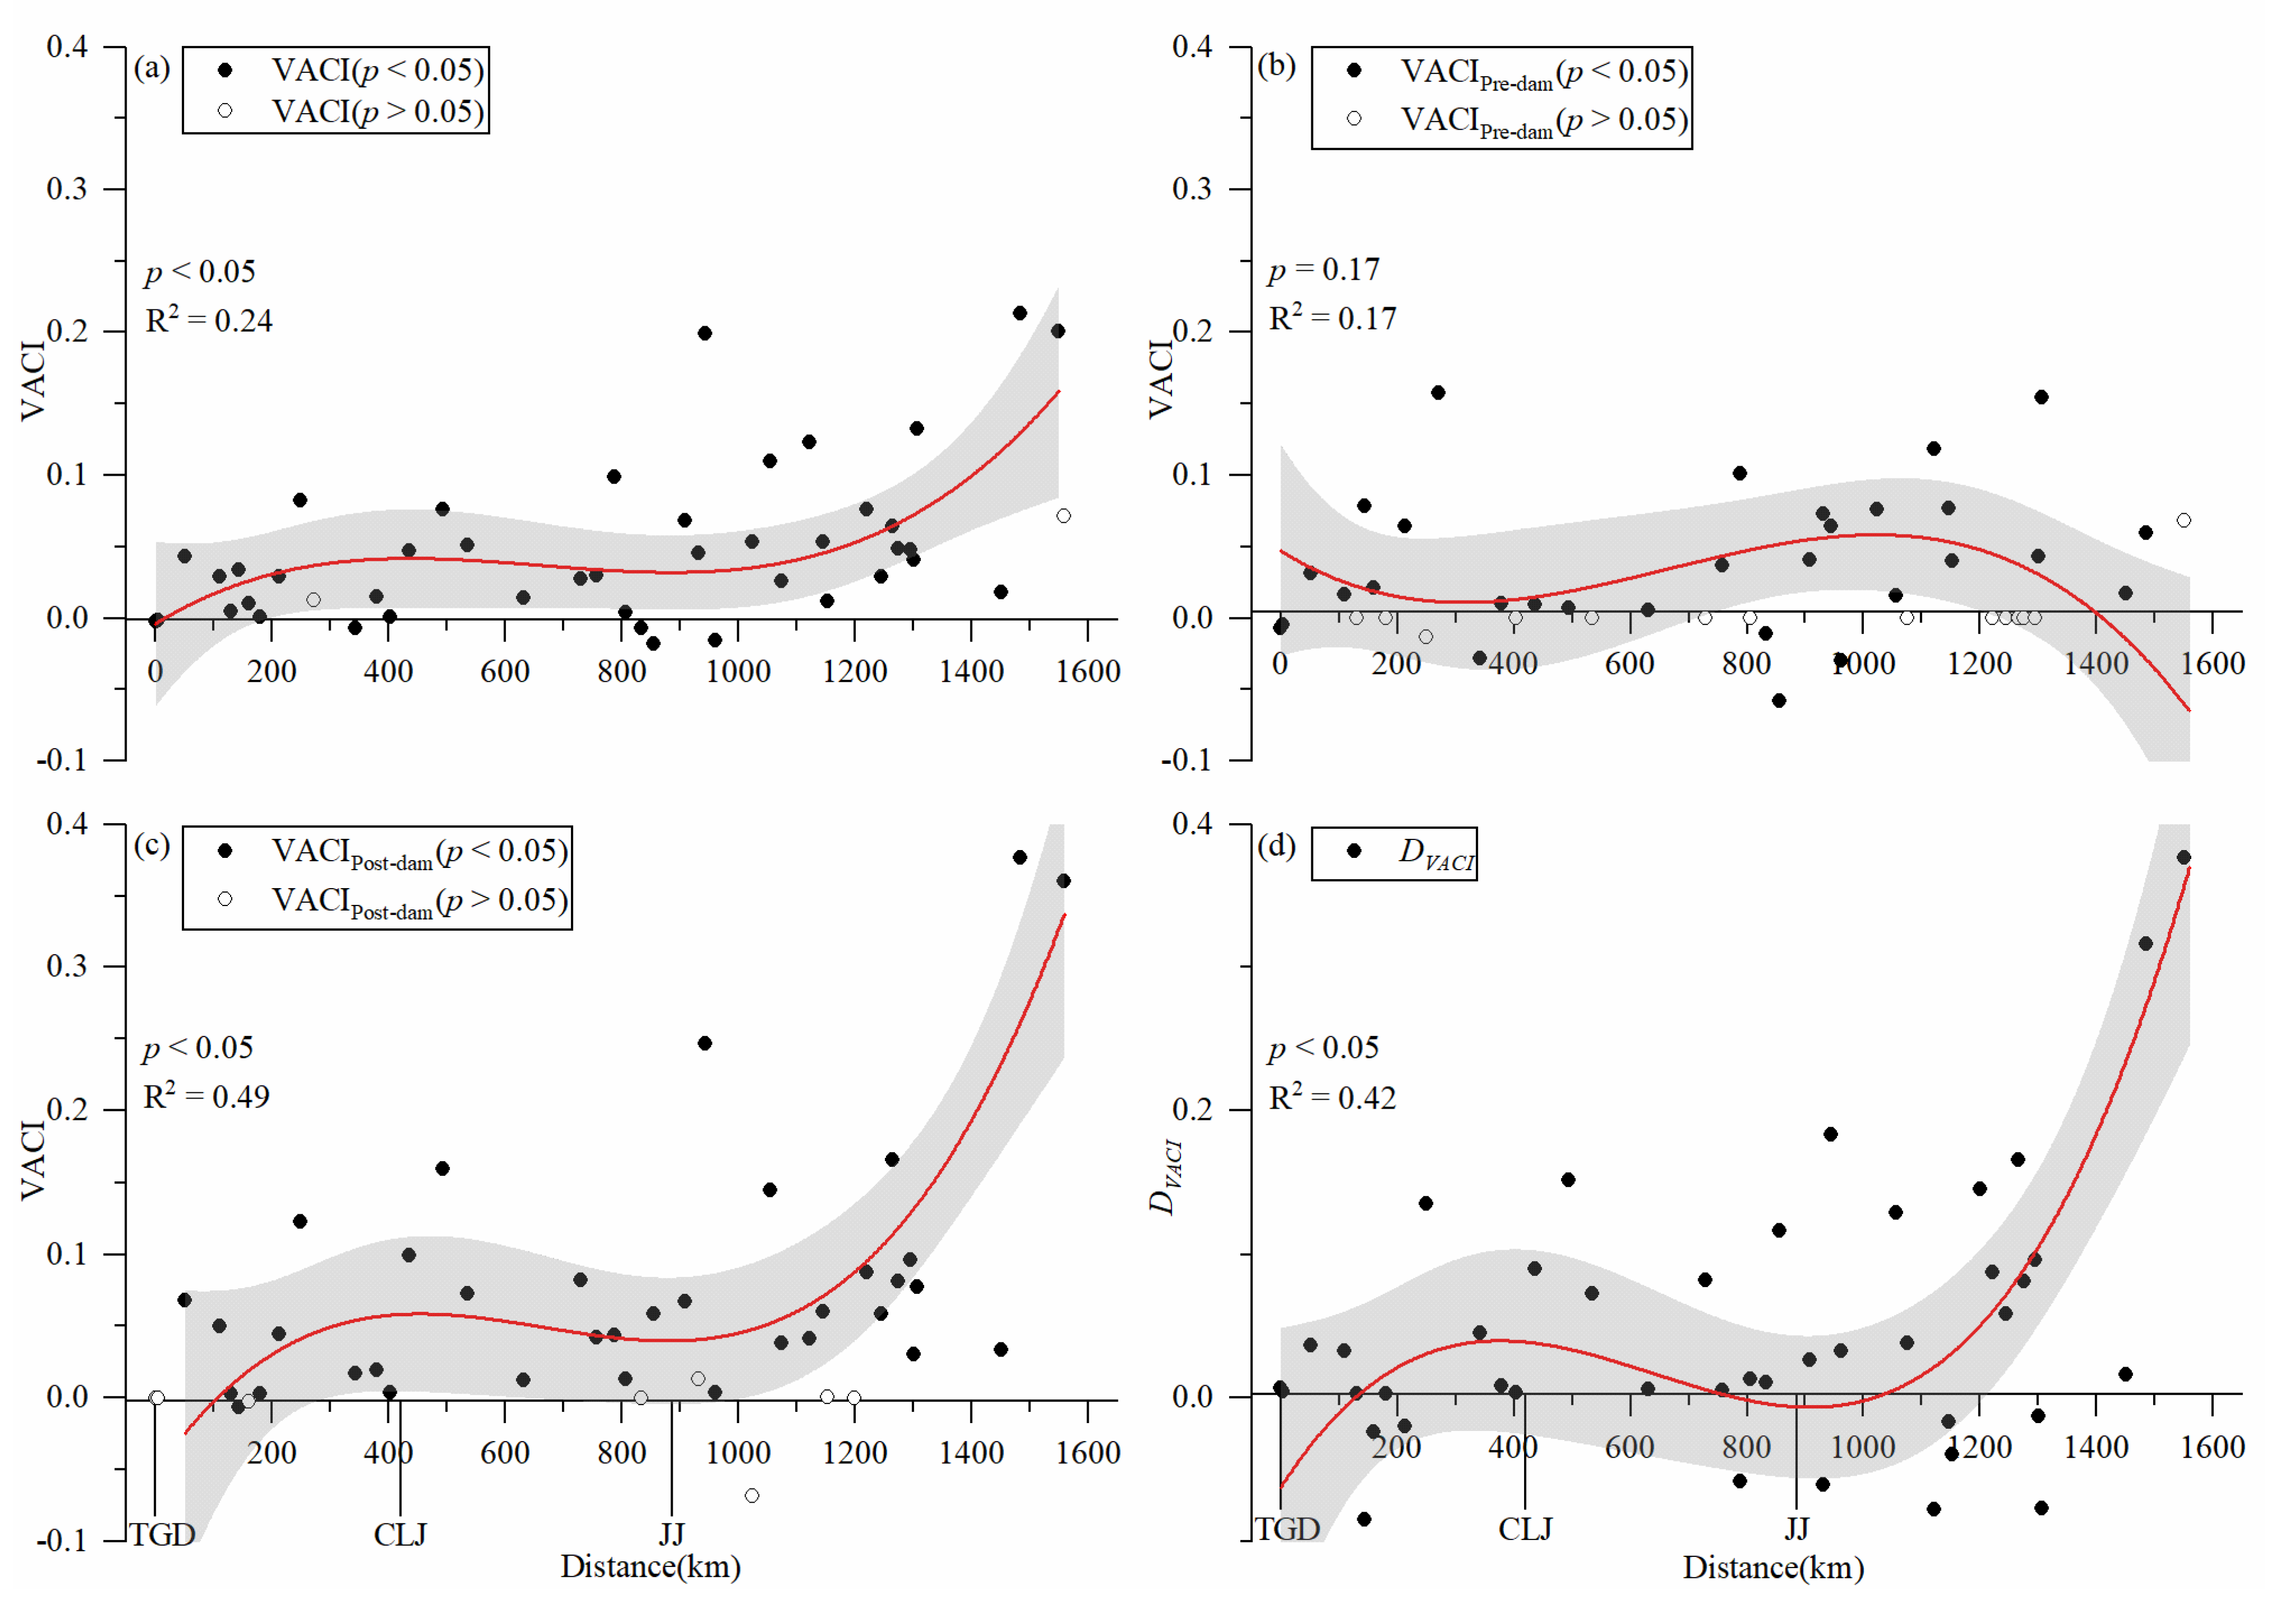
3.4. Relationship between the VACI and the Distance to the TGD

From 1987 to 2017, the overall VACIs showed a general uptrend as distances to the TGD increased (Figure 6a). In the pre-dam period, they showed a decreasing changing pattern (Figure 6b, p = 0.17, R2 = 0.17). However, in the post-dam period, they showed an increasing changing pattern (Figure 6c, p < 0.05, R2 = 0.49). From Figure 6d, it can be found that roughly 2/3 of MCBs have positive DVACI values. This means that most MCBs experienced accelerated vegetation expansion in the post-dam period compared to the pre-dam period. Moreover, the DVACI values of MCBs also showed an uptrend (p < 0.05, R2 = 0.42) as the distance to the TGD increased. In other words, the further MCBs were away from the dam, the faster the vegetation expanded in the post-dam period. These similar findings hold for the three different types of MCBs (SS, MS, and LS) as shown in Figure 7.

4. Discussion

4.1. Driving Factors

The above results show that vegetation of MCBs downstream of the TGD expanded at an accelerated rate in the post-dam period. Usually, vegetation dynamics in a riparian zone is governed by flood disturbance (scouring and depositing) [52]. As a specific riparian zone, an MCB’s area and shape constantly change [32], which could affect vegetation dynamics in the MCB according to the classic species–area relationship [53]. Therefore, the vegetation dynamics of MCBs could be affected by two main factors: Process of flood disturbance and area of MCBs. In order to gain insight into the possible explanations of the current vegetation expansion, these two possible factors are discussed here.
For small-sized MCBs, while their area did not show an overall statistically significant decreasing trend in the post-dam period (−0.25 km2/yr, p = 0.21, Figure 7a), a clearly decreasing trend can be spotted after 2010. This may be due to the full operation of the TGD since 2010, which trapped a large amount of sediment and caused the release of downstream water to be sediment starved [54]. Such “hungry” water would erode the downstream MCBs and decrease their area. Theoretically, the decreased habitat area would lead to a decreased vegetation area based on the species–area relationship [42]. However, VACIs of small-sized MCBs showed as positive, which is unexpected (0.33 km2/yr, p = 0.001, Figure 7a). Because of this, the detection of VACI as positive could be explained by the weakened flood disturbance [55] after TGD operation began, as shown in Figure 8. Note that the water discharges in flood seasons of the post-dam period were less than that of the pre-dam period. As a result, MCBs received less flood disturbance in the post-dam period than in the pre-dam period.
Medium-sized MCBs did not show a statistically significant change of area in the post-dam period (−0.36 km2/yr, p = 0.45, Figure 7b), but did show fluctuations. The VACIs in those MCBs were positive (1.23 km2/yr, p < 0.001, Figure 7b). As there is no significant evidence of trend change in medium-sized MCBs, their increasing VACI is more likely caused by the weakened flood disturbance as mentioned above [52]. It is noteworthy that the trend of MCBs shown in Figure 7b is based on the grouped medium-sized MCBs. However, for individual MCBs, the area of MCB and vegetation change patterns could be vastly different from the current ones, which may make it possible to more clearly determine the cause of vegetation dynamics.
Unlike small-sized and medium-sized MCBs, the area of large-sized MCBs experienced an uptrend in the post-dam period (0.92 km2/yr, p < 0.05, see Figure 7c). Two causes could contribute to such an uptrend. First, large-sized MCBs are generally considered more stable than the small-sized ones in resisting erosion of “hungry” water released by the TGD [38]. Second, large-sized MCBs are often distributed in lower reaches where the sediment eroded from an upstream channel would be deposited and increase their area [56]. In addition, increasing VACI in large-sized MCBs is also evident (1.49 km2/yr, p < 0.001, see Figure 7c). We noted that the increasing rate of vegetation area is larger than that of the MCB area. This suggests that such a higher rate of vegetation expansion may be driven by both the weakened flood disturbance and the increased MCB area.

4.2. Uncertainties and Future Research

The vegetation patches were extracted from Landsat series images with spatial resolution of 30 m. Generally, low spatial resolution may introduce uncertainty into our results from two sources. One is that low spatial resolution images may produce relatively low accuracy of the extracted vegetation patches. To evaluate such uncertainty, we chose Planet Scope high spatial resolution images (3 m) as “ground-truth” source data for extracting the “true” vegetation patches to verify the vegetation patches obtained from Landsat images by a carefully designed procedure (see Section 2.2.2). Experiments prove that the extracted vegetation patches from Landsat images are reliable for further analysis (Figure 3). The other one is that the low spatial resolution images may also ignore the sparse vegetation patches with area less than one pixel area (900 m2), which is often the case in small-sized MCBs. Two possible methods could be adopted to minimize such uncertainty. First, by focusing on the overall pattern of vegetation dynamics in grouped MCBs instead of individual MCBs, as we did in this study, and secondly by using high spatial resolution images to extract small vegetation patches in future monitoring, as they have become more widely available. Moreover, the imaging dates were limited to the dry seasons from November to March to minimize the influence of water fluctuation. Vegetation growth is seasonally dependent and the five-month time span for extracting vegetation may introduce some level of additional uncertainty in our results. Future monitoring should rely on high temporal resolution image data, such as Sentinel-2 and GF series images as much as possible.

5. Conclusions

This paper is the first time that focus has been paid to the area dynamics of (natural) vegetation in MCBs in the downstream TGD of the Yangtze River during 1987–2017. The study’s time frame consists of both pre-dam period (1987–2002) and post-dam period (2003–2017). Vegetation patches of MCBs were extracted from Landsat images by using human–computer interaction processes. MCBs were divided into three types: Small sized (0.2 km2–2 km2), medium sized (area between 2 km2–7 km2), and large sized (7 km2 and 33 km2).
Overall, the VACIs of all MCBs showed as positive from 1987 to 2017, but the rate in the post-dam period was 3.3 times that in the pre-dam period. The VACIs of large-sized, medium-sized, and small-sized MCBs all showed uptrends, but with different rates, in the post-dam period. Specifically, the larger the MCBs, the higher the VACIs. For individual MCBs, their VACIs generally increased with the increase of MCB area in the post-dam period. In addition, the VACI for individual MCBs showed a general increasing pattern as their distances to the TGD increased. In other words, the further an MCB was from the TGD, the greater its VACI. The above findings indicate that the operation of the TGD causes rapid plant growth and colonization in downstream MCBs. The weakened flood disturbances in the post-dam period could explain the rapid vegetation growth and colonization. This work not only provides us the first in-depth look into vegetation dynamics in the MCBs under the context of dam operation, but is also helpful for managing and protecting MCBs in dammed river systems.

Supplementary Materials

The following are available online at https://0-www-mdpi-com.brum.beds.ac.uk/article/10.3390/rs13204190/s1, Table S1. Basic information of the selected Landsat image.

Author Contributions

Conceptualization, X.Z. and Z.W.; methodology, X.Z. and Z.W.; formal analysis, X.Z.; investigation, X.Z., Z.W. and Y.H.; resources, X.Z., Z.W. and T.L.; writing-original draft preparation, X.Z.; writing-review and editing, Z.W., S.W., and M.M; visualization, X.Z. and X.Y.; supervision, Z.W. and S.W.; funding acquisition, S.W. and M.M. All authors have read and agreed to the published version of the manuscript.

Funding

This research was jointly funded by the National Natural Science Foundation of China (No: 51779241 and 41501096) and the Three Gorges follow-up scientific research project from Chongqing Water Resources Bureau (No: 5000002021BF40001).

Institutional Review Board Statement

Not applicable.

Informed Consent Statement

Not applicable.

Data Availability Statement

All original Landsat images were ordered from the Earth Explorer of the United States Geological Survey (USGS) (https://earthexplorer.usgs.gov/, accessed on 10 September 2021). All high spatial resolution images (3m) were obtained from the Planet Scope satellite con-stellation (https://www.planet.com/explorer/, accessed on 10 September 2021).

Acknowledgments

The authors would like to thank the reviewers for their valuable comments, which improved the quality of the article.

Conflicts of Interest

The authors declare no conflict of interest relevant to this study.

References

  1. Bejarano, M.D.; Nilsson, C.; Aguiar, F.C. Riparian plant guilds become simpler and most likely fewer following flow regulation. J. Appl. Ecol. 2018, 55, 365–376. [Google Scholar] [CrossRef] [Green Version]
  2. Meade, R.H.; Moody, J.A. Causes for the decline of suspended-sediment discharge in the Mississippi River system, 1940–2007. Hydrol. Process. 2010, 24, 35–49. [Google Scholar] [CrossRef]
  3. Yang, S.L.; Milliman, J.D.; Xu, K.H.; Deng, B.; Zhang, X.Y.; Luo, X.X. Downstream sedimentary and geomorphic impacts of the Three Gorges Dam on the Yangtze River. Earth-Sci. Rev. 2014, 138, 469–486. [Google Scholar] [CrossRef]
  4. Li, D.; Lu, X.; Chen, L.; Wasson, R.J. Downstream geomorphic impact of the Three Gorges Dam: With special reference to the channel bars in the Middle Yangtze River. Earth Surf. Process. Landf. 2019, 44, 2660–2670. [Google Scholar] [CrossRef]
  5. Lyu, Y.; Fagherazzi, S.; Tan, G.; Zheng, S.; Feng, Z.; Han, S.; Shu, C. Hydrodynamic and geomorphic adjustments of channel bars in the Yichang-Chenglingji Reach of the Middle Yangtze River in response to the Three Gorges Dam operation. Catena 2020, 193, 11. [Google Scholar] [CrossRef]
  6. Esseen, P.-A. Strong influence of landscape structure on hair lichens in boreal forest canopies. Can. J. For. Res. 2019, 49, 994–1003. [Google Scholar] [CrossRef]
  7. Ostman, O.; Mellbrand, K.; Hamback, P.A. Edge or dispersal effects—Their relative importance on arthropod densities on small islands. Basic Appl. Ecol. 2009, 10, 475–484. [Google Scholar] [CrossRef]
  8. Zeng, Q.; Shi, L.; Wen, L.; Chen, J.; Duo, H.; Lei, G. Gravel Bars Can Be Critical for Biodiversity Conservation: A Case Study on Scaly-Sided Merganser in South China. PLoS ONE 2015, 10, e0127387. [Google Scholar] [CrossRef] [PubMed]
  9. Wang, B.; Xu, Y.J. Dynamics of 30 large channel bars in the Lower Mississippi River in response to river engineering from 1985 to 2015. Geomorphology 2018, 300, 31–44. [Google Scholar] [CrossRef]
  10. Gilvear, D.; Willby, N. Channel dynamics and geomorphic variability as controls on gravel bar vegetation; River Tummel, Scotland. River Res. Appl. 2006, 22, 457–474. [Google Scholar] [CrossRef]
  11. Hupp, C.R.; Rinaldi, M. Riparian Vegetation Patterns in Relation to Fluvial Landforms and Channel Evolution Along Selected Rivers of Tuscany (Central Italy). Ann. Assoc. Am. Geogr. 2007, 97, 12–30. [Google Scholar] [CrossRef]
  12. Elliott, B.L.; Kerley, G.I.H.; McLachlan, A. Patterns of development and succession of vegetated hummocks in slacks of the Alexandria coastal dune field, South Africa. J. Coast. Conserv. 2000, 6, 79–88. [Google Scholar] [CrossRef]
  13. Tal, M.; Paola, C. Dynamic single-thread channels maintained by the interaction of flow and vegetation. Geology 2007, 35, 347–350. [Google Scholar] [CrossRef]
  14. Dean, D.J.; Topping, D.J.; Schmidt, J.C.; Griffiths, R.E.; Sabol, T.A. Sediment supply versus local hydraulic controls on sediment transport and storage in a river with large sediment loads. J. Geophys. Res. Earth Surf. 2016, 121, 82–110. [Google Scholar] [CrossRef] [Green Version]
  15. Slowik, M.; Dezso, J.; Marciniak, A.; Toth, G.; Kovacs, J. Evolution of river planforms downstream of dams: Effect of dam construction or earlier human-induced changes? Earth Surf. Process. Landf. 2018, 43, 2045–2063. [Google Scholar] [CrossRef]
  16. Renofalt, B.M.; Jansson, R.; Nilsson, C. Effects of hydropower generation and opportunities for environmental flow management in Swedish riverine ecosystems. Freshw. Biol. 2010, 55, 49–67. [Google Scholar] [CrossRef]
  17. Pan, B.; Yuan, J.; Zhang, X.; Wang, Z.; Chen, J.; Lu, J.; Yang, W.; Li, Z.; Zhao, N.; Xu, M. A review of ecological restoration techniques in fluvial rivers. Int. J. Sediment Res. 2016, 31, 110–119. [Google Scholar] [CrossRef]
  18. Wang, Z.; Tian, S.; Yi, Y.; Yu, G. Principles of river training and management. Int. J. Sediment Res. 2007, 22, 247–262. [Google Scholar]
  19. International Commission on Large Dams. General Synthesis. World Regist. Dams 2020. Available online: https://www.icold-cigb.org/GB/world_register/general_synthesis.asp (accessed on 12 October 2021).
  20. Hand, B.K.; Flint, C.G.; Frissell, C.A.; Muhlfeld, C.C.; Devlin, S.P.; Kennedy, B.P.; Crabtree, R.L.; McKee, W.A.; Luikart, G.; Stanford, J.A. A social–ecological perspective for riverscape management in the Columbia River Basin. Front. Ecol. Environ. 2018, 16, S23–S33. [Google Scholar] [CrossRef] [Green Version]
  21. Mallik, A.U.; Richardson, J.S. Riparian vegetation change in upstream and downstream reaches of three temperate rivers dammed for hydroelectric generation in British Columbia, Canada. Ecol. Eng. 2009, 35, 810–819. [Google Scholar] [CrossRef]
  22. Birken, A.S.; Cooper, D.J. Processes of Tamarix invasion and floodplain development along the lower Green River, Utah. Ecol. Appl. 2006, 16, 1103–1120. [Google Scholar] [CrossRef]
  23. Merritt, D.M.; Poff, N.L. Shifting dominance of riparian Populus and Tamarix along gradients of flow alteration in western North American rivers. Ecol. Appl. 2010, 20, 135–152. [Google Scholar] [CrossRef] [Green Version]
  24. Schelle, P.; Collier, U.; Pittock, J. Rivers at risk: Dams and the future of freshwater ecosystems, World wildlife fund (WWF). In Proceedings of the 7th International River Symposium, Brisbane, Australia, 4 September 2004. [Google Scholar]
  25. Mueller, E.R.; Grams, P.E.; Schmidt, J.C.; Hazel, J.E.; Alexander, J.S.; Kaplinski, M. The influence of controlled floods on fine sediment storage in debris fan-affected canyons of the Colorado River basin. Geomorphology 2014, 226, 65–75. [Google Scholar] [CrossRef]
  26. McCoy-Sulentic, M.E.; Kolb, T.E.; Merritt, D.M.; Palmquist, E.; Ralston, B.E.; Sarr, D.A.; Shafroth, P.B. Changes in Community-Level Riparian Plant Traits over Inundation Gradients, Colorado River, Grand Canyon. Wetlands 2017, 37, 635–646. [Google Scholar] [CrossRef] [Green Version]
  27. Sankey, J.B.; Ralston, B.E.; Grams, P.E.; Schmidt, J.C.; Cagney, L.E. Riparian vegetation, Colorado River, and climate: Five decades of spatiotemporal dynamics in the Grand Canyon with river regulation. J. Geophys. Res.-Biogeosci. 2015, 120, 1532–1547. [Google Scholar] [CrossRef] [Green Version]
  28. Stevens, L.E.; Schmidt, J.C.; Ayers, T.J.; Brown, B.T. Flow regulation, geomorphology, and Colorado-River marsh development in the grand canyon, Arizona. Ecol. Appl. 1995, 5, 1025–1039. [Google Scholar] [CrossRef]
  29. Casado, A.; Peiry, J.-l.; Campo, A.M. Geomorphic and vegetation changes in a meandering dryland river regulated by a large dam, Sauce Grande River, Argentina. Geomorphology 2016, 268, 21–34. [Google Scholar] [CrossRef] [Green Version]
  30. New, T.; Xie, Z. Impacts of large dams on riparian vegetation: Applying global experience to the case of China’s Three Gorges Dam. Biodivers. Conserv. 2008, 17, 3149–3163. [Google Scholar] [CrossRef]
  31. Zhu, G.; Li, Y.; Sun, Z.; Kanae, S. Response of vegetation to submergence along Jingjiang Reach of the Yangtze River. PLoS ONE 2021, 16, e0251015. [Google Scholar] [CrossRef] [PubMed]
  32. Hooke, J.M.; Yorke, L. Channel bar dynamics on multi-decadal timescales in an active meandering river. Earth Surf. Process. Landf. 2011, 36, 1910–1928. [Google Scholar] [CrossRef]
  33. Zheng, S.; Xu, Y.J.; Cheng, H.; Wang, B.; Xu, W.; Wu, S. Riverbed erosion of the final 565 kilometers of the Yangtze River (Changjiang) following construction of the Three Gorges Dam. Sci. Rep. 2018, 8, 11. [Google Scholar] [CrossRef]
  34. Hudson, P.F.; van der Hout, E.; Verdaasdonk, M. (Re)Development of fluvial islands along the lower Mississippi River over five decades, 1965–2015. Geomorphology 2019, 331, 78–91. [Google Scholar] [CrossRef]
  35. Zheng, S. Reflections on the Three Gorges Project since Its Operation. Engineering 2016, 2, 389–397. [Google Scholar] [CrossRef]
  36. Hu, F.; Ge, J.; Lv, S.B.; Li, Y.F.; Li, Z.J.; Yuan, M.; Chen, Z.; Liu, Y.M.; Li, Y.S.; Ross, A.G.; et al. Distribution pattern of the snail intermediate host of schistosomiasis japonica in the Poyang Lake region of China. Infect. Dis. Poverty 2019, 8, 23. [Google Scholar] [CrossRef]
  37. Liu, J. Evolution Processes of Mid-Channel Bars in the Middle and Lower Yangtze River and Xiang River. Master’s Thesis, Changsha University of Science & Technology, Changsha, China, 2018. (In Chinese). [Google Scholar]
  38. Wen, Z.; Yang, H.; Zhang, C.; Shao, G.; Wu, S. Remotely Sensed Mid-Channel Bar Dynamics in Downstream of the Three Gorges Dam, China. Remote. Sens. 2020, 12, 409. [Google Scholar] [CrossRef] [Green Version]
  39. Li, Z.; Wang, Z.; Jia, Y.; Li, W. Evolution analysis of channel bars in the middle and lower Yangtze river before and after impoundment of Three Gorges Reservoir. Resour. Environ. Yangtze Basin 2015, 24, 65–73. (In Chinese) [Google Scholar] [CrossRef]
  40. Chen, Z.; Wang, Z.; Finlayson, B.; Chen, J.; Yin, D. Implications of flow control by the Three Gorges Dam on sediment and channel dynamics of the middle Yangtze (Changjiang) River, China. Geology 2010, 38, 1043–1046. [Google Scholar] [CrossRef]
  41. Tang, Z.; Qiao, X.; Fang, J. Species-area relationship in biological communities. Biodivers. Sci. 2009, 17, 549–559. (In Chinese) [Google Scholar] [CrossRef]
  42. Tjorve, E. Shapes and functions of species-area curves: A review of possible models. J. Biogeogr. 2003, 30, 827–835. [Google Scholar] [CrossRef]
  43. Chapman, K.A.; Best, R.J.; Smith, M.E.; Mueller, E.R.; Grams, P.E.; Parnell, R.A. Estimating the contribution of tributary sand inputs to controlled flood deposits for sandbar restoration using elemental tracers, Colorado River, Grand Canyon National Park, Arizona. Geol. Soc. Am. Bull. 2021, 133, 1141–1156. [Google Scholar] [CrossRef]
  44. Jourdain, C.; Claude, N.; Antoine, G.; Tassi, P.; Cordier, F. Influence of flood regime on riparian vegetation dynamics in rivers with alternate bars. In Ninth International Conference on Fluvial Hydraulics; Paquier, A., Riviere, N., Eds.; E3S Web of Conferences; E D P Sciences: Les Ulis, France, 2018; Volume 40. [Google Scholar]
  45. Khaddor, I.; Achab, M.; Soumali, M.R.; Benjbara, A.; Alaoui, A.H. The Impact of the Construction of a Dam on Flood Management. Civ. Eng. J. 2021, 7, 343–356. [Google Scholar] [CrossRef]
  46. Gao, X.; Fujiwara, M.; Winemiller, K.O.; Lin, P.; Li, M.; Liu, H. Regime shift in fish assemblage structure in the Yangtze River following construction of the Three Gorges Dam. Sci. Rep. 2019, 9, 11. [Google Scholar] [CrossRef] [PubMed]
  47. Jia, Y.; Tang, X.; Tang, F.; Yang, Y. Spatial-temporal evolution of landscape pattern in the middle and lower reaches ofthe Yangtze River basin from 1995 to 2015. J. Nanjing For. Univ. (Nat. Sci. Ed.) 2020, 44, 185–194. (In Chinese) [Google Scholar] [CrossRef]
  48. Liu, J.; Li, S.; Ouyang, Z.; Tam, C.; Chen, X. Ecological and socioeconomic effects of China’s policies for ecosystem services. Proc. Natl. Acad. Sci. USA 2008, 105, 9477–9482. [Google Scholar] [CrossRef] [Green Version]
  49. Dai, Z.; Liu, J.T. Impacts of large dams on downstream fluvial sedimentation: An example of the Three Gorges Dam (TGD) on the Changjiang (Yangtze River). J. Hydrol. 2013, 480, 10–18. [Google Scholar] [CrossRef]
  50. Ham, D.G.; Church, M. Bed-material transport estimated from channel morphodynamics: Chilliwack River, British Columbia. Earth Surf. Process. Landf. 2000, 25, 1123–1142. [Google Scholar] [CrossRef]
  51. Wang, J.; Dai, Z.; Mei, X.; Lou, Y.; Wei, W.; Ge, Z. Immediately downstream effects of Three Gorges Dam on channel sandbars morphodynamics between Yichang-Chenglingji Reach of the Changjiang River, China. J. Geogr. Sci. 2018, 28, 629–646. [Google Scholar] [CrossRef] [Green Version]
  52. Tzeng, H.-Y.; Wang, W.; Tseng, Y.-H.; Chiu, C.-A.; Kuo, C.-C.; Tsai, S.-T. Tree mortality in response to typhooninduced floods and mudslides is determined by tree species, size, and position in a riparian Formosan gum forest in subtropical Taiwan. PLoS ONE 2018, 13, e0190832. [Google Scholar] [CrossRef] [Green Version]
  53. Lomolino, M.V. Ecology’s most general, yet protean pattern: The species-area relationship. J. Biogeogr. 2000, 27, 17–26. [Google Scholar] [CrossRef]
  54. Wang, Y.; Rhoads, B.L.; Wang, D.; Wu, J.; Zhang, X. Impacts of large dams on the complexity of suspended sediment dynamics in the Yangtze River. J. Hydrol. 2018, 558, 184–195. [Google Scholar] [CrossRef]
  55. Lou, Y.; Mei, X.; Dai, Z.; Wang, J.; Wei, W. Evolution of the mid-channel bars in the middle and lower reaches of the Changjiang (Yangtze) River from 1989 to 2014 based on the Landsat satellite images: Impact of the Three Gorges Dam. Environ. Earth Sci. 2018, 77, 18. [Google Scholar] [CrossRef]
  56. Lai, X.; Yin, D.; Finlayson, B.L.; Wei, T.; Li, M.; Yuan, W.; Yang, S.; Dai, Z.; Gao, S.; Chen, Z. Will river erosion below the Three Gorges Dam stop in the middle Yangtze? J. Hydrol. 2017, 554, 24–31. [Google Scholar] [CrossRef]
Figure 1. Geographic location of the study area. TGD, YC, CLJ, HK, WH, JJ, DT, NJ, EST, and SH stand for Three Gorges Dam, Yichang, Chenglingji, Hankou, Wuhan, Jiujiang, Datong, Nanjing, Yangtze River Estuary, and Shanghai, respectively.
Remotesensing 13 04190 g001
Figure 2. Workflow for extracting vegetation patches.
Remotesensing 13 04190 g002
Figure 3. Accuracy assessment of extracted MCB vegetation area (a) and MCB area (b).
Remotesensing 13 04190 g003
Figure 4. Temporal dynamics of vegetation area in MCBs downstream of the TGD from 1987 to 2017: (a) For all of the MCBs, (b) for small-sized MCBs (SS), (c) for medium-sized MCBs (MS), (d) for large-sized MCBs (LS). The parameters VCAI and R2 represent vegetation area change intensity and coefficient of determination, respectively. Slope values with “**” indicate the F-tested p-value < 0.001. The shaded areas are 95% confidence intervals.
Remotesensing 13 04190 g004
Figure 5. The relationships between VACIs of individual MCBs and MCBs’ sizes in the three distinct periods. (a) For whole period: 1987–2017; (b) for pre-dam period: 1987–2002; and (c) for post-dam period: 2003–2017. (d) For the difference of VACIs in post- and pre-dam period. The shaded areas are 95% confidence intervals.
Remotesensing 13 04190 g005
Figure 6. Relationships between VACIs of individual MCBs and distance from MCB to the dam in the three distinct periods. (a) For whole period: 1987–2017; (b) for pre-dam period: 1987–2002; and (c) for post-dam period: 2003–2017. (d) For the difference of VACIs in post- and pre-dam period. The shaded areas are 95% confidence intervals.
Remotesensing 13 04190 g006
Figure 7. Changes in vegetation area (in green) and MCB area (in red) of three types of MCBs. (a) For small-sized MCBs (SS), (b) for middle-sized MCBs (MS), (c) for large-sized MCBs (LS). The slope parameter represents the change trend of the MCB area. The VACI parameter represents the change trend of the MCB vegetation area.
Remotesensing 13 04190 g007
Figure 8. Monthly averaged water discharges in three key gauging stations (YC: Yichang; HK: Hankou; and DT: Datong) in the pre-dam (1989–2002) and post-dam (2003–2017) periods.
Remotesensing 13 04190 g008
Table 1. High spatial resolution images and corresponding matched Landsat images selected for accuracy assessment.
High Spatial Resolution ImagesLandsat Images
SourceAcquisition DateSensorPathRowAcquisition Date
PlanetScope10 December 2013Landsat 811903810 December 2013
PlanetScope1 April 2016Landsat 812003828 March 2016
PlanetScope19 December 2017Landsat 812103919 December 2017
PlanetScope1 March 2016Landsat 81230391 March 2016
PlanetScope15 January 2014 Landsat 812304023 January 2014
PlanetScope21 March 2015Landsat 812403922 March 2015
PlanetScope4 December 2016Landsat 81240395 December 2016
PlanetScope31 December 2015Landsat 812503926 December 2015
Publisher’s Note: MDPI stays neutral with regard to jurisdictional claims in published maps and institutional affiliations.

