Article

A Multidisciplinary Approach for the Mapping, Automatic Detection and Morphometric Analysis of Ancient Submerged Coastal Installations: The Case Study of the Ancient Aegina Harbour Complex

1
Laboratory of Marine Geology and Physical Oceanography, Department of Geology, University of Patras, 265 00 Rio Patras, Greece
2
Ephorate of Underwater Antiquities, Hellenic Ministry of Culture and Sports, 117 42 Athens, Greece
3
Centre Camille Jullian, Aix Marseille Univ, CNRS, 13090 Aix-en-Provence, France
*
Author to whom correspondence should be addressed.
Remote Sens. 2021, 13(21), 4462; https://0-doi-org.brum.beds.ac.uk/10.3390/rs13214462
Submission received: 28 September 2021 / Revised: 30 October 2021 / Accepted: 4 November 2021 / Published: 6 November 2021

Abstract

:
The documentation of underwater cultural heritage (UCH) is the basis for sustainable maritime development including its protection, preservation, and incorporation in coastal zone management plans. In this study, we present a multidisciplinary, non-intrusive downscale approach for the documentation of UCH implemented on the coastal area of Aegina Island, Greece, where a unique submerged harbour complex is preserved. This approach succeeded in obtaining information that serves both geomorphological and archaeological purposes in a time- and cost-effective way, while obtaining information of centimeters to millimeters scale. The geomorphology of the area was mapped in detail through marine geophysical means while ancient submerged conical rubble structures and breakwaters were documented using automatic seafloor segmentation techniques, revealing previously unknown sites of archaeological interest. The structures’ parameters were extracted from the acoustic data to analyze their morphometry, while photogrammetry was realized using a Remotely Operated Vehicle to expose their micro-structure. The spatial distribution of the structures revealed the construction of a well-planned harbour complex with multiple passages and different possible functionalities. Finally, through the structures’ morphometric analysis (geometry and terrain statistical parameters) their preservation status was revealed, demonstrating the anthropogenic impact on the submerged ancient structures due to the modern harbor activity.

1. Introduction

“προσπλεῦσαι δὲ Aἴγινά ἐστι νήσων τῶν Ἑλληνίδων ἀπορωτάτη· πέτραι τε γὰρ ὕφαλοι περὶ πᾶσαν καὶ χοιράδες ἀνεστήκασι.” (Pausanias 2.29.6) [1]. The access to the island of Aegina in the Saronic Gulf was characterized as the most difficult of the Greek islands by Pausanias, who visited Aegina in 122 AD. The Greek traveler and geographer noted the challenging entrance to the harbour due to the existence of sunken rocks and reefs which rise perilously at sea level. His testimonies are the first to reveal the existence of the complex, extensive, and expensive harbour infrastructure constructed at the shoreline of Aegina’s ancient city. The geostrategic position of Aegina island in the Saronic Gulf, between the Peleponnese, Attica, and Crete favored the Aegineans in dominating the naval and trading field, starting from ~1800 to 459 BC [2,3,4,5,6]. The conceptualization and implementation of the Aegina harbour installations render it as one of the most significant and largest artificial harbour projects of Classical antiquity.
The ancient harbour infrastructure of Aegina was first described by G. Welter (1938) [2] who visited the site before the modern harbour construction works, while P. Knoblauch [3] surveyed topographically the visible remains (1964–69) and gave a systematic account of the harbour and coastal installations. Recently, the Ephorate of Underwater Antiquities conducted an underwater survey and detailed mapping of the conical rubble structures system (1988–98), while an effort to map the currently submerged installations was performed by N. Mourtzas and E. Kolaiti [4], who used satellite images to digitize their extent. From the aforementioned surveys, the (i) ancient naval harbour was referred to by Pausanias as secret (“kryptos”) (ii) the ancient commercial harbour is under the modern one, (iii) two extended breakwaters bound the archaeological maritime zone from the north and south, and (iv) conical rubble structures were detected submerged or semi-submerged at the maritime facade of Aegina city, forming a massive harbour complex, which is unique among the known harbour facilities of the ancient Greek world. Nevertheless, the harbour facilities’ original layout, interconnectivity, functionality and dating have not yet been clarified. Therefore, these issues are now under systematic study within the framework of the “Aigina Harbour-City Project (2019–2023)”, a cooperation between the Ephorate of Underwater Antiquities, the French School of Athens and Aix-Marseille University with the scientific support of six European partners.
Marine geophysical techniques are widely used in geoarchaeological surveys for the detection and mapping of submerged archaeological sites [7], shipwrecks [8,9,10,11], but also the reconstruction of coastal paleogeography [12,13]. By using multibeam and side-scan sonars scientists are able to acquire detailed bathymetric and backscatter intensity data respectively. For sites buried under the seafloor sub-bottom profilers can provide seismic profiles that show the acoustic impedance difference interface of accumulated sediments [14], gas-charged sediments [15], or buried features [16]. By operating these modern and non-destructive tools simultaneously, scientists are capable of mapping large-scale areas both above and below the seafloor in minimum time and a resolution of few centimeters, regardless of the depth and suspended material of the water column [13,17,18,19,20,21]. The need for greater detail, after detecting and mapping targets of archaeological interest, pushed geoscientists and marine archaeologists to use photogrammetric techniques [22,23,24,25]. Photogrammetry is a cost-effective and non-destructive tool that allows geoscientists to create millimeter accuracy 3D models which they can study over the years without the need to revisit the site.
In this publication, we present a non-intrusive, multidisciplinary approach using mainly marine geophysical data implemented at the coastal zone of Aegina city in the framework of the “Aigina Harbour-city Project”. Multibeam, side-scan sonar, and sub-bottom profiler acoustic data were used to map and delimit the ancient coastal installations and study the geomorphology of the area in detail. Detection of the submerged ancient harbour facilities (conical rubble structures and breakwaters) spatial extent and distribution analysis was performed using the acoustic data in combination with automatic seafloor segmentation techniques, allowing the preliminary interpretation hypotheses regarding their use in antiquity (defensive/sheltering function) but also of sea-level change scenarios. Parametrization of the submerged archaeological remains contributed to their morphometric analysis (geometric characteristics and depth distribution of the structures, burial depth, construction morphologies), but also helped in assessing their preservation status since the modern harbour activities affect them directly, setting several of them under great risk. Finally, photogrammetric techniques were applied on one of the archaeological structures (i.e., conical rubble structure), using a Remotely Operated Vehicle (ROV) equipped with action cameras, in order to reveal its microstructure.

2. Geomorphological/Geological Setting

2.1. Study Area & Oceanography

The island of Aegina is located at the center of the Saronic Gulf (37°44.656′N, 23°25.654′E), at the western part of the central Aegean Sea (Figure 1A,C). The Saronic Gulf constitutes a semi-enclosed gulf located in between the Attica peninsula and the Peloponnese. Apart from numerous streams, river inflow in the Saronic Gulf is limited since two main seasonal torrents (Ilissos and Kifissos) result in the northeastern part of the gulf [26]. The tide fluctuates from 0.3–0.4 m while the currents are wind-driven, creating cyclonic or anti-cyclonic circulation [27]. Wind mainly blows from the N-NNW at a monthly average wind speed range of 4.5–19 km/h with the highest values presented during the winter-spring period. NW-WNW monthly average speeds are generally of lower magnitude (3.5–14 km/h) but can reach up to 20 km/h during winter months (National Observatory Athens-Aegina weather station) (Figure 1B). These wind directions prevail throughout the year, however wind-generated waves are of limited fetch [28]. On the contrary, the SE-SSE winds blow at a lower speed of 3.8–8.4 km/h, yet they can generate waves of great height and swell.

2.2. Structural Setting

The Saronic Gulf is located at the northwestern edge of the south Aegean volcanic arc while it is affected by an N-S extensional back-arc tectonism that reduces the crust thickness to 20 km and allows the mantle material to ascent [29]. As a result, the volcanic centers of Sousaki, Aegina, Methana, and Poros are apparent in the area of the gulf [30] (Figure 1A). Complicated patterns of NE–SW, E–W, and ENE–WSW active normal and strike-slip faults have been formed due to subsidence while segmenting the area into continental shelf basins that reach a maximum depth of almost −400 m west of Methana (Methana Basin) [23,24] (Figure 1C).
Shallow earthquakes are generated by the N-S extensional regime while the deeper ones correspond to the subduction of the oceanic crust beneath the Aegean Sea Plate [31]. A subsidence rate of 0.03–0.31 mm/yr was calculated for the subsiding basins while a sedimentation rate of 2.8 and 3.2 cm/ka was measured at the southeastern part of the Saronic gulf based on progradational wedges [32].
Volcanic deposits are apparent at the central part of Aegina Island that were formed during the first phase of the Pliocene volcanic eruption series [33,34]. The second phase of eruptions that occurred during the Plio-Pleistocene era was of smaller volume and is responsible for the formation of the southern part of the island. Finally, the westward tilting and subsidence of the island during the Pleistocene led to the deposition of marine limestone.

3. Methodology

The methodology followed in this marine geological prospection started from an overall approach to the area of interest using marine remote sensing techniques for mapping the acoustic/geomorphological properties of the seafloor and the stratigraphy. Automatic segmentation techniques were implemented for the detection of sites of possible archaeological interest and were validated through acoustic data thereafter. Ground truthing of those areas was finally performed using a Remotely Operated Vehicle (ROV) which was also used for implementing photogrammetric techniques on one of the findings. The methodological approach followed in this article has been extensively described by N. Georgiou in the following article [35].

3.1. Remote Sensing Survey

A research vessel was equipped with advanced marine geophysical equipment which was operating simultaneously during the data acquisition, at a maximum speed of 3 knots. For the acquisition of the 2 cm resolution bathymetry, an over-the-side ITER Systems BathySwath interferometric multibeam echo-sounder (MBES) was operated, using a slant range of 150 m. An SMC IMU-108 motion sensor was used for the correction of the vessel movement (pitch, roll, heave) with a resolution angle of 0.001° for pitch and roll and resolution heave of 1 cm. A Sound Velocity Profiler (SVP-Sea&Sun) was deployed before and after the survey to collect sound velocity profiles and use them as an input for the correction of the multi-beam echo-sounder. A dual-frequency (100 & 400 kHz) side-scan sonar (SSS) (EG&G 272TD) with an Edgetech 4200-P topside Processor, was towed to acquire the acoustic backscatter intensity which generally describes the geomorphology of the seafloor and contributes to the detection of targets of potential archaeological interest. The swath width of the SSS was set at 100 m, while the lane spacing was 25 m, providing a 75% range overlap. Data were mosaiced using the SeaView Mosaic (Moga software). The thickness of the sedimentary unit and the seismic stratigraphy was obtained through the “Chirp” Kongsberg Geoacoustics Geopulse Plus sub-bottom profiler system with a Universal transceiver, an acquisition display, and an over-the-side Transducer Mounting (array of 4 transducers) with a hydrophone. The operating frequencies ranged between 1.5–11.5 kHz using the hyperbolic chirp pulses, which achieve greater penetration with a maximum vertical resolution of 10 cm. The positioning of the vessel and data georeference were accomplished through a Leica GS08 RTK GNSS that provided an accuracy of 10 mm. The HYPACK software was used for the navigation of the vessel.

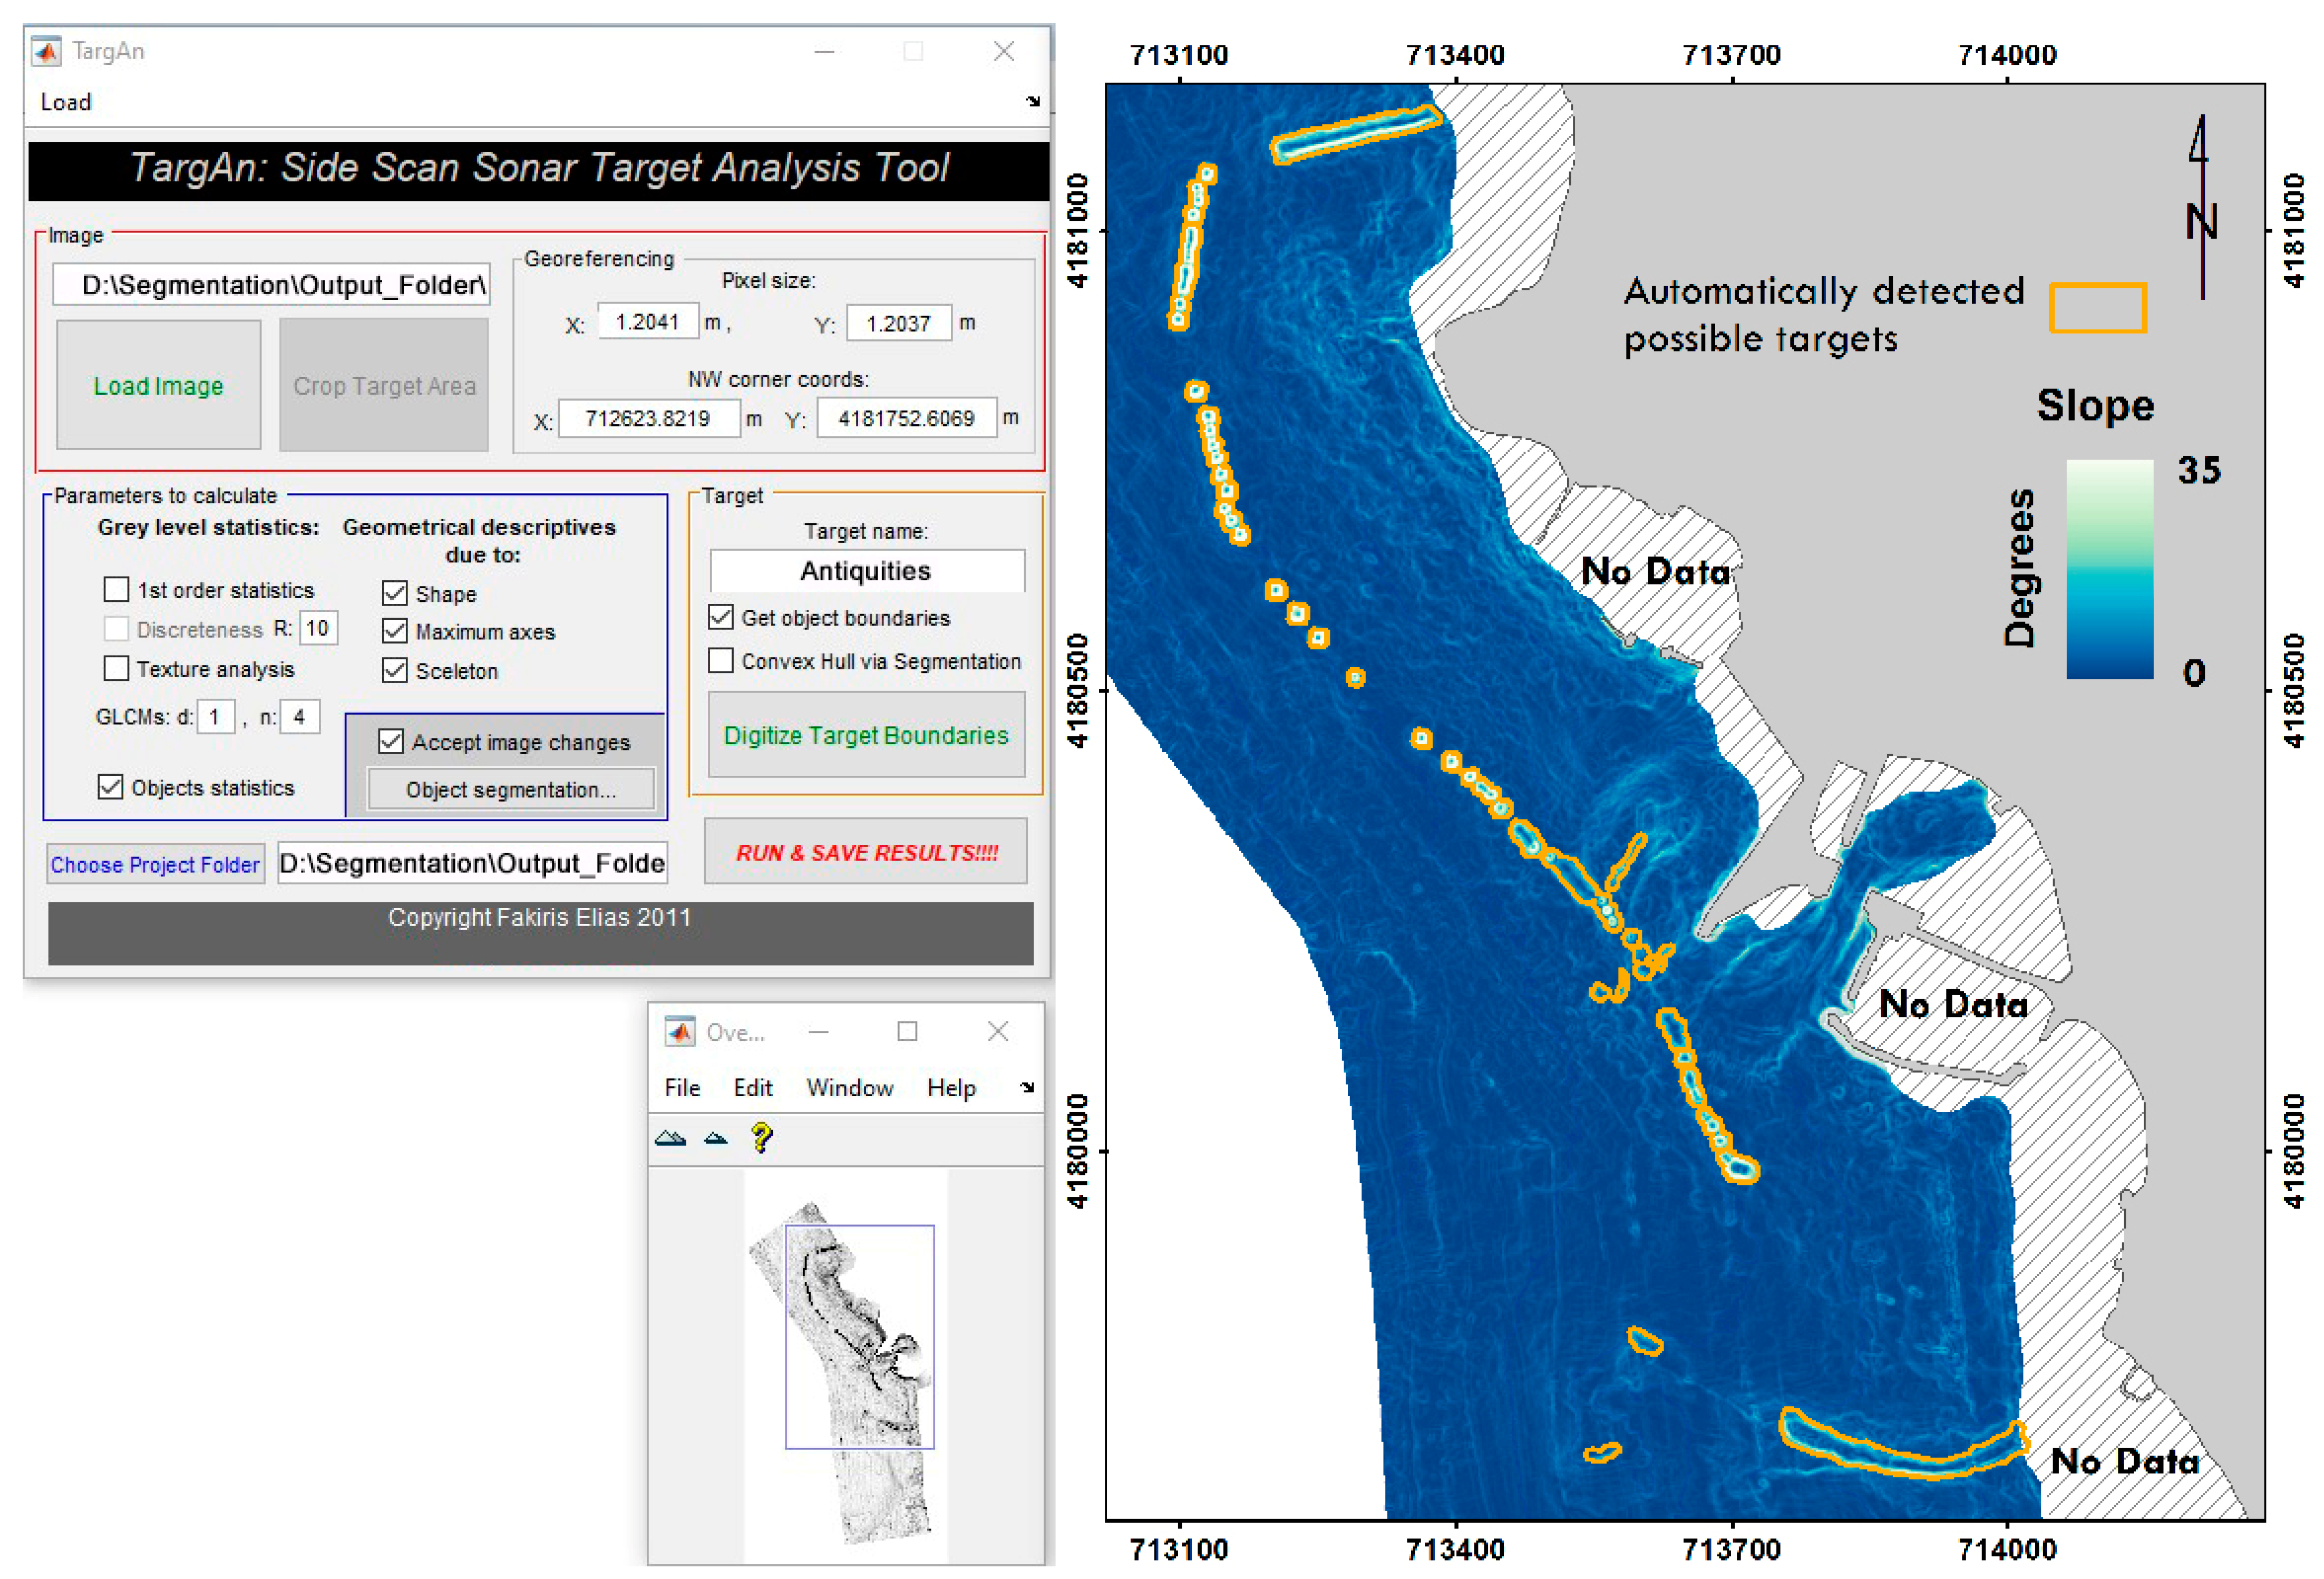
3.2. Detection and Parametrization of Submerged Antiquities

For the detection of possible archaeological targets, the bathymetric slope was converted to a greyscale image with a pixel size of 1.2 m, to be further processed in the TargAn software [36,37] for segmentation and statistical parameterization (Section 4.2.1). The “Canny” edge detection method, as adopted in the TargAn software was the core of the segmentation process. The ‘‘Canny’’ method (1986) finds edges by looking for local maxima of the gradient of the processed image. The gradient is calculated using the derivative of a Gaussian filter. The method uses two thresholds, to detect strong and weak edges, and includes the weak edges in the output only if they are connected to strong edges while it is relatively insensitive to noise. The morphological ‘‘edge dilation’’ operation was applied to the results, which controls the coarseness of the segmentation results, while in the preprocessing stage the “background open” morphological operation was used with a radius of 10 pixels to remove background trends from the image and enhance local anomalies.
Parameterization of the detected objects in TargAn was realized through extracting simple shape geometry statistics, namely the area, perimeter, minimum and maximum axis lengths, isoperimetric quotient (compares the area and perimeter of the shape to the equivalents of a circle), and eccentricity (ratio of the distance between the foci of the minimum enclosing ellipse and its major axis length). Moreover, simple terrain statistics were extracted from the interior of the segmented objects as well as from a buffer zone of 5 m around each object, namely the mean, standard deviation, and range depth values.

3.3. Photogrammetric Implications

Ground-truthing of the areas of interest was attained using a SubseaTech mini ROV Guardian. The exact position of the ROV was achieved by utilizing a Blueprint subsea X150 USBL acoustic transponder attached to it. A carbon fiber tube was also added at the front part of the ROV where 3 action cameras (GoPro 7) were embedded. The 2 side cameras were placed at a 30° angle on the Y-axis and 45° on the X-axis so that they both focus on the front and center view. The middle camera was also inclined 30° on the Y-axis while it remained centered on the front. The cameras were synchronized and set to record high-quality video (1920 × 1080 px). By acquiring footage from 3 different cameras and 3 different angles a very dense set of overlapping images was collected. The post-processing of the data collected was performed using Agisoft Metashape® software (v.1.7.0). This software generates 3D models and orthorectified images from overlapping photos. The photos collected were aligned using the SfM algorithm which produces a 3D point cloud of the surveyed area, the relative position of the photographs collected, and the internal calibration parameters (focal length, principal point location, three radial, and two tangential distortion coefficients) [38,39]. For the 3d model, 92 photos were used. The photos were collected at a distance of 1 m from the slope of the conical rubble structure while the area mapped was 96.3 m2. The resolution of the ortho-mosaic is 5.07 mm/pix while the reprojection error is 1.67 pix.

4. Results

4.1. Geomorphology of the Coastal Area of Aegina City

The coastal zone of Aegina city has been affected by ancient and modern anthropogenic interventions, such as the construction of ancient harbor facilities in antiquity, which are currently found submerged/semi-submerged (South and North breakwater, system of conical rubble structures, naval and commercial harbour), as well as the construction of the modern commercial harbour on the remains of the ancient one and modern berthing areas. (Figure 2). The coastline is oriented NNW-SSE and is mainly flat apart from the Kolona hill that rises to 15–20 m above present sea level. The seabed reaches a maximum depth of −15 m at a distance of 0.8 km from the coast, while its morphology, excluding the ancient structures, generally follows that of the coastline. The seabed which is covered by sand inclines gently (0–5°) towards the west, while west of the Kolona hill, the rocky outcrops deepen seawards at a maximum angle of 15°. The presence of patches and fields of the seagrass P. oceanica generally increases towards the north, it starts from a minimum depth of −1 m to greater than −15 m, while it is absent from the areas where the rocky seabed outcrops. The southern part of our survey area is characterized by the existence of three successive normal faults (Figure 1C) as detected in the seismic profile (Figure 1D). The faults cluster at an N65°–86°E strike while they dip towards the NW and NNW. The southern fault dips at a 16° angle while it has submerged the footwall by 2.4 m. The central fault dips at an angle of 11°, displacing the footwall by 1.5 m, while the northern one dips at 19° with a displacement of 2.4 m. It should be mentioned that it is not known if these faults are linked to the subsidence of the area since their onshore continuation was not surveyed.
To better describe the geomorphological characteristics of the seabed, it was separated into three different areas: (i) northern, (ii) central, and (iii) southern area.

4.1.1. Northern Area

The northern part of our study area is bounded by the North Breakwater, which is an artificial structure, linear, perpendicular to the coast (WSW-ENE direction) submerged structure (Figure 3A) of at least 170 m in length [3]. The top part of the north breakwater is almost flat (0–5°) (Figure 3B), it ranges from 1.8–2.5 m depth at the east and reaches down to 4.7 m at the west. The breakwater slopes at a maximum of 35°. At a distance of 65 m west of the breakwater, there exist NNE-SSW oriented artificial cone-shaped rubble structures that form the “Conical rubble structures I” (CA I) (Figure 3A). The north part of “CA I” consists of four single conical structures that are closely placed to each other, the central part consists of overlapping cones that form two different solid structures, while the south part is composed of two closely located single cones. The crest of each structure is rounded while the slope inclines at a maximum of 35–45° (Figure 3B). The depth of each crest ranges from 3.17–4.53 m while the depth of the seabed around the structures fluctuates from 8.5–10.1 m.
The northern part of “Conical rubble structures II” (CA II) is located 80 m south of “CA I”, where a single cone is apparent. The central part is at a distance of 11 m from the northern and is composed of six successive structures which are placed at a short distance from each other, in an almost N-S direction. The southern part of “CA II” consists of three successive cones which are slightly shifted (10 m) to the west and are NW oriented. Each cone crest is also rounded and ranges from 3.57–4.64 m in depth. The maximum slope of each cone ranges from 35–45° while the surrounding seafloor depth ranges from 8.7–9.5 m.
70 m to the SE “Conical rubble structures III” (CA III) is apparent and is NW-SE oriented. “CA III” spatial distribution is different from the previous arrays since it consists of three distinct conical structures which are positioned at an equal distance of 15 m from each other and have almost identical morphology. Their crest depth ranges from 3.86 to 4.06 m, their maximum slope varies from 40–45°, while the surrounding seafloor depth fluctuates from 9.5–10.1 m. Southeast of CA III a cone of smaller size, 6.4 m minimum depth, and 30° maximum slope, is visible (Figure 3A-black arrow). The submerged structures can also be distinguished in the SSS mosaic as areas of high backscatter intensity (Figure 3C). An extended seagrass field (P. oceanica) is presented as an area of medium backscatter intensity, while it is surrounding the conical rubble structures and continues west until a depth greater than 15 m. The seafloor between the conical rubble structures and the Aegina coast is covered by P. oceanica patches and sediment that presents a medium to high backscatter intensity at the SSS backscatter map (Figure 3C). The rocky promontory of Kolona Hill continues underwater towards the west until 5 m depth and at an average slope of 5° (maximum 12°), forming a tombolo-like feature. P. oceanica is sparse in this area. South of the Kolona Hill, semi-submerged rubble formations mounded by fortification walls that delimit the ancient “naval harbour” are apparent. The current entrance to this harbour is at 2.8 m depth.
The seismic profiles acquired with the SBP showed the existence of a sedimentary unit which is overlapping the acoustic bedrock and is acoustically transparent (Figure 3E). Due to the existence of the seagrass (P. oceanica) on the seafloor, a chaotic acoustic pattern is created on the profile. Due to the high density of the construction material of the artificial structures, the sound is not able to penetrate below them creating also a chaotic acoustic pattern. The thickness of the sedimentary unit that is overlapping the acoustic bedrock at the NW of “CA I” and between Kolona Hill and the conical rubble structures ranges from 0.5 to 1.5 m, while it increases to 2.5 m west of “CA II”. The interpretation of the sediment thickness through the seismic profiles shows that the base of each structure is buried by the sedimentary unit that reaches a thickness of 0.5–1.2 m around the structures (Figure 3E).

4.1.2. Central Area

The central part of our survey area includes the present commercial harbour that was built on the foundations of the ancient commercial port. The commercial harbour has a maximum depth of 6.2 m while the current entrance to the harbour is 6 m deep (Figure 4A). Two deepenings of 9.7 and 7.5 m maximum depth are formed north and south of the modern berth respectively. In the broader area of the deepenings, linear features appeared on the backscatter intensity map (Figure 4C), probably forming due to dredging and anchoring of the commercial vessels as the seagrass was absent from the seafloor. The dredging activity can also be supported by the absence of the upper sedimentary unit in the seismic profile (Figure 4D). North of this deepening the seabed is covered by P. oceanica while the depth of the seabed ranges from 4.8–7.5 m. The seabed is generally flat while the thickness of the sedimentary unit decreases to the north, from 2.5 to 1 m. The harbour facilities are bounded by three conical rubble structures to the west, which is NW-SE oriented. “Conical rubble structures IV” (CA IV) consists of six different cones and is surrounded by a P. oceanica field. The two northern conical structures are placed at a distance of 40 m with each other, their crest has a depth of 3.8 m and their slope varies from 35–40°. It appeared by the backscatter map that the cones are well preserved and that their characteristics resemble those of the previous conical rubble structures. The other four cones are placed close to each other, their crests are found deeper than the other two (4–4.95 m) while they have a smaller slope that ranges from 20–40°.
“Conical rubble structures V” (CA V) is different from the conical rubble structures described so far since their morphology resembles that of low relief rubble mounds or possibly collapsed cones (Figure 4A,C,E), without the presence of crests. They are generally wider and smoother structures, and their upper part is deeper than the previously described structures. Their depth ranges from 4.5–7 m depth and their slope from 10–37°. The structures present a medium to high backscatter intensity while P. oceanica is present only at the southern part of “CA V”.
The southern of them, “Conical rubble structures VI” (CA VI), consists of seven, not very well-formed, cones that generally present a wider and more rounded upper part (Figure 4B). Their crest depth ranges from 4–4.85 m and their slope varies from 24–30°. On the contrary, the southern cone structure of this array is significantly larger, almost tripled the size of the other cones, since it presents an elongated shape of 40 m base width and 30 m in length. Apart from that, the upper part has a minimum depth of 2.92 m, which is the shallowest depth recorded from all the conical rubble structures. The slope of the cone ranges from 30–35° and is surrounded by P. oceanica. The sediment thickness increases towards the south while it ranges from 1–1.5 m west of the conical rubble structures. The seafloor west of the conical rubble structures is generally flat and is covered by an extended field of P. oceanica.

4.1.3. Southern Area

The southern part of our survey area is bounded by a 280 m length, E-W oriented curved breakwater with its concave facing the north (Figure 5A). At the eastern and central flat upper parts of the breakwater, the shallowest areas have a depth of 1.77 m, while it gradually deepens to the west at a maximum depth of 3.4 m. The breakwater slopes at a maximum angle of 30° (Figure 5B), while sediment of 1.5 m maximum thickness is apparent at the inner part of the concave (Figure 5D). At the western tip of the breakwater, a linear feature following the same orientation of the breakwater is apparent, presenting high backscatter intensity (Figure 5A,C(ci)). This feature consists of equidistant (~5 m) rocky piles that connect to the west with a mound of 6.3 m maximum depth (Figure 4A-Mound 1). About 100 m SW of this mound there exists a second mound of lower relief (maximum depth 7 m) (Figure 5A-Mound 2).
A P. oceanica field is present in the southern area, mostly at the very shallow eastern part, while moving to the east it is present only around the breakwater and the two mounds. The thickness of the sedimentary unit close to the breakwater varies from 0.5–1.5 m while at the area of the two mounds the maximum thickness (>4.5 m) appears (Figure 5E). South of the breakwater the rocky bedrock outcrops at a depth of 1.9 m and inclines at an average angle of 4°. The rest of the seafloor is mostly sandy while it inclines gently (1°) towards the west.

4.2. Automatic Detection and Morphometric Analysis of the Ancient Harbour Facilities

4.2.1. Automatic Detection of Submerged Ancient Structures

For the automatic detection of the submerged ancient port structures; as described in the methodological part, the bathymetric slope was converted to a greyscale image and was processed in the TargAn software [36,37] for segmentation and statistical parameterization (Figure 6). The software segmented multiple areas along the Aegina coastline which matched the areas of the submerged harbour facilities. The north and south breakwaters were detected successfully as well as the conical rubble structures. The two mounds also described in Section 4.1.3 were also detected by TargAn and were grouped with the rest of the targets. However, in one of the segmented areas, the software detected features irrelevant to the archaeological targets. This area was outside the modern harbour facilities where dredging has exposed the bedrock, creating strong edges that were included in the segmented areas. To add to that, the limitation of the analyzed slope image resolution which was 1.2 m, did not allow the detection of targets of possible archaeological interest, with a dimension lower than the image resolution. To avoid these effects and reach a final delimitation of the ancient structures, all of the geophysical and visual data were interpreted and combined with the results of the segmentation process. The map that contains the final delimitation of the ancient harbour facilities is given in Section 4.2.2.

4.2.2. Seafloor Classification and Spatial Planning Analysis

Segmentation of the bathymetric slope detected the main submerged structures while the acoustic data (multibeam, side-scan, sub-bottom) and ROV data were also used for the final seafloor classification map (Figure 7). The ancient installations constructed at the coastal area of Aegina extended for 1.6 km starting from the northern border, which is bounded by the north linear breakwater and south curved breakwater, covering in total an area of 0.52 km2 (Figure 7).
The northern part of the submerged harbour facilities (north breakwater, conical rubble structures I-IV) is well preserved since they all present similar extent and geometry (Figure 8A). However, some of the conical rubble structures were destroyed during the ‘70 s to allow the passages of larger modern ships. In general, two morphologies of construction were identified within the conical rubble structures. The first morphology is that of a single cone and the second describes an array of multiple cones (from two up to a maximum of nine conical rubble structures) that are closely placed to each other and with overlapping bases. It was observed that at CA I, II, IV, the northern cone of each array is always a single cone which is 25, 30, and 40 m away from the main body of the multiple arrays respectively (Figure 7). The rest of each array is constructed following the second morphology of construction. The distance between each crest of each of these cones ranges from 11–19 m. Furthermore, the conical rubble structures were built almost equidistant since between CA I and the north breakwater there is a gap of 85 m, between CA I and CA II a gap of 80 m, and between CA II and CA III a gap of 75 m. This arrangement allowed the creation of multiple passages to the northern protected area (E1–3, Figure 7).
CA III presents a different construction pattern since it consists of three very well-shaped single cones which are equidistant (35 m) and morphometrically identical. Between the CA III and the anchorage site scattered boulders are apparent on the seafloor (Figure 8B) The gap that exists to CA IV is forming a wider entrance (150 m) towards the “naval harbour”. CA V represents the possibly collapsed part of the arrays which might have consisted of multiple conical structures. However, due to its current condition, this array was not evaluated in the spatial planning analysis to avoid biased results. CA VI also consists of multiple conical rubble structures that are more rounded on the upper part. The greatest difference is that the southern rubble structure of this array, and also of the whole area, is not circular, it is bigger than the other structures (30 m width, 40 m length) and it presents the shallower crest of all (−2.9 m), hence it could have been probably a significant navigation landmark for ancient sailors, such as a lighthouse.
The purple, red and green lines represent hypothetical paleocoasts at depths of −3.8, −2.5 and −1.7 m as derived by the sub-bottom seismic profiles. The orientation of the conical rubble structures is parallel to that of the paleocoast all along the extent of the harbour facilities, while the distance between the structures and the paleocoast of −3.8 m is always greater than 200 m. More specifically, CA I is situated 260–270 m far from the paleocoast of −3.8 m, CA II &III at a distance range of 210–250 m and conical rubble structures IV that are located in front of the “closed” harbour entrance present the closer distance (190–120 m). CA V which is collapsed is 200–250 m far while the southern conical rubble structures are situated at a greater distance from the paleo-coast of −3.8 m (300–320 m).
Finally, apart from the curved southern breakwater (Figure 7), a previously unknown complex pattern of structures is apparent. At the western edge of the south breakwater, an array of stone piles (Figure 7 and Figure 8c,ci) is forming a 170 m linear feature that connects to mound 1 (Figure 7). Mound 1 was detected from the automatic classification as part of the structures based on its slope and acoustic properties. A second mound (mound 2) with similar characteristics to that of mound 1 but of limited extent, is apparent 130 m to the south. This complex structure renders two possible passages to the protected area, E5 and E6.

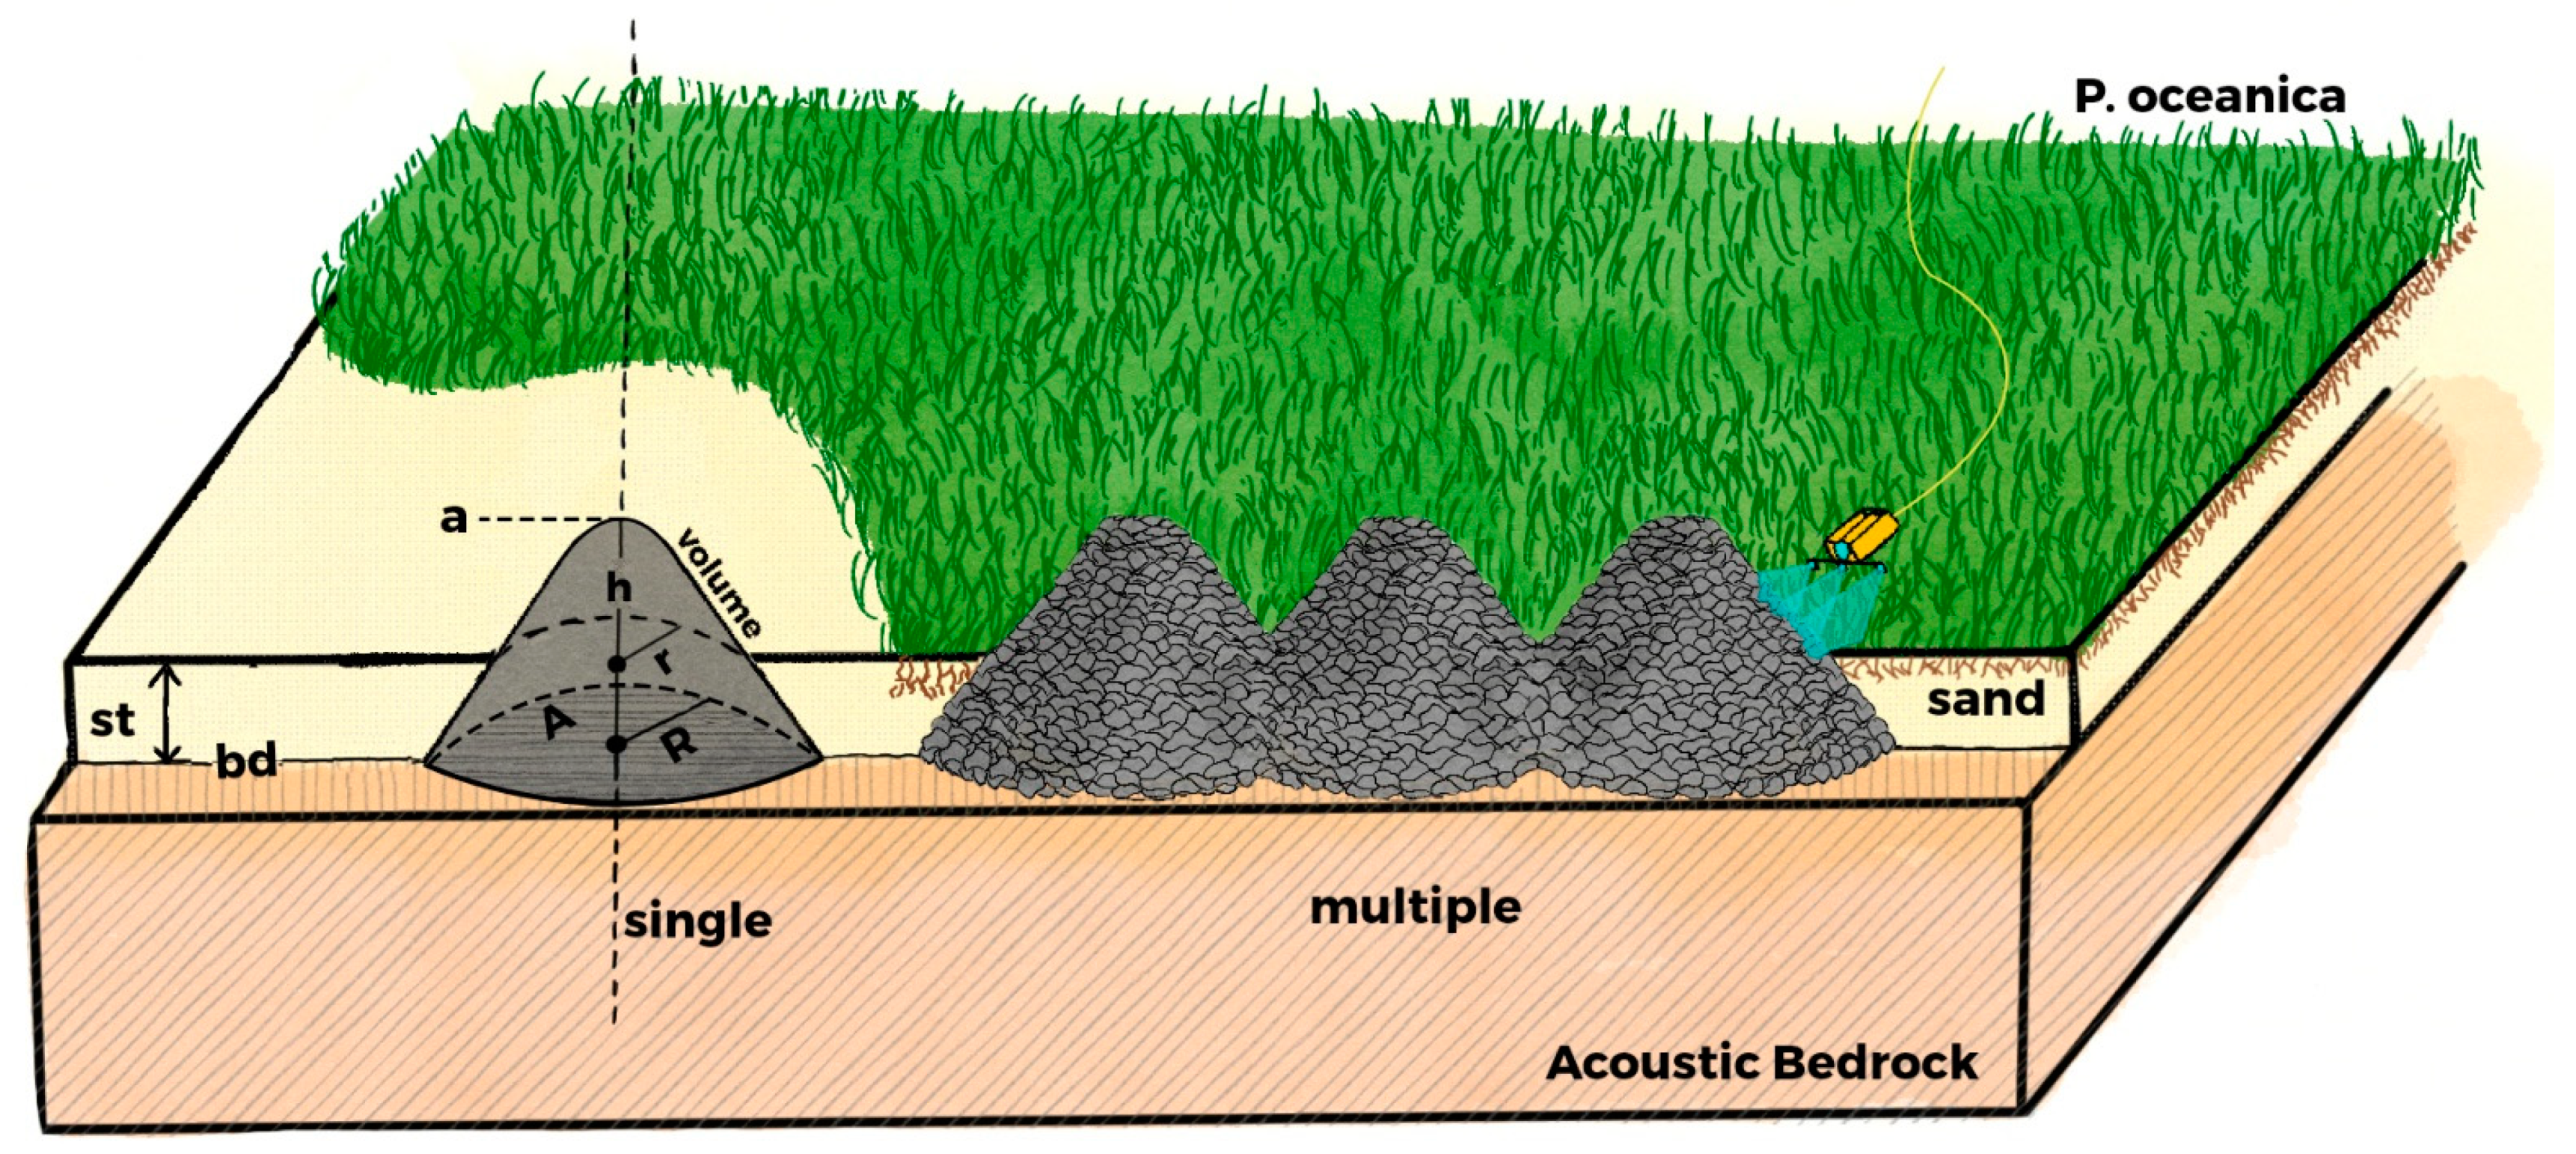
4.2.3. Morphometric Analysis and Parametrization

In the following sketch, the morphometric characteristics and the geomorphological setting of the surrounding environment are simplified (Figure 9). Each of the cones is founded on the acoustic bedrock, that was detected by using seismic profiling (also seen in Figure 3E). In this way, we were able to calculate the sediment thickness (st) around the cones and their base depth (bd) (or foundation depth). The structures’ “bd” were founded at depths of 8–11.6 m while 66% of them were detected between 10 and 11 m depth. The shallower acoustic bedrock depths were situated at the southern part of our survey area, at CA VI. The thickness of the loose sedimentary unit surrounding the cones ranged between 0.5–2 m while 65% of them were buried by 0.8–1.3 m of loose sediment. 67% of the cones’ crests were found at a depth range of 3.6–4.1 m while the rest ranged from 2.9–5 m. The height (h) of most of the cones varied from 5.7–7.5 m while at the southern part they presented a minimum height of 3.6–4.1 m. It was observed that the greater the depth of the acoustic bedrock, the greater was the height of each conical structure.
As already mentioned in Section 4.2.1 the conical structures were constructed in two construction morphologies, the single and the multiple whose morphometric properties were realized through the TargAn software. It was calculated that the single cones were slightly bigger than the multiple morphology conical structures. Single cones presented an upper radius (r) range of 11.5–12.5 m while their base radius (R) ranged between 12.15 and 13.05 m (Figure 9). The base radius of each cone that belongs to the multiple construction morphology was estimated at 8–11.5 m. The average area covered by every single cone on average was 432 m2 while in total an area of 35.000 m2 is covered by the ancient structures. The average volume of each cone was estimated at 1.300 m3 while a rough estimation of 78.000 m3 total volume of construction material might have been used for the construction of all observed ancient harbor structures (the North and South breakwaters and the totality of the conical rubble structures).

4.2.4. Photogrammetric Implication

By using an ROV equipped with underwater cameras and photogrammetry, a 3D model of a small part at the base of a cone (100 m2) was created (Figure 7a and Figure 10). The photogrammetry confirmed that these cones constitute rubble structures (rocky piles). It appeared that the stones were possibly placed on each other randomly since a specific building pattern was not observed. The number of stones and their size were measured, while the part of the cone that present the minimum reprojection error was selected for further analysis (Figure 10C,D- area D). The number and size of the boulders were measured inside one square meter (Figure 10C,D). In this area, 7 stones were detected and measured. Their size in the x-axis ranged from 22.4–52.1 ±10 cm, in the y axis 20.9–58 ±10 cm, and in the z-axis (when possible) from 13.5–32.4 ±6 cm. By using an average stone size from these values, a volume of 1.300 m3 of construction material was possibly used for each cone, while it was estimated that each cone would need on average 16 k stones to be built.

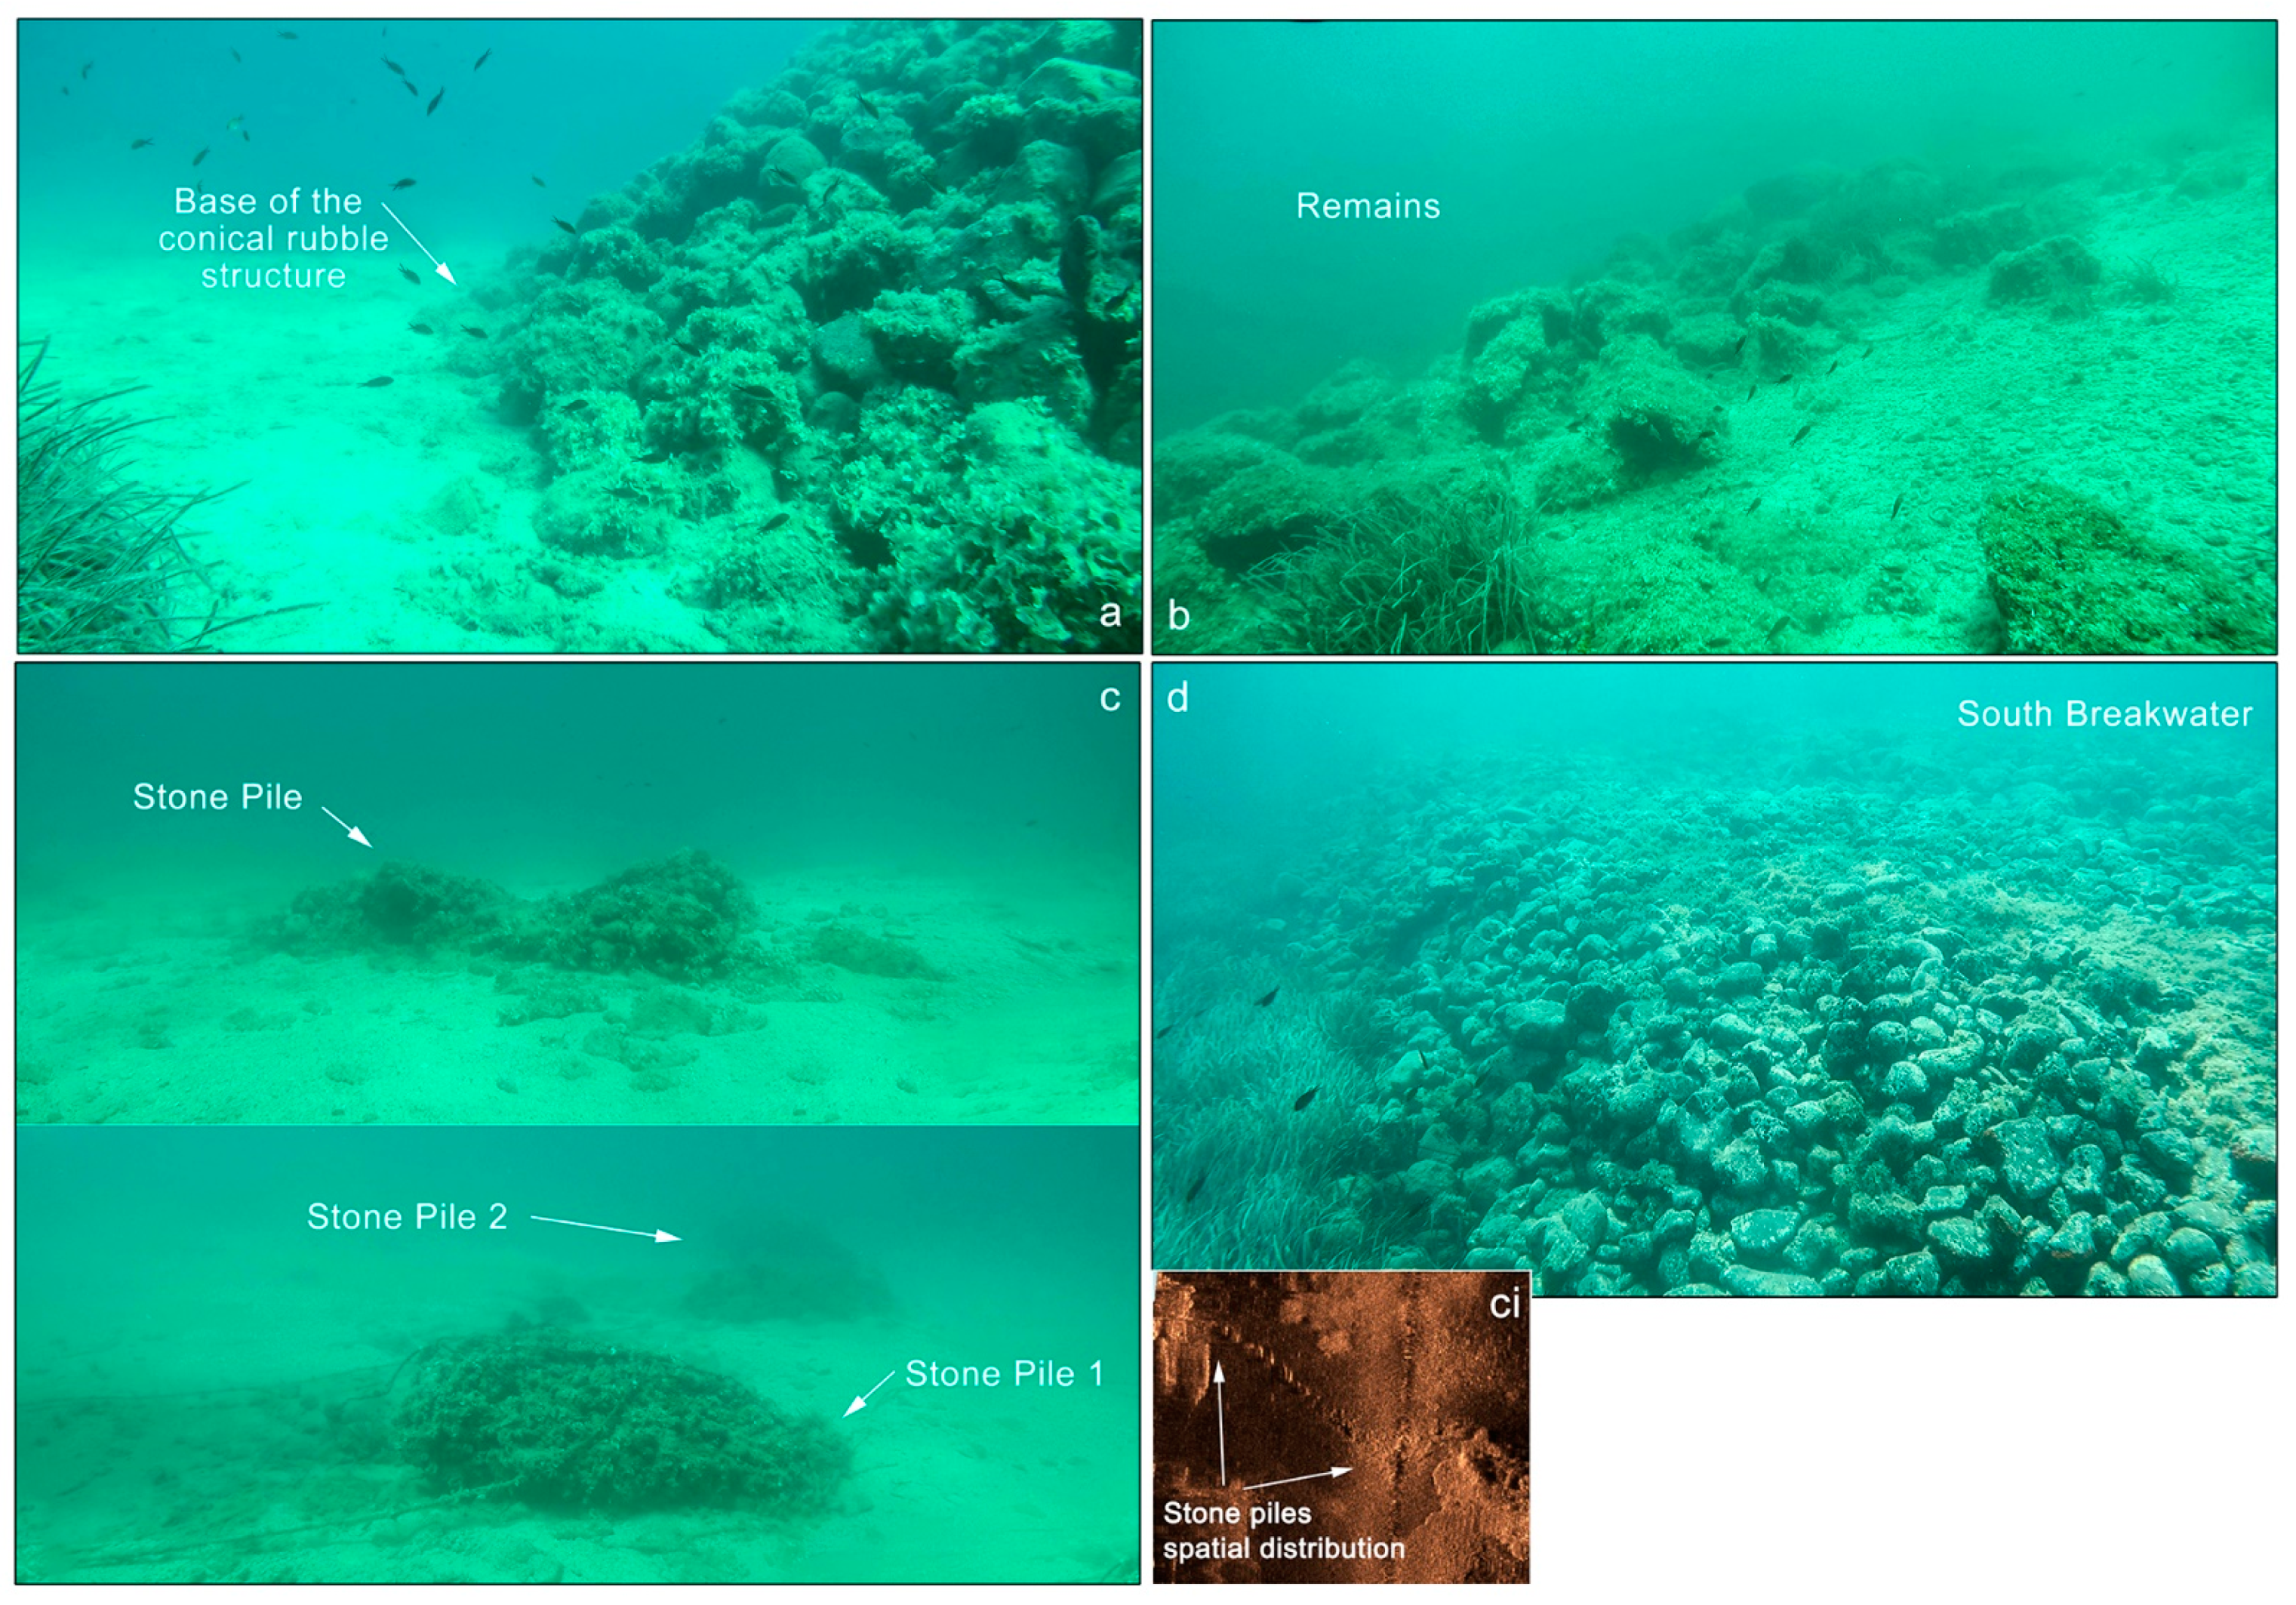
4.3. Condition Assessment of the Submerged Archaeological Remains

The modern harbour of Aegina is the receiver of a great number of vessels and especially passenger vessels whose density was estimated at an average of more than 1000 h/km2 (EMODNET-vessel density map, accessed on 26 May 2021). The passenger vessels have an average draught of 3.5–4 m, while they affect the seafloor with water turbulence and mechanical disturbance. The shape geometry and terrain statistical parameters of the segmented objects (i.e., conical rubble structures and breakwaters) as derived by the TargAn software, were data mined against their ability to reveal any meaningful spatial patterns related to their preservation status or their geometrical distribution. Although no spatial pattern was revealed using any of the shape geometry statistics, the standard deviation and depth range within the interior plus a buffer of 5 m around each segmented object showed a clear spatial pattern. The depth range and standard deviation values were plotted versus each other and three well-separated groups of segmented objects were revealed (Figure 11A). Interpretation of those groups can be based on the preservation status of the archaeological remains given that a heavily ruined structure implies low relief and flat terrains, given for instance that the top of the conical rubble structures has likely collapsed. This way heavily ruined archaeological remains will bear low depth ranges and standard deviations while the opposite will be the case at well-preserved ones. The middle group, bearing moderate range and standard deviation values, indicates moderately preserved remains. The spatial distribution of those three groups is consistent with the known preservation status of the rubble structures (Figure 11B). It appears that the conical rubble structures are better preserved within the increasing distance from the entrance of the modern harbour.

5. Discussion

5.1. Documentation of Underwater Cultural Heritage Using Remote Sensing

The coastal zone of Aegina under survey constitutes one of the most archaeologically significant sites of the Mediterranean due to the extent, the conceptualization, and implementation of the currently submerged harbour facilities constructed during Classical antiquity [2,3,4,5,6]. The increasing pressure of modern industrialization and coastal harbor development in the coastal zone poses a significant threat to the viability of this underwater and coastal cultural heritage, thus one of the modern challenges is their preservation. Therefore, it is essential that they are detected and mapped systematically and precisely. The downscale methodological approach used in this marine geological survey [35] succeeded in obtaining information that serves both geomorphological and archaeological purposes, regarding the surface of the seafloor and the subsurface in a time- and cost-effective way. The combined use of marine geophysical sensors (side-scan sonar, multibeam sonar, and sub-bottom profiler) proved successful in the detection of archaeological sites and geomorphological features necessary for the paleogeographic reconstruction of the sites (subsidence-uplift, sediment thickness, sea-level change, etc.) [12]. The application of non-intrusive marine geophysics combined with photogrammetric techniques acquired using an ROV [18,40,41,42] on archaeological targets that lie on the seafloor, allowed the collection of centimeters to millimeters scale data. These data are crucial for knowing their morphological characteristics (parametrization) but most importantly for estimating their preservation status, which is a mandatory step towards their protection. Seafloor classification techniques have been used especially for the mapping of generally shallow seabed habitats [43,44,45] while in few cases in the detection of archaeological sites [8,46]. In the current survey, the use of the TargAn software [37], which is dedicated to the parameterization of backscatter image regions in acoustic data, contributed to the detection of archaeological targets and the assessment of their preservation status.

5.2. Advanced Harbour Engineering Planning & Issues of Functionality of the Conical Rubble Structures Arrays

The current survey brought light to a series of very important research issues, that have been pending since the discovery of this harbour complex and advanced considerably the implementation of the now ongoing systematic maritime archaeological research. Concerning the implementation of the system of the conical rubble structures, the geophysical interpretation revealed that the base depth of 66% of the cones followed the depth contours between 10 and 11 m below present sea level, while their distance from the −3.8 m paleo-shore varied between 220–270 m. Moreover, the depth of the cones’ crests was about the same level regardless of their foundation depth. This is a strong indication that before the construction of the harbor facilities, a hydrographic survey using the available means of this age was preceded by the ancient harbour engineers. The spatial distribution of the conical rubble structures offered controlled access (70–80 m width) to the northern part of the site (Figure 7), the access at the central part was easier (150 m width), while the northern was probably more complex since it was controlled by two rubble mounds which are attached to a linear rubble construction that reaches the edge of the South curved breakwater. Finally, the dimensions and depth of the southern conical structure (almost triple the size comparing to the rest of the cones and has the shallower crest) allows us a probable interpretation as a navigation landmark for ancient seafaring.

5.2.1. Shielding

The functionality of the conical rubble structure arrays has originally been linked to defensive purposes against enemies and piratical raids, based on Pausanias [1]. Before estimating the depth of the conical rubble structures’ crest and evaluate it as a Relative Sea Level indicator [47], it should be taken into account that it is still unknown to which extent material from their crests have been removed or destroyed over time due to natural or anthropogenic causes [48], or whether the conical rubble structures have undergone any modification or improvement works after their construction. What is known is that no scattered material was detected around most of the conical rubble structures, except for those affected by the modern harbor activities. 75% of the well-preserved cones crests range from 3.6–4.1 m. Considering that the well-preserved conical structures crests’ depth remained intact through the centuries, the scenario that could support the conical rubble structures use for shielding purposes is that of P. Knoblauch [3] who suggested a relative sea level of an average of at least −3.8 m bpsl at a certain period of time. According to this scenario, the crests would have been constructed to reach the mean sea level in order to function as a shield to repel the enemies’ vessels since the draught of the oared vessels during antiquity was relatively shallow.

5.2.2. Sheltering

On the other hand, the multiple cone construction technique, i.e., building the cones tangent to each other placing their crests at a closer distance (12–15 m) comparing to the single morphology cones (30–45 m), made the navigation passage less accessible to the enemies but they also constitute a more robust and dense construction. By using the same sea-level scenario (−3.8 m) the paleodepth of the crests was shallow (0–1 m brsl), thus this could force the waves to break and the wave energy to dissipate before reaching the coast, resembling the modern submerged breakwaters whose crests are also constructed at 0.5–1 m bsl [49,50]. Submerged breakwaters constitute a sophisticated engineering concept that is under great development today. It has been found that they are two times more effective than the emerged ones in terms of wave energy reduction, while they prevent siltation [51,52,53]. Construction of modern submerged breakwaters depends on wave conditions and geomorphology of the coast, they are usually built at a distance of 150–200 from the coast and a depth of 3–5 m. The ancient conical rubble structure arrays of Aegina are found at deeper waters (8–11 m paleo-depth) while their distance from the paleoshore of −3.8 m varied between 220–270 m during their construction. The construction of these “ancient submerged breakwaters” would not only be beneficial for creating calmer conditions between the conical rubble structures and the harbors, but it would be cost-effective compared to a usual breakwater while it would also create a productive artificial fishing field, or anchorage space as it is today. Of course, by using the bathymetry as input in a wave simulation model more trustworthy results could support the hypothesis of a submerged breakwater, a study already initiated by the Aigina Harbour city Project. In this context, a natural rocky ridge that has been mapped offshore the Alexandria, in Egypt, seems to be playing a key role in the functionality of the ancient Alexandria harbour (“Great Harbour”) and constitute a submerged breakwater preventing the entrance of high waves in inshore waters and protecting the entrance of the ancient harbour basin [54].
Finally, based on the sediment thickness derived from the seismic profiles, the sediment thickness between the west breakwater and the conical rubble structures is not greater than 1.5 m (Figure 3D), while west of the structures sediments accumulate up to 3 m thickness. Thus, the passages and the gaps between the conical rubble structures’ crests could possibly contribute to preventing siltation. One of the biggest issues in ancient harbours was their siltation due to the coastal sedimentation or worse due to the presence of riverine input nearby [55,56]. Since antiquity, engineering solutions were implemented, such as channels and vaulted moles in the Roman period to prevent this process temporarily to prevent this process temporarily [57,58].

5.2.3. Relative Sea-Level Rise Implications

The survey provided more accurate data for advancing the issue of the relative sea-level change in Aegina that remains open. Submerged archaeological remains in the Attico-Cycladic massive, including the Sounion area, (−2.5 to −3 m bpsl during the Classical and Hellenistic period [17,59,60]), suggest that a sea-level rise rate of 1–1.2 mm/yr affected the area during the last 2.5 ka [17,59,60]. Different relative sea-level scenarios have been advanced for the city of Aegina [3,4]. When using the data of the current survey and assuming that the depth of the well-preserved conical rubble structures’ crests remained intact through the centuries, all the well-preserved crests’ depth range between 3.2–4.4 m bpsl with a mean value of −3.9 m bpsl. It is expected that the systematic underwater geoarchaeological research now on-going will provide accurate data on the relative sea-level change for the different periods of construction and use of the harbour structures clarifying the key issues on the functionality and dating of this unique harbour system, that has no parallel in the Greek world [61,62].

5.3. Underwater Cultural Heritage Preservation Status

The acoustic data parameterization that derived from the TargAn software proved highly efficient in the assessment of the submerged archaeological features’ preservation status. The assessment analysis of the conical rubble structures showed that the bigger the distance from the modern harbor the better they were preserved. Modern interventions by the port authorities the recent years and after the modernization of the harbour commercial zone have affected their original height and morphology, while some conical rubble structures have been deliberately destroyed to facilitate the navigation towards the entrance of the modern harbor [6]. Moreover, to enter the modern harbor facilities the vessels occasionally still cross on top of the structures whose original depth, comparing to the ones that are well preserved, should have probably ranged between −3.2 to −4.4 m during their construction. The vessels that currently enter the harbor have a draught of 3.5–4 m, thus water turbulence and mechanical disturbance caused by the propellers and hull can still affect their geometry, ruining their original shape. This could be the direct result of their neglect in the integrated coastal zone management plans [63]. Therefore, their condition assessment is critical for the management of underwater and coastal cultural heritage sites and their future inclusion in the Blue Growth strategies.

6. Conclusions

The present marine geological survey offered valuable data in order to advance the ongoing systematic underwater and coastal archaeological research and open a new interdisciplinary dialogue. This was achieved through the use of a non-intrusive downscale approach for the mapping and detection of the submerged ancient structures which requires the combined use of modern marine geophysics (side-scan sonar, sub-bottom profiler, multibeam echo-sounder), automatic seafloor segmentation software, and photogrammetric implications through the use of ROV.
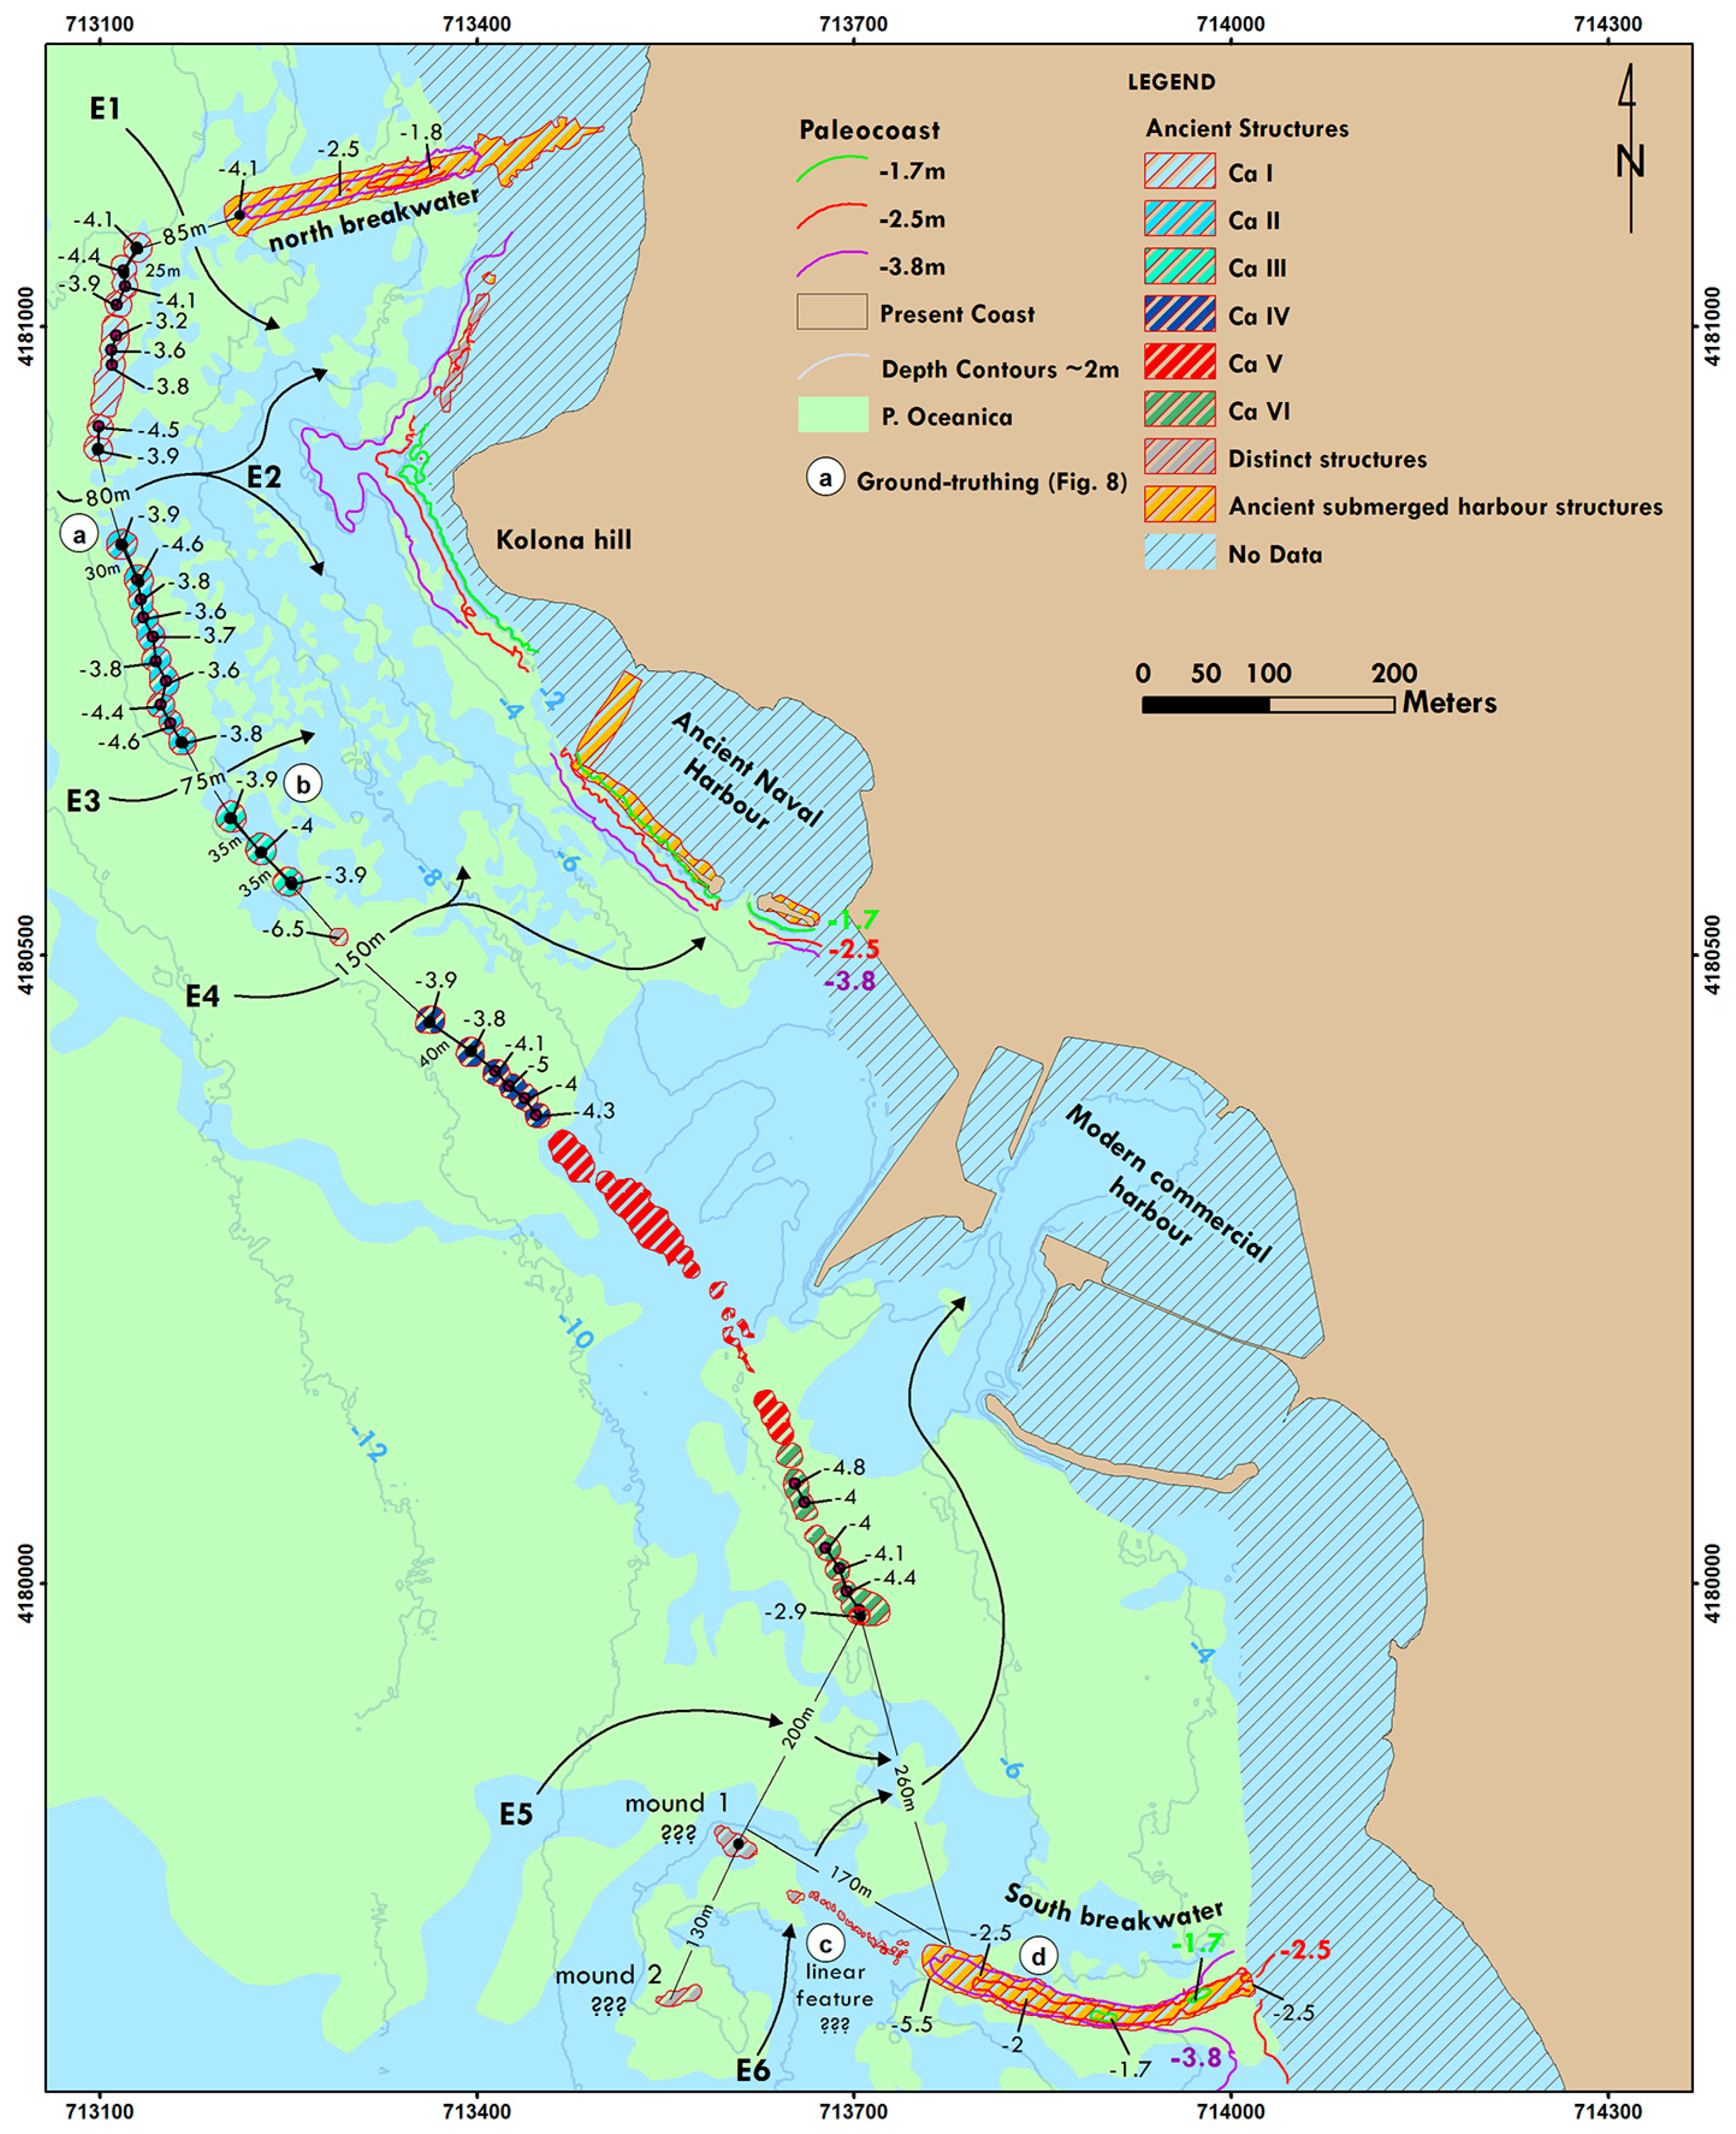
  • The use of this methodological approach proved successful in identifying geomorphological features (i.e., faults, sediment thickness, seabed bathymetry). The whole extent of the submerged and semi-buried archaeological site was delimited using the collected acoustic data while automatic seafloor segmentation techniques were used to detect the submerged harbour facilities (conical rubble structures and breakwaters) in detail while revealing a previously unknown underwater area that contains archaeological remains.
  • The submerged harbor facilities’ spatial planning analysis revealed the advanced harbour engineering plan, unique in the Greek world, that offered multiple and controlled passages to the ancient harbours’ basins. This strongly indicates that a hydrographic survey preceded the construction of the harbor facilities by the ancient harbour engineers.
  • The parameterization and morphometric analysis (geometric characteristics and depth distribution of the structures, burial depth) of the submerged harbor facilities’ (conical rubble structures) acoustic data showed that their use to prevent enemies from entering the harbors (shielding) but also as submerged breakwaters (sheltering) could be two possible functional scenarios. However, this remains to be verified by the study of the morphology and the dating of the conical rubble structures complex by underwater archaeological survey and excavation, as well as wave modelling that will use the current seafloor bathymetry as input.
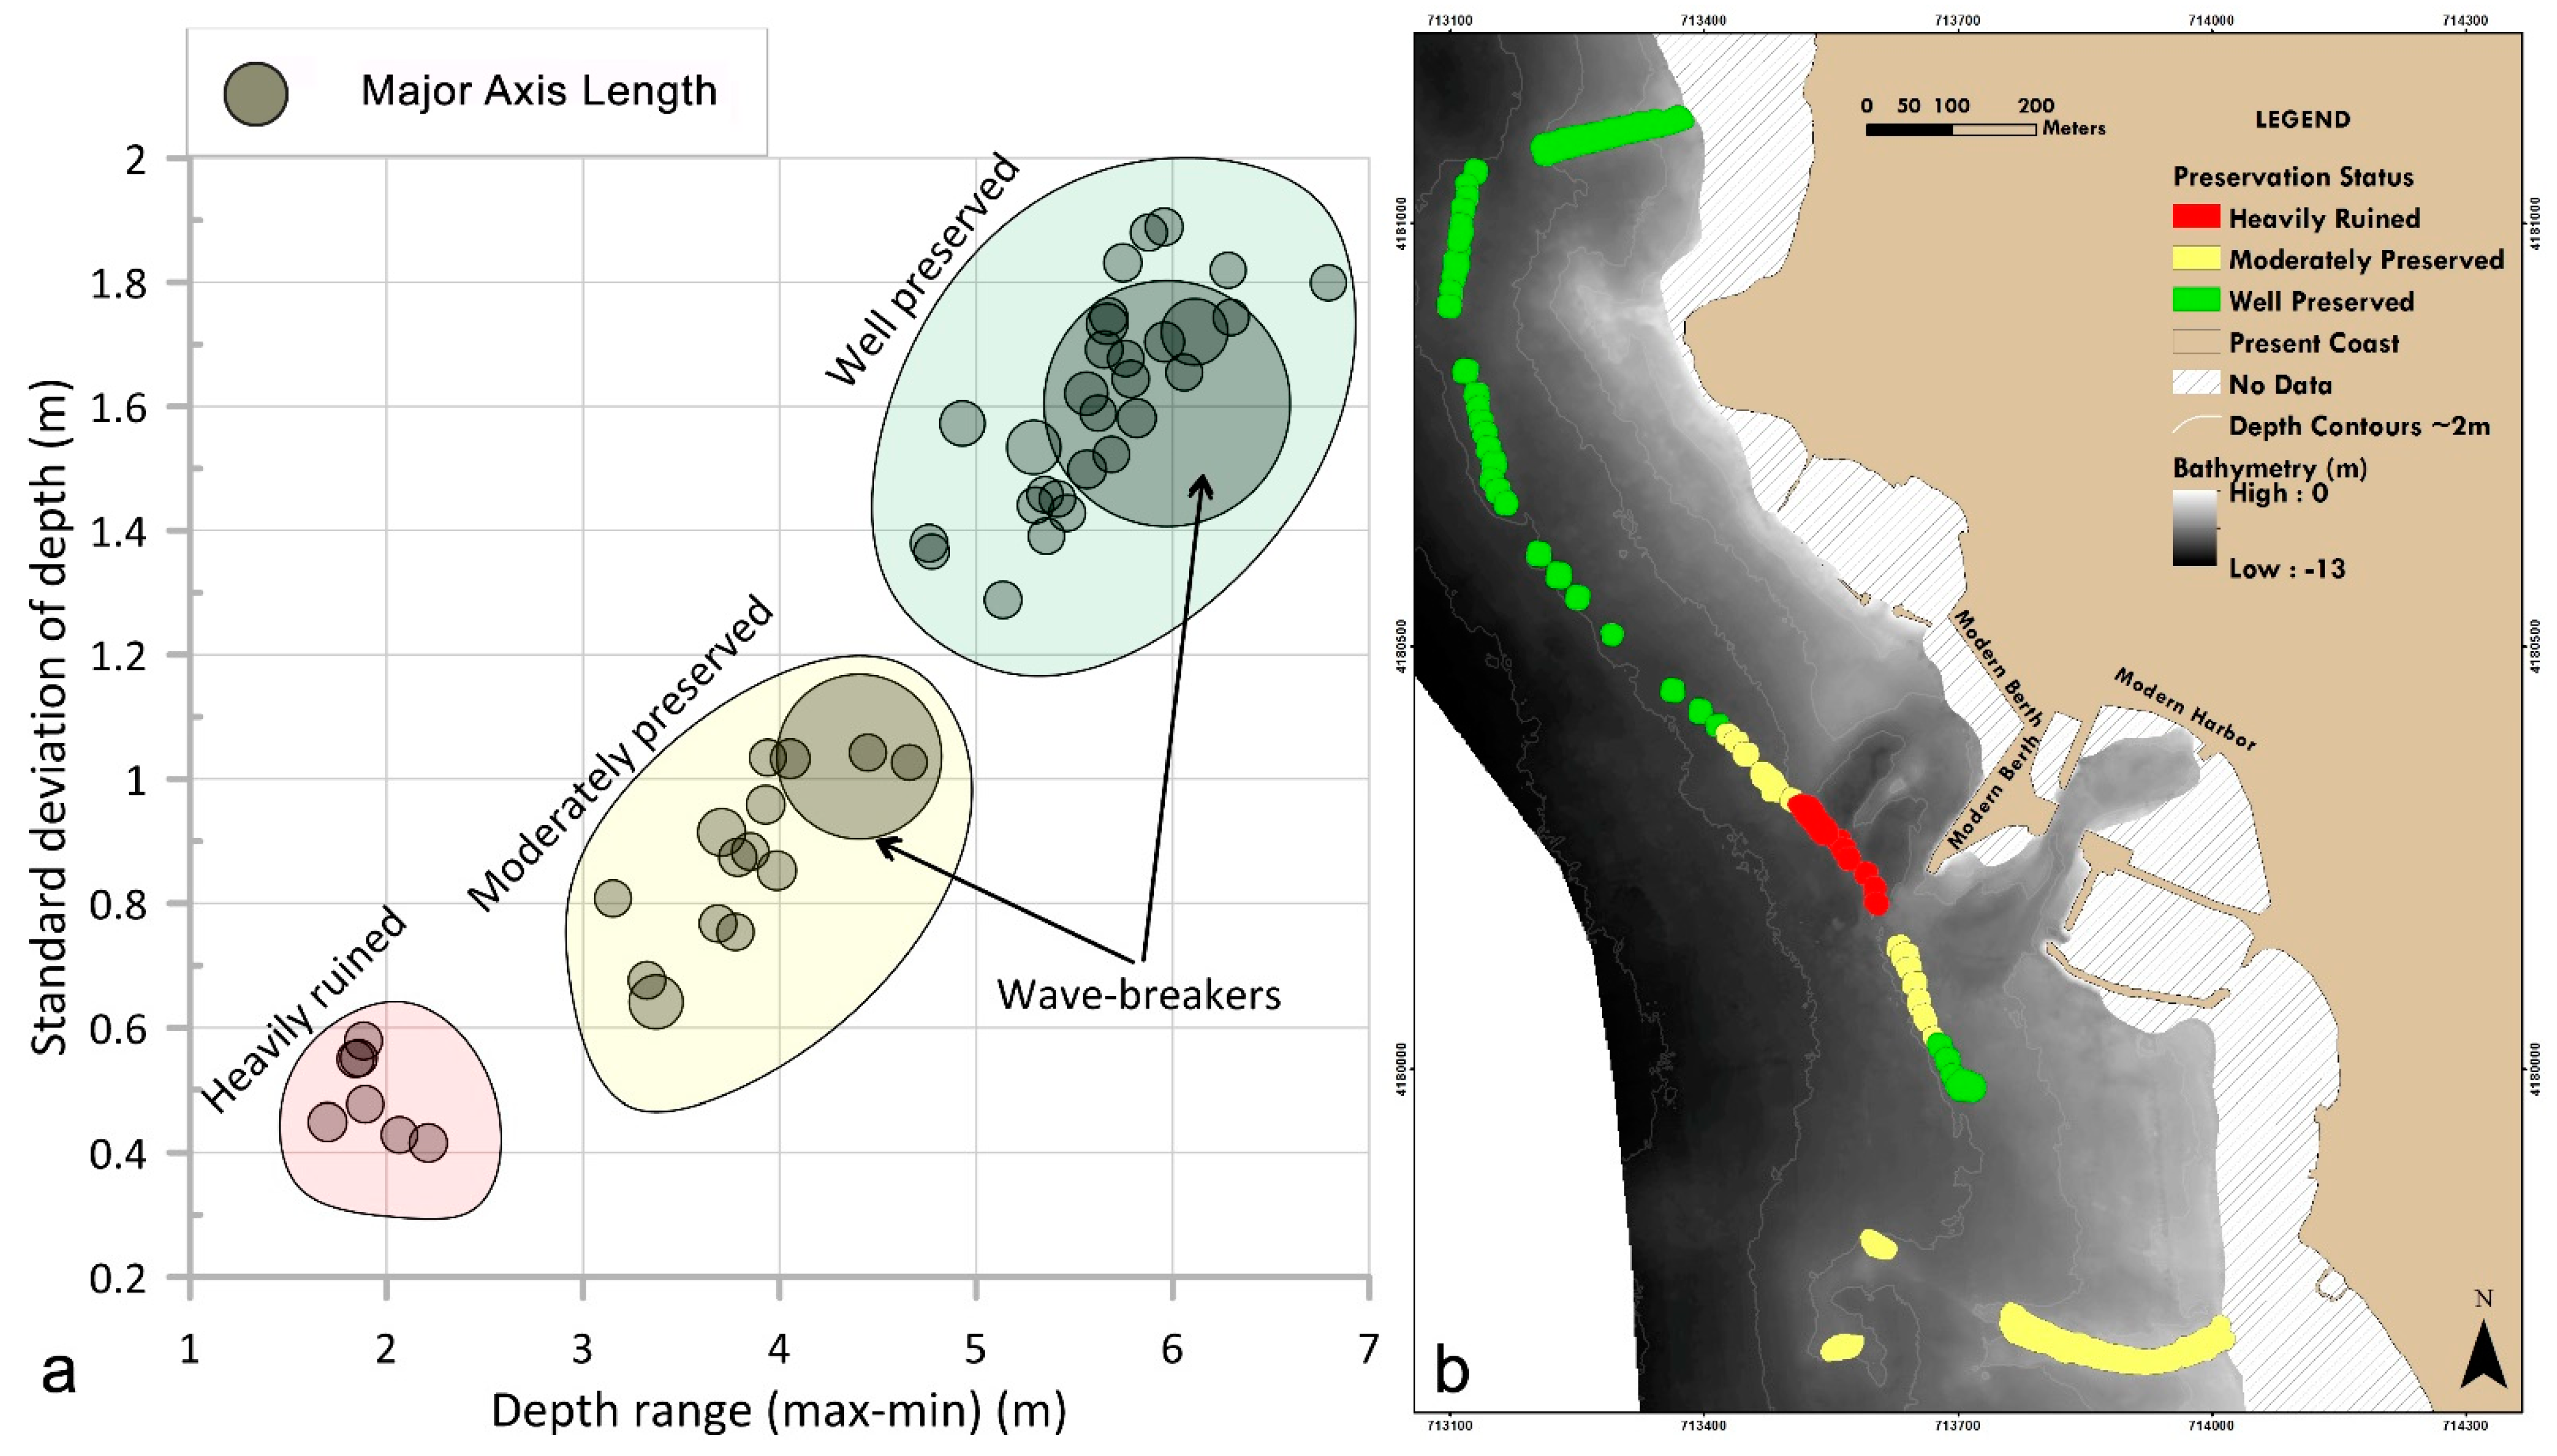
  • Morphometric analysis of the submerged site revealed its preservation status, indicating the partly destroyed structures affected by the modern harbor activities.
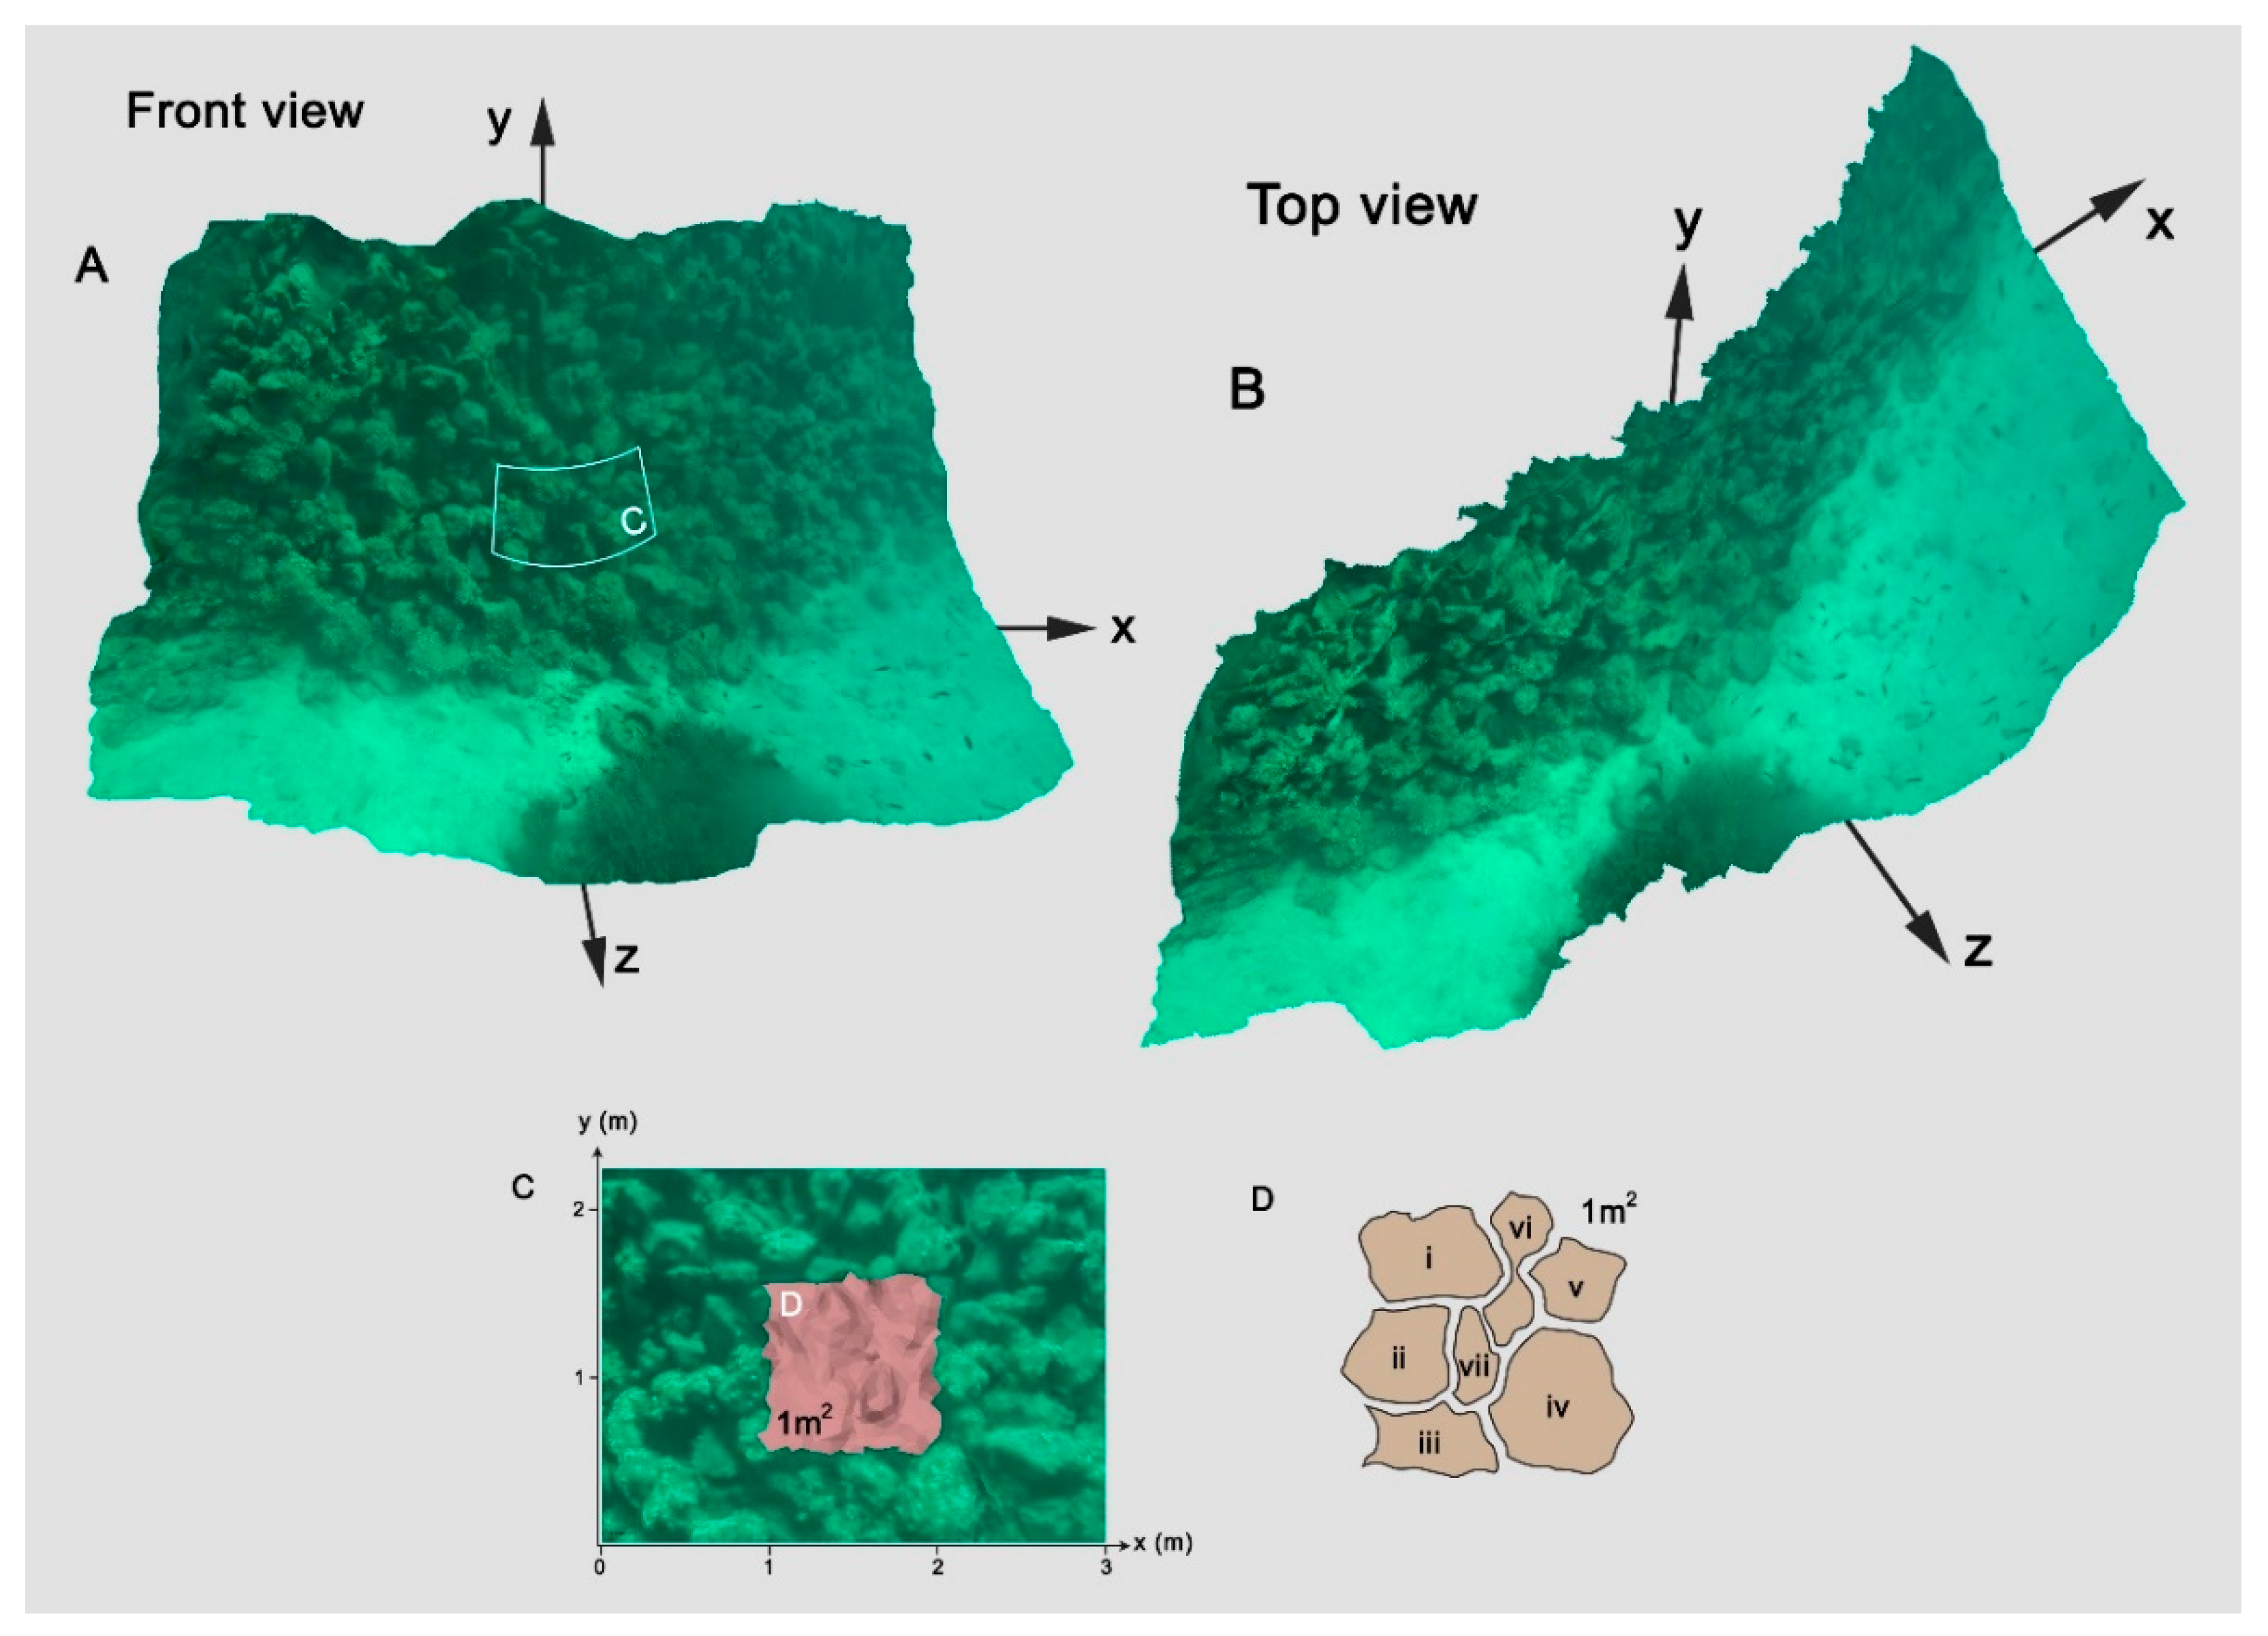
  • Photogrammetry, using an ROV equipped with action cameras, was applied on one of the archaeological structures (i.e., conical rubble structure), revealing the microstructure such as the size of the rubble material and the amount needed for their construction. These estimations will be further explored by systematic archaeological documentation and detailed underwater photogrammetric recording, that have now been initiated.
This article is a holistic approach to coastal areas of archaeological interest that succeeded in obtaining information that serves both geomorphological and archaeological purposes in a time- and cost-effective way, while obtaining information of centimeters to millimeters scale. Therefore, this detailed marine geomorphological documentation has contributed significantly on enhancing the systematic maritime archaeological research on clarifying issues of dating, functionality and landscape reconstruction of this unparalleled ancient harbour-city complex. Finally, this article demonstrated the anthropogenic impact on the site, thus the necessity to include the UCH in marine spatial planning as well as coastal zone management.

Author Contributions

Conceptualization, N.G., E.F., and G.P.; methodology, N.G., E.F.; software, E.F.; validation, N.G., E.F.; investigation, N.G., X.D., D.C., E.F., M.G., G.P., G.F.; data curation, N.G., G.P., E.F.; writing—original draft preparation, N.G., E.F., K.B.; writing—review and editing, K.B., D.K., G.P., ; visualization, N.G., E.F.; supervision, K.B., D.K., G.P., G.F.; project administration, K.B., D.K., P.K. All authors have read and agreed to the published version of the manuscript.

Funding

The authors N.G. and X.D. were granted a scholarship by Greece and the European Union (European Social Fund- ESF) through the Operational Programme «Human Resources Development, Education and Lifelong Learning 2014-2020» in the context of the project “EnAktea: Integrated Methodological Approach for the Detection & Mapping of Marine Priority Habitats and Submerged Antiquities” -Gn. 504717.

Institutional Review Board Statement

Not applicable.

Informed Consent Statement

Not applicable.

Data Availability Statement

Not applicable.

Acknowledgments

The authors would like to thank the three anonymous reviewers for their comments on the manuscript, and Kostantinos Merkouris for the interpretation of the photogrammetric data.

Conflicts of Interest

The authors declare no conflict of interest.

References

  1. Pausanias Description of Greece 2.29.6–2.32.4. Available online: https://pindar.chs.harvard.edu/read/urn:cts:greekLit:tlg0525.tlg001.the-center-for-hellenic-studies-translations-eng:2.29.6-2.32.4 (accessed on 5 August 2021).
  2. Welter, G. Aeginetica XIII-XXIV. Archäologischer Anz. 1938, 53, 480–540. [Google Scholar]
  3. Knoblauch, P. Die Hafenlagen der Stadt Ägina; Athens, 1973; Volume 27, Available online: https://www.oeaw.ac.at/resources/Record/990002942240504498 (accessed on 28 September 2021).
  4. Mourtzas, N.D.; Kolaiti, E. Historical coastal evolution of the ancient harbor of Aegina in relation to the Upper Holocene relative sea level changes in the Saronic Gulf, Greece. Palaeogeogr. Palaeoclimatol. Palaeoecol. 2013, 392, 411–425. [Google Scholar] [CrossRef]
  5. Kolaiti, E.; Mourtzas, N.D. Upper Holocene sea level changes in the West Saronic Gulf, Greece. Quat. Int. 2016, 401, 71–90. [Google Scholar] [CrossRef]
  6. Triantafillidis, I.; Koutsoumba, D. The Harbour Landscape of Aigina. In Proceedings of the 13th ISBSA Amsterdam Eelde: Ships And Maritime Landscapes, Amsterdam, The Netherlands, 8–12 October 2012; pp. 165–170. [Google Scholar]
  7. Gkionis, P.; Papatheodorou, G.; Geraga, M.; Fakiris, E.; Christodoulou, D.; Tranaka, K. A marine geoarchaeological investigation for the cultural anthesis and the sustainable growth of Methoni, Greece. J. Cult. Herit. 2020, 42, 158–170. [Google Scholar] [CrossRef]
  8. Ferentinos, G.; Fakiris, E.; Christodoulou, D.; Geraga, M.; Dimas, X.; Georgiou, N.; Kordella, S.; Papatheodorou, G.; Prevenios, M.; Sotiropoulos, M. Optimal sidescan sonar and subbottom profiler surveying of ancient wrecks: The ‘Fiskardo’ wreck, Kefallinia Island, Ionian Sea. J. Archaeol. Sci. 2020, 113, 105032. [Google Scholar] [CrossRef]
  9. Geraga, M.; Papatheodorou, G.; Ferentinos, G.; Fakiris, E.; Christodoulou, D.; Georgiou, N.; Dimas, X.; Iatrou, M.; Kordella, S.; Sotiropoulos, G.; et al. The study of an ancient shipwreck using marine remote sensing techniques, in Kefalonia Island (Ionian Sea), Greece. Archaeol. Maritima Mediterr. 2015, 12, 183–200. [Google Scholar]
  10. Geraga, M.; Christodoulou, D.; Eleftherakis, D.; Papatheodorou, G.; Fakiris, E.; Dimas, X.; Georgiou, N.; Kordella, S.; Prevenios, M.; Iatrou, M.; et al. Atlas of Shipwrecks in Inner Ionian Sea (Greece): A Remote Sensing Approach. Heritage 2020, 3, 1210–1236. [Google Scholar] [CrossRef]
  11. Papatheodorou, G.; Geraga, M.; Christodoulou, D.; Fakiris, E.; Iatrou, M.; Georgiou, N.; Dimas, X.; Ferentinos, G. The Battle of Lepanto Search and Survey Mission (1971–1972) by Throckmorton, Edgerton and Yalouris: Following Their Traces Half a Century Later Using Marine Geophysics. Remote Sens. 2021, 13, 3292. [Google Scholar] [CrossRef]
  12. Geraga, M.; Papatheodorou, G.; Agouridis, C.; Kaberi, H.; Iatrou, M.; Christodoulou, D.; Fakiris, E.; Prevenios, M.; Kordella, S.; Ferentinos, G. Palaeoenvironmental implications of a marine geoarchaeological survey conducted in the SW Argosaronic gulf, Greece. J. Archaeol. Sci. Reports 2017, 12, 805–818. [Google Scholar] [CrossRef] [Green Version]
  13. Westley, K.; Plets, R.; Quinn, R. Holocene Paleo-Geographic Reconstructions of the Ramore Head Area, Northern Ireland, Using Geophysical and Geotechnical Data: Paleo-Landscape Mapping and Archaeological Implications. Geoarchaeology 2014, 29, 411–430. [Google Scholar] [CrossRef] [Green Version]
  14. Ferentinos, G.; Georgiou, N.; Christodoulou, D.; Geraga, M.; Papatheodorou, G. Propagation and termination of a strike slip fault in an extensional domain: The westward growth of the North Anatolian Fault into the Aegean Sea. Tectonophysics 2018, 745, 183–195. [Google Scholar] [CrossRef]
  15. Kordella, S.; Christodoulou, D.; Fakiris, E.; Geraga, M.; Kokkalas, S.; Marinaro, G.; Iatrou, M.; Ferentinos, G.; Papatheodorou, G. Gas seepage-induced features in the hypoxic/anoxic, shallow, marine environment of amfilochia bay, amvrakikos gulf (Western Greece). Geosciences 2021, 11, 27. [Google Scholar] [CrossRef]
  16. Papatheodorou, G.; Geraga, M.; Georgiou, N.; Christodoulou, D.; Dimas, X.; Fakiris, E.; Ferentinos, G. The palaeogeography of the strait of Salamis: Marine geoarchaeological survey in the strait of Salamis and the Ampelakia Bay. In Salamis 480 B.C; Hellenic Maritime Museum: Piraeus, Athens, 2020; pp. 392–411. ISBN 13 9786188218178. [Google Scholar]
  17. Papatheodorou, G.; Geraga, M.; Christodoulou, D.; Iatrou, M.; Fakiris, E.; Heath, S.; Baika, K. A marine geoarchaeological survey, cape Sounion, Greece: Preliminary results. Mediterr. Archaeol. Archaeom. 2014, 14, 357–371. [Google Scholar] [CrossRef]
  18. Plets, R.; Quinn, R.; Forsythe, W.; Westley, K.; Bell, T.; Benetti, S.; McGrath, F.; Robinson, R. Using Multibeam Echo-Sounder Data to Identify Shipwreck Sites: Archaeological assessment of the Joint Irish Bathymetric Survey data. Int. J. Naut. Archaeol. 2011, 40, 87–98. [Google Scholar] [CrossRef]
  19. Bates, C.R. A Review Archeological Geophysical Remote Surveying for the Seafloor. 2010. Available online: https://www.researchgate.net/publication/254562799_A_Review_Archaeological_Geophysical_Remote_Surveying_for_the_Seafloor (accessed on 10 May 2021).
  20. Bates, C.R.; Lawrence, M.; Dean, M.; Robertson, P. Geophysical Methods for Wreck-Site Monitoring: (RASSE) programme. Int. J. Naut. Archaeol. 2011, 40, 404–416. [Google Scholar] [CrossRef]
  21. Georgiou, N.; Fakiris, E.; Koutsikopoulos, C.; Papatheodorou, G.; Christodoulou, D.; Dimas, X.; Geraga, M.; Kapellonis, Z.G.; Vaziourakis, K.-M.; Noti, A.; et al. Spatio-Seasonal Hypoxia/Anoxia Dynamics and Sill Circulation Patterns Linked to Natural Ventilation Drivers, in a Mediterranean Landlocked Embayment: Amvrakikos Gulf, Greece. Geosciences 2021, 11, 241. [Google Scholar] [CrossRef]
  22. Wright, A.E.; Conlin, D.L.; Shope, S.M. Assessing the accuracy of underwater photogrammetry for archaeology: A comparison of structure from motion photogrammetry and real time kinematic survey at the east key construction wreck. J. Mar. Sci. Eng. 2020, 8, 849. [Google Scholar] [CrossRef]
  23. Balletti, C.; Beltrame, C.; Costa, E.; Guerra, F.; Vernier, P. 3D reconstruction of marble shipwreck cargoes based on underwater multi-image photogrammetry. Digit. Appl. Archaeol. Cult. Herit. 2016, 3, 1–8. [Google Scholar] [CrossRef]
  24. Liarokapis, F.; Kouřil, P.; Agrafiotis, P.; Demesticha, S.; Chmelík, J.; Skarlatos, D. 3D modelling and mapping for virtual exploration of underwater archaeology assets. Int. Arch. Photogramm. Remote Sens. Spat. Inf. Sci.-ISPRS Arch. 2017, 42, 425–431. [Google Scholar] [CrossRef] [Green Version]
  25. Aragón, E.; Munar, S.; Rodríguez, J.; Yamafune, K. Underwater photogrammetric monitoring techniques for mid-depth shipwrecks. J. Cult. Herit. 2018, 34, 255–260. [Google Scholar] [CrossRef]
  26. Schwartz, M.; Tziavos, C. Sedimentary provinces of the Saronic Gulf system. Nature 1975, 257, 573–575. [Google Scholar] [CrossRef]
  27. Kontoyiannis, H. Observations on the circulation of the Saronikos Gulf: A Mediterranean embayment sea border of Athens, Greece. J. Geophys. Res. Ocean. 2010, 115, 1–23. [Google Scholar] [CrossRef] [Green Version]
  28. Andritsanos, V.D.; Arabelos, D.; Spatalas, S.D.; Tziavos, I.N. Mean Sea Level studies in the Aegean Sea. Phys. Chem. Earth Part A Solid Earth Geod. 2000, 25, 53–56. [Google Scholar] [CrossRef]
  29. Papazachos, C.B.; Kiratzi, A.A. A detailed study of the active crustal deformation in the Aegean and surrounding area. Tectonophysics 1996, 253, 129–153. [Google Scholar] [CrossRef]
  30. Pe-Piper, G.; Piper, D.J.W. The South Aegean active volcanic arc: Relationships between magmatism and tectonics. In The South Aegean Active Volcanic Arc; Elsevier: Amsterdam, The Netherlands, 2005; Volume 7, pp. 113–133. [Google Scholar] [CrossRef]
  31. Papazachos, B.C.; Karakostas, V.G.; Papazachos, C.B.; Scordilis, E.M. The geometry of the Wadati-Benioff zone and lithospheric kinematics in the Hellenic arc. Tectonophysics 2000, 319, 275–300. [Google Scholar] [CrossRef]
  32. Foutrakis, P.M.; Anastasakis, G.; Piper, D.J.W. Chronology of Quaternary shoreline progradational sequences related to eustatic sea-level changes: Sedimentation and subsidence in Saronikos Gulf, Greece. Mar. Geol. 2020, 428, 106278. [Google Scholar] [CrossRef]
  33. Dietrich, V.; Gaitanakis, P.; Mercolli, I.; Oberhaensli, R. Geological map of Greece, Aegina Island, 1: 25000. Bull. Geol. Soc. Greece 1993, 28, 555–566. [Google Scholar]
  34. Morris, A. Magnetic fabric and palaeomagnetic analyses of the Plio-Quaternary calc-alkaline series of Aegina Island, South Aegean volcanic arc, Greece. Earth Planet. Sci. Lett. 2000, 176, 91–105. [Google Scholar] [CrossRef]
  35. Georgiou, N.; Dimas, X.; Papatheodorou, G. Integrated Methodological Approach for the Documentation of Marine Priority Habitats and Submerged Antiquities: Examples from the Saronic Gulf, Greece. Sustainability in press. 2021. [Google Scholar]
  36. Canny, J. A Computational Approach to Edge Detection. IEEE Trans. Pattern Anal. Mach. Intell. 1986, PAMI-8, 679–698. [Google Scholar] [CrossRef]
  37. Fakiris, E.; Papatheodorou, G. Quantification of regions of interest in swath sonar backscatter images using grey-level and shape geometry descriptors: The TargAn software. Mar. Geophys. Res. 2012, 33, 169–183. [Google Scholar] [CrossRef]
  38. Ullman, S. The Interpretation of Structure from Motion. Proc. R. Soc. London. Ser. B Biol. Sci. 1979, 203, 405–426. [Google Scholar]
  39. Casella, E.; Rovere, A.; Pedroncini, A.; Stark, C.P.; Casella, M.; Ferrari, M.; Firpo, M. Drones as tools for monitoring beach topography changes in the Ligurian Sea (NW Mediterranean). Geo-Mar. Lett. 2016, 36, 151–163. [Google Scholar] [CrossRef]
  40. Drap, P.; Papini, O.; Merad, D.; Pasquet, J.; Royer, J.P.; Motasem Nawaf, M.; Saccone, M.; Ben Ellefi, M.; Chemisky, B.; Seinturier, J.; et al. Deepwater Archaeological Survey: An Interdisciplinary and Complex Process. Coast. Res. Libr. 2019, 31, 135–153. [Google Scholar] [CrossRef] [Green Version]
  41. Mattei, G.; Rizzo, A.; Anfuso, G.; Aucelli, P.P.C.; Gracia, F.J. A tool for evaluating the archaeological heritage vulnerability to coastal processes: The case study of Naples Gulf (southern Italy). Ocean Coast. Manag. 2019, 179, 104876. [Google Scholar] [CrossRef]
  42. Aucelli, P.P.C.; Mattei, G.; Caporizzo, C.; Cinque, A.; Troisi, S.; Peluso, F.; Stefanile, M.; Pappone, G. Ancient coastal changes due to ground movements and human interventions in the roman portus julius (Pozzuoli Gulf, Italy): Results from photogrammetric and direct surveys. Water 2020, 12, 658. [Google Scholar] [CrossRef] [Green Version]
  43. Walbridge, S.; Slocum, N.; Pobuda, M.; Wright, D.J. Unified Geomorphological Analysis Workflows with Benthic Terrain Modeler. Geosciences 2018, 8, 94. [Google Scholar] [CrossRef] [Green Version]
  44. Fakiris, E.; Zoura, D.; Ramfos, A.; Spinos, E.; Georgiou, N.; Ferentinos, G.; Papatheodorou, G. Object-based classification of sub-bottom profiling data for benthic habitat mapping. Comparison with sidescan and RoxAnn in a Greek shallow-water habitat. Estuar. Coast. Shelf Sci. 2018, 208, 219–234. [Google Scholar] [CrossRef]
  45. Fakiris, E.; Blondel, P.; Papatheodorou, G.; Christodoulou, D.; Dimas, X.; Georgiou, N.; Kordella, S.; Dimitriadis, C.; Rzhanov, Y.; Geraga, M.; et al. Multi-frequency, multi-sonar mapping of shallow habitats-efficacy and management implications in the National Marine Park of Zakynthos, Greece. Remote Sens. 2019, 11, 461. [Google Scholar] [CrossRef] [Green Version]
  46. Liu, B.; Liu, Z.; Men, S.; Li, Y.; Ding, Z.; He, J.; Zhao, Z. Underwater Hyperspectral Imaging Technology and Its Applications for Detecting and Mapping the Seafloor: A Review. Sensors 2020, 20, 4962. [Google Scholar] [CrossRef]
  47. Rovere, A.; Stocchi, P.; Vacchi, M. Eustatic and Relative Sea Level Changes. Curr. Clim. Chang. Rep. 2016, 2, 221–231. [Google Scholar] [CrossRef] [Green Version]
  48. Benjamin, J.; Rovere, A.; Fontana, A.; Furlani, S.; Vacchi, M.; Inglis, R.H.; Galili, E.; Antonioli, F.; Sivan, D.; Miko, S.; et al. Late Quaternary sea-level changes and early human societies in the central and eastern Mediterranean Basin: An interdisciplinary review. Quat. Int. 2017, 449, 29–57. [Google Scholar] [CrossRef] [Green Version]
  49. Vona, I.; Gray, M.W.; Nardin, W. The impact of submerged breakwaters on sediment distribution along marsh boundaries. Water 2020, 12, 1016. [Google Scholar] [CrossRef] [Green Version]
  50. Na’Im, I.I.; Shahrizal, A.R.M.; Safari, M.D. A Short Review of Submerged Breakwaters. MATEC Web Conf. 2018, 203, 1–17. [Google Scholar] [CrossRef]
  51. Hanson, S.; Nicholls, R.; Zanuttigh, B. Case Studies Worldwide: Introduction; Butterworth-Heinemann: Oxford, UK, 2014; ISBN 9780123973313. [Google Scholar] [CrossRef]
  52. Sabdono, P.; Parmantoro, P.N. Design of Submerged Breakwater. Media Komun. Tek. Sipil 2014, 12, 1–11. [Google Scholar] [CrossRef]
  53. Kubowicz-Grajewska, A. Morpholithodynamical changes of the beach and the nearshore zone under the impact of submerged breakwaters—A case study (Orłowo Cliff, the Southern Baltic). Oceanologia 2015, 57, 144–158. [Google Scholar] [CrossRef] [Green Version]
  54. Papatheodorou, G.; Geraga, M.; Chalari, A.; Christodoulou, D.; Iatrou, M.; Ferentinos, G. Hellenistic Alexandria: A palaeogeographic reconstruction based on marine geophysical data. In Alexandria under the Mediterranean; Centre d’etudes Alexandrines: Alexandria, Egypt, 2015. [Google Scholar]
  55. Vött, A. Silting up Oiniadai’s harbours (Acheloos River delta, NW Greece). Geoarchaeological implications of late Holocene landscape changes. Géomorphologie Reli. Process. Environ. 2009, 13. [Google Scholar] [CrossRef] [Green Version]
  56. Morhange, C.; Pirazzoli, P.A.; Evelpidou, N.; Marriner, N. Late holocene tectonic uplift and the silting up of lechaion, the western harbor of ancient Corinth, Greece. Geoarchaeology 2012, 27, 278–283. [Google Scholar] [CrossRef]
  57. Graauw, A.D. Ancient port structures: An engineer’s perspective. In Proceedings of the PortusLimen Conference, Rome, Italy, 29–30 January 2019. [Google Scholar]
  58. Morhange, C.; Marriner, N. The Ecohistory of Ancient Harbours. 2013. Available online: https://www.ancientportsantiques.com/wp-content/uploads/Documents/AUTHORS/Morhange-PublGenerales/Morhange2016-HistoryPorts.pdf (accessed on 23 August 2021).
  59. Baika, K. Archaeological indicators of relative sea-level changes in the Attico-Cycladic massif since Classical antiquity: Preliminary results. Bull. Geol. Soc. Greece 2008, 42, 33–48. [Google Scholar]
  60. Poulos, S.E.; Ghionis, G.; Maroukian, H. Sea-level rise trends in the Attico-Cycladic region (Aegean Sea) during the last 5000 years. Geomorphology 2009, 107, 10–17. [Google Scholar] [CrossRef]
  61. Baika, K. The fortification of shipsheds and naval arsenals. In Shipsheds in the Ancient Mediterranean; Blackman, D., Rankov, B., Baika, K., Gerding, H., Pakkanen, J., Eds.; Cambridge University Press: Cambridge, UK, 2013; pp. 210–230. [Google Scholar]
  62. Baika, K. Ancient harbour cities—New methodological perspectives and recent research in Greece. In Byzas 19—Harbors and Harbor Cities in the Eastern Mediterranean from Antiquity to the Byzantine Period: Recent Discoveries and Current Approaches in Proceedings of the Int. Symposium (DAI), BYZAS 19; Ladstatter; Öster-reichisches Archäologisches Institut Sonder: Vienna, Austria, 2015; Volume 2, pp. 445–491. [Google Scholar]
  63. Khakzad, S.; Pieters, M.; Van Balen, K. Coastal cultural heritage: A resource to be included in integrated coastal zone management. Ocean Coast. Manag. 2015, 118, 110–128. [Google Scholar] [CrossRef]
Figure 1. (A) Greek volcanic centers and arc, (B) Average wind speed of Aegina island (National Observatory Athens-Aegina weather station), (C) Ancient coastal sites and volcanic centers in the Saronic Gulf, main faults and survey area, (D) Bathymetric map of the survey area (Aegina city coastal zone), the three main areas analyzed in the results section (i, ii, iii- Section 4.1.1, Section 4.1.2, Section 4.1.3), the main faults detected at the southern part of the area based on the (E) seismic profile where three normal faults are detected supporting the subsidence referred in literature.
Remotesensing 13 04462 g001
Figure 2. Bathymetric map focused on the submerged archaeological site, bounded by the south and north breakwaters.
Remotesensing 13 04462 g002
Figure 3. Geophysical data from the northern area (i) as delimited in Figure 1. (A) bathymetric map, (B) slope map, (C) backscatter intensity map, (D) sediment thickness map, (E) seismic profile (location of the seismic profile is shown in Figure 3C).
Remotesensing 13 04462 g003
Figure 4. Geophysical data from the central area (ii) as delimited in Figure 1. (A) bathymetric map, (B) slope map, (C) backscatter intensity map, (D) sediment thickness map, (E) seismic profile (location is shown in Figure 4C).
Remotesensing 13 04462 g004
Figure 5. Geophysical data from the southern area (iii) as delimited in Figure 1. (A) bathymetric map, (B) slope map, (C) backscatter intensity map, (D) sediment thickness map, (E) seismic profile (location is shown in Figure 5C).
Remotesensing 13 04462 g005
Figure 6. The TargAn software was used for the segmentation of the bathymetric slope imagery to detect any morphological anomalies in the scene (i.e., conical rubble structures, breakwaters, other artificial structures) and proceed to geostatistical parameterization.
Remotesensing 13 04462 g006
Figure 7. Map showing the extent of the submerged structures (system of conical rubble structures) detected by the geophysical survey and classification, the possible passages to the protected maritime area and their width, the paleocoasts for depths of −3.8, −2.5, −1.7 m (purple, red, green). Letters ad represent the location of the ground-truthing survey shown in Figure 8.
Remotesensing 13 04462 g007
Figure 8. Ground-truthing photos of the submerged structures (their location is shown in Figure 7). (a) base of the conical rubble structure, (b) remains from the structures, (c) 2 of the stone piles constituting the linear structure at the south in line with the south breakwater, (ci) spatial distribution of the stone piles forming a linear feature, (d) southern breakwater.
Remotesensing 13 04462 g008
Figure 9. 3D sketch showing the two different construction morphologies (single, multiple) and the geometric characteristics of an average-sized conical rubble structure (st: sediment thickness, bd: acoustic bedrock, A: bottom cone area, R: base radius, r: upper radius (at seafloor level), h: structure height-including the submerged part, a: crest depth).
Remotesensing 13 04462 g009
Figure 10. (A) Orthophoto of a small part at the base of a single conical rubble structure (location of Figure 10C shown with white polygon), (B) top view of the same 3D model, (C) zoomed image of the 3D model where a square meter is marked with pink color, (D) stones included in this square meter.
Remotesensing 13 04462 g010
Figure 11. (a) Plot of the depth range (x-axis) versus the standard deviation values (y-axis) of the detected submerged showing their preservation status (circle radius corresponds to the length of the major axis of each detected element), and (b) a map showing their spatial extent, preservation status and the location of the modern harbour.
Remotesensing 13 04462 g011
Publisher’s Note: MDPI stays neutral with regard to jurisdictional claims in published maps and institutional affiliations.

