
Earthquake Magnitude Estimation from High-Rate GNSS Data: A Case Study of the 2021 Mw 7.3 Maduo Earthquake


1
Key Laboratory of Earthquake Dynamics, Institute of Geology, China Earthquake Administration, Beijing 100029, China
2
Key Laboratory of Urban Informatics and Guangdong Laboratory of Artificial Intelligence and Digital Economy (SZ), School of Architecture & Urban Planning, Shenzhen University, Shenzhen 518052, China
*
Author to whom correspondence should be addressed.
Remote Sens. 2021, 13(21), 4478; https://0-doi-org.brum.beds.ac.uk/10.3390/rs13214478
Submission received: 8 October 2021
/
Revised: 31 October 2021
/
Accepted: 3 November 2021
/
Published: 8 November 2021
Abstract
:Peak ground displacement (PGD) and peak ground velocity (PGV) are critical parameters during earthquake early warning, as they can provide rapid magnitude estimation before rupture end. In this study, we used the high-rate Global Navigation Satellite System (GNSS) data from 55 continuous stations to estimate the magnitude of the 2021 Maduo earthquake in western China. We used the relative positioning method and variometric approach to acquire real-time GNSS displacement and velocity waveforms, respectively. The results showed the amplitude of displacement and velocity waveforms gradually decreased with increasing hypocentral distance. Our results showed that the fluctuation of PGD magnitudes over time is smaller than that of PGV magnitudes. Nonetheless, the earthquake magnitudes estimated from both methods were consistent with their counterparts (Mw 7.3) reported by the United States Geological Survey (USGS). The final magnitude estimated from the PGD and PGV methods were Mw 7.25 and Mw 7.31, respectively. In addition, our results highlighted how the number of high-rate GNSS stations could influence the stability and convergence time of magnitude estimation.
1. Introduction
According to the China Earthquake Network Center, at 18:04:13 (UTC) on 21 May 2021, an Mw 7.3 earthquake occurred in Maduo County, Qinghai Province, China. The epicenter was located at (98.34°E, 34.59°N) and had a focal depth of 17 km (Figure 1). Field investigations immediately after the event [1,2], and Interferometric Synthetic Aperture Radar (InSAR) observation obtained within a few days after the main shock [3,4,5] confirmed that the seismogenic fault of the Maduo earthquake was the Kunlunshankou–Jiangcuo Fault, a secondary fault ~70–80 km to the south of the East Kunlun Fault within the Bayan Har block. This unexpected earthquake was the largest earthquake to have occurred in China since the 2008 Mw 7.9 Wenchuan earthquake [6,7,8], challenging the conventional perspective that the Bayan Har block acts as a quasi-stable block.
Over the past 20 years, high-rate (≥1 Hz) Global Navigation Satellite System (GNSS) stations have been set up across mainland China to study crustal deformation. During the Maduo earthquake, the densely distributed high-rate GNSS stations (Figure 1) around the epicenter recorded ground displacement and velocity waveforms, providing valuable data to investigate the source process of the earthquake. Moreover, these data can help in testing algorithms, such as the rapid estimation of magnitude, in the geodetic-based earthquake early warning (EEW) system that is under development [9].
Real-time processing of GNSS data is challenging but vital for EEW. Currently, there are three categories of methods for real-time GNSS kinematic positioning: Precise Point Positioning (PPP) [10], relative positioning [11] and the variometric approach [12]. PPP relies on precise orbit and clock products, and requires a relatively long convergence or re-convergence time (20–30 min) due to complicated error corrections and parameter estimation [13,14]. Relative positioning has an accuracy of sub-centimeters, but it needs at least one stable reference station to acquire displacements and thereby might be affected by the reference station [15,16]. Nonetheless, it has been widely used to extract real-time coseismic displacements. The variometric approach uses broadcast ephemeris to obtain GNSS velocities with an accuracy of mm/s in real time [12]. This method does not need reference stations and could shorten the convergence time when compared with PPP. Site velocities could be easily integrated to displacements with an accuracy of cm, but drifts may occur during the process, resulting in error accumulation [17,18].
Magnitude is a key parameter in EEW. In estimating earthquake magnitude, traditional seismic data, such as ground acceleration recorded by strong-motion accelerometers and ground velocity recorded by broadband seismometers, may suffer from some limitations. For instance, broadband seismometers are prone to clip and go off-scale when recording in the near-field of large earthquakes (Mw > 7.0) [19]. This leads to magnitude saturation, a well-documented condition in large earthquakes whereby an EEW system underestimates the true event magnitude. Although acceleration records have the advantage of amplitude unsaturation in the near-field of large earthquakes, one needs to integrate acceleration to displacement or velocity to calculate the magnitude. Due to factors such as instrument tilt and rotation, the integration would suffer from baseline drift during this process [20]. GNSS is capable of measuring long periods down to the static offset (0 Hz) and could, therefore, ameliorate some of the above limitations in determining earthquake magnitude. In the time domain, although seismometric methods only take a few seconds (0.5–4 s) for the P wave to estimate the magnitude of an event, their predictions typically saturate for ~M 7+ earthquakes [21]. GNSS could account for static surface displacement accumulated with the arrival of the S wave, enabling the estimation of finite-fault slip and the event’s moment magnitude [22].
To investigate the applicability of GNSS in magnitude estimation of large earthquakes in the Tibetan Plateau, in this study, we focused on the recent Maduo earthquake. When using GNSS to calculate earthquake magnitude, peak ground displacement (PGD) is often used. The regression model between PGD and earthquake magnitude was first established using the seismogeodetic observations from five earthquakes (Mw 5.3–9.0) in Japan and California [23]. The regression model was tested and updated using more earthquake cases in recent years [24,25,26]. The past few years benefited from the accumulation of high-rate GNSS data in earthquake case studies, and a regression model between earthquake magnitude and peak ground velocity (PGV) of high-rate GNSS was established [16]. Using the data from 22 earthquakes with magnitudes ranging from Mw 6.0 to Mw 9.1, Fang et al. [16] found that the PGV magnitudes were comparable with PGD magnitudes.
In this study, we collected high-rate GNSS data from the 2021 Mw 7.3 Maduo earthquake. First, we used the relative positioning method to obtain the coseismic displacement waveforms and the variometric approach to obtain the velocity time series at high-rate GNSS stations. PGD and PGV magnitudes were then estimated for each station. Finally, we compared the differences between PGD and PGV magnitudes and discussed their implications in geodetic-based EEW.
2. Data and Methods
2.1. GNSS Data and Data Processing
High-rate GNSS stations within 550 km of the epicenter recorded the coseismic displacement and velocity waveforms of the 2021 Mw 7.3 Maduo earthquake. We collected the high-rate (1 Hz) GNSS data from 55 continuous stations (Figure 1), 14 of which were from the Crustal Movement Observation Network of China (CMONOC). The remaining were from the Qinghai Continuously Operating Reference Stations (QHCORS) network.
To acquire displacement waveform results at each high-rate GNSS station, we used the relative positioning method implemented as the TRACK module in the GAMIT/GLOBK software [27]. During processing, we used the International GNSS Service (IGS) final orbits products and absolute antenna phase center model. We selected the SCYY station, which is located in the Sichuan Province and is about 850 km away from the epicenter, as the reference station. To avoid masked coseismic signals, we did not perform the post-processing of spatial filtering of displacement waveforms. To confirm that our processing results were not affected by the reference station, we used the PPP method [28] to process the high-rate data of the reference station, and the result (Figure S1) showed that the reference station was not affected by coseismic deformation.
To obtain site velocity time series results, we used the variometric approach implemented as the SNIVEL software package [18] to process the high-rate GNSS data. This approach uses real-time broadcast ephemeris data to estimate the high-precision real-time velocities at GNSS stations [12,18]; it uses dual-frequency data to form a linear combination of L1 and L2 narrow lanes [18]. The above practice reduces noise level and corrects ionospheric error and tropospheric delay. No external data, such as IGS products, were needed during data processing.
2.2. PGD and PGV Magnitudes
The three-component displacement time series was used to extract PGD value from each GNSS station, which is given as:
where Nd(t), Ed(t) and Ud(t) represent the displacement components of the north, east and up in meters, respectively.
The regression model between PGD and moment magnitude is given as [23,24,25,26]:
where Mw is the moment magnitude; R is the hypocentral distance in km; and A, B and C are the regression coefficients.
We used the regression coefficients (A = −5.919, B = 1.009 and C = −0.145) from Ruhl et al. [26], which were estimated from GNSS observational data taken during 29 moderate-to-large (Mw 6.0–9.0) earthquakes. At each high-rate GNSS station, we calculated the moment magnitude at each epoch until the moment magnitude reached convergence. We then averaged the moment magnitudes from all stations to obtain the final moment magnitude of the Maduo earthquake.
Using the three-component velocity time series, the PGV value at each GNSS station was calculated as:
where Nv(t), Ev(t) and Uv(t) show the velocity components of the north, east and up in m/s, respectively.
The regression model between PGV and moment magnitude is expressed as [16]:
where Mw is the moment magnitude; R is the hypocentral distance in km; and A, B and C are the regression coefficients.
We used the regression coefficients (A = −5.025, B = 0.741 and C = −0.111) from Fang et al. [16], which were extracted from modeling of GNSS observational data taken during 22 moderate-to-large (Mw 6.0–9.1) earthquakes. Similar to the PGD magnitude, the PGV magnitude was updated at every epoch until it reached convergence. The average magnitude at all GNSS stations was taken as the final moment magnitude of the Maduo earthquake.
3. Results
3.1. Displacement and Velocity Waveform Results
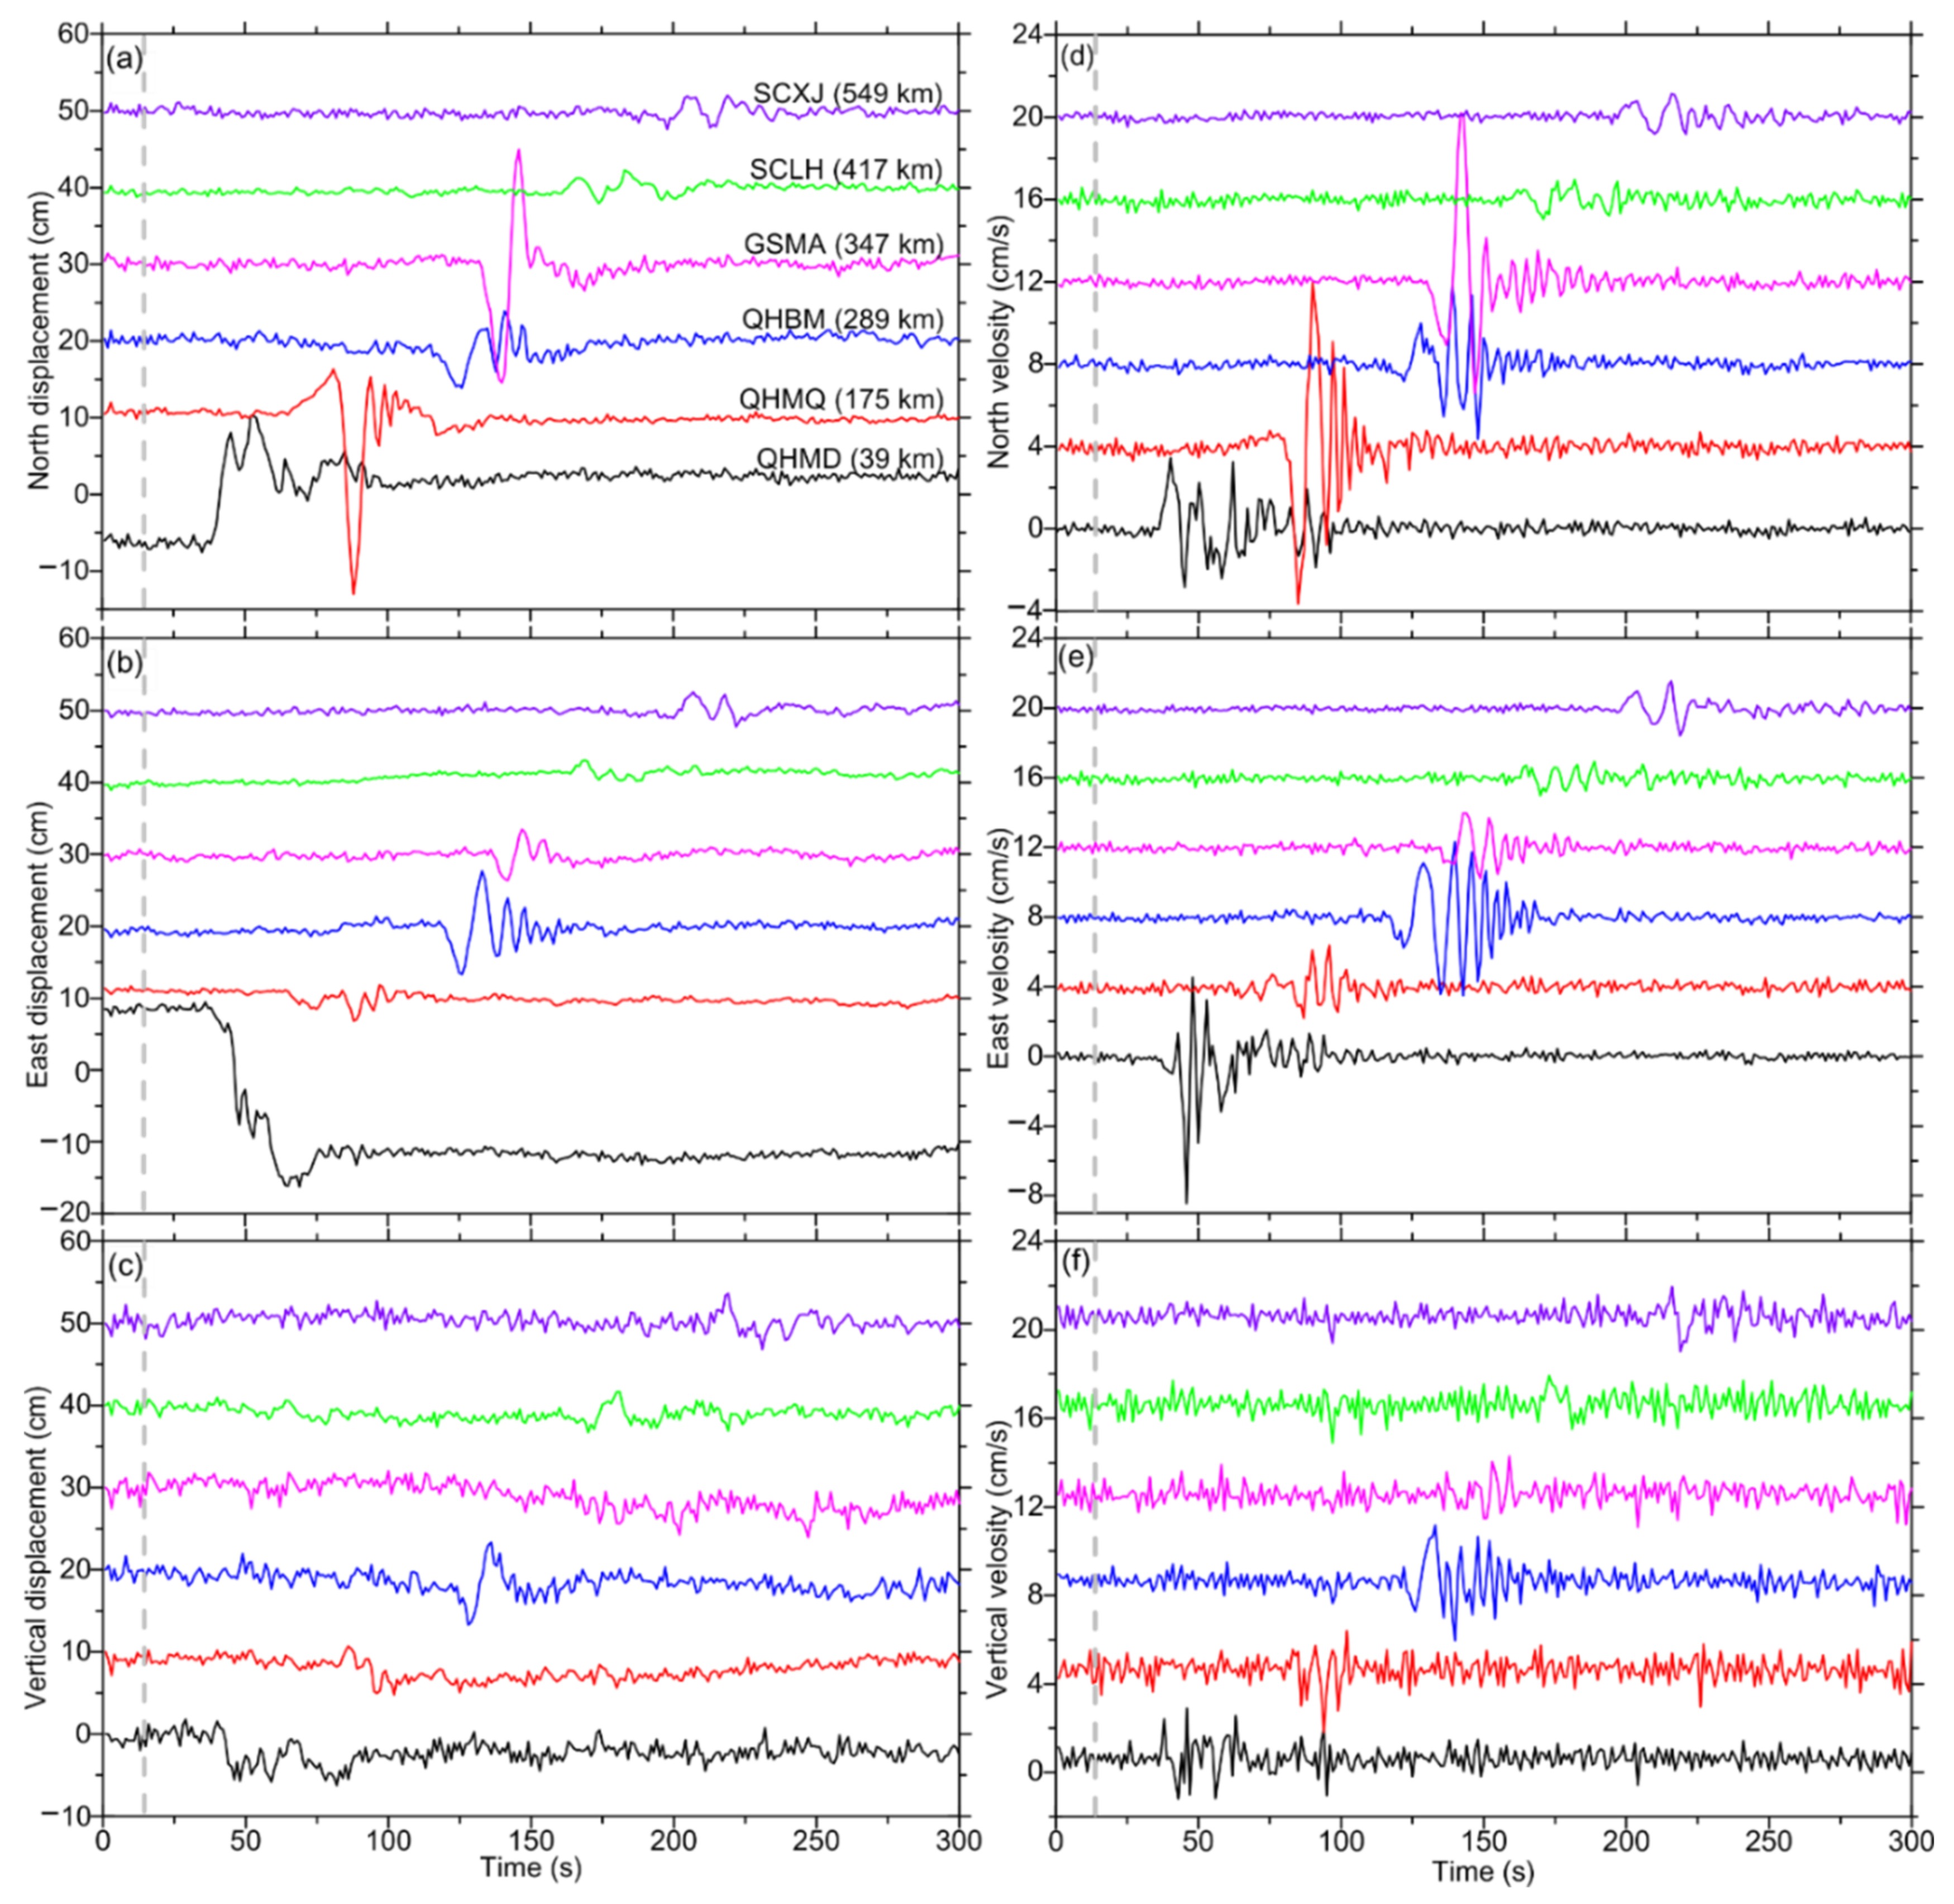
Figure 2a–c show examples of displacement waveforms at six high-rate GNSS stations, whose locations are shown in Figure 1. Figure S2 shows the displacement waveforms at all high-rate GNSS stations. We notice that vertical displacements were less sensitive to Maduo earthquake than horizontal displacements. This is to be expected, given the strike-slip focal mechanism in the 2021 Maduo earthquake. Therefore, we focus on horizontal displacements in the following section. The amplitude of displacement waveforms gradually decreases with increasing hypocentral distance. Moreover, as the hypocentral distance increases, permanent horizontal coseismic displacement decreases.
Figure 2d–f show the velocity waveform results at the six stations, the same as those shown in Figure 2a–c. Figure S3 shows the velocity waveforms at all high-rate GNSS stations. It is obvious that before the arrival of the S wave, velocity waveforms at all stations were nearly flat. After the earthquake, all stations experienced obvious velocity fluctuations. The amplitude of velocity waveforms at GNSS stations attenuates as the hypocentral distance increases. Similar to displacements, vertical velocities were less sensitive to seismic waveform than horizontal velocities. Nonetheless, quite a few GNSS stations observed significant vertical velocity fluctuations.
3.2. PGD/PGV Results and Magnitudes
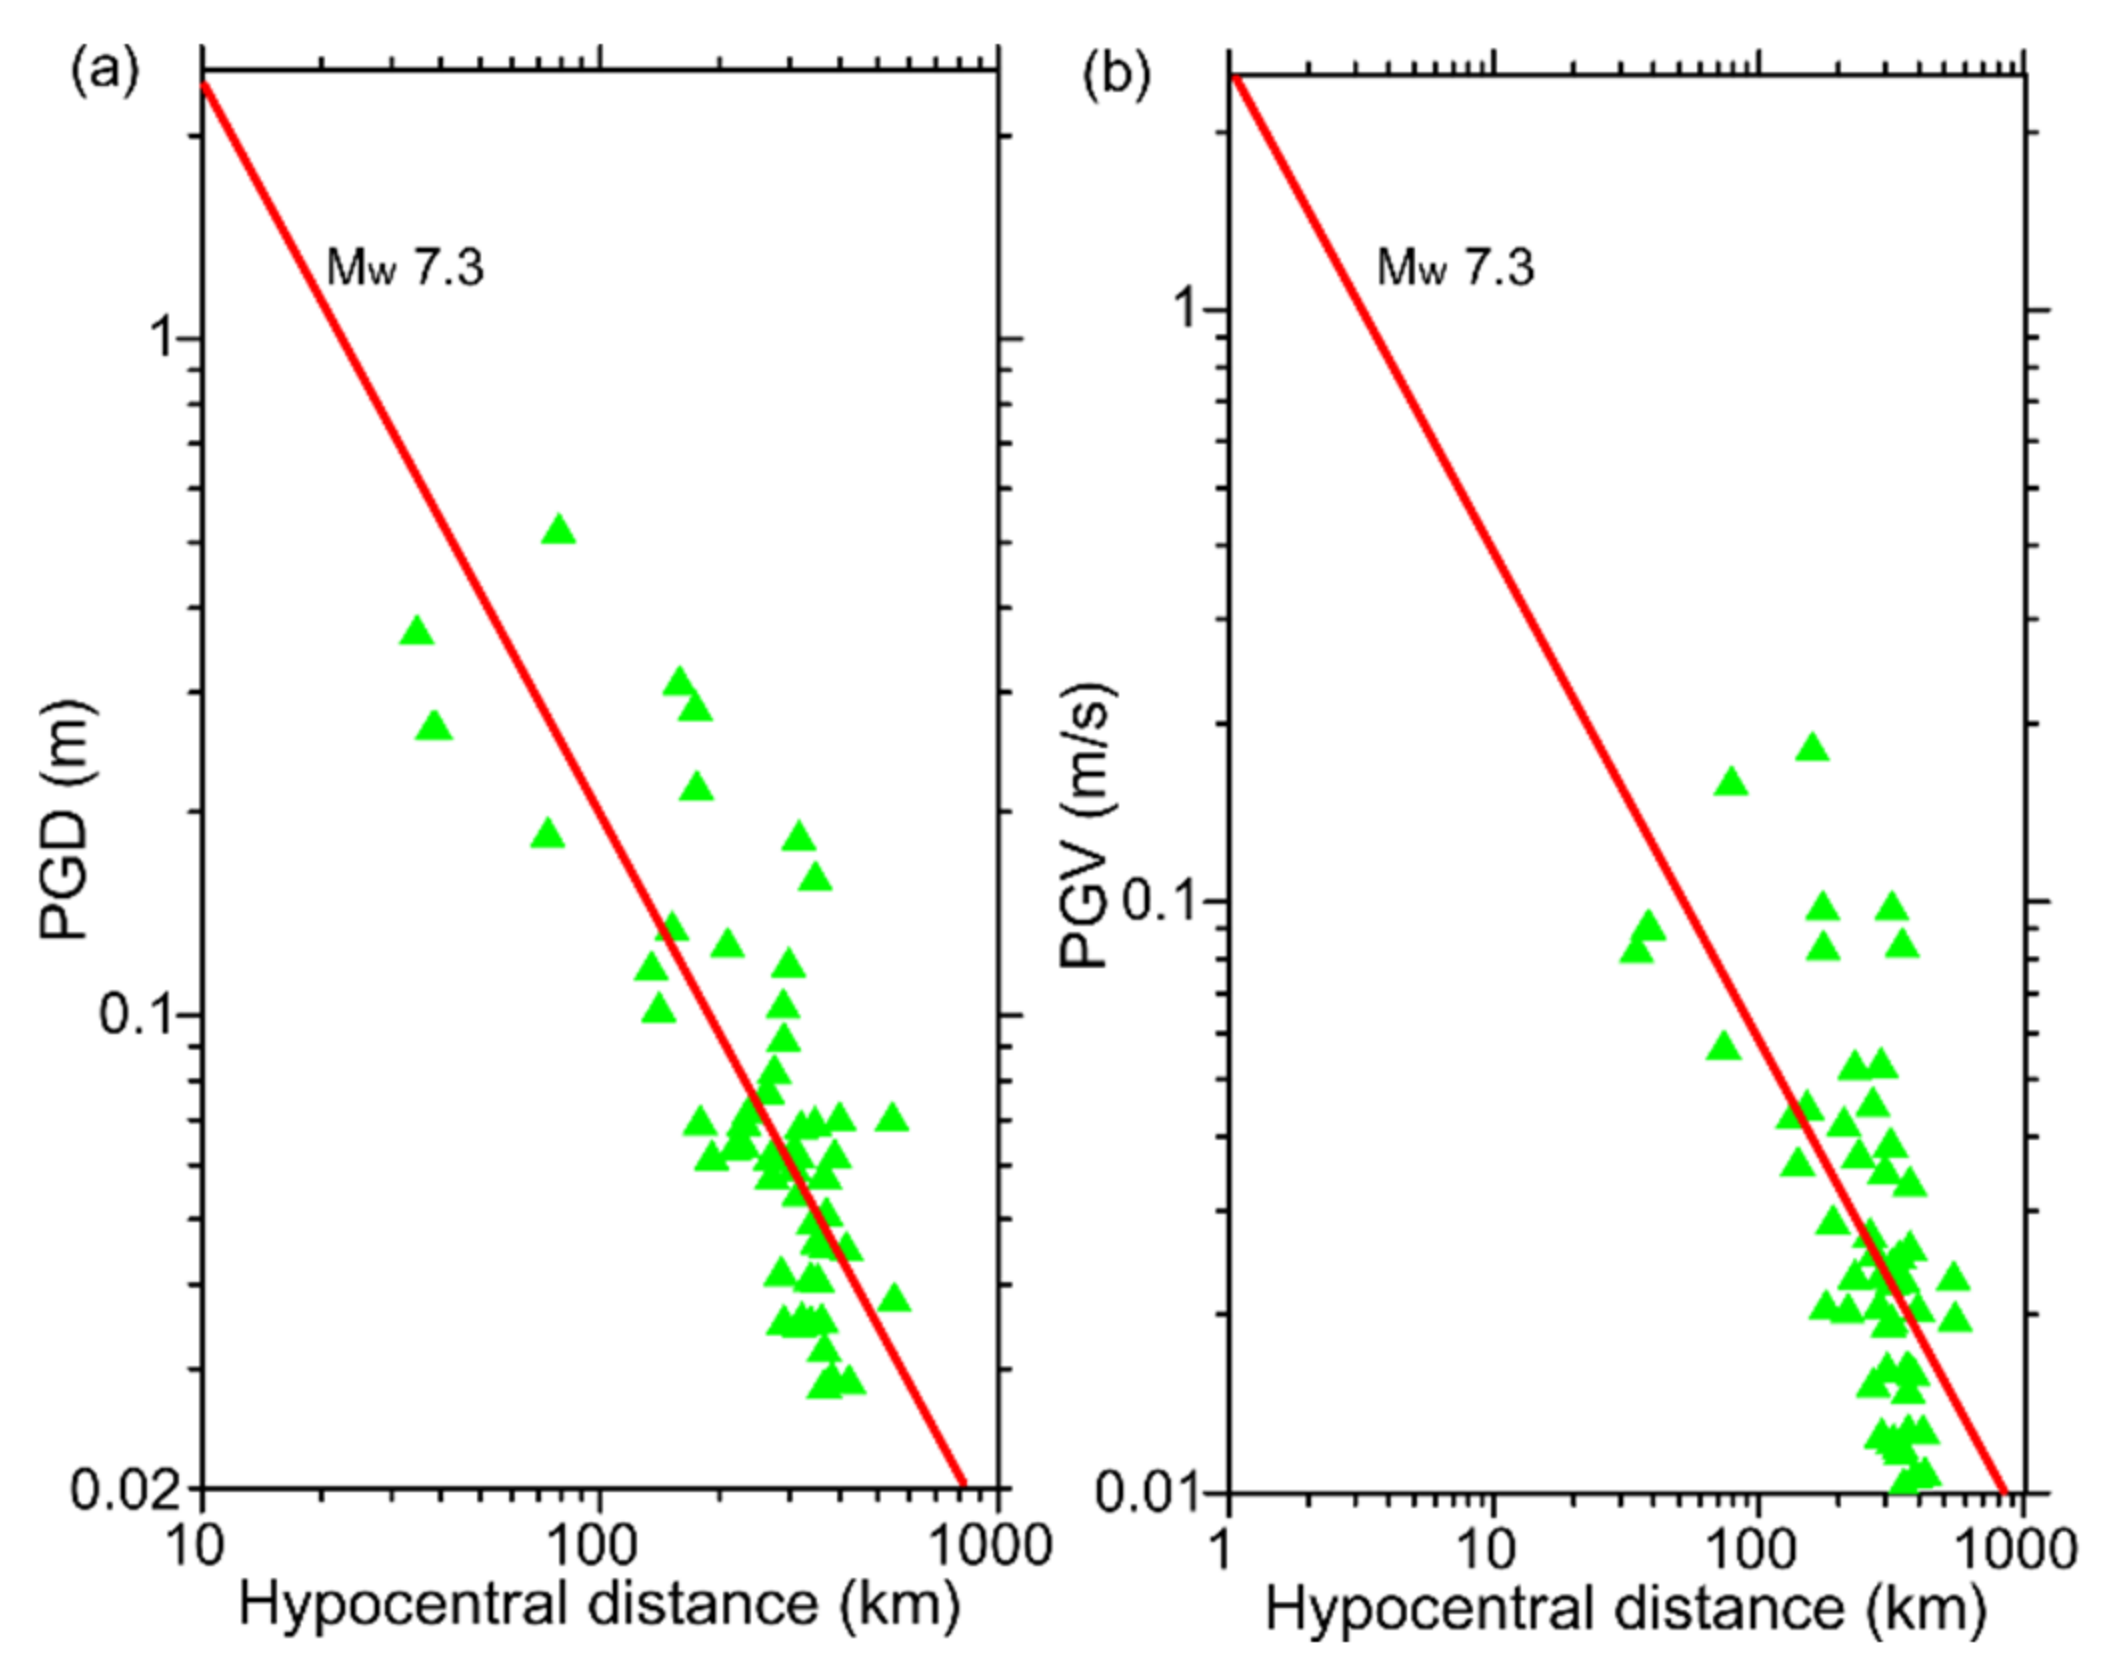
We extracted PGD and PGV values at each high-rate GNSS station from the displacement and velocity waveforms, respectively. Figure 3 shows PGD and PGV values as a function of hypocentral distance. It is obvious that PGD and PGV values decrease with hypocentral distance increasing. PGD and PGV values fluctuate near the line, showing the theoretical relationship between PGD/PGV and hypocentral distance in Mw 7.3 earthquakes.
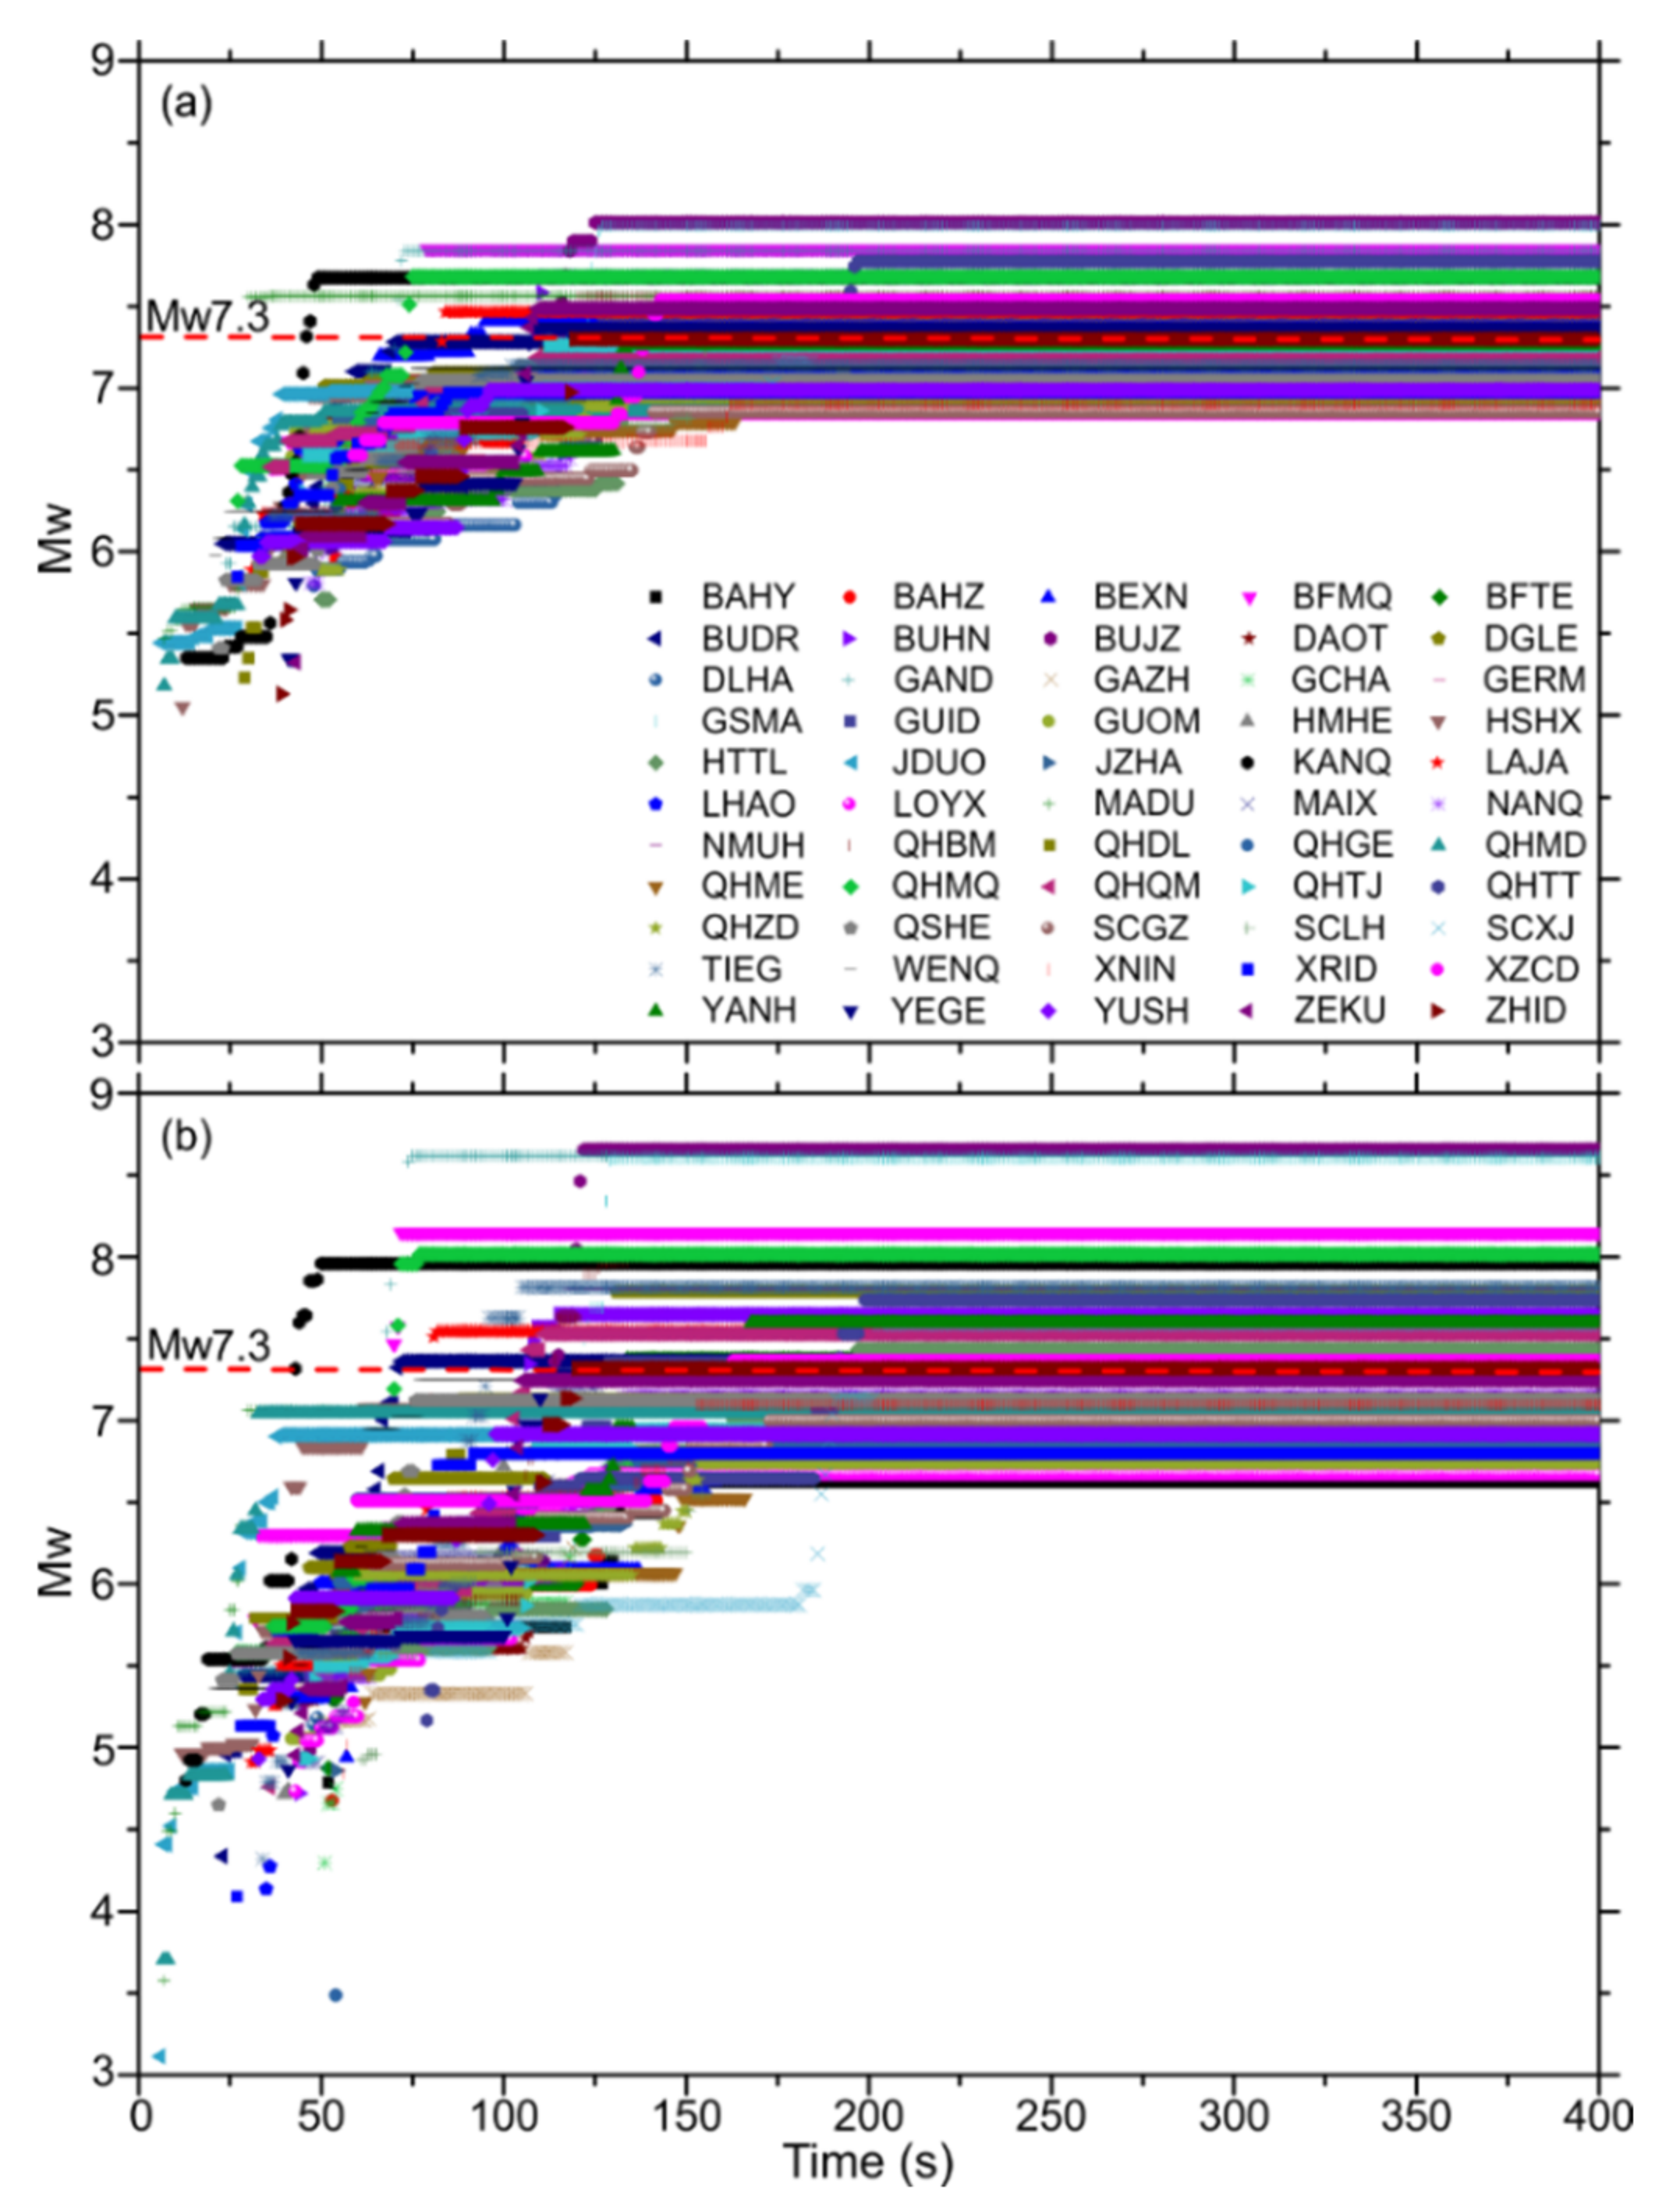
Figure 4 shows the PGD magnitude evolution. We obtained a maximum and minimum value of PGD magnitude of Mw 8.0 and Mw 6.8, respectively. These results indicate that, at different high-rate GNSS stations, PGD magnitude varies to a sizable extent, which might be related to site effects and/or radiation pattern. More reliable magnitude estimates can be obtained by averaging the results at multiple GNSS stations [29]. The final average magnitude was estimated at Mw 7.25, which is slightly smaller than the moment magnitude (Mw 7.3) reported by USGS, indicating that the PGD magnitude from GNSS is reasonable.
Slightly different from the PGD magnitudes, PGV magnitudes show larger deviation. The maximum PGV magnitude was estimated at Mw 8.7, whereas the minimum was Mw 6.6. The average magnitude after convergence was Mw 7.31, slightly larger than that from PGD estimation but consistent with the magnitude (Mw 7.3) reported by USGS.
The above results show that, in spite of different magnitude estimates at different GNSS stations, both PGD and PGV can provide plausible earthquake magnitude estimates that are consistent with the magnitude derived from the seismological method. We present more analysis in the following section regarding the time efficiency of PGD and PGV methods in estimating magnitude.
4. Discussion
PGD and PGV are critical parameters during EEW; they can provide rapid magnitude estimation before rupture end [30,31,32], thereby issuing reliable warning information to the public. During the Maduo earthquake, because the majority of high-rate GNSS stations were far from the epicenter and unevenly distributed, we discuss how the number of high-rate GNSS stations might influence the stability and convergence time of magnitude estimation. In addition, we provide outlooks for the application of PGD and PGV magnitude estimation methods.
Figure 5a shows the PGD and PGV magnitudes as function of the number of GNSS stations. The number of GNSS stations increases as the epicenter distance increases. Overall, PGD and PGV magnitudes fluctuate around Mw 7.3, with maximum deviations of Mw 0.21 and Mw 0.22, respectively. Compared with the PGV magnitudes, PGD magnitudes are more stable and fluctuate less. However, the final PGV magnitude (Mw 7.31) is closer to Mw 7.3 than the PGD magnitude (Mw 7.25). In particular, we notice that in the case of four stations, both PGD and PGV underestimated the magnitude. When the number of GNSS stations increases to about eight, the PGD method can obtain a stable magnitude, while the PGV method requires more stations (>15) to obtain a stable magnitude. In this sense, the PGD method seems to be more suitable for applications in areas where GNSS stations are sparse.
We chose to use the eight stations within 170 km of hypocentral distance to discuss the sensitivity of magnitude convergence time to the number of high-rate GNSS stations. Figure 5b,c show the convergence time of PGD and PGV magnitudes as a function of the number of GNSS stations. There are two main features. First, in the case of the same number of stations, the convergence time for PGD and PGV magnitudes was almost identical. For example, when the number of GNSS stations was four, the convergence times for PGD and PGV magnitudes were all at 50 s after the earthquake onset, but the first-alert magnitude by the PGD method (Mw 5.5) was significantly higher than that of the PGV method (Mw 3.1). Second, with the increases in the number of GNSS stations, the time for the magnitude to converge also increases. For instance, when the number of GNSS stations was eight, the convergence times for PGD and PGV magnitudes were at 73 s after the earthquake onset; this is to be expected, because different stations received S waves at different times.
In terms of time efficiency, we discuss the PGD magnitude shown in Figure 5b. Using four stations from the current GNSS array, we obtained the first alert 6 s after the earthquake onset; 50 s later, the magnitude reached convergence with estimate at Mw 7.1. When the number of GNSS stations was eight, the convergent magnitude (Mw 7.5) was at 73 s after the earthquake onset. The more stations there were, the more accurate the final estimated magnitude would be. We note that these convergence times are longer than the ~40 s of the source rupture. This is because almost all the GNSS stations were in the far-field of the Maduo earthquake. Nonetheless, the GNSS displacement time series data provide irreplaceable constraints for rapid finite-fault slip inversion.
EEW is currently being carried out on a global scale [9,21,33]. PGD and PGV from high-rate GNSS data provide a way to quickly estimate the earthquake magnitude [16,32], as shown during the Maduo earthquake in this study. Although this method does not require complex fault rupture models, there are some issues that need attention and resolution. Firstly, compared with the relative positioning method that requires at least one reference station, the variometric approach uses broadcast ephemeris to obtain GNSS site velocities and is thus more suitable for early warning networks where stations are relatively sparse. However, as we emphasized in the Introduction, integrating velocity to displacement may cause error accumulation. Therefore, it is necessary to develop methods of removing errors effectively. Secondly, compared with seismic data with a high sampling rate (≥50 Hz), the sampling rate of GNSS data (1‒10 Hz) is significantly lower. Therefore, when using GNSS data to estimate the earthquake magnitude, it is inevitable that high-frequency information would be lost, which might result in deviations in earthquake magnitude estimate. Consequently, it is imperative to develop methods of effectively integrating geodetic data with seismic data [34,35,36]. Finally, compared with PGD magnitude, PGV magnitude at different stations fluctuates greatly, meaning that the regression model between PGV and moment magnitude may still need to be improved when dealing with earthquakes in Tibet. Regarding the results of our work, integrating PGD and PGV magnitudes seems to be a plausible method of magnitude estimation.
5. Conclusions
In this study, we collected the high-rate GNSS data from 55 stations around the 2021 Mw 7.3 Maduo earthquake epicenter. Using the relative positioning method to process these data, we obtained displacement time series at each GNSS station. In addition, we used the variometric approach to process GNSS data and obtained velocity time series at each GNSS station. Displacement and velocity data were used to extract PGD and PGV values, which were then used to estimate PGD and PGV magnitudes.
Our data processing results showed the amplitude of displacement and velocity waveforms gradually decreased with increasing hypocentral distance. PGD and PGV fluctuated near the line (Mw 7.3), which reflects the relationship between earthquake magnitude and hypocentral distance. PGD and PGV magnitudes were consistent with their counterparts (Mw 7.3) from USGS, with absolute deviation of 0.05 and 0.01 magnitude units. Our results confirmed the applicability and reliability of real-time earthquake magnitude estimation from high-rate GNSS data.
Supplementary Materials
The following are available online at https://0-www-mdpi-com.brum.beds.ac.uk/article/10.3390/rs13214478/s1, Figure S1: PPP results of the reference station, Figure S2: Displacement waveforms results, Figure S3: Velocity waveforms results.
Author Contributions
Conceptualization, X.S. and Y.L.; methodology, Z.G. and Y.L.; software, Z.G.; validation, Y.L., X.S. and C.Z.; formal analysis, Z.G. and Y.L.; data curation, Z.G.; writing—original draft preparation, Z.G.; writing—review and editing, Z.G., Y.L., X.S. and C.Z.; visualization, Z.G.; supervision, X.S.; project administration, X.S.; funding acquisition, Y.L., X.S. and C.Z. All authors have read and agreed to the published version of the manuscript.
Funding
This research was funded by the National Key Research and Development Program of China (grant number 2019YFC1509205), the National Natural Science Foundation of China (grant number 41631073, 41974006), the Basic Scientific Funding of Institute of Geology, China Earthquake Administration (grant number IGCEA2120) and the Lhasa National Geophysical Observation and Research Station (grant number NORSLS20-08).
Data Availability Statement
The moment tensor solutions of the 2021 Mw 7.3 Maduo earthquake come from China Earthquake Networks Center (CNEC; https://www.cenc.ac.cn/, accessed on 30 September 2021) and United States Geological Survey (USGS; https://www.usgs.gov/, accessed on 30 September 2021).
Acknowledgments
High-rate GNSS data were provided by China Earthquake Networks Center and Qinghai Institute of Basic Surveying and Mapping. Thanks to Yufei Han, Lijiang Zhao and Yu Li for supporting the high-rate GNSS data. Thanks to all colleagues who were involved in the construction, maintenance and data collection at GNSS stations. Track software package comes from http://geoweb.mit.edu/~tah/track_example/. SINVEL software package [18] comes from https://github.com/crowellbw/SNIVEL. All figures were made using the Generic Mapping Tools (GMT) software package [37] (https://www.soest.hawaii.edu/gmt). All websites were last accessed on 30 September 2021.
Conflicts of Interest
The authors declare no conflict of interest.
References
- Li, Z.; Li, W.; Li, T.; Xu, Y.; Su, P.; Guo, P.; Sun, H.; Ha, G.; Chen, G.; Yuan, Z.; et al. Seismogenic fault and coseismic surface deformation of the Maduo Ms 7.4 earthquake in Qinghai, China: A quick report. Seismol. Geol. 2021, 43, 722–737. [Google Scholar] [CrossRef]
- Pan, J.; Bai, M.; Li, C.; Liu, F.; Li, H.; Li, D.; Chevalier, M.; Wu, K.; Wang, P.; Lu, H.; et al. Coseismic surface rupture and seismogenic structure of the 2021-05-22 Maduo (Qinghai) Ms 7.4 earthquake. Acta Geol. Sin. 2021, 95, 1655–1670. [Google Scholar] [CrossRef]
- Chen, H.; Qu, C.; Zhao, D.; Ma, C.; Shan, X. Rupture kinematics and coseismic slip model of the 2021 Mw 7.3 Maduo (China) earthquake: Implications for the seismic hazard of the Kunlun fault. Remote Sens. 2021, 13, 3327. [Google Scholar] [CrossRef]
- He, K.; Wen, Y.; Xu, C.; Zhao, Y. Fault Geometry and Slip Distribution of the 2021 Mw 7.4 Maduo, China, Earthquake Inferred from InSAR Measurements and Relocated Aftershocks. Seismol. Res. Lett. 2021, XX, 1–13. [Google Scholar] [CrossRef]
- Zhao, D.; Qu, C.; Chen, H.; Shan, X.; Song, X.; Gong, W. Tectonic and geometric control on fault kinematics of the 2021 Mw 7.3 Maduo (China) earthquake inferred from interseismic, coseismic and postseismic InSAR observations. Geophys. Res. Lett. 2021, 48, e2021GL095417. [Google Scholar] [CrossRef]
- Wang, W.; Fang, L.; Wu, J.; Tu, H.; Chen, L.; Lai, G.; Zhang, L. Aftershock sequence relocation of the 2021 Ms 7.4 Maduo Earthquake, Qinghai, China. Sci. China Earth Sci. 2021, 64, 1371–1380. [Google Scholar] [CrossRef]
- Xu, Z.; Liang, S.; Zhang, G.; Liang, J.; Zou, L.; Li, X.; Chen, Y. Analysis of seismogenic structure of Madoi, Qinghai Ms 7.4 earthquake on May 22, 2021. Chin. J. Geophys. 2021, 64, 2657–2670. [Google Scholar] [CrossRef]
- Zhu, Y.; Diao, F.; Fu, Y.; Liu, C.; Xiong, X. Slip rate of the seismogenic fault of the 2021 Maduo earthquake in western China inferred from GPS observations. Sci. China Earth Sci. 2021, 64, 1363–1370. [Google Scholar] [CrossRef]
- Shan, X.; Li, Y.; Wang, Z.; Yin, H.; Liu, X.; Liu, Y.; Zhang, G.; Zhang, Y.; Qu, C. GNSS for quasi-real-time earthquake source determination in eastern Tibet: A prototype system toward early warning applications. Seismol. Res. Lett. 2021, 92, 2988–2997. [Google Scholar] [CrossRef]
- Zumberge, J.F.; Heflin, M.B.; Jefferson, D.C.; Watkins, M.M.; Webb, F.H. Precise point positioning for the efficient and robust analysis of GPS data from large networks. J. Geophys. Res. 1997, 102, 5005–5017. [Google Scholar] [CrossRef] [Green Version]
- Dong, D.N.; Bock, Y. Global Positioning System Network analysis with phase ambiguity resolution applied to crustal deformation studies in California. J. Geophys. Res. 1989, 94, 3949–3966. [Google Scholar] [CrossRef]
- Colosimo, G.; Crespi, M.; Mazzoni, A. Real-time GPS seismology with a stand-alone receiver: A preliminary feasibility demonstration. J. Geophys. Res. 2011, 116, B11302. [Google Scholar] [CrossRef] [Green Version]
- Heroux, P.; Kouba, J. GPS precise point positioning using IGS orbit products. Phys. Chem. Earth 2001, 26, 573–578. [Google Scholar] [CrossRef]
- Shu, Y.; Fang, R.; Liu, Y.; Ding, D.; Qiao, L.; Li, G.; Liu, J. Precise coseismic displacements from the GPS variometric approach using different precise products: Application to the 2008 Mw 7.9 Wenchuan earthquake. Adv. Space Res. 2020, 65, 2360–2371. [Google Scholar] [CrossRef]
- Shu, Y.; Fang, R.; Geng, J.; Zhao, Q.; Liu, J. Broadband velocities and displacements from integrated GPS and accelerometer data for high-rate seismogeodesy. Geophys. Res. Lett. 2018, 45, 8939–8948. [Google Scholar] [CrossRef]
- Fang, R.; Zheng, J.; Geng, J.; Shu, Y.; Shi, C.; Liu, J. Earthquake magnitude scaling using peak ground velocity derived from high-rate GNSS observations. Seismol. Res. Lett. 2021, 92, 227–237. [Google Scholar] [CrossRef]
- Benedetti, E.; Branzanti, M.; Biagi, L.; Colosimo, G.; Mazzoni, A.; Crespi, M. Global Navigation Satellite Systems Seismology for the 2012 Mw 6.1 Emilia earthquake: Exploiting the VADASE algorithm. Seismol. Res. Lett. 2014, 85, 649–656. [Google Scholar] [CrossRef]
- Crowell, B.W. Near-field strong ground motions from GPS-derived velocities for 2020 intermountain western United States earthquakes. Seismol. Res. Lett. 2021, 92, 840–848. [Google Scholar] [CrossRef]
- Bilich, A.; Cassidy, J.F.; Larson, K.M. GPS seismology: Application to the 2002 Mw 7.9 Denali fault earthquake. Bull. Seismol. Soc. Am. 2008, 98, 593–606. [Google Scholar] [CrossRef]
- Trifunac, M.D.; Todorovska, M.I. A note on the useable dynamic range of accelerographs recording translation. Soil Dyn. Earthq. Eng. 2001, 21, 275–286. [Google Scholar] [CrossRef]
- Allen, R.M.; Melgar, D. Earthquake early warning: Advances, scientific challenges, and societal needs. Annu. Rev. Earth Planet. Sci. 2019, 47, 361–388. [Google Scholar] [CrossRef] [Green Version]
- Grapenthin, R.; Johanson, I.A.; Allen, R.M. Operational real-time GPS-enhanced earthquake early warning. J. Geophys. Res. 2014, 119, 7944–7965. [Google Scholar] [CrossRef]
- Crowell, B.W.; Melgar, D.; Bock, Y.; Haase, J.S.; Geng, J.H. Earthquake magnitude scaling using seismogeodetic data. Geophys. Res. Lett. 2013, 40, 6089–6094. [Google Scholar] [CrossRef]
- Melgar, D.; Crowell, B.W.; Geng, J.; Allen, R.M.; Bock, Y.; Riquelme, S.; Hill, E.M.; Protti, M.; Ganas, A. Earthquake magnitude calculation without saturation from the scaling of peak ground displacement. Geophys. Res. Lett. 2015, 42, 5197–5205. [Google Scholar] [CrossRef]
- Crowell, B.W.; Schmidt, D.A.; Bodin, P.; Vidale, J.E.; Gomberg, J.; Renate-Hartog, J.; Kress, V.C.; Melbourne, T.I.; Santillan, M.; Minson, S.E. Demonstration of the Cascadia G-FAST geodetic earthquake early warning system for the Nisqually, Washington, earthquake. Seismol. Res. Lett. 2016, 87, 930–943. [Google Scholar] [CrossRef]
- Ruhl, C.J.; Melgar, D.; Geng, J.; Goldberg, D.E.; Crowell, B.W.; Allen, R.M.; Bock, Y.; Barrientos, S.; Riquelme, S.; Baez, J.C.; et al. A global database of strong-motion displacement GNSS recordings and an example application to PGD scaling. Seismol. Res. Lett. 2019, 90, 271–279. [Google Scholar] [CrossRef] [Green Version]
- Herring, T.A.; King, R.W.; Floyd, M.A.; McClusky, S.C. Introduction to GAMIT/GLOBK, Release 10.6; Massachusetts Institute of Technology: Cambridge, MA, USA, 2016. [Google Scholar]
- Geng, J.; Chen, X.; Pan, Y.; Mao, S.; Li, C.; Zhou, J.; Zhang, K. PRIDE PPP-AR: An open-source software for GPS PPP ambiguity resolution. GPS Solut. 2019, 23, 91. [Google Scholar] [CrossRef]
- Shan, X.; Yin, H.; Liu, X.; Wang, Z.; Qu, C.; Zhang, G.; Zhang, Y.; Li, Y.; Wang, C.; Jiang, Y. High-rate real-time GNSS seismology and early warning of earthquakes. Chin. J. Geophys. 2019, 62, 3043–3052. [Google Scholar] [CrossRef]
- Melgar, D.; Hayes, G.P. Characterizing large earthquakes before rupture is complete. Sci. Adv. 2019, 5, eaav2032. [Google Scholar] [CrossRef] [Green Version]
- Murray, J.R.; Crowell, B.W.; Grapenthin, R.; Hodgkinson, K.; Langbein, J.O.; Melbourne, T.; Melgar, D.; Minson, S.E.; Schmidt, D.A. Development of a geodetic component for the U.S. West Coast earthquake early warning system. Seismol. Res. Lett. 2018, 89, 2322–2336. [Google Scholar] [CrossRef]
- Zang, J.; Xu, C.; Li, X. Scaling earthquake magnitude in real time with high-rate GNSS peak ground displacement from variometric approach. GPS Solut. 2020, 24, 101. [Google Scholar] [CrossRef]
- Peng, C.; Jiang, P.; Ma, Q.; Wu, P.; Su, J.; Zheng, Y.; Yang, J. Performance evaluation of an earthquake early warning system in the 2019–2020 M6.0 Changning, Sichuan, China, seismic sequence. Front. Earth Sci. 2021, 9, 699941. [Google Scholar] [CrossRef]
- Bock, Y.; Melgar, D.; Crowell, B.W. Real-time strong-motion broadband displacements from collocated GPS and accelerometers. Bull. Seismol. Soc. Am. 2011, 101, 2904–2925. [Google Scholar] [CrossRef]
- Dahmen, N.; Hohensinn, R.; Clinton, J. Comparison and combination of GNSS and strong-motion observations: A case study of the 2016 Mw 7.0 Kumamoto earthquake. Bull. Seismol. Soc. Am. 2020, 110, 2647–2660. [Google Scholar] [CrossRef]
- Tu, R.; Zhang, R.; Zhang, P.; Liu, J.; Lu, X. Integration of single-frequency GNSS and strong-motion observations for real-time earthquake monitoring. Remote Sens. 2018, 10, 886. [Google Scholar] [CrossRef] [Green Version]
- Wessel, P.; Smith, W.H.F.; Scharroo, R.; Luis, J.; Wobbe, F. Generic Mapping Tools: Improved version released. Eos Trans. Am. Geophys. Union 2013, 94, 409–410. [Google Scholar] [CrossRef] [Green Version]
Figure 1.
Tectonic setting and GNSS stations around the Kunlunshankou–Jiangcuo Fault. The black star represents the epicenter of the 2021 Mw 7.3 Maduo earthquake. The red beach ball represents the focal mechanism of the 2021 Mw 7.3 Maduo earthquake reported by the United States Geological Survey (USGS). The green and red triangles represent high-rate GNSS stations from the Qinghai Continuously Operating Reference Stations (QHCORS) network and the Crustal Movement Observation Network of China (CMONOC), respectively. The pink dots represent the relocated aftershocks [6]. The red lines represent surface rupture [6]. The blue and black lines represent block boundaries and active faults, respectively. EKLF: East Kunlun Fault; GZ–YS–XSF: Garze–Yushu–Xianshuihe Fault. The inset map on the bottom left outlines the location of the study area.

Figure 2.
(a–f) Displacement (left panel) and velocity (right panel) time series results at six GNSS stations. The vertical gray dotted lines mark the time (18:04:13, UTC) of the 2021 Mw 7.3 Maduo earthquake. Station names and hypocentral distances are labeled.
Figure 2.
(a–f) Displacement (left panel) and velocity (right panel) time series results at six GNSS stations. The vertical gray dotted lines mark the time (18:04:13, UTC) of the 2021 Mw 7.3 Maduo earthquake. Station names and hypocentral distances are labeled.

Figure 3.
(a,b) PGD and PGV values as a function of hypocentral distance. The red lines are the predicted values of PGD and PGV as a function of hypocentral distance from the regression model following Equations (2) and (5).
Figure 3.
(a,b) PGD and PGV values as a function of hypocentral distance. The red lines are the predicted values of PGD and PGV as a function of hypocentral distance from the regression model following Equations (2) and (5).

Figure 4.
(a,b) PGD/PGV magnitude evolution at all high-rate GNSS stations. The upper panel shows results of PGD magnitudes. The lower panel shows results of PGV magnitudes. The red dotted line represents the magnitude of 2021 Mw 7.3 Maduo earthquake reported by USGS.
Figure 4.
(a,b) PGD/PGV magnitude evolution at all high-rate GNSS stations. The upper panel shows results of PGD magnitudes. The lower panel shows results of PGV magnitudes. The red dotted line represents the magnitude of 2021 Mw 7.3 Maduo earthquake reported by USGS.

Figure 5.
The relationship between (a) PGD/PGV magnitude and the number of high-rate GNSS stations; the convergence process of the (b) PGD and (c) PGV magnitudes with different numbers of high-rate GNSS stations within 200 km of hypocentral distance. The red dotted line represents the magnitude of 2021 Mw 7.3 Maduo earthquake reported by USGS.

Publisher’s Note: MDPI stays neutral with regard to jurisdictional claims in published maps and institutional affiliations. |
© 2021 by the authors. Licensee MDPI, Basel, Switzerland. This article is an open access article distributed under the terms and conditions of the Creative Commons Attribution (CC BY) license (https://creativecommons.org/licenses/by/4.0/).
Share and Cite
MDPI and ACS Style
Gao, Z.; Li, Y.; Shan, X.; Zhu, C. Earthquake Magnitude Estimation from High-Rate GNSS Data: A Case Study of the 2021 Mw 7.3 Maduo Earthquake. Remote Sens. 2021, 13, 4478. https://0-doi-org.brum.beds.ac.uk/10.3390/rs13214478
AMA Style
Gao Z, Li Y, Shan X, Zhu C. Earthquake Magnitude Estimation from High-Rate GNSS Data: A Case Study of the 2021 Mw 7.3 Maduo Earthquake. Remote Sensing. 2021; 13(21):4478. https://0-doi-org.brum.beds.ac.uk/10.3390/rs13214478
Chicago/Turabian StyleGao, Zhiyu, Yanchuan Li, Xinjian Shan, and Chuanhua Zhu. 2021. "Earthquake Magnitude Estimation from High-Rate GNSS Data: A Case Study of the 2021 Mw 7.3 Maduo Earthquake" Remote Sensing 13, no. 21: 4478. https://0-doi-org.brum.beds.ac.uk/10.3390/rs13214478
Note that from the first issue of 2016, this journal uses article numbers instead of page numbers. See further details here.