Article

A Vehicle-Borne Mobile Mapping System Based Framework for Semantic Segmentation and Modeling on Overhead Catenary System Using Deep Learning

1
School of Remote Sensing and Information Engineering, Wuhan University, Wuhan 430079, China
2
China Railway Design Corporation, Tianjin 300308, China
3
College of Civil Engineering, Nanjing Forestry University, Nanjing 210037, China
4
School of Geosciences, Yangtze University, Wuhan 430100, China
*
Author to whom correspondence should be addressed.
Remote Sens. 2021, 13(23), 4939; https://0-doi-org.brum.beds.ac.uk/10.3390/rs13234939
Submission received: 13 November 2021 / Revised: 2 December 2021 / Accepted: 3 December 2021 / Published: 4 December 2021
(This article belongs to the Special Issue Advances in Deep Learning Based 3D Scene Understanding from LiDAR)

Abstract

:
Overhead catenary system (OCS) automatic detection is of important significance for the safe operation and maintenance of electrified railways. The vehicle-borne mobile mapping system (VMMS) may significantly improve the data acquisition. This paper proposes a VMMS-based framework to realize the automatic detection and modelling of OCS. The proposed framework performed semantic segmentation, model reconstruction and geometric parameters detection based on LiDAR point cloud using VMMS. Firstly, an enhanced VMMS is designed for accurate data generation. Secondly, an automatic searching method based on a two-level stereo frame is designed to filter the irrelevant non-OCS point cloud. Then, a deep learning network based on multi-scale feature fusion and an attention mechanism (MFF_A) is trained for semantic segmentation on a catenary facility. Finally, the 3D modelling is performed based on the OCS segmentation result, and geometric parameters are then extracted. The experimental case study was conducted on a 100 km high-speed railway in Guangxi, China. The experimental results show that the proposed framework has a better accuracy of 96.37%, outperforming other state-of-art methods for segmentation. Compared with traditional manual laser measurement, the proposed framework can achieve a trustable accuracy within 10 mm for OCS geometric parameter detection.

Graphical Abstract

1. Introduction

The railway has become a significant mode of modern transportation because of its advantages in terms of its high speed, high safety, good comfort and low-cost performance [1]. Currently, the railway has gradually become one of the most important means of transportation between cities in China. The railway has been rapidly developed and constructed recently [2]. The electrified railway is the main form of railway in China. By 2020, the total mileage of China’s railway operation exceeded 146,000 km, and contained 106,000 km of electrified railways, with an electrification rate of 72.6 percent. The overhead catenary system (OCS) is an electromechanical system in the railway that provides electrical energy to an electric traction unit through a contact wire. Generally, it is composed of a pole, pole foundation, support device, positioning device, contact suspension and power supply auxiliary facilities, as shown in Figure 1. As the core of the electrified railway, OCS plays a vital role in ensuring railway transportation safety, improving transportation efficiency and reducing the energy consumption of transportation [3]. However, because of the effects of bad weather, such as wind, rain, snow, sandstorm and others, it is inevitable that OCS will experience issues, such as structural loosening, aging and changes from its original geometric position. Moreover, due to the abnormal relationship between the pantograph and the contact wire, long-term vibration, the overload capacity and the corrosion of catenary equipment, the OCS will experience deformations, and the whole system will be broken. When the OCS fails, the entire railway line operation will be affected because of the absence of no backup facilities. Thus, in order to avoid OCS breakdown, it is necessary to carry out regular timely monitoring on the status of the OCS. However, the rapid growth of the railway construction brings tremendous challenges for this task.
Catenary geometric parameters, such as the height and stagger of the contact wire, are important data for evaluating the catenary status [4]. To balance the wear of the carbon sliding plate of the pantograph on the electric locomotive, the overhead contact wire needs to be reasonably arranged according to the “zigzag” shape, and its offset from the central line of the pantograph at the positioning point is called the stagger value. Due to the limitation of the length of the carbon sliding plate of the pantograph, the stagger value of the contact wire needs to be limited to a certain range. When the stagger value is too large, in the case of severe weather, such as strong wind, the contact line will easily exceed the limit, resulting in pantograph and catenary accidents, such as pantograph scraping or pantograph drilling. Meanwhile, when the stagger value is too small, the contact wire acts too intensively in the area of the carbon sliding plate of the pantograph, which will cause the service life of the carbon sliding plate to decrease [5]. The height of the contact wire refers to the vertical distance between the bottom of the contact wire and the connecting line on the rail surface. The height of the contact wire is an important index for evaluating the working state of the catenary. If the height of the contact wire is too high, the pantograph may go offline and produce an electric arc, resulting in the wear of the contact wire and the pantograph. If the height of the contact wire is too small, it is prone to bow drilling accidents, which affects the safety of passengers and goods.
To achieve the above objectives, this paper therefore further explores the deep learning semantic segmentation and detection of OCS facilities from VMMS LiDAR point cloud by deep learning. The main objectives are as follows: (1) to propose an automatic efficient extraction method for catenary facility samples in 3D scenes and to effectively remove background interference points; (2) to propose a semantic segmentation network based on the multi-scale feature fusion attention mechanism (MFF_A) to classify OCS facilities; and (3) to reconstruct the 3D model of catenary facilities and to test the geometric parameters of OCS with ground truth generated by traditional equipment.
The reminder of this paper is organized as follows. Section 2 reviews the related works. Section 3 describes the detailed methodology and data generation process. In Section 4, the experiment results and the performance evaluation are presented, analyzed and then discussed. Finally, Section 4 concludes the paper, along with a few suggestions for future research topics.

2. Related Works

The current OCS detection method can be divided into contact and non-contact types. Contact detection dynamically measures the geometric parameters of OCS by installing various proximity sensors on the pantograph slide plate. However, this kind of method increases the weight of skateboards, which affects the normal function of pantographs. This kind of method also has serious electromagnetic interference, a low reliability, inconvenient maintenance and other defects. Non-contact detection usually achieves OCS defect detection [6,7] and geometric parameters measurement [8,9] through a high-speed camera and laser phase rangefinder or line-array camera, etc. Generally, non-contact methods are mainly based on 2D image detection [10,11] or 2D/3D light detection and ranging (LiDAR) [8,12]. However, 2D image detection adopts optical measurement technology based on line structured light or binocular linear array active vision measurement technology to measure OCS geometric parameters [13,14]. This method is susceptible to the weather, light and other factors, causing the results to often have problems, such as an unstable detection quality, serious difficulty in the target recognition and low accuracy. The 2D LiDAR detection identifies and segments point clouds on the 2D scan lines to measure the geometric parameters of OCS [8,12]. This method is restricted by the single measuring angle range with a relatively slow detection speed. Therefore, current non-contact detection methods cannot meet the requirements of the rapid identification, classification and precision measurement of OCS in complex scenes. The 3D LiDAR detection normally uses a vehicle-borne mobile mapping system (VMMS) to collect high-density laser point clouds along the line by carrying the measurement system on the rail flatbed vehicle. Compared with other detection methods, VMMS data are richer in dimension information, with a faster measurement speed and a wider scanning range. The key point of VMMS-based OCS detection lies in the specific component semantic segmentation of the point cloud. At present, 3D point-cloud-based segmentation methods can be divided into two categories: statistical analysis and deep learning methods.

2.1. Statistics-Based Method

The principle of the statistics-based method is to achieve the fitting and analysis of specific targets or planes based on the differences in the distance, shape, echo intensity and other characteristics between different parts of point cloud data. Machine learning algorithms, such as random sample consensus (RANSAC) clustering or region growth [15,16], are widely used. Zhou et al. [17] proposed a region-RANSAC and Euclidean clustering to extract multiple linear regions of the catenary support system after setting the extraction range of point cloud data. Pastucha [15] used RANSAC to detect and classify the cantilevers, support structures and catenary wires, and then improved the classification result with a modified DBSCAN clustering algorithm. Zou et al. [16] used a K-means clustering fused region-grow fitting algorithm to extract the rail track and recognize the track branches apart. Lamas et al. [18] proposed a heuristic-based workflow for the semantic segmentation of complex railway environments. A 90 km-long railway dataset was used to verify the method’s effectiveness. Jung et al. [19] proposed a multi-range conditional random field and support vector machine to classify railway scenes, which can consider vertical and horizontal object relations in a railway scene. However, locally extracted line segments showed their limitations in representing objects with their full scales, which led to misclassification errors. The above methods have clear principles and simple methods, and can solve the problem of detecting and extracting OCS in specific railway scenes. However, most methods still need a priori knowledge, requiring considerable manual intervention in the implementation process, such as setting parameters [20], which makes it difficult to both achieve automatic extraction and promote practical application. Thus, achieving automatic extraction with a strong robustness is necessary.

2.2. Deep-Learning-Based Method

Compared with the statistical analysis method, the deep learning (DL) semantic segmentation method has better application prospects [21]. It no longer relies on the manual extraction of target features, but extracts multi-dimensional features through an automatic convolution operation. The activation function is used for the semantic segmentation of high-dimensional features, improving the segmentation accuracy. Several methods were conducted for catenary facility segmentation based on deep learning. Point cloud segmentation methods based on deep learning can be divided into projection-based and point-based [22]. The projection-based method is to project points in a 3D scene onto the 2D plane or manifold surface to process 2D information by a convolutional neural network (CNN), detecting the railway catenary component [10]. The application of this type of method is often limited because complex feature images need to be generated before training samples. Moreover, these methods are often computationally redundant because close points of the same features are calculated and processed multiple times in the network. Compared with the projection method, the point-based method does not need to generate complex feature images. It can directly take the point cloud as the input of the network model to classify and segment the point cloud. The PointNet [23] network is a deep learning point cloud classification and segmentation network that can operate point cloud data directly. PointNet++ [24] is a hierarchical feature learning framework that improves the PointNet to overcome the deficiency of the PointNet network in extracting local features. PointCNN [25], PointWeb [26], KPConv [27], PointConv [28] and other networks are proposed to be applied to point-based semantic segmentation. Chen et al. [12] proposed a method that combined PointNet with long short-term memory to recognize the multiple OCS component by the point cloud collected by mobile 2D LiDAR. Lin et al. [8] designed a classification OCS point cloud method that identified the context of each single frame point cloud by an improved PointNet and combined single frame data based on classification results. This algorithm was better in terms of its mean accuracy compared with the PointNet. However, most of the current methods have disadvantages in many different aspects: (1) It relies on manual sample extraction in the early stage and lacks the automatic searching and extraction of catenary facilities from the entire scene of the point cloud. Although segmentation recognition on every frame of the 2D LiDAR point cloud can be achieved [8,12], the automatic search of 3D LiDAR catenary facilities is still unrealized; (2) Many neural networks tend to map features to high-dimensional space to obtain more and richer high-dimensional features. However, they cannot effectively distinguish the feature weight matrix according to the importance of features. This shortcoming results in a large amount of important feature information that cannot be effectively transmitted, and is thus abandoned. The recent introduction of the attention mechanism in a few network models [29] proved that the segmentation accuracy could be improved slightly, but that the calculation unfortunately increases sharply. Moreover, there is no effective attention mechanism to improve the weight coefficient of important features; (3) The thinning structure plays an increasingly important role in image deep semantic segmentation. At present, the thinning structure is, with regret, rarely applied to the point-cloud-based network for segmentation and re-refinement; (4) The method for fusing the multi-scale features of both the shallow feature and deep feature map are still lacking.

3. Material and Methodology

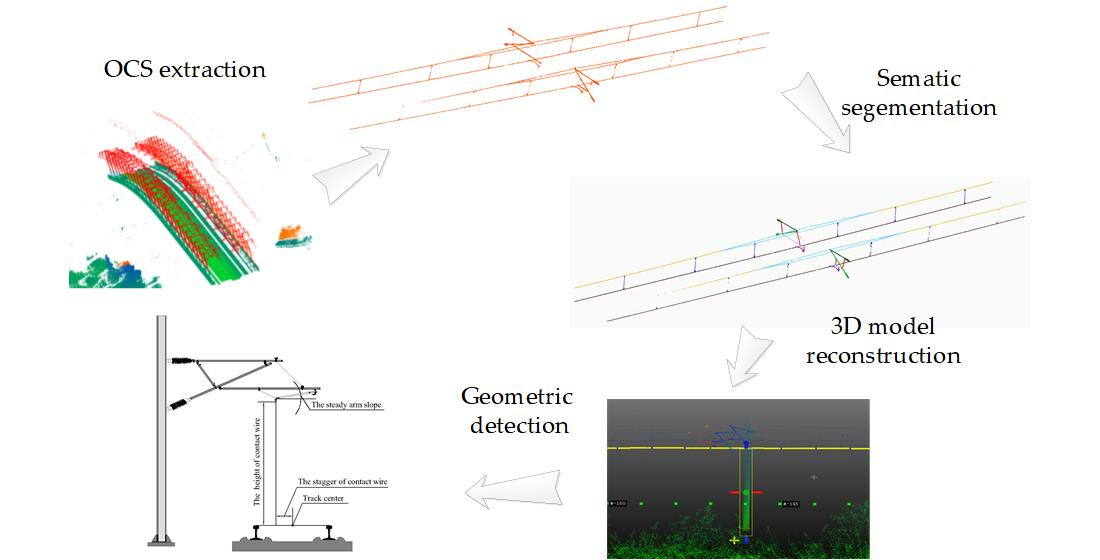
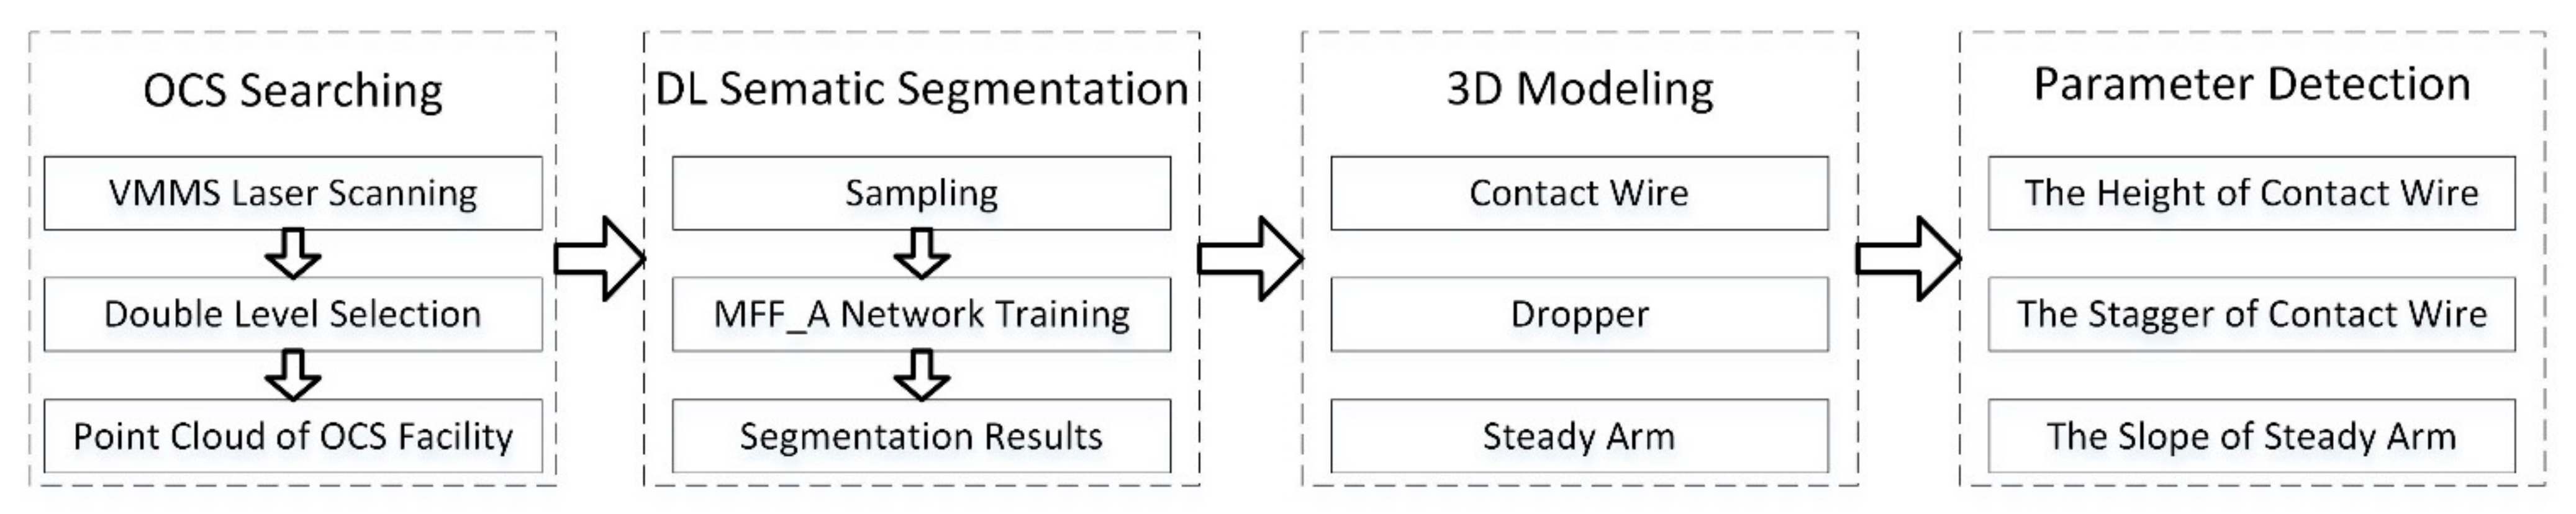
Considering the advantage of deep learning in OCS segmentation, this paper tried to improve the current DL network by addressing the shortcomings summarized in Section 2.2. The proposed framework in this work mainly consists of four steps (Figure 2). First, the method can effectively deal with the automatic extraction of OCS facility samples in 3D scenes and can remove background interference points. An automatic fast search and extraction based on the original point cloud scenario can be realized. Second, the extraction of the catenary facilities sample classification can be achieved through the means of a manual label. Third, the semantic segmentation of catenary facilities based on deep learning is implemented. Finally, the 3D model of catenary facilities is reconstructed, and the application of catenary geometric parameters detection is carried out.

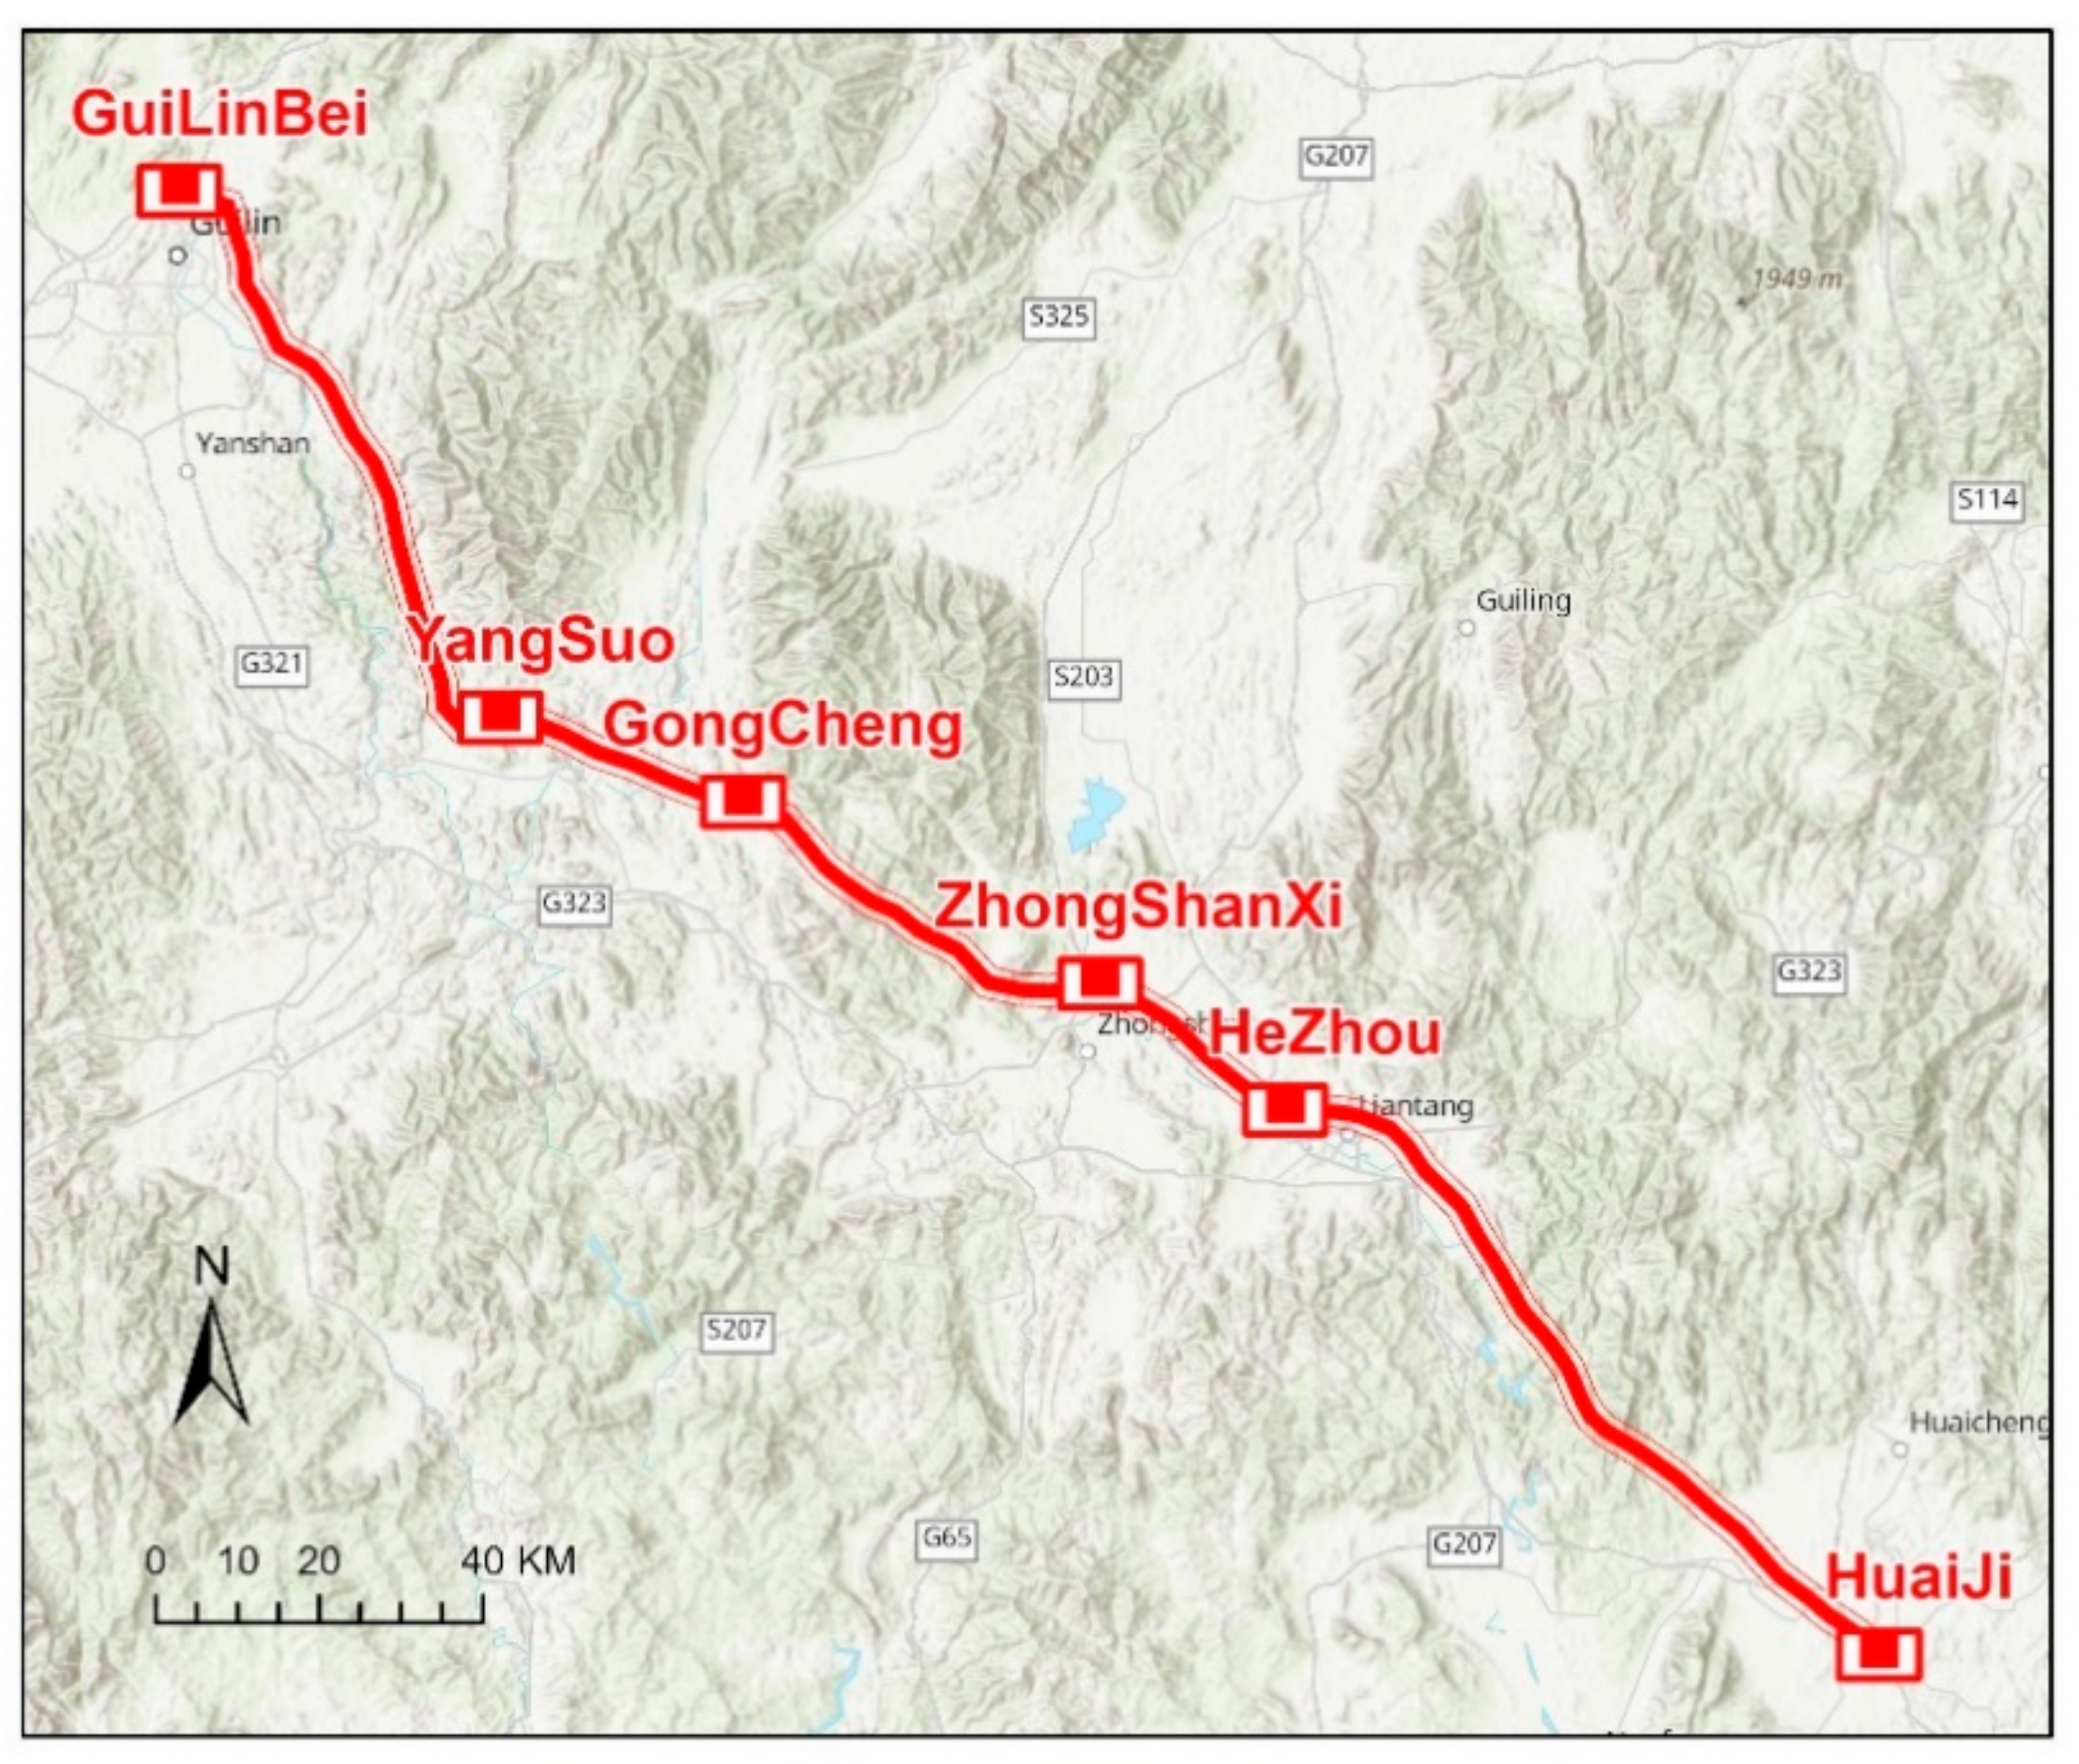
3.1. Study Area and VMMS Data Generation

In this study, part of the Guiyang–Guangzhou railway was selected to conduct experiments to verify the method effectiveness. This line is an interregional high-speed railway that connects Guiyang and Guangzhou in China, with a total of 857.00 km. A sub-line of 100.66 km from HeZhou station to HuaiJi Station was selected for VMMS LiDAR survey and scanning. The survey was conducted on the left and right lines of the railway, as shown in Figure 3.
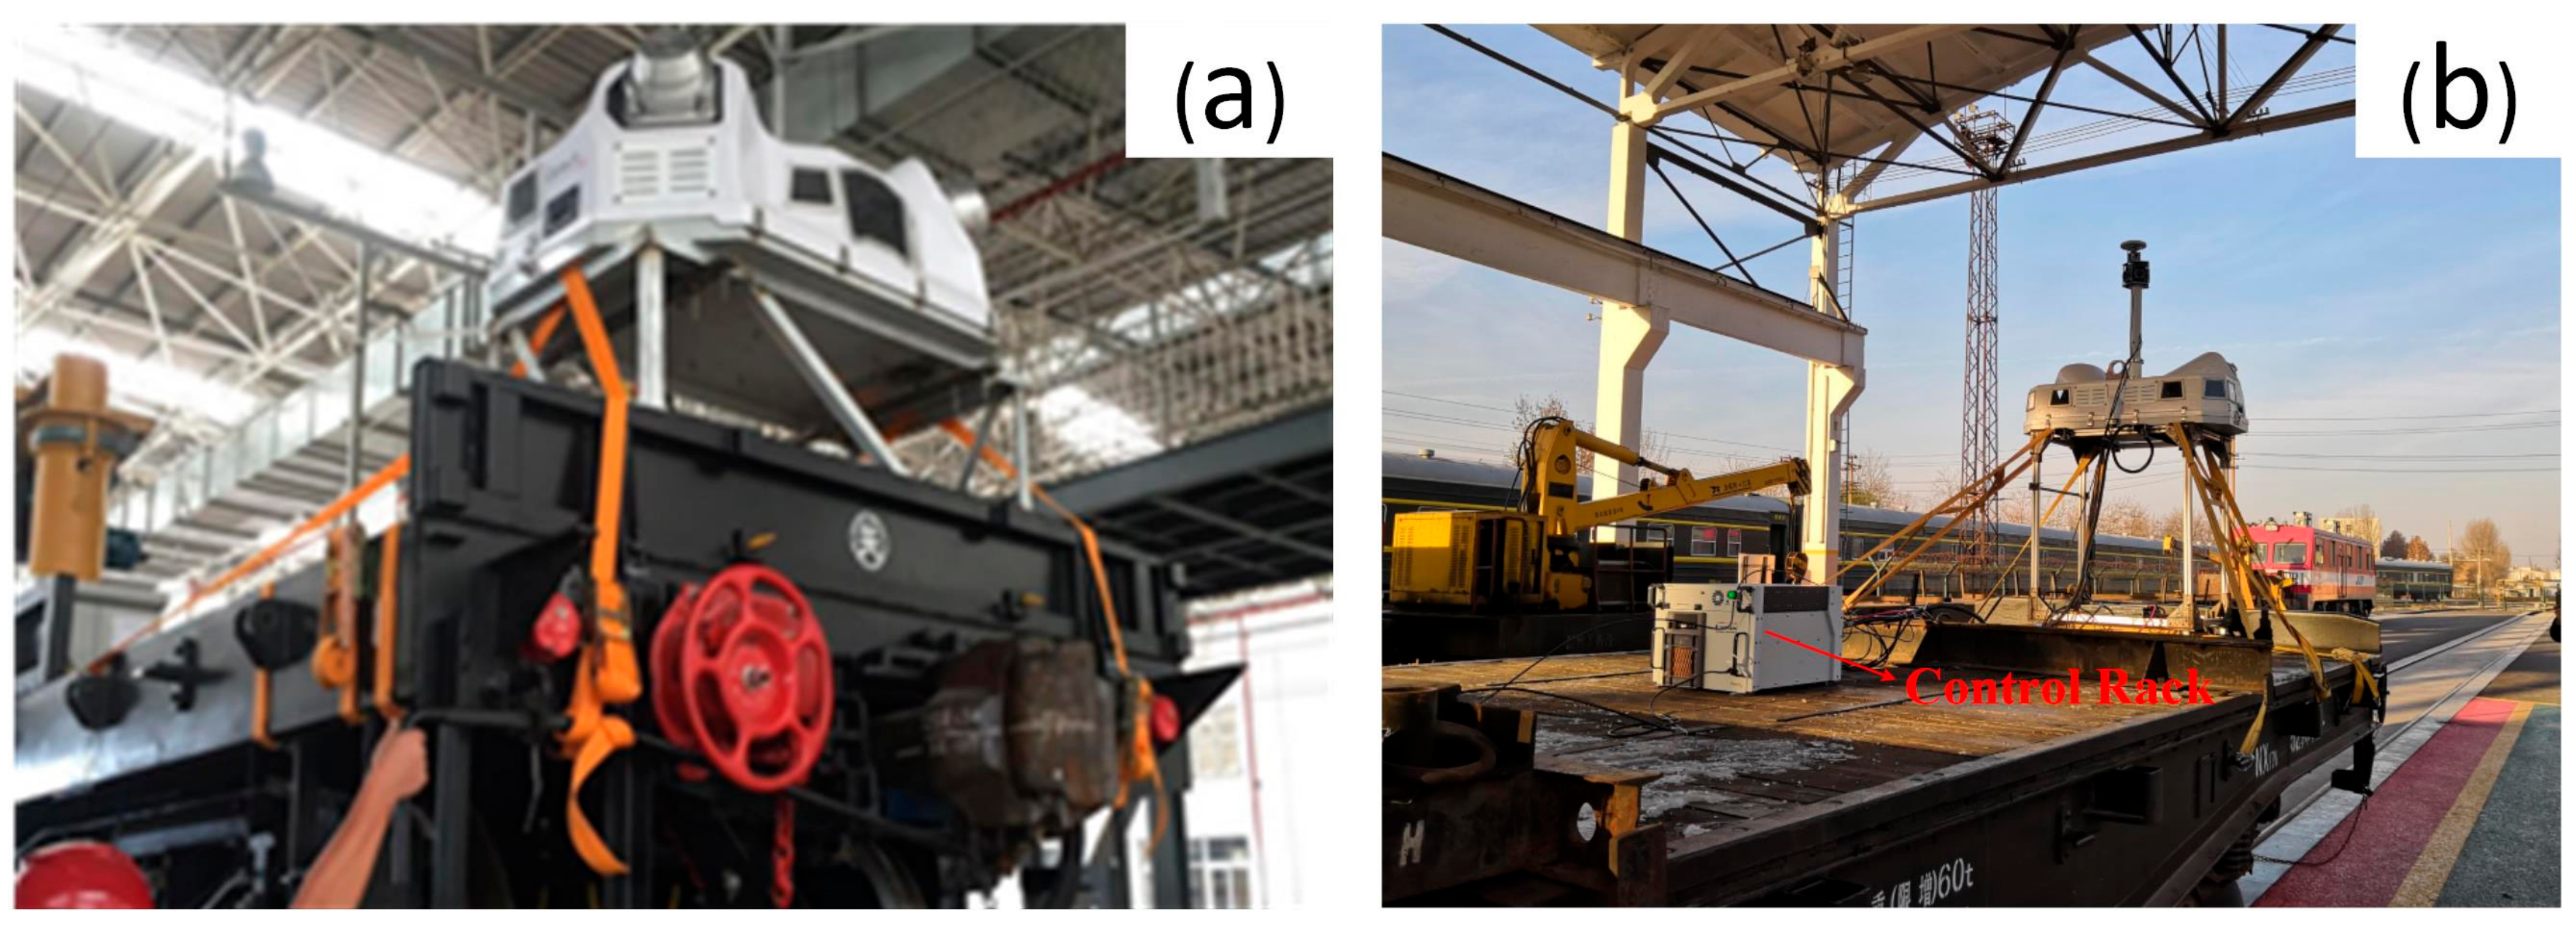
A VMMS was applied and improved in this study to collect data along the railway quickly and effectively.
For LiDAR scanning, an Optech Lynx HS 600 VMMS (Figure 4) with a minimum measurement distance of 1.5 m is used. The inclined installation of two laser scanning heads of Lynx HS 600 can effectively reduce the scanning blind area along the railway. The actual practice shows that it is a better and more convenient way of installing the onboard radar system to the rear of the flat car utilizing a customized rigid elevated frame. The heightening frame can increase the distance from the scanner center to the bottom rail, and the top of the support is equipped with a fast fixing device for convenient installation. The lifting bracket and vehicle can be fixed by a binding belt. This enhanced system can be quickly installed in two hours. The actual acquisition scanner parameter settings are from many preliminary field tests: the laser scanner frequency is 600 kHz and the scanning frequency of a single laser head is 400 lines/s. This setting can maintain a balance between the density and accuracy of the collected point cloud.
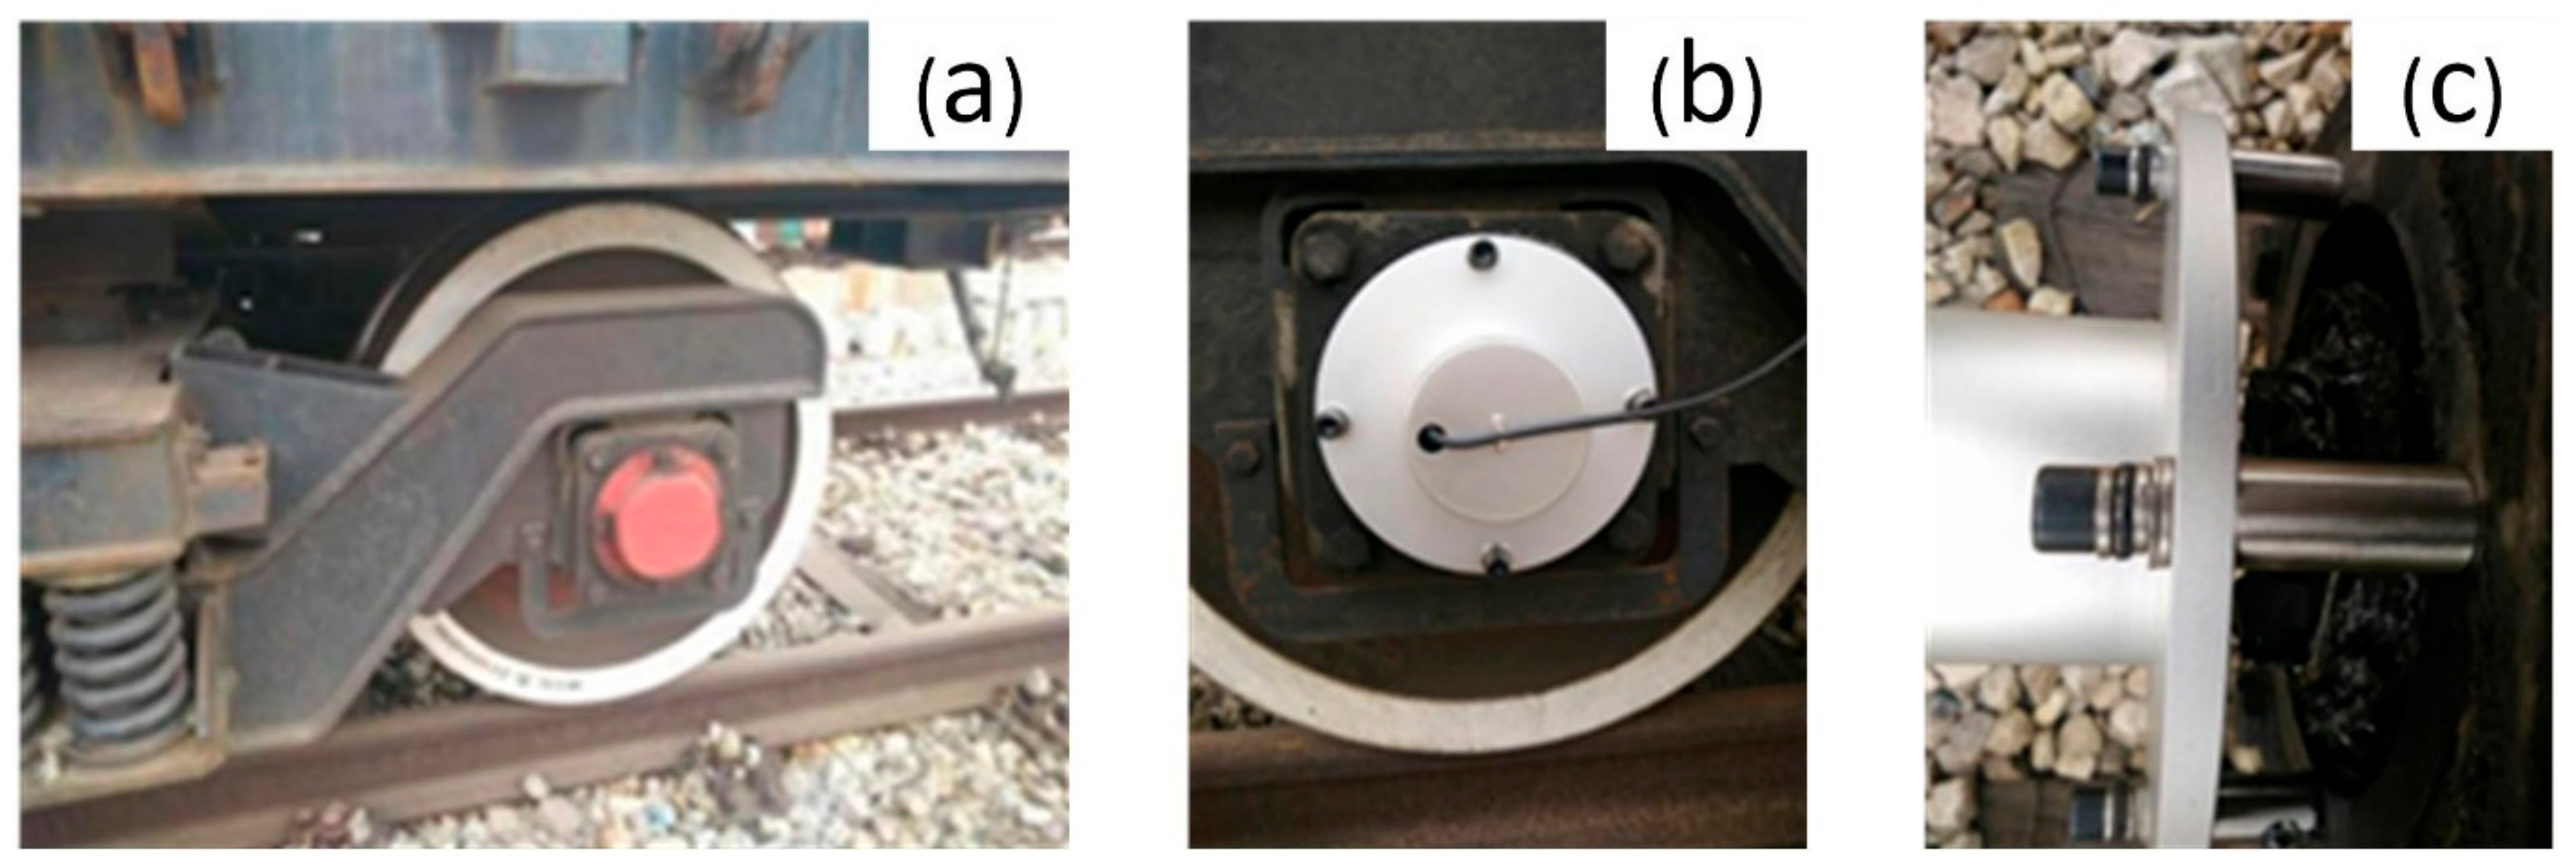
For accurate position information, Applanix POSLV620 GNSS and the integrated high-precision fiber optic gyroscope were used. The roll and pitch accuracy of this device is 0.005 degrees and the heading accuracy is 0.015 degrees when the satellite signal is good. The gyroscope can maintain its nominal accuracy within 60 s when the satellite signal loses lock. During scanning, a total of 7 GNSS reference stations were set up at an interval of approximately 15 km along the line. The sampling frequency of the reference station was uniformly set to 1 Hz, and GNSS signals were received continuously throughout the entire process. When VMMS enters the railway tunnel, the position and orientation system (POS) could not accept satellite signals. After driving in the tunnel for more than 60 s, it was necessary to stop and stand at the entrance and exit of the tunnel, respectively, in order to improve the position and orientation accuracy of the POS. Due to the fact that POS will always drift when parking and standing, an odometer (DMI)-assisted POS needs to be installed on the train wheels for zero speed correction. A metal protective cover of DMI on the axle was installed to protect it from the outside train transmission shaft and to achieve accurate synchronisation between the DMI and the train wheel rotation (Figure 5).
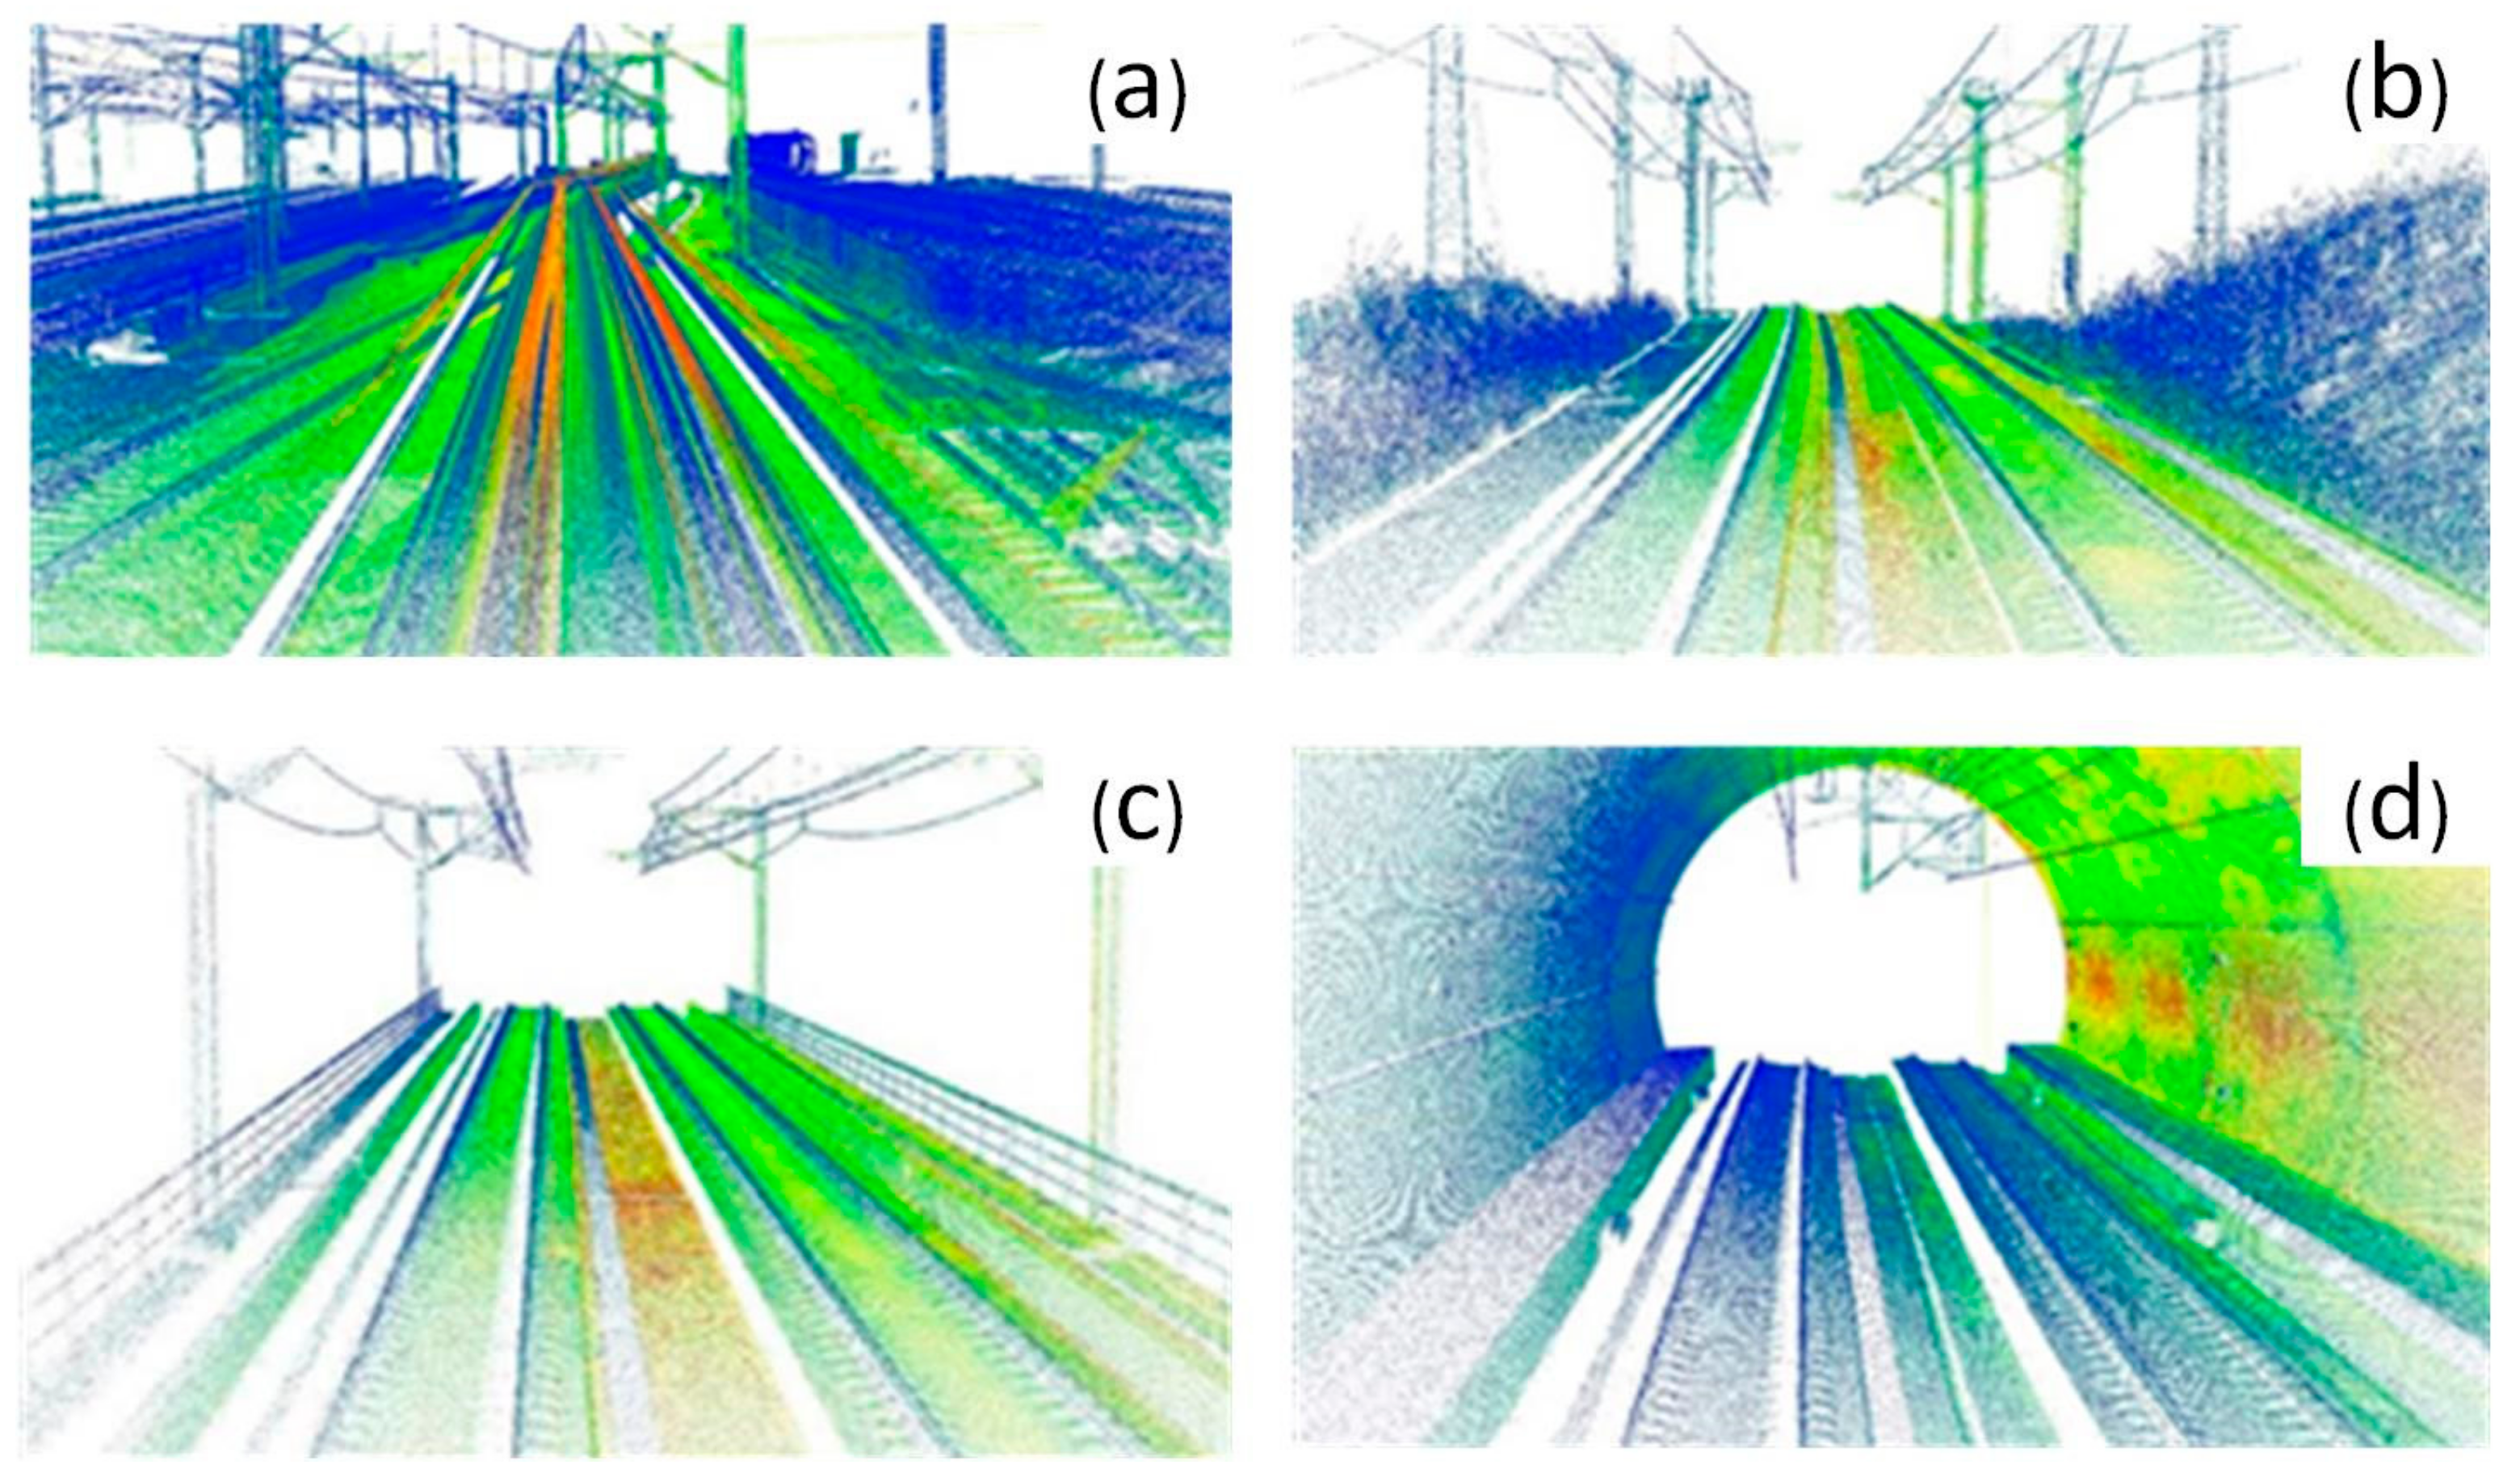
Finally, considering the normal operation of the railway, the maintenance time from 23:00 to 03:00 on two days (no other trains running on the railway line) is selected for scanning, with a total duration of eight hours. During the scanning, the average vehicle moving speed is approximately 60 km/h. As a result of the large number of long tunnels or tunnel groups in this section, it is necessary to stop before entering the tunnel for the positioning and attitude measurement system to stand for 5–10 min each time. During the parking waiting period, the scanner stops data acquisition, the positioning and attitude measurement system still works normally and the original generated point cloud data are approximately 180 GB (as shown in Figure 6).

3.2. Double Selection Stereo Frame of OCS

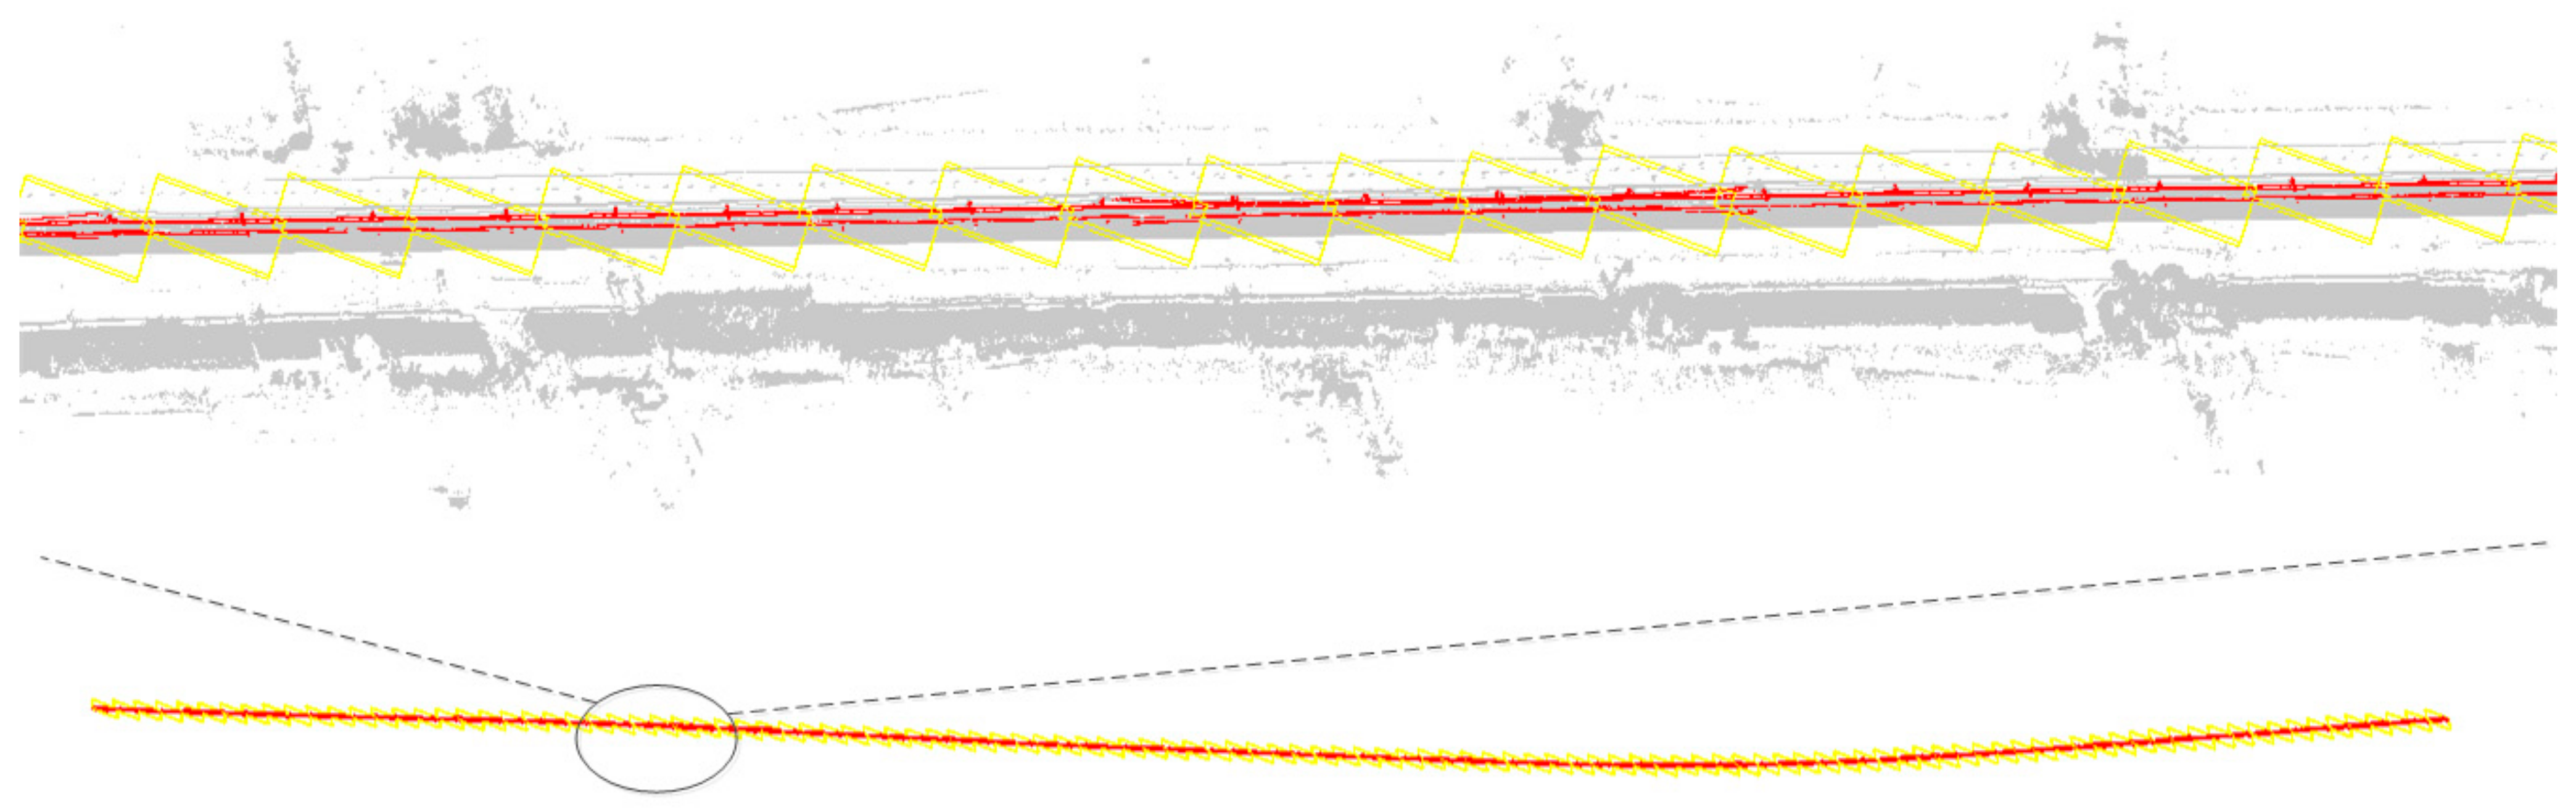
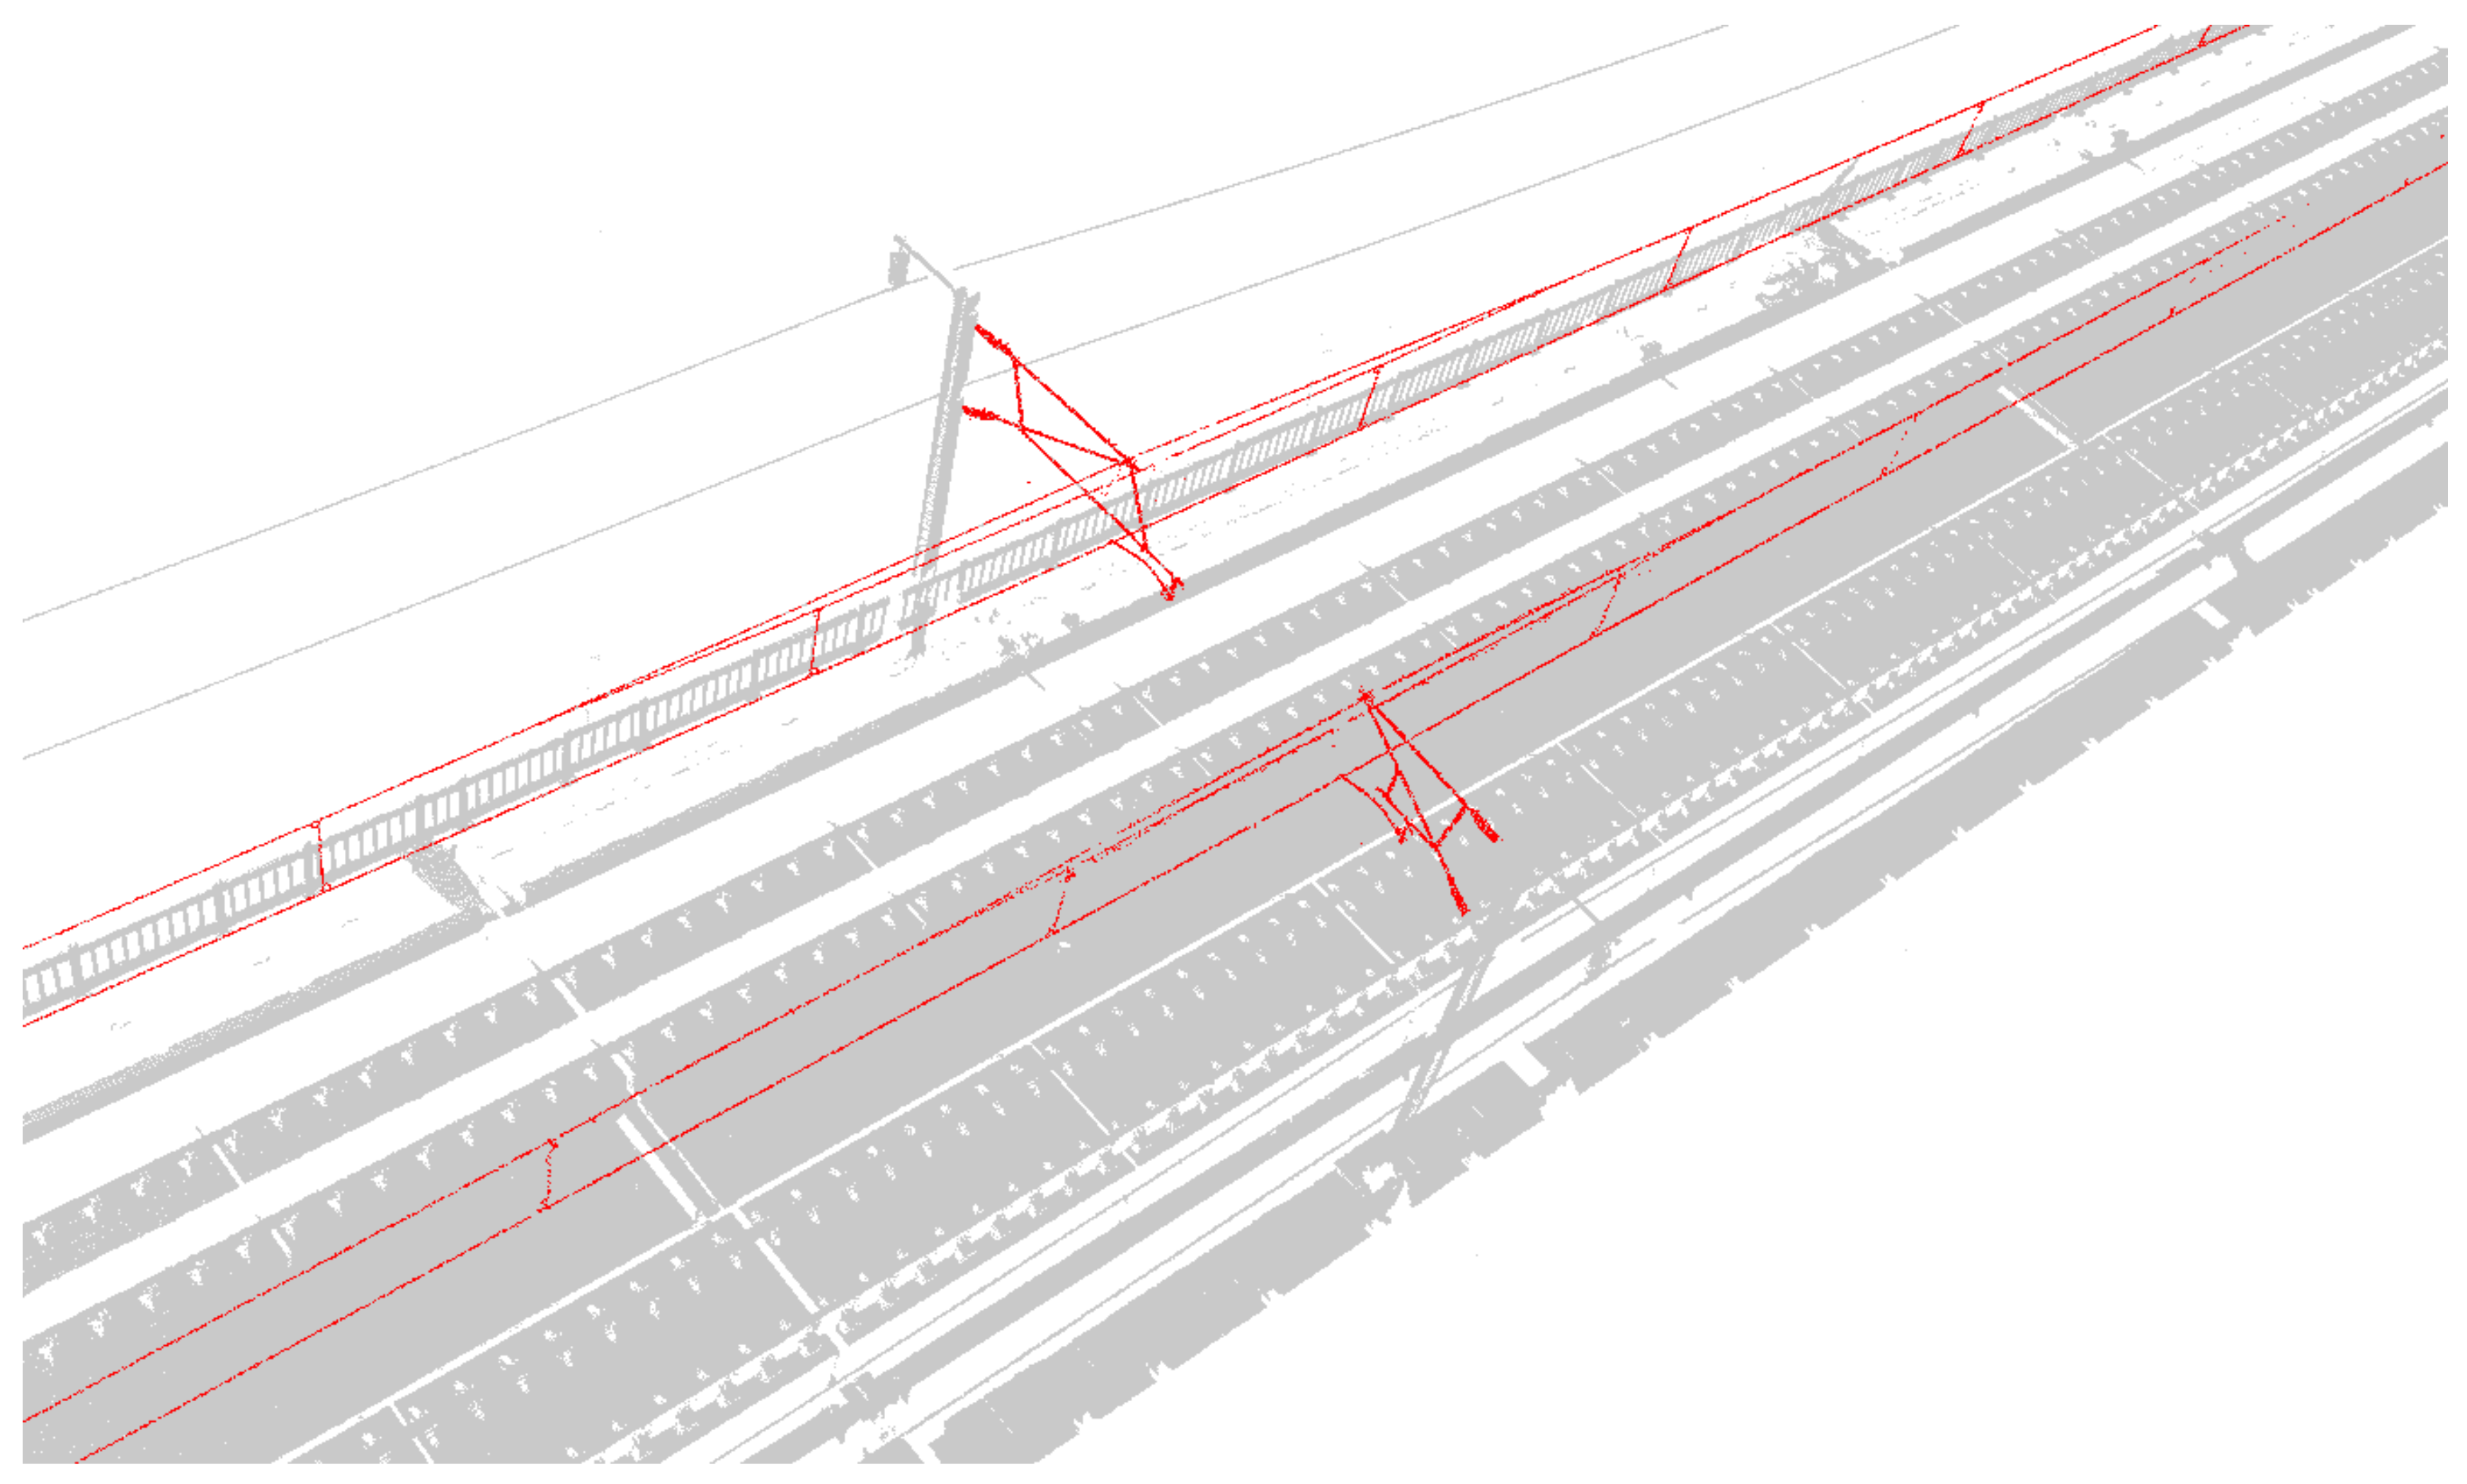
In the obtained point cloud data, the subgrade section accounts for 21.03%, the tunnel section accounts for 38.30%, the bridge section accounts for 40.67% and the point cloud of OCS facilities accounts for no more than 1% of the entire point cloud scene. If the deep learning network is used directly for semantic segmentation of the original point cloud data when the category samples are extremely unbalanced, it may lead to the poor generalization ability of the network and easy overfitting, finally leading to the misclassification and omission of OCS components. Therefore, the OCS facilities need to be extracted from the original scene in advance to eliminate the interference of other types of point cloud objects on the identification of OCS facilities. This paper presents an automatic search and extraction method of scene double selection stereo frame catenary based on POS data (
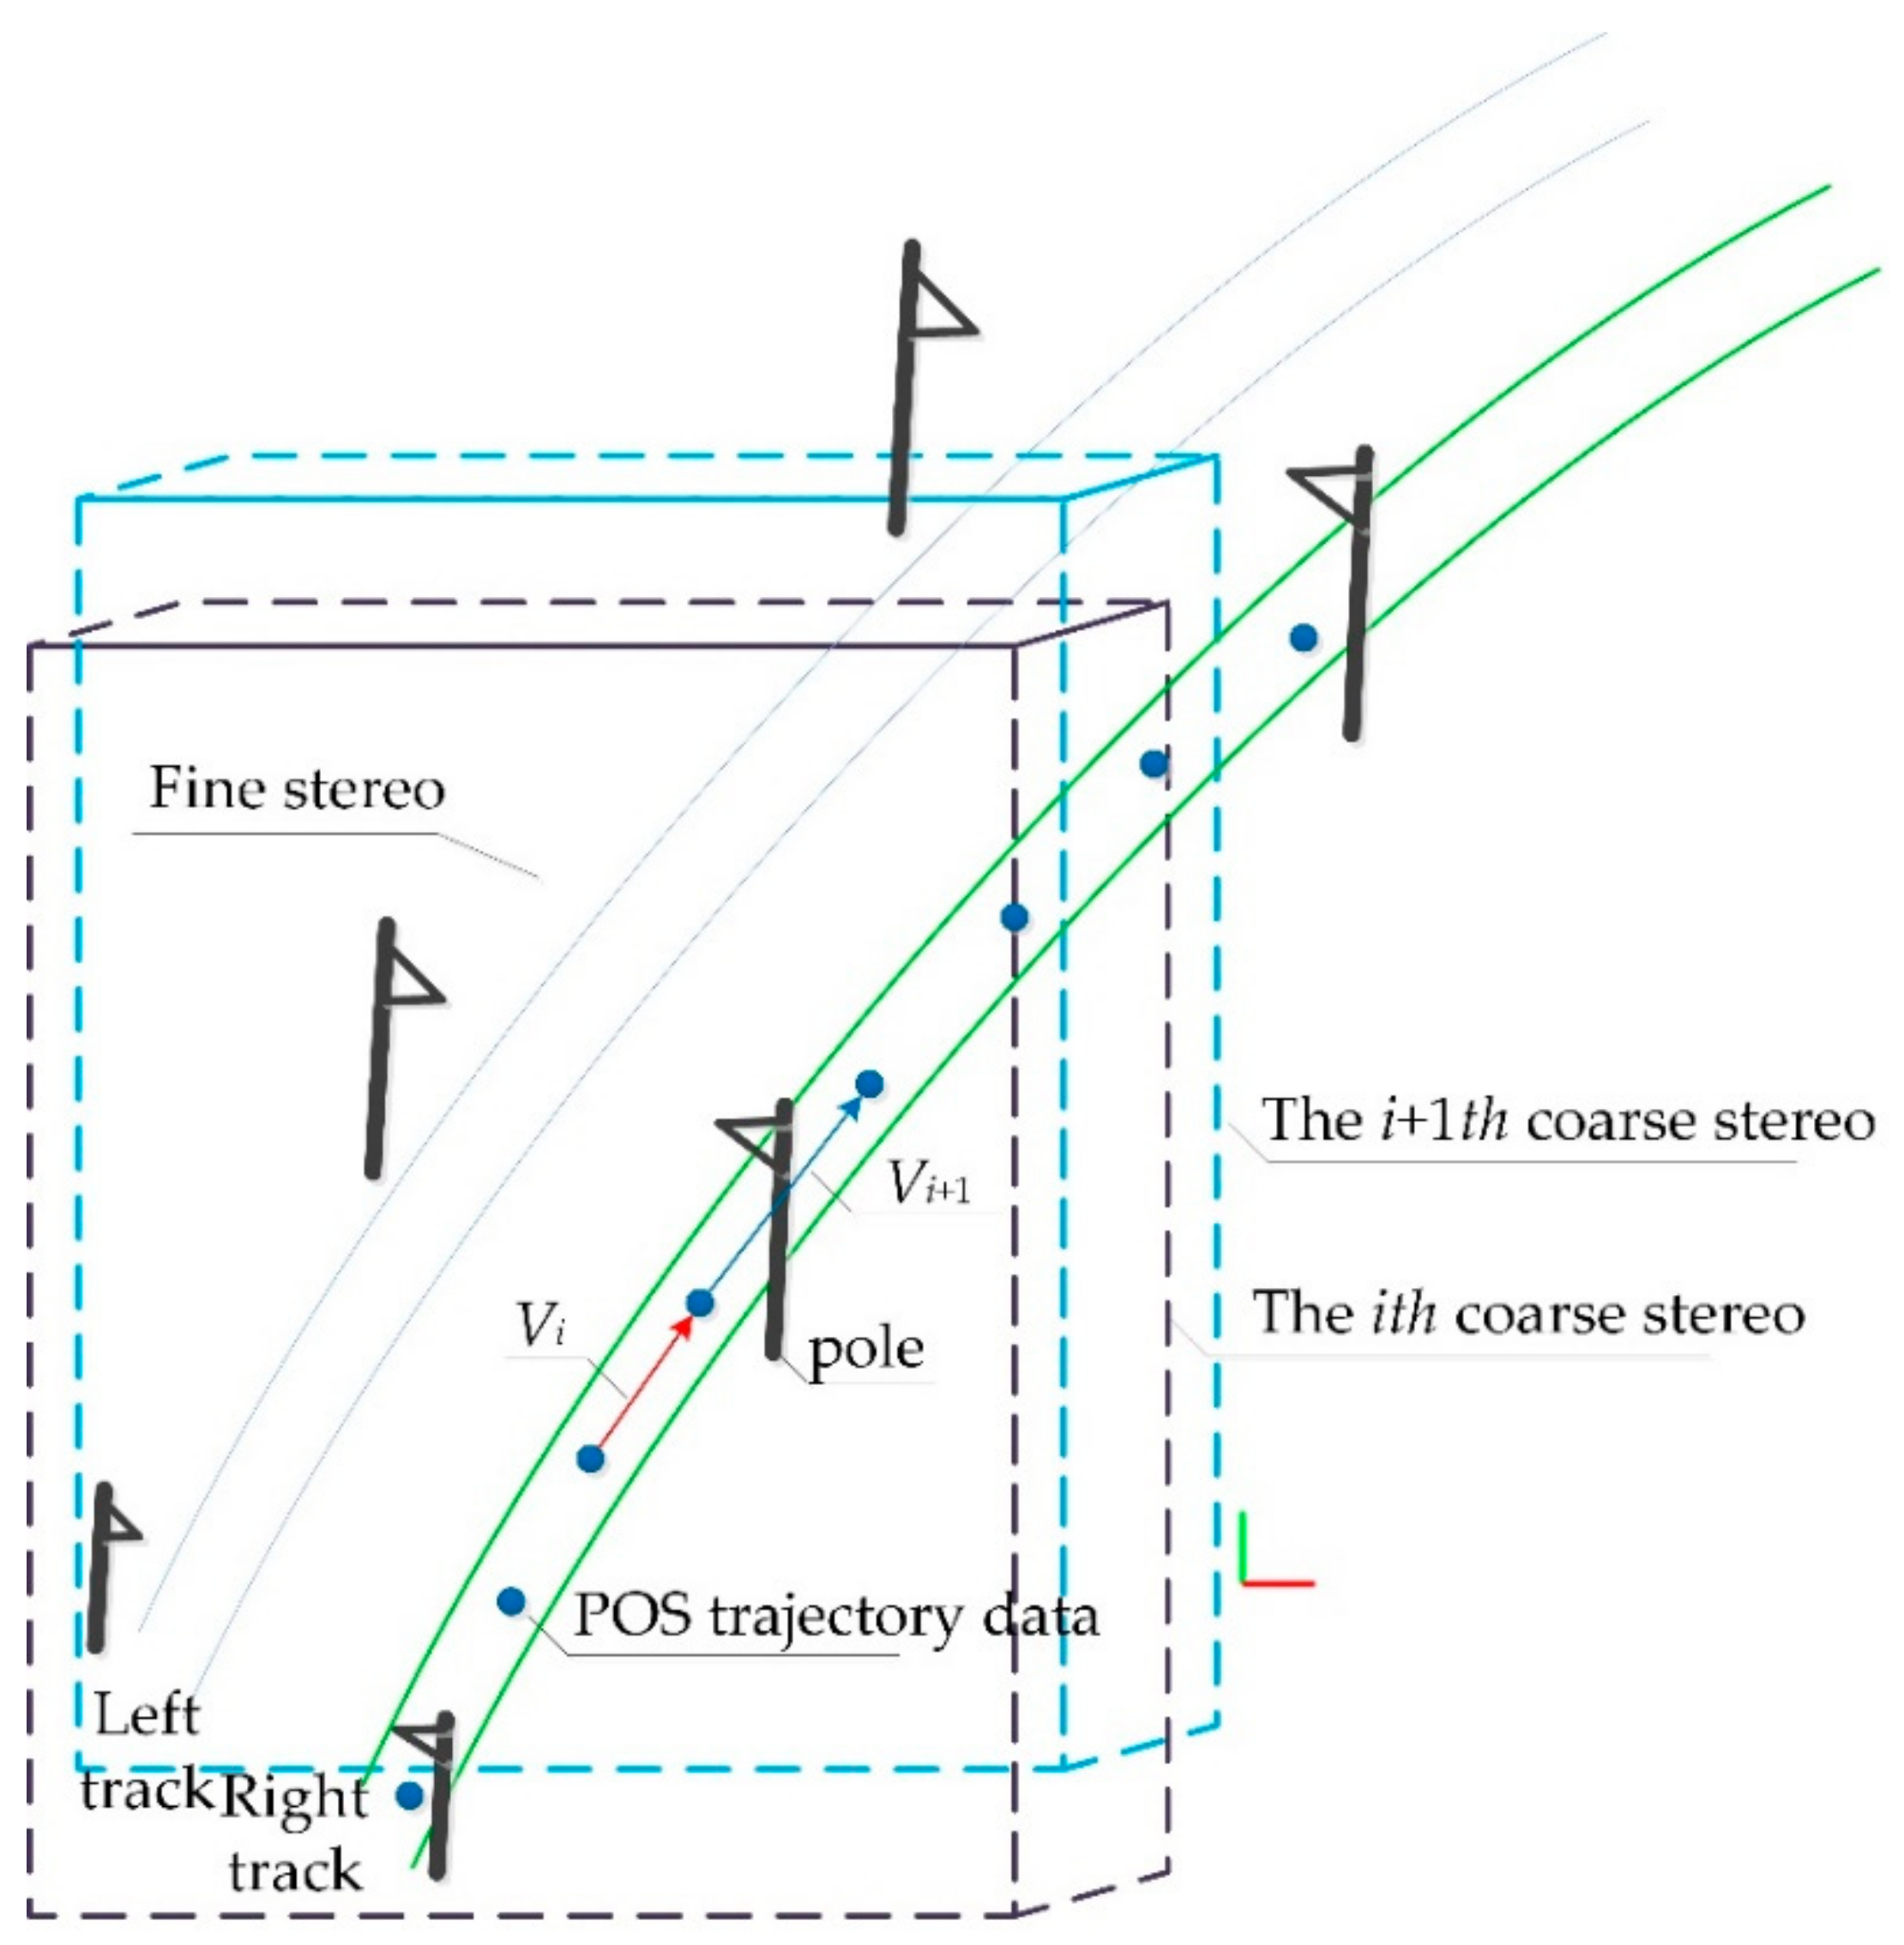
Figure 7) to reduce the computation of point cloud in translation and rotation and to assist in clipping POS trajectory points in a certain range. First, the search range is determined by roughly selecting the 3D box, and the track lines and points within the range are obtained according to this box. Then, the stereo frame is selected to track, cut and extract along the track direction. The method includes four steps (Algorithm 1): double selection stereo frame attitude and positioning, determination of double selection stereo frame offset vector, automatic adjustment of selected frame attitude assisted by POS trajectory data and clipping and extraction of OCS facilities.
Algorithm 1. Automatic extraction algorithm of OCS facilities
Input: Rail region point cloud: C = {Ck}, k = 1, 2, 3, …, M
POS Trajectory lines L = {li}, I = 1, 2, 3, …, N
An initial coarse selection of stereo frame B B o x { min _ point , max _ point }
(1)
Traverse the points in the POS track line, obtain three adjacent track points and calculate the direction vector Vdif between the two points;
(2)
Calculate an initial fine selection of stereo frame C B o x R M a t r i x × m i n B o x + T ;
(3)
Cut and extract the point cloud in the selected stereo frame area and extract the track point cloud CD1;
(4)
Obtain the next track point and recalculate the new coarse selection stereo box and selected stereo box;
(5)
Calculate P o l e D i s , which is the distance between adjacent columns, as the cutting interval distance;
(6)
Recalculate the rotation matrix R M a t r i x and translation T at the next track point, and realize the advance along the track of rough selection solid frame and selected solid frame according to this information;
(7)
When the forward distance of the selected stereo frame is equal to the distance between adjacent columns, carry out the cutting and extraction operations;
(8)
Repeat steps 2 to 7 until the point cloud C in the track area is empty.
Output: Segmented and extracted rail region point cloud data CD = {CDj}, j = 1, 2, 3, …, H
  • Coarse selection of stereo frame posture and positioning
Coarse selection of stereo frame is performed by a bounding box BBox in a 3D scene, and a subset of 3D point cloud meeting the conditions is selected from the scene with this frame as the constraint range, which satisfies the following equation:
B B o x = { min _ point , max _ point } ,
where min_point and max_point denote the minimum and maximum points of coordinate values within the range of the rough-selected stereo frame, respectively.
In general, determining min_point and max_point should consider that the area of the rough-selected stereo frame can contain the area of the track line points and all of the facilities of the catenary. The frame center point should be placed in the middle of the pair of adjacent poles in the XOY projection plane to reduce the selection error caused by translation on the track line. The initial center point will be set artificially from the point cloud. In the process of cutting and extraction, the rough-selected stereo frame moves along the direction of the track line, and the height of BBox is constant. Moving distance is determined according to the distance between the adjacent poles.
  • Fine selection of stereo frame posture and positioning
The fine stereo frame is cut along the track direction, and the catenary facility point cloud is extracted by clipping box C B o x from the track data with the frame along the track, which satisfies the following equation:
C B o x = R M a t r i x × m i n B o x + T ,   R M a t r i x = x 1 , y 1 , z 1 x 2 , y 2 , z 2 x 3 , y 3 , z 3 ,   T = t r x , t r y , t r z ,
where minBox is the minimum stereo frame for cutting a pair of OCS facilities, RMatrix is the rotation matrix and T is the offset vector. The frame is transformed along the track by rotating and translating the minBox. The fine stereo frame should be of an appropriate length, width and height, and the minimum cutting stereo frame should be contained completely in the coarse selection box BBox. The long side of the finely selected stereo frame should be parallel to the track, and the width should be vertical to the track.
  • Determination of distance offset of dual selection stereo frame
The offset vector of the center point of the double selection stereo frame along the rail line should consider terrain fluctuation and obstacle blocking. The offset vector T in Equation (2) of the adjacent stereo frame includes the offset direction and offset distance.
The offset distance along the railway line in the scene needs to be adjusted according to the distance between adjacent poles, which can be achieved as follows: the center position of each column from the scene { C e n t e r p o i n t 1, ..., C e n t e r p o i n t i, ..., C e n t e r p o i n t n} is extracted and then projected onto the XOY plane, and then the distance from the center of the adjacent column P o l e D i s [ i ] is calculated to obtain the offset distance information of the dual selection stereo frame:
P o l e D i s [ i = D i s ( C e n t e r p o i n t [ i + 1 ] c e n t e r p o i n t [ i ) , i = 1 , , N 1 ,
where Dis(·) is a function of finding the Euclidean distance of the XOY plane between two points. C e n t e r p o i n t [i] refers to the coordinate information of the center point of the column i.
When the coarse selection stereo frame (Figure 7) is moving from the ith frame (red box) to the i+1th frame (blue box), the offset direction V d i f can be determined by calculating the vector difference formed by the POS data:
V d i f = V i + 1 V i ,
where   V i is the direction vector of the POS track in the ith frame and V i + 1 is the direction vector of the POS track in the i + 1th frame.
  • Track data-assisted posture auto-adjustment for selected stereo frame
When the double-selected stereo offset vector is determined, the selected stereo box needs to be shifted to the next area to be clipped. First, the double-selected stereo box is shifted according to the offset vector. Then, the current double-selected stereo box is updated. The center of the currently selected stereo box is re-calculated to become the new center of rotation.
The carefully selected stereo frame posture should change with the fluctuation of the railway track and the change in the curve in order to be more helpful in clipping and extracting the contact network facilities that could meet the accuracy requirements. The complete transformation information, including the center of rotation, translation and rotation at i + 1 of the selected stereo frame, can be obtained.
  • Clipping and extraction of contact network facilities
The selected stereo box of the OCS facility can be generated by clipping the original point cloud using the clipping box (CBox). The clipped data will be stored separately for training and prediction based on the deep learning network model.

3.3. Deep Learning Based Semantic Segmentation

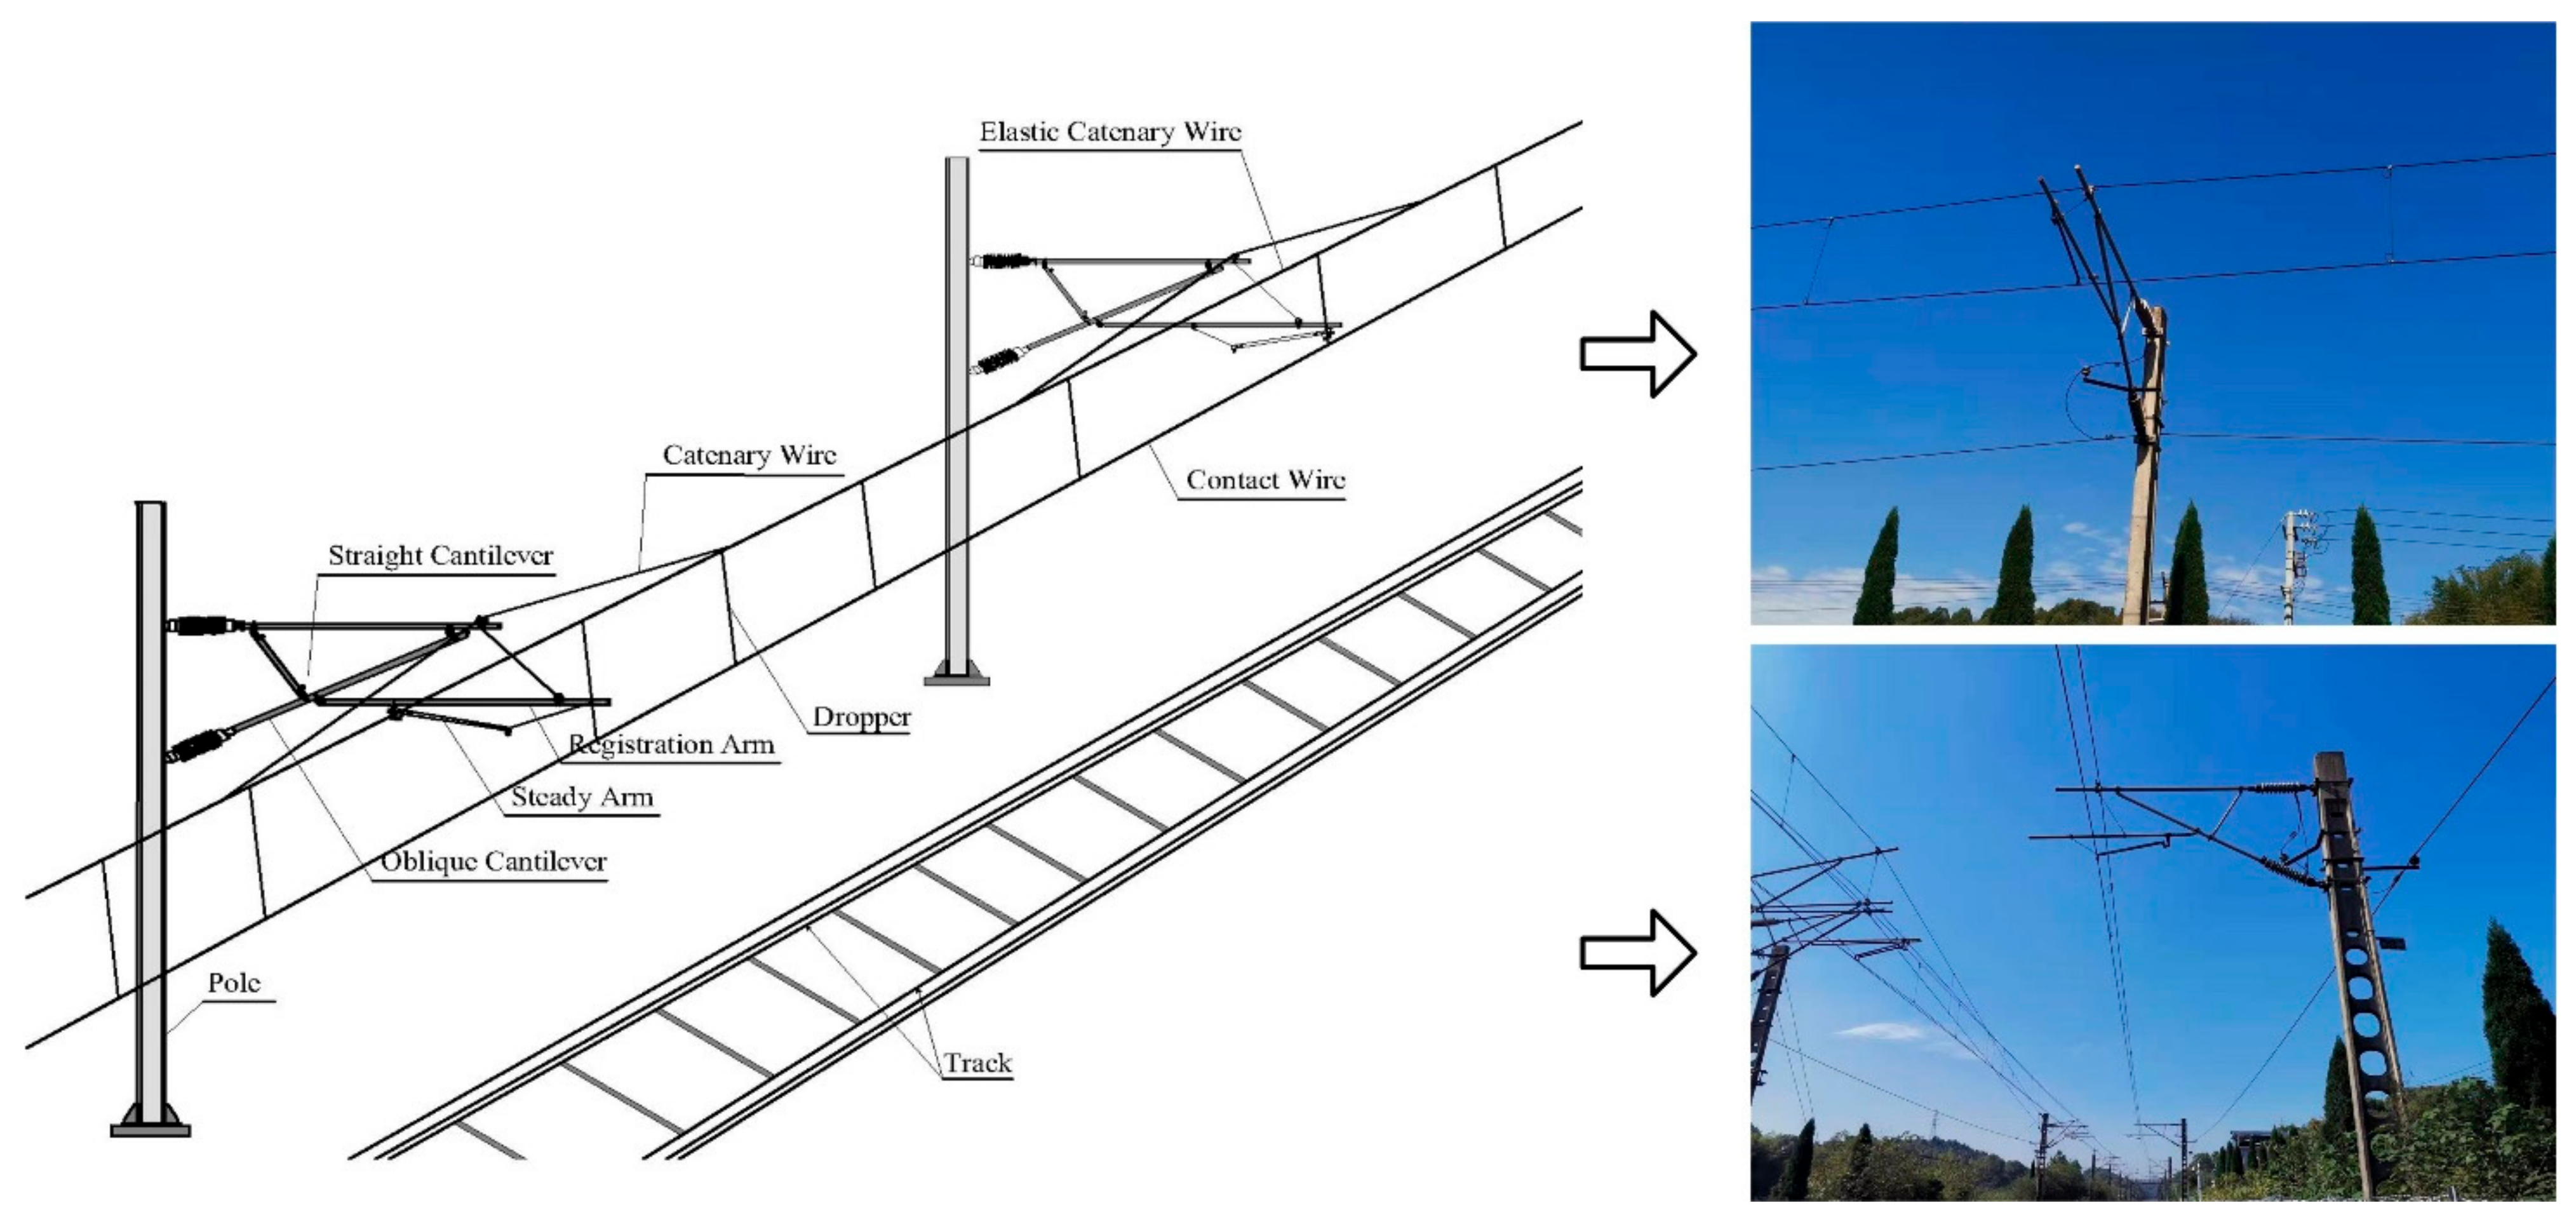
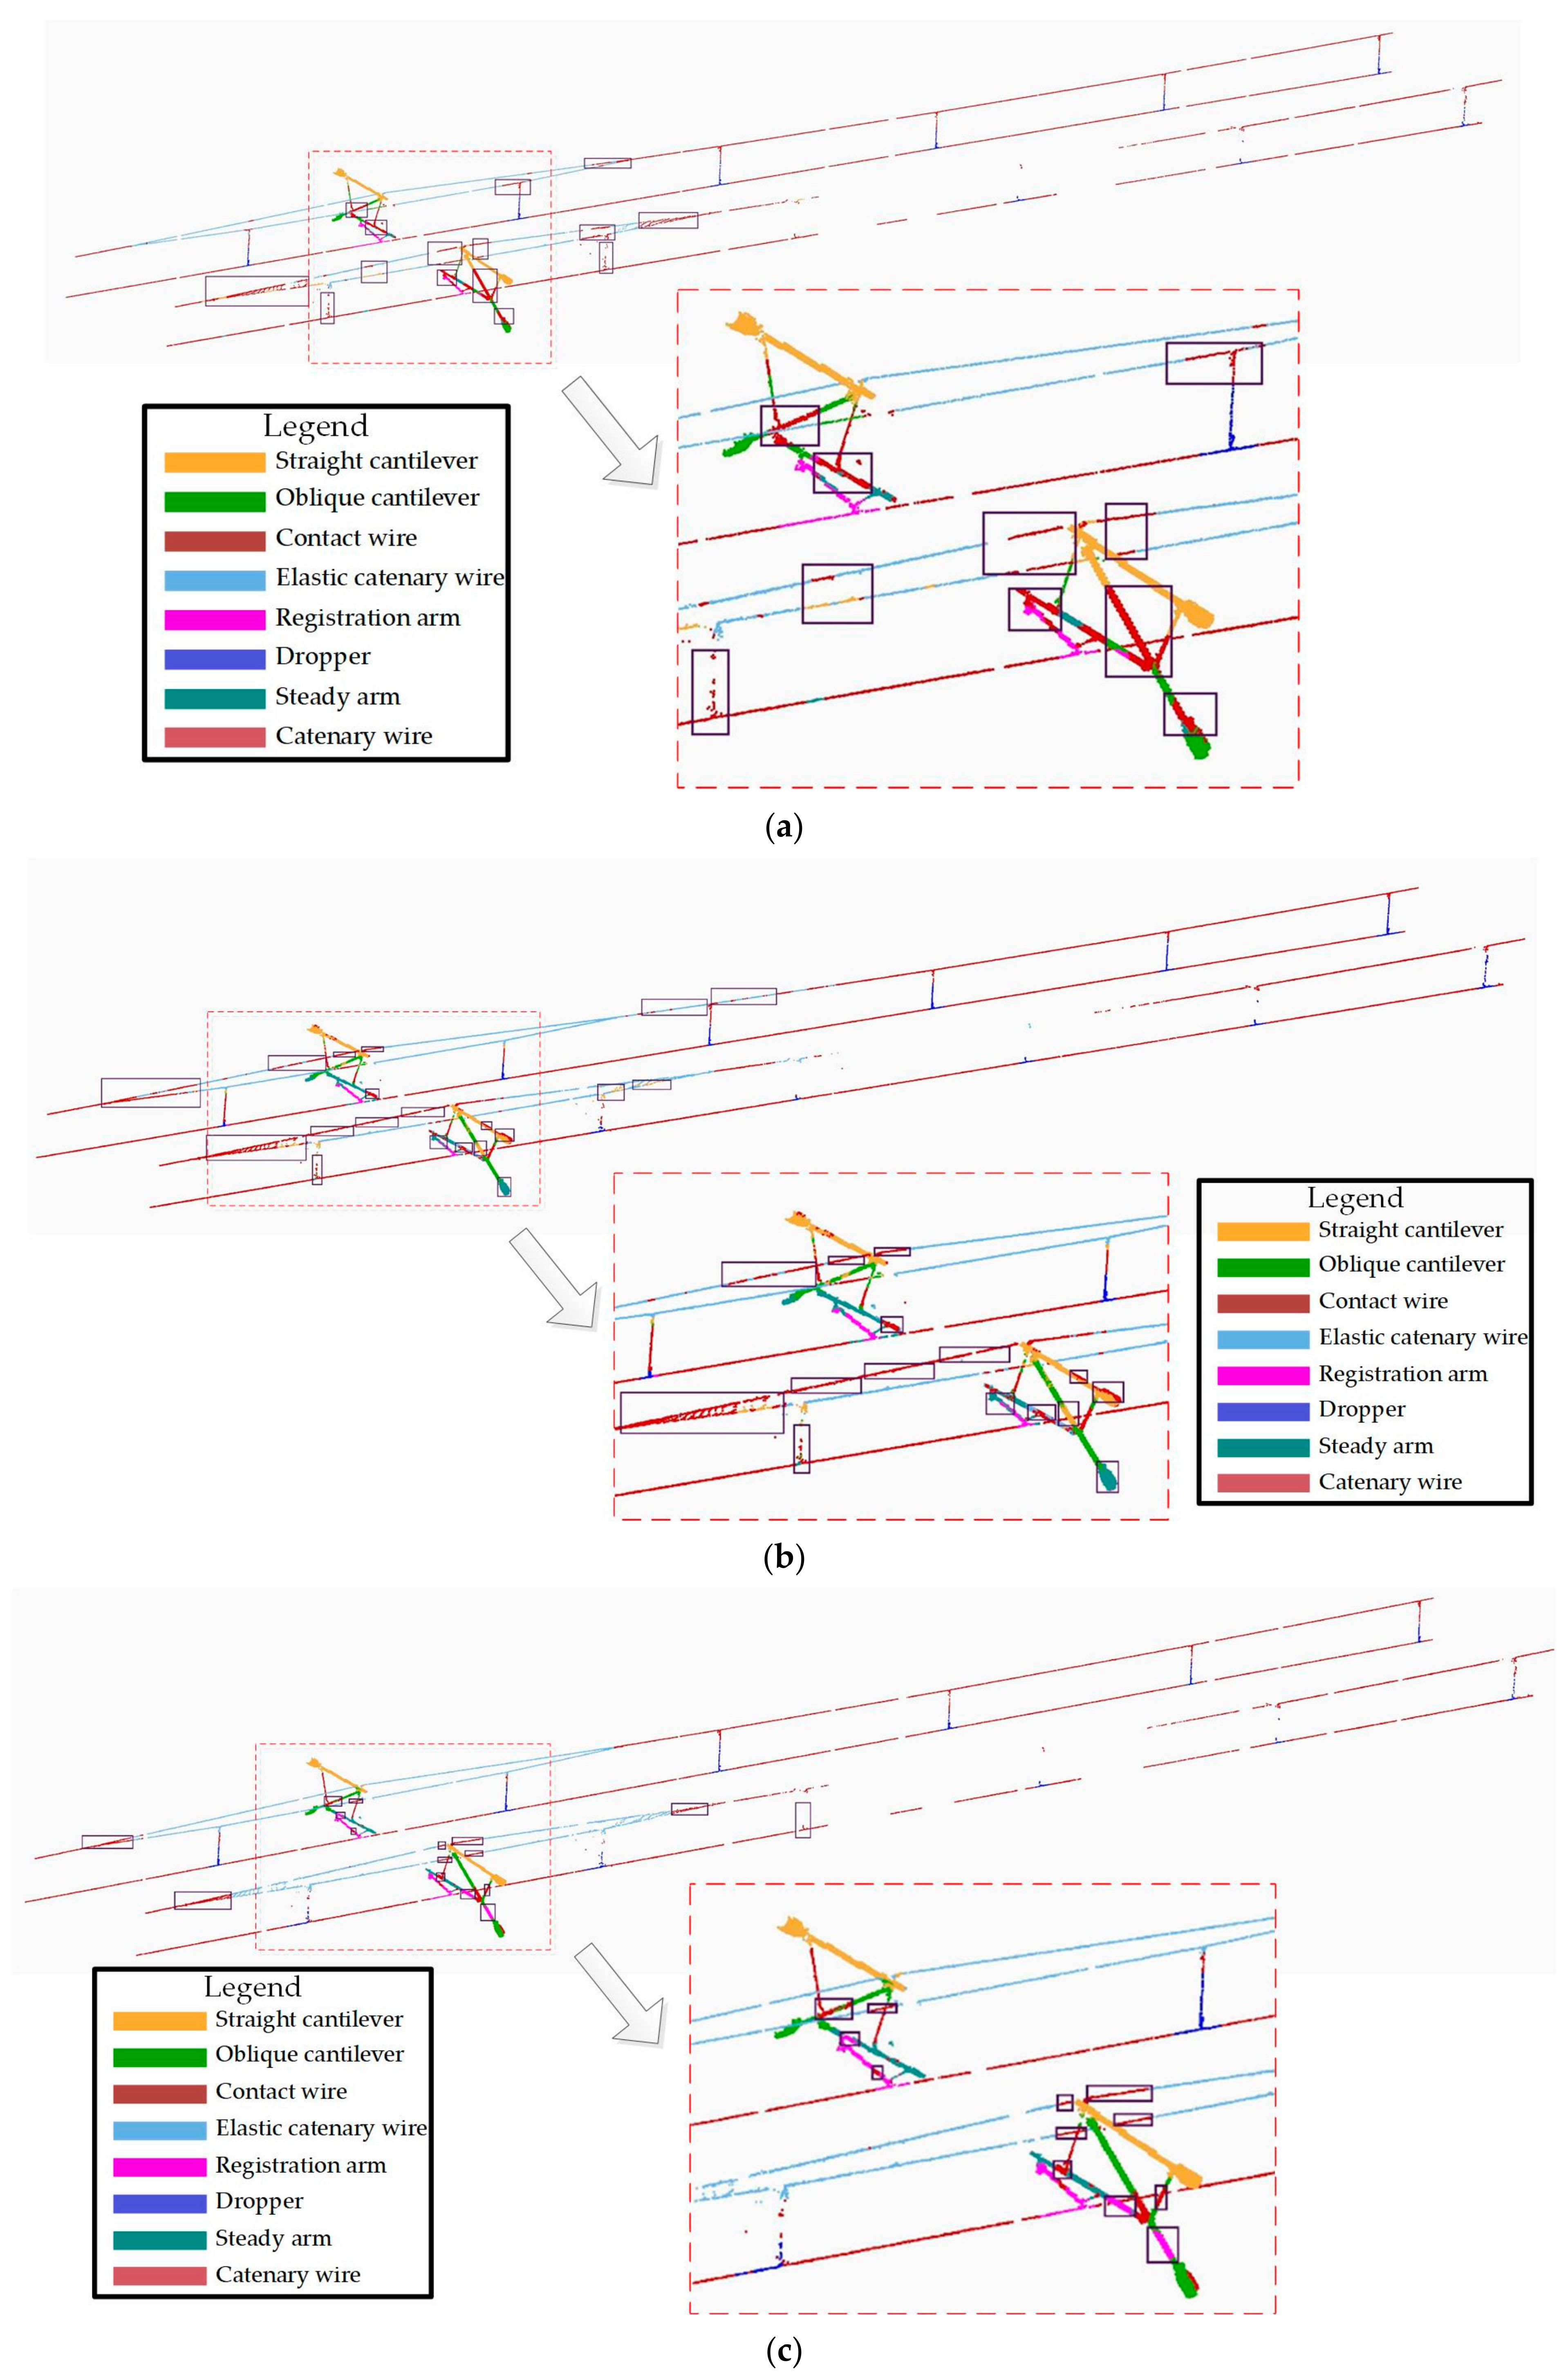
After the automatic search and extraction of OCS facilities, they are segmented into eight categories through deep learning, including oblique cantilever, straight cantilever, elastic catenary wire, catenary wire, dropper, contact wire, steady arm, registration arm, etc. Manual labels of the point cloud data are generated to train the model. Deep learning network architecture needs to be redesigned considering the relative imbalance of point cloud density and percentage among different categorizations. Spatial and channel attention mechanisms are introduced in the construction of a deep learning network. A semantic segmentation model based on multi-scale feature fusion and attention mechanism (MFF_A) is proposed to classify contact network facilities. First, a feature extraction method based on efficient channel attention (ECA) and convolutional block attention module (CBAM) is proposed to enhance the important features in point clouds from channels and spatial domains. Then, a residual refinement structure based on OCS preliminary results is introduced, which refines OCS results through feature extraction and fusion of multi-scale sensing fields. The architecture of the re-designed network is shown in Figure 8.
The proposed MFF_A in this paper takes PointNet as the backborn structure, while removing the T-shaped input feature transformation from the original structure. Instead, the network adopts a multilayer perception (MLP) module (two or more convolution layers form weight sharing) to extract point cloud features, and adopts the ECA channel attention mechanism to realize the channel enhancement of extracted features. The shallow features processed in ECA are enhanced by CBAM, and the multi-layer shallow features and deep features are fused. The preliminary results are then entered into the refine structure to generate the final refined results.

3.3.1. ECA

Previous studies have shown that embedding the attention module into CNN can result in significant performance improvement (e.g., SENet [30], CBAM [31], ECANet [32], EPSANet [
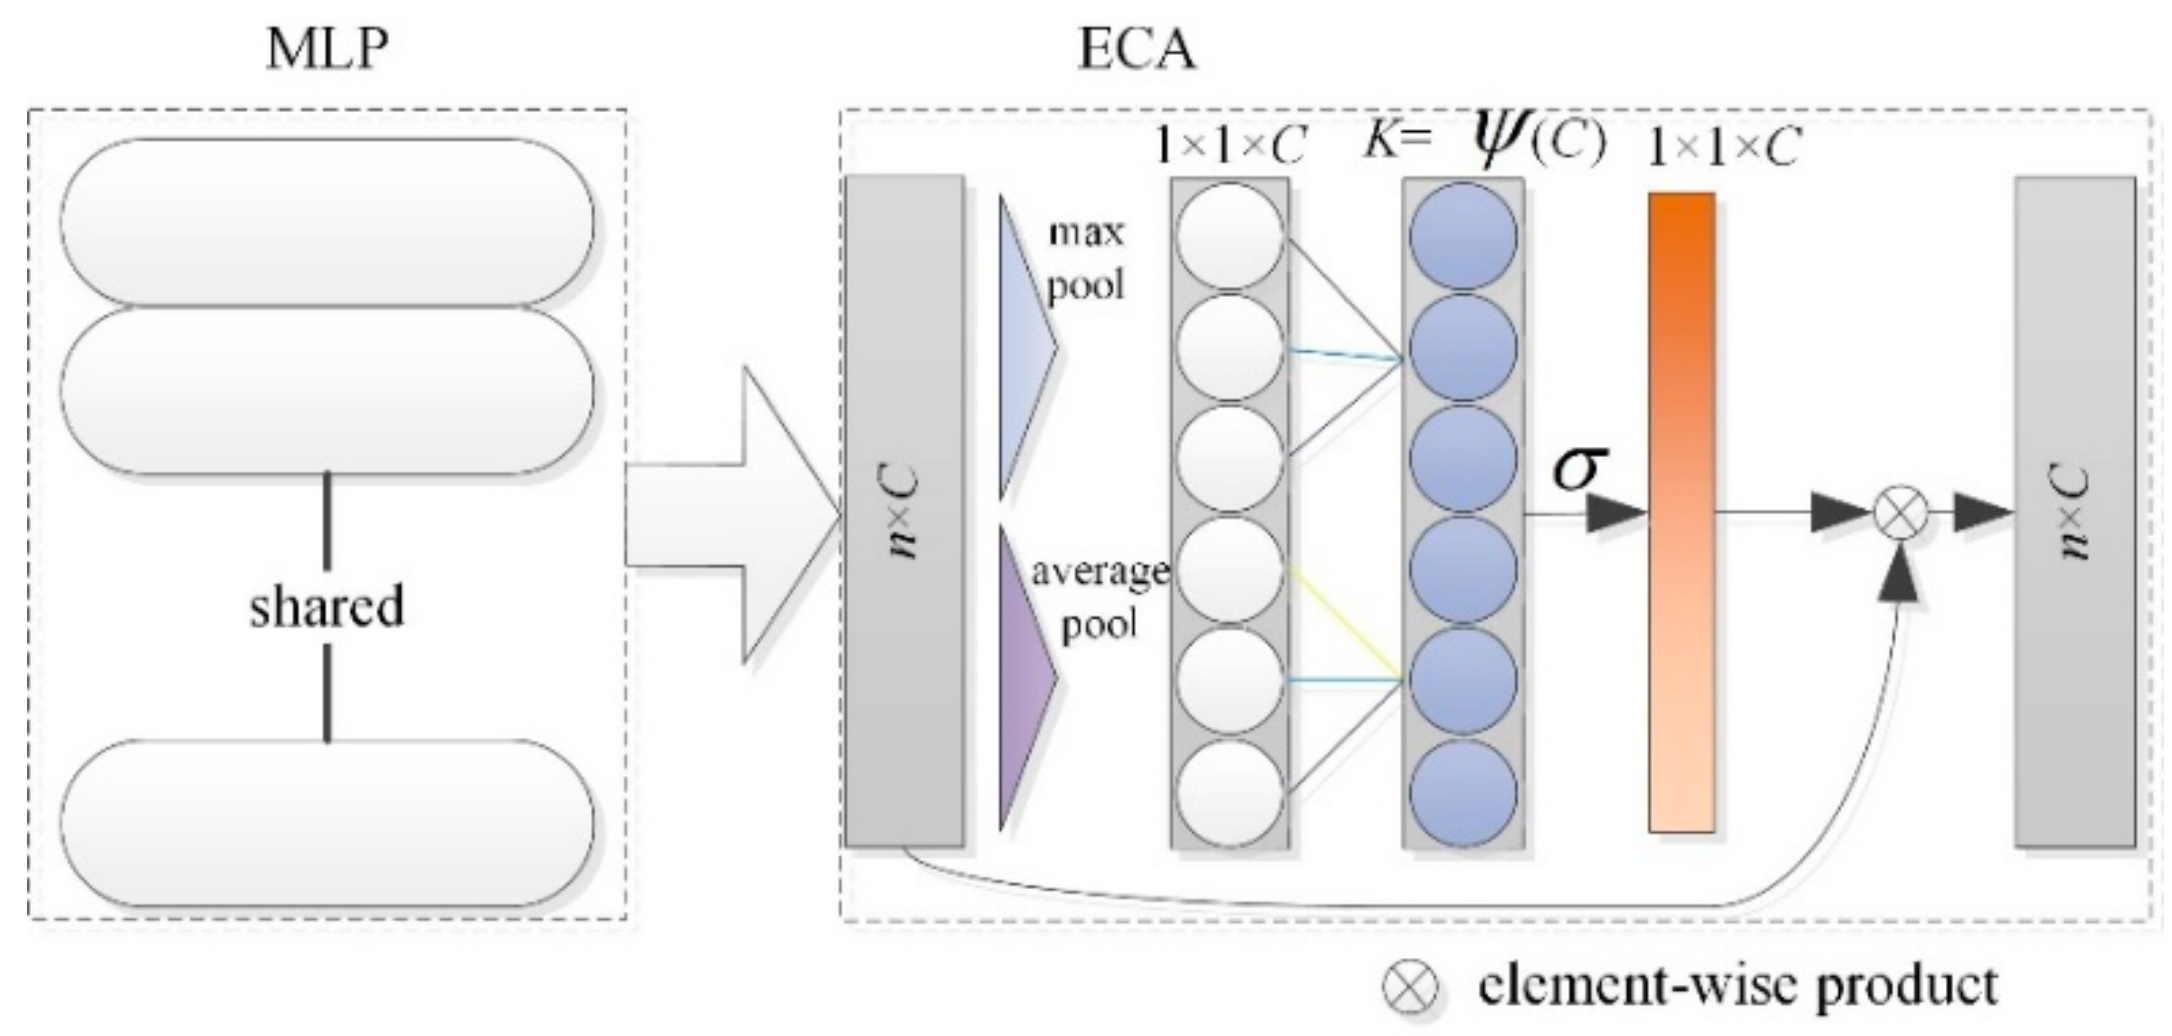
33]). In the traditional PointNet network structure, shared weight MLP is used to extract the point cloud features, and different numbers of convolution kernels are combined to achieve dimensionality enhancement or reduction in the extracted features. The convolution kernel size is (1,1). The introduction of ECA improves the ability of important feature extraction in global feature extraction (Figure 9). The original ECA module is improved to combine global average pooling (GAP) and global max pooling (GMP).
K = ψ C = l o g 2 C γ + b γ o d d ,
where |t|odd take the nearest odd number to t. In this paper, γ and b are set to 2 and 1, respectively. The ψ function causes the larger channel to have long-distance interaction, and vice versa.
The multi-dimensional feature map obtained after the MLP feature extraction of shared weight is taken as the input of the ECA module, and the consistency between the input and output feature dimensions can effectively prevent the reduction in the feature dimensions. In addition, a grouping convolution strategy is applied to capture cross-channel interactions. Given a fully connected layer, grouping convolution divides it into multiple groups and performs linear transformation independently for each group. Therefore, the weight calculation is as follows:
W i = σ ( j = 1 k α i j y i j ) , y i j Ω i k ,
where σ   represents the activation function and Ω i k   represents a set of adjacent channels. In Equation (6), cross-channel local interactions are captured. Such local scale constraints effectively avoid cross-channel interactions, thereby improving the efficiency of the network model. In this way, each channel attention module affects the K*C parameters. All channels share the same learning parameters to reduce the model complexity further and to improve efficiency. The final structure of the ECA module is as depicted in Figure 9.

3.3.2. CBAM

In encoder–decoder network architecture, although a normal network jumping connection can improve the fusion of shallow features and deep features, it cannot effectively reduce the degradation of neural networks. CBAM could solve the problem [
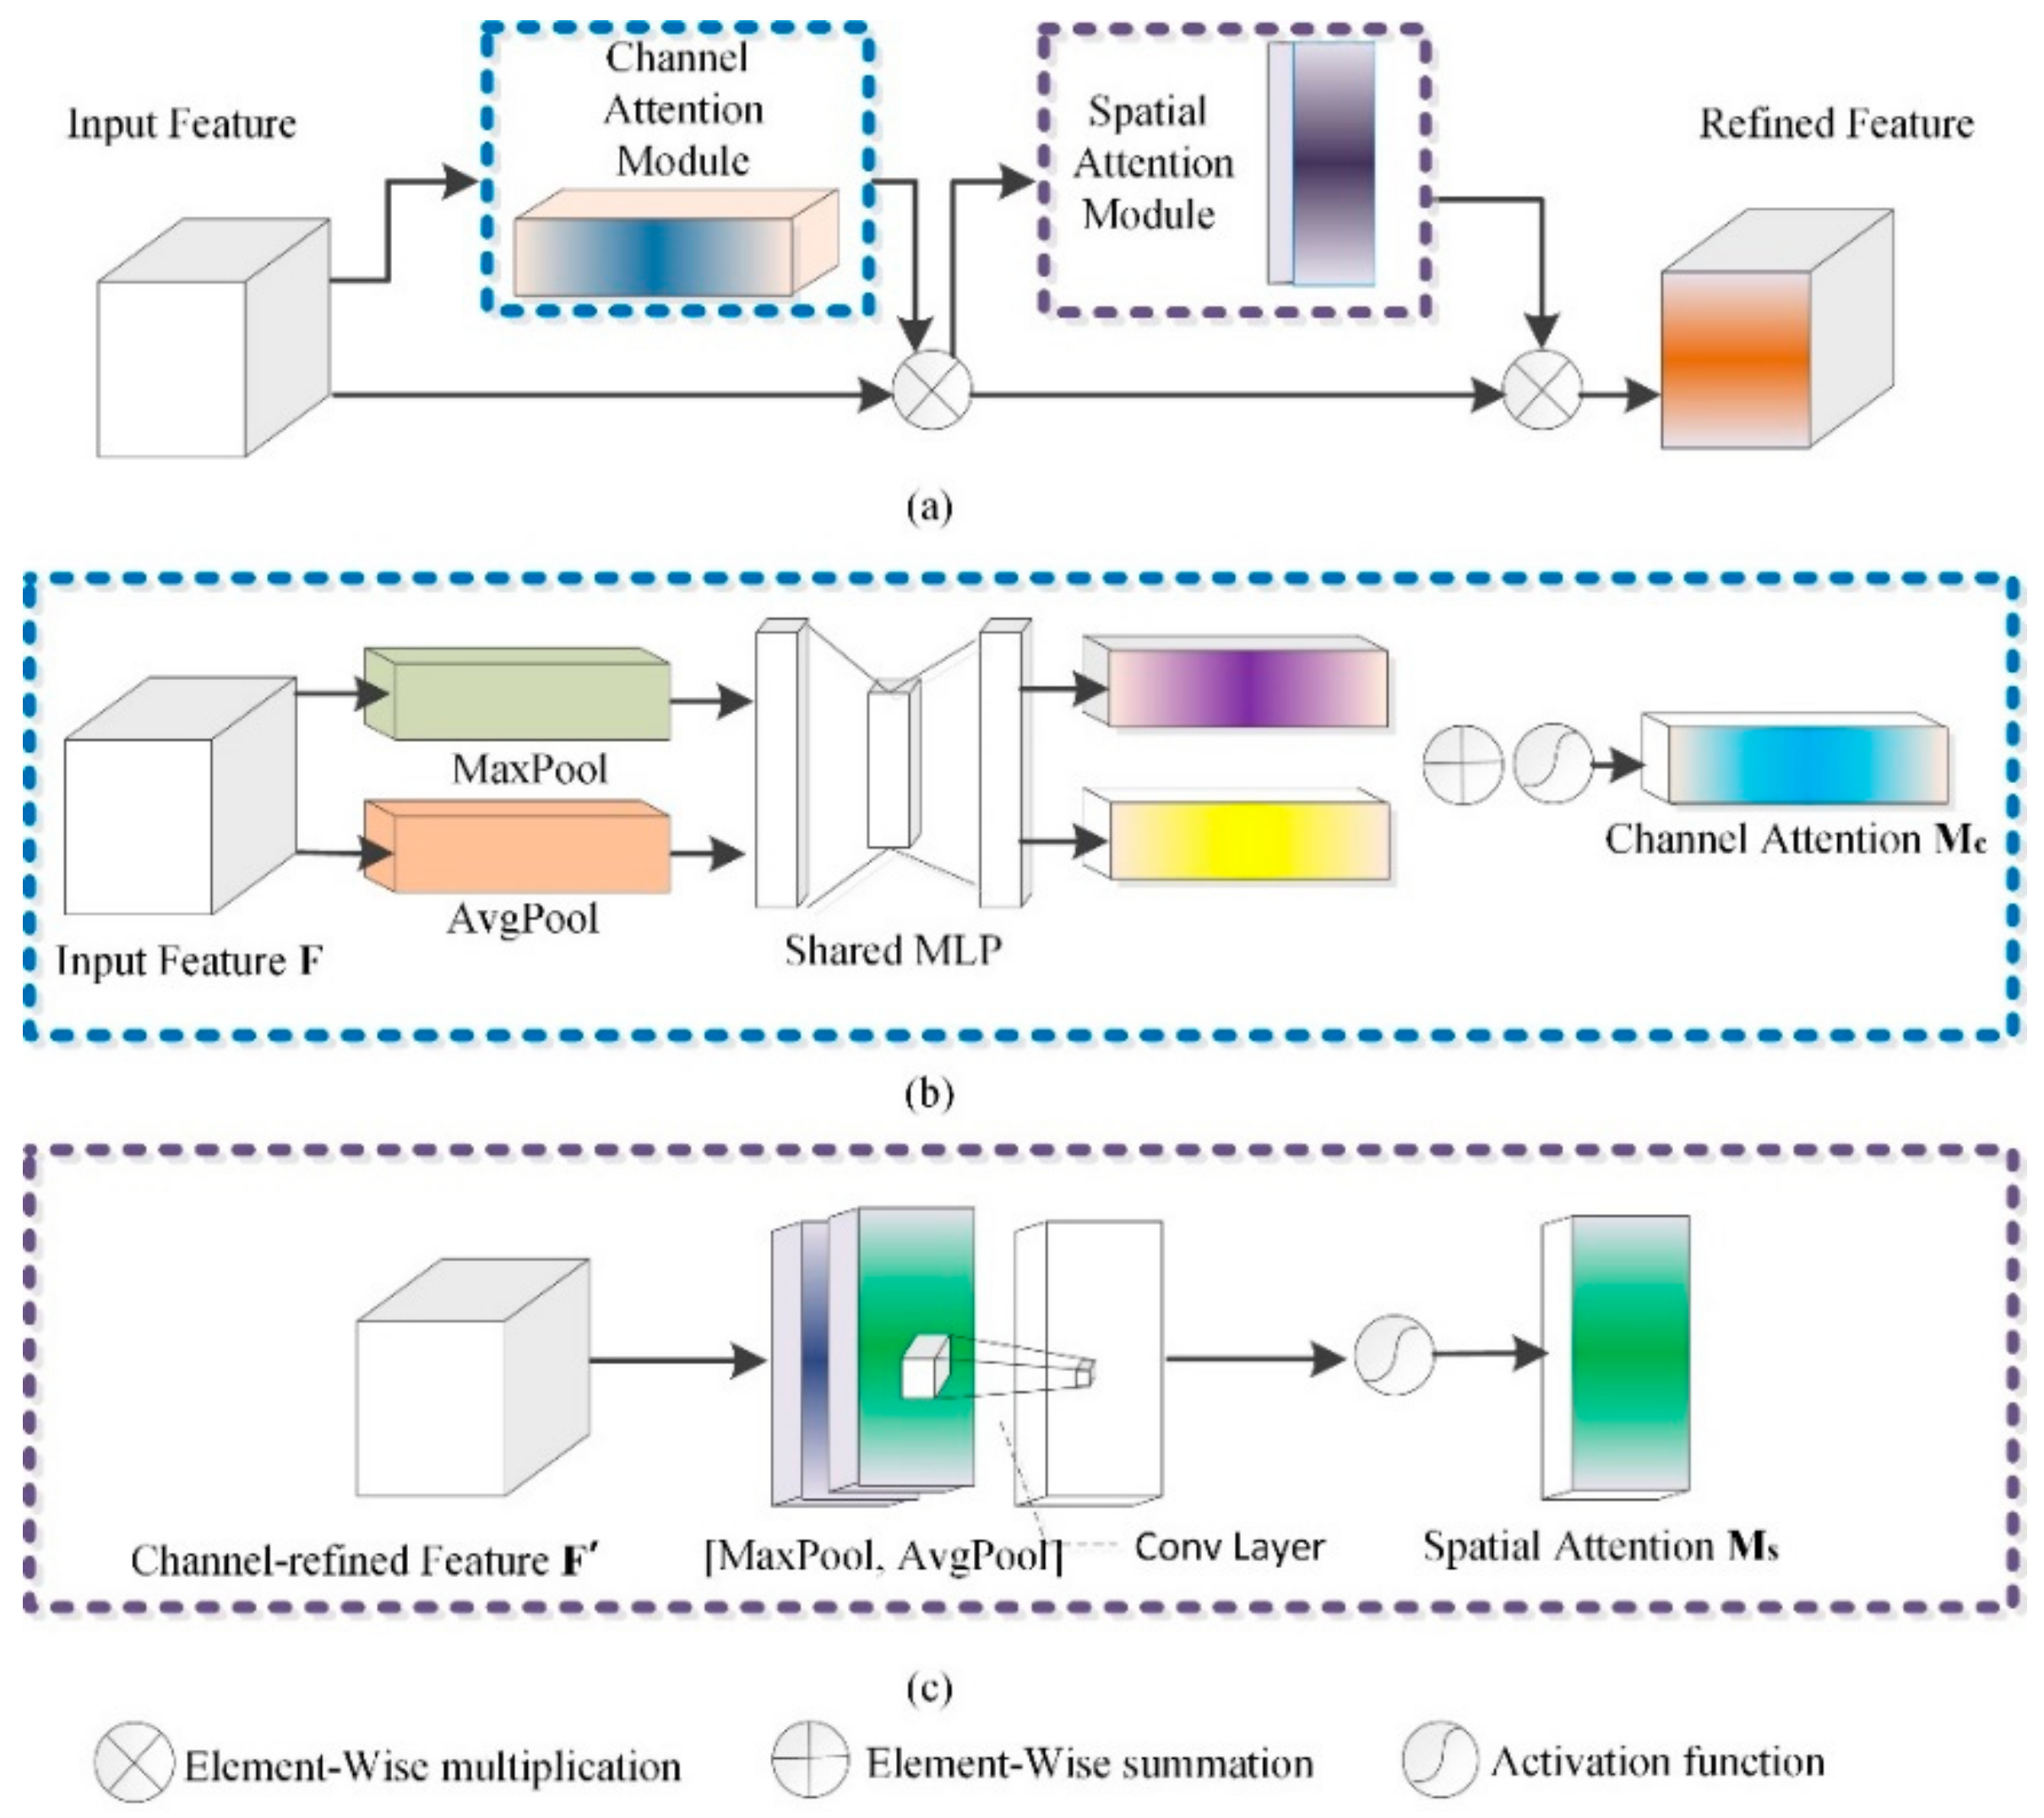
31]. Due to the fact that the MLP operation in this study extracts features by mixing cross-channel and spatial information, a CBAM-based jump connection can be adopted to strengthen important features. Figure 10 shows the structure of the CBAM. The input features pass through the channel and spatial attention mechanism so that each branch can learn “what” and “where” on the channel and spatial axis, respectively, which strengthens effective transmission.
(1)
Channel attention submodule in CBAM
The implementation of the channel attention structure in CBAM is as follows. First, the average and maximum pooling operations are used to aggregate the spatial information of feature mapping for input feature F, and two spatial context descriptors, average pool feature F a v g c and maximum pool feature F m a x c , are generated. The two descriptors were then fed into a shared MLP structure to generate a channel attention feature map M c C × 1 × 1 . The hidden activation size is set to C / r × 1 × 1 , where r is the reduction ratio, to reduce the number of parameters. After the shared network is applied to each descriptor, the output feature vectors are combined by element accumulation. The calculation of channel attention is shown in Equation (7):
M c F = σ ( W 1 ( W 0 ( F a v g c ) ) + W 1 ( W 0 ( F m a x c ) ) ) ,
where σ represents the activation function and W 0 and W 1 refer to the weight of MLP, which satisfies the condition W 0 C / r × C and W 1 C × C / r . W 0 and W 1 , the input feature and subsequent ReLU activation function, share the weight.
(2)
Spatial attention submodule in CBAM
The GAP and GMP are adopted to pool channel reinforcement feature F′, and the two are connected to generate an effective feature descriptor for spatial information. On the connected feature descriptors, convolution layer is used to generate spatial attention feature maps M s F H × W and encode them to emphasize or suppress features. Two types of feature graphs are generated by aggregating the channel information of feature graphs through two pooling operations: F a v g s 1 × H × W and F m a x s 1 × H × W . The channel attention mechanism is adopted for each average and maximum pooling feature, which are then connected and convolved through a standard convolution layer to generate 2D spatial attention feature maps.
M s F = σ ( f 7 × 7 ( [ F a v g s ; F m a x s ] ) ) ,
where σ represents the activation function and f 7 × 7 represents a 7 × 7 convolution.

3.3.3. Refine Structure

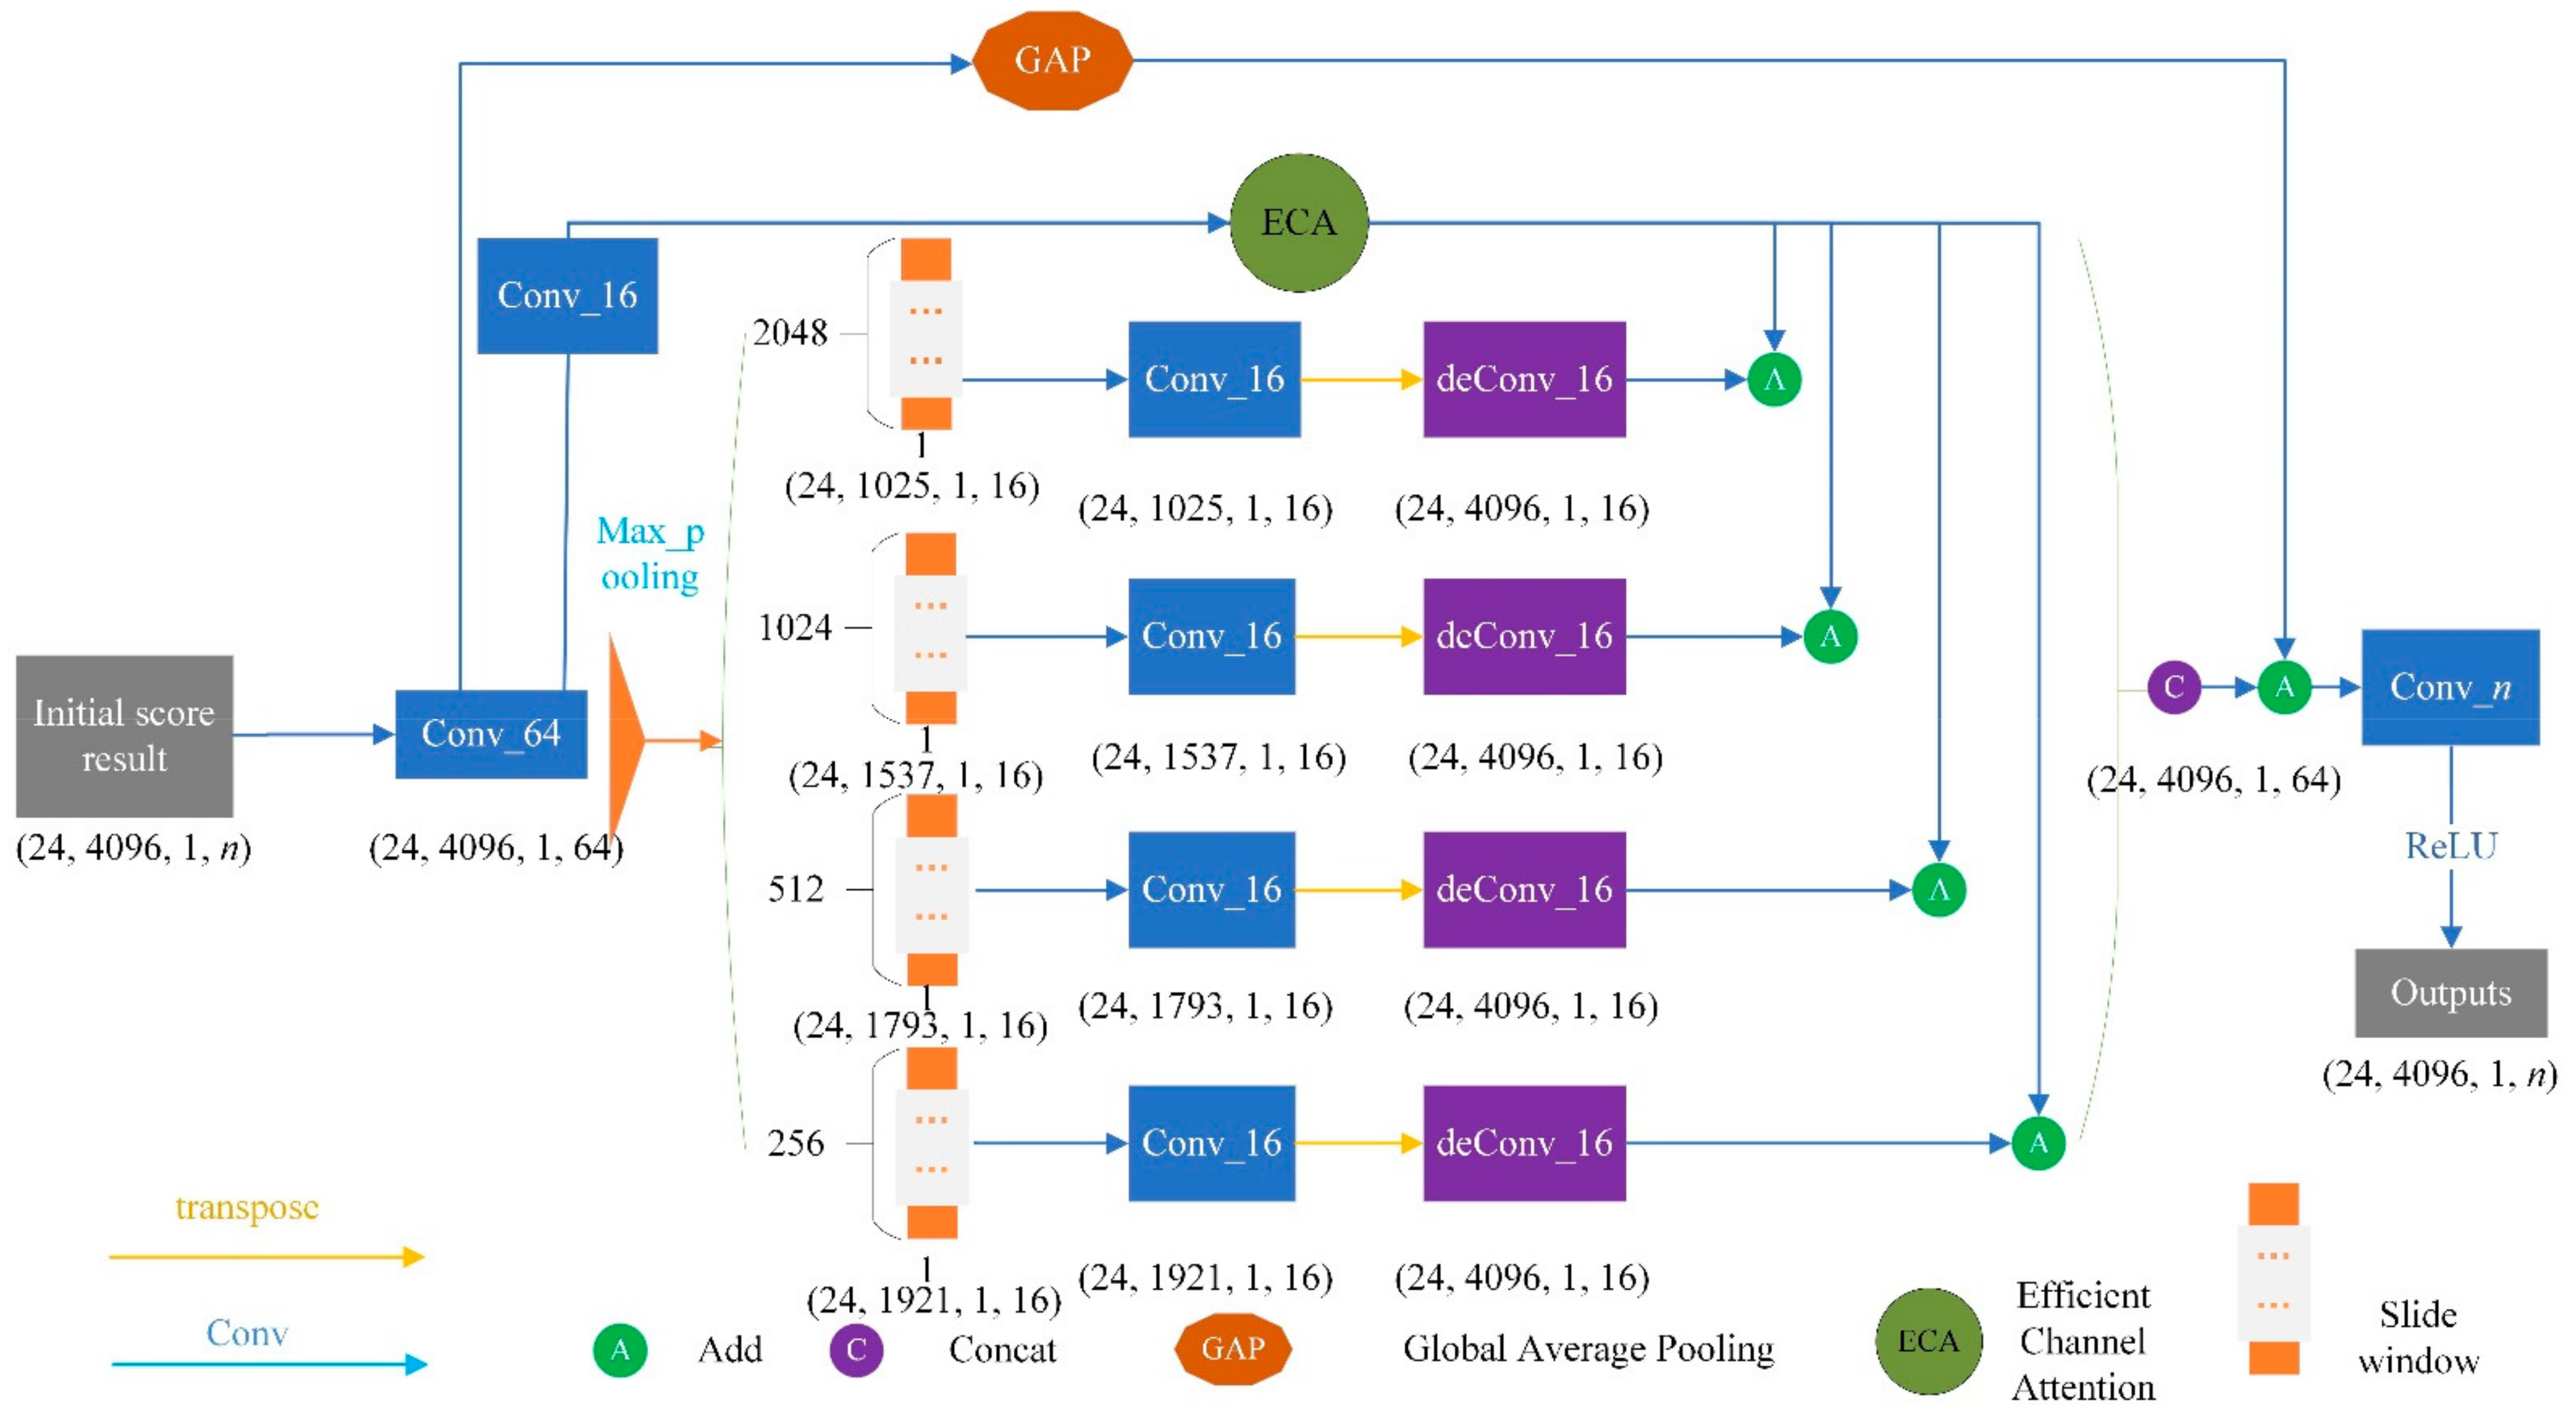
Context is very important in complex scene analysis. Many prediction networks may ignore small and medium-scale targets in complex scenes if the contexts are not considered. Meanwhile, large-scale targets may exceed the receptive field of network feature extraction, which results in discontinuous segmentation. The pyramid pooling module (PPM) structure can effectively obtain the cloud feature information of contact points with different scales, which is conducive to the identification of small target objects [34,35]. Thus, PPM is introduced into this study. Figure 11 shows the detailed PPM structure in proposed MFF_A network, which consists of four pooling processes with different kernel sizes of (256, 1), (512, 1), (1024, 1) and (2048, 1). This makes the PPM able to generate multi-scale features of OCS. First, the PPM obtains the feature map through the convolution operation and obtains the feature map of different scales through the global maximum pooling operation. Then, the characteristic tensors of the different scales are convoluted to reduce the channel. Finally, the transposed convolution operation is carried out to facilitate the superposition and fusion of these feature tensors in the later stage. In addition, refinement process is also used, which puts the initial segmentation result back into the PPM. This PPM refinement can obtain the feature information of OCS facilities based on context with the spatial relationship, and can achieve a fine classification of OCS segments.

3.3.4. Channel Feature Enhancement

The feature enhancement strategy adopted in the proposed MFF_A starts from two aspects. On the one hand, the feature channel is transformed from the original 64 to 16 through the convolution layer, and the ECA module is introduced to strengthen the learning of channel features and to improve the expression ability of the feature channel in important features. Then, the feature enhancement results are superimposed with the feature extraction results of each scale in PPM. Finally, the features of these four scales are superimposed and fused through and connected to realize the enhancement and fusion of multi-scale features. On the other hand, the average pooled feature tensor of the feature tensor (24, 4096, 1, 64) is obtained through the GAP module, which is then superimposed with the multi-scale feature fusion tensor obtained in the previous step to achieve the goal of feature enhancement. This channel feature enhancement module adds only a small number of parameters to obtain obvious performance gain.

3.4. 3D Model Reconstruction and Parameter Detection of OCS

The 3D model of various components of OCS is reconstructed after the deep-learning-based semantic segmentation from the point cloud. We use piecewise straight line fitting for contact wire and dropper; cylindrical fitting for the oblique cantilever, straight cantilever and registration arm; and cube fitting for the steady arm.
As an important component of the catenary structure, the steady arm and the contact wire interact directly with the pantograph to complete the current collection of the train. The slope of the steady arm is essential to the pantograph contact performance and operation safety [36]. In the process of rapid train operation, the vibration-induced effects caused by pantograph coupling will usually loosen the bolt and nut structure of the positioner, resulting in an abnormal slope value of the steady arm. The abnormal slope value will accelerate the wear of the pantograph and hit the steady arm, which will affect the current collection quality of the pantograph. Therefore, the normalized detection of steady arm slope has significance in ensuring the safe operation of the train.
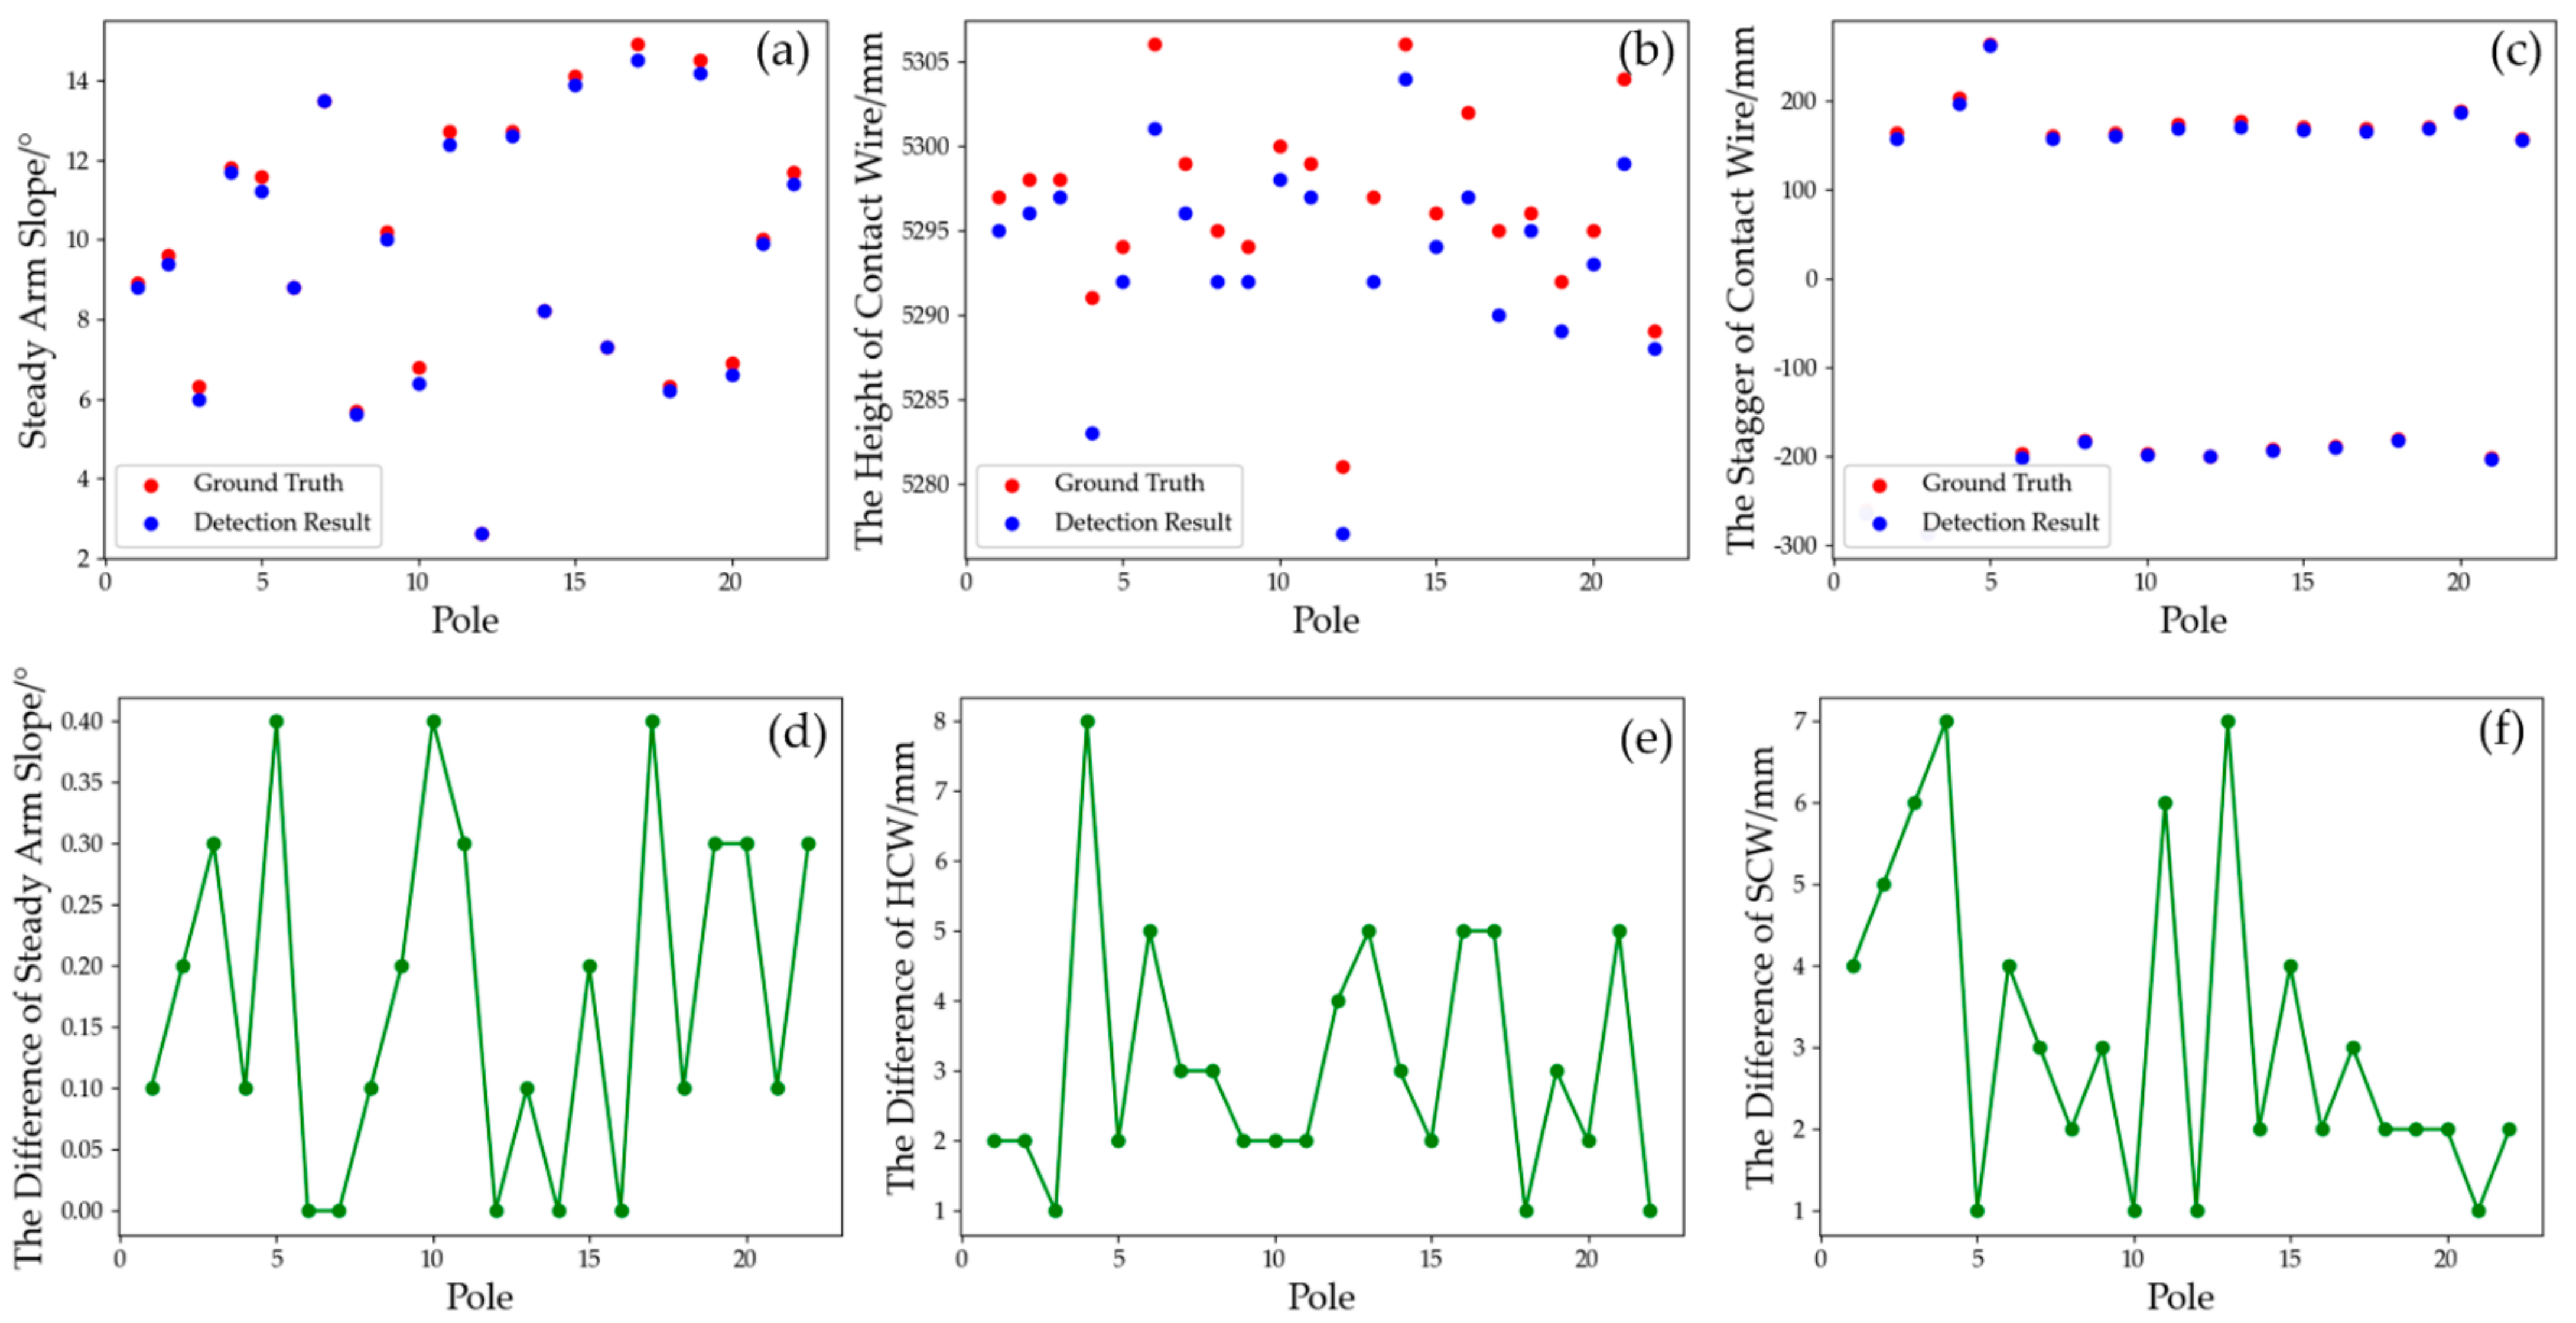
Catenary geometric parameters, such as contact wire height, stagger value and steady arm slope angle, are measured based on the 3D modelling results. The contact wire height measurement uses the elevation difference between the reconstructed suspension point and the track centerline. Stagger value in a straight-line section is measured as the distance from the vertical projection of the contact wire to the centerline of the track line, and the reconstructed contact line model parameters are defined by Equation (9).
a = m + h × H L ,
where a denotes the stagger value of the catenary, m denotes the horizontal distance between the contact wire of locating point and line center, h denotes the superelevation of the outer rail, H denotes the height of the contact line and L denotes gauge.
The steady arm slope can be calculated through iterative closest point (ICP) registration between the steady arm model and steady arm point cloud by Equation (10).
cos θ = p s p e   × p s p e p s p e × p s p e ,
where p s is the spatial coordinate values of the beginning point, p e is the endpoint and p e is the p e projected onto the XOY plane.

4. Results and Analysis

4.1. Search Result

Experimental data are used to conduct the automatic search and extraction test of OCS facilities based on a three-dimensional box. First, the first coarse selection stereoscopic box and the accurately selected stereo box need to be set manually. In the algorithm, we need the POS trajectory point in the experimental data area to be required as an auxiliary. This paper takes the upper left corner of the panoramic point cloud as the starting point to determine the position of the coarse selection stereoscopic box. The accurately selected stereo box is within the coarse selection stereoscopic box, and its length, width and height parameters are 49, 11, 3 m, respectively. The whole point cloud is divided into 156 segments, and the processing efficiency is approximately two million pts/s. The ground points, track points, facade baffles and poles have been excluded from the accurately selected stereo box of search and extraction (Figure 12, Figure 13 and Figure 14), and the data obtained by cutting can meet the requirements of the OCS component segmentation.

4.2. MFF_A Segmentation

4.2.1. Segmentation Results

The proposed deep learning network model is verified to realize the semantic segmentation of catenary facilities. This paper selects the representative typical point cloud segmentation algorithm (PointNet/PointNet++) and feature extraction unit segmentation model (FEU_SM) in the literature [8], in which, the number of adjacent points in the point neighbourhood is set to 16. The segmentation results are shown in Figure 15.
For the straight cantilever and oblique cantilevers, PointNet is the worst, and this algorithm has many misclassifications. As shown in the purple rectangle in Figure 15a, straight and oblique cantilevers are classified incorrectly as wires because of the global features reflected by the whole point cloud sample, and, thus, the local feature information is not extracted. Therefore, when the types of OCS facilities are relatively similar, PointNet may fail to effectively identify the corresponding types of OCS facilities, resulting in misclassification. However, PointNet++ (MSG) and FEU_SM can effectively obtain local features and can integrate them with global features to improve its feature expression ability. The proposed algorithm uses multi-scale feature extraction and fusion modules to focus effectively on the feature information of different details. Compared with the four algorithms, the algorithm in this paper is the best in terms of the straight cantilever and oblique cantilever segmentation.
For the elastic catenary wire, FEU_SM and this paper has a better segmentation accuracy than PointNet and PointNet++ (MSG). The worst performance was PointNet++ (MSG), wherein a large number of elastic catenary wire point clouds were misclassified into wire types. The algorithm in this paper segmented the elastic sling in better detail than FEU_SM. A small number of point clouds in the elastic catenary wire area, as shown in the purple rectangle box in Figure 15c, were mistakenly divided into wires, which was significantly improved in Figure 15d.
For the tubes and positioners, both PointNet++ (MSG) and the algorithm presented in this paper performed well. No misclassification of a large number of the steady arm into the registration arm and contact wires was observed. The identification accuracy of the steady arm is higher than that of the registration arm, but the algorithm in this paper misclassifies a small part of the point cloud, where the registration arm contact wire is wrongly classified into the registration arm.
For the dropper, FEU_SM has advantages over other algorithms, and has fewer misclassifications because the feature extraction unit can effectively extract the distance information of adjacent point clouds and can adopt a MLP structure for the feature extraction of higher dimensions.

4.2.2. Quantitative Evaluation of the Segmentation Results

A comparison of the precision (P) and intersection-over-union (IoU) between the different algorithms is conducted to assess the segmentation accuracy quantitatively (Table 1).
Compared with the other similar algorithms, the proposed MFF_A has the best performance in terms of P and IoU, with the highest precision and IoU of 96.37% and 93.08%, respectively. Among the four algorithms, the P and IoU decrease from MFF_A, FEU_SM, PointNet++ (MSG) and PointNet. The performance of the PointNet is the worst because PointNet uses mainly MLP to extract global features of OCS facilities and lacks local feature extraction. Then, multi-scale grouping (MSG) improves this problem and locally samples and groups the point cloud. It introduces systematic down sampling and an encoder–decoder structure, and uses a jump connection to fuse shallow features with deep features to obtain good semantic segmentation results. In FEU_SM, the context feature of each single frame point cloud is extracted mainly through the improved point net, and the adjacent point distance analysis of single-frame data is combined with the feature extraction unit to realize the semantic segmentation of OCS. In this algorithm, the spatial and channel attention mechanism is introduced and combined with the fusion of multi-level shallow features and deep features. Then, the residual of the initial score result is used to refine the structure and to extract multi-scale feature information more effectively. Therefore, this algorithm is in the lead among the average values of P and IoU.
For most OCS facility point cloud types, the P and IoU of this algorithm are better than other algorithms; in particular, the registration arm, straight cantilever, oblique cantilever, contact wire and catenary wire are in the lead in terms of accuracy. Meanwhile, the straight cantilever, oblique cantilever and contact wire are in the lead in terms of the intersection and combination ratio.
Overall, the P and IoU of the straight cantilever and oblique cantilever are at least 1.8% and 1.2% higher than other algorithms. Therefore, this algorithm has better practicability.

4.2.3. Parameter Complexity

Multiply–accumulate operations (MACs) were used to evaluate the parameter complexity of the proposed algorithm. Figure 16 shows the proposed MFF_A; that is, the segmentation algorithm MACs and the total number of parameters are at the minimum because the proposed network uses fewer full connection operations and the MLP structure of a smaller convolution kernel, which is the lightweight attention mechanism ECA introduced in this paper without increasing the number of parameters. The MFF_A network not only has a better performance in terms of accuracy but also has fewer network parameters with regard to efficiency. The results of initial segmentation are further segmented by a refinement structure to obtain higher precision results and reduce the complexity of the model.

4.3. Geometric Evaluation of Reconstruction Results

In this paper, the DJJ-8 laser catenary detector was used to manually measure the catenary set parameters in a certain section of the experimental area and to evaluate the reliability and correctness of the method described in this chapter for the detection of catenary geometric parameters. It can measure more than ten geometric parameters of the catenary, such as the contact wire height, stagger value, steady arm slope and so on. The measurement data of DJJ-8 are selected as a reference, which can be regarded as the ground truth. We assess if our approach detection results meet the accuracy requirements. The comparison results are shown in Figure 17.
The results of the comparative analysis of the detection results of the two measurement methods show that the difference in the detection values of the steady arm slope is within a 0.5 degrees difference. As for the stagger of the contact wire, the maximum difference is 7 mm and the average value is 3 mm. In terms of the height of the contact wire, the maximum difference is 8 mm and the average value is 3 mm. Provisional technical conditions for catenary suspension condition detection and the monitoring device (TJ/GD006-2014) [37] specifies the range and accuracy of catenary suspension condition detection and static geometric parameters. The accuracy of the contact wire height is required to be 5 mm, the stagger is required to be 20 mm and the steady arm slope is required to be 0.5 degrees. Hence, the detection accuracy of the proposed framework in this paper for the geometric parameter detection is equivalent to that of the conventional special measuring instrument, with much convenience and automation.

5. Conclusions and Future Works

An automatic search and extraction method based on stereo frame OCS facilities is proposed considering the lack of point cloud search and extraction ability of OCS facilities in previous studies. The method achieves an automatic search and extraction of catenary facility point cloud information from the original 3D point cloud scene through the steps of positioning the dual selection stereo frame, a determination of the offset vector of the dual selection stereo frame and the automatic attitude adjustment of the selected stereo frame assisted by POS data along the rail. An attentional mechanism feature extraction method based on ECA and CBAM was proposed to enhance the feature extraction capability, promote the multi-level shallow feature and deep feature fusion, refine the structure by the residual of the initial segmentation results and address the problems in the semantic segmentation of the contact point cloud explored in previous studies. A semantic segmentation model based on MFF_A is then proposed to realize catenary facility classification. The three-dimensional models of the contact wire and the dropper are reconstructed through piecewise linear fitting. The 3D model of the steady arm is reconstructed by cube fitting. A geometric parameter detection method based on the catenary model is proposed. Experimental results show that the proposed automatic search and extraction method has the advantages of fast speed and a high extraction accuracy, and is suitable for terrain relief and curves. The proposed catenary semantic segmentation method based on deep learning has a better accuracy and computational efficiency than other similar algorithms. The method of catenary 3D reconstruction by fitting straight lines and cubes is effective, and the measurement accuracy of the catenary geometric parameters meets the measurement requirements. In this paper, catenary facilities search, extraction and segmentation, model reconstruction, geometric parameters detection and other fields have broad application prospects.
In the future, in order to improve the relative accuracy of OCS detection, we will use other brands of laser scanners. We will collect more experimental data to improve the accuracy of point cloud semantic segmentation, such as stations and different railway lines. In order to reduce the equipment cost and improve the application, we will develop a light VMMS.

Author Contributions

Conceptualization, L.X.; methodology, L.X.; software, L.X.; validation, L.X.; formal analysis, L.X.; writing—original draft preparation, L.X., C.M. and J.N.; writing—review and editing, J.N., S.Z., Y.Y. and D.S.; visualization, L.X.; supervision, S.Z.; funding acquisition, S.Z. All authors have read and agreed to the published version of the manuscript.

Funding

This work was financially supported by the National Key Research and Development Program (No. SQ2021YFB2300025), the Major Project of China Railway Design Corporation (No. 2021A240507), and the Science and Technology Planning Project of Tianjin Province (No. 20YFZCGX00710).

Data Availability Statement

Data and code from this research will be available upon request to the authors.

Acknowledgments

The authors sincerely thank the comments from anonymous reviewers and members of the editorial team.

Conflicts of Interest

The authors declare no conflict of interest.

References

  1. Feng, X.; He, S.-W.; Li, Y.-B. Temporal characteristics and reliability analysis of railway transportation networks. Transp. A Transp. Sci. 2019, 15, 1825–1847. [Google Scholar] [CrossRef]
  2. Zhang, Q.; Liu, S.; Gong, D.; Zhang, H.; Tu, Q. An Improved multi-objective quantum-behaved particle swarm optimization for railway freight transportation routing design. IEEE Access 2019, 7, 157353–157362. [Google Scholar] [CrossRef]
  3. State Council Information Office of the People’s Republic of China. Sustainable Development of Transportation in China; People’s Publishing House: Beijing, China, 2020. [Google Scholar]
  4. Xiukun, W.; Da, S.; Dehua, W.; Xiaomeng, W.; Siyang, J.; Ziming, Y. A survey of the application of machine vision in rail transit system inspection. Control. Decis. 2021, 36, 257–282. [Google Scholar]
  5. Wanju, Y. High Speed Electrified Railway Catenary; Southwest Jiaotong University Press: Chengdu, China, 2003. [Google Scholar]
  6. Tan, P.; Li, X.; Wu, Z.; Ding, J.; Ma, J.; Chen, Y.; Fang, Y.; Ning, Y. Multialgorithm fusion image processing for high speed railway dropper failure–defect detection. IEEE Trans. Syst. Man Cybern. Syst. 2021, 51, 4466–4478. [Google Scholar] [CrossRef]
  7. Kang, G.; Gao, S.; Yu, L.; Zhang, D. Deep architecture for high-speed railway insulator surface defect detection: Denoising autoencoder with multitask learning. IEEE Trans. Instrum. Meas. 2019, 68, 2679–2690. [Google Scholar] [CrossRef]
  8. Lin, S.; Xu, C.; Chen, L.; Li, S.; Tu, X. LiDAR point cloud recognition of overhead catenary system with deep learning. Sensors 2020, 20, 2212. [Google Scholar] [CrossRef] [Green Version]
  9. Gutiérrez-Fernández, A.; Fernández-Llamas, C.; Matellán-Olivera, V.; Suárez-González, A. Automatic extraction of power cables location in railways using surface LiDAR systems. Sensors 2020, 20, 6222. [Google Scholar] [CrossRef]
  10. Zhong, J.; Liu, Z.; Han, Z.; Han, Y.; Zhang, W. A CNN-based defect inspection method for catenary split pins in high-speed railway. IEEE Trans. Instrum. Meas. 2019, 68, 2849–2860. [Google Scholar] [CrossRef]
  11. Han, Y.; Liu, Z.; Lyu, Y.; Liu, K.; Li, C.; Zhang, W. Deep learning-based visual ensemble method for high-speed railway catenary clevis fracture detection. Neurocomputing 2020, 396, 556–568. [Google Scholar] [CrossRef]
  12. Chen, L.; Xu, C.; Lin, S.; Li, S.; Tu, X. A deep learning-based method for overhead contact system component recognition using mobile 2D LiDAR. Sensors 2020, 20, 2224. [Google Scholar] [CrossRef] [Green Version]
  13. Dongxing, Z. Geometric parameter measurement of high-speed railroad OCS (Overhead Contact System) based on template matching image algorithm. Railw. Qual. Control. 2015, 43, 11–14. [Google Scholar]
  14. Liu, Y.; Han, T.; Liu, H. Study on OCS dynamic geometric parameters detection based on image processing. Railw. Locomot. Car 2012, 32, 86–91. [Google Scholar]
  15. Pastucha, E. Catenary system detection, localization and classification using mobile scanning data. Remote Sens. 2016, 8, 801. [Google Scholar] [CrossRef] [Green Version]
  16. Zou, R.; Fan, X.; Qian, C.; Ye, W.; Zhao, P.; Tang, J.; Liu, H. An efficient and accurate method for different configurations railway extraction based on mobile laser scanning. Remote Sens. 2019, 11, 2929. [Google Scholar] [CrossRef] [Green Version]
  17. Zhou, J.; Han, Z.; Wang, L. A steady arm slope detection method based on 3D point cloud segmentation. In Proceedings of the 2018 IEEE 3rd International Conference on Image, Vision and Computing (ICIVC), Chongqing, China, 27–29 June 2018; pp. 278–282. [Google Scholar]
  18. Lamas, D.; Soilán, M.; Grandío, J.; Riveiro, B. Automatic point cloud semantic segmentation of complex railway environments. Remote Sens. 2021, 13, 2332. [Google Scholar] [CrossRef]
  19. Jung, J.; Chen, L.; Sohn, G.; Luo, C.; Won, J.-U. Multi-range conditional random field for classifying railway electrification system objects using mobile laser scanning data. Remote Sens. 2016, 8, 1008. [Google Scholar] [CrossRef] [Green Version]
  20. Jingsong, Z.; Zhiwei, H.; Changjiang, Y. Catenary geometric parameters detection method based on 3D point cloud. Chin. J. Sci. Instrum. 2018, 39, 239–246. [Google Scholar]
  21. Chen, D.; Li, J.; Di, S.; Peethambaran, J.; Xiang, G.; Wan, L.; Li, X. Critical points extraction from building façades by analyzing gradient structure tensor. Remote Sens. 2021, 13, 3146. [Google Scholar] [CrossRef]
  22. Huang, R.; Xu, Y.; Stilla, U. GraNet: Global relation-aware attentional network for ALS point cloud classification. arXiv 2012, arXiv:13466 2020. [Google Scholar]
  23. Qi, C.R.; Su, H.; Mo, K.; Guibas, L.J. Pointnet: Deep learning on point sets for 3d classification and segmentation. In Proceedings of the IEEE Conference on Computer Vision and Pattern Recognition, Honolulu, HI, USA, 21–26 July 2017; pp. 652–660. [Google Scholar]
  24. Qi, C.R.; Yi, L.; Su, H.; Guibas, L.J. Pointnet++: Deep hierarchical feature learning on point sets in a metric space. arXiv 2017, arXiv:1706.02413. [Google Scholar]
  25. Li, Y.; Bu, R.; Sun, M.; Wu, W.; Di, X.; Chen, B. Pointcnn: Convolution on x-transformed points. Adv. Neural Inf. Process. Syst. 2018, 31, 820–830. [Google Scholar]
  26. Zhao, H.; Jiang, L.; Fu, C.-W.; Jia, J. PointWeb: Enhancing local neighborhood features for point cloud processing. In Proceedings of the 2019 IEEE/CVF Conference on Computer Vision and Pattern Recognition (CVPR), Long Beach, CA, USA, 15–20 June 2019; pp. 5560–5568. [Google Scholar]
  27. Thomas, H.; Qi, C.R.; Deschaud, J.-E.; Marcotegui, B.; Goulette, F.; Guibas, L. KPConv: Flexible and deformable convolution for point clouds. In Proceedings of the 2019 IEEE/CVF International Conference on Computer Vision (ICCV), Seoul, Korea, 27–28 October 2019; pp. 6411–6420. [Google Scholar]
  28. Wu, W.; Qi, Z.; Fuxin, L. PointConv: Deep convolutional networks on 3D point clouds. In Proceedings of the 2019 IEEE/CVF Conference on Computer Vision and Pattern Recognition (CVPR), Long Beach, CA, USA, 15–20 June 2019; pp. 9613–9622. [Google Scholar]
  29. Fu, J.; Liu, J.; Tian, H.; Li, Y.; Bao, Y.; Fang, Z.; Lu, H. Dual attention network for scene segmentation. In Proceedings of the IEEE/CVF Conference on Computer Vision and Pattern Recognition (CVPR), Long Beach, CA, USA, 15–20 June 2019; pp. 3141–3149. [Google Scholar]
  30. Hu, J.; Shen, L.; Sun, G. Squeeze-and-excitation networks. In Proceedings of the IEEE Conference on Computer Vision and Pattern Recognition (CVPR), Salt Lake City, UT, USA, 18–23 June 2018; pp. 7132–7141. [Google Scholar]
  31. Woo, S.; Park, J.; Lee, J.-Y.; Kweon, I.S. Cbam: Convolutional block attention module. In Proceedings of the European conference on computer vision (ECCV), Munich, Germany, 8–14 September 2018; pp. 3–19. [Google Scholar]
  32. Wang, Q.; Wu, B.; Zhu, P.; Li, P.; Zuo, W.; Hu, Q. ECA-Net: Efficient channel attention for deep convolutional neural networks. In Proceedings of the IEEE/CVF Conference on Computer Vision and Pattern Recognition (CVPR), Seattle, WA, USA, 14–19 June 2020; pp. 11531–11539. [Google Scholar] [CrossRef]
  33. Zhang, H.; Zu, K.; Lu, J.; Zou, Y.; Meng, D. Epsanet: An efficient pyramid split attention block on convolutional neural network. arXiv 2021, arXiv:2105.14447. [Google Scholar]
  34. Zhao, H.; Shi, J.; Qi, X.; Wang, X.; Jia, J. Pyramid scene parsing network. In Proceedings of the 2017 IEEE Conference on Computer Vision and Pattern Recognition (CVPR), Honolulu, HI, USA, 21–26 July 2017; pp. 6230–6245. [Google Scholar]
  35. Fang, H.; Lafarge, F. Pyramid scene parsing network in 3D: Improving semantic segmentation of point clouds with multi-scale contextual information. ISPRS J. Photogramm. Remote Sens. 2019, 154, 246–258. [Google Scholar] [CrossRef] [Green Version]
  36. Zhan, D.; Jing, D.; Wu, M.; Zhang, D. Study on dynamic vision measurement for locator slope gradient of electrified railway overhead catenary. J. Electron. Meas. Instrum. 2018, 32, 50–58. (In Chinese) [Google Scholar]
  37. TJ/GD006-2014. Provisional Technical Conditions for Catenary Suspension Condition Detection and Monitoring Device (4C); China Railway Publishing House Co., Ltd.: Beijing, China, 2014. [Google Scholar]
Figure 1. Structure of OCS.
Remotesensing 13 04939 g001
Figure 2. Technical scheme diagram of this paper.
Remotesensing 13 04939 g002
Figure 3. Study area.
Remotesensing 13 04939 g003
Figure 4. Modified VMMS acquisition equipment. (a) Fix the elevated support on the flat plate with binding tape; (b) the onboard mobile measurement system is installed in the flat car department.
Remotesensing 13 04939 g004
Figure 5. DMI setup: (a) origin train wheel; (b) front view after removal; (c) side view after removal.
Remotesensing 13 04939 g005
Figure 6. Generated point cloud (part). (a) Laser point cloud within the station; (b) laser point cloud in subgrade range; (c) laser point cloud over the bridge; (d) laser point cloud in tunnel range.
Remotesensing 13 04939 g006
Figure 7. Schematic diagram of rough selection stereo frame and selection stereo frame.
Remotesensing 13 04939 g007
Figure 8. Architecture of proposed MFF_A network.
Remotesensing 13 04939 g008
Figure 9. Schematic diagram of ECA.
Remotesensing 13 04939 g009
Figure 10. Structure of CBAM. (a) Convolutional block attention module; (b) Channel attention module; (c) Spatial attention module.
Remotesensing 13 04939 g010
Figure 11. Refine structure.
Remotesensing 13 04939 g011
Figure 12. Fully automatic search and extraction result map of OCS facilities based on the stereoscopic box (red represents the OCS result point cloud, yellow is the outer boundary stereoscopic box of segmented result point cloud and grey is background point).
Remotesensing 13 04939 g012
Figure 13. Display diagram of extracted result point cloud and background point cloud (red is a catenary result point cloud and grey is background point).
Remotesensing 13 04939 g013
Figure 14. Detailed drawing of single-arm condition extraction result: (a) side view of single arm; (b) vertical view of single arm; (c) side view of double arm; (d) vertical view of double arm.
Remotesensing 13 04939 g014
Figure 15. Segmentation results comparison with others: (a) PointNet; (b) PointNet++; (c) FEU_SM; (d) proposed MFF_A.
Remotesensing 13 04939 g015aRemotesensing 13 04939 g015b
Figure 16. Comparison of MACs and parameter number.
Remotesensing 13 04939 g016
Figure 17. Comparison of the results of different measurement methods: (a) steady arm slope; (b) the height of contact wire; (c) the stagger of contact wire, which is designed as a left–right symmetrical structure; (d) the difference in steady arm slope; (e) the difference in contact wire height; (f) the difference in contact wire stagger.
Remotesensing 13 04939 g017
Table 1. Comparison with other algorithms (%). Bold indicate the best performance in the comparision.
OCS Type ClassificationProposed MFF_AFEU_SMPointNet++ (MSG)PointNet
PIoUPIoUPIoUPIoU
Steady arm96.3486.2195.6987.6090.3885.3192.4681.65
Straight cantilever93.6488.6390.6587.4691.8685.7686.4978.91
Oblique cantilever92.9589.4091.2184.6591.4686.9487.6176.59
Registration arm94.5192.6595.3993.0895.6091.7493.1288.32
Elastic catenary wire98.6196.4899.4299.0398.0697.5998.6498.16
Dropper95.6592.3296.4491.3695.2593.1790.7875.49
Contact wire99.8799.6999.3999.1499.6898.3399.2898.75
Catenary wire99.3999.2999.3599.2698.2398.0197.0496.49
Average96.3793.0895.9492.7095.0792.1193.1886.80
Publisher’s Note: MDPI stays neutral with regard to jurisdictional claims in published maps and institutional affiliations.

