
The Impact of Digital Elevation Model Preprocessing and Detection Methods on Karst Depression Mapping in Densely Forested Dinaric Mountains


Abstract
:
1. Introduction
2. Research Area, Data, and Methods
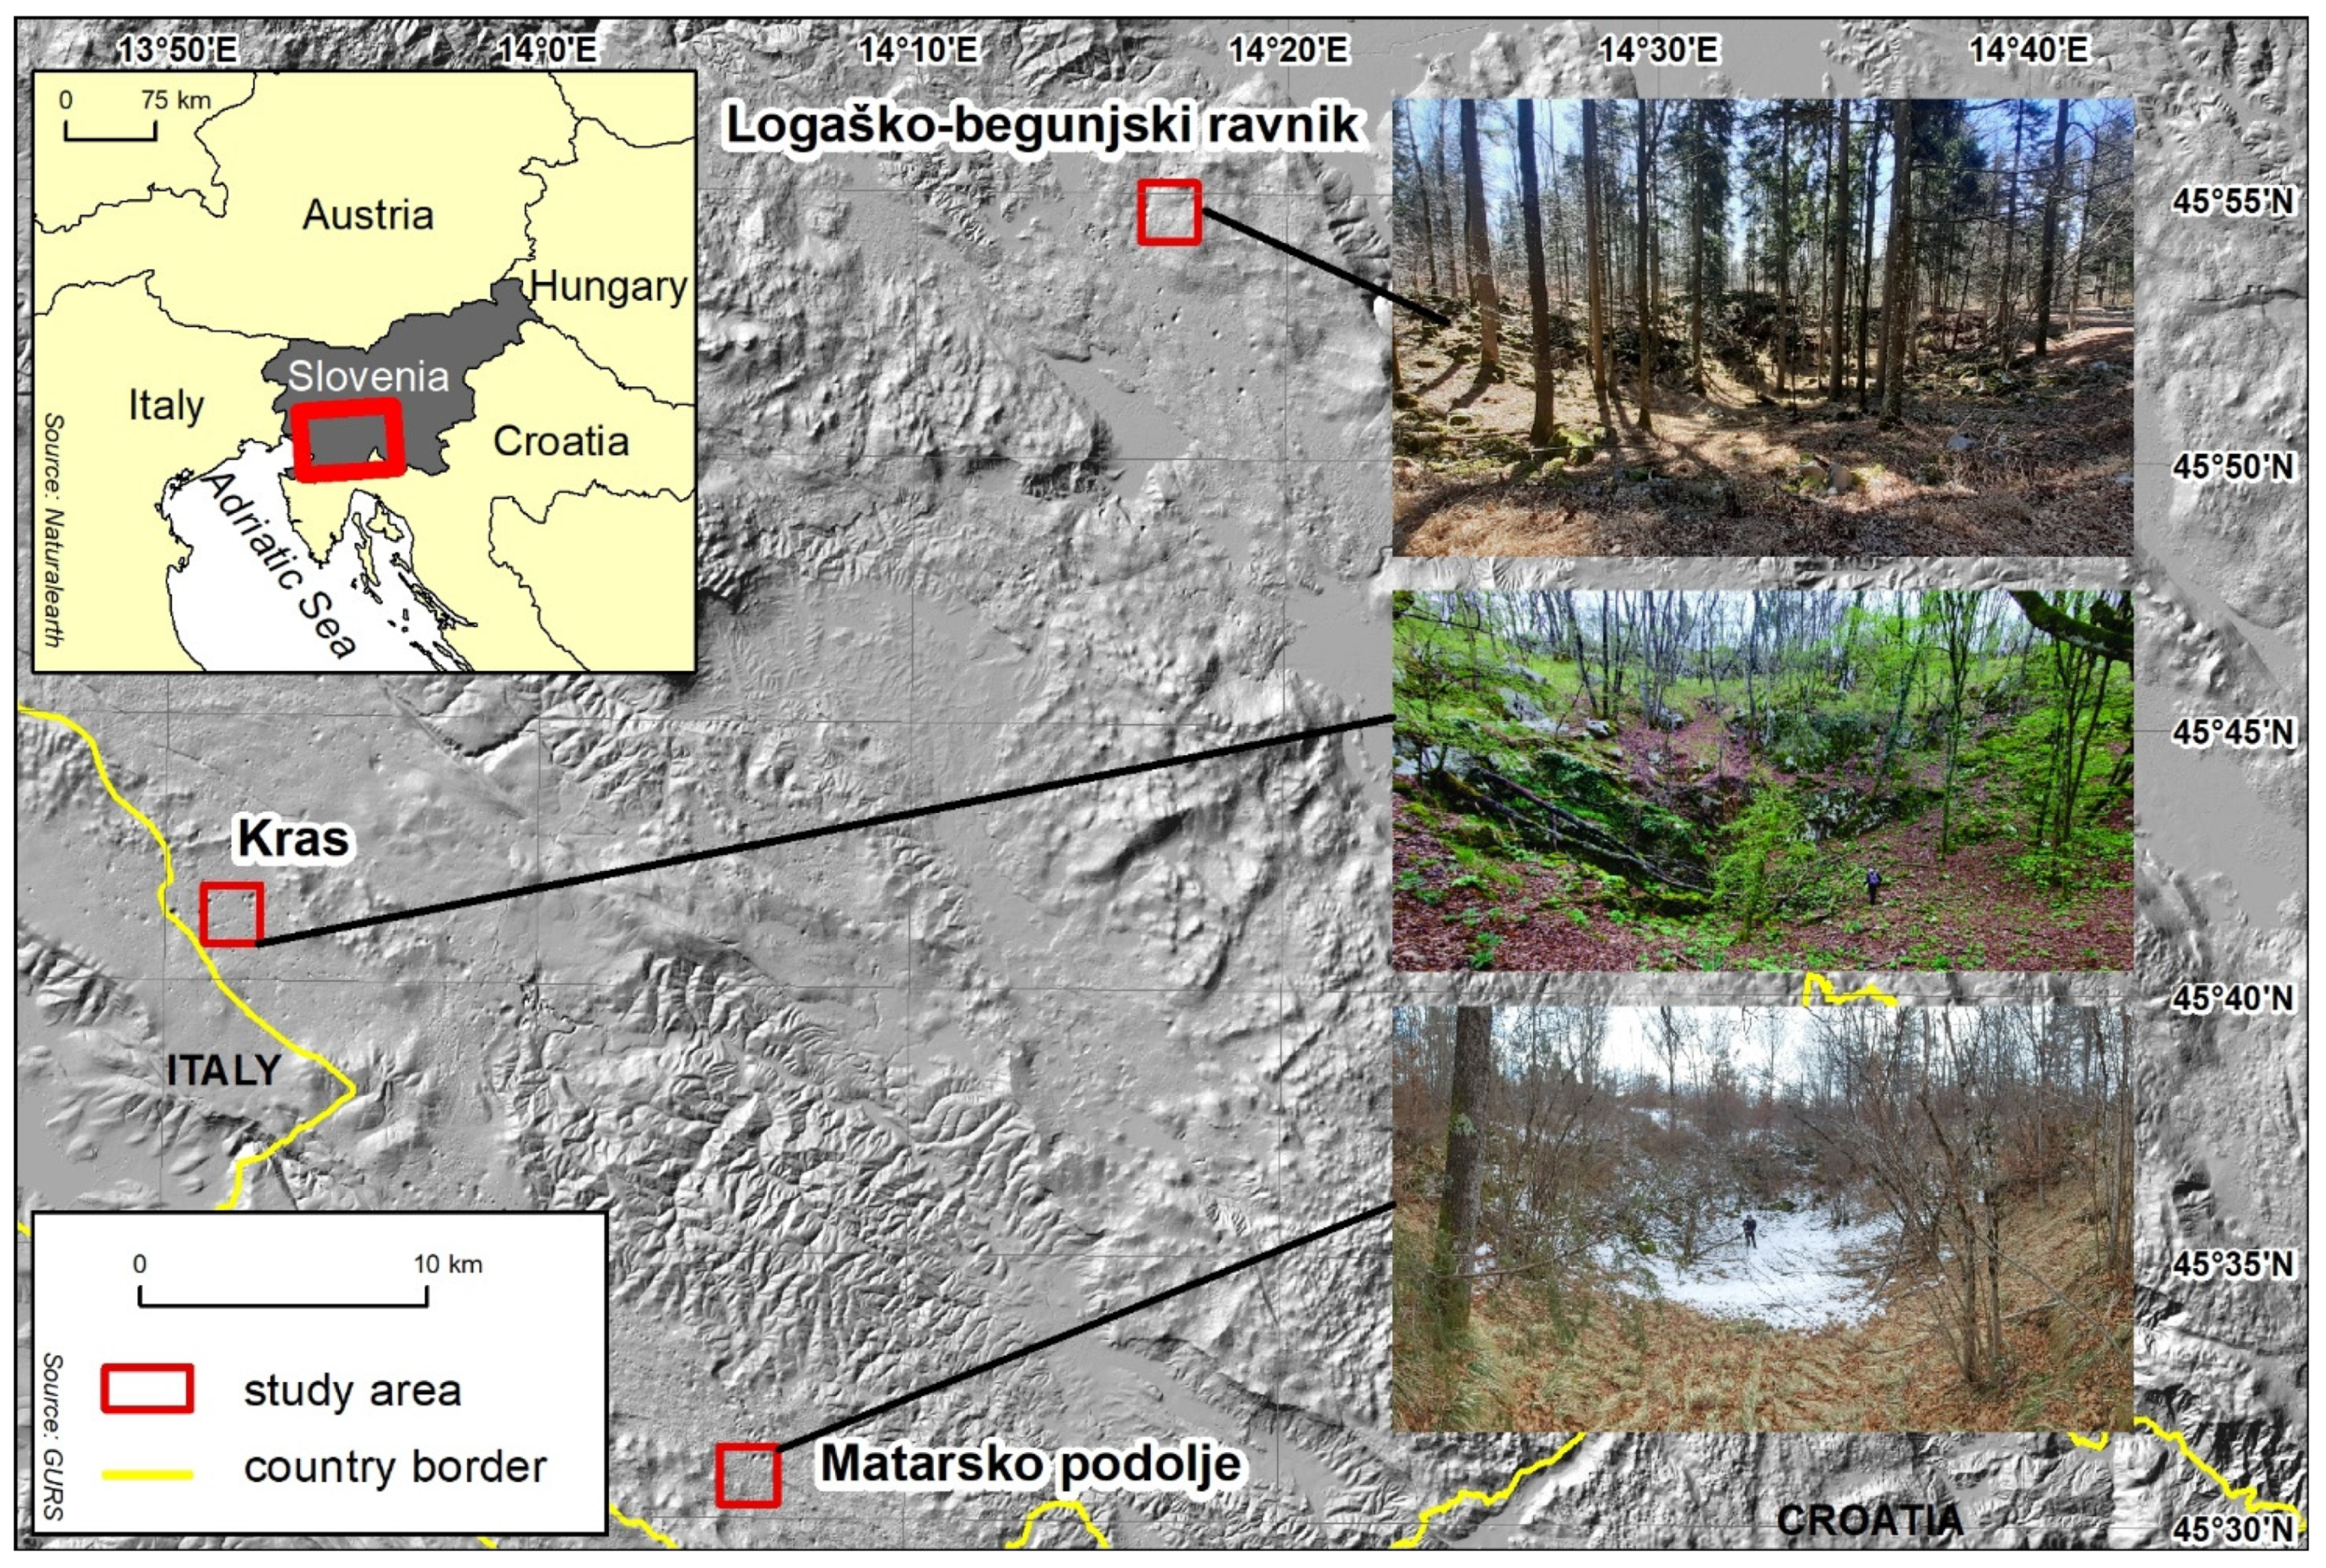
2.1. Research Area
2.2. Data
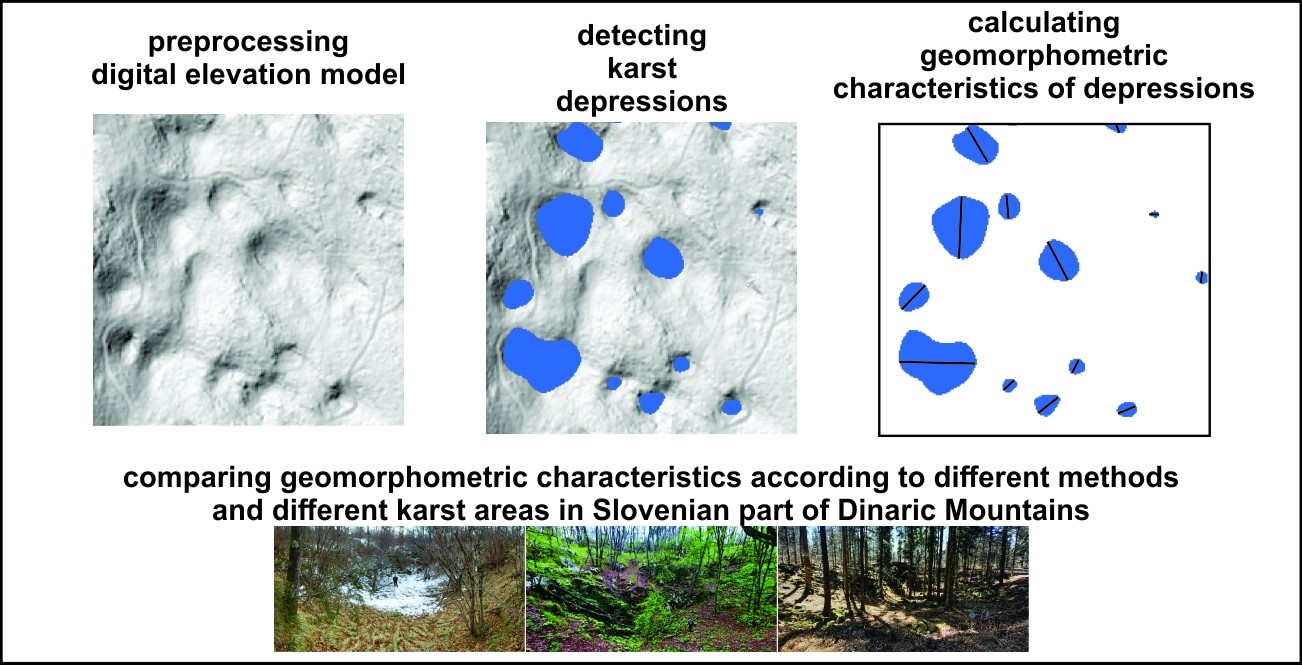
2.3. Methods
- -
- Preprocessing a DEM (see Section 2.3.1);
- -
- Detecting enclosed karst depressions (see Section 2.3.2);
- -
- Calculating the geomorphometric characteristics of enclosed karst depressions (see Section 2.3.3);
- -
- Analyzing the results inside areas (overlapping) (see Section 2.3.4);
- -
- Analyzing the differences in the results between areas (see Section 2.3.5).
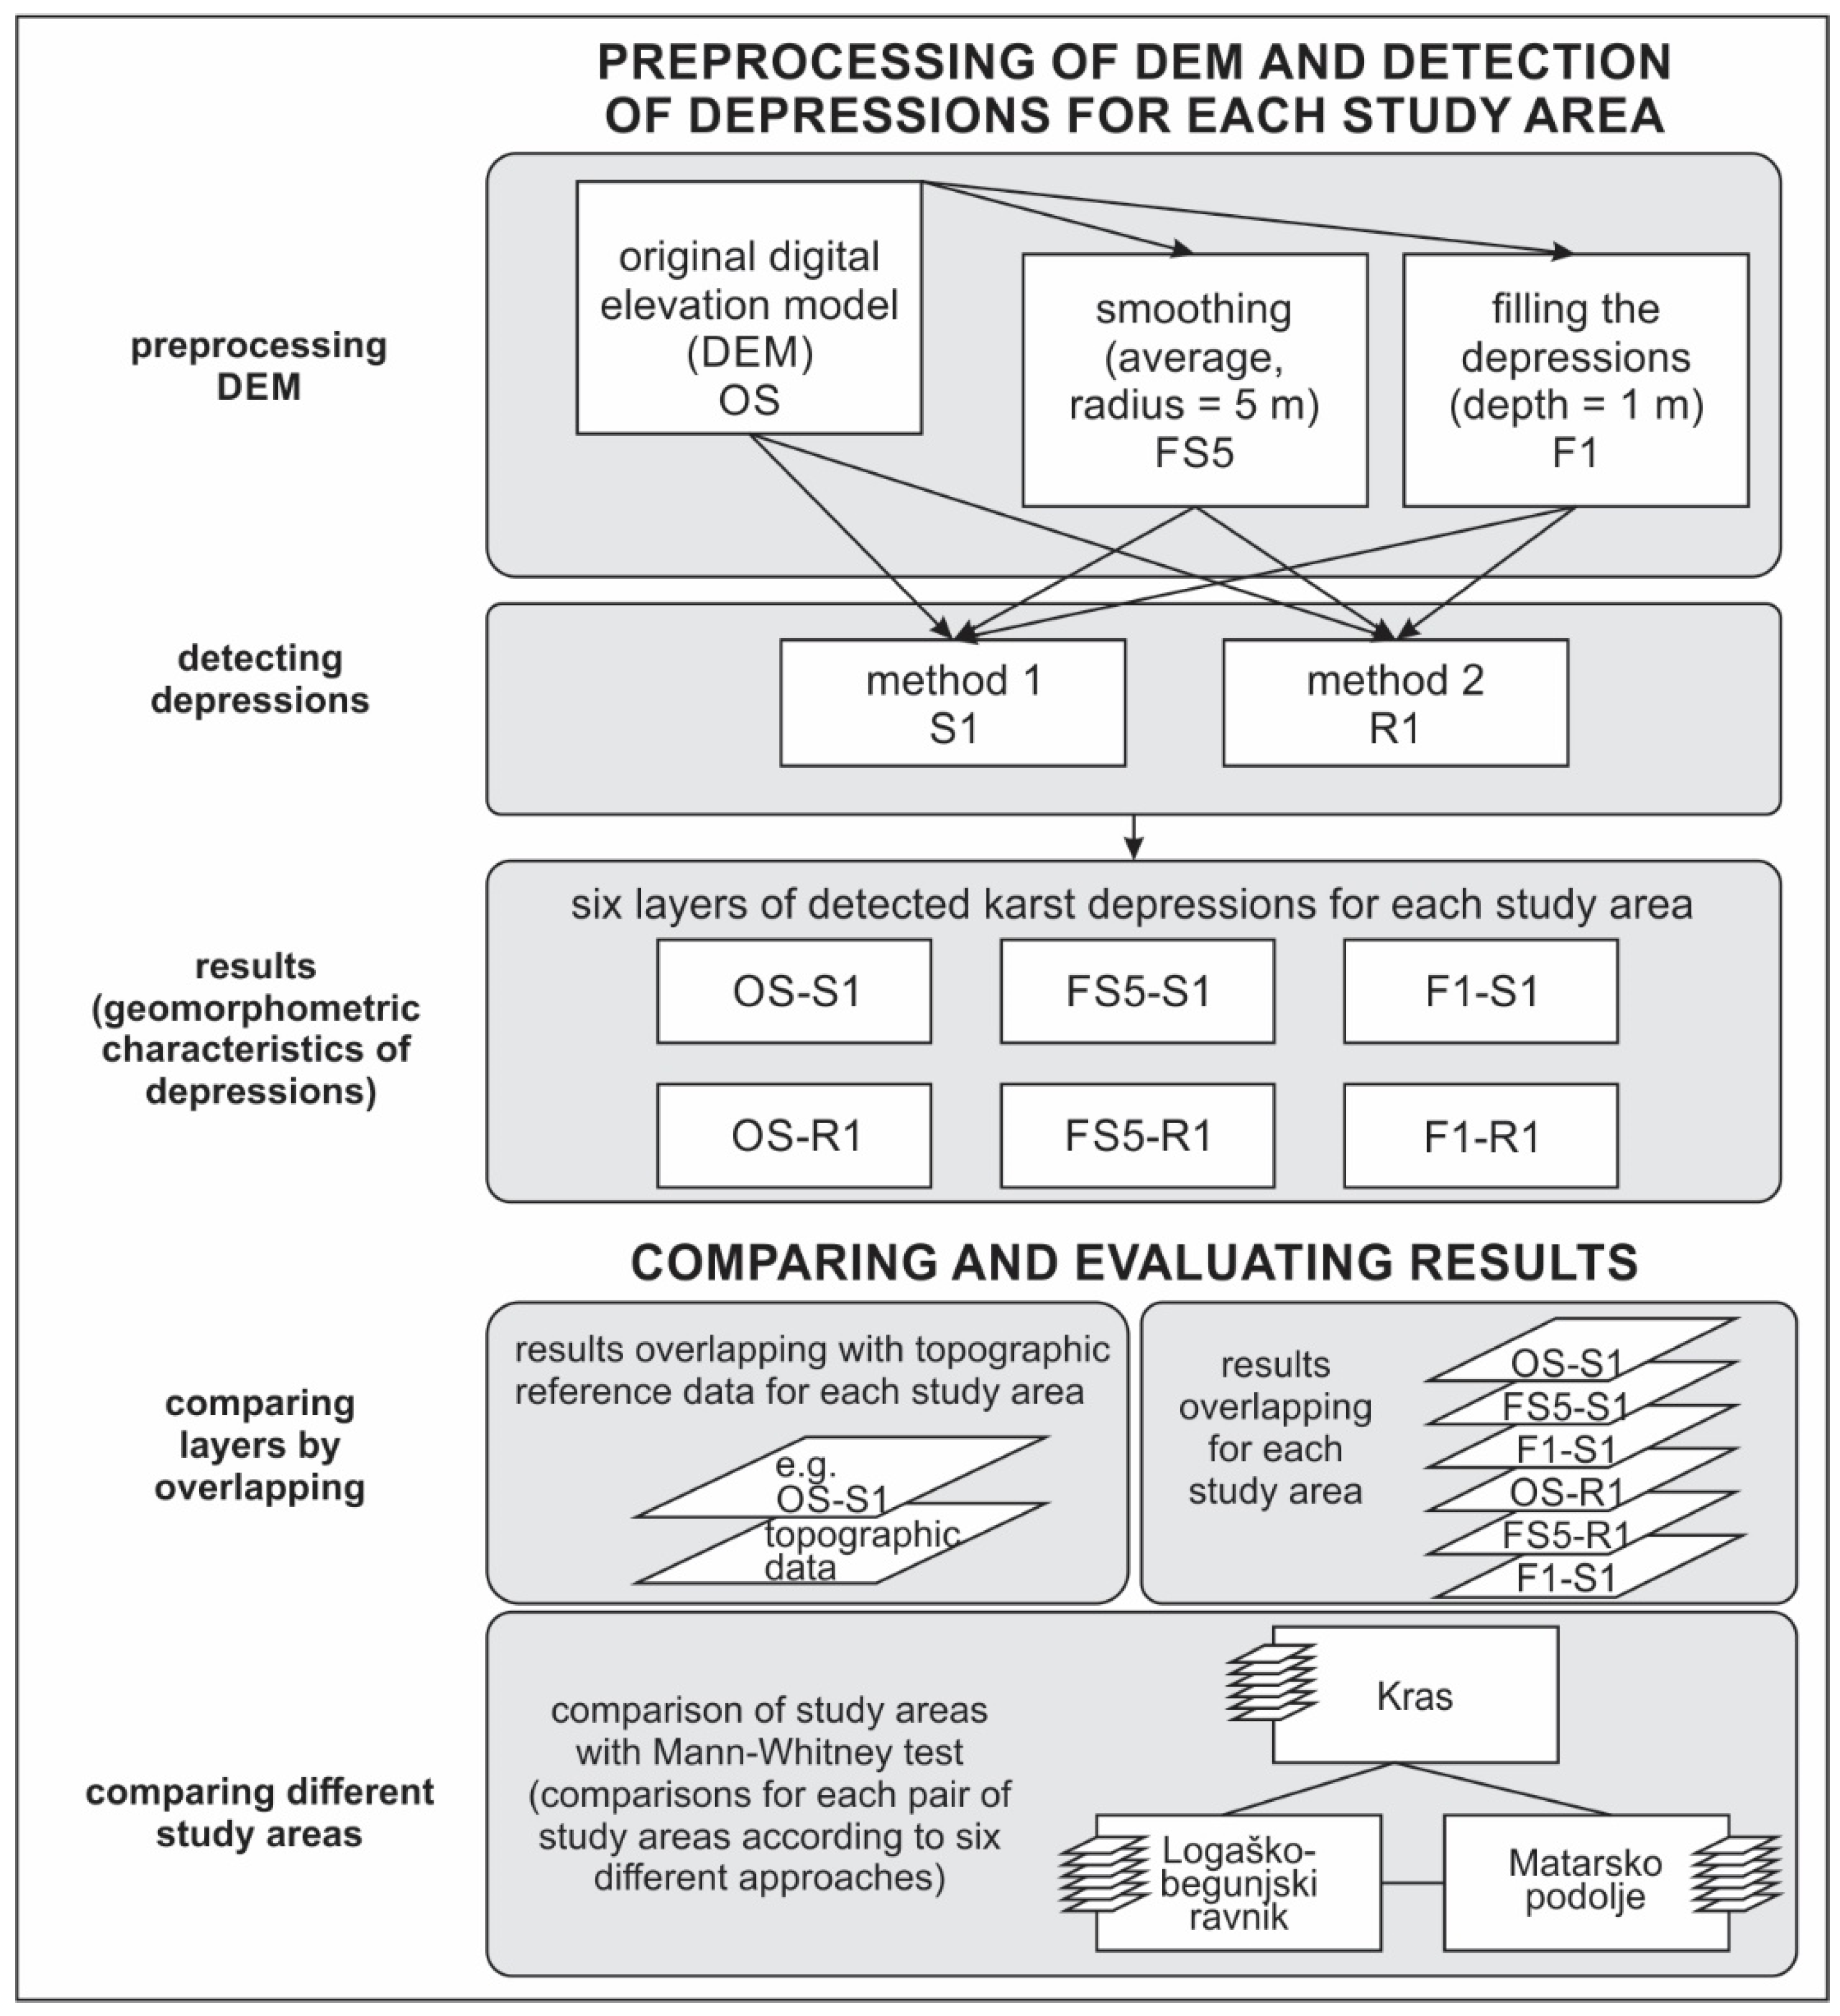
2.3.1. Preprocessing the Input Laser Scanning DEMs
- (1)
- Focal statistics—Smoothing using a five-cell circular radius filter;
- (2)
- Fill—Filling the depressions that were shallower than 1 m.
2.3.2. Enclosed Karst Depression Detection
- -
- Diameter of the theoretical circle: d ≤ 10 m (d = 2 × );
- -
- Depth: g ≤ 2 m (g = highest elevation − lowest elevation).
2.3.3. Calculating the Geomorphometric Characteristics of Karst Depressions
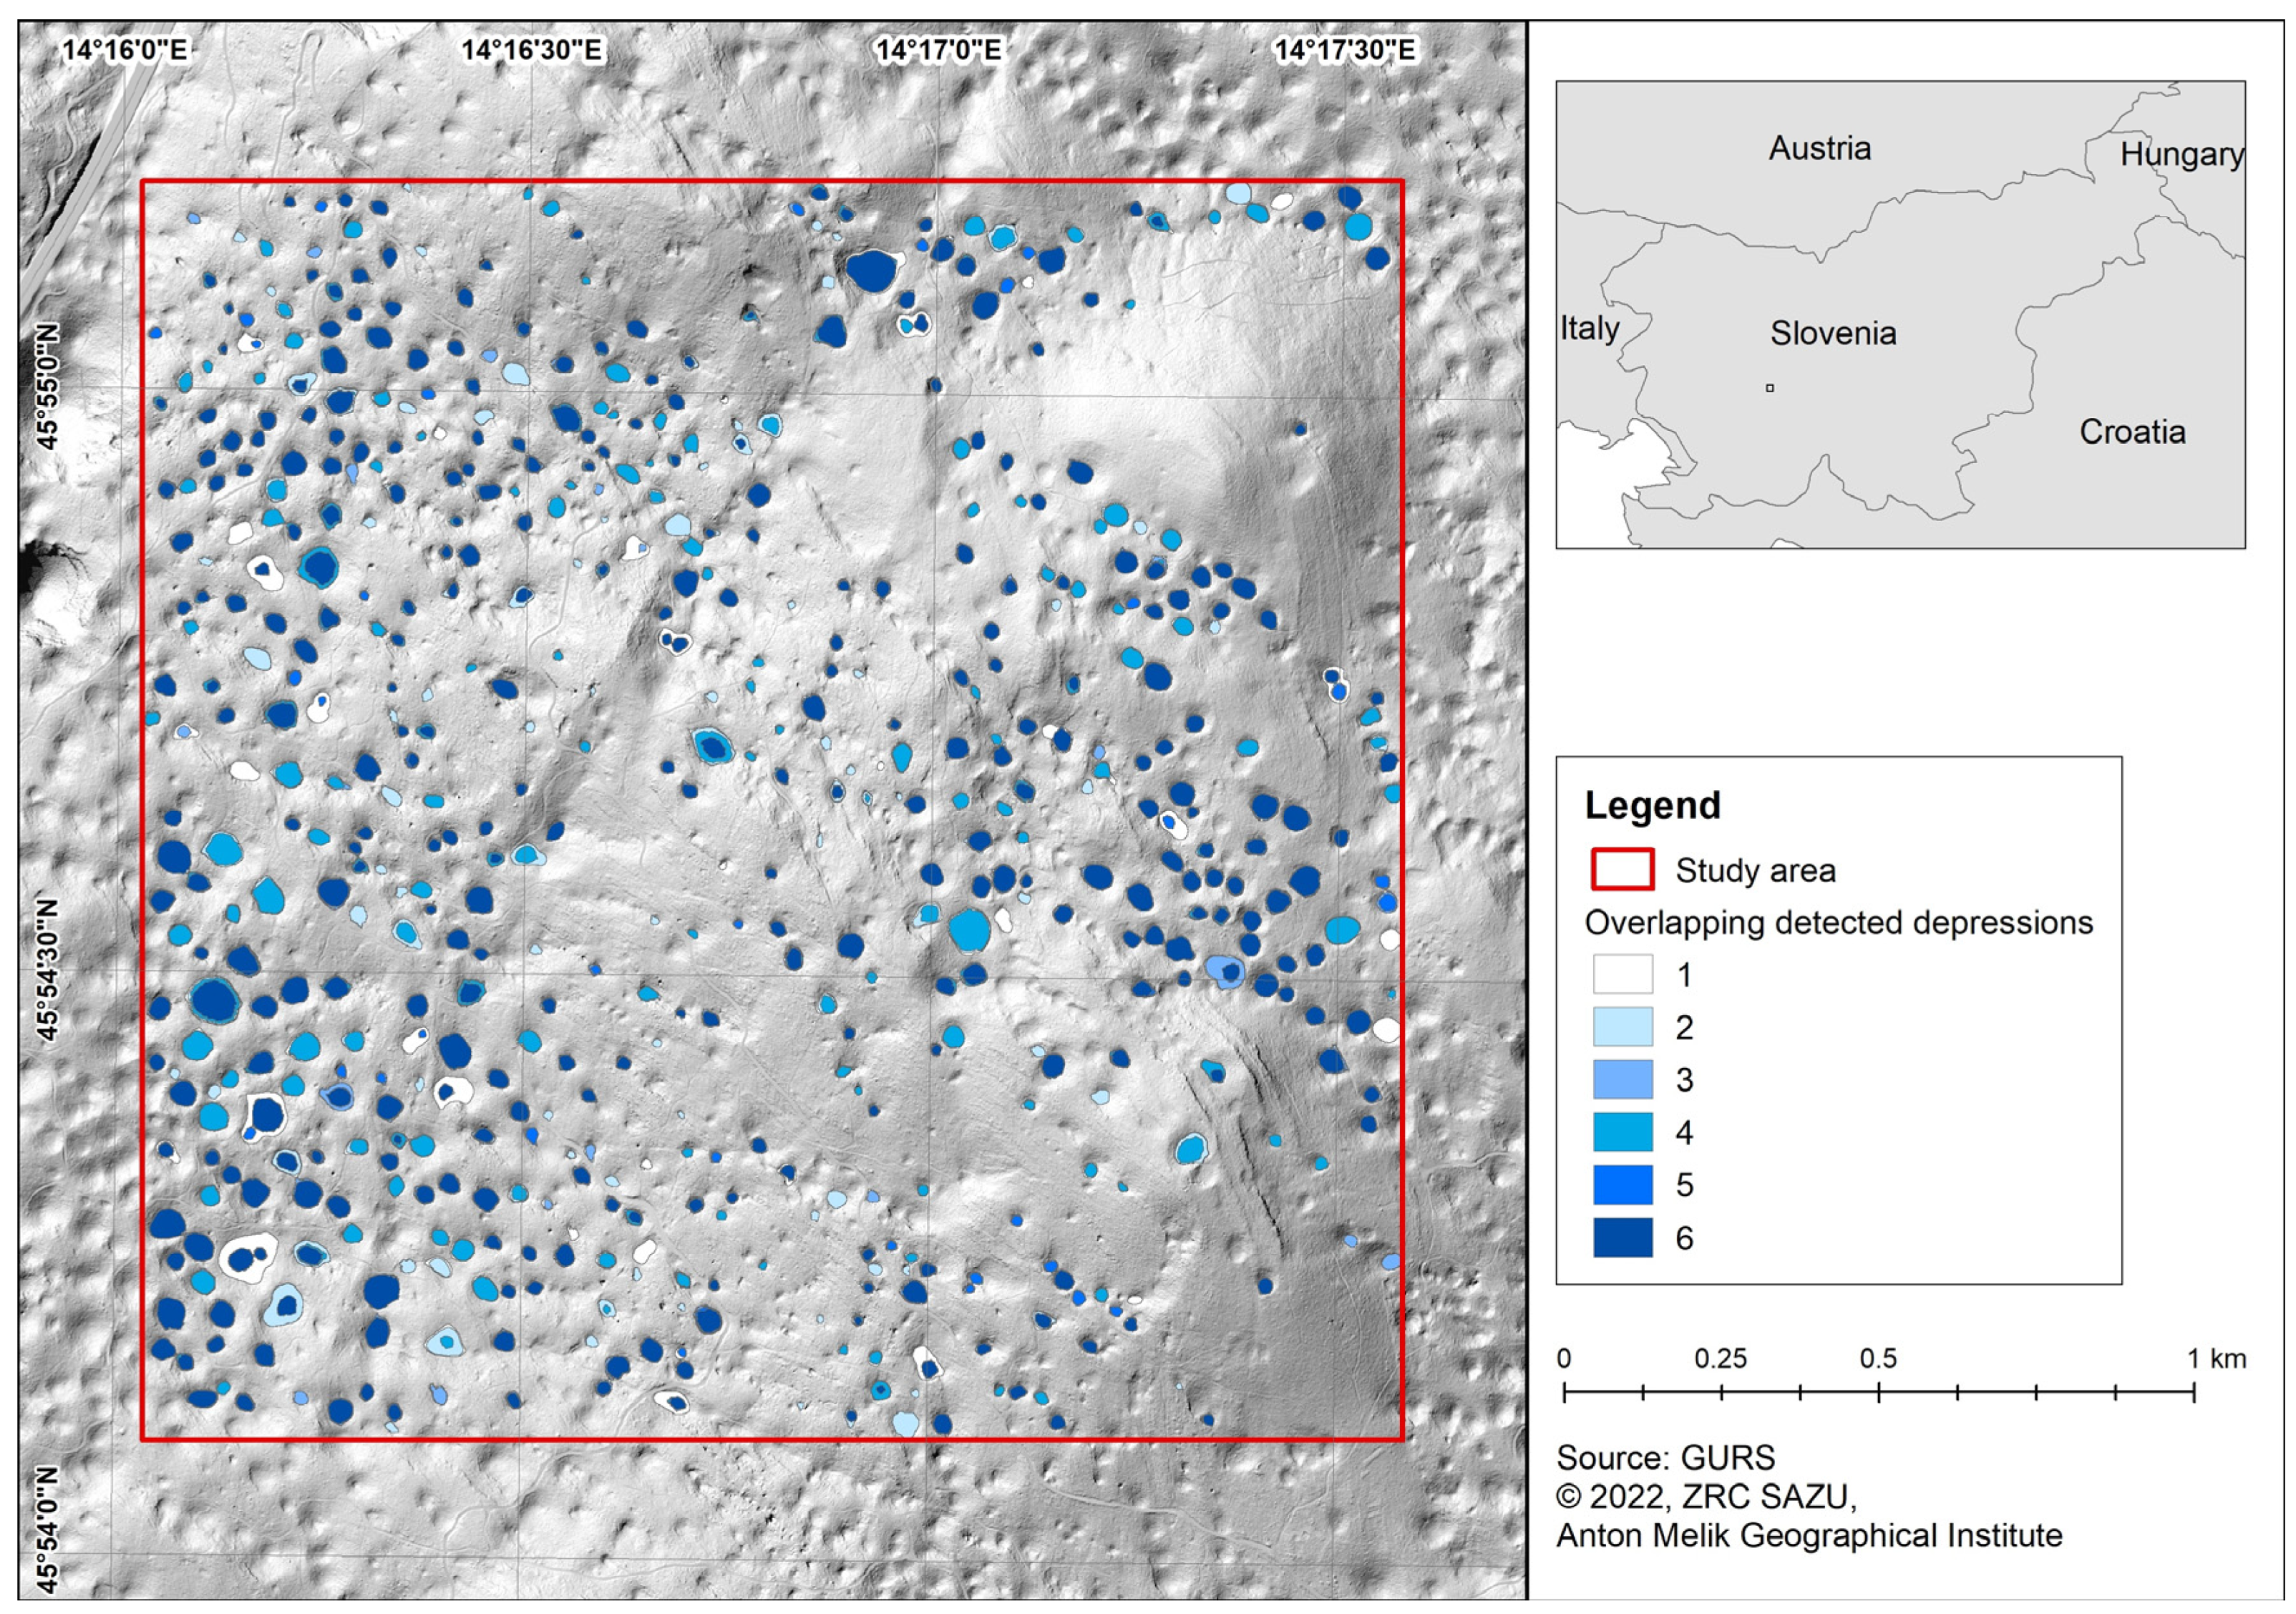
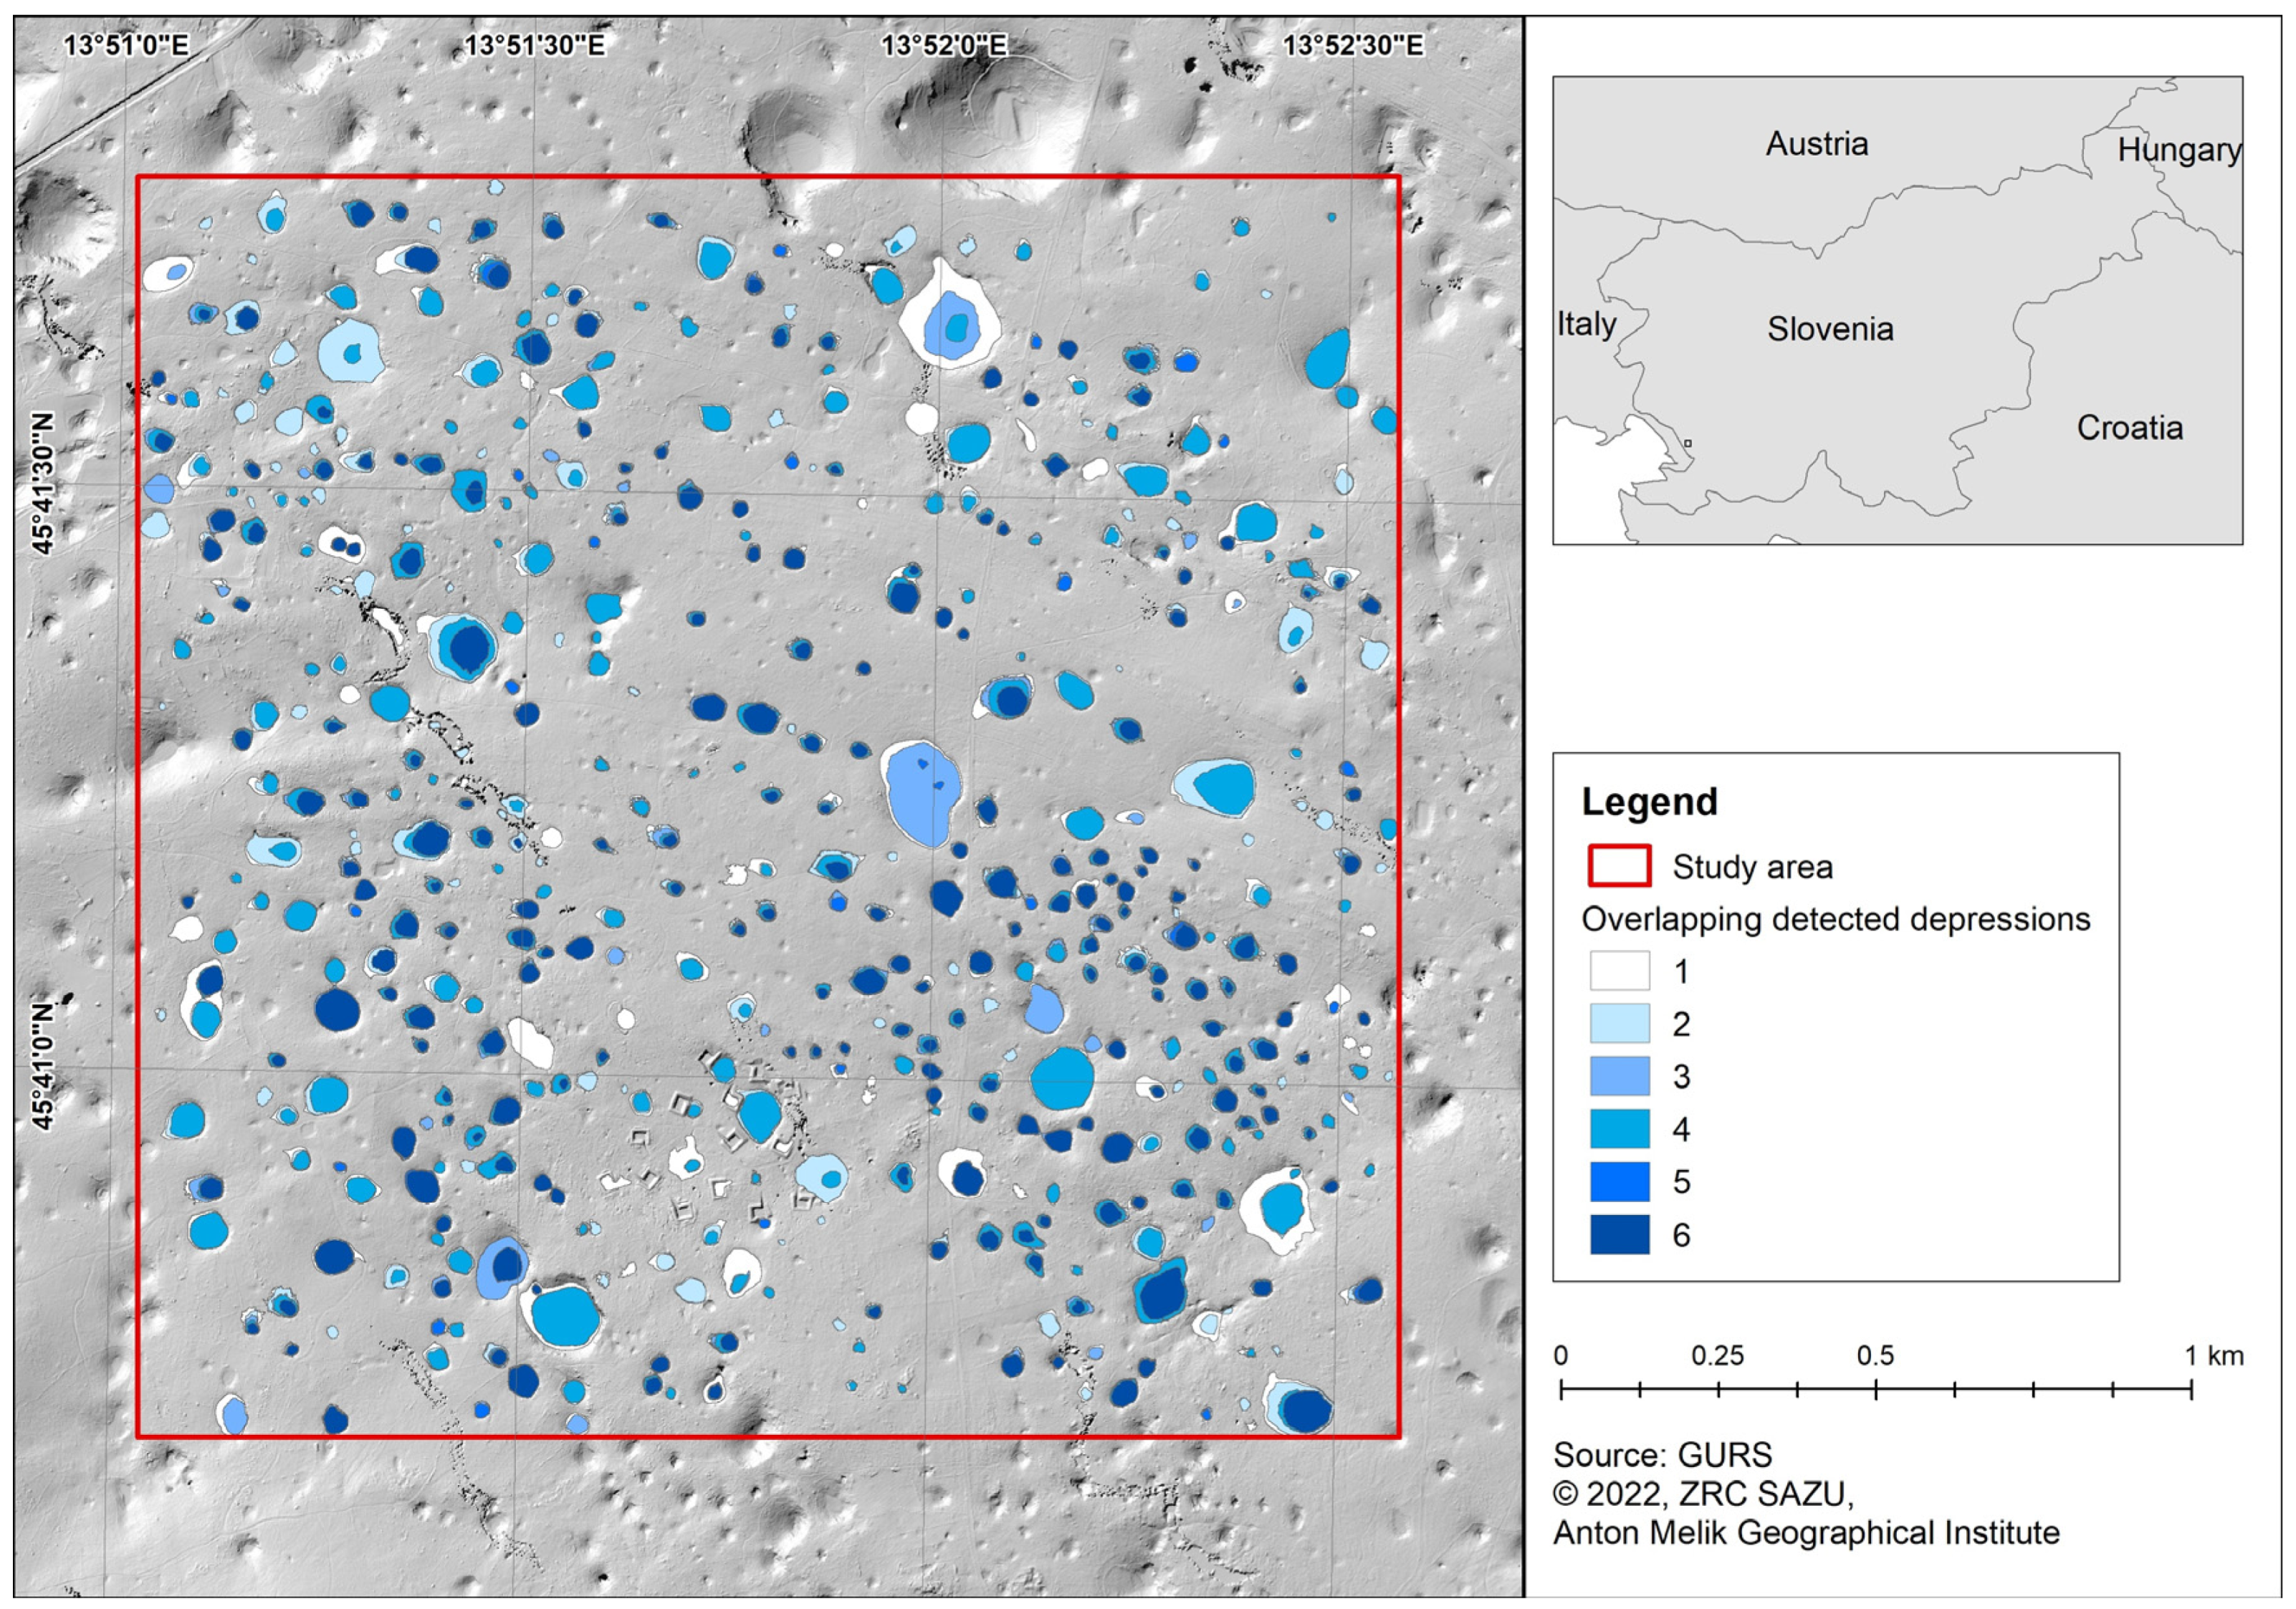
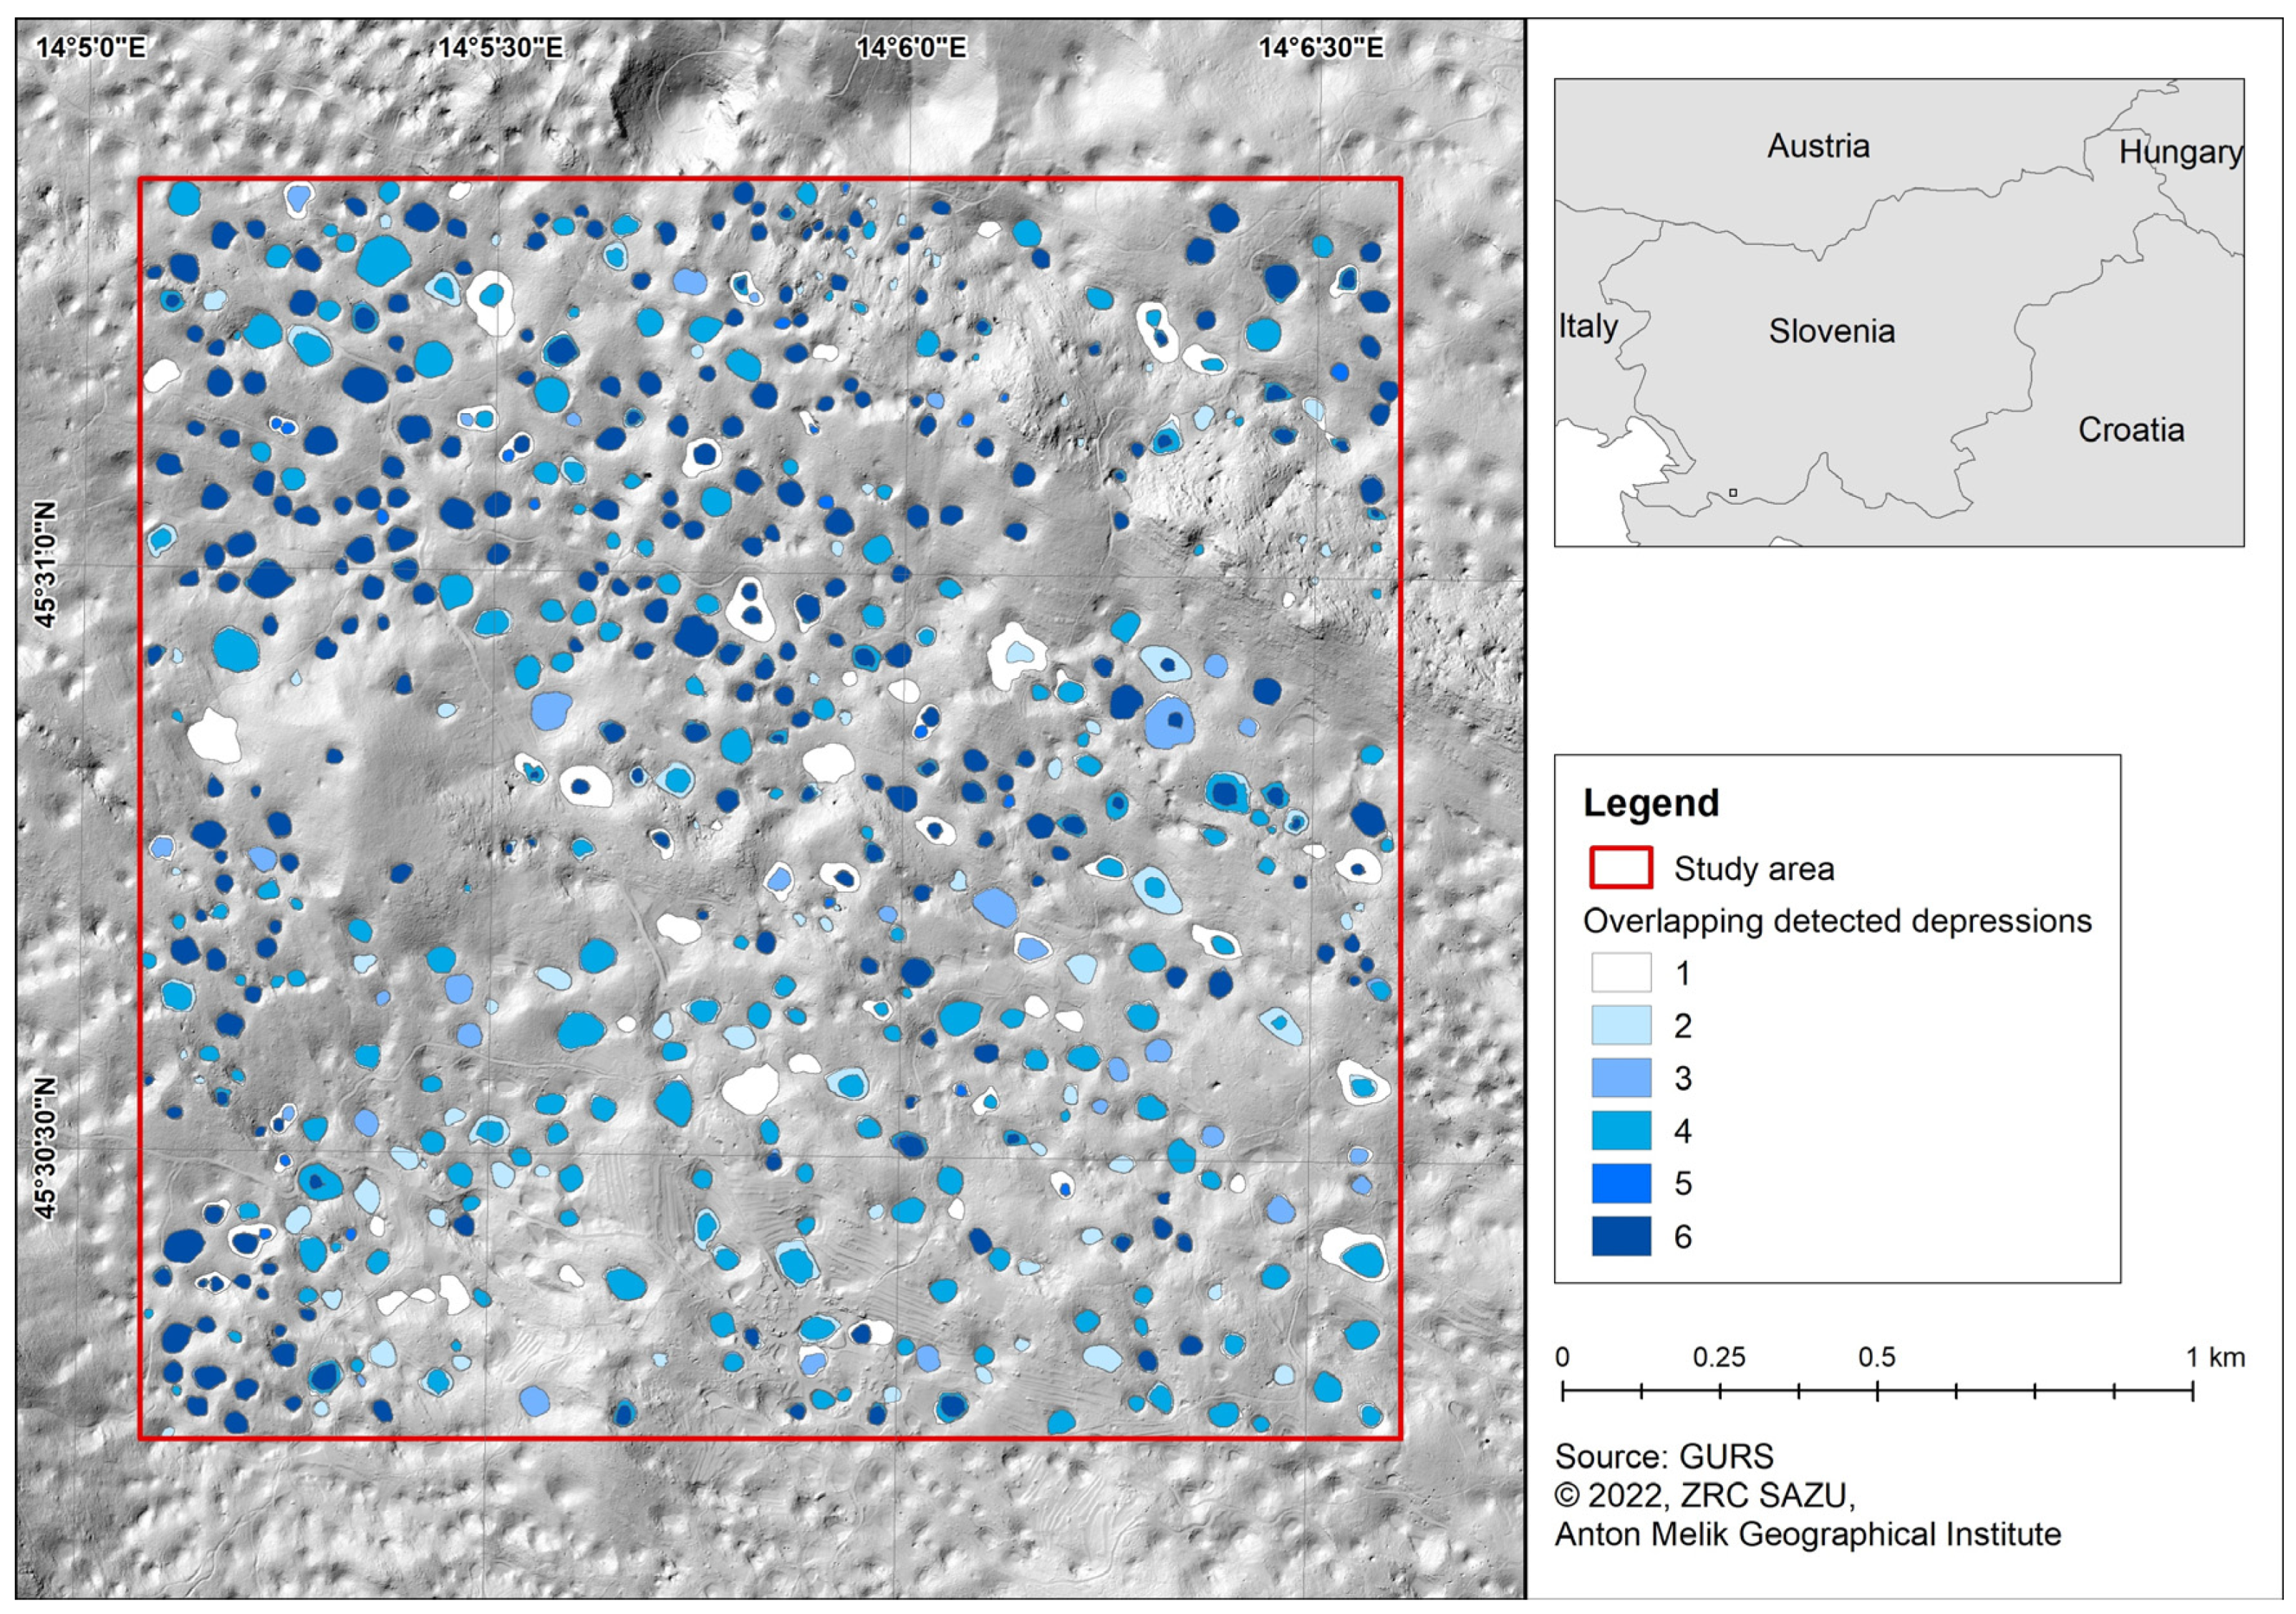
2.3.4. Overlapping the Detected Karst Depressions
2.3.5. Analyzing the Differences between the Areas
3. Results
3.1. The Number of Detected Karst Depressions within the Study Areas
- -
- By detecting depressions using the filled-DEM method (S1) based on:
- ○
- The original DEM (OS);
- ○
- DEM smoothing (FS5);
- ○
- Filled DEM (F1).
- -
- By detecting depressions using the contour line method (R1) based on:
- ○
- The original DEM (OS);
- ○
- DEM smoothing (FS5);
- ○
- Filled DEM (F1).
3.2. Geomorphometric Characteristics of Karst Depressions within Individual Areas
3.2.1. Logaško-Begunjski Ravnik
3.2.2. Kras
3.2.3. Matarsko Podolje
3.3. Overlapping of Karst Depressions within Individual Areas
4. Discussion
4.1. Discussion on Geomorphometric Differences between the Study Areas
4.2. Discussion on Smoothing of High-Resolution DEM of Karst Landscape
4.2.1. The Issues Related to Forest Cover and Vegetation Filtering
4.2.2. The Issues Related to Human Impacts on Terrain “Smoothness” Due to Agricultural Land-Use
4.3. Remote Detection of Karst Depresions as the Best Alternative
5. Conclusions
Supplementary Materials
Author Contributions
Funding
Institutional Review Board Statement
Informed Consent Statement
Acknowledgments
Conflicts of Interest
References
- Goldscheider, N.; Chen, Z.; Auler, A.S.; Bakalowicz, M.; Broda, S.; Drew, D.; Hartmann, J.; Jiang, G.; Moosdorf, N.; Stevanovic, Z.; et al. Global Distribution of Carbonate Rocks and Karst Water Resources. Hydrogeol. J. 2020, 28, 1661–1677. [Google Scholar] [CrossRef] [Green Version]
- Gostinčar, P. Geomorphological Characteristics of Karst on Contact between Limestone and Dolomite in Slovenia. Ph.D. Thesis, Fakulteta za Podiplomski Študij Univerze v Novi Gorici, Nova Gorica, Slovenia, 2016. [Google Scholar]
- Zorn, M.; Ferk, M.; Lipar, M.; Komac, B.; Tičar, J.; Hrvatin, M. Landforms of Slovenia. In The Geography of Slovenia, 1st ed.; Perko, D., Ciglič, R., Zorn, M., Eds.; World Regional Geography Book Series; Springer: Cham, Germany, 2020; pp. 35–57. [Google Scholar] [CrossRef]
- Komac, M.; Urbanc, J. Assessment of Spatial Properties of Karst Areas on a Regional Scale Using GIS and Statistics—The Case of Slovenia. J. Cave Karst Stud. 2012, 74, 251–261. [Google Scholar] [CrossRef]
- Breg Valjavec, M.; Zorn, M.; Čarni, A. Human-induced land degradation and biodiversity of Classical Karst landscape: On the example of enclosed karst depressions (dolines). Land Degrad. Dev. 2018, 29, 3823–3835. [Google Scholar] [CrossRef] [Green Version]
- Stepišnik, U.; Gostinčar, P. Periodically inundated uvalas and collapse dolines of Upper Pivka, Slovenia. Acta Geogr. Slov. 2020, 60, 91–105. [Google Scholar] [CrossRef]
- Zhu, J.; Nolte, A.M.; Jacobs, N.; Ye, M. Using machine learning to identify karst sinkholes from LiDAR-derived topographic depressions in the Bluegrass Region of Kentucky. J. Hydrol. 2020, 588, 125049. [Google Scholar] [CrossRef]
- Verbovšek, T.; Gabor, L. Morphometric properties of dolines in Matarsko podolje, SW Slovenia. Environ. Earth Sci. 2019, 78, 396. [Google Scholar] [CrossRef]
- Mihevc, A.; Mihevc, R. Morphological Characteristics and Distribution of Dolines in Slovenia, a Study of a Lidar-Based Doline Map of Slovenia. Acta Carsologica 2021, 50, 11–36. [Google Scholar] [CrossRef]
- Doctor, D.H.; Jones, J.M.; Wood, N.J.; Falgout, J.T.; Igorevna Rapstine, N. Progress toward a preliminary karst depression density map for the conterminous United States. In Proceedings of the 16th Sinkhole Conference 2020, San Juan, PR, USA, 20–24 April 2020; pp. 315–326. [Google Scholar] [CrossRef]
- Obu, J.; Podobnikar, T. Algorithm for karst depression recognition using digital terrain models. Geod. Vestn. 2013, 57, 260–270. [Google Scholar] [CrossRef]
- Garas, K.L.; Madrigal, M.F.B.; Agot, R.D.D.; Canlas, M.C.M.; Manzano, L.S.J. Karst depression detection using IFSAR-DEM: A tool for subsidence hazard assessment in Panglao, Bohol. Carsologica Sin. 2020, 928–936. [Google Scholar] [CrossRef]
- Kobal, M.; Bertoncelj, I.; Pirotti, F.; Kutnar, L. Lidar Processing for Defining Sinkhole Characteristics under Dense Forest Cover: A Case Study in the Dinaric Mountains. Int. Arch. Photogramm. Remote Sens. Spat. Inf. Sci. 2014, XL-7, 113–118. [Google Scholar] [CrossRef] [Green Version]
- Kobal, M.; Bertoncelj, I.; Pirotti, F.; Dakskobler, I.; Kutnar, L. Using Lidar Data to Analyse Sinkhole Characteristics Relevant for Understory Vegetation under Forest Cover—Case Study of a High Karst Area in the Dinaric Mountains. PLoS ONE 2015, 10, e0122070. [Google Scholar] [CrossRef] [PubMed] [Green Version]
- Bauer, C. Analysis of dolines using multiple methods applied to airborne laser scanning data. Geomorphology 2015, 250, 78–88. [Google Scholar] [CrossRef]
- Telbisz, T.; Látos, T.; Deák, M.; Székely, B.; Koma, Z.; Standovár, T. The advantage of lidar digital terrain models in doline morphometry compared to topographic map based datasets—Aggtelek karst (Hungary) as an example. Acta Carsologica 2016, 45, 5–18. [Google Scholar] [CrossRef]
- Wu, Q.; Deng, C.; Chen, Z. Automated delineation of karst sinkholes from LiDAR-derived digital elevation models. Geomorphology 2016, 266, 1–10. [Google Scholar] [CrossRef]
- Hofierka, J.; Gallay, M.; Bandura, P.; Šašak, J. Identification of Karst Sinkholes in a Forested Karst Landscape Using Airborne Laser Scanning Data and Water Flow Analysis. Geomorphology 2018, 308, 265–277. [Google Scholar] [CrossRef]
- Grlj, A. Omejevanje kraških kotanj z analizo polrezov. Dela 2020, 53, 5–22. [Google Scholar] [CrossRef]
- Melis, M.T.; Pisani, L.; De Waele, J. On the Use of Tri-Stereo Pleiades Images for the Morphometric Measurement of Dolines in the Basaltic Plateau of Azrou (Middle Atlas, Morocco). Remote Sens. 2021, 13, 4087. [Google Scholar] [CrossRef]
- Doctor, D.; Young, J. An Evaluation of Automated GIS Tools for Delineating Karst Sinkholes and Closed Depressions from 1-Meter Lidar-Derived Digital Elevation Data. In Proceedings of the Thirteenth Multidisciplinary Conference on Sinkholes and the Engineering and Environmental Impacts of Karst, Carlsbad, NM, USA, 6–10 May 2013; pp. 449–458. [Google Scholar] [CrossRef] [Green Version]
- Grlj, A.; Grigillo, D. Uporaba digitalnega modela višin in satelitskega posnetka RapidEye za zaznavanje kraških kotanj in brezstropih jam Podgorskega krasa. Dela 2014, 42, 129–147. [Google Scholar] [CrossRef]
- Mihevc, A.; Mihevc, R. Distribution and morphological characteristics of dolines in Slovenia defined by lidar data sets and machine learning. In Proceedings of the Geophysical Research Abstracts 21, EGU General Assembly 2019, Vienna, Austria, 7–12 April 2019. [Google Scholar]
- Silberzahn, R.; Uhlmann, E.L.; Martin, D.P.; Anselmi, P.; Aust, F.; Awtrey, E.; Bahník, Š.; Bai, F.; Bannard, C.; Bonnier, E.; et al. Many analysts, one data set: Making transparent how variations in analytic choices affect results. Adv. Methods Pract. Psychol. Sci. 2018, 1, 337–356. [Google Scholar] [CrossRef] [Green Version]
- Ciglič, R.; Perko, D. Modelling as a Method for Evaluating Natural Landscape Typology: The Case of Slovenia. In Landscape Analysis and Planning; Geographical Perspectives; Springer: Cham, Switzerland, 2015; pp. 59–79. [Google Scholar] [CrossRef]
- Ciglič, R. Assessing the Impact of Input Data Incongruity in Selected Quantitative Methods for Modelling Natural Landscape Typologies. Geogr. Vestn. 2018, 90, 115–141. [Google Scholar] [CrossRef] [Green Version]
- Bondesan, A.; Meneghel, M.; Sauro, U. Morpho-metric analysis of dolines. Int. J. Speleol. 1992, 21, 1–55. [Google Scholar] [CrossRef] [Green Version]
- Šušteršič, F. Classic dolines of classical site. Acta Carsologica 1994, 23, 123–152. [Google Scholar]
- Ćalić, J. Uvala—Contribution to the Study of Karst Depressions (with Selected Examples from Dinarides and Carpatho-Balkanides). Ph.D. Thesis, University of Nova Gorica, Nova Gorica, Slovenia, 2009; p. 213. [Google Scholar]
- Telbisz, T.; Dragušica, H.; Nagy, B. Doline Mor-phometric Analysis and Karst Morphology of Bio-kovo Mt (Croatia) Based on Field Observations and Digital Terrain Analysis. Hrvat. Geogr. Glas. 2009, 71, 5–22. [Google Scholar] [CrossRef] [Green Version]
- Šegina, E.; Benac, Č.; Rubinić, J.; Knez, M. Morphometric analyses of dolines—The problem of delineation and calculation of basic parameters. Acta Carsologica 2018, 47, 23–33. [Google Scholar] [CrossRef]
- Wu, Q.; Lane, C.R.; Wang, L.; Vanderhoof, M.K.; Christensen, J.R.; Liu, H. Efficient Delineation of Nested Depression Hierarchy in Digital Elevation Models for Hydrological Analysis Using Level-Set Method. J. Am. Water Resour. Assoc. 2018, 55, 354–368. [Google Scholar] [CrossRef] [PubMed]
- Ciglič, R.; Perko, D. Europe’s Landscape Hotspots. Acta Geogr. Slov. 2013, 53, 117–139. [Google Scholar] [CrossRef] [Green Version]
- Gams, I. Kras v Sloveniji v Prostoru in Času, 2nd ed.; Založba ZRC: Ljubljana, Slovenia, 2004. [Google Scholar]
- Triglav Čekada, M.; Bric, V. Končan je projekt laserskega skeniranja Slovenije/The project of laser scanning of Slovenia is completed. Geod. Vestn. 2015, 59, 586–592. [Google Scholar]
- Lidberg, W.; Nilsson, M.; Lundmark, T.; Ågren, A.M. Evaluating Preprocessing Methods of Digital Elevation Models for Hydrological Modelling. Hydrol. Process. 2017, 31, 4660–4668. [Google Scholar] [CrossRef] [Green Version]
- Stepišnik, U. Udornice v Sloveniji, 1st ed.; Znanstvena Založba Filozofske Fakultete Univerze v Ljubljani: Ljubljana, Slovenia, 2017. [Google Scholar]
- Sappington, J.M.; Longshore, K.M.; Thompson, D.B. Quantifying Landscape Ruggedness for Animal Habitat Analysis: A Case Study Using Bighorn Sheep in the Mojave Desert. J. Wildlife Manag. 2007, 71, 1419–1426. [Google Scholar] [CrossRef]
- Erdbrügger, J.; van Meerveld, I.; Bishop, K.; Seibert, J. Effect of DEM-smoothing and -aggregation on topographically-based flow directions and catchment boundaries. J. Hydrol. 2021, 602, 126717. [Google Scholar] [CrossRef]
- Ciglič, R. Subjektivnost pri metodi segmentacije. In Geografski Informacijski Sistemi v Sloveniji 2009–2010, 1st ed.; Perko, D., Zorn, M., Eds.; GIS v Sloveniji 10; Založba ZRC: Ljubljana, Slovenia, 2010; pp. 53–63. [Google Scholar]
- Gostinčar, P.; Ciglič, R. Large-scale geomorphological mapping: Fieldwork vs. GIS—Examples from Slovenia. In Proceedings of the Congress Programme and Abstracts, EUGEO Budapest 2015, Budapest, Hungary, 30 August–2 September 2015; p. 133. [Google Scholar]
- Peucker, T.K.; Douglas, D.H. Detection of surface-specific points by local parallel processing of discrete terrain elevation data. Comput. Vision. Graph. 1975, 4, 375–387. [Google Scholar] [CrossRef]
- Nicod, J.; Salomon, J.N. Impacts of agricultural transformation on the principal karstic regions of France. Int. J. Speleol. 1999, 28, 15–31. [Google Scholar] [CrossRef] [Green Version]
- Hoai, N.V.; Dung, N.M.; Ro, S. Sinkhole Detection by Deep Learning and Data Association. In Proceedings of the 2019 Eleventh International Conference on Ubiquitous and Future Networks (ICUFN), Zagreb, Croatia, 2–5 July 2019. [Google Scholar] [CrossRef]
- Babič, M.; Huber, M.A.; Bielecka, E.; Soycan, M.; Przegon, W.; Gigović, L.; Drobnjak, S.; Sekulović, D.; Pogarčić, I.; Miliaresis, G.; et al. New Method of Visibility Network and Statistical Pattern Network Recognition Usage in Terrain Surfaces. Mater. Geoenvironment 2019, 66, 13–25. [Google Scholar] [CrossRef] [Green Version]
- Drăguţ, L.; Eisank, C. Automated Object-Based Classification of Topography from SRTM Data. Geomorphology 2012, 141–142, 21–33. [Google Scholar] [CrossRef] [Green Version]
- Wieczorek, M.; Migoń, P. Automatic relief classification versus expert and field based landform classification for the medium-altitude mountain range, the Sudetes, SW Poland. Geomorphology 2015, 206, 133–146. [Google Scholar] [CrossRef]
- Novak, A.; Oštir, K. Towards Better Visualisation of Alpine Quaternary Landform Features on High-Resolution Digital Elevation Models. Remote Sens. 2021, 13, 4211. [Google Scholar] [CrossRef]
- Čonč, Š.; Oliveira, T.; Portas, R.; Černe, R.; Breg Valjavec, M.; Krofel, M. Dolines and Cats: Remote Detection of Karst Depressions and Their Application to Study Wild Felid Ecology. Remote Sens. 2022, 14, 656. [Google Scholar] [CrossRef]
- Bátori, Z.; Vojtkó, A.; Keppel, G.; Tölgyesi, C.; Čarni, A.; Zorn, M.; Farkas, T.; Erdős, L.; Kiss, P.J.; Módra, G.; et al. Anthropogenic disturbances alter the conservation value of karst dolines. Biodivers. Conserv. 2020, 29, 503–525. [Google Scholar] [CrossRef] [Green Version]
- Čarni, A.; Čonč, Š.; Breg Valjavec, M. Landform-vegetation units in karstic depressions (dolines) evaluated by indicator plant species and Ellenberg indicator values. Ecol. Indic. 2022, 135, 108572. [Google Scholar] [CrossRef]
- Breg Valjavec, M.; Ciglič, R.; Oštir, K.; Ribeiro, D. Modelling habitats in karst landscape by integrating remote sensing and topography data. Open Geosci. 2018, 10, 137–156. [Google Scholar] [CrossRef]


| Code | Description |
|---|---|
| DEPTH | Depth (highest elevation − lowest elevation) |
| AREA | Surface area |
| ELONG | Elongation (length of the major axis/length of the minor axis [15]) |
| VOL | Volume (surface area × average depth) |
| CIRCB | Circularity (Circularity index, [15]) Ai surface area of a depression, Pi perimeter length of a depression. |
| RAT_DP | Ratio between the depth and the width (depth/perimeter length of the theoretical circle) |
| HDIST | Horizontal distance between the 2D centroid and the lowest point |
| ORIENT | Orientation of the line centroid–lowest point (in 0–180°; 0° is east, 180° is west) |
| RAT_DD | Ration of the horizontal distance between the 2D centroid to the lowest point and the length of the major axis (horizontal distance between the 2D centroid and the lowest point/length of the major axis) |
| SLOPE | Average slope |
| SH_3 * | * Share of cells with a slope ≤ 3° |
| VRM_MEAN ** | ** Average VRM value |
| Study Area | Logaško-Begunjski Ravnik | Kras | Matarsko Podolje | ||||||
|---|---|---|---|---|---|---|---|---|---|
| Depression detecting approach | S1, F1 | S1, FS5 | S1, OS | S1, F1 | S1, FS5 | S1, OS | S1, F1 | S1, FS5 | S1, OS |
| Number | 488 | 475 | 482 | 377 | 403 | 368 | 369 | 504 | 366 |
| Density (no./km2) | 122 | 118.75 | 120.5 | 94.25 | 100.75 | 92 | 92.25 | 126 | 91.5 |
| Depression detecting approach | R1, F1 | R1, FS5 | R1, OS | R1, F1 | R1, FS5 | R1, OS | R1, F1 | R1, FS5 | R1, OS |
| Number | 490 | 442 | 491 | 364 | 366 | 364 | 497 | 504 | 498 |
| Density (no./km2) | 122.5 | 110.5 | 122.75 | 91 | 91.5 | 91 | 124.25 | 126 | 124.5 |
| Study Area | Surface Area (m2) | ||||||
|---|---|---|---|---|---|---|---|
| Detected in 1/6 Approaches | Detected in 2/6 Approaches | Detected in 3/6 Approaches | Detected in 4/6 Approaches | Detected in 5/6 Approaches | Detected in 6/6 Approaches | Union of All | |
| Kras | 124,682 | 101,033 | 58,087 | 176,967 | 8503 | 141,831 | 611,103 |
| Matarsko podolje | 134,211 | 89,296 | 54,272 | 202,017 | 10,685 | 197,927 | 688,408 |
| Logaško-begunjski ravnik | 48,328 | 54,403 | 23,201 | 89,770 | 15,291 | 205,789 | 436,782 |
| Study Area | Logaško-Begunjski Ravnik (nTTN5 = 154) | Kras (nTTN5 = 414) | Matarsko Podolje (nTTN5 = 486) | ||||||
|---|---|---|---|---|---|---|---|---|---|
| Depression detecting approach | S1, F1 | S1, FS5 | S1, OS | S1, F1 | S1, FS5 | S1, OS | S1, F1 | S1, FS5 | S1, OS |
| Total number of detected dolines | 488 | 475 | 482 | 377 | 403 | 368 | 369 | 504 | 366 |
| Number of matching (true positives) | 126 | 142 | 125 | 282 | 338 | 278 | 287 | 427 | 286 |
| Recall (%) | 81.82 | 92.21 | 81.17 | 68.12 | 81.64 | 67.15 | 59.05 | 87.86 | 58.85 |
| Precision (%) | 25.82 | 29.89 | 25.93 | 74.80 | 83.87 | 75.54 | 77.78 | 84.72 | 78.14 |
| Depression detecting approach | R1, F1 | R1, FS5 | R1, OS | R1, F1 | R1, FS5 | R1, OS | R1, F1 | R1, FS5 | R1, OS |
| Total number | 490 | 442 | 491 | 364 | 366 | 364 | 497 | 504 | 498 |
| Number of matching (true positives) | 146 | 140 | 147 | 312 | 317 | 312 | 415 | 430 | 415 |
| Recall (%) | 94.81 | 90.91 | 95.45 | 75.36 | 76.57 | 75.36 | 85.39 | 88.48 | 85.39 |
| Precision (%) | 29.80 | 31.67 | 29.94 | 85.71 | 86.61 | 85.71 | 83.50 | 85.32 | 83.33 |
| Comparison Kras: Matarsko Podolje | ||||||||||||
| Detection and preprocessing approach | AREA | VOL | RAT_ | CIRCB | RAT_ | SH_3 | ||||||
| HDIST | DD | ELONG | DP | ORIENT | SLOPE | VRM_ | DEPTH | |||||
| MEAN | ||||||||||||
| R1, F1 | 0 | 0.001 | 0.902 | 0 | 0.225 | 0.787 | 0 | 0 | 0 | 0 | 0 | 0.014 |
| R1, FS5 | 0.005 | 0.018 | 0 | 0 | 0.345 | 0.517 | 0 | 0 | 0 | 0 | 0 | 0.003 |
| R1, OS | 0 | 0.001 | 0.896 | 0 | 0.238 | 0.883 | 0 | 0 | 0 | 0 | 0 | 0.013 |
| S1, F1 | 0.029 | 0.001 | 0 | 0 | 0 | 0 | 0 | 0 | 0.06 | 0 | 0 | 0.766 |
| S1, FS5 | 0.34 | 0.015 | 0 | 0 | 0 | 0 | 0 | 0 | 0.697 | 0 | 0 | 0.023 |
| S1, OS | 0 | 0 | 0 | 0 | 0 | 0 | 0 | 0 | 0.46 | 0 | 0 | 0.935 |
| Comparison Matarsko Podolje: Logaško-Begunjski Ravnik | ||||||||||||
| Detection and preprocessing approach | AREA | VOL | RAT_ | CIRCB | RAT_ | SH_3 | ||||||
| HDIST | DD | ELONG | DP | ORIENT | SLOPE | VRM_ | DEPTH | |||||
| MEAN | ||||||||||||
| R1, F1 | 0 | 0 | 0 | 0 | 0.292 | 0.209 | 0 | 0.925 | 0 | 0 | 0 | 0.016 |
| R1, FS5 | 0 | 0 | 0 | 0 | 0.463 | 0.008 | 0 | 0.383 | 0 | 0 | 0 | 0 |
| R1, OS | 0 | 0 | 0 | 0 | 0.274 | 0.216 | 0 | 0.93 | 0 | 0 | 0 | 0.015 |
| S1, F1 | 0 | 0 | 0 | 0 | 0.305 | 0.623 | 0.002 | 0.873 | 0 | 0 | 0 | 0.014 |
| S1, FS5 | 0 | 0 | 0 | 0 | 0.988 | 0.01 | 0 | 0.074 | 0 | 0 | 0 | 0.001 |
| S1, OS | 0 | 0 | 0 | 0 | 0.386 | 0.097 | 0.002 | 0.991 | 0 | 0 | 0 | 0.012 |
| Comparison Kras: Logaško-Begunjski Ravnik | ||||||||||||
| Detection and preprocessing approach | AREA | VOL | RAT_ | CIRCB | RAT_ | SH_3 | ||||||
| HDIST | DD | ELONG | DP | ORIENT | SLOPE | VRM_ | DEPTH | |||||
| MEAN | ||||||||||||
| R1, F1 | 0.698 | 0.037 | 0 | 0 | 0.033 | 0.185 | 0 | 0 | 0 | 0.376 | 0 | 0 |
| R1, FS5 | 0 | 0.001 | 0 | 0 | 0.818 | 0.07 | 0 | 0 | 0.958 | 0.453 | 0 | 0 |
| R1, OS | 0.711 | 0.036 | 0 | 0 | 0.033 | 0.239 | 0 | 0 | 0 | 0.406 | 0 | 0 |
| S1, F1 | 0.166 | 0.785 | 0 | 0 | 0 | 0 | 0.058 | 0 | 0 | 0 | 0.002 | 0.032 |
| S1, FS5 | 0 | 0.003 | 0 | 0 | 0 | 0 | 0.089 | 0 | 0 | 0 | 0.069 | 0 |
| S1, OS | 0.927 | 0.421 | 0 | 0 | 0.002 | 0 | 0.001 | 0 | 0.004 | 0 | 0 | 0.048 |
| Study Area | VRM (Mean ± SD) | TRI (Mean ± SD) |
|---|---|---|
| Logaško-begunjski ravnik | 0.0042 ± 0.0055 | 0.8248 ± 0.4255 |
| Kras | 0.0033 ± 0.0147 | 0.4606 ± 1.0060 |
| Matarsko podolje | 0.0033 ± 0.0061 | 0.6808 ± 0.4401 |
Publisher’s Note: MDPI stays neutral with regard to jurisdictional claims in published maps and institutional affiliations. |
© 2022 by the authors. Licensee MDPI, Basel, Switzerland. This article is an open access article distributed under the terms and conditions of the Creative Commons Attribution (CC BY) license (https://creativecommons.org/licenses/by/4.0/).
Share and Cite
Ciglič, R.; Čonč, Š.; Breg Valjavec, M. The Impact of Digital Elevation Model Preprocessing and Detection Methods on Karst Depression Mapping in Densely Forested Dinaric Mountains. Remote Sens. 2022, 14, 2416. https://0-doi-org.brum.beds.ac.uk/10.3390/rs14102416
Ciglič R, Čonč Š, Breg Valjavec M. The Impact of Digital Elevation Model Preprocessing and Detection Methods on Karst Depression Mapping in Densely Forested Dinaric Mountains. Remote Sensing. 2022; 14(10):2416. https://0-doi-org.brum.beds.ac.uk/10.3390/rs14102416
Chicago/Turabian StyleCiglič, Rok, Špela Čonč, and Mateja Breg Valjavec. 2022. "The Impact of Digital Elevation Model Preprocessing and Detection Methods on Karst Depression Mapping in Densely Forested Dinaric Mountains" Remote Sensing 14, no. 10: 2416. https://0-doi-org.brum.beds.ac.uk/10.3390/rs14102416