Review

Visible and Infrared Remote Imaging of Hazardous Waste: A Review

1
U.S. Geological Survey Eastern Geographic Science Center, 12201 Sunrise Valley Drive, Ms 521, Reston, VA 20192, USA
2
Department of Geography and Geoinformation Science, George Mason University, Fairfax, VA 22030, USA
*
Author to whom correspondence should be addressed.
Remote Sens. 2010, 2(11), 2474-2508; https://0-doi-org.brum.beds.ac.uk/10.3390/rs2112474
Submission received: 21 September 2010 / Revised: 2 November 2010 / Accepted: 2 November 2010 / Published: 5 November 2010

Abstract

:
One of the critical global environmental problems is human and ecological exposure to hazardous wastes from agricultural, industrial, military and mining activities. These wastes often include heavy metals, hydrocarbons and other organic chemicals. Traditional field and laboratory detection and monitoring of these wastes are generally expensive and time consuming. The synoptic perspective of overhead remote imaging can be very useful for the detection and remediation of hazardous wastes. Aerial photography has a long and effective record in waste site evaluations. Aerial photographic archives allow temporal evaluation and change detection by visual interpretation. Multispectral aircraft and satellite systems have been successfully employed in both spectral and morphological analysis of hazardous wastes on the landscape and emerging hyperspectral sensors have permitted determination of the specific contaminants by processing strategies using the tens or hundreds of acquired wavelengths in the solar reflected and/or thermal infrared parts of the electromagnetic spectrum. This paper reviews the literature of remote sensing and overhead imaging in the context of hazardous waste and discusses future monitoring needs and emerging scientific research areas.

1. Introduction

The intentional or accidental release of hazardous substances into the environment is an inevitable consequence of anthropogenic activity. Industrial, commercial, mining, military and even domestic activities can result in the release of substances into the air, land and water that are harmful to environmental quality and human health. The combined industrialization and population growth of the twentieth century has resulted in unprecedented events of fugitive, transitory, and ephemeral releases of contamination that today threaten many plant and animal species and may ultimately threaten the survival of the human race [1]. The detection and remediation of many hazardous waste problems consist of a variety of monitoring and analysis strategies that are time-consuming and expensive, such as laboratory chemical analysis. One of the technologies that has an established and growing potential to provide a non-contact and cost-effective alternative to traditional sampling methods is remote sensing. Hazardous waste control, monitoring, remediation and related issues result in a staggering cost to society in terms of human and ecological health effects, negative externalities on real estate values (i.e., the ‘stigma’ of contamination) and the extraordinary burden of a massive regulatory infrastructure on economic productivity. The United States Environmental Protection Agency (USEPA) estimates that complying with hazardous waste regulations cost U.S. businesses nearly $32 billion in 2000 [2]. The use of more efficient remote sensing methods could reduce these societal costs. The purpose of this study is to review the potential to provide relevant information to the hazardous waste remediation process through the use of both traditional and emerging passive remote sensing imaging technologies.

1.1. The Definition of Hazardous Waste

Substances are considered hazardous wastes if they are ignitable—capable of burning or causing a fire; corrosive—able to corrode steel or harm organisms because of extreme acidic or basic properties; reactive—able to explode or produce toxic gasses such as cyanide or sulfide; or toxic—containing substances that are poisonous to people and other organisms [3]. In the U.S., the regulatory definition of hazardous substances are detailed in the Resource Conservation and Recovery Act (RCRA) and can be found under specific listings, along with accepted testing methods, in Chapter 40, Code of Federal Regulations, Section 261(40 CFR § 261) [3].
Most hazardous waste is the by-product of industrial or commercial manufacturing processes but significant levels of hazardous substances are also associated with agricultural chemicals such as pesticides. There is a distinction between widely dispersed contaminants such as agricultural pesticides known as non-point sources and point sources such as an industrial site. Even household waste contains substances such as bleach, gasoline, batteries and solvents that qualify as hazardous wastes. Hazardous waste can also be naturally occurring substances, such as heavy metals like lead and mercury that are brought into much higher than normal exposure concentrations by anthropogenic processes.

1.2. The Regulation of Hazardous Waste

In the U.S., hazardous waste and hazardous waste cleanup are regulated by two federal statutes that are administered by the USEPA. The Resource Conservation and Recovery Act (RCRA) was enacted by Congress in 1976 in order to (1) protect human health and the environment from the potential hazards of waste disposal, (2) conserve energy and natural resources and to reduce the amount of waste generated, and (3) ensure that waste is managed in an environmentally sound manner. The Comprehensive Environmental Response, Compensation, and Liability Act (CERCLA) of 1980, commonly known as Superfund, [4], and the 1986 Superfund Amendments and Reauthorization Act (SARA) [5] provide strict guidelines regarding the responsibility of past and present property owners, as well as others, for the cost of toxic-waste cleanup. Superfund empowers the USEPA to compel the owner of property contaminated by hazardous substances to clean up the site. Alternatively, the USEPA can conduct an immediate cleanup and obtain reimbursement from the responsible parties at a later date. Hazardous waste regulations vary tremendously from none or little if any enforcement in some countries to very strict controls in others. There have also been international agreements on this issue as presented in the next section.

1.3. Worldwide Concerns

On a global scale, the issue of hazardous waste is very serious. During the 1980s, the development of strict environmental controls on hazardous waste in industrialized countries, such as the Superfund Act in the U.S., resulted in a black market for unregulated translocation of hazardous wastes, especially from industrialized to developing countries [6]. The movement of hazardous waste between international boundaries, and international outrage at the large scale activities of these “toxic traders,” led to the adoption of an international treaty known as the Basel Convention in 1989 [7].
Both the Basel Convention and the Rotterdam Convention of 1998 sought to stem the trans-boundary movement of hazardous substances and hazardous waste. The central goal of the Basel Convention was “environmentally sound management” to protect human health and the environment by minimizing hazardous waste production whenever possible and promoting an “integrated life-cycle approach” to hazardous waste management, which involves promoting institutional controls from the generation of a hazardous waste to its storage, transport, treatment, reuse, recycling, recovery and final disposal [8].
After the Basel Convention was adopted it was viewed by several groups, developing countries, Greenpeace, and the Nordic states in particular, as insufficient to fully ban hazardous waste trafficking [9]. In the mid-1990s the Basel Convention was amended with a clear ban on hazardous waste exports. The Rotterdam Convention of 1998 established an international law of shared responsibility between exporting and importing countries for the notification and monitoring of hazardous wastes that are known to have harmful effects on human health and the environment. Since the adoption of the Basel Convention and the Rotterdam Convention there are two international hazardous waste disposal issues currently receiving the most concern and attention amongst government agencies, and environmental and health advocate organizations: electronic-waste (e-waste) and shipbreaking or ship recycling. The U.S. and other developed countries export e-waste, which contains hazardous substances used in their manufacture primarily to Asia [10]. Threats to the environment and occupational health hazards are both major problems reported from e-waste processing activities in developing nations. Rudimentary e-waste processing and recycling facilities have led to excessive releases of heavy metals and other contaminants into the environment [11,12]. Table 1 shows the basic characteristics and analytical techniques of the remote sensing methods reviewed here.
Table 1. Imaging sensors and analysis methods used for hazardous waste analysis and reviewed here.
SensorFormatSpectral ResolutionSpectral RangeAnalysis MethodsComment
Aerial Photos Film, digitalBroadbandVIS-NIR
400–900 nm
Manual interpretationCan be analyzed digitally also.
Satellite ImageryDigitalBroadband MultispectralVIS-NIR
400–2,200 nm
Image processingCan be analyzed manually also.
TIR ImageryFilm, digitalBroadbandThermal Infrared
8,000–14,000 nm
Manual and digital methods
Solar Reflected HyperspectralDigitalNarrowSolar-reflected
400–2,500 nm
Spectroscopic
Thermal HyperspectralDigitalNarrowThermal IR
8,000-14.000 nm
Spectroscopic

2. Remote Sensing of Hazardous Waste

The process of discovering, characterizing and remediating fugitive contaminants is typically a long and costly endeavor [13]. In the hazardous waste remediation process, one of the key steps is site characterization, the determination of the spatial extent, concentrations and nature of the contamination. Site characterization traditionally requires extensive field sampling and laboratory analysis. One technology that has been valuable in cleanup efforts and shows promise in providing an alternative to field sampling methods is remote sensing.
Remote sensing is a generic term that encompasses a body of non-contact monitoring techniques that measure energy-matter interactions to determine the characteristics of a target surface or medium. Although remote sensing includes a wide variety of instruments and methods, such as Light Detection and Ranging (LiDAR), radar, X-ray technology and acoustic instruments, it is most often associated with overhead imaging techniques, such as aerial photography and satellite imagery that record energy in the solar-reflected part of the electromagnetic spectrum (EMS) between 400 and 2,500 nm wavelengths. Remote sensing has a long history of providing critical information to the process of identifying, characterizing and remediating hazardous waste problems [14,15,16,17]. Further, new and emerging remote sensing techniques show promise for greatly improved methods in characterizing site conditions and providing critical information to the hazardous waste cleanup process. The purpose of this paper is to review the scientific literature on different forms of passive solar-reflected remote sensing imaging techniques that have been used to identify, characterize, quantify and map the existence and extent of fugitive hazardous wastes in the environment. This review will progress from the earlier, more simplistic but still very effective, use of aerial photography to more complex methods of multispectral and hyperspectral remote sensing. Suggestions for needed research on this topic are also included.

3. Basic Imagery Applications

The most basic use of remotely sensed data for hazardous waste identification involves the visual interpretation of morphological characteristics of production, storage, disposal, transport and effects on the natural environment. Aerial photographs have been used in numerous applications to detect and analyze the presence of hazardous waste, waste-disposal sites and landfills [14,15,16,17,18,19,20,21]. Aerial photos generally have sufficient spatial resolutions for detecting small features and historical archives for comparative temporal analysis. The ability to monitor sites over time is very effective to assess environmental impacts and also to evaluate compliance in remediation cases. Aerial photography has frequently been employed as evidence in the legal process as well. An advantage, and to some degree a disadvantage, of aerial photography is that it generally relies upon visual interpretation by an analyst. Aerial photography is also limited in available spectral resolutions [22,23].
Historic aerial photographs supply the documentation required for analysts to compile a record over time of uncontrolled waste disposal site boundaries, points of access and adjacent land use [24]. USEPA has utilized an extensive archive of aerial photography dating back to the 1930s to reconstruct the waste handling and disposal history of hazardous waste sites. Over 4,000 historical aerial photographic reports on hazardous waste activity have been produced and used in environmental cleanup programs [17,25]. Figure 1 shows the type of landscape morphological analyses that can be produced from a time series of aerial photographs.
Figure 1. Example of historical aerial photo documentation of structural changes at a hazardous waste site. Shoreline is filled and expanded outward between 1950 (a) and 1958 (b). An industrial facility including several large petroleum tanks has been established by 1964 (c). Historical aerial photos, routinely acquired for other purposes easily captures morphological changes on the landscape that reveal import details about hazardous waste facilities. Source: the EPA/Environmental Photographic Interpretation Center (EPIC).
Remotesensing 02 02474 g001
Objects that are interpreted from aerial photography of sites that contain hazardous waste include: evidence of discarded materials [15], barrels and drums [22] (Figure 2), open dumps [26], spills [23] (Figure 3 and Figure 4) and disturbance [15]. Features that can be detected which help to monitor and analyze potential impacts of hazardous waste include: vegetation [14,27], local groundwater movement to investigate potential pollutant migration [20], drainage routes [15], hydrological conditions [14,27] and subsequent land use on closed landfills [27].
Figure 2. An aerial photograph of a drum disposal site. The photo allows counting and documentation of the number of containers and changes over time. Source: The EPA/Environmental Photographic Interpretation Center (EPIC).
Remotesensing 02 02474 g002
Comparative temporal studies of a waste disposal site with historical aerial photography help to determine how an area has changed over time and in turn offers a better understanding of current site conditions [18,21,28]. The use of historical aerial photos highlights the importance for this and other applications of maintaining imagery archives.
Historical aerial photographs are the only remotely sensed data that has recorded conditions as far back as the 1930s [22]. Surveys using historical and current aerial photography have been employed to produce detailed databases on locations of present and former waste sites and adjacent environmental features (e.g., wetlands) and built features (e.g., impoundments). The examination of a site over time allows for the analysis of succession or replacement of land cover to determine the status of an abandoned site and to identify a hazardous site that is currently obscured due to new development [14,22].
Figure 3. A photograph of the Deepwater Horizon oil spill and failed containment booms in coastal wetlands. Source: U.S. Coast Guard.
Remotesensing 02 02474 g003
Figure 4. Oil spill from failed containment of a storage facility during Hurricane Katrina. The spill is represented by a light blue sheen on the water. Source: The EPA/Environmental Photographic Interpretation Center (EPIC).
Remotesensing 02 02474 g004
Aerial photo interpretations of waste disposal locations have been conducted as site specific studies [20,29], and as regional studies to systematically produce an inventory of existing and potential hazardous sites within a certain boundary, such as a county [16,30]. Interpretation of hazardous waste sites from aerial photos can be performed using different equipment and techniques, such as a stereoscope [16,30] or in digital format [21,31], depending on the needs of a project or the experience of the interpreter [29].
Compared to other forms of remotely sensed imagery, aerial photo interpretation is generally a straightforward process due to the map-like qualities of imagery and because it includes wavelengths recognizable, or easily understandable, to the human eye [28]. Typical photography includes black and white, panchromatic, or natural color across the visible portion of the EMS. In addition, color-infrared (CIR) photography which includes the 700–900 nm near-infrared wavelengths helps to detect health and stress of vegetation. Herman et al., obtained CIR photography for five dates to interpret the intensity and extent of vegetation stress on the edge of a superfund site in Michigan and found improvements in vegetation health corresponding to groundwater remediation [29]. The availability of aerial imagery from federal and local government agencies with coverage of the conterminous United States for more than one date ensures that a hazardous waste site has been overflown and site conditions documented for inventory and analysis [22].

4. Multispectral Applications

Multispectral sensors digitally collect reflectance or emittance energy levels in discrete portions of the EMS; often 4–10 separate bands. Advantages of these systems include statistical processing and analysis of the data and extension into sections of the EMS beyond aerial photographic capabilities. Data from multispectral imaging systems such as the Landsat MultiSpectral Scanner (MSS) and Thematic Mapper (TM) and a variety of aircraft-based systems have been utilized to monitor hazardous waste sites with respect to land use, regional risk and the spectral characteristics of specific disposal sites and their pollution profile. Bolviken showed that basic MSS data could be used to identify heavy metal contamination based on basic spectral differences [32]. Herman et al., showed that CIR aerial photography, SPOT and Landsat TM imagery could be used collectively to monitor vegetation stress and recovery at a Superfund site in Michigan [29]. Similarly, Airola and Kosson demonstrated the value of digital analysis of high-resolution aerial photographs and aircraft scanner data as well as Landsat data for broader scale issues such as groundwater migration [31]. Jones and Elgy determined that multispectral data could be used to monitor landfill gas migration and its effect on vegetation [33]. Kwarteng and Al-Enezi demonstrated that multispectral imagery could be used to monitor landfill development and its associated pollution profile [34].
Several researchers have successfully used multispectral imagery to search for and locate illegal, unknown, or uncontrolled hazardous waste sites. Foody and Embashi found that industrially “despoiled” land cover could be reasonably identified and mapped from the multispectral signatures of Landsat TM. Spatial filtering was utilized to enhance the signature of despoiled land and supervised classification, using known areas of waste sites, was utilized to generate maps of industrial and hazardous waste, which compared favorably with ground truth-based maps of known contamination areas [35]. Figure 5 documents the changes in extent of a land fill fusing spaceborne multispectral images over time, and Figure 6 demonstrates the use of multispectral data for hazardous waste site identification.
Figure 5. These two subscenes from the Landsat multispectral sensor show the growth of the Brogbouough land fill area in the United Kingdom. The image on the left is from 1992 and on the right, from 2001. Ottavianelli et al., 2005 [36].
Remotesensing 02 02474 g005
Landsat TM data have been utilized to detect altered surface area due to hydrocarbon microseepages by Almieda-Filho et al. [37]. Utilizing band ratios (TM2/3, TM4/3) and a difference image, features related to a reducing environment that created bleached materials were identified. Similar use of Landsat multispectral data to detect hydrocarbon-induced alterations has been reported by several researchers [38,39,40,41].
Silvestri and Omri [42] used the effects of soil contamination on vegetation reflectance to develop a spectral signature of stressed vegetation from known illegal landfill sites. Using these calibrated signatures, they successfully located numerous candidate sites that are most likely to host waste materials. Using secondary analyses of population densities, road networks and historical aerial photographs, many false positives were eliminated and uncontrolled hazardous waste sites were identified with an accuracy of approximately 60 percent.
Figure 6. Methodology for the identification and mapping of potential uncontrolled hazardous waste sites from multispectral imagery; (a) maximum likelihood classification result showing the most stressed areas in red and the least stressed areas in green, with black showing background unclassified area; (b) the Ikonos Image in standard color combination, used for comparison and (c) mapping of polygon of interest on geo-referenced Ikonos image. From Silvestri and Omri, 2008 [42].
Remotesensing 02 02474 g006

5. Laboratory, Field and Imaging Spectroscopy Applications

5.1. Laboratory and Field Spectroscopy

Spectroscopy is the science of measuring the interaction of energy with matter and is a fundamental form of remote sensing investigation. Spectroscopy has been used extensively in chemistry and astronomy for material identification and, with the development of new instrumentation, is being increasingly utilized in remote sensing investigations. Early laboratory spectroscopic and remote sensing imaging research successfully identified spectral signatures of heavy metal stress in vegetation and applied these techniques to applications involving mineral prospecting and environmental contamination [43,44,45,46,47].
The use of laboratory spectral reflectance methods to gain an understanding of photosynthesis and related vegetative processes is a field of scientific study that has been ongoing for decades [48]. Laboratory instruments called spectrometers, spectrophotometers, spectrographs or spectroradiometers are all different names for instruments that essentially use some type of prism or electro-optical device to separate light into its component discrete wavelengths and measure the reflectance and absorption of those wavelengths from a target surface. Early instruments separated light into the basic colors of the spectrum. Modern instruments separate light into individual nanometers of reflectance energy. Each of these individual wavelengths can react differently to a target surface based on its chemical and/or molecular composition which results in unique or diagnostic data.
In terms of hazardous waste, field and laboratory spectroscopic applications of plants and minerals have identified the relationship between biomass productivity and spectral signatures [49] using a vegetation index based approach. Innovations using high spectral resolution optical remote sensing have indicated that it may be further possible to detect relative concentrations of foliar biochemicals, particularly water, plant pigments, carbon and nitrogen and the stresses that are the result of uptake and/or exposure to materials that would be classified as hazardous wastes. An excellent review of the remote sensing of plant pigments can be found in Blackburn [50].

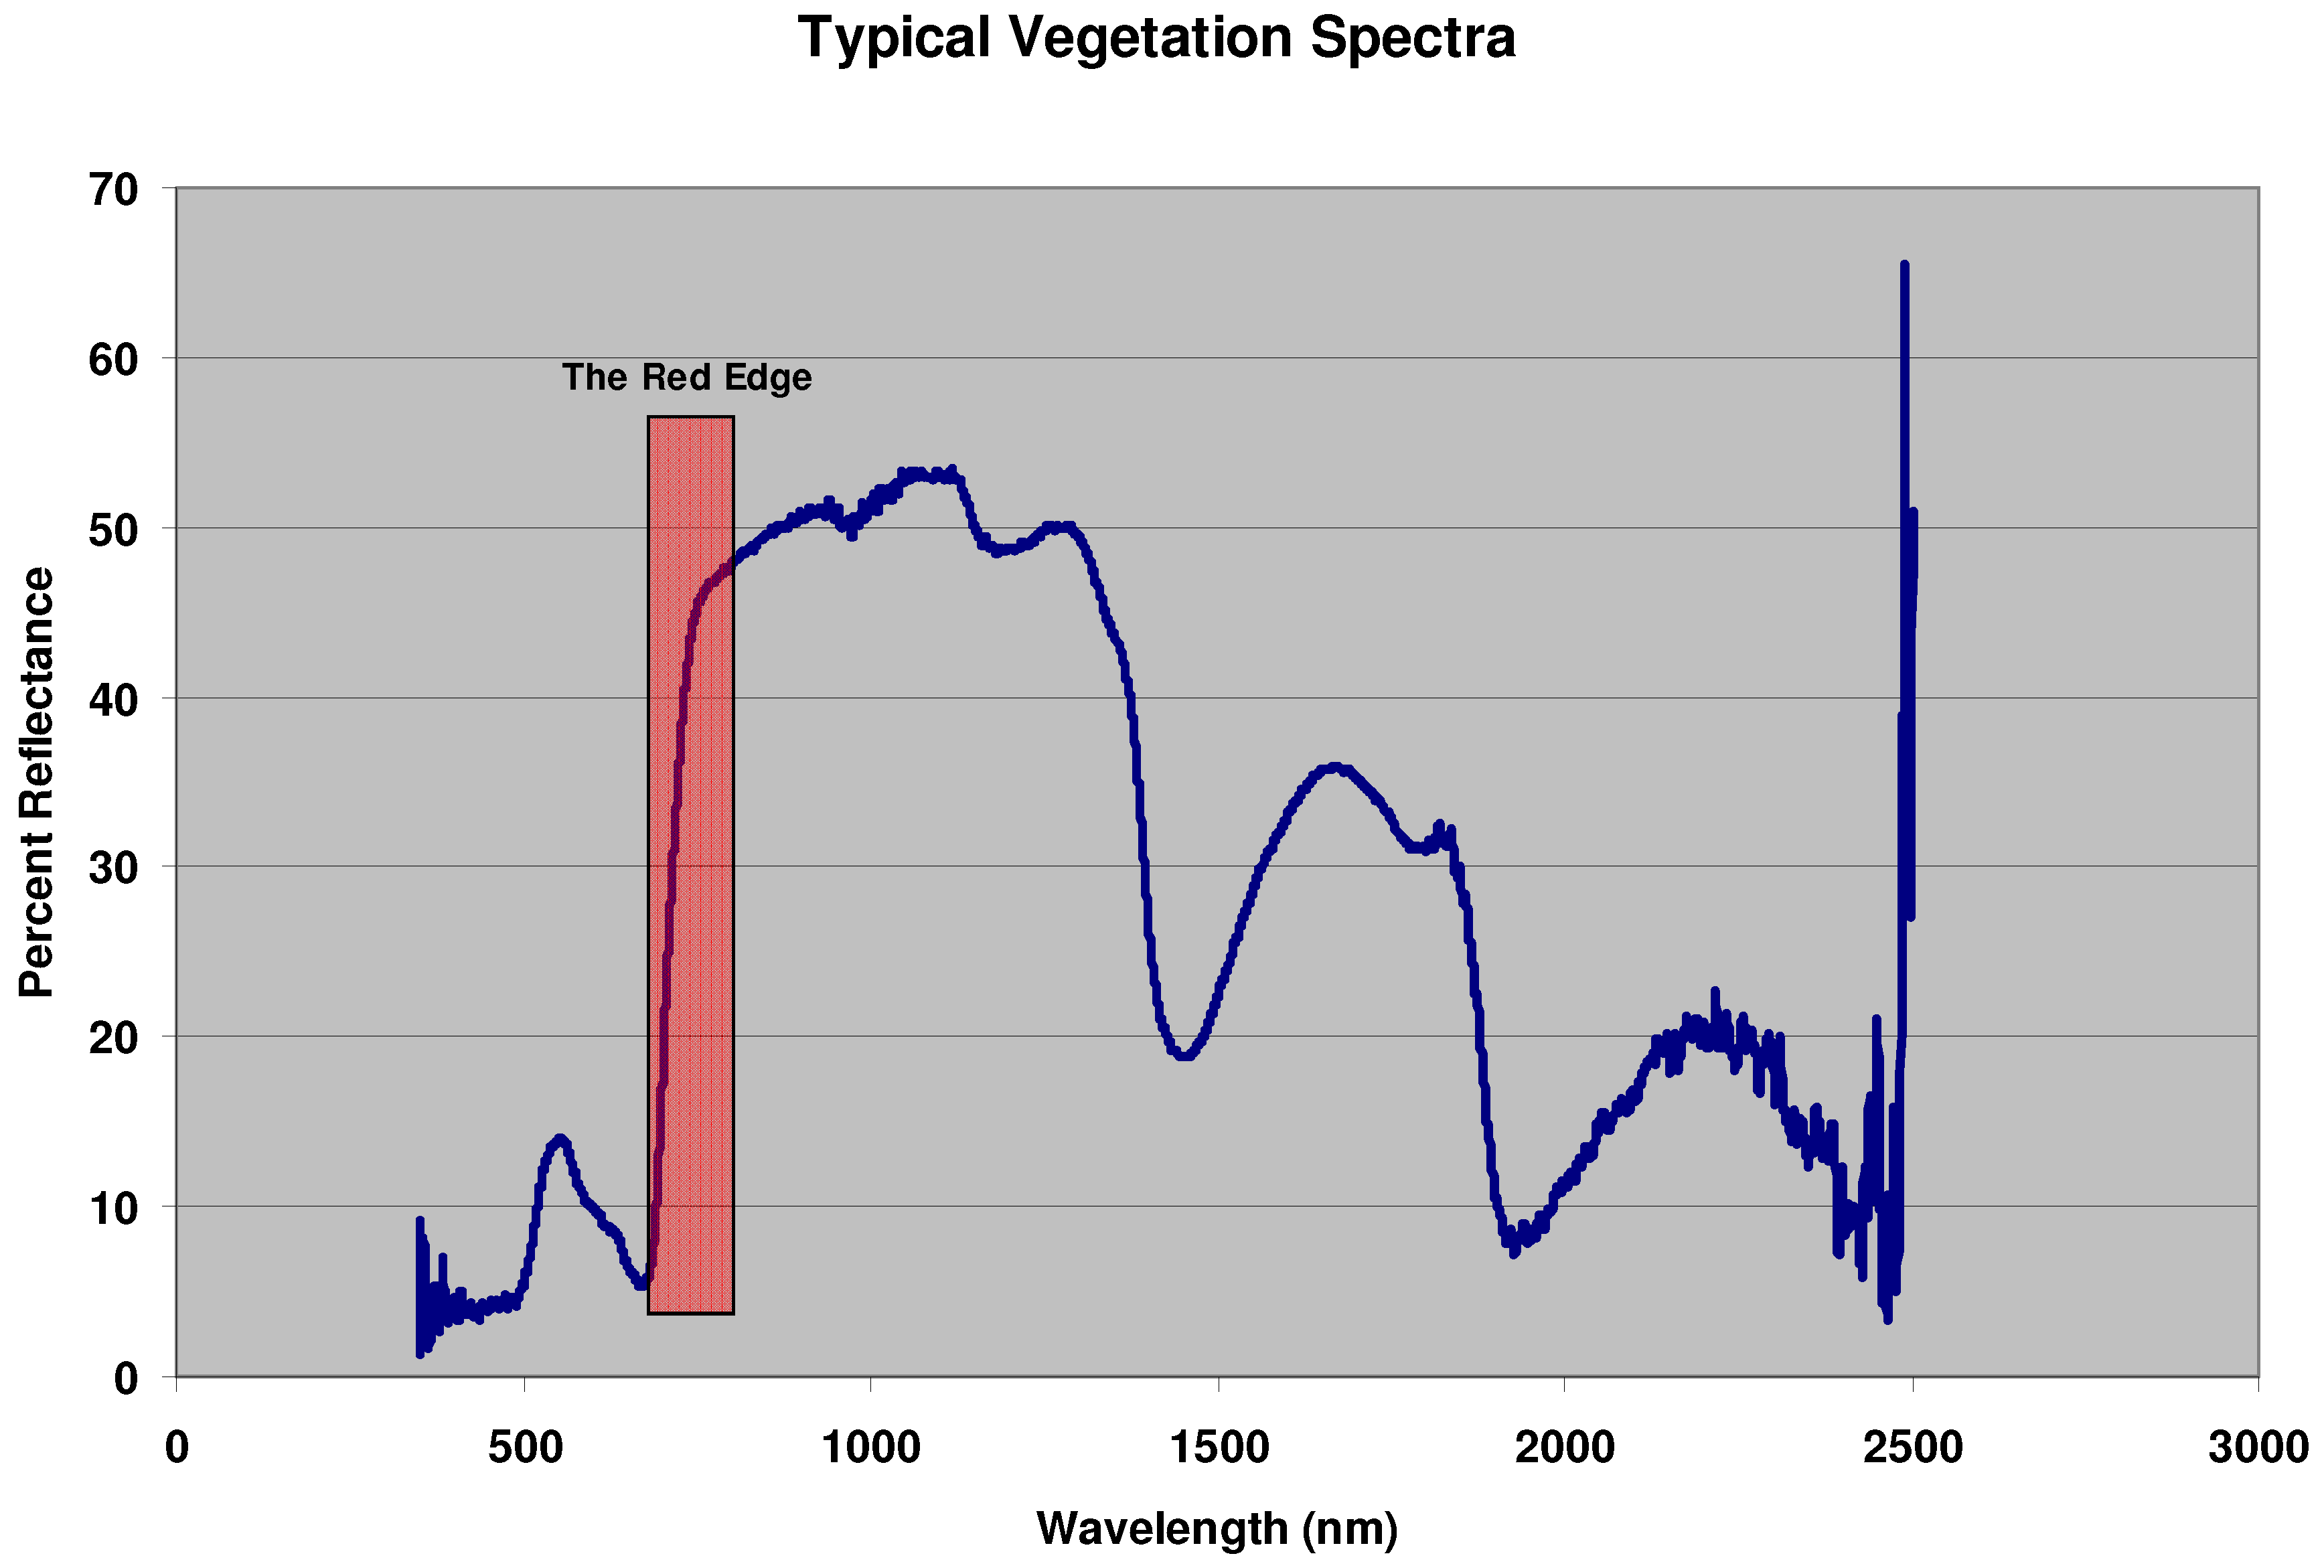
5.2. Vegetation Stress and the Red Edge

One of the fundamental concepts that has been developed in the spectral analysis of vegetation has been the “Red Edge” of vegetation reflectance, an area usually centered on the 720 nm area and represented by the typical sharp rise in reflectance in the 680–760 nm range of the classic vegetation spectral signature. The location, size, shape and shifts in this Red Edge form one of the central concepts in spectral monitoring of vegetation condition (Figure 7).
The spectral characteristics of vegetation have enjoyed a wide range of interest through the years for military, agricultural and environmental applications. Key papers by Gates et al. [48] and Guyot et al. [51] summarize the diverse applications of laboratory spectral research for vegetation studies. All green vegetation shows a similar pattern of spectral reflectance in the visible and near infrared regions. Figure 7 contains the library spectra typical of vegetation illustrating common chlorophyll-based reflectance patterns including the classic bimodal reflectance typical of healthy vegetation. The bimodal reflectance pattern is caused by the chlorophyll absorption of blue and red wavelengths, at about 450 and 680 nm respectively, and by the reflectance of chlorophyll in the green wavelengths causing the peak at around 550 nm. The second larger spectral peak around 780 nm is caused by the internal structure of leaf tissue that reflects significant amounts of energy in the near infrared. This internal mesophyll tissue generally consists of irregularly shaped cells separated by interconnected openings. Infrared radiation is strongly scattered by this structure, which combined with a general decrease in pigment absorption at the edge of the visible portion of the spectrum, causes a significant increase in reflected energy at the edge of the infrared part of the spectrum [52].
Although the general concept of the Red Edge is easily understood as the area of the sharp rise in reflectance, generally between 680 and 760 nm, a variety of definitions and quantitative methods for describing the Red Edge are found in the literature. Ray et al. [53] defined the Red Edge as the sharp transition between absorption by chlorophyll in the visible wavelengths and the strong scattering in the near infrared from the cellular structure of leaves. The Red Edge (λre) is defined by Horler et al. [54] as the wavelength of maximum ΔR/Δλ, where R is reflectance and λ is the specific wavelength. Guyot et al. [51] defines the Red Edge as an inflection in the sharp rise in reflectance between 670 and 760 nm.
Figure 7. An important region of vegetation spectra is known as the Red Edge. Much research has focused on measuring shifts in this region corresponding to stress or enhancement of chlorophyll.
Remotesensing 02 02474 g007
Horler et al. [54] studied the feasibility of utilizing a Red Edge measurement as an indication of plant chlorophyll status. Using derivative reflectance spectroscopy in the laboratory, plant chlorophyll status and Red Edge measurements were made of single leaves of several different species. By using spectroscopic and laboratory methods to measure the chlorophyll content of the same leaf samples, direct evidence of the Red Edge—chlorophyll correlation was obtained. Important was the fact that the correlation was strongest when leaf chlorophyll was described on a leaf-area basis and somewhat weaker on a weight or thickness basis. Ray et al. [53] discovered significant differences in the size and shape of the Red Edge in varied types of arid vegetation and found that for a common yellow grass species, there was no chlorophyll “bump” and no detectable Red Edge.
Another critical analytical feature of spectral analysis of vegetation is the shift in absorption and reflectance features that occur as a result of chemical and nutrient exposures. A general relationship between increases in chlorophyll concentration and a “red shift” towards longer wavelengths has been established by several scientists. Gates et al. observed the basic relationship between the increased chlorophyll and plant health and the shift of the Red Edge towards longer wavelengths [48]. Guyot et al. similarly documented that the Red Edge inflection point shifts to longer red wavelengths as chlorophyll concentrations increase [51].
Collins et al. [43] observed a basic blue shift in conifers affected by metal sulphide in the 700–780 nm region. Horler found blue shifts in tree species subjected to heavy metal concentration in the soil [47]. Similar blue shift results have been reported by Schwaller and Tkach [55] and Milton et al. [44,46]. Rock et al. [56] demonstrated a 5 nm blue shift in spruce and fir species in Vermont and Germany as a result of stress caused by airborne acid deposition. These techniques can be very important in the analysis of hazardous wastes.
Horler [47] studied the effects of heavy metals on the reflectance spectra of plants. Utilizing both natural vegetation growing in known areas of metal concentrations, and specific greenhouse experiments, they established relationships of metal stress to total chlorophyll, chlorophyll a/b ratios and reduced reflectance at specific wavelengths. Controlled experiments with pea plants and other species determined that the general effect of exposure to cadmium (Cd), copper (Cu), lead (Pb) and zinc (Zn) was growth inhibition. Also the pea plants showed changes in the leaf chlorophyll a/b ratios for exposure to Cd and Cu but showed no changes for Pb and Zn. Metal-treated plants in both controlled and natural environments showed a decrease in reflectance at 850, 1,650 and 2,200 nm and an increase at 660 nm. Metal concentration in the soil has strong negative correlations to reflectance at 1,650 and 2,200 nm and strong positive correlations at 660 nm. In general, the ability to measure stress effects from heavy metals is dependent on species, the phase of the growth cycle and the environment. Nonetheless, these relationships are the basis for remote sensing of specific hazardous waste materials.

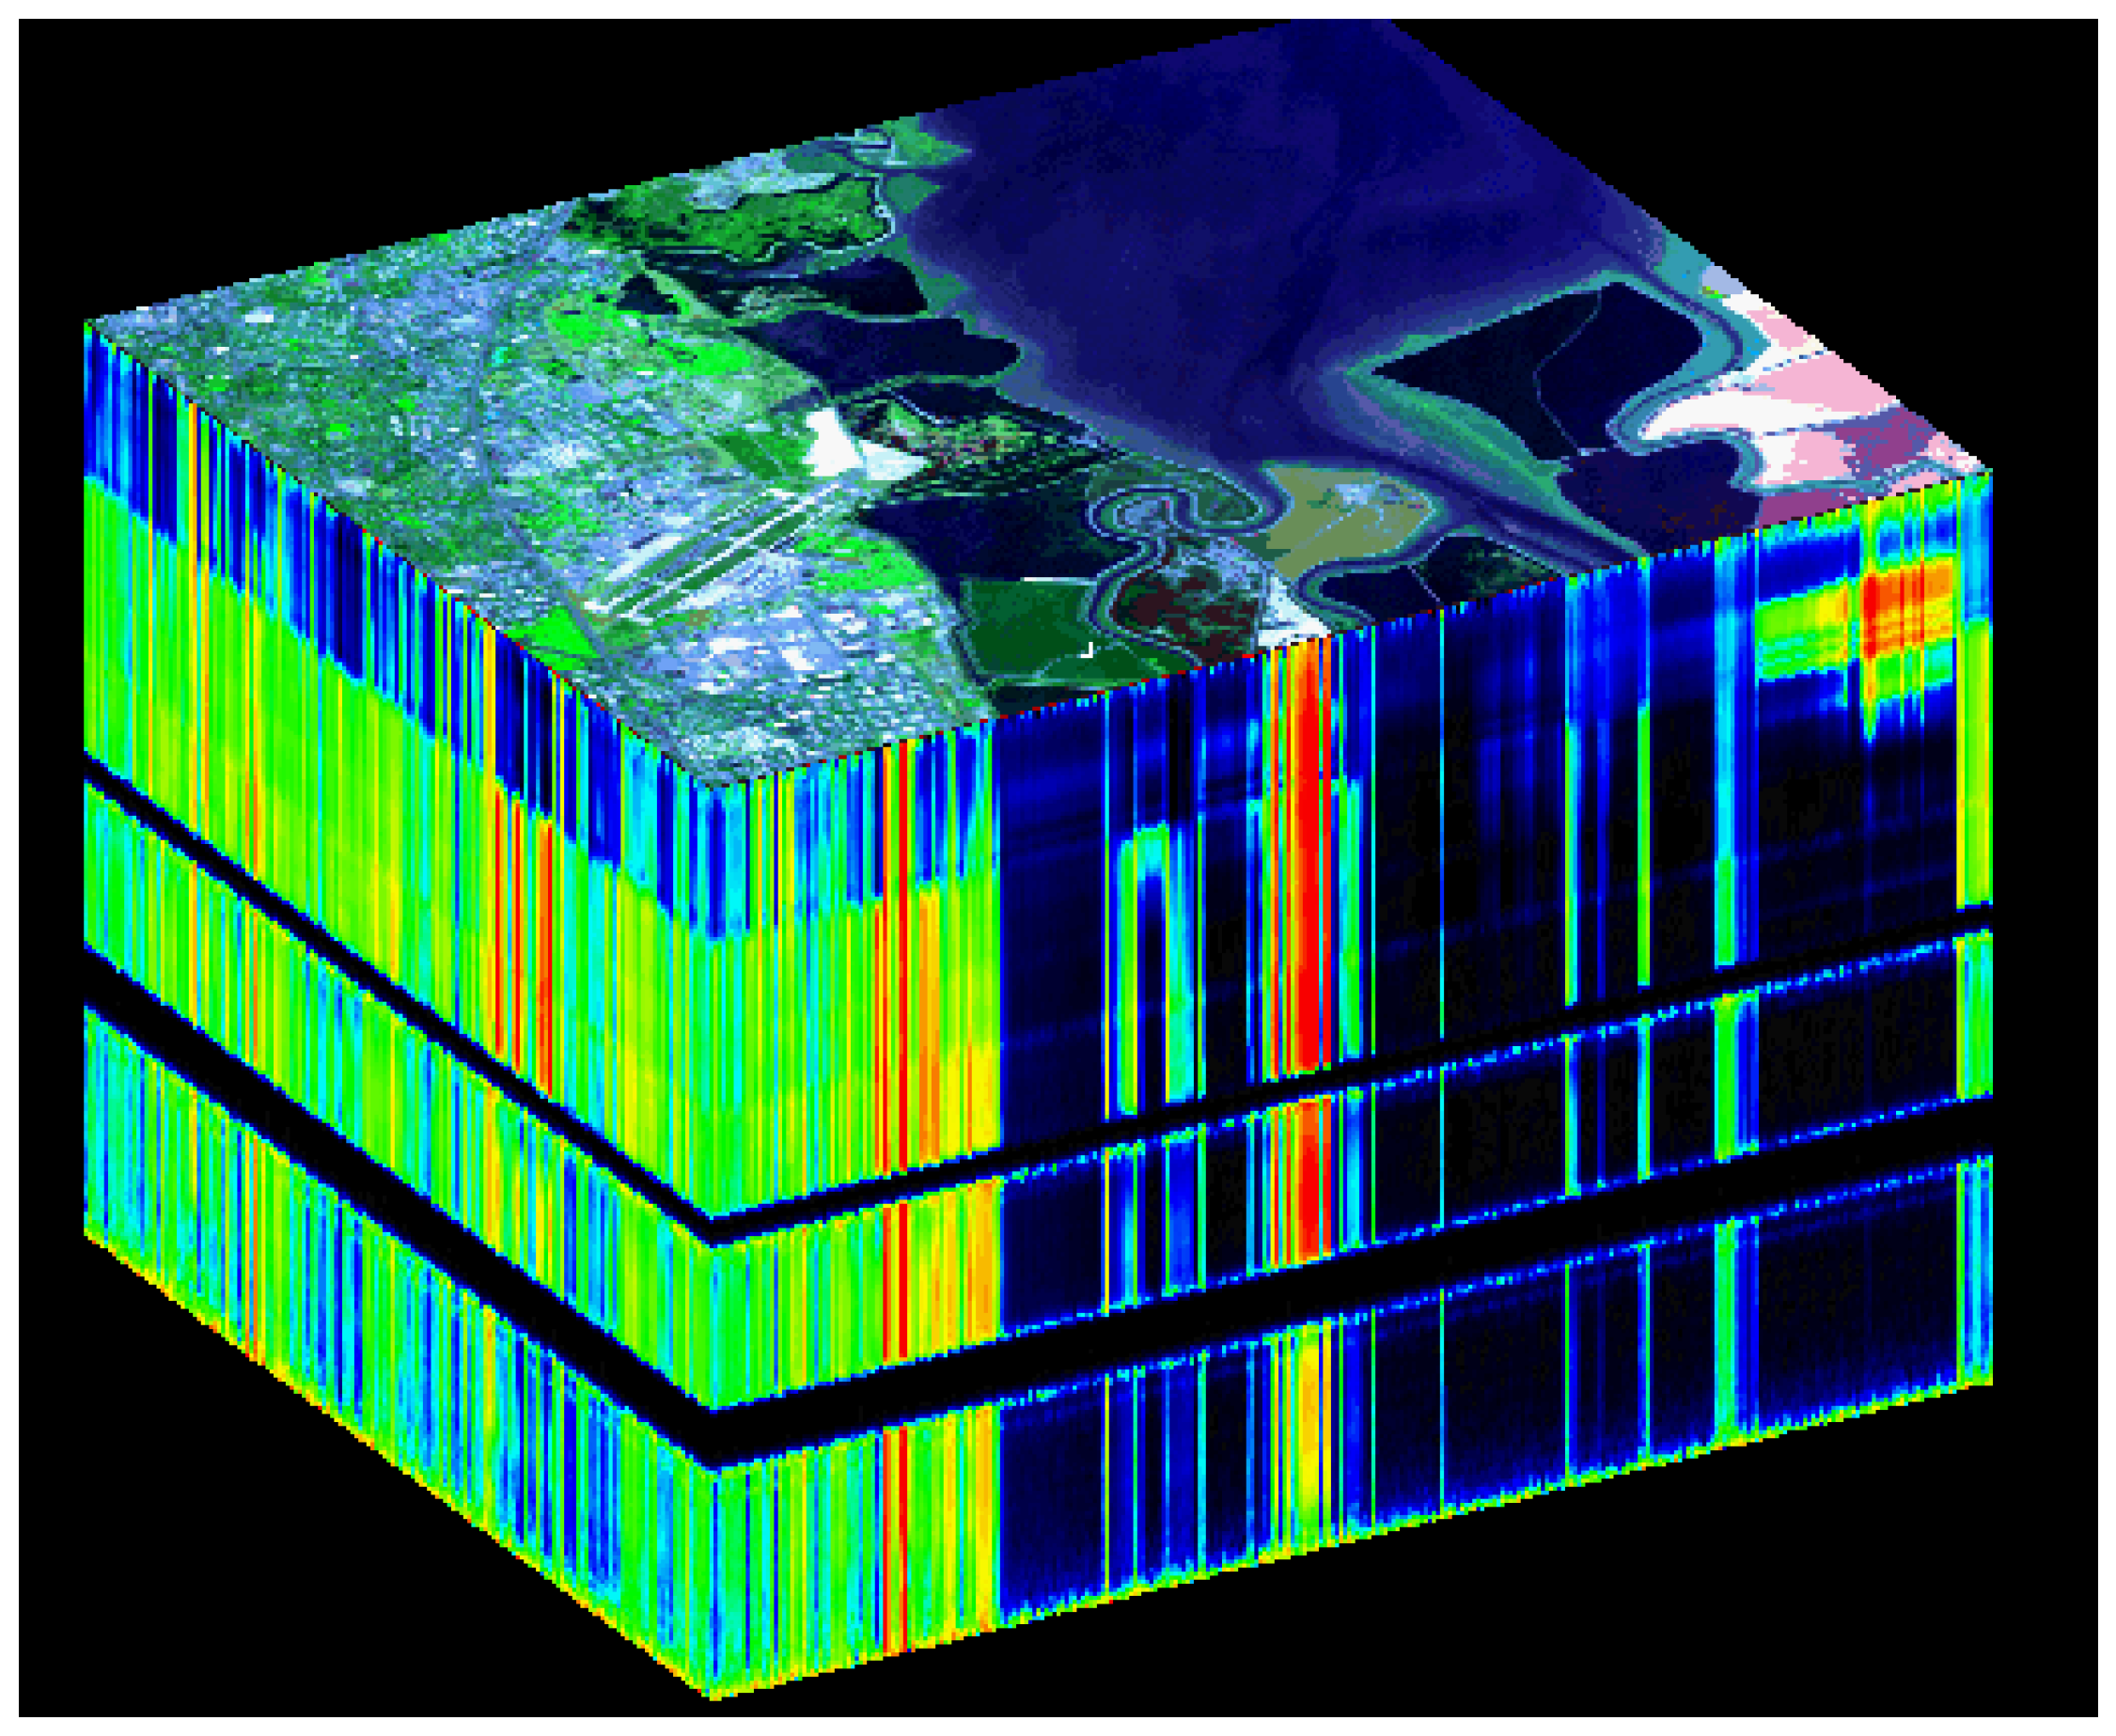
5.3. Imaging Spectroscopy (Hyperspectral Remote Sensing)

Spectral reflectance of vegetation and other landscape conditions has received considerable interest by the remote sensing community during the past decade because of the development of a new class of imaging technology called hyperspectral remote sensing (HRS), also known as imaging spectroscopy. These sensors are extensions of spectroscopic instruments found in a laboratory or field setting. Lab spectrometers capture a spectrum for a single point or transect. Aerial imaging spectrometers capture a two dimensional image with a spectrum for each pixel in the image.
HRS collects imagery in very narrow bandwidths across the solar reflected part of the EMS. The result is a digital file of hundreds of bands of co-registered imagery, sometimes called a ‘cube’, which can be analyzed with the same methods as laboratory spectra and can identify specific compounds, materials and conditions based on the interaction of photons with the molecular composition and/or structure of the target material (Figure 8). Spectroscopic analysis techniques can now be employed outside of the laboratory from overhead platforms such as aircraft and even satellites. Further, because the data are produced in an imagery format, they also represent critical geospatial information about the landscape (Figure 9).
Imaging spectroscopy became feasible in the mid-1980s through the early 1990s with the development of a number of aircraft based hyperspectral imaging sensors [52,57,58]. At the forefront of this development was the NASA Advanced Visible InfraRed Imaging Spectrometer (AVIRIS) (See Figure 10), although there were a number of other instruments under parallel development. The AVIRIS sensor collects 224 bands of hyperspectral imagery across the solar-reflected part of the EMS from 350 to 2,500 nm. Data from the AVIRIS instrument have demonstrated the significant value of HRS science for a number of terrestrial monitoring applications [52,57,58]. Many hyperspectral imaging sensors now exist including orbital systems such as the European CHRIS and the NASA Hyperion systems. For some applications, hyperspectral systems often have advantages over multispectral sensors because they collect many more wavelengths or bands of data. HRS are of considerable interest in hazardous waste detection and remediation.
Figure 8. Airborne hyperspectral image cube of Moffett Field, California. The image was collected on 20 August 1992 from a height of 20,000 m [59].
Remotesensing 02 02474 g008
Figure 9. Airborne hyperspectral image of the clay-capped Mixed Waste Management Facility at the Savannah River Site obtained on July 22, 2002 at a spatial resolution of 2 × 2 m. Spectral analysis of the bands can locate potential areas of failure of the facility. Subsequent images can be used for change detection from Jensen [60] and [61].
Remotesensing 02 02474 g009
Figure 10. The NASA Advanced Visible Infrared Imaging Spectrometer (AVIRIS) has been at the forefront of the development of imaging spectroscopy [59].
Remotesensing 02 02474 g010

6. Specific Hazardous Waste Applications

6.1. Mining and Acid Mine Drainage

There is a rich history of the use of remote sensing to create mineralogical maps, assist mineral exploration, and to detect mine waste and the effects of mining activities in the landscape and aid in mine remediation [23,62,63,64,65,66,67,68]. General reviews of the utility of remotely sensed data for monitoring mining activity can be found in [69,70,71,72].
Multispectral scanners, such as Landsat TM, have been used to identify faults and fractures, and to identify hydrothermally altered rocks and probable mineral deposits [65,67,69]. HRS has allowed measurements of a material’s spectra and permits a high degree of mineral separation and identification [63,73].
The emergence of imaging spectroscopy in the 1990s, as an extension of, and based on a rich history of laboratory spectroscopic analyses, created opportunities for many mining and direct mineral identification applications [52,57,63,64,74,75]. A fundamental advantage of spectroscopic analyses is that data collection can be done in the field, laboratory or from an aircraft or satellite. Information that is gathered in the field or lab has been used to identify spectra for detection of heavy metals in image data to quantitatively map their distribution [63,68,76,77]. Ground measurements inform or train the interpretation of hyperspectral images. It is important to note that differences in spectral and spatial resolution between hyperspectral images and ground spectrometer data, as well as atmospheric conditions, must be taken into account when linking these data [77].
The use of imaging spectroscopy allows entire mining districts to be screened quickly to identify acid producing minerals in mine waste or unmined rock outcrops [75]. Image spectroscopy provides a robust mapping tool as subtle changes in the reflectance spectra of minerals can indicate major differences in chemistry with spectral information acquired from laboratory samples or remotely sensed by aircraft or satellites [76].
Several studies at the U.S. Geological Survey (USGS) in Denver, Colorado have used AVIRIS data and an in-house developed algorithm, Tricorder/Tetracorder, to map mineralogy, vegetation coverage and other material distributions of interest at mines in the western United States [62,75,76]. Tricorder/Tetracorder is an expert system that uses a digital spectral library of known materials and a modified-least-squares method of locating particular spectral features for given materials within a data image [78].
In the Leadville mining district in the Central Colorado Rockies mineral maps have been created using imaging spectroscopy where gold, silver, lead and zinc have been mined for over 100 years [62]. The maps have been employed to aid in the characterization and hazardous waste remediation efforts for the area. Potential sources of acid mine drainage have been identified to protect the Arkansas River, a main source of water for urban centers and agricultural communities [75].
In Summitville, Colorado, King et al. found that the Alamosa River received metal-rich material from both natural sources and from the Summitville mine site using AVIRIS data [76]. Acid-buffering minerals such as calcite and chlorite were accurately distinguished in AVIRIS spectra for the Animas River Watershed, Colorado [68]. At the Ray Mine in Arizona, diagnostic mineralogy was accurately mapped, however, there was a lack of AVIRIS data detection of low concentrations of unweathered sulfides that was attributed to the 17 m spatial resolution of the spectral data [79].
Mars and Crowley [80] utilized AVIRIS and Digital Elevation Model (DEM) data to evaluate hazardous waste contamination in southeastern Idaho including mine waste dumps, wetlands vegetation and other relevant vegetation types. With the mapped information and the DEM, delineation of mine dump morphologies, catchment watershed areas above each mine dump, flow directions from the dumps, stream gradients and the extent of downstream wetlands available for selenium absorption were determined. Additionally, Mars and Crowley were able to characterize the physical settings of mine dumps and test hypotheses concerning the causes of selenium contamination in the area [80].

6.2. Heavy Metals

Related to mine waste and often categorized in the “hazardous waste” category, heavy metals and their effect on the environment have been the subject of many remote sensing research efforts. Although the general term defies specific definition, heavy metals such as cadmium, lead, selenium, arsenic and zinc are often primary contaminants at hazardous waste sites [81], and the identification and mapping of fugitive heavy metals is an important element of emerging remote sensing science (Figure 11).
Unfortunately, fugitive metals in the environment do not usually exist in their pure form but rather in a soil-water-vegetation matrix as waste rock materials, sediments or as a result of soil deposition. Besides detecting the minerals themselves, imaging spectroscopy is also used to detect the composition and condition of vegetation, which can then be used to interpret the mineral deposits or metal composition of the soil in the area where the vegetation is growing. It has long been acknowledged by scientists that a relationship exists between vegetation, soils and underlying mineral deposits [65]. In several studies, airborne spectroscopy was used to detect ‘hidden’ mineral deposits through forest-covered areas by revealing subtle variations in the reflected spectrum of vegetation under stress due to the presence of heavy metals [43,45]. Figure 11 shows an example of the spectral differences caused by arsenic stress.
Figure 11. Spectra differences in plant reflectance as a result of Arsenic stress in grasses. From Slonecker 2007 [17].
Remotesensing 02 02474 g011
When analyzing the spectral reflectance patterns from canopies to interpret what is occurring in the substrate, sub-surface and for stress prediction, Rosso et al. [82] noted that the biophysical principles of remote sensing of vegetation under stress need to be understood to correctly interpret the information obtained from the canopy level.
In 2003, Reusen successfully mapped heavy metal contamination in Belgium through the expressions of vegetation stress. Utilizing imaging data from an airborne HRS sensor (CASI), flown in an area of historical zinc smelting, they computed vegetation stress in several tree species utilizing the Edge Green First derivative Normalized difference (EGFN) vegetation index [83].
In 2003, Kooistra conducted a study to examine the possibilities for in situ evaluation of soil properties in river floodplains using field reflectance spectroscopy of cover vegetation. Results determined that a combination of field spectroscopy and multivariate calibration does result in a qualitative relation between organic matter and clay content. The study indicated the potential for these multivariate methods for mapping soil properties using HRS techniques. The authors found that there are great benefits of using detailed spectral information for the classification of sediments in river floodplains. They used partial least squares (PLS) regression to establish relationships between soil reflectance spectra measured under field conditions and the organic matter and clay content of the soil. The investigation found that although the performance of the spectra measured in situ is not as accurate as physical analysis, the accuracy obtained is useful for rapid soil characterization and remote sensing applications [84].
In 2004, Kooistra conducted another study to investigate the relation between vegetation reflectance and elevated concentrations of the metals Ni, Cd, Cu, Zn and Pb found in the floodplain soils along the rivers Rhine and Meuse in the Netherlands. The study obtained high-resolution vegetation reflectance spectra in the visible to near-infrared using a field radiometer. The relationships were evaluated using simple linear regression in combination with two spectral vegetation indices: the Difference Vegetation Index (DVI) and the Red-Edge Position (REP). The results of the study demonstrated the potential of remote sensing data to contribute to the survey of spatially distributed soil contaminants in floodplains under natural grassland, using the spectral response of the vegetation as an indicator. Modeling the relationship between soil contamination and vegetation reflectance resulted in similar results for DVI, REP and the multivariate approach using PLS regression. Further research is needed to better understand the relationship for bio-availability of metals and the resulting plant uptake. The study found that the results obtained are both resolution and location dependent [85].
Similar studies were conducted by Clevers et al. [86,87] in contaminated floodplains in the Netherlands. Analysis of field spectroradiometric measurements found that the REP and the first derivative were the best predictors of heavy metal contamination.
Rosso et al. successfully detected plant stress due to pollution at the leaf level, and reiterates that more investigations need to take place that link their results to canopy level reflectance [82]. Arsenic contamination in the soil was successfully mapped through the reflectance properties of cover grass in a contaminated urban environment [17].

6.3. Hydrocarbons

A major research area for remote sensing of hazardous wastes can be found in the identification and analysis of hydrocarbons and their effect on the environment. Hydrocarbons are organic compounds consisting entirely of hydrogen and carbon and naturally occur in crude oil where decomposed organic matter provides an abundance of carbon and nitrogen. Different hydrocarbons molecules can bond, or catenate, with other hydrocarbon molecules and create a variety of additional hydrocarbon compounds. All hydrocarbons belong to a functional group that facilitates combustion and are thus hazardous wastes because they are ignitable [88].
Hydrocarbons are important both from an economic and environmental perspective. Oil and gas products are critical to the world’s economy, and remote sensing has played an important role in the prospecting and exploration of new oil and natural gas deposits. However, fugitive hydrocarbon leaks and spills can be significant environmental stressors to human and ecological health and also make up several important greenhouse gases related to global warming. Natural hydrocarbon seepages can also occur in areas of fault zones and be indicators of potential seismic activity. Van der Meer et al. [41] provided a review of natural macro and micro seepages of petroleum to the surface and includes both direct and indirect detection of petroleum.
Remote sensing of hydrocarbons and their effects comprise a major body of work related to remote sensing of hazardous waste. Especially important is the loss of liquid and gas hydrocarbons as a result of their long range transport through pipelines. Hydrocarbons can be detected by remote sensing methods in a number of ways, including several techniques that detect emissions in the thermal infrared part of the spectrum. However, the focus of this paper is based on the optical, solar-reflected spectrum.
Liquid hydrocarbon releases can occur both naturally and as a result of a spill or leakage and can be detected by basic aerial photo interpretation, microwave imagery, airborne video and/or multispectral satellite imagery.
Basic reflectance and morphological characteristics can be identified related to the presence of hydrocarbons on the surface of terrestrial or marine environments [89]. Maritime oil spills are routinely monitored with a variety of remote sensing platforms and systems that include radar, passive microwave, thermal infrared, near and short-wave infrared, visual and ultraviolet. An excellent review of the remote sensing of oil spills can be found in Jha et al. [90]. Horig et al. [91] demonstrated the basic ability of high signal-to-noise hyperspectral systems to detect hydrocarbon features in the near and short-wave infrared.
In a major development, Kuhn et al. [89] presented a hydrocarbon index that can be utilized by field spectrometers or hyperspectral imagers that isolates and processes spectral absorption properties of hydrocarbon-bearing materials around the known 1,730 nm hydrocarbon-absorption feature. Figure 12 illustrates the basic hydrocarbon index showing the absorption feature and the two adjacent peaks and Figure 13 shows the basic hydrocarbon absorption spectra. The hydrocarbon index is calculated as:
HI = ( λ B λ A ) R C R A λ C λ A + R A R B
where λA;RA, λB;RB, and λC;RC are the wavelength/radiance pairs for each index point.
When in the form of natural gas, the effects of hydrocarbons on vegetation are complex but in general, natural gas, which is composed mostly of methane (CH4), does not in itself cause vegetation stress [92]. However, the natural gas in the soil displaces oxygen and this has been shown to have a primary stress effect on vegetation health.
Noomen [93,94,95,96,97] reported on several experiments using hyperspectral analysis to detect hydrocarbon gas seepages near pipelines. Noomen et al. discovered that there were generally increases in reflectance between 560–590 nm and a 1–5 nm shift towards the longer wavelengths as a result of vegetation stress.
Figure 12. The graphic depiction of the hydrocarbon index based on the 1,730 nm hydrocarbon absorption feature. One of the advantages of this index is that it is valid with raw radiance data and is independent of atmospheric correction or radiative transfer functions. Source: Kuhn et al. 2004 [89].
Remotesensing 02 02474 g012
Figure 13. Hydrocarbons have distinctive absorption patterns in the near infrared at approximately 1,730 and 2,310 nm. From Allen [98].
Remotesensing 02 02474 g013
Pysek et al. [99] reported on the physiological effects of natural gas leakage and found that there was typically a decrease in canopy cover and species diversity and increased reflectance at red wavelengths. Smith [100,101] tested several different gases and water to displace soil oxygen. After spectral analysis of overlying vegetation stress, they found that, although there were differences in intensity, the stress response was generic and not generally identifiable by a specific agent. They concluded that spectral analysis of overlying vegetation could identify stress from leaking pipelines but only with additional data such as pipeline maps and other locational information. Bammel and Birnie [102] found that the red edge was shifted towards shorter wavelengths in sagebrush as a result of hydrocarbon-induced stress at or near the surface. Crawford [103] similarly detected an increase in reflectance in the visible light and shift in the REP towards shorter wavelengths in Douglas-fir trees growing in an area of hydrocarbon microseepage. Conversely, Yang [104,105,106] found a shift of the REP towards longer wavelengths in a wheat field located in a hydrocarbon microseepage area.

6.4. Other Organic Chemicals

In addition to hydrocarbons, a large class of other organic chemicals is often present in hazardous waste disposal sites and represents a significant risk to human and ecological health. As a major component and waste by-product of industrial, agricultural and military activities, many organic chemicals are toxic and are also classified as carcinogens, or cancer causing substances. Common organic compounds such as toluene, used in dry-cleaning, and benzene used in plastics, are often among the “chemicals of concern” at Superfund hazardous waste cleanup sites.
Direct remote sensing detection of organic compounds is spectrally related to the C-H stretch which occurs around 3,400 nm with overtones in the area of 1,150, 1,700 and 2,300 nm [107]. The basic spectral reflectance properties of hydrocarbons and the potential for remote sensing analysis was demonstrated by Cloutis [108] who found that many organic compounds display electronic transitions that are the result of the excitation of bonding electrons in the ultraviolet (100–350 nm) region but as the molecular complexity increases, there is more overlap and a shift to longer wavelengths.
Although spectroscopic identification of organics has been demonstrated in several astronomical applications [109,110,111,112], the lack of spectral libraries for organic chemicals has often been a significant impediment to spectroscopic identification of individual organic compounds [113,114].
Both direct and indirect remote sensing detection of organic compounds is possible via spectral fingerprinting of organic substances and alteration of surface soils and through stress in the overlying vegetation. However, there are many types of organic chemicals and their individual analytical spectroscopic features often lie in different parts of the EMS. An interesting approach to this problem can be found in a paper by Clark et al. of the USGS Spectroscopy Laboratory in which spectral libraries for a variety of organic compounds are being established in the visible, near-infrared and mid-infrared spectral ranges.

7. Thermal Infrared Applications

Thermal infrared (TIR) remote sensing, sometimes called thermography, or thermal imaging, are all examples of infrared imaging science and play a unique role in the study of hazardous waste. Thermal imaging cameras detect radiation in the mid and far infrared ranges of the electromagnetic spectrum (roughly 3,000–5,000 and 8,000–14,000 nm) and produce analog or digital images of that radiation that resemble black and white photographs, but can also be colorized by image processing techniques.
Electromagnetic radiation in these infrared wavelengths is emitted, as opposed to reflected, by all matter according to Planck’s black body radiation law. Differences in heat intensity are related to the amount of radiation emitted by an object which increases with temperature; therefore, thermography allows one to see variations in temperature. When recorded digitally or on film by a thermal imaging camera, warm objects stand out brighter against cooler, darker backgrounds.
TIR monitoring systems have found numerous commercial and industrial applications. Such as monitoring pipeline leaks or overheated motors, joints or power lines. Forward looking infrared (FLIR) cameras are used routinely by police and border patrol agents aboard helicopters to monitor the movement of people and vehicles through complex landscapes such as vegetated rural terrain.
Much like conventional camera technology, TIR systems have evolved from line scanners and basic imaging systems into sophisticated hyperspectral instruments that can evaluate the unique properties of emissive thermal infrared spectra, which can be a fingerprint for many elements and chemical compounds.
Overhead TIR imaging systems, such as aircraft systems or the TIR band 6 on Landsat 5 and Landsat 7 have been used for specialized environmental monitoring and hazardous waste applications where differences in temperature are important signatures of the landscape characteristics. Examples include the discovery and monitoring of underground fires at mines or landfills [115,116,117,118,119,120,121,122,123], the thermal characteristics of landfill processes [124,125], seeps or the release of leachate into the environment [126,127], or structural characteristics of landfill caps and other remediation methods [36,128,129,130].
Thermal infrared imagery has been successfully employed to detect underground disposal trenches at Los Alamos National Laboratory (LANL) and Oak Ridge National Laboratory (ORNL) where materials associated with past weapons development and testing are buried. The trenches could be identified based on the difference in thermal characteristics of disturbed soil and undisturbed soil [131,132].
Thermal infrared remote sensing has also evolved into multi- and hyperspectral sensors that bring special analytical capabilities to the monitoring and detection of hazardous waste. The detection and monitoring of wildfires has been firmly established by the use of multispectral thermal data using the MODerate resolution Imaging Spectrometer (MODIS) [133,134]. Several researchers have demonstrated that multispectral thermal infrared imagery from the Thermal Infrared Multispectral Scanner (TIMS) could be used to identify and map mineralogic information which could potentially be related to the presence of heavy metals [135,136,137]. Collins and Ondrusek et al. both showed that volcanically altered rocks could be mapped with TIMS imagery [138,139]. Realmuto has shown the ability of TIMS imagery to map sulfur dioxide emissions from volcanoes [140,141,142].
The relatively recent advancement of hyperspectral thermal infrared imaging has created unique new capabilities for the remote imaging identification of many chemicals and elements that could be related to hazardous wastes. In addition to elemental heavy metals, the detection of most organic, organophosphates, and similar high molecular weight compounds is best accomplished in the thermal infrared. New hyperspectral infrared imaging sensors such as the Advanced Hyperspectral Imager (AHI) [143,144,145,146], the Spectrally Enhanced Broadband Array Spectrograph System (SEBASS) [147,148] and others are advancing the use of imaging spectroscopy into the new areas of chemical complexity.
Applications of hyperspectral thermal infrared data include numerous geologic, geothermally altered and surface mineral mapping [138,148,149,150,151,152,153], anomaly detection [154], acid sulfate runoff [155], vegetation characteristics [156,157], gaseous effluents [158,159,160,161,162] and landmine detection [157,163].
A related but non-imaging technology known as Fourier Transform Infrared Technology (FTIR) should be mentioned in this discussion because of its major applications in the area of hazardous waste. Although neither passive nor imaging FTIR systems operate in the visible and infrared parts of the spectrum and are extremely diagnostic for many chemical constituents that could be considered hazardous wastes depending on the context. FTIRs are active systems that send out a pulse of energy and record the absorption or emission at specific wavelengths. FTIRs are generally limited to laboratory or field systems and are widely used to monitor airborne releases at hazardous waste incinerators and industrial sites [164,165,166].

8. Conclusions and Research Opportunities

The problem of fugitive hazardous wastes in the environment is not one that is likely to diminish in the future. As the global population grows, the need for natural resource exploitation will increase dramatically along with the negative side effects of mining, industrial by-products and both controlled and fugitive wastes.
As this review has indicated, there have been numerous successful applications of remote sensing for the location and monitoring of hazardous wastes. Those applications have included traditional visual interpretation of temporal profiles of aerial photography, more generalized spectral signature analysis of hazardous wastes using multispectral sensors, and more recently differentiation of very subtle shifts in spectral responses due to hazardous waste using data intense HRS. Unlike earlier systems, HRS has the potential to identify specific materials based on molecular structure, but this is generally difficult due to complex atmospheric interferences. There is need for considerable research on this topic.

8.1. Spectral Libraries

The process of identification of specific materials using HRS is basically matching known spectral signatures, often from a library, to unknown signatures or to reflectance data from an HRS. A limitation in this process is the lack of viable spectral libraries. A needed research area is the development of an extensive, calibrated library for hazardous waste substances. These libraries can in part be created from existing collections but will also require new data acquisitions. For hazardous wastes, a complexity in compiling spectral signatures is that many of the materials of interest will not be in large amounts and will be integrated in other features such as soils or absorbed by plants. Further, field work in hazardous environments is problematic which greatly complicates establishing these libraries, but it is one of the basic requirements necessary to effectively use HRS for hazardous waste identification.

8.2. Controlled Experiments

Hazardous wastes are often contaminated or mixed with other materials. One approach to identify these materials in different concentrations in different stratum or absorbed by plants is to have controlled laboratory experiments.
These experiments can be conducted in multiple ways, but the goal is to have spectral signatures of the wastes of interest in different situations. A standard experiment is to grow plants in varied concentrations of hazardous components, as well as growing controls, typically in a greenhouse and to take detailed spectral measurements at different times during the growth period. These experiments can determine if there are spectral differences in the plants’ spectral signatures as a function of absorbed contaminants.
A variation on these experiments is to place a contaminant, such as a selection of hydrocarbon products, on different strata such as gravel, asphalt, sand, organic soil and measure the spectral responses over time. The temporal component will determine the rate of evaporation and changes in spectral signature. These controlled experiments will greatly assist the development of a spectral library, but they are complex and time consuming.

8.3. Spectral Analysis Processing Development

HRS data can often identify anomalies in a data set via multiple, often complex, processing strategies. For example, there might be a subtle shift in the red edge in a specific vegetative type such as the red oaks in a scene. The challenge, however, is to differentiate whether that shift or anomaly is a response to a relatively benign condition, such as moisture stress, or absorption of a hazardous waste from the soil or atmospheric contamination.
For example, the band-depth analysis technique, developed by Kokaly and Clark [167] and later confirmed by Curran [168] showed that foliar biochemical concentrations, such as nitrogen, lignin and cellulose, could be accurately measured with a spectral band-depth analysis of dried and ground leaf samples. A logical extension of that concept could include the direct or indirect measurement of fugitive contaminants such as heavy metals that are inside the leaf tissue as a result of uptake.
Scientists have speculated, and there are some successful research results on this topic, that additional processing approaches could resolve this problem or at least reduce the frequency of false alarms. Improved spectral signature libraries including those derived via controlled experiments will greatly assist this processing challenge.

References

  1. Nriagu, J.O. Arsenic in the Environment: Cycling and Characterization; John Wiley & Sons, Inc.: New York, NY, USA, 1994; Volume 1. [Google Scholar]
  2. Sigman, H. Hazardous Waste and Toxic Substance Policies. In Public Policies for Environmental Protection, 2nd ed.; Portney, P.R., Stavins, R.N., Eds.; RFF Press Book: Washington, DC, USA, 2000; pp. 215–259. [Google Scholar]
  3. Resource Conservation and Recovery Act. Code of Federal Regulations; Part 261, Title 40; 2010. [Google Scholar]
  4. Comprehensive Environmental Response, Compensation and Liability Act (commonly known as Superfund). Public Law 96-510; 1980; 42 U.S.C. § 9601 et seq.
  5. SARA, Superfund Amendments and Reauthorization Act. Public Law 99-499; 1986; 42 U.S.C. Section 9601 et seq.
  6. Cortinas de Nava, C. Worldwide overview of hazardous wastes. Toxicol. Ind. Health 1996, 12, 127–138. [Google Scholar] [PubMed]
  7. Kummer, K. The international regulation of transboundary traffic in hazardous wastes: The 1989 Basel Convention. Int. Comp. Law Q. 1992, 41, 530–562. [Google Scholar] [CrossRef]
  8. UNEP. Introduction to the Basel Convention; United Nations Environmental Programme 2006. Available online: http://www.basel.int/ (accessed on October 15, 2010).
  9. Krueger, J. The Basel Convention and the International Trade in Hazardous Wastes. In Yearbook of International Co-operation on Environment and Development 2001/2002; Stokke, O.S., Thommessen, Ø.B., Eds.; Earthscan Publications: London, UK, 2001; pp. 43–51. [Google Scholar]
  10. Ladou, J.; Lovegrove, S. Export of electronics equipment waste. Int. J. Occup. Environ. Health 2008, 14, 1–10. [Google Scholar] [CrossRef] [PubMed]
  11. Wong, C.S.C.; Duzgoren-Aydin, N.S.; Aydin, A.; Wong, M.H. Evidence of excessive releases of metals from primitive e-waste processing in Guiyu, China. Environ. Pollut. 2007, 148, 62–72. [Google Scholar] [CrossRef] [PubMed]
  12. Wong, M.H.; Wu, S.C.; Deng, W.J.; Yu, X.Z.; Luo, Q.; Leung, A.O.W.; Wong, C.S.C.; Luksemburg, W.J.; Wong, A.S. Export of toxic chemicals—A review of the case of uncontrolled electronic-waste recycling. Environ. Pollut. 2007, 149, 131–140. [Google Scholar] [CrossRef] [PubMed]
  13. Slonecker, E.T.; Lyon, J.G. Spectral Monitoring of Fugitive Contaminants in the Environments. In Proceedings of U.S. EPA Environmental Monitoring Technology Conference, Boston, MA, USA, September 19–20, 2000.
  14. Lyon, J.G. Use of maps, aerial photographs, and other remote sensor data for practical evaluations of hazardous waste sites. Photogramm. Eng. Remote Sensing 1987, 53, 515–519. [Google Scholar]
  15. Titus, S.J. Survey and Analysis of Present or Potential Environmental Impact Sites in Woburn, Massachusetts. In Proceedings of the 48th Annual Meeting of the American Society for Photogrammetry, Denver, CO, USA, March 14–20, 1982; pp. 538–549.
  16. Barnaba, E.M.; Philipson, W.R.; Ingram, A.W.; Pim, J. The use of aerial photographs in county inventories of waste-disposal sites. Photogramm. Eng. Remote Sensing 1991, 57, 1289–1296. [Google Scholar]
  17. Slonecker, E.T. Remote Sensing Investigations of Fugitive Soil Arsenic and Its Effects on Vegetation Reflectance. Ph.D. Dissertation, George Mason University, Fairfax, VA, USA, 2007. [Google Scholar]
  18. Erb, T.L.; Philipson, W.R.; Teng, W.L.; Liang, T. Analysis of landfills with historic airphotos. Photogramm. Eng. Remote Sensing 1981, 47, 1363–1369. [Google Scholar]
  19. Vincent, R.K. Remote sensing for solid waste landfills and hazardous waste sites. Photogramm. Eng. Remote Sensing 1994, 60, 979–982. [Google Scholar]
  20. Stohr, C.; Su, W.J.; DuMontelle, P.B.; Griffin, R.A. Remote sensing investigations at a hazardous-waste landfill. Photogramm. Eng. Remote Sensing 1987, 53, 1555–1563. [Google Scholar]
  21. Pope, P.; Van Eeckhout, E.; Rofer, C.; Baldridge, S.; Ferguson, J.; Jiracek, G.; Balick, L.; Josten, N.; Carpenter, M. Environmental Waste Site Characterization Utilizing Aerial Photographs, Remote Sensing, and Surface Geophysics. In Proceedings of SPECTRUM ‘96, Seattle, WA, USA, 1996.
  22. Garofalo, D. Aerial photointerpretation of hazardous waste sites: An overview. In GIS for Water Resources and Watershed Management; Lyon, J.G., Ed.; CRC Press LLC: Boca Raton, FL, USA, 2003; Chapter 18; pp. 219–229. [Google Scholar]
  23. Slonecker, E.T.; Lacerte, M.J.; Garofalo, D. The value of historic imagery. Earth Obs. Mag. 2002, 8, 39–41. [Google Scholar]
  24. Nelson, A.B.; Hartshorn, L.A.; Young, R.A. A Methodology to Inventory, Classify and Prioritize Uncontrolled Waste Disposal Sites; Report EPA-600/4-83-050; Environmental Monitoring Systems Laboratory, Office of Research and Development, U.S. Environmental Protection Agency: Las Vegas, NV, USA, 1983; p. 128.
  25. Benger, M.J. The EPA remote sensing archive. In The Landscape Science Seminar Series; The USEPA Environmental Photographic Interpretation Center (EPIC): Reston, VA, USA, 2004. [Google Scholar]
  26. Getz, T.J.; Randolph, J.C.; Echelberger, W.F. Environmental application of aerial reconnaissance to search for open dumps. Environ. Manage. 1983, 7, 553–562. [Google Scholar] [CrossRef]
  27. Lyon, J.G. Use of aerial photography and remote sensing in the management of hazardous wastes. In Hazardous Waste Management for the 80’s; Sweeney, T.L., Bhatt, H.G., Sykes, R.M., Sproul, O.J., Eds.; Ann Arbor Science Publications: Ann Arbor, MI, USA, 1982; pp. 163–171. [Google Scholar]
  28. Kroeck, R.M.; Shelton, G.A. Overhead Remote Sensing for Assessment of Hazardous Waste Sites; Research Report EPA-600/x-82-019; U.S. Environmental Protection Agency: Las Vegas, NV, USA, 1982; p. 95.
  29. Herman, J.D.; Waites, J.E.; Ponitz, R.M.; Etzler, P. A temporal and spatial resolution remote sensing study of a Michigan Superfund site. Photogramm. Eng. Remote Sensing 1994, 60, 1007–1017. [Google Scholar]
  30. Bagheri, S.; Hordon, R.M. Hazardous waste site identification using aerial photography: A pilot study in Burlington County, New Jersey, USA. Environ. Manage. 1988, 12, 119–125. [Google Scholar] [CrossRef]
  31. Airola, T.M.; Kosson, D.S. Digital analysis of hazardous waste site aerial photographs. J. Water Pollut. Control Fed. 1989, 61, 180–183. [Google Scholar]
  32. Bølviken, B.; Honey, F.; Levine, S.R.; Lyon, R.J.P.; Prelat, A. Detection of naturally heavy-metal-poisoned areas by Landsat-1 digital data. J. Geochem. Explor. 1977, 8, 457–471. [Google Scholar] [CrossRef]
  33. Jones, H.K.; Elgy, J. Remote sensing to assess landfill gas migration. Waste Manag. Res. 1994, 12, 327–337. [Google Scholar] [CrossRef]
  34. Kwarteng, A.Y.; Al-Enezi, A. Assessment of Kuwait’s Al-Qurain landfill using remotely sensed data. J. Environ. Sci. Health A Tox. Hazard Subst. Environ. Eng. 2005, 39, 351–364. [Google Scholar] [CrossRef]
  35. Foody, G.M.; Embashi, M.R.M. Mapping despoiled land cover from Landsat Thematic Mapper imagery. Comput. Environ. Urban Syst. 1995, 19, 249–260. [Google Scholar] [CrossRef]
  36. Ottavianelli, G.; Hobbs, S.; Smith, R.; Bruno, D. Assessment of Hyperspectral and SAR Remote Sensing for Solid Waste Landfill Management. In Proceedings of the 3rd ESA CHRIS/Proba Workshop, Frascati, Italy, March 21–23, 2005; p. 8.
  37. Almeida-Filho, R.; Miranda, F.P.; Yamakawa, T. Remote detection of a tonal anomaly in an area of hydrocarbon microseepage, Tucano basin, north-eastern Brazil. Int. J. Remote Sens. 1999, 20, 2683–2688. [Google Scholar] [CrossRef]
  38. Segal, D.; Merin, I. Successful use of Landsat Thematic Mapper data for mapping hydrocarbon microseepage-induced mineralogic alteration, Lisbon Valley, Utah. Photogramm. Eng. Remote Sensing 1989, 4, 1137–1145. [Google Scholar]
  39. Zhang, G.; Shen, X.; Zou, L.; Lu, S. Identifying Hydrocarbon Leakage Induced Anomalies Using Landsat-7/ETM+ Data Processing Techniques in the West Slope of Songliao Basin, China. In Proceedings of the Asian Conference on Remote Sensing (ACRS), Kuala Lumpur, Malaysia, November 12–16, 2007.
  40. Zhang, G.; Zou, L.; Shen, X.; Lu, S.; Li, C.; Chen, H. Remote sensing detection of heavy oil through spectral enhancement techniques in the western slope zone of Songliao Basin, China. Am. Assoc. Pet. Geol. Bull. 2009, 93, 31–49. [Google Scholar] [CrossRef]
  41. van der Meer, F.D.; van Dijk, P.; van der Werff, H.; Yang, H. Remote sensing and petroleum seepage: a review and case study. Terra Nova 2002, 14, 1–17. [Google Scholar] [CrossRef]
  42. Silvestri, S.; Omri, M. A method for the remote sensing identification of uncontrolled landfills: formulation and validation. Int. J. Remote Sens. 2008, 29, 975–989. [Google Scholar] [CrossRef]
  43. Collins, W.; Chang, S.H.; Raines, G.L.; Canney, F.; Ashley, R. Airborne biogeophysical mapping of hidden mineral deposits. Econ. Geol. 1983, 78, 737–749. [Google Scholar] [CrossRef]
  44. Milton, N.M.; Ager, C.M.; Eiswerth, B.A.; Power, M.S. Arsenic-and selenium-induced changes in spectral reflectance and morphology of soybean plants. Remote Sens. Environ. 1989, 30, 263–269. [Google Scholar] [CrossRef]
  45. Milton, N.M.; Collins, W.; Chang, S.H.; Schmidt, R.G. Remote detection of metal anomalies on Pilot Mountain, Randolph County, North Carolina. Econ. Geol. 1983, 78, 605–617. [Google Scholar] [CrossRef]
  46. Milton, N.M.; Eiswerth, B.A.; Ager, C.M. Effect of phosphorus deficiency on spectral reflectance and morphology of soybean plants. Remote Sens. Environ. 1991, 36, 121–127. [Google Scholar] [CrossRef]
  47. Horler, D.N.H.; Barber, J.; Barringer, A.R. Effects of heavy metals on the absorbance and reflectance spectra of plants. Int. J. Remote Sens. 1980, 1, 121–136. [Google Scholar] [CrossRef]
  48. Gates, D.M.; Keegan, H.J.; Schleter, J.C.; Weidner, V.R. Spectral properties of plants. Appl. Opt. 1965, 4, 11–20. [Google Scholar] [CrossRef]
  49. Ustin, S.L.; Roberts, D.A.; Gamon, J.A.; Asner, G.P.; Green, R.O. Using imaging spectroscopy to study ecosystem processes and properties. BioScience 2004, 54, 523–534. [Google Scholar] [CrossRef]
  50. Blackburn, G.A. Hyperspectral remote sensing of plant pigments. J. Exp. Bot. 2007, 58, 855–867. [Google Scholar] [CrossRef] [PubMed]
  51. Guyot, G.; Baret, F.; Jacquemoud, S. Imaging spectroscopy for vegetation studies. In Imaging Spectroscopy: Fundamentals and Prospective Applications; Toselli, F., Bodechtel, J., Eds.; Kluwer Academic Publishers: Norwell, MA, USA, 1992; Volume 2, pp. 145–165. [Google Scholar]
  52. Goetz, A.F.H.; Vane, G.; Solomon, J.E.; Rock, B.N. Imaging spectroscopy for Earth remote sensing. Science 1985, 228, 1147–1153. [Google Scholar] [CrossRef] [PubMed]
  53. Ray, T.W.; Murray, B.C.; Chehbouni, A.; Njoku, E. The red edge in arid region vegetation: 340–1060 nm spectra. In Summaries of the Fourth Annual JPL Airborne Geoscience Workshop; JPL Publication 93-26; Jet Propulsion Laboratory: Pasadena, CA, USA, 1993; pp. 149–152. [Google Scholar]
  54. Horler, D.N.H.; Dockray, M.; Barber, J. The red edge of plant leaf reflectance. Int. J. Remote Sens. 1983, 4, 273–288. [Google Scholar] [CrossRef]
  55. Schwaller, M.R.; Tkach, S.J. Premature leaf senescence; remote-sensing detection and utility for geobotanical prospecting. Econ. Geol. 1985, 80, 250–255. [Google Scholar] [CrossRef]
  56. Rock, B.N.; Hoshizaki, T.; Miller, J.R. Comparison of in situ and airborne spectral measurements of the blue shift associated with forest decline. Remote Sens. Environ. 1988, 24, 109–127. [Google Scholar] [CrossRef]
  57. Green, R.; Eastwood, M.; Sarture, C.; Chrien, T.; Aronsson, M.; Chippendale, B.; Faust, J.; Pavri, B.; Chovit, C.; Solis, M. Imaging spectroscopy and the Airborne Visible/Infrared Imaging Spectrometer(AVIRIS). Remote Sens. Environ. 1998, 65, 227–248. [Google Scholar] [CrossRef]
  58. Vane, G.; Goetz, A.F.H. Terrestrial imaging spectrometry: current status, future trends. Remote Sens. Environ. 1993, 44, 117–126. [Google Scholar] [CrossRef]
  59. NASA. AVIRIS Moffett Field Image Cube. Available online: http://aviris.jpl.nasa.gov/html/aviris.cube.html (accessed on October 15, 2010).
  60. Jensen, J.R.; Hodgson, M.E.; Garcia-Quijano, M.; Im, J.; Tullis, J.A. A remote sensing and GIS-assisted spatial decision support system for hazardous waste site monitoring. Photogramm. Eng. Remote Sensing 2009, 75, 169–177. [Google Scholar] [CrossRef]
  61. Jensen, J.R. A Remote Sensing-assisted Hazardous Waste Site Monitoring Decision Support System. Available online: http://webra.cas.sc.edu/reason/Overview.aspx (accessed on October 15, 2010).
  62. Swayze, G.A.; Clark, R.N.; Pearson, R.M.; Livo, K.E. Mapping acid-generating minerals at the California gulch superfund site in Leadville, Colorado using imaging spectroscopy. In Summaries of the 6th Annual JPL Airborne Earth Science Workshop; Jet Propulsion Laboratory, NASA: Pasadena, CA, USA, 1996; p. 6. [Google Scholar]
  63. Clark, R.N. Spectroscopy of rocks and minerals, and principles of spectroscopy. In Manual of Remote Sensing, Volume 3, Remote Sensing for the Earth Sciences; Rencz, A.N., Ed.; John Wiley and Sons: New York, NY, USA, 1999; Chapter 1; pp. 3–58. [Google Scholar]
  64. Anderson, J.E.; Robbins, E.I. Spectral reflectance and detection of iron-oxide precipitates associated with acidic mine drainage. Photogramm. Eng. Remote Sensing 1998, 64, 1201–1208. [Google Scholar]
  65. Sabins, F.F. Remote sensing for mineral exploration. Ore Geol. Rev. 1999, 14, 157–183. [Google Scholar] [CrossRef]
  66. Ferrier, G. Application of imaging spectrometer data in identifying environmental pollution caused by mining at Rodaquilar, Spain. Remote Sens. Environ. 1999, 68, 125–137. [Google Scholar] [CrossRef]
  67. Lamb, A.D. Earth observation technology applied to mining-related environmental issues. Mining Technol.: IMM Trans. Section A 2000, 109, 153–156. [Google Scholar] [CrossRef]
  68. Dalton, J.B.; King, T.V.V.; Bove, D.J.; Kokaly, R.G.; Clark, R.N.; Vance, J.S.; Swayze, G.A. Distribution of Acid-Generating and Acid-Buffering Minerals in the Animas River Watershed as Determined by AVIRIS Spectroscopy. In Proceedings of the SME-ICARD 2000 Meeting, Denver, CO, USA, May 21–24, 2000; pp. 1541–1550.
  69. Irons, J.R.; Kennard, R.L. The utility of thematic mapper sensor characteristics for surface mine monitoring. Photogramm. Eng. Remote Sensing 1986, 52, 389–396. [Google Scholar]
  70. Boldt, C.M.K.; Scheibner, B.J. Remote Sensing of Mine Waste; U.S. Dept. of the Interior, Bureau of Mines: Pittsburgh, PA, USA, 1987; pp. 39–43.
  71. Rathore, C.S.; Wright, R. Monitoring environmental impacts of surface coal mining. Int. J. Remote Sens. 1993, 14, 1021–1042. [Google Scholar] [CrossRef]
  72. Slonecker, E.T.; Benger, M.J. Remote sensing and mountaintop mining. Remote Sens. Rev. 2001, 20, 293–322. [Google Scholar] [CrossRef]
  73. Henderson, F.B. Remote Sensing for Acid Mine Sites-Looking at Earth from above can reveal the mineralogical details for monitoring acid mine sites and their surroundings. Geotimes 2000, 45, 32–34. [Google Scholar]
  74. Vane, G.; Goetz, A.F.H. Terrestrial imaging spectroscopy. Remote Sens. Environ. 1988, 24, 1–29. [Google Scholar] [CrossRef]
  75. Swayze, G.A.; Smith, K.S.; Clark, R.N.; Sutley, S.J.; Pearson, R.M.; Vance, J.S.; Hageman, P.L.; Briggs, P.H.; Meier, A.L.; Singleton, M.J. Using imaging spectroscopy to map acidic mine waste. Environ. Sci. Technol. 2000, 34, 47–54. [Google Scholar] [CrossRef]
  76. King, T.V.V.; Clark, R.N.; Ager, C.; Swayze, G.A. Remote Mineral Mapping Using AVIRIS Data at Summitville, Colorado and the Adjacent San Juan Mountains. In Proceedings of Summitville Forum ’95, Fort Collins, CO, USA, January 17–20, 1995; In Colorado Geological Survey Special Publication 38. Posey, H.H., Pendelton, J.A., Van Zyl, D., Eds.; Colorado Geological Survey: Denvor, CO, USA, 1995; pp. 59–63. [Google Scholar]
  77. Choe, E.; van der Meer, F.; van Ruitenbeek, F.; van der Werff, H.; de Smeth, B.; Kim, Y.W. Mapping of heavy metal pollution in stream sediments using combined geochemistry, field spectroscopy, and hyperspectral remote sensing: A case study of the Rodalquilar mining area, SE Spain. Remote Sens. Environ. 2008, 112, 3222–3233. [Google Scholar] [CrossRef]
  78. Clark, R.N.; Swayze, G.A. Mapping minerals, amorphous materials, environmental materials, vegetation, water, ice and snow, and other materials: The USGS Tricorder Algorithm. In Summaries of the Fifth Annual JPL Airborne Earth Science Workshop; Green, R.O., Ed.; JPL Publication 95-1; JPL: Pasadena, CA, USA, 1995; pp. 39–40. [Google Scholar]
  79. Clark, R.N.; Vance, J.S.; Livo, K.E.; Green, R.O. Mineral mapping with imaging spectroscopy: The Ray Mine, AZ. In Summaries of the 7th Annual JPL Airborne Earth Science Workshop; Green, R.O., Ed.; Jet Propulsion Labratory Pub. 97-21; JPL: Pasadena, CA, 1998; pp. 67–75. [Google Scholar]
  80. Mars, J.C.; Crowley, J.K. Mapping mine wastes and analyzing areas affected by selenium-rich water runoff in southeast Idaho using AVIRIS imagery and digital elevation data. Remote Sens. Environ. 2003, 84, 422–436. [Google Scholar] [CrossRef]
  81. Duffus, J.H. Heavy metals—A meaningless term? Pure Appl. Chem. 2002, 74, 793–807. [Google Scholar] [CrossRef]
  82. Rosso, P.H.; Pushnik, J.C.; Lay, M.; Ustin, S.L. Reflectance properties and physiological responses of Salicornia virginica to heavy metal and petroleum contamination. Environ. Pollut. 2005, 137, 241–252. [Google Scholar] [CrossRef] [PubMed]
  83. Reusen, I.; Bertels, L.; Debruyn, W.; Deronde, B.; Fransaer, D.; Sterckx, S. Species Identification and Stress Detection of Heavy-Metal Contaminated Trees. In Proceedings of U.S. EPA Spectral Remote Sensing of Vegetation Conference, Las Vegas, NV, USA, March 12–14, 2003.
  84. Kooistra, L.; Wanders, J.; Epema, G.F.; Leuven, R.S.E.W.; Wehrens, R.; Buydens, L.M.C. The potential of field spectroscopy for the assessment of sediment properties in river floodplains. Anal. Chim. Acta 2003, 484, 189–200. [Google Scholar] [CrossRef]
  85. Kooistra, L.; Salas, E.A.L.; Clevers, J.G.P.W.; Wehrens, R.; Leuven, R.S.E.W.; Nienhuis, P.H.; Buydens, L.M.C. Exploring field vegetation reflectance as an indicator of soil contamination in river floodplains. Environ. Pollut. 2004, 127, 281–290. [Google Scholar] [CrossRef]
  86. Clevers, J.G.P.W.; Kooistra, L.; Salas, E.A.L. Study of heavy metal contamination in river floodplains using the red-edge position in spectroscopic data. Int. J. Remote Sens. 2004, 25, 3883–3895. [Google Scholar] [CrossRef]
  87. Clevers, J.G.P.W.; Kooistra, L. Assessment of heavy Metal Contamination in River Floodplains by Using the Red-Edge Index. In Proceedings of The 3rd EARSeL Workshop on Imaging Spectroscopy, Herrsching, Germany, May 13–16, 2003.
  88. Berry, M.; Bove, F. Birth weight reduction associated with residence near a hazardous waste landfill. Environ. Health Perspect. 1997, 105, 856–861. [Google Scholar] [CrossRef] [PubMed]
  89. Kühn, F.; Oppermann, K.; Hörig, B. Hydrocarbon index—An algorithm for hyperspectral detection of hydrocarbons. Int. J. Remote Sens. 2004, 25, 2467–2473. [Google Scholar] [CrossRef]
  90. Jha, M.N.; Levy, J.; Gao, Y. Advances in remote sensing for oil spill disaster management: State-of-the-art sensors technology for oil spill surveillance. Sensors 2008, 8, 236–255. [Google Scholar] [CrossRef]
  91. Horig, B.; Kuhn, F.; Oschutz, F.; Lehmann, F. HyMap hyperspectral remote sensing to detect hydrocarbons. Int. J. Remote Sens. 2001, 22, 1413–1422. [Google Scholar] [CrossRef]
  92. Gustafson, F.G. Is natural gas injurious to flowering plants? Plant Physiol. 1944, 19, 551–558. [Google Scholar] [CrossRef] [PubMed]
  93. Noomen, M.F. Hyperspectral Reflectance of Vegetation Affected by Underground Hydrocarbon Gas Seepage. Ph.D. Theses, International Institute for Geo-information Science & Earth Observation, Enschede, The Netherlands, 2007. [Google Scholar]
  94. Noomen, M.F.; Skidmore, A.K.; Van der Meer, F.D. Detecting the Influence of Gas Seepage on Vegetation, Using Hyperspectral Remote Sensing. In Proceedings of the 3rd EARSeL Workshop on Imaging Spectroscopy, Herrsching, Germany, May 13–16, 2003; Habermeyer, M., Mülle, A., Holzwarth, S., Eds.; EARSeL: Herrsching, Germany, 2003; pp. 252–255. [Google Scholar]
  95. Noomen, M.F.; Skidmore, A.K.; Van der Meer, F.D.; Prins, H.H.T. Continuum removed band depth analysis for detecting the effects of natural gas, methane and ethane on maize reflectance. Remote Sens. Environ. 2006, 105, 262–270. [Google Scholar] [CrossRef]
  96. Noomen, M.F.; Smith, K.L.; Colls, J.J.; Steven, M.D.; Skidmore, A.K.; Van Der Meer, F.D. Hyperspectral indices for detecting changes in canopy reflectance as a result of underground natural gas leakage. Int. J. Remote Sens. 2008, 29, 5987–6008. [Google Scholar] [CrossRef]
  97. Noomen, M.F.; van der Meer, F.D.; Skidmore, A.K. Hyperspectral Remote Sensing for Detecting the Effects of Three Hydrocarbon Gases on Maize Reflectance. In Proceedings of the 31st International Symposium on Remote Sensing of Environment: Global Monitoring for Sustainability And Security, St. Petersburg, Russia, June 20–24, 2005; p. 4.
  98. Allen, C.S.; Krekeler, M.P.S. Reflectance spectra of crude oils and refined petroleum products on a variety of common substrates. Proc. SPIE 2010, 7687, 76870L. [Google Scholar]
  99. Pysek, P.; Pysek, A. Changes in vegetation caused by experimental leakage of natural gas. Weed Res. 1989, 29, 193–204. [Google Scholar]
  100. Smith, K.L.; Steven, M.D.; Colls, J.J. Use of hyperspectral derivative ratios in the red-edge region to identify plant stress responses to gas leaks. Remote Sens. Environ. 2004, 92, 207–217. [Google Scholar] [CrossRef]
  101. Smith, K.L.; Steven, M.D.; Colls, J.J. Spectral responses of pot-grown plants to displacement of soil oxygen. Int. J. Remote Sens. 2004, 25, 4395–4410. [Google Scholar] [CrossRef]
  102. Bammel, B.H.; Birnie, R.W. Spectral reflectance response of big sagebrush to hydrocarbon-induced stress in the Bighorn Basin, Wyoming. Photogramm. Eng. Remote Sensing 1994, 60, 87–96. [Google Scholar]
  103. Crawford, M.F. Preliminary Evaluation of Remote Sensing Data for Dectection of Vegetation Stress Related to Hydrocarbon Microseepage: Mist Gas Field Oregon. In Proceedings of 5th Thematic Conference on Remote Sensing for Exploration Geology, Reno, NV, USA, September 29–October 2, 1986.
  104. Yang, H. Spectral characteristics of wheat associated with hydrocarbon microseepages. Int. J. Remote Sens. 1999, 20, 807–813. [Google Scholar] [CrossRef]
  105. Yang, H.; Zhang, J.; Van der Meer, F.D.; Kroonenberg, S.B. Imaging spectrometry data correlated to hydrocarbon microseepage. Int. J. Remote Sens. 2000, 21, 197–202. [Google Scholar] [CrossRef]
  106. Yang, Z.; van der Meer, K. Geochemistry and field spectrometry for detecting hydrocarbon microseepage. Terra Nova 1998, 10, 231–235. [Google Scholar] [CrossRef]
  107. King, T.V.V.; Clark, R.N. Reflectance Spectroscopy (0.2 to 20 microns) as an Analytical Method for the Detection of Organics in Soils. In Proceedings of First International Symposium Field Screening Methods for Hazardous Waste Site Investigations, Las Vegas, NV, USA, October 11–13, 1988; pp. 485–488.
  108. Cloutis, E.A. Spectral reflectance properties of hydrocarbons: Remote-sensing implications. Science 1989, 245, 165–168. [Google Scholar] [CrossRef] [PubMed]
  109. McCord, T.B.; Carlson, R.W.; Smythe, W.D.; Hansen, G.B.; Clark, R.N.; Hibbitts, C.A.; Fanale, F.P.; Granahan, J.C.; Segura, M.; Matson, D.L.; Johnson, T.V.; Martin, P.D. Organics and other molecules in the surfaces of Callisto and Ganymede. Science 1997, 278, 271–275. [Google Scholar] [CrossRef] [PubMed]
  110. Clark, R.N.; Brown, R.H.; Jaumann, R.; Cruikshank, D.P.; Nelson, R.M.; Buratti, B.J.; McCord, T.B.; Lunine, J.; Baines, K.H.; Bellucci, G.; Bibring, J.P.; Capaccioni, F.; Cerroni, P.; Coradini, A.; Formisano, V.; Langevin, Y.; Matson, D.L.; Mennella, V.; Nicholson, P.D.; Sicardy, B.; Sotin, C.; Hoefen, T.M.; Curchin, J.M.; Hansen, G.; Hibbits, K.; Matz, K.D. Compositional maps of Saturn’s moon Phoebe from imaging spectroscopy. Nature 2005, 435, 66–69. [Google Scholar] [CrossRef] [PubMed]
  111. Cruikshank, D.P.; Mason, R.E.; Dalle Ore, C.M.; Bernstein, M.P.; Quirico, E.; Mastrapa, R.M.; Emery, J.P.; Owen, T.C. Ethane on Pluto and Triton. Bull. Am. Astron. Soc. 2006, 38, 518. [Google Scholar]
  112. Cruikshank, D.P.; Wegryn, E.; Dalle Ore, C.M.; Brown, R.H.; Bibring, J.P.; Buratti, B.J.; Clark, R.N.; McCord, T.B.; Nicholson, P.D.; Pendleton, Y.J.; Owen, T.C.; Filacchione, G.; Coradini, A.; Cerroni, P.; Capaccioni, F.; Jaumann, R.; Nelson, R.M.; Baines, K.H.; Sotin, C.; Bellucci, G.; Combes, M.; Langevin, Y.; Sicardy, B.; Matson, D.L.; Formisano, V.; Drossart, P.; Mennella, V. Hydrocarbons on Saturn’s satellites Iapetus and Phoebe. Icarus 2008, 193, 334–343. [Google Scholar] [CrossRef]
  113. Clark, R.N.; Green, R.O.; Swayze, G.A.; Meeker, G.; Sutley, S.J.; Hoefen, T.M.; Livo, K.E.; Plumlee, G.; Parvi, B.; Sarture, C.; Wilson, S.; Hageman, P.L.; Lamothe, P.; Vance, J.S.; Boardman, J.; Brownfield, I.; Gent, C.; Morath, L.C.; Taggart, J.; Theodorakos, P.M.; Adams, M. Environmental Studies of the World Trade Center Area after the September 11, 2001 Attack; OFR-01-0429; U. S. Geological Survey: Denver, CO, USA, 2001.
  114. Clark, R.N.; Curchin, J.M.; Hoefen, T.M.; Swayze, G.A. Reflectance spectroscopy of organic compounds: 1. Alkanes. J. Geophys. Res. 2009, 114. [Google Scholar] [CrossRef]
  115. Ellyett, C.; Fleming, A. Thermal infrared imagery of the Burning Mountain coal fire. Remote Sens. Environ. 1974, 3, 79–86. [Google Scholar] [CrossRef]
  116. Mansor, S.B.; Cracknell, A.P.; Shilin, B.V.; Gornyi, V.I. Monitoring of underground coal fires using thermal infrared data. Int. J. Remote Sens. 1994, 15, 1675–1685. [Google Scholar] [CrossRef] [Green Version]
  117. Saraf, A.K.; Prakash, A.; Sengupta, S.; Gupta, R.P. Landsat-TM data for estimating ground temperature and depth of subsurface coal fire in the Jharia coalfield, India. Int. J. Remote Sens. 1995, 16, 2111–2124. [Google Scholar] [CrossRef]
  118. Prakash, A.; Gupta, R.P. Surface fires in Jharia coalfield, India-their distribution and estimation of area and temperature from TM data. Int. J. Remote Sens. 1999, 20, 1935–1946. [Google Scholar] [CrossRef]
  119. Voigt, S.; Tetzlaff, A.; Zhang, J.; Künzer, C.; Zhukov, B.; Strunz, G.; Oertel, D.; Roth, A.; van Dijk, P.; Mehl, H. Integrating satellite remote sensing techniques for detection and analysis of uncontrolled coal seam fires in North China. Int. J. Coal Geol. 2004, 59, 121–136. [Google Scholar] [CrossRef]
  120. Zhang, X.; Zhang, J.; Künzer, C.; Voigt, S.; Wagner, W. Capability evaluation of 3–5 µm and 8–12.5 µm airborne thermal data for underground coal fire detection. Int. J. Remote Sens. 2004, 25, 2245–2258. [Google Scholar] [CrossRef]
  121. Gangopadhyay, P.K.; Lahiri-Dutt, K.; Saha, K. Application of remote sensing to identify coalfires in the Raniganj Coalbelt, India. Int. J. Appl. Earth Obs. 2006, 8, 188–195. [Google Scholar] [CrossRef]
  122. Gangopadhyay, P.K. Application of remote sensing in coal-fire studies and coal-fire-related emissions. Rev. Eng. Geol. 2007, 18, 239–248. [Google Scholar]
  123. Gangopadhyay, P.K.; Draggan, S. Coalfire and remote sensing. In Encyclopedia of Earth; 2007; Available online: http://www.eoearth.org/article/Coalfire_and_remote_sensing (accessed on October 30, 2010).
  124. Lewis, A.W.; Yuen, S.T.S.; Smith, A.J.R. Detection of gas leakage from landfills using infrared thermography-applicability and limitations. Waste Manage. Res. 2003, 21, 436–447. [Google Scholar] [CrossRef]
  125. Kroll, A.; Baetz, W.; Peretzki, D. On Autonomous Detection of Pressured Air and Gas Leaks Using Passive IR-Thermography for Mobile Robot Application. In Proceedings of the 2009 IEEE international conference on Robotics and Automation, Kobe, Japan, May 12–17, 2009; pp. 921–926.
  126. Sangrey, D.A.; Philipson, W.R.; Monitoring, E. Detecting Landfill Leachate Contamination Using Remote Sensors; Environmental Monitoring and Support Laboratory, Office of Research and Development, US Environmental Protection Agency: Las Vegas, NV, USA, 1979; Volume EPA-600/4-79-060.
  127. Well, G.J.; Graf, R.J.; Forister, L.M. Investigations of hazardous waste sites using thermal IR and ground penetrating radar. Photogramm. Eng. Remote Sensing 1994, 60, 999–1005. [Google Scholar]
  128. Stohr, C.; Su, W.J.; Follmer, L.; DuMontelle, P.; Griffin, R.A. Engineering geology investigations of a hazardous-waste landfill in West Central Illinois, USA. Bull. Eng. Geol. Environ. 1988, 37, 77–89. [Google Scholar] [CrossRef]
  129. Stohr, C.; Darmody, R.G.; Frank, T.D.; Elhance, A.P.; Lunetta, R.; Worthy, D.; O’Connor-Shoresman, K. Classification of depressions in landfill covers using uncalibrated thermal-infrared imagery. Photogramm. Eng. Remote Sensing 1994, 60, 1019–1028. [Google Scholar]
  130. Kwarteng, A.Y.; Al-Enezi, A. Assessment of Kuwait’s Al-Qurain landfill using remotely sensed data. J. Environ. Sci. Heal. A 2005, 39, 351–364. [Google Scholar] [CrossRef]
  131. David, N.A.; Ginsberg, I.W.; Van Eeckhout, E.M.; Balick, L.K.; Lewis, A.A.; Odenweller, J.B.; Stahl, G.A.; Tyler, W.A.; Weber, R.M. Remote sensing characterization of selected waste sites at the Los Alamos National Laboratory. Environ. Geosci. 1996, 3, 1–10. [Google Scholar]
  132. Irvine, J.M.; Evers, T.K.; Smyre, J.L.; Huff, D.; King, A.L.; Stahl, G.; Odenweller, J. The detection and mapping of buried waste. Int. J. Remote Sens. 1997, 18, 1583–1595. [Google Scholar] [CrossRef]
  133. Justice, C.O.; Giglio, L.; Korontzi, S.; Owens, J.; Morisette, J.T.; Roy, D.; Descloitres, J.; Alleaume, S.; Petitcolin, F.; Kaufman, Y. The MODIS fire products. Remote Sens. Environ. 2002, 83, 244–262. [Google Scholar] [CrossRef]
  134. Giglio, L.; Descloitres, J.; Justice, C.O.; Kaufman, Y.J. An enhanced contextual fire detection algorithm for MODIS. Remote Sens. Environ. 2003, 87, 273–282. [Google Scholar] [CrossRef]
  135. Kahle, A.B.; Goetz, A.F.H. Mineralogic information from a new airborne thermal infrared multispectral scanner. Science 1983, 222, 24–27. [Google Scholar] [CrossRef] [PubMed]
  136. Lang, H.; Adams, S.; Conel, J.; McGuffie, B.; Paylor, E.; Walker, R. Multispectral remote sensing as stratigraphic and structural tool, Wind River Basin and Big Horn Basin areas, Wyoming. AAPG Bull. 1987, 71, 389–402. [Google Scholar]
  137. Hook, S.J.; Cudahy, T.J.; Kahle, A.B.; Whitbourn, L.B. Synergy of active and passive airborne thermal infrared systems for surface compositional mapping. J. Geophys. Res. 1998, 103, 18269–18276. [Google Scholar] [CrossRef]
  138. Collins, A.H. Thermal infrared spectra and images of altered volcanic rocks in the Virginia Range, Nevada. Int. J. Remote Sens. 1991, 12, 1559–1574. [Google Scholar] [CrossRef]
  139. Ondrusek, J.; Christensen, P.R.; Fink, J.H. Mapping the distribution of vesicular textures on silicic lavas using the Thermal Infrared Multispectral Scanner. J. Geophys. Res. 1993, 98, 15903–15908. [Google Scholar] [CrossRef]
  140. Realmuto, V.J.; Abrams, M.J.; Buongiorno, M.F.; Pieri, D.C. The use of multispectral thermal infrared image data to estimate the sulfur dioxide flux from volcanoes: a case study from Mount Etna, Sicily, July 29, 1986. J. Geophys. Res. 1994, 99, 481–488. [Google Scholar] [CrossRef]
  141. Realmuto, V.J.; Sutton, A.J.; Elias, T. Multispectral thermal infrared mapping of sulfur dioxide plumes: A case study from the East Rift Zone of Kilauea Volcano, Hawaii. J. Geophys. Res. 1997, 102, 15057–15072. [Google Scholar] [CrossRef]
  142. Realmuto, V.J. The potential use of earth observing system data to monitor the passive emission of sulfur dioxide from volcanoes. Geoph. Monog. 2000, 116, 101–115. [Google Scholar]
  143. Lucey, P.G.; Williams, T.J.; Mignard, M.; Julian, J.; Kobubun, D.; Allen, G.; Hampton, D.; Schaff, W.; Schlangen, M.J.; Winter, E.M. AHI: An airborne long-wave infrared hyperspectral imager. Proc. SPIE 1998, 3431. [Google Scholar] [CrossRef]
  144. Lucey, P.G.; Williams, T.J.; Winter, M.; Winter, E.M. Performance of the AHI airborne thermal infrared hyperspectral imager. Proc. SPIE 2000. [Google Scholar] [CrossRef]
  145. Lucey, P.G.; Williams, T.J.; Winter, M.E.; Winter, E.M. Two years of operations of AHI: An LWIR hyperspectral imager. Proc. SPIE 2000, 4030. [Google Scholar] [CrossRef]
  146. Lucey, P.G.; Williams, T.; Winter, M. Recent results from AHI: A LWIR hyperspectral imager. Proc. SPIE 2004, 5159. [Google Scholar] [CrossRef]
  147. Keim, E.R. The SEBASS Hyperspectral Imaging Spectrograph: Instrument Description and Sample Thermal Images Obtained Near Flagstaff, Arizona and Mesquite, Nevada. In Lunar and Planetary Institute Workshop; Houston, TX, USA, 10–11 June 1999. [Google Scholar]
  148. Kirkland, L.; Herr, K.; Keim, E.; Adams, P.; Salisbury, J.; Hackwell, J.; Treiman, A. First use of an airborne thermal infrared hyperspectral scanner for compositional mapping. Remote Sens. Environ. 2002, 80, 447–459. [Google Scholar] [CrossRef]
  149. Cudahy, T.J.; Wilson, J.; Hewson, R.; Linton, P.; Harris, P.; Sears, M.; Okada, K.; Hackwell, J.A. Mapping Variations in Plagioclase Felspar Mineralogy Using Airborne Hyperspectral TIR Imaging Data. In Proceedings of 2001 IEEE International Geoscience and Remote Sensing Symposium, Sydney, NSW, Australia, July 9–13, 2001; pp. 730–732.
  150. Vaughan, R.G.; Calvin, W.M.; Taranik, J.V. SEBASS hyperspectral thermal infrared data: Surface emissivity measurement and mineral mapping. Remote Sens. Environ. 2003, 85, 48–63. [Google Scholar] [CrossRef]
  151. Calvin, W.M.; Coolbaugh, M.; Kratt, C.; Vaughan, R.G.; Calvin, W. Application of Remote Sensing Technology to Geothermal Exploration. In Proceedings of Geological Survey of Nevada Meeting, Reno, NV, USA, May 14–18, 2005.
  152. Aslett, Z.; Taranik, J.V.; Riley, D.N. Mapping Rock-Forming Minerals at Daylight Pass, Death Valley National Park, California, Using SEBASS Thermal-Infrared Hyperspectral Image Data. In Proceedings of 2008 IEEE International Geoscience & Remote Sensing Symposium, Boston, MA, USA, July 6–11, 2008.
  153. Jones, K.L.; Schulenburg, N.W.; Wright, C. Hyperspectral remote sensing techniques for locating geothermal areas. Proc. SPIE 2010, 7687. [Google Scholar] [CrossRef]
  154. Riley, R.A.; Newsom, R.K.; Andrews, A.K. Anomaly detection in noisy hyperspectral imagery. Proc. SPIE 2004, 5546, 159–170. [Google Scholar]
  155. Calvin, W.M.; Vaughan, R.G.; Taranik, J.V.; Smailbegovic, A. Mapping Natural and Human Influenced Acid Sulfate Weathering near Reno, NV Using the SEBASS Hyperspectral Instrument. In Proceedings of 2001 IEEE International Geoscience and Remote Sensing Symposium, Sydney, NSW, Australia, July 9–13, 2001; pp. 727–729.
  156. Ribeiro da Luz, B.; Crowley, J.K. Spectral reflectance and emissivity features of broad leaf plants: Prospects for remote sensing in the thermal infrared (8.0–14.0 μm). Remote Sens. Environ. 2007, 109, 393–405. [Google Scholar] [CrossRef]
  157. Zare, A.; Bolton, J.; Gader, P.; Schatten, M. Vegetation mapping for landmine detection using long-wave hyperspectral imagery. IEEE Trans. Geosci. Remote Sens. 2007, 46, 172–178. [Google Scholar] [CrossRef]
  158. Griffin, M.K.; Kerekes, J.P.; Farrar, K.E.; Burke, H.K. Characterization of gaseous effluents from modeling of LWIR hyperspectral measurements. Proc. SPIE 2001, 4381, 360–369. [Google Scholar]
  159. Messinger, D.W. Gaseous plume detection in hyperspectral images: a comparison of methods. Proc. SPIE 2004, 5425, 592–603. [Google Scholar]
  160. O’Donnell, E.; Messinger, D.; Salvaggio, C.; Schott, J. Identification and detection of gaseous effluents from hyperspectral imagery using invariant algorithms. Proc. SPIE 2004, 5425, 573–582. [Google Scholar]
  161. Heasler, P.; Posse, C.; Hylden, J.; Anderson, K. Nonlinear bayesian algorithms for gas plume detection and estimation from hyper-spectral thermal image data. Sensors 2007, 7, 905–920. [Google Scholar] [CrossRef]
  162. Messinger, D.W.; Salvaggio, C.; Sinisgalli, N.M. Detection of gaseous effluents from airborne LWIR hyperspectral imagery using physics-based signatures. In Spectral Sensing Research for Water Monitoring Applications and Frontier Science and Technology for Chemical, Biological and Radiological Defense; Woolard, D., Jensen, J., Eds.; World Scientific Pub Co. Inc.: Hackensack, NJ, USA, 2008; Volume 17, p. 173. [Google Scholar]
  163. Bowman, A.P.; Winter, E.M.; Stocker, A.D.; Lucey, P.G. Hyperspectral Infrared Techniques for Buried Landmine Detection. In Proceedings of Second International Conference on the Detection of Abandoned Land Mines, Edinburgh, UK, October 12–14, 1998; pp. 129–133.
  164. Gurka, D.F.; Betowski, L.D. Gas chromatographic/Fourier transform infrared spectrometric identification of hazardous waste extract components. Anal. Chem. 1982, 54, 1819–1824. [Google Scholar] [CrossRef]
  165. Brown, M.A.; Kim, I.S.; Roehl, R.; Sasinos, F.I.; Stephens, R.D. Analysis of target and nontarget pollutants in aqueous leachates from the hazardous waste site Stringfellow, California, via ion chromatography-particle beam and inductively coupled plasma mass spectrometry. Chemosphere 1989, 19, 1921–1927. [Google Scholar] [CrossRef]
  166. Kaune, A.; Lenoir, D.; Nikolai, U.; Kettrup, A. Estimating concentrations of polychlorinated dibenzo-p-dioxins and dibenzofurans in the stack gas of a hazardous waste incinerator from concentrations of chlorinated benzenes and biphenyls. Chemosphere 1994, 29, 2083–2096. [Google Scholar] [CrossRef]
  167. Kokaly, R.F.; Clark, R.N. Spectroscopic Determination of Leaf Biochemistry Using Band-Depth Analysis of Absorption Features and Stepwise Multiple Linear Regression. Remote Sens. Environ. 1999, 67, 267–287. [Google Scholar] [CrossRef]
  168. Curran, P.J.; Dungan, J.L.; Peterson, D.L. Estimating the foliar biochemical concentration of leaves with reflectance spectrometry: Testing the Kokaly and Clark methodologies. Remote Sens. Environ. 2001, 76, 349–359. [Google Scholar] [CrossRef]

