1. Introduction
Temperatures are gradually increasing globally due to a changing climate [
1]. For example, Hamdi [
2] found that daily minimum and, to a lesser extent, maximum summer temperatures in the Brussels region, Belgium, followed a linear increase over the past 50 years. The built environment in urban areas such as Brussels is generally categorized into different land uses for local and regional planning purposes. The thermal properties of land uses are playing a significant role in producing temperature extremes [
3]. When heat is radiated from surfaces of various land uses along with the presence of meteorological parameters such as wind speed and direction, an Urban Heat Island (UHI) can form [
4]. The UHI effect is defined as the warmer temperatures of urban areas in comparison to their rural surroundings [
5]. The United States Environmental Protection Agency (US EPA) [
1] distinguishes between surface UHIs and atmospheric UHIs. Solar energy is absorbed and radiated back to the atmosphere by the physical land features. This is considered to be a main factor in warming both surface and air temperatures, “especially in the canopy layer, which is closest to the surface” ([
1], p. 4). This project focuses on the surface UHI. Therefore, it becomes vital to explore the association of different types of urban land use with surface temperatures.
Extreme temperatures have serious impacts on human health, including but not limited to: heat rash, sunburn, fainting, and heat exhaustion [
6,
7,
8]. These illnesses can lead to increased mortality [
7]. A large number of deaths related to heat occur during heat waves [
9]. Whitman
et al. [
10] reported that more than 500 people were killed in five days during a heat wave in Chicago in 1995, and nearly 70,000 people died as a result of heat-related illness in 16 European countries in 2003 [
11].
Continuously rising temperatures in urban areas create an uncomfortable environment for residents which results in increasing demand for energy to use air conditioners during extreme heat events. The operation of cooling centers also increases operational and maintenance cost for municipalities [
1,
12,
13]. It is a key concern for urban planners to understand the role that land development patterns and their spatial distribution area playing in the formation of the UHI in large cities like Toronto. Taha [
14] found that urban form, thermal properties of buildings, and anthropogenic heat sources have an influence on the UHI. Therefore, the UHI has recently gained attention of public administration in municipal governments, environmental protection offices, and public health agencies [
1,
13].
The purpose of this study is to explore the relationship between land use and surface temperature in an urban environment on a hot summer day. The study objectives are to: (1) Identify temperature differences between land uses and assess the association between land use and surface temperature; (2) Examine the influence of homogenous land use areas on temperatures; (3) Suggest targeted mitigation strategies for planning and public health agencies. We employ zonal statistics, correlation analysis, and kernel density techniques (e.g., [
15]) to measure the association between land use and surface temperature.
The remainder of the paper is organized as follows. The next section summarizes previous research and studies conducted on urban land uses and the urban heat island effect. Next, the data and methods used in this project are described. This is followed by the results of the analysis according to the three research objectives. The last section provides a discussion and an outlook on future work.
2. Background
The Urban Heat Island (UHI) effect has been of concern for over 40 years [
16]. It refers to the notion that urban areas are warmer than surrounding rural areas [
17]. This temperature difference is due to a number of factors including but not limited to urban geometry (
i.e., size, shape, height, and arrangement of buildings), thermal characteristics of urban surfaces, scarce vegetation, extensive use of air conditioning during hot weather, industrial processes, and automobile use [
5,
18]. An UHI can form in small cities and towns but its effects increase with an increase in the size of the built area [
1].
The UHI effect is primarily caused by the built environment in urban areas, in which natural areas are replaced with non-permeable and high-temperature surfaces of concrete and asphalt [
19]. The built environment includes building roofs and walls, roads and parking lots, industrial and commercial areas, and parks and recreation centers [
20]. This land cover results in less shade and moisture to keep urban areas cool. This is because built up areas have less moisture contents, and therefore evaporate less water into the air causing high surface and air temperatures [
1]. Different urban land uses participate in proliferating or alleviating the urban heat island effect, and influence temperatures in cities [
21]. In developed urban areas, surfaces and structures create increased opportunities for solar energy to be absorbed due to multiple reflections caused by the high-rise buildings. Such arrangement of buildings minimizes the chances of trapped heat (long-wave radiation) to escape from urban canyons—the streets and adjacent buildings that make up urban areas [
22]. In urban centers such as core downtown areas, high rise buildings can obstruct heat from escaping [
23,
24].
The US EPA report [
1] notes that surface temperatures influence air temperatures, particularly in the layer between the surface and the tree canopy. However, the relationship “between the surface temperature and air temperature is not constant” [
1]. While surface temperature varies with surface materials, air temperature does not change as much over an area [
1]. Surface temperature is of primary importance because it not only helps determining the heat trapped in urban canyons, radiated from thermal properties of structures and urban surfaces, but also creates an uncomfortable environment for residents when they are indoors as well as outdoors [
25]. Studies of the UHI using surface temperature from thermal remote sensing benefit from greater spatial resolutions, while
in situ measurement of air temperature can produce greater temporal resolutions [
3].
Urban development, whether in the form of residential, commercial, or industrial, influences the UHI through the thermal characteristics of land cover. For example, a study conducted in Ho Chi Minh City of Northern Vietnam, Van and Bao [
26] found the highest land surface temperatures in industrial areas (greater than 45 °C) as compared to the rest of the urban area (36 to 40 °C). Similarly, a study in Nanjing, China, revealed that an increase in urban land surface temperature is associated with a decrease in the Normalized Difference Vegetation Index (NDVI) by a moderate negative correlation of −0.59 [
16]. This study also found that smaller patches of vegetated area provided less cooling than larger ones [
16].
Several studies have been conducted to observe spatial patterns of the UHI. For example, Xiao
et al. [
27] reported that impervious surfaces tended to correlate positively with land surface temperature in Beijing, China. Stone and Norman [
28] conducted a study in Atlanta, Georgia, and found that if appropriate changes in the zoning and sub-division regulations were applied, the formation of the UHI could be reduced by 40 percent. Bottyan
et al. [
29] observed a concentric shape of UHI intensity with local anomalies around the denser urban areas of Debrecen, Hungary. Using a regression analysis, they concluded that built-up areas are strongly correlated with the development of an urban heat intensity field (a measure of the strength of the heat island). Similarly, [
21] conducted studies in Singapore on the influence of land use on the UHI and found that during the day, land uses in the order of decreasing surface temperature were industrial, commercial, airport, residential, and park. The order during night-time was commercial, residential, park, industrial, and airport. A recent study conducted by Maloley [
19] for the Greater Toronto Area, Canada, compared land cover changes over the last two decades with land surface temperature and found that new developments in Brampton, Richmond Hill, Mississauga and Oakville are closely related to increased surface temperatures.
3. Data and Methods
3.1. Study Area
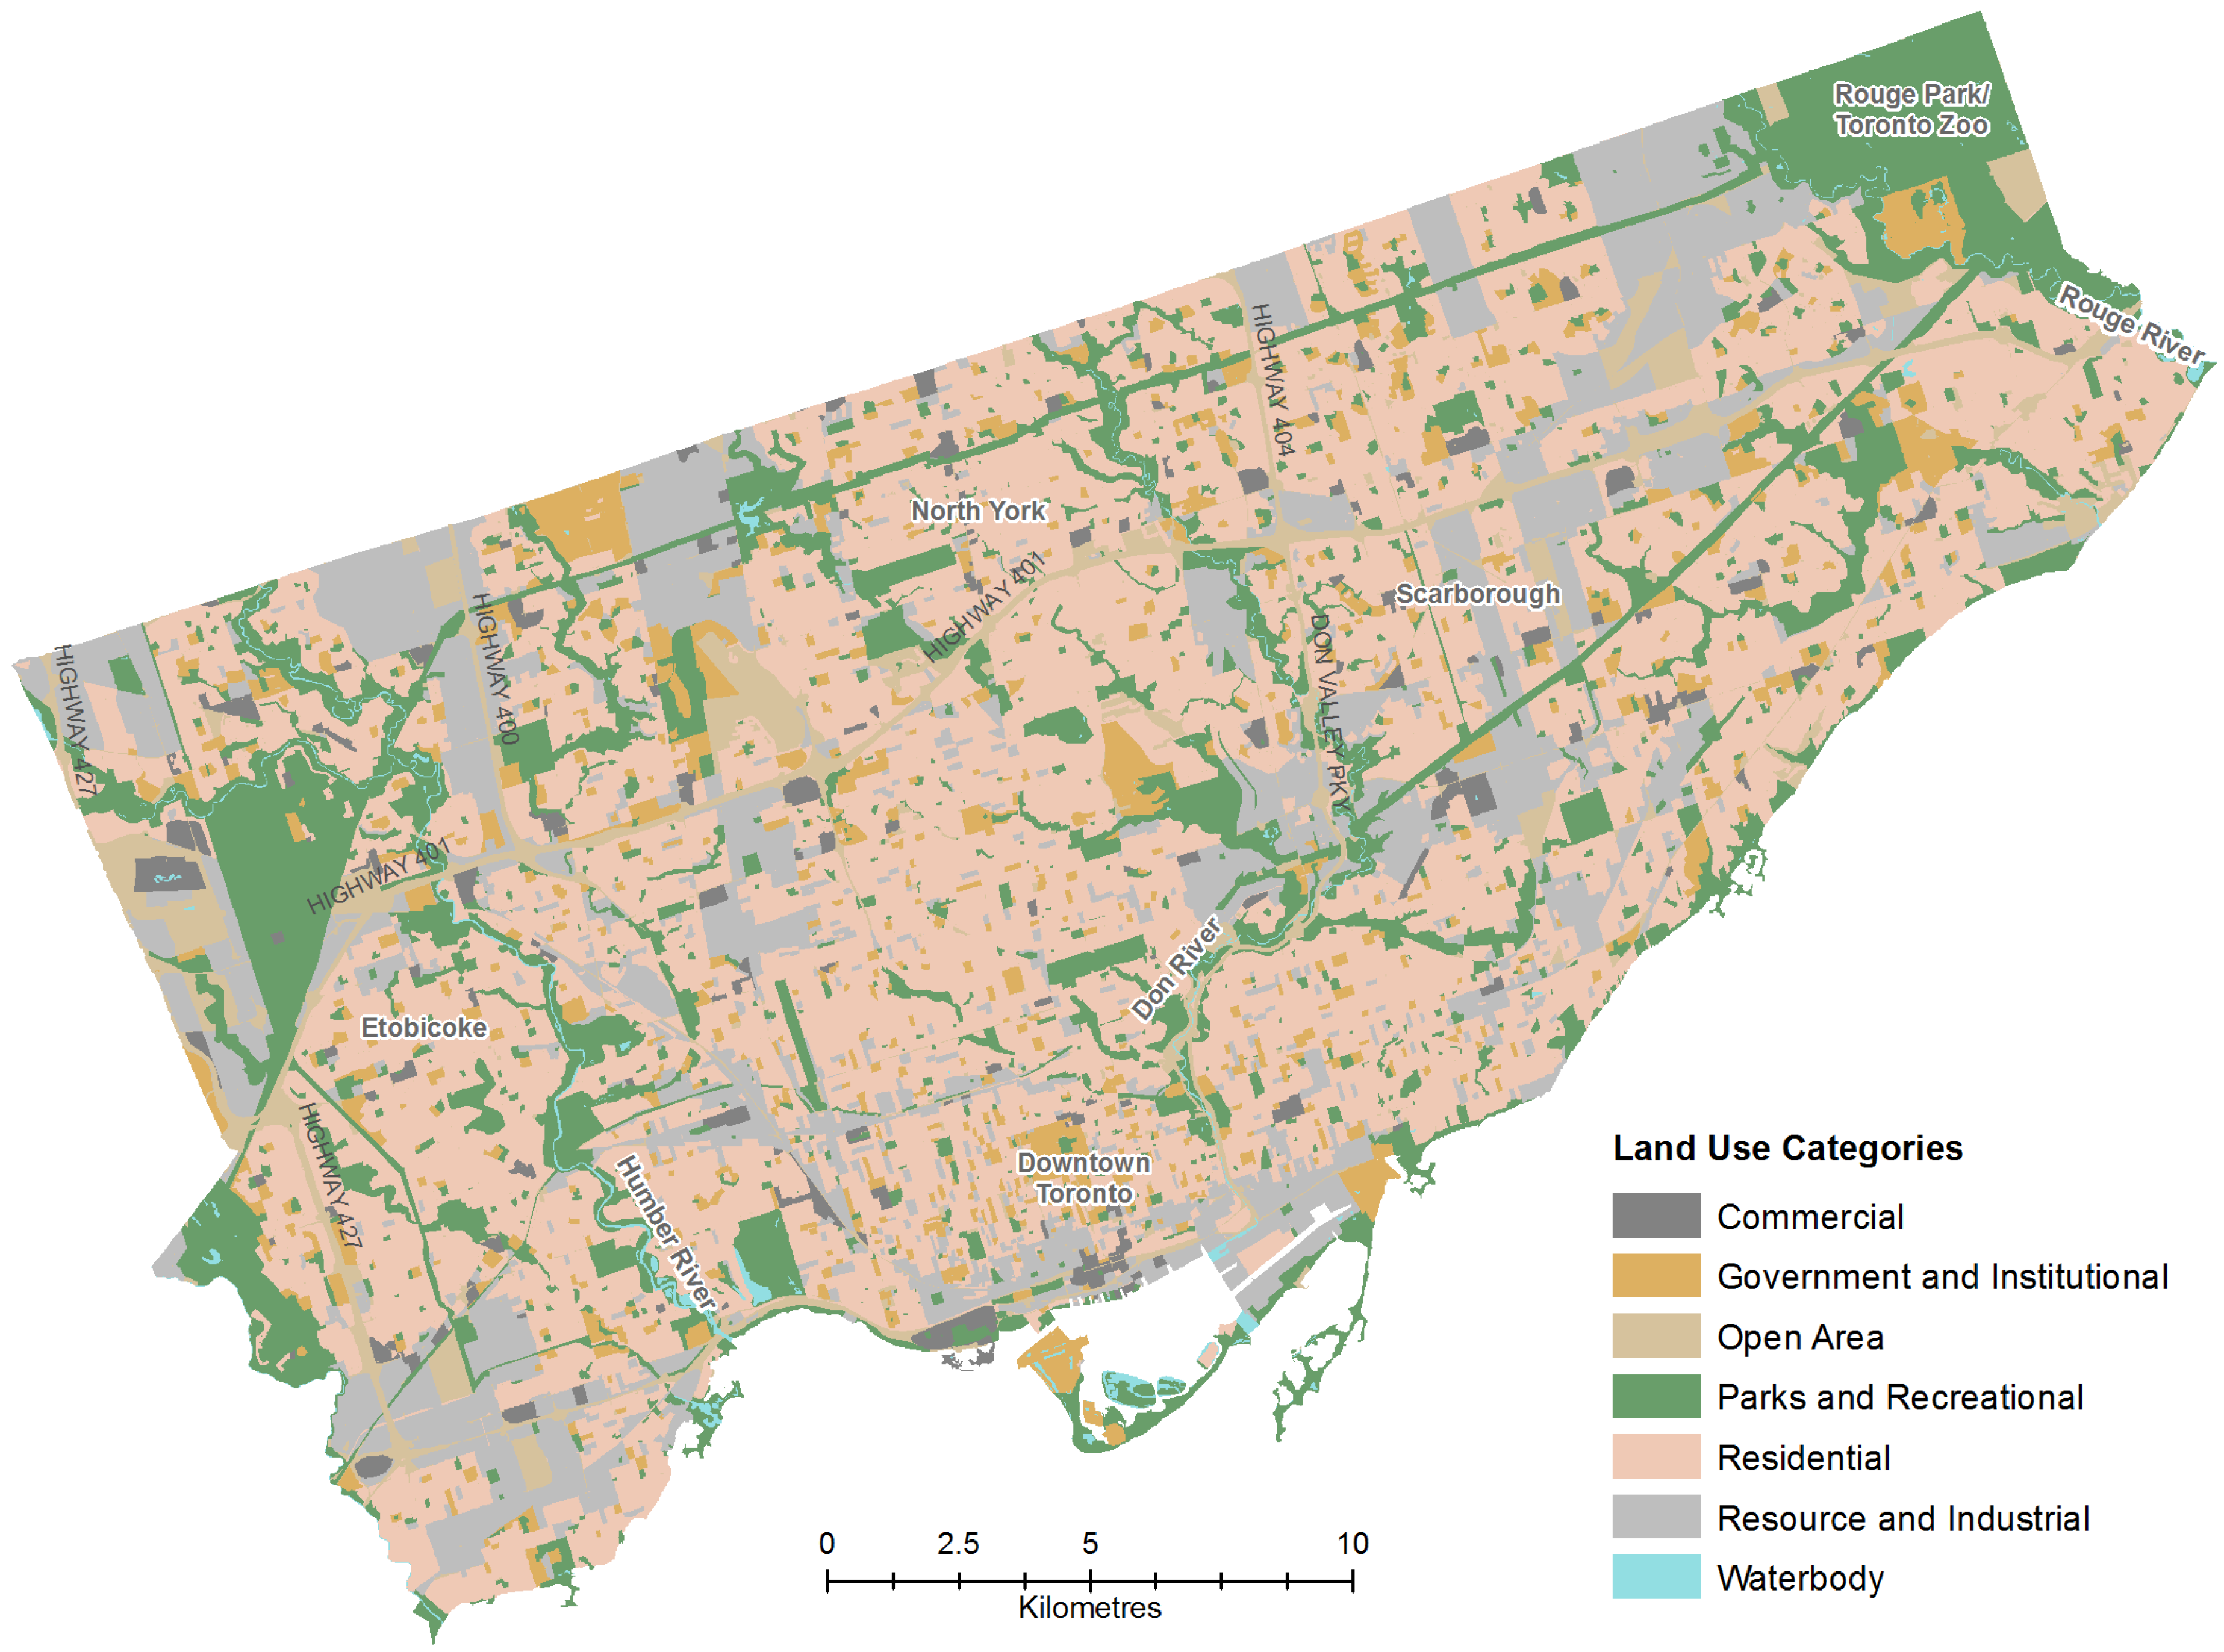
The City of Toronto is the urban core of the Greater Toronto Area (GTA) and contains a unique mix of land uses within its boundaries (
Figure 1). The city is located at 43 °N on the north shore of Lake Ontario, Canada. Greenland [
30] and Yap [
31] noted that regional boundaries play an important role in defining the climate trends in this city as well as in southern Ontario. For example, the Niagara Escarpment and the Oak Ridge’s Moraine provide buffers that mitigate extreme temperatures. Also, Lake Ontario to the south provides a cooling effect to the city. However, the UHI continues to expand in the north [
32].
Figure 1.
Distribution of land use categories in the City of Toronto (Data source: DMTI Spatial).
Figure 1.
Distribution of land use categories in the City of Toronto (Data source: DMTI Spatial).
3.2. Data Sources
The study involved two main datasets: land use polygons, and a remotely sensed thermal image. The land use data for all of Ontario were obtained from DMTI Spatial Inc. as part of the CanMap Route Logistics 2009.4 dataset. The dataset contained seven types of land uses: commercial, government and institutional, open area, parks and recreation, residential, resource and industrial, and water body (see
Figure 1).
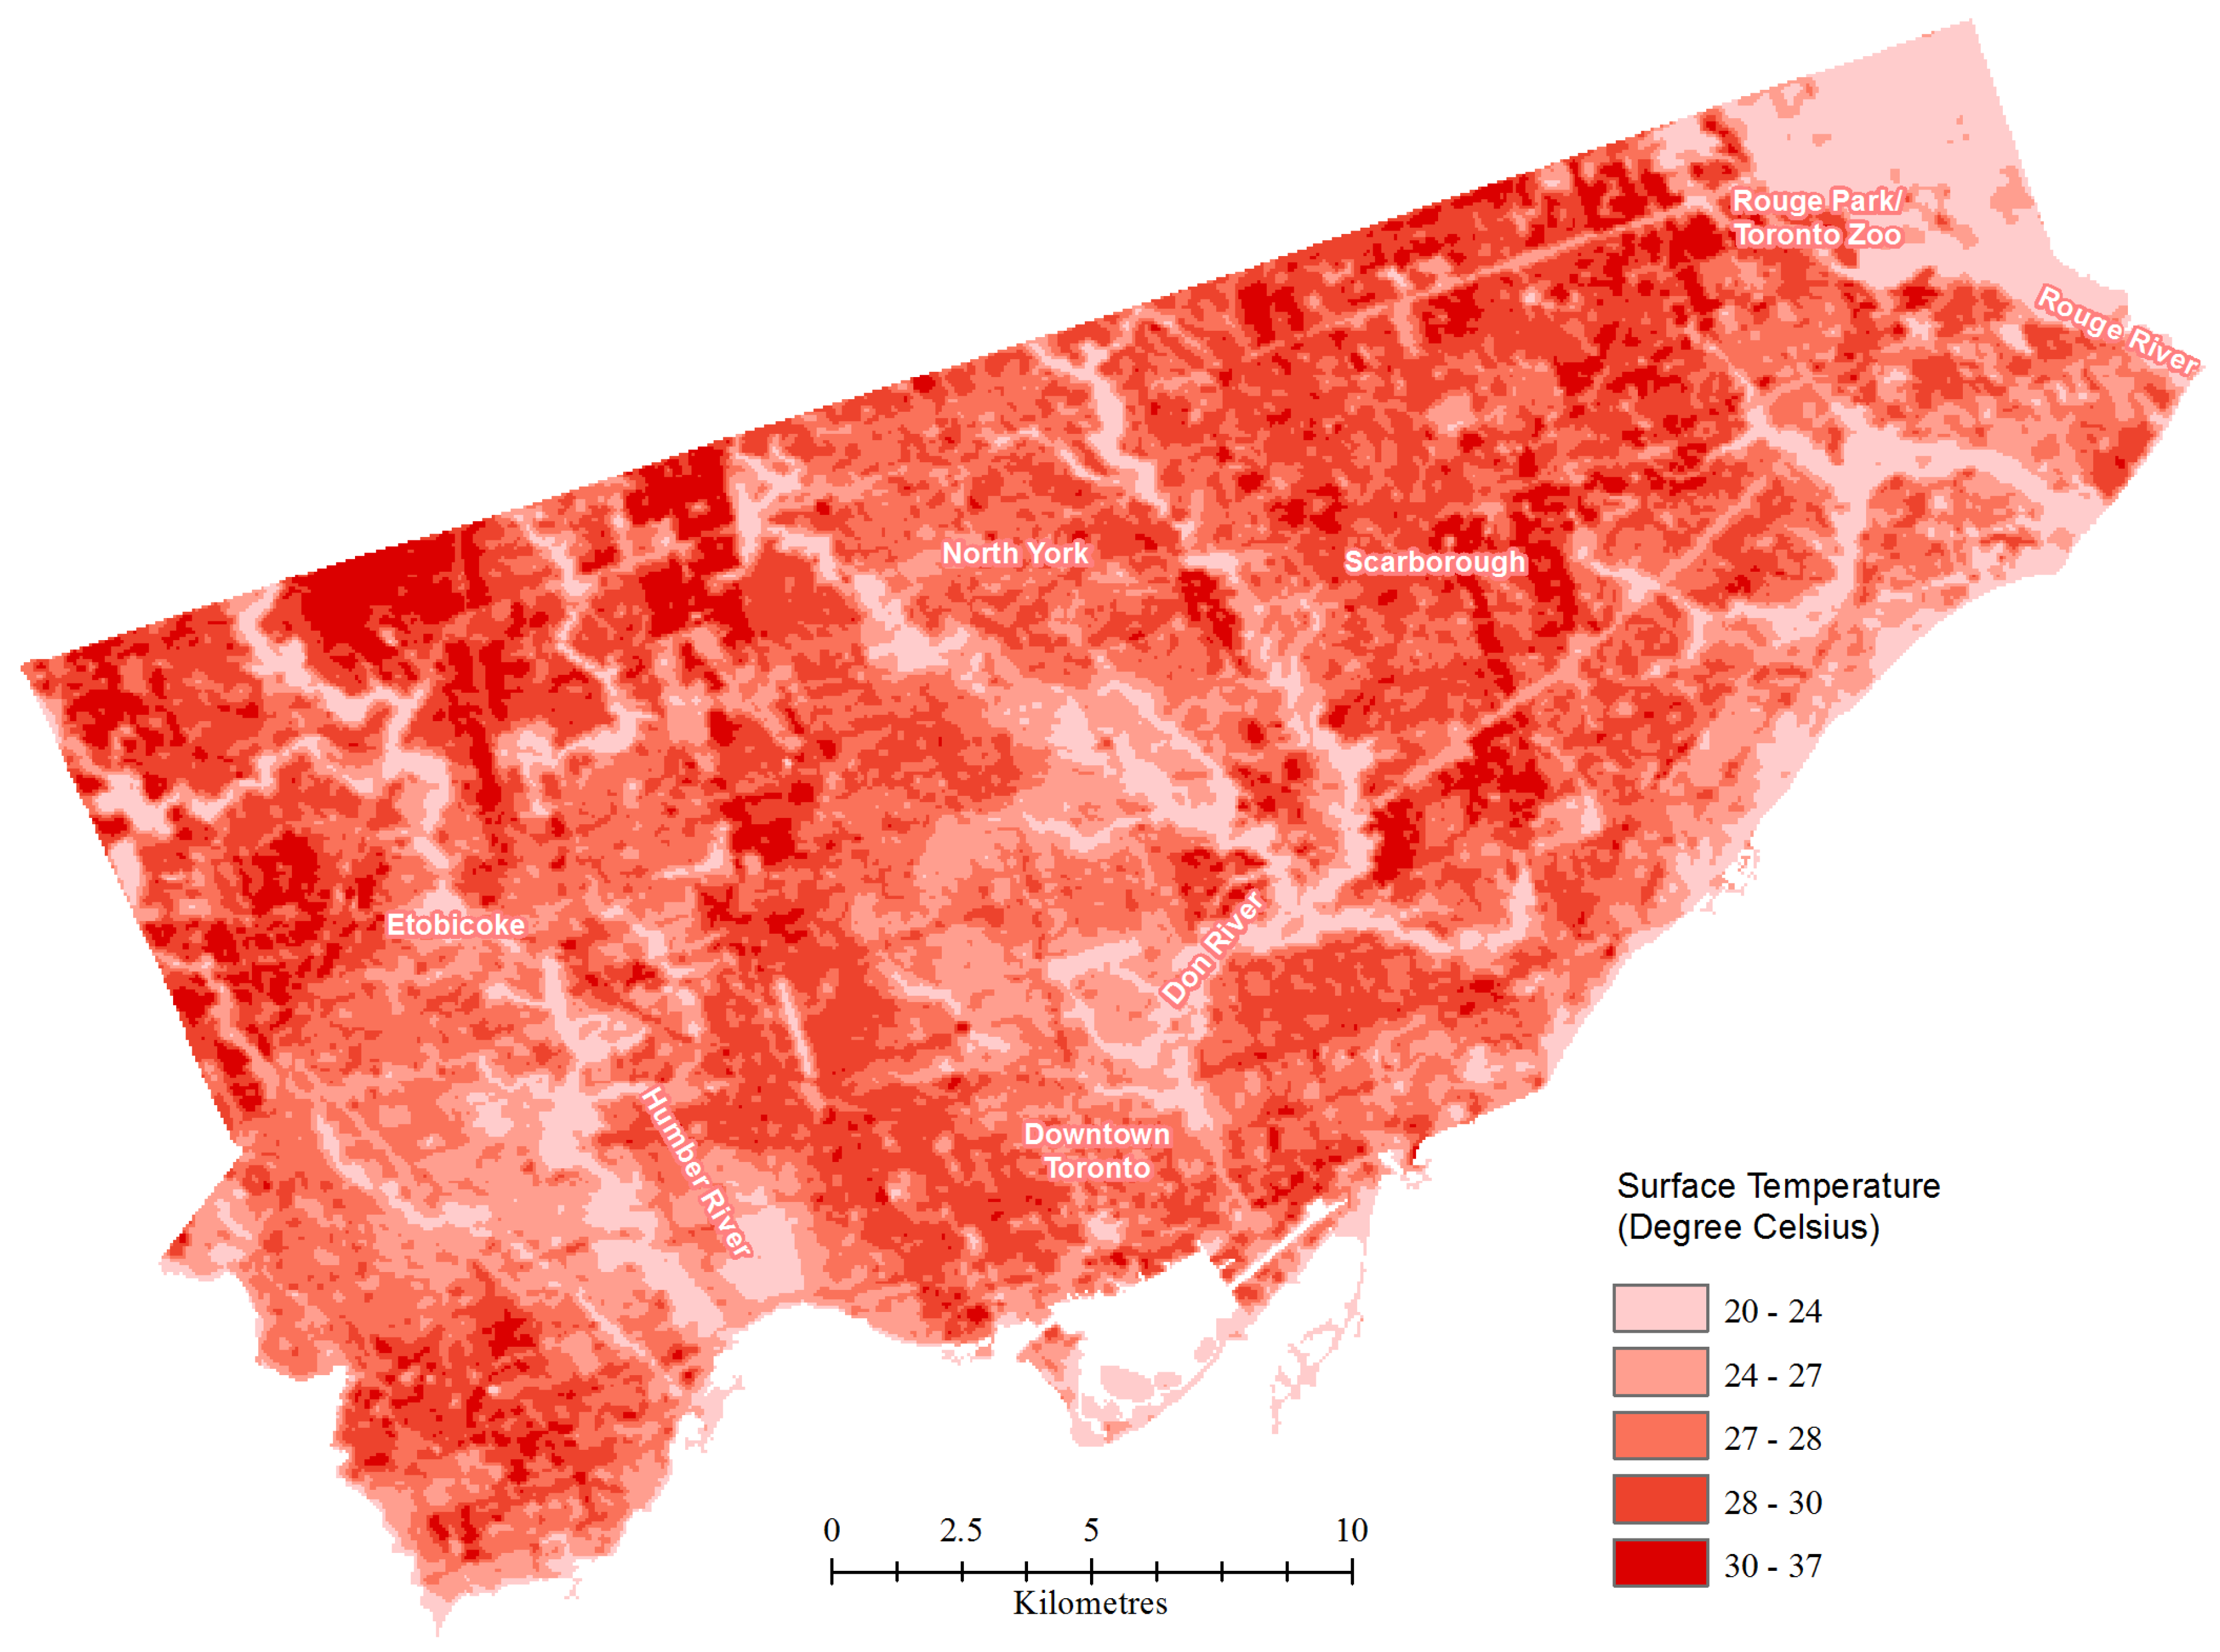
The thermal image was acquired by Landsat Thematic Mapper (TM) at 10:00 am on 3 September 2008. An image for the year 2009 was not available. Therefore, the most recent image of 2008 was used to match the 2009 land use dataset. The air temperature, relative humidity, wind direction, and wind speed at the time of image acquisition at Pearson Airport were 26.3 °C, 46%, West (260 degrees), and 7 km/h respectively [
33]. The Landsat TM image was provided by Natural Resources Canada with a 60-m spatial resolution [
19]. The digital numbers of the thermal band 6 were converted to spectral radiances, from which surface temperatures were derived with an estimated error within 2 °C [
19]. Atmospheric correction was not performed because data on the atmospheric conditions were not available [
19].
3.3. Analysis Methods
To address Objective 1, identifying temperature differences between land uses and assessing the association between land use and surface temperature, vector data analysis (zonal statistics) and descriptive statistics along with an analysis of variance (ANOVA) were applied. To address Objective 2, examining the influence of homogenous land use areas on temperatures, we conducted an additional non-spatial correlation analysis between polygon area and surface temperature, before turning to raster data analysis (kernel density estimation) and correlation analysis between land use density and temperature. To arrive at conclusions for Objective 3, suggesting targeted mitigation strategies for planning and public health agencies, we produced three-dimensional visual overlays of surface temperature and land use density, and provided neighborhood-level illustrations of the results of the previous analysis steps. These methods along with data pre-processing are described in more detail in the following paragraphs.
The land use data were clipped to the City of Toronto boundary, resulting in 18,558 valid land use polygons. Similarly, the 2008 thermal image covering the entire Greater Toronto Area (GTA) was clipped to the City of Toronto boundary. The clipped image contained 176,067 cells showing the variation in the surface temperature for the City of Toronto (
Figure 2).
The area of each land use polygon was calculated in square meters and added to the attribute table. The thermal image was loaded in ArcGIS and analyzed with the zonal statistics operation in spatial analyst tools. The land use layer was used to define zonal boundaries to obtain the mean surface temperature for each land use polygon. The resulting zonal statistics table joined back to the land use polygons.
Basic descriptive statistics were generated for the polygon area and mean temperature variables for each land use type in SPSS 15.0. In addition, histograms were plotted for both variables to check for data normality. The mean temperature variable was approximately normally distributed, whereas the area variable was positively skewed.
We hypothesized that the mean temperatures for different land uses were different. A one-way ANOVA was conducted to verify the significance of differences between the seven land use types representing seven different groups. The test was performed with the Bonferroni post-hoc option to also test the pairwise differences in mean temperature.
Figure 2.
Surface temperature across the City of Toronto at 10:00 am on 3 September 2008 (Data source: Natural Resources Canada).
Figure 2.
Surface temperature across the City of Toronto at 10:00 am on 3 September 2008 (Data source: Natural Resources Canada).
We further hypothesized that there would be a relationship between the size of a single land use area and surface temperature. Polygon boundaries and attribute data for each land use type were separated into stand-alone layers in order to perform a correlation test between the area and mean temperature variables. Since polygon areas were not normally distributed, Spearman’s rho correlation was used.
In order to further understand the relationship between concentrations of homogenous land use and surface temperature, land use density was modeled through kernel density estimation. This technique produces a smooth surface representing the area used for a land use type divided by the total land area. To perform kernel density estimation, centroids were created for the polygons in each of the seven land use layers. Kernel density was estimated using a 1 km radius and a spatial resolution (cell size) of 60 m. The search radius was selected upon visual inspection of the patterns resulting from trials with search radiuses between 200 m and 2 km. The magnitude of each polygon (area) served as an input to the kernel density estimation tool. For each land use, a separate land use density surface with 176,067 cells was created that corresponded to the thermal image resolution. Using SPSS, we applied Spearman’s rho correlation between the land use density and corresponding surface temperature values.
To draw conclusions from the quantitative analyses, we used ArcScene 9.3.1 to overlay the land use density on a three-dimensional surface representing temperature. For each of the land use density map, height extrusion was obtained from the thermal image (surface temperature) with a conversion factor of 300. Finally, we also provided zoomed-in perspectives on selected neighborhoods in Toronto to illustrate the results from the previous steps.
4. Results
4.1. Temperature Differences between Land Uses
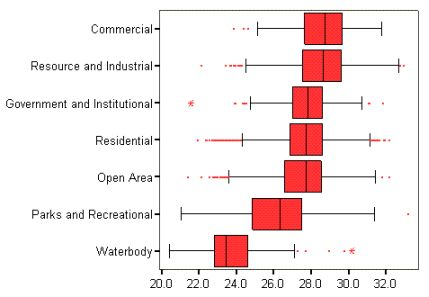
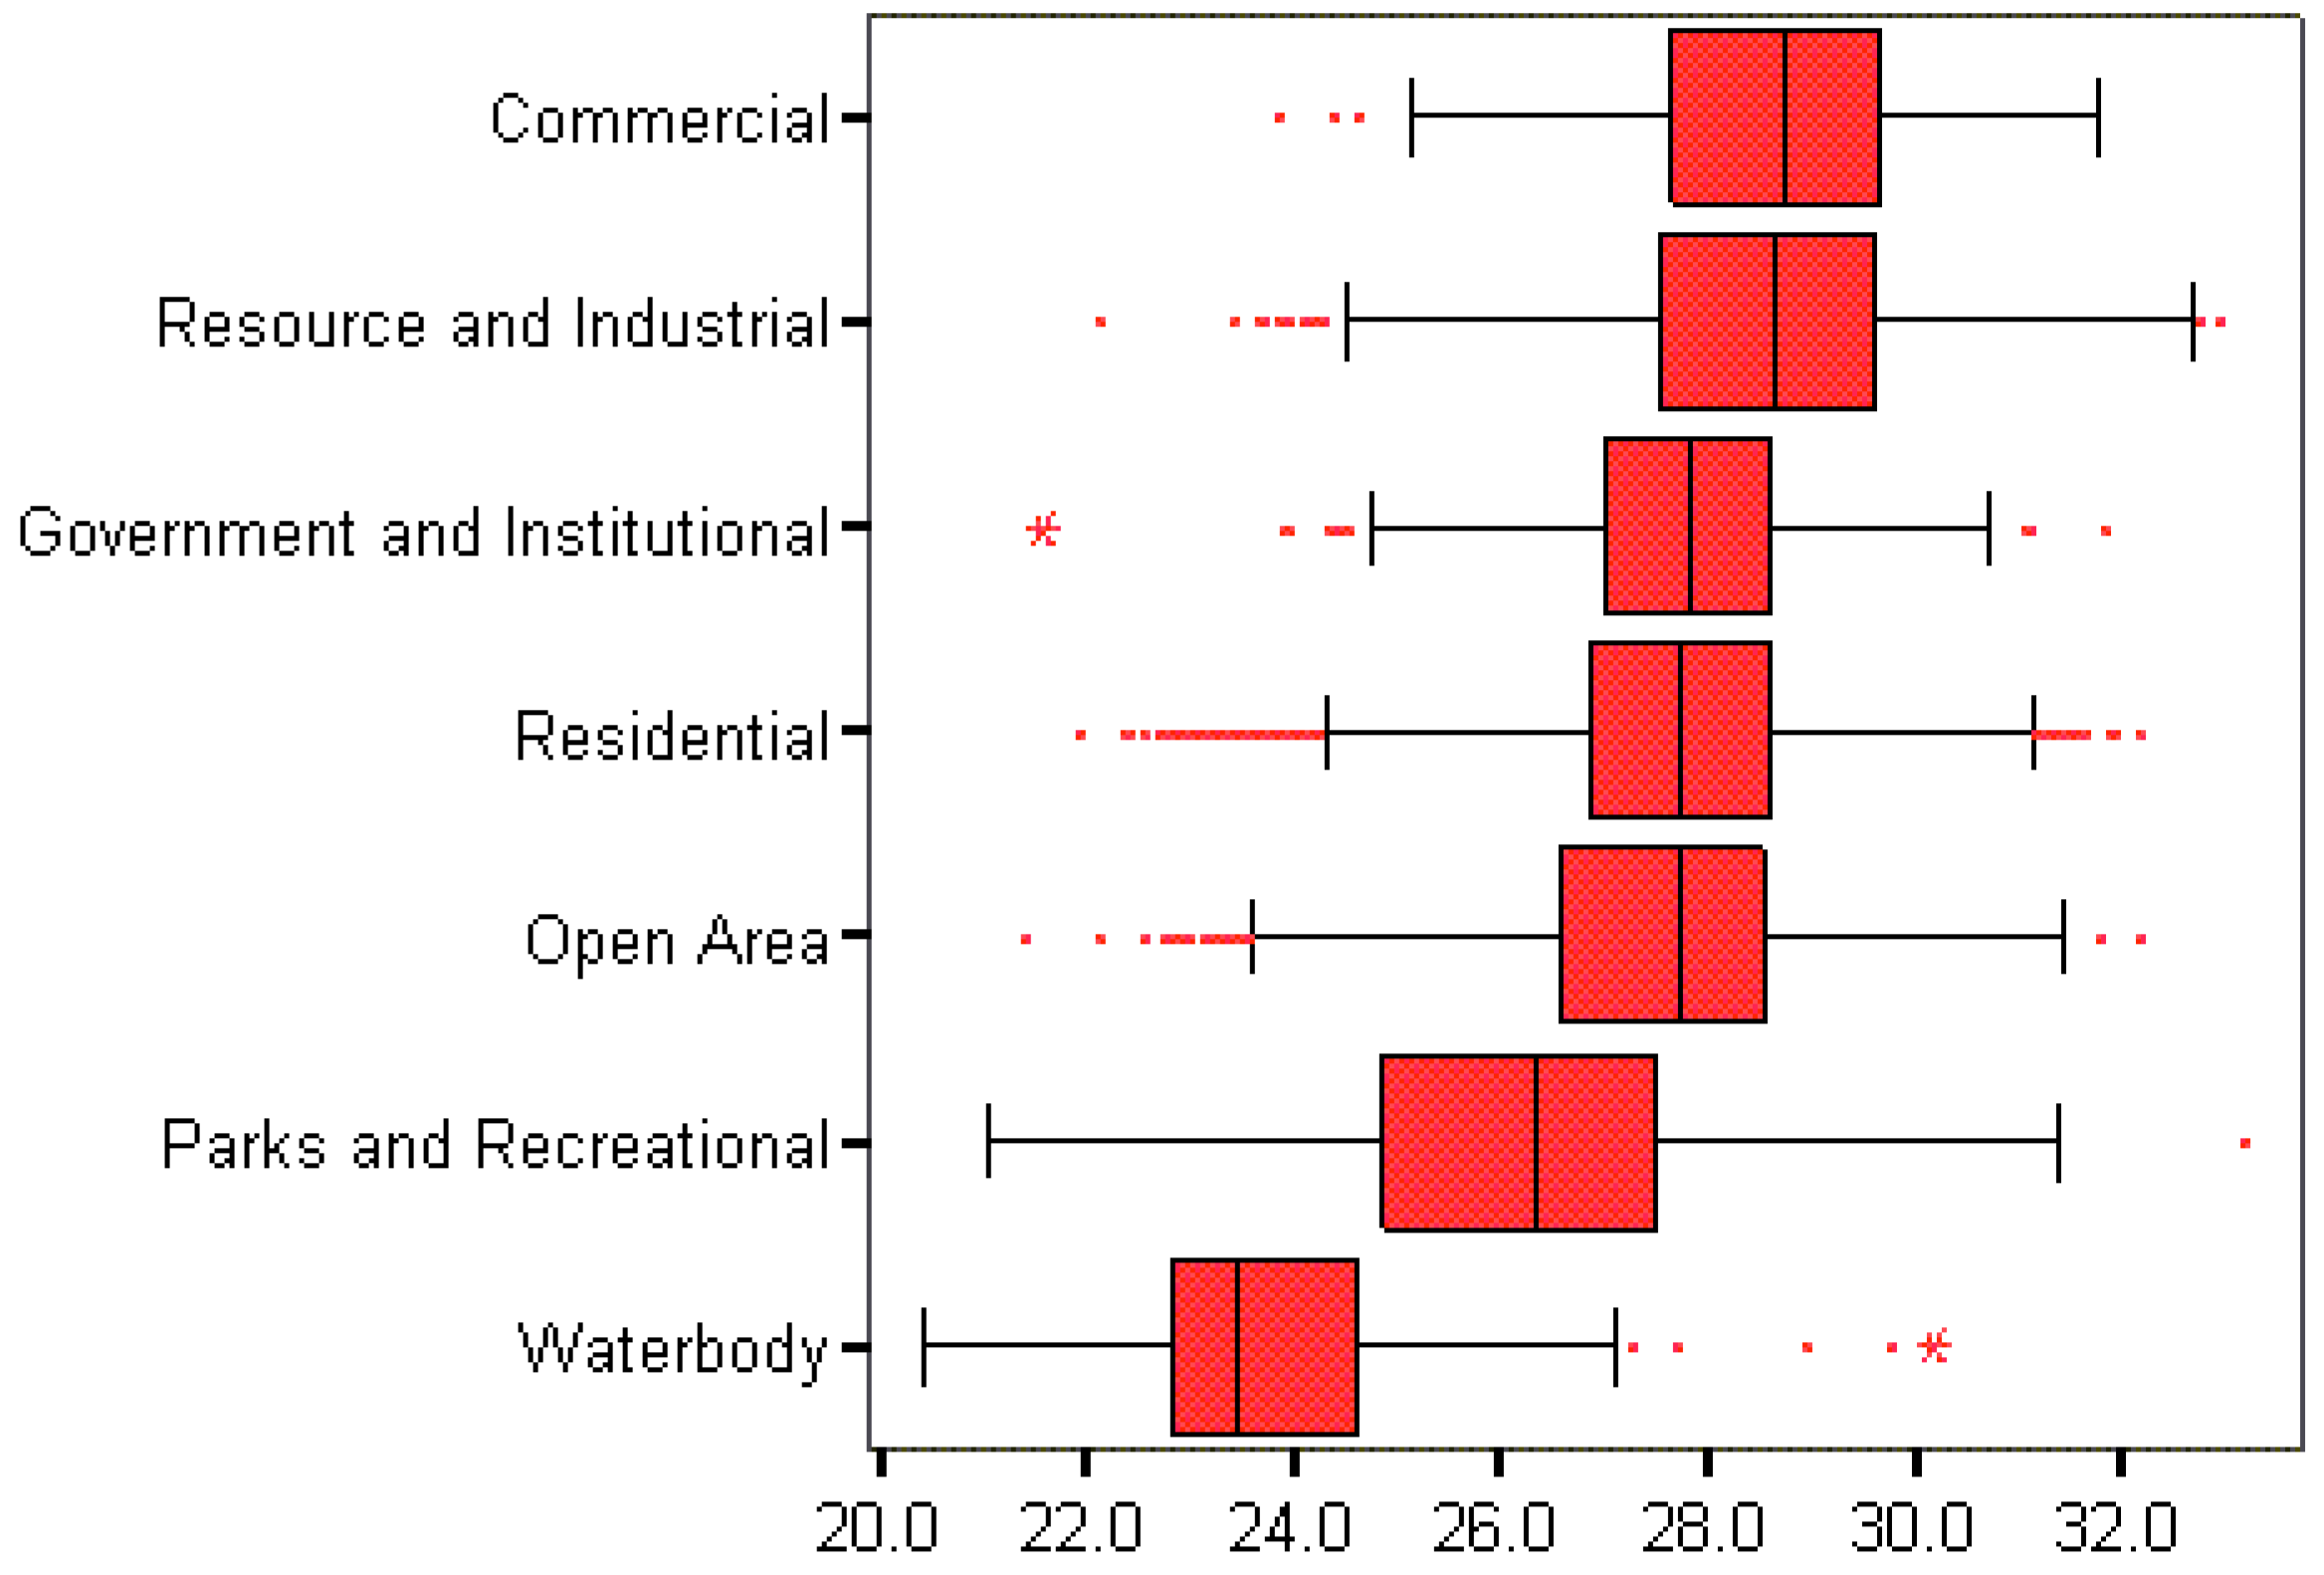
The average temperatures for commercial and resource/industrial land uses were similarly high (29.1 °C). On the other hand, the average temperatures for parks/recreational land use (25.1 °C) and water bodies (23.1 °C) were found to be much lower. Residential and open area land uses averaged temperatures of 27.5 °C, and government/institutional land use was similar with 27.3 °C. The land use types in the order of higher to lower temperatures are: commercial, resource/industrial, government/institutional, residential, open area, parks/recreational, and water body, as shown in
Figure 3.
Figure 3.
Boxplots of mean surface temperature by land use polygon. Land use types are sorted by decreasing average temperatures.
Figure 3.
Boxplots of mean surface temperature by land use polygon. Land use types are sorted by decreasing average temperatures.
The results of the ANOVA showed that the differences between the average temperatures of the land use types were statistically significant. According to the Bonferroni post-hoc test results, only two pairs of land uses do not exhibit statistically significant temperature differences at the 0.01 level: Commercial relative to resource/industrial land uses, and residential land use in relation to government/institutional areas. All other pairs were significantly different.
4.2. The Effect of Land Use Polygon Size
The land area of land use polygons positively correlated with surface temperature for commercial (r = 0.405) and resource/industrial (r = 0.259) land uses at the 0.01 significance level. As the area of these polygons increases, the temperature also tends to increase. On the other hand, water bodies (r = −0.323) and parks and recreational polygons (r = −0.264) showed a statistically significant negative relationship at the 0.01 level. As the area of a water body or park increases, its temperature tends to decrease. The other three land uses (residential, government/institutional, and open area) showed very weak relationships (r = 0.067, −0.083, and −0.098 respectively), although these were still significant at the 0.05 level.
4.3. The Effect of Land Use Density
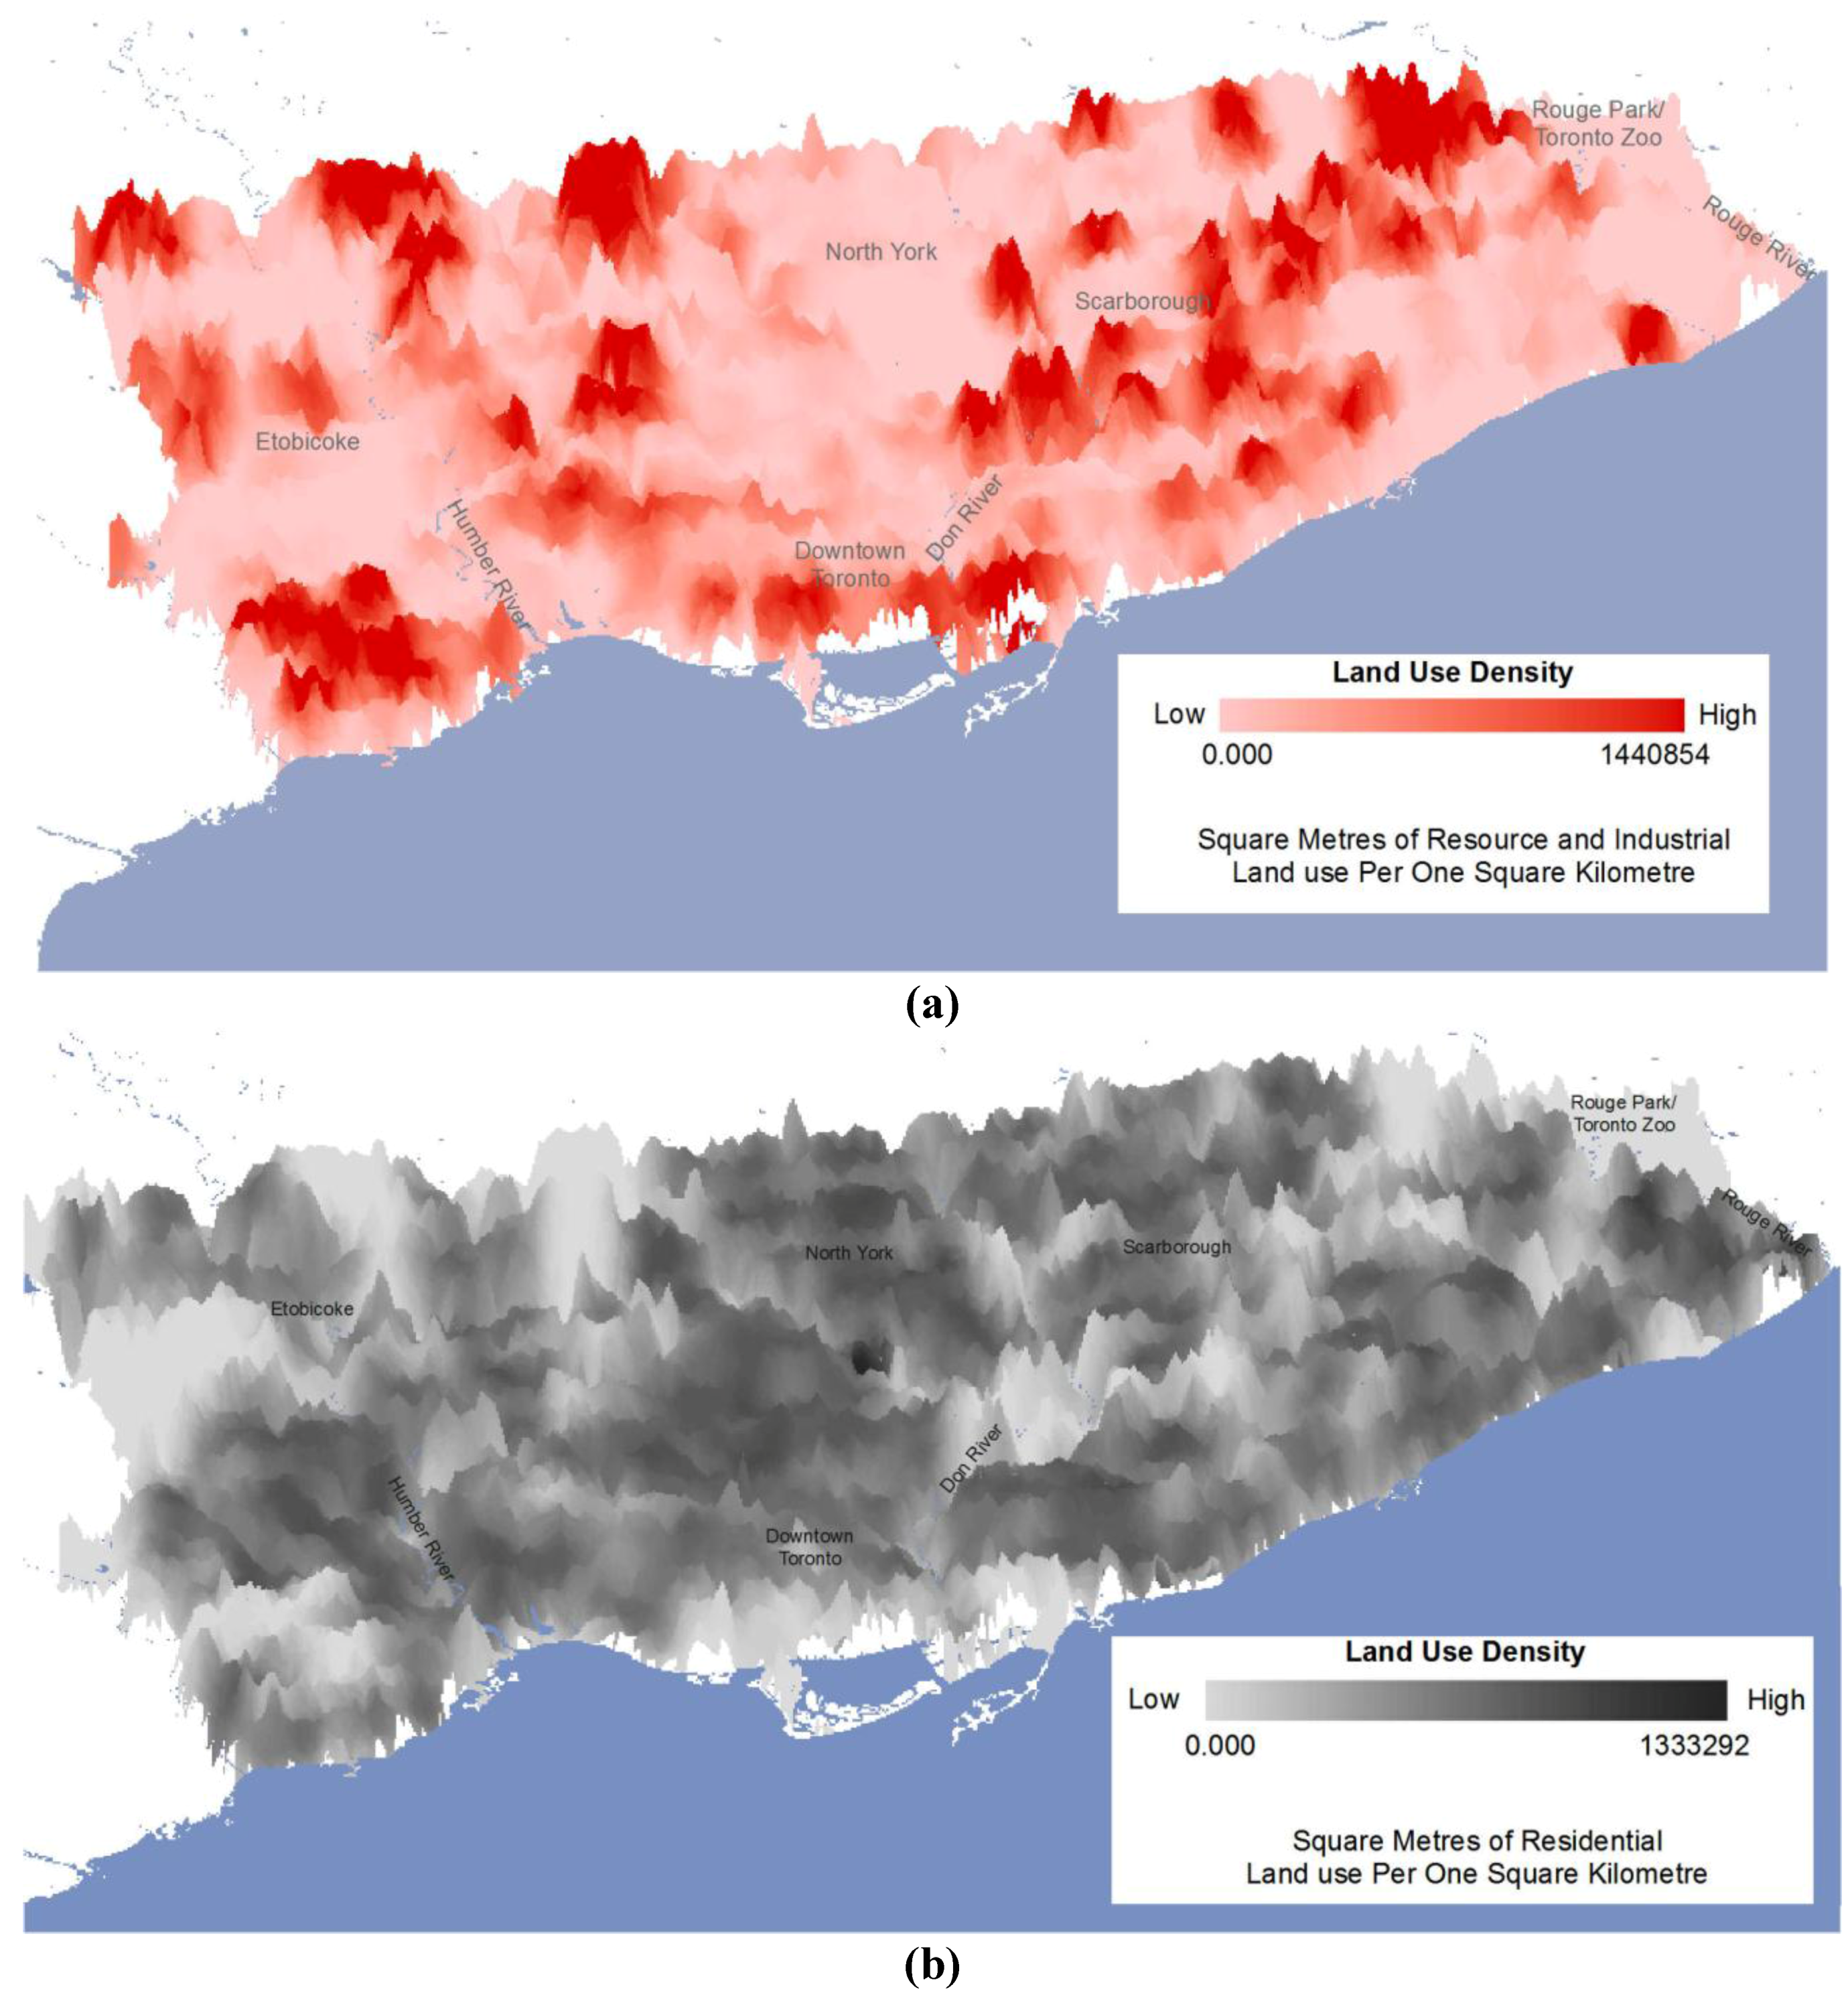
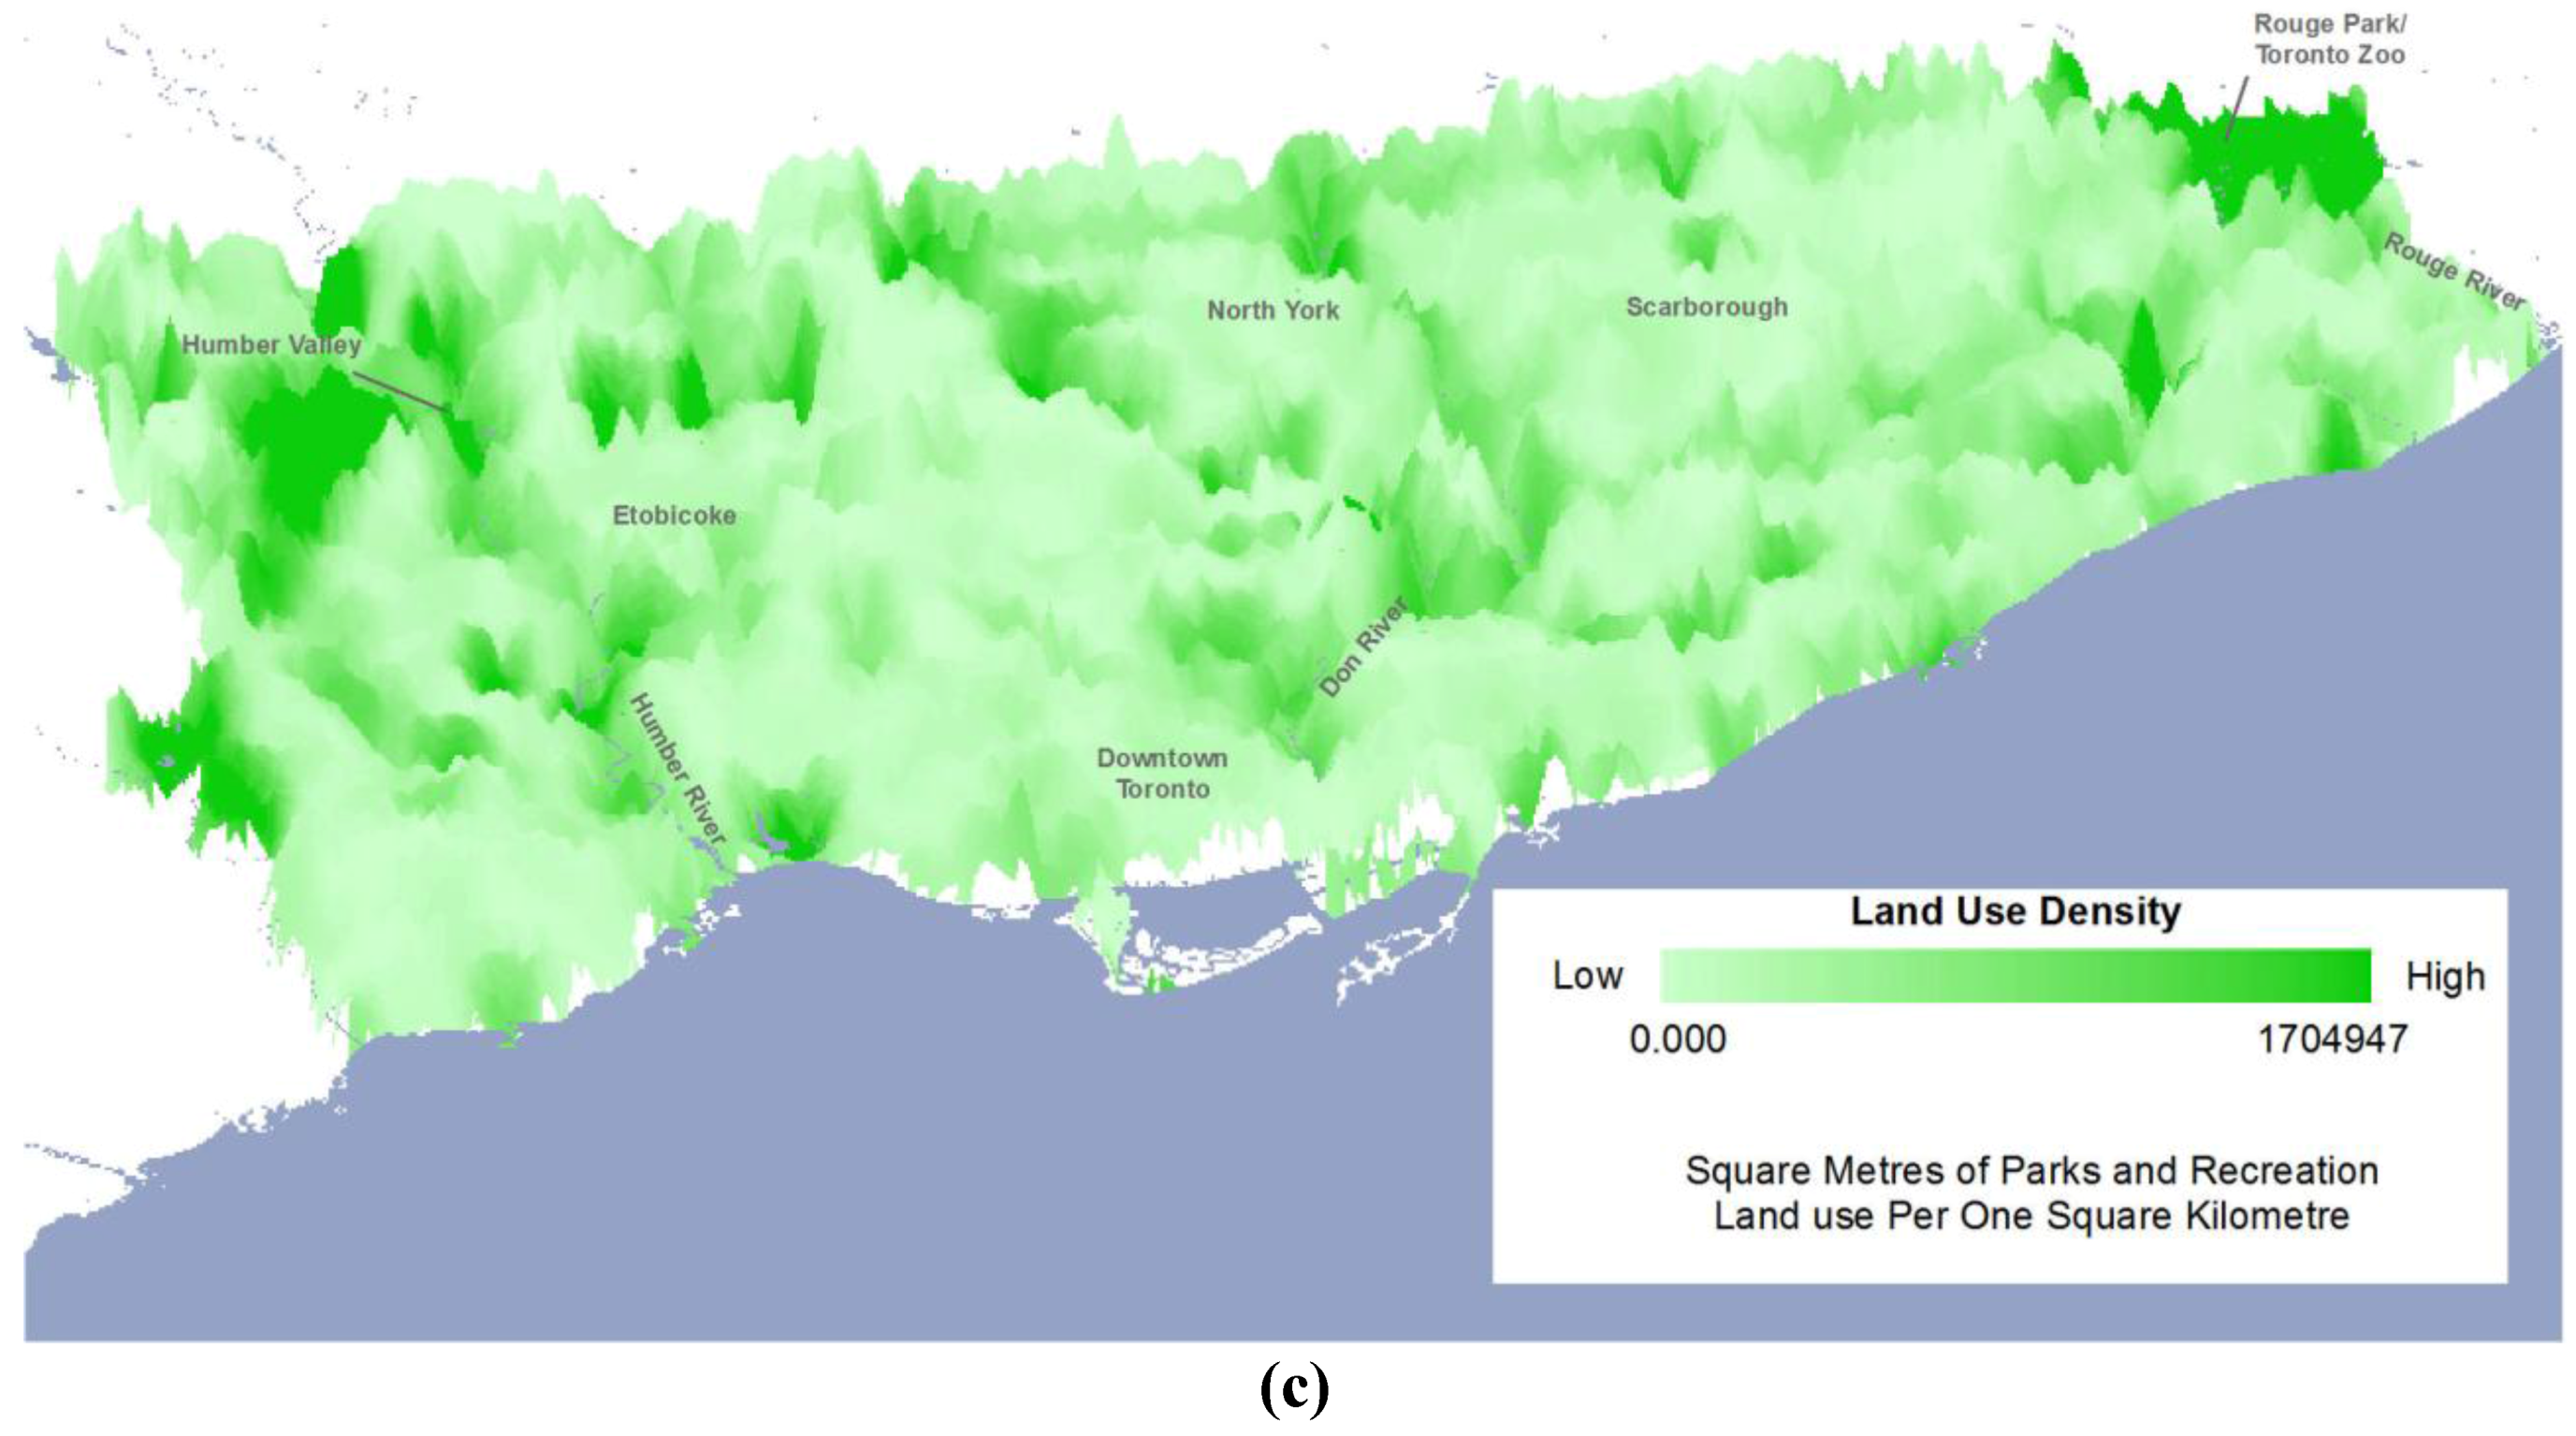
The distribution of commercial land use density shows characteristic peaks in the northwest (Etobicoke), in downtown Toronto, and in the east (Scarborough). Resource/industrial land use clusters appear in north and south Etobicoke, northwest North York, and northeast Scarborough. Clusters of open areas were noted along highway 427 in the west of the City, and around highway 401 in the north. Clusters for government/institutional land use appear in the downtown core, northwest North York, Etobicoke, and east Scarborough. Parks and recreation land use clusters were noted in north Etobicoke and northeast Scarborough. Residential land use density is spread across south Etobicoke, downtown Toronto, North York, and Scarborough. Concentrations of water bodies were noted at the mouth of the Humber River (west), Don River (centre-east), and Rouge River (east).
The correlation analysis revealed a moderately positive relationship between surface temperature and resource/industrial land use density (r = 0.423), suggesting that greater resource/industrial density tends to be associated with higher temperatures. The relationships for commercial (r = 0.173) and open area (r = 0.130) land use densities were weakly positive. On the other hand, there were moderately negative relationships for parks/recreation (r = −0.442) and water bodies (r = −0.297), which means that as their density increased, surface temperatures tended to be cooler. The correlations for government/institutional (r = 0.053) and residential (r = 0.018) land use densities were near zero. Scatter plots of land use density and surface temperature provide an alternative perspective on the same findings. All correlation coefficients were significant at the 0.01 level.
4.4. Three-Dimensional Visualization
Figure 4 shows examples of three land use density surfaces overlaid on a three-dimensional temperature map. High densities of resource/industrial land use frequently coincide with peaks of high temperature (
Figure 4(a)). These clusters are found in north and south Etobicoke, northwest North York, the Toronto Harbour area in the south-centre of Toronto, and in a band from east Toronto to northeast Scarborough. In contrast, residential land use density does not systematically coincide with higher or lower temperatures upon visual inspection (
Figure 4(b)). Finally, high densities of parks/recreation tend to co-locate with temperature “valleys” in Toronto’s ravines and green spaces (e.g., Humber Valley Golf Course, Rouge Park/Toronto Zoo; Humber, Don, and Rouge rivers (
Figure 4(c)).
4.5. Neighborhood-Level Illustrations
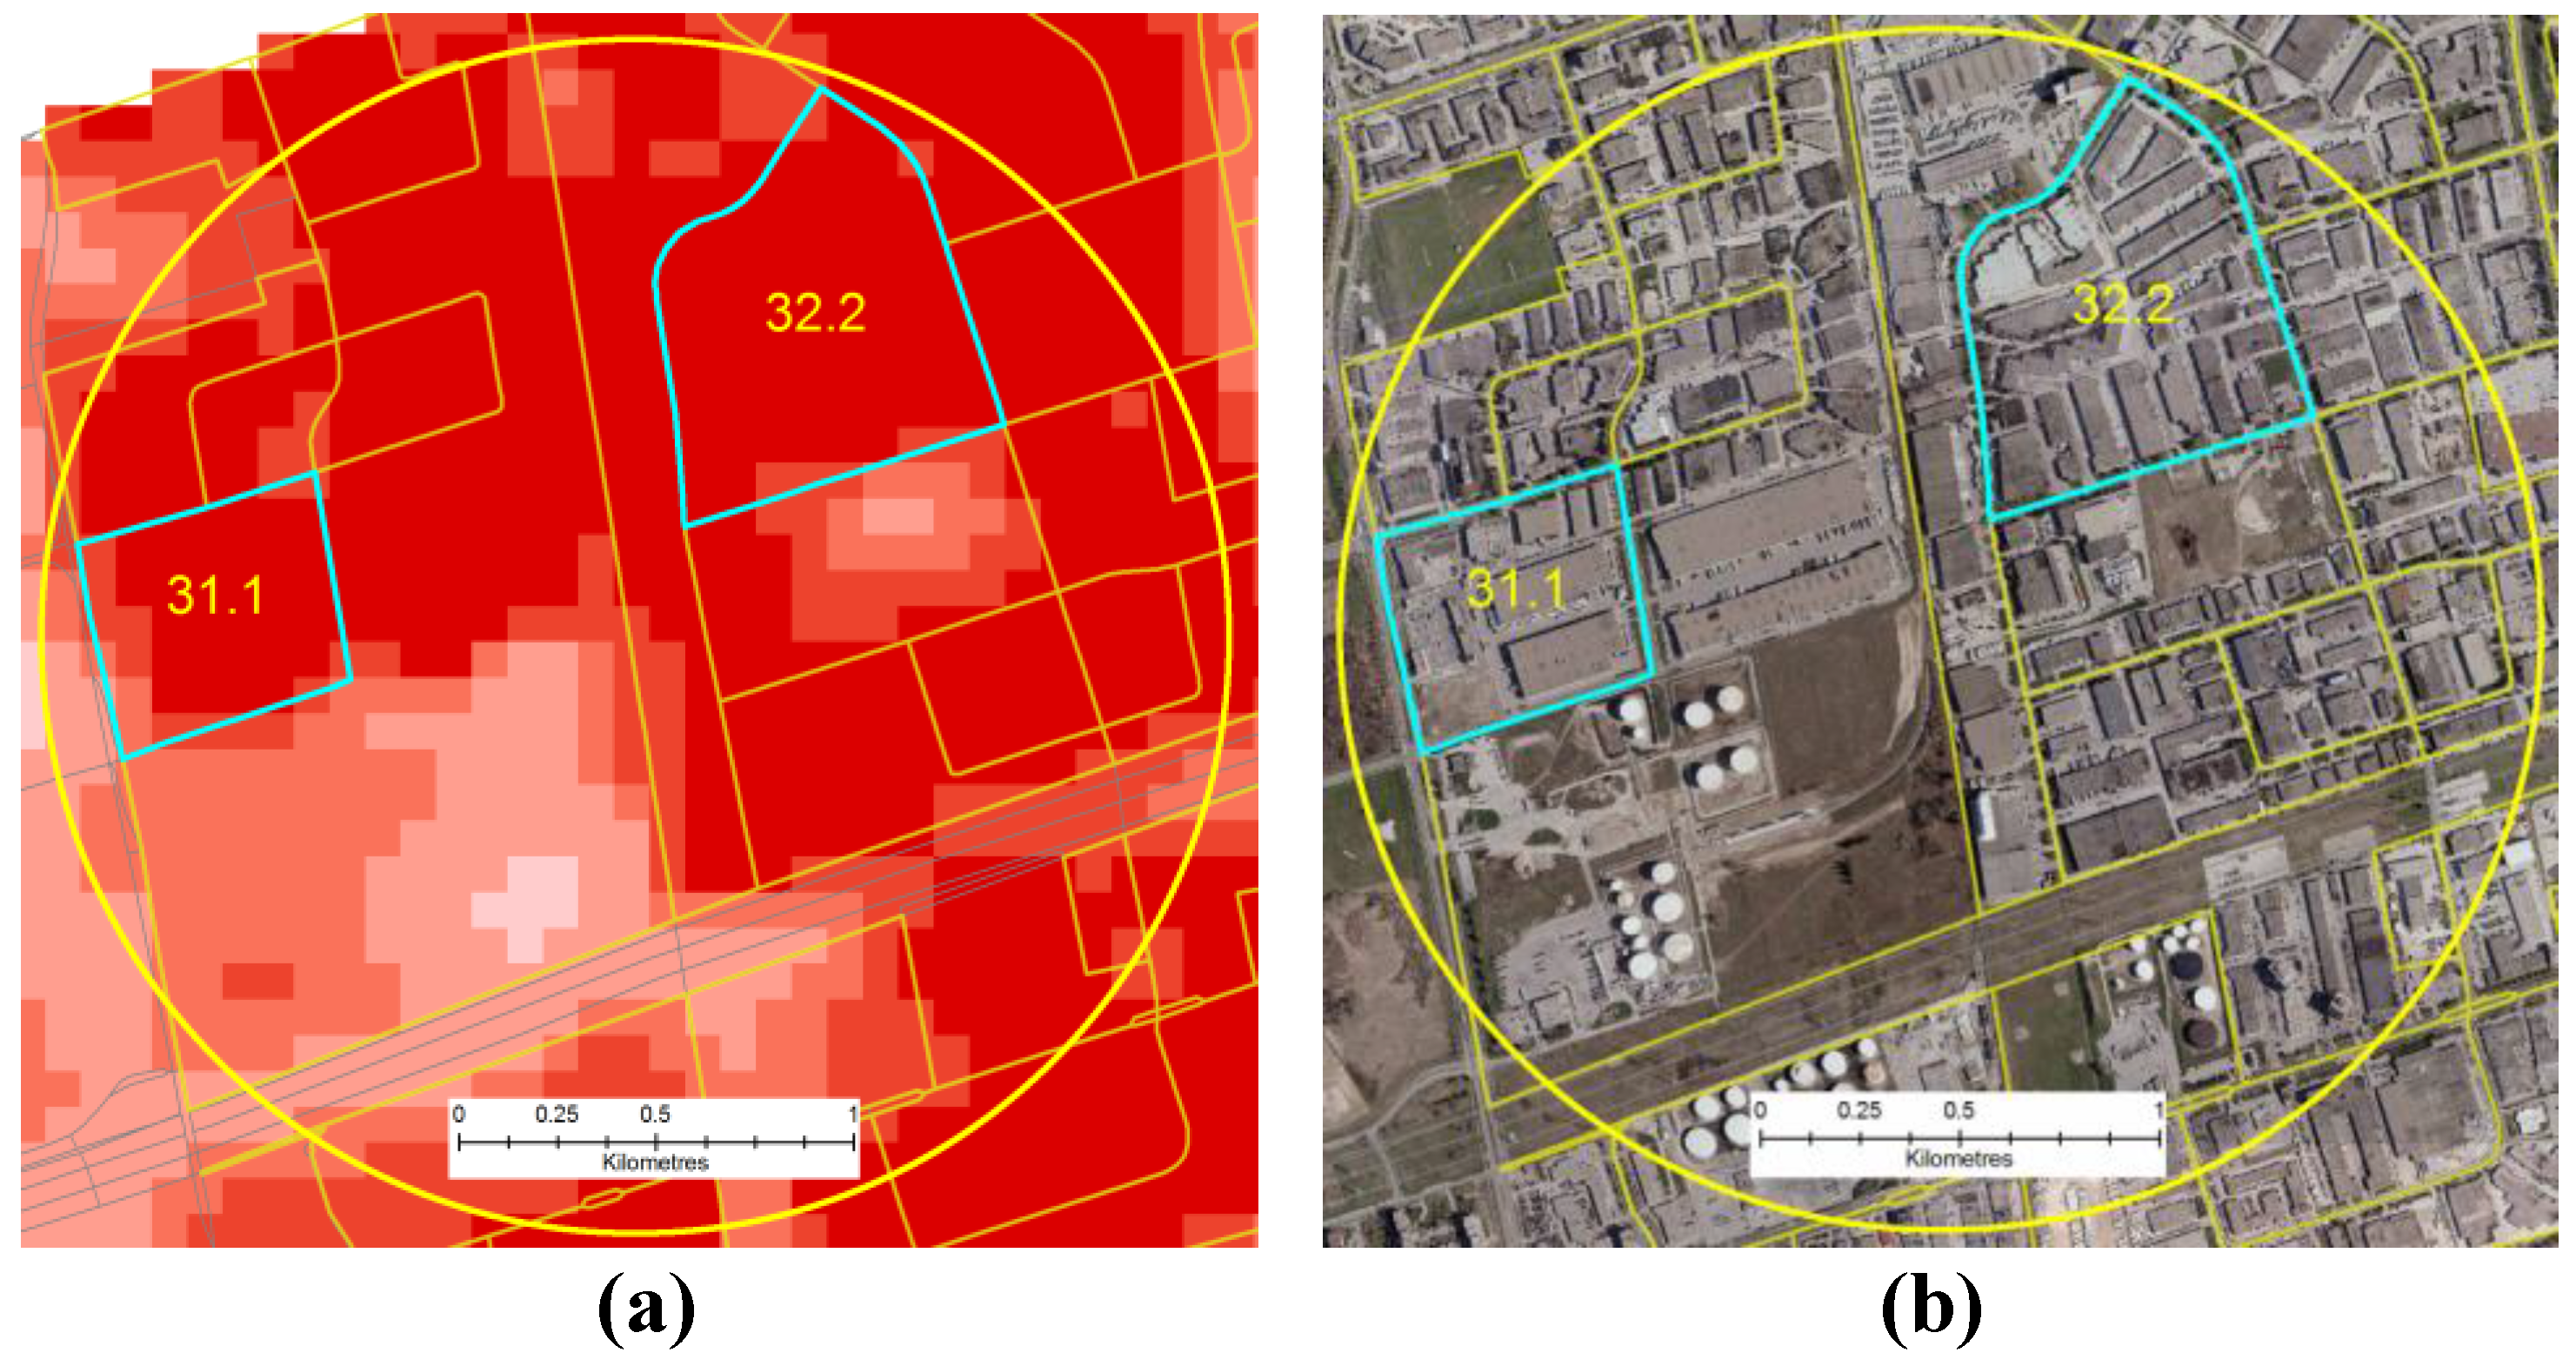
To demonstrate one of the factors influencing surface temperature between and within land use types, examples of resource/industrial and parks/recreational land use were selected. Two resource/industrial land use polygons of different sizes are highlighted with a blue outline in
Figure 5(a). The smaller polygon has a mean surface temperature of 31.1 °C, whereas the larger polygon has a temperature of 32.2 °C. This illustrates the positive correlation between polygon size and temperatures for resource/industrial land use found in the above analysis.
Figure 5(b) provides an extract from an aerial photograph, which allows for further interpretation of the local conditions that contribute to high surface temperatures.
Figure 4.
Land use densities overlaid on a three-dimensional temperature surface. (a) Resource and industrial; (b) residential; (c) parks and recreational land uses.
Figure 4.
Land use densities overlaid on a three-dimensional temperature surface. (a) Resource and industrial; (b) residential; (c) parks and recreational land uses.
Figure 5.
Neighborhood-level perspective on resource/industrial land use showing increase in mean surface temperature as polygon size increases. (a) Resource/industrial polygons overlaid on surface temperature; (b) orthophoto for reference.
Figure 5.
Neighborhood-level perspective on resource/industrial land use showing increase in mean surface temperature as polygon size increases. (a) Resource/industrial polygons overlaid on surface temperature; (b) orthophoto for reference.
To illustrate the opposite effect of polygon area for parks/recreational land use, three differently sized City parks are highlighted in
Figure 6. The mean temperature in a large polygon in High Park is 21.5 °C, whereas the mean temperature in the smaller Rennie Park is higher with 23.8 °C. In addition, the mean temperature in Lithuania Park located in a residential neighborhood north of High Park is 25.2 °C, as shown in
Figure 6(a). An orthophoto for reference is provided in
Figure 6(b). Although larger park polygons tended to have lower temperatures across the study area, it should be noted that micro-climatic effects may also be at play, such as the proximity to Grenadier Pond (shown in the orthophoto) or Lake Ontario to the south of the parks.
Figure 6.
Neighborhood-level perspective on parks/recreation land use showing decrease in mean surface temperature as polygon size increases. (a) Parks/recreation polygons overlaid on surface temperature; (b) orthophoto for reference.
Figure 6.
Neighborhood-level perspective on parks/recreation land use showing decrease in mean surface temperature as polygon size increases. (a) Parks/recreation polygons overlaid on surface temperature; (b) orthophoto for reference.
5. Discussion and Conclusion
5.1. Interpretation of Results
Our analysis of the relationship between land use and surface temperature revealed several important, though not unexpected findings. To some extent, this study confirms the urban heat island (UHI) effect. However, the UHI is usually observed between urban and rural land uses. Fewer studies have examined the intra-urban patterns of the UHI.
We confirmed that average temperatures are significantly higher for commercial and resource/industrial land uses, and lower for parks and recreational land uses as well as water bodies. Higher temperatures are primarily due to the fact that commercial and industrial areas are characterized by a high proportion of built-up surface. The buildings often have flat concrete or metallic roofs, and/or darker color roofs (red/brown) as were seen on aerial photos. Concrete surfaces are reported to have low albedo from 0.1 to 0.35 [
34], low emissivity, and high heat capacity. Also, these areas lack vegetation that could offset hot surface temperatures. In contrast, the vegetation in parks, particularly their trees, acts as a buffer between the ground and solar heat radiation, which helps to reduce the surface temperature [
1]. The tree canopy also intercepts solar heat, absorbs it, and hence provides cooler temperature to the surface underneath it [
18].
The similarity in high temperatures of commercial and resource/industrial land uses can be explained by similar surface characteristics relating to their built environment. The same effect can be observed for the mid-range temperatures of government/institutional and residential land uses. For example, both of these land uses typically have vegetation such as lawns or trees occurring around built structures.
We could also demonstrate that the homogeneity of several land uses exacerbates temperature extremes. Surface temperature tends to increase with the size of commercial and resource/industrial land use polygons. It decreases with the size of parks/recreation and water body polygons. The calculation of land use density allowed us to study this relationship beyond land use polygon boundaries. The correlation of land use density and surface temperature confirmed the results of the polygon-based analysis. However, commercial land use is not as strongly positively correlated with temperature as it is in the polygon model. An explanation might be that commercial areas tend to be smaller than resource/industrial areas, and therefore closer to other land uses, which reduces commercial land use density.
The findings of this study have implications for urban planning and public health agencies. Policies involving the use of high albedo materials could be formulated and implemented with reference to specific land uses, such as commercial and resource/industrial. Currently, only a small number of Canadian communities have taken measurable steps for such mitigation strategies [
18]. For example, decision-makers in city planning could introduce zoning by-laws or building codes that require new industrial or commercial development to include green spaces and green or high-albedo roofing. Tax incentives or direct subsidies could also prompt industrial and commercial property owners to take steps towards heat mitigation. In fact, the City of Toronto passed a bylaw in May 2009 that requires the construction of green roofs on 20% to 60% of available roof space on all new buildings with a gross floor area of 2,000 m
2 or more [
35]. Our study confirms that the inclusion of commercial and industrial developments in this bylaw was necessary. The City also supports tree planting programs for residential front- and backyards and requires a permit for damaging or destroying existing trees on private property [
36]. Again, our study confirms the City’s goal of increasing the urban tree canopy will benefit heat mitigation, including in residential areas, although the partial coincidence of residential land use and hot surface temperatures indicates that tree planting should be targeted at “hot” neighborhoods.
5.2. Limitations and Outlook
The conclusions of this study are based on several assumptions. Thermal remote sensing imagery has high spatial resolution and is relatively inexpensive to acquire and process. However, as discussed in the background section, thermal sensors measure surface temperature, which cannot fully represent human exposure to heat through outdoor or indoor air temperature. In addition, the thermal image acquisition is constrained to the time of day, at which the Landsat satellite crosses the Toronto area, i.e., 10:00 am. Therefore, the formation of the UHI throughout the day and its persistence over night, when it triggers human health concerns, cannot be captured and surface temperatures and their consequences may be under-estimated. Similarly, the image capture at 10:00 am also means that solar radiation may not reach the ground in areas with high-rise buildings and thus vertical shading may contribute to further under-estimation of surface temperature in the thermal image.
Another set of limitations is linked to the land use dataset, which is no more than an approximation of actual land cover. The distinction of only seven land use types may affect the accuracy of our conclusions. Another simplification occurred in the calculation of land use densities, when land use polygons were reduced to their centroids to contribute to the density surface.
Finally, surface temperature and land use could only be considered for one point in time, so that their long-term relationship could not be assessed. In addition, micro-climatic conditions could not be taken into account in the comparison of temperature and land use patterns.
Future work can address these limitations in different ways. The present analysis could be replicated for other points in time and for other urban areas. For example, a spatio-temporal analysis for Toronto could attempt to associate local temperature changes with local land use changes over time. In addition, land cover data could be used instead of land use data to more accurately represent the built environment. In situ temperature measurement would further enhance the representation of the intra-urban heat island effect. It would also be desirable to obtain temperature data for actual heat alert days instead of hot, yet randomly selected summer days. Finally, the joint effects of neighboring land uses should be considered when developing mitigation strategies.
In conclusion, and with the above limitations in mind, our analysis demonstrates clear, statistically significant differences in heat exposure from different land use types. These will have a spatially variable effect on the health of people living or working in hotter areas. In collaboration with public health agencies and other City departments, municipal planners should review existing land use development and control policies in order to develop heat mitigation strategies.


