1. Introduction
Rapidly growing mega-urban regions, such as the Pearl River Delta (PRD), South China, provide new and additional challenges for scientific fields such as remote sensing and environmental planning. The demand for available land for urban use will increase considering the projected population growth, economic development and increasing urbanization [
1]. For informed decision making regarding future development, it is necessary to analyze and understand past and current developments. Since the Chinese Reform Programme at the end of the 1970s, the region of the PRD experienced constant growth [
2,
3]. Urban expansion went along with economic expansion, which led to the conversion of approximately 4% of the total cropland and 6.5% of the total forest cover in China between 1979–81 and 1989–91 [
3]. Urban structures have been changing constantly since 1995. Former village structures were transformed and remain visible only in very specific remnants (e.g., cores of old villages). The increasing conversion of traditional farmland to urban built-up areas has tripled between 1988 and 2002 [
4]. Simultaneously, new urban structures such as
migrant housing areas have appeared quickly and now dominate these former rural regions. Pauleit & Duhme [
5] assessed the different types of structures in the urban environment and noted their manifold properties for the urban environment. The urban structure type
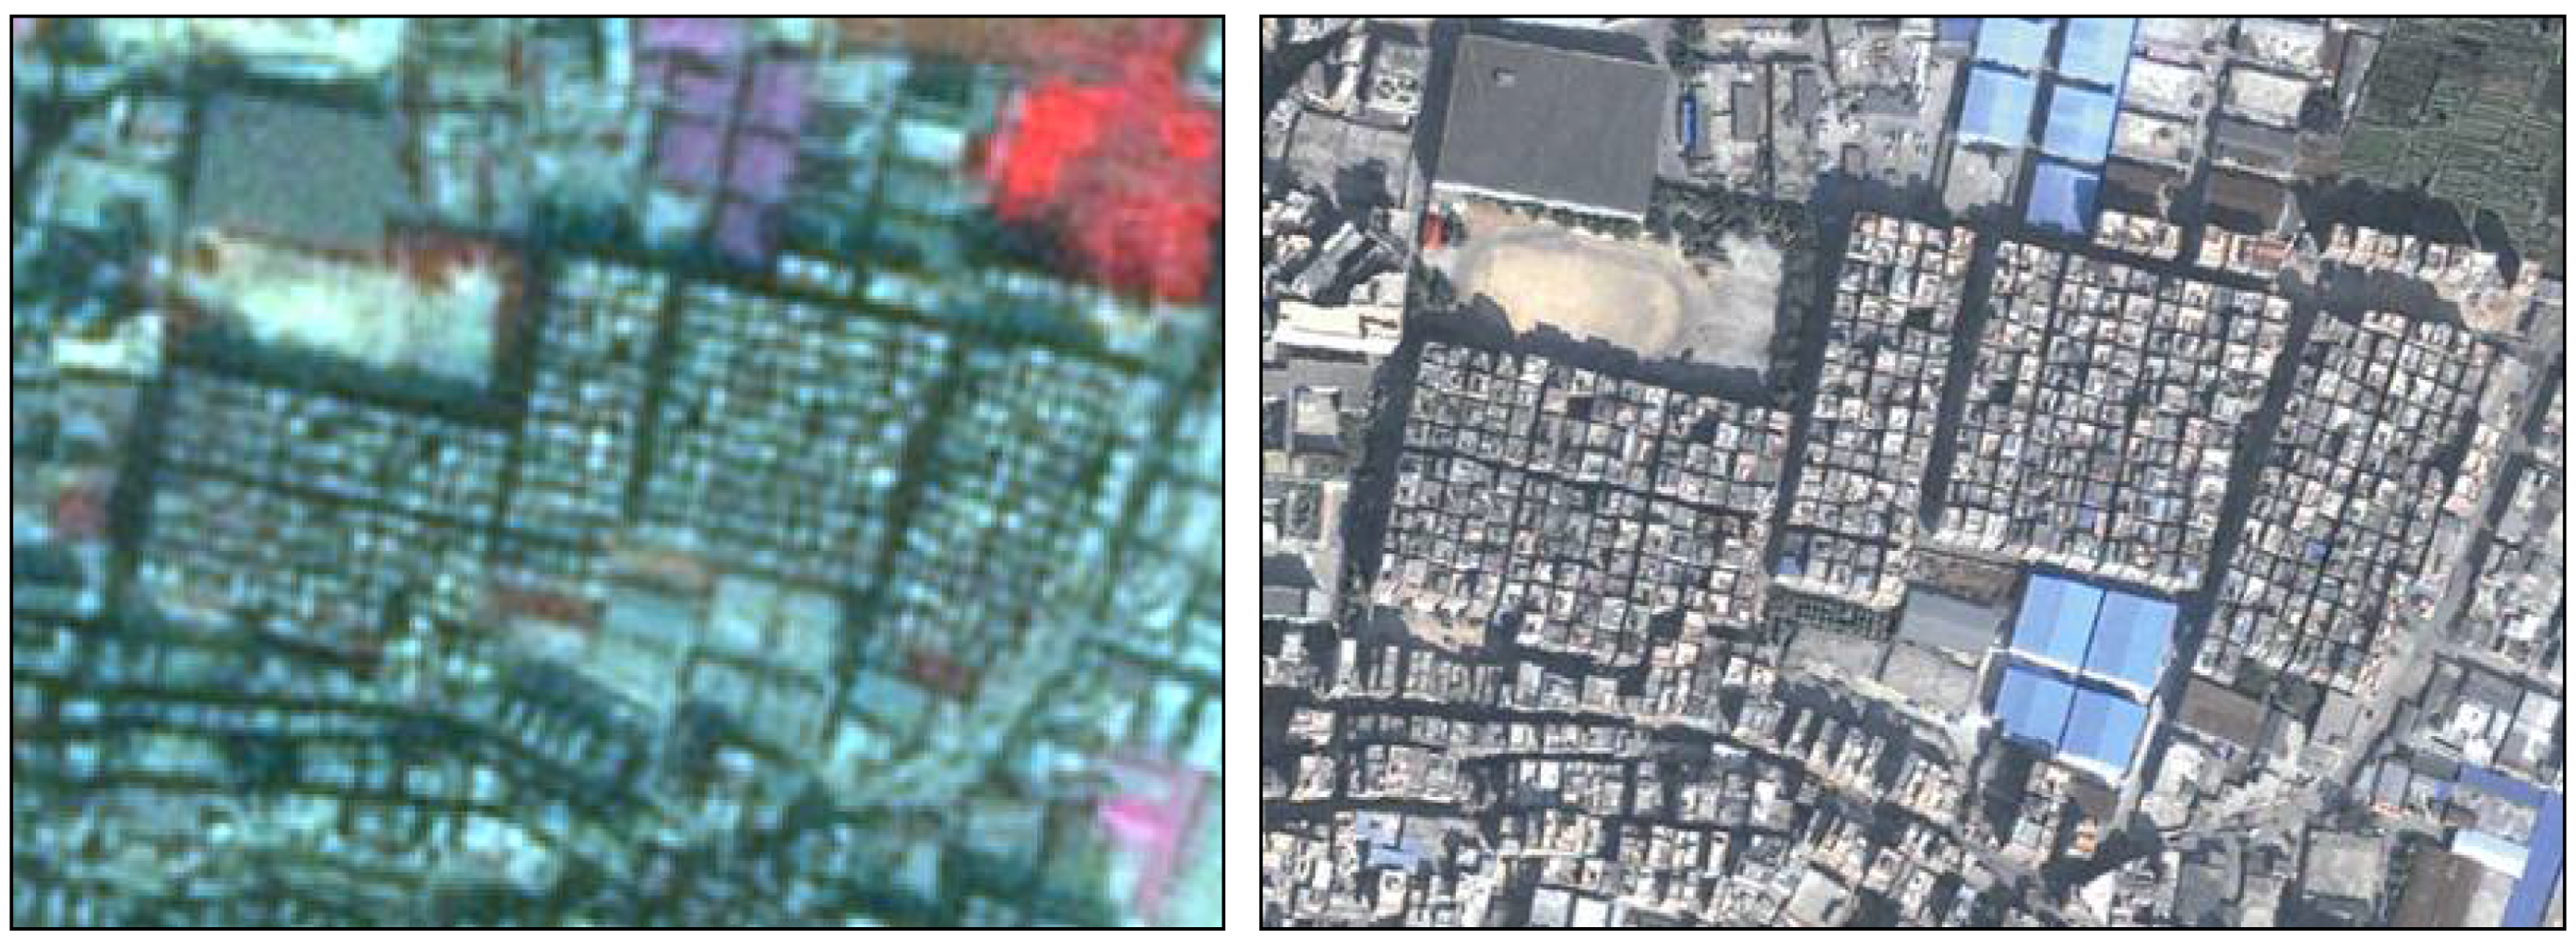
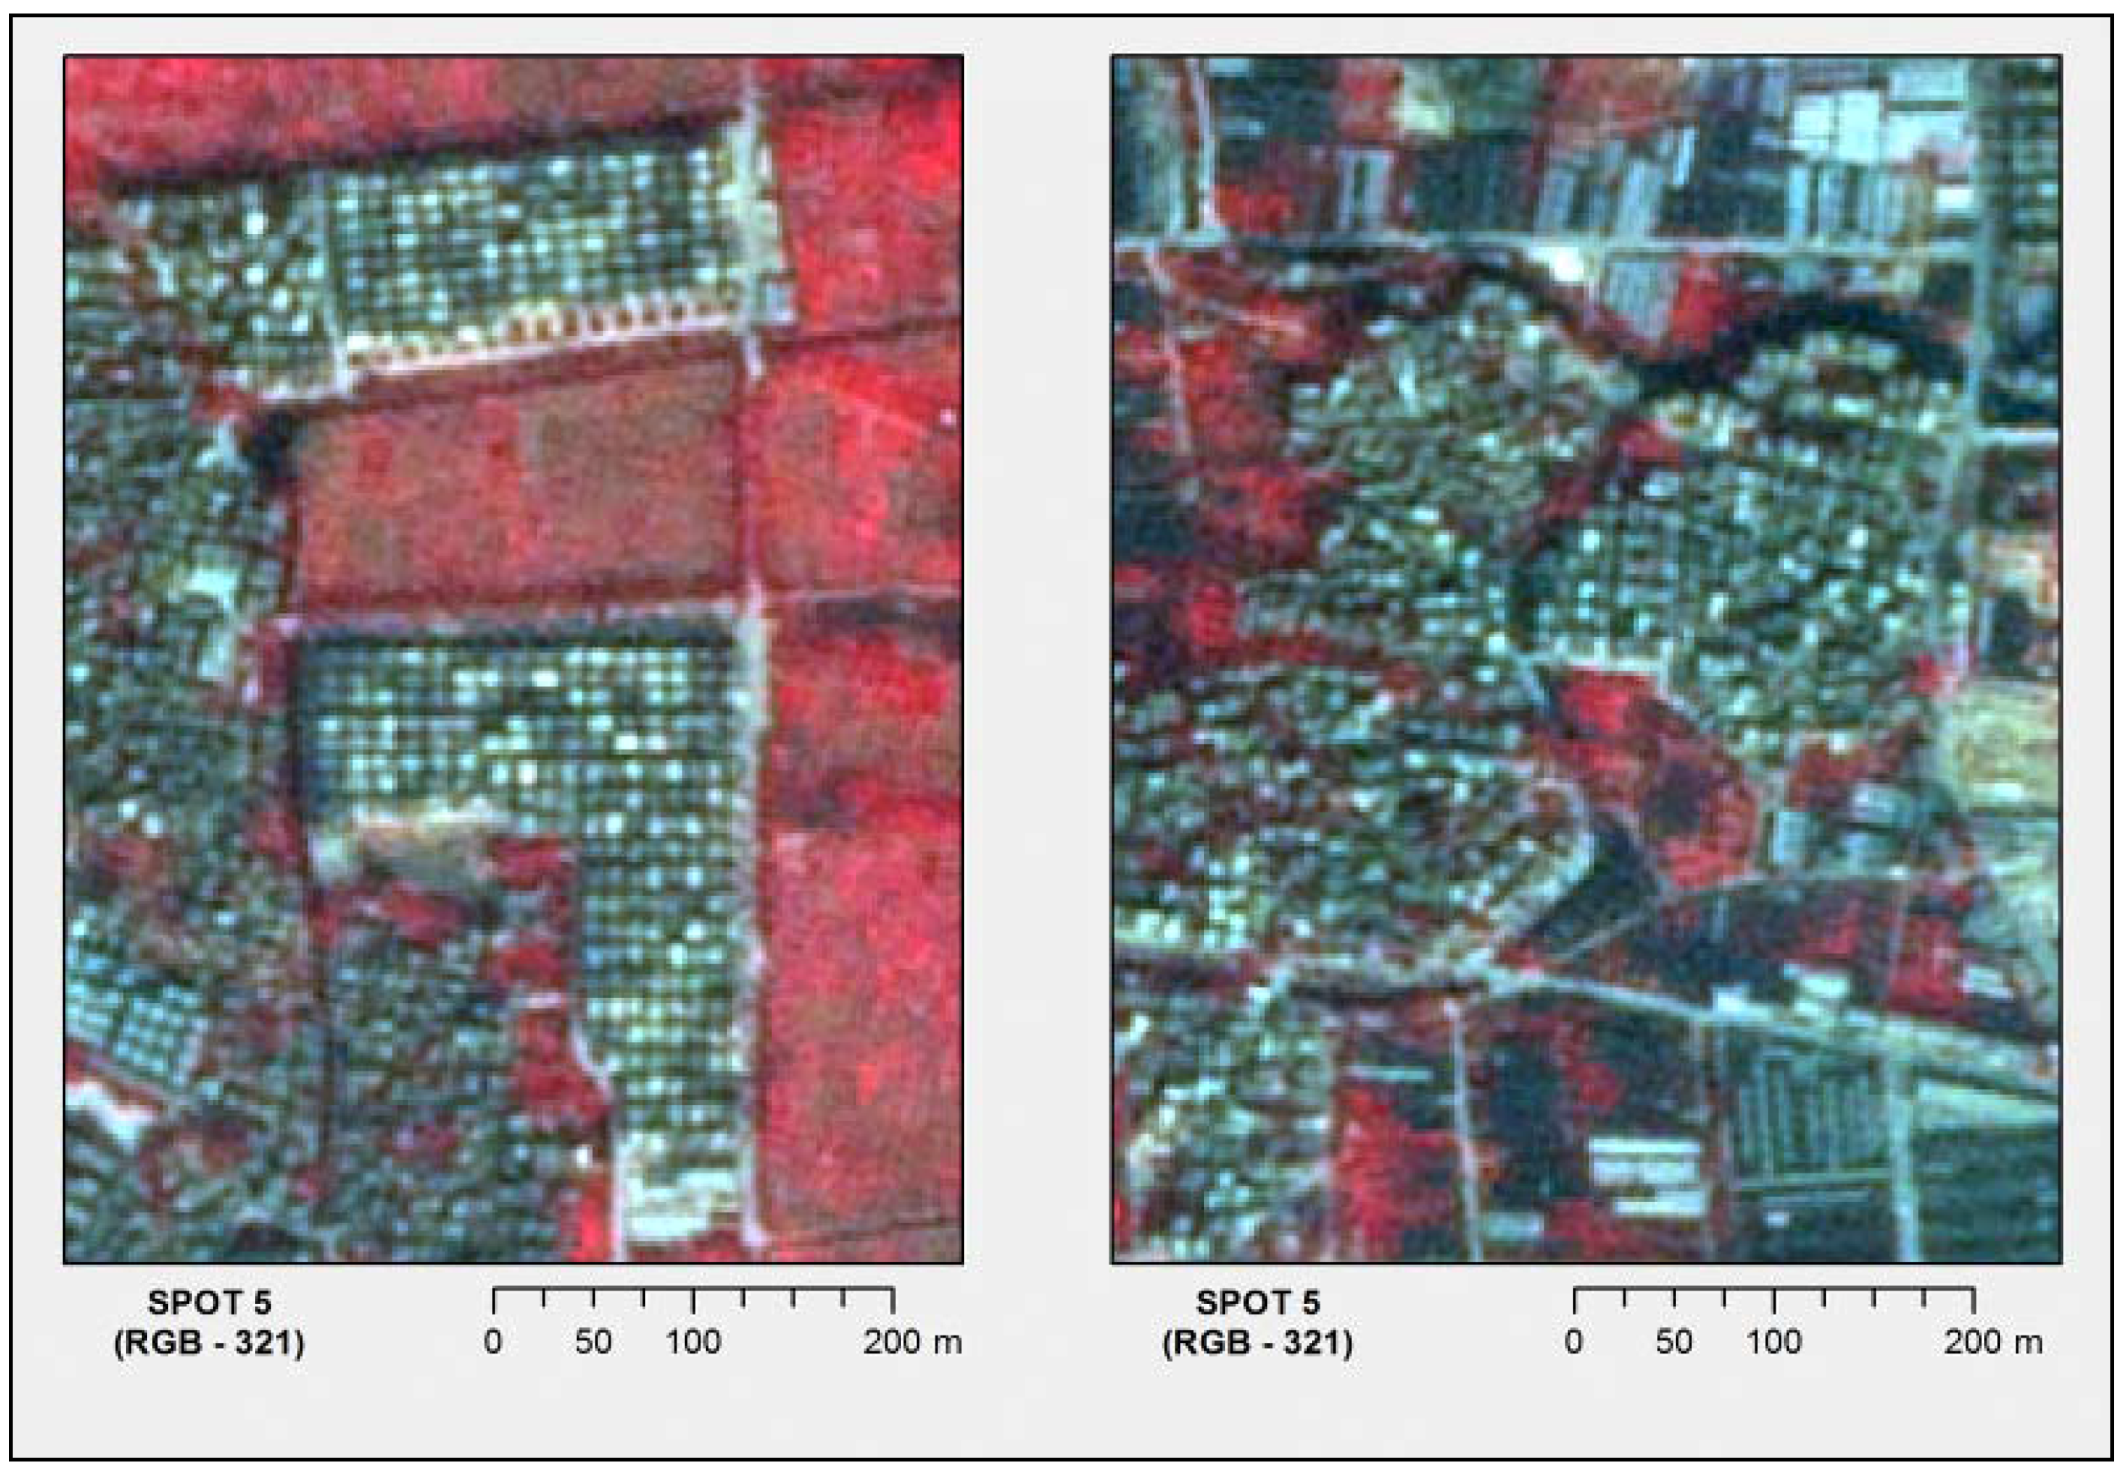
migrant housing is described as houses with a square base of approximately 12 × 12 m. The distance between houses differs from less than 1 m up to 3 m. This density results from the allotments’ shape, which was formerly allocated to every single inhabitant to practice subsistence economy. Today, owners build houses for rent to an allotment’s limit. They even ignore legal restrictions on building height to increase income from received rent. People living in these houses are primarily migrant workers, after whom this urban structure type is named.
These developments in the urban sector primarily take place in agricultural areas, leading to a significant loss of cropland [
2,
3,
4,
6]. Existing cities have grown while new urban structure types are built in areas without direct connection to existing city areas. A primary reason for these changes in land cover and land use (LC/LU) is ongoing urban sprawl.
Because of these rapid changes, the need for the latest information about the impacts of these processes (
i.e., growth of settlement areas) is evident. The lack of available spatial data requires large-scale mapping approaches. The focus of this paper is to separate the
migrant housing urban structure type from other urban areas because it presents an indicator of dynamic processes (see
Figure 1). The spatial development of this housing type, analyzed over several years, will illustrate both spatial growth and economic development because these
migrant housing areas are mainly inhabited by migrants.
Figure 1.
Migrant housing complex at two different resolutions (Left SPOT5–RGB 321/Right QUICKBIRD2–RGB 123). Buildings have a square base and a homogeneous orthogonal alignment.
Figure 1.
Migrant housing complex at two different resolutions (Left SPOT5–RGB 321/Right QUICKBIRD2–RGB 123). Buildings have a square base and a homogeneous orthogonal alignment.
Several remote sensing studies have been conducted in the PRD to detect and monitor changes in LC and LU during the last 15 years. In most cases, medium resolution satellite data such as LANDSAT together with pixel-based methods have been used to differentiate between coarse classes for the whole region [
2,
3,
7,
8,
9]. Other areas in East Asia experiencing similar changes have also been analyzed [
10,
11,
12,
13].
Describing the changes in land cover (LC) provides information about large areas that can be used to answer different research questions. Numerous examples can be found in the literature. The impact of urbanization on hydrologic processes was analyzed by Jacquin
et al. [
1], who investigated a river catchment area in the Midi-Pyrenees region (southwest France) using SPOT5. A study monitoring urban expansion in China using LANDSAT TM data achieving an accuracy of more than 90% was published by Seto
et al. [
3]. The combination of socioeconomic classes and land cover data for the city of Lima, Peru, by Avelar
et al. [
14] is an example of how to generate laminar information from qualitative data using image classification and grid-based modelling. Rogan & Chen [
15] offer a good overview of the different sensors and aspects of using remote sensing for mapping and monitoring land cover and land use (LC/LU) changes. In summary, all of these articles analyze questions regarding different LCs, but none of them differentiate urban areas on a detailed level. Because urban remote sensing concerns a very detailed and heterogeneous environment that offers numerous challenges [
16,
17], the combination of methods and the addition of external data become increasingly common in the attempts to derive more accurate results, as shown by Zhang [
18], Berberoglu
et al. [
19] and Banzhaf & Höfer [
20].
Urban areas are characterized by a high spatial and spectral diversity of surface materials. The interplay of the complex effects of 3-dimensional building structures and reflectance constitutes a special challenge to analysis and methodology [
21]. Detecting single objects in the inner city area, such as single roofs or several types of urban structures, is a challenging task. Urban targets often appear similar in the visible wavelengths. At least two main characteristics must be considered: spectral and spatial. Explorations of the physical characterization of urban reflectance properties using spectral mixture analysis deliver information about the variety of LC in heterogeneous urban areas [
22]. Attempting a classification of buildings using conventional multispectral classification methods neglects spatial information such as shape, area and neighbourhood relations. A combination of different methods (image classification, texture analysis and object-oriented image analysis) is necessary for the task of detecting and monitoring urban structure types [
18,
23,
24]. The exact definition of objects for classification must be considered the primary challenge in urban remote sensing.
The analysis of urban areas with LANDSAT data soon met limits due to detailed intra-urban heterogeneity, which can hardly be captured at this level of spatial resolution. More recent approaches use satellite data with higher spatial resolution, such as SPOT, IKONOS and QUICKBIRD [
18,
25,
26]. Satellite systems producing images with moderate spatial resolution (MSR) or high spatial resolution (HSR) considerably improve classification possibilities [
27]. However, one pixel often contains different kinds of LC/LUs, and therefore, the question of mixed pixels remains. In this case, the analysis of sub-pixels may be used [
23], but it will not be employed in this article. A first attempt can be made by reducing the number of different LU classes at the beginning of the classification process, e.g., by masking out non-urban areas using impervious indexes computed from ratio channels [
27]. Nevertheless, using object-based classification methods may improve classification results, as explained below.
Object-based classification approaches comprise, among other features, the addition of information such as shape, size, context and spectral properties into the classification process. Therefore, the classification results have a much higher accuracy than those collected without this information [
28,
29,
30,
31,
32]. Implementing additional information into the classification process leads to further improvements [
33]. To increase classification accuracy in urban areas, information such as height (DEM), cadastral information and demographic data are used if available [
31,
32,
34].
In this study, the most dynamic development of the new emerging urban structures in the PRD—so-called migrant housing—is investigated. The analysis is performed with a SPOT5 image and additional knowledge gained from LANDSAT5 and QUICKBIRD2 imagery. The study aims to detect and locate migrant housing by spectral and spatial information and to gain knowledge about the spatial context and neighborhood relations of objects. The aim is not an area-wide classification of the whole PRD, but a selective classification of the urban structure type migrant housing.
2. Study Area and Data
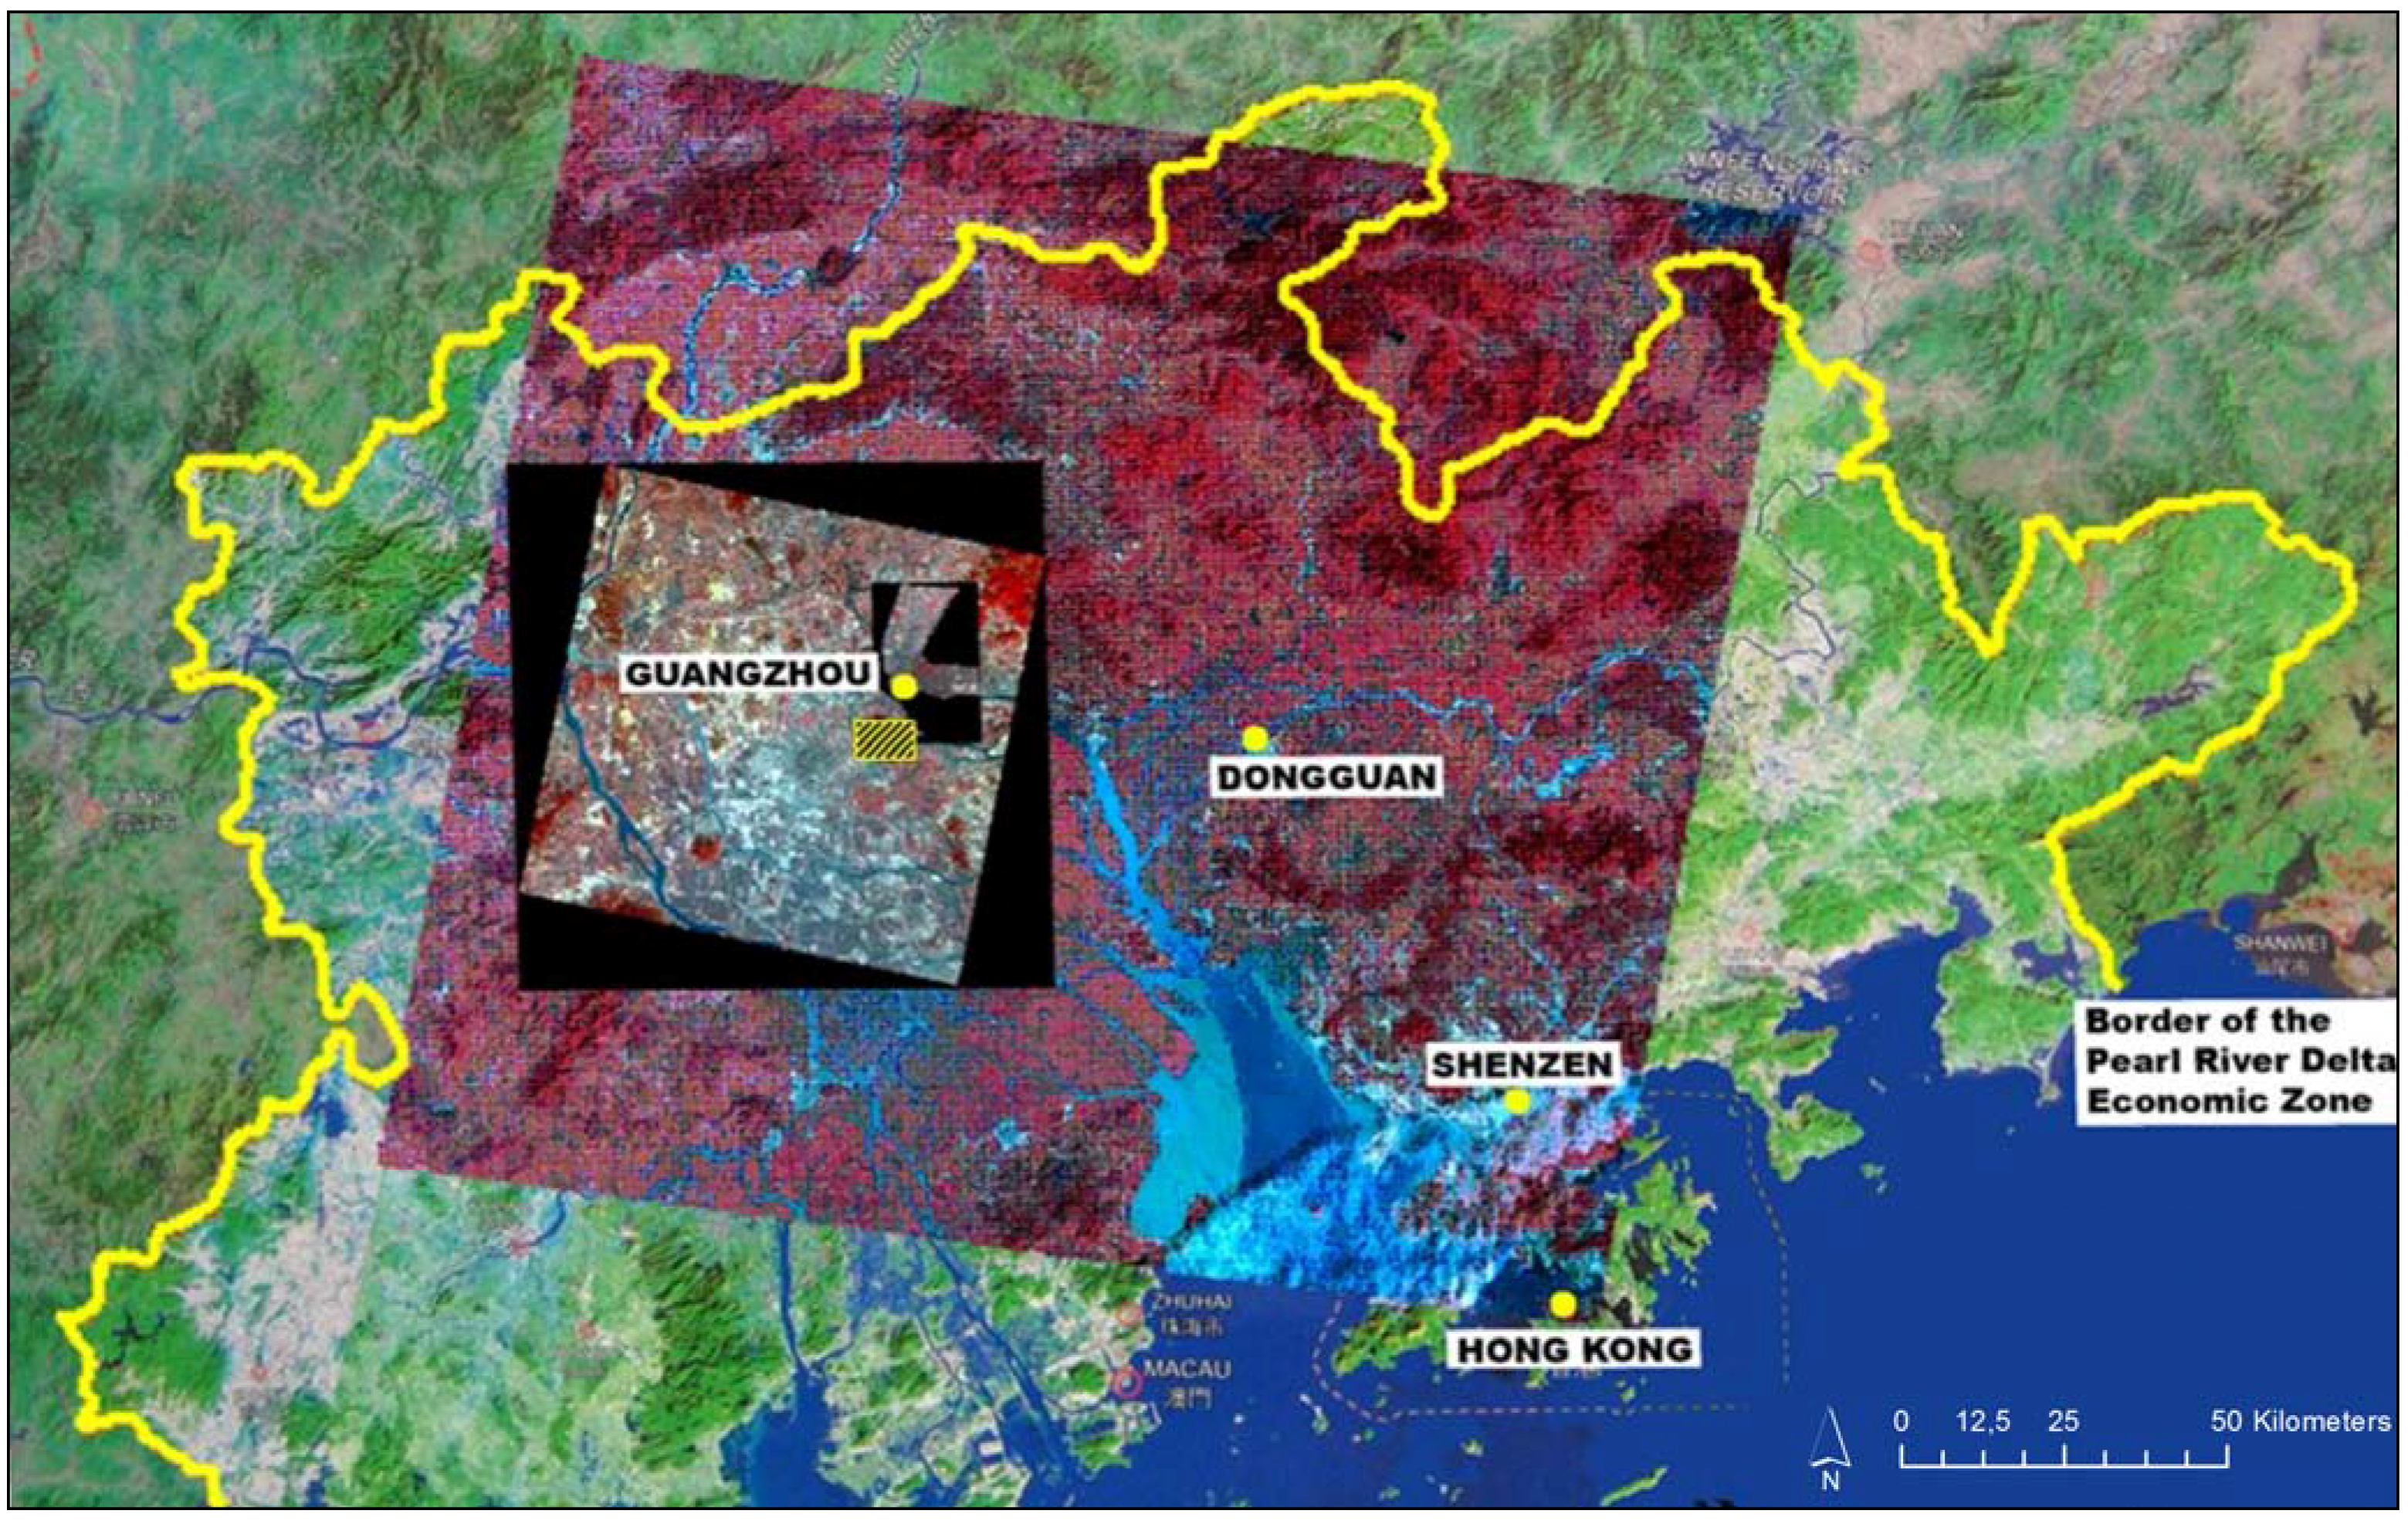
The study area is located in South China, around the city of Guangzhou (23°7′39″N, 113°14′50″E). The PRD, with an area of almost 55,000 km
2, is located in the northwest of Hong Kong and is the third largest river delta in China, with the densest concentration of economic activity in South China (see
Figure 2). The PRD is still regarded as a model for Chinese regional development. The enormous growth began in the city of Shenzhen, located near Hong Kong, and soon spread northwest into the surrounding area and further into the country. Due to the fertile soils in the area, large portions of the landscape had formerly been used for intensive agriculture (e.g., rice fields, fish farming and vegetables).
Satellite data with different properties were selected. A LANDSAT TM scene (date of acquisition: 1990/10/13; cloud cover: 0 %; Scene-ID: ETP122R44_5T19901013) describes the LC at the beginning of the urban growth. A SPOT5 scene (date of acquisition: 2005/01/06; cloud cover: 0 %; Scene-ID: 52833040501060316441J; geo-referencing processed by SPOTIMAGE) with panchromatic very high-resolution (2.5 m × 2.5 m) and multispectral high-resolution data (10 m × 10 m) was used as a source for up-to-date LC and LU classification. The processing was performed on a subset of the SPOT5 scene. The subset has an extent of 2,620 × 1,920 pixels (31.44 km
2) with a spatial resolution of 2.5 m × 2.5 m (pan-sharpened), as shown in
Figure 2.
The chosen subset is representative of the mega-urban area of the PRD. This subset contains all urban structure types, such as migrant housing, industrial estates and old village cores, as well as different types of LC/LU, such as vegetation, water, bare soil (often areas in transition, prepared for buildings) and several types of sealed surfaces (e.g., roads and parking lots). This composition of the subset made it a reasonable choice as a representative area for analysis.
For spatial feature extraction purposes, pan-sharpened data were generated from the original images by means of a data-fusion technique [
35,
36]. In addition, QUICKBIRD2 data (date of acquisition: 2006/01/27) were used for reference, especially for information regarding specific features to describe
migrant housing complexes by means of visual interpretation techniques.
The main traffic network was manually delineated in a pan-sharpened SPOT5 scene. Because of legal restrictions, extensive fieldwork had to be reduced to a minimum, and ground truthing was not possible. For any data-processing steps, software solutions from ERDAS IMAGINE (Version 9.3.1) and eCognition (Versions 7 and 8, each 32-bit) were used.
Figure 2.
Study area and satellite data coverage of the Pearl River Delta (PRD), China. The outer limit of the ‘Pearl River Delta Economic Zone’ is indicated by the yellow line. The data coverage consists of the following satellite images (large to small): LANDSAT TM (RGB 432), SPOT5 (RGB 321) and QUICKBIRD2 (RGB 432). The main cities are highlighted with yellow dots. The analyzed area within the classification is located southwest of Guangzhou (rectangle with yellow/black pattern).
3. Methodology
The mapping of selected urban structure types requires a classification concept that allows a detailed analysis of manifold relevant attributes in a local context and for larger regions. In some cases, structures and objects with very small areas need to be analyzed to enable differentiation between urban structure types. For classification processing, a representative subset of the SPOT5 scene has been created (see
Section 2), which is the basis for the efficient use of object-based classification methods.
Pre-classifications of LC (
water,
vegetation,
sealed surface,
bare soil) using a pixel-based approach determine the reduction of the analysis area. For the extraction of urban structure types, pixel-based approaches alone are inadequate. In addition to spectral information, urban objects also exhibit aspects of texture and shape [
17,
19]. Neighbourhood relationships must be defined to improve the classification. Therefore, a top-down object-based analysis approach was carried out for the stepwise assignment of urban structure types as
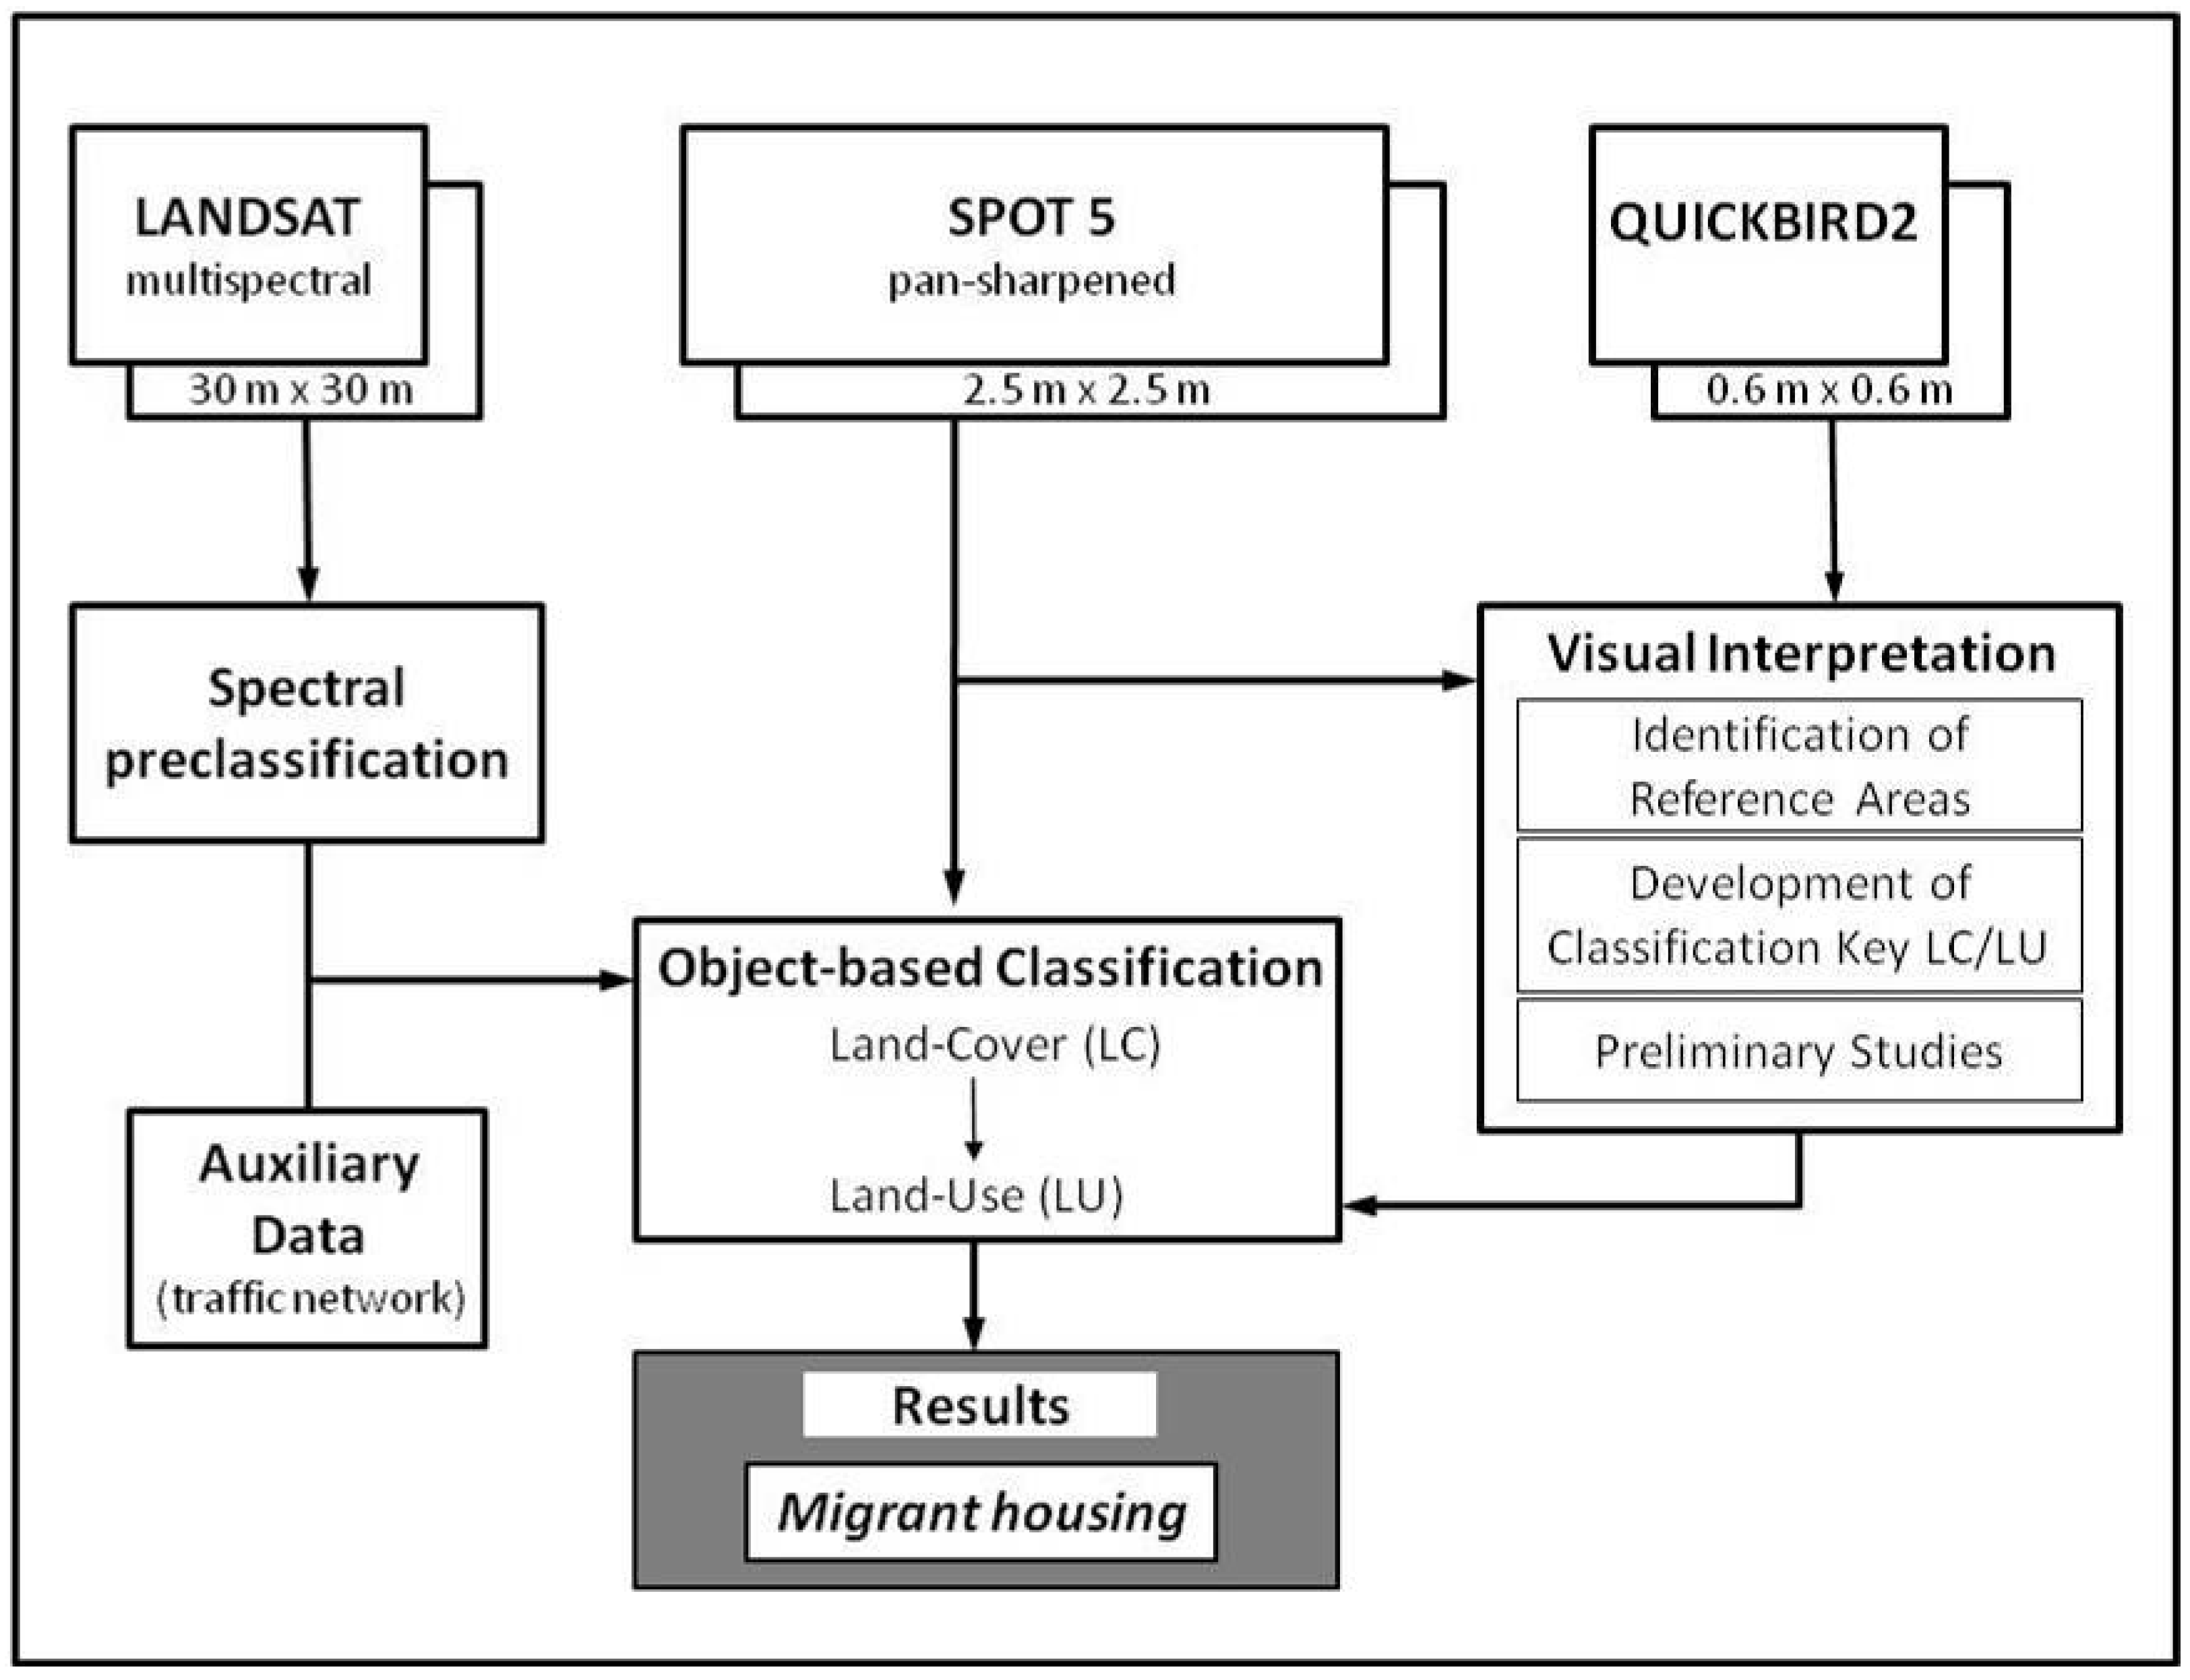
migrant housing. The workflow and existing data relations are shown with the classification scheme in
Figure 3.
Figure 3.
Scheme of the overall classification process.
Figure 3.
Scheme of the overall classification process.
3.1. Pixel-Based Classification of LC
The main LC types (water, vegetation, bare soil, sealed surfaces) and any necessary additional information on the allocation of old village cores and industrial plots were classified from LANDSAT TM data with spectral per-pixel analysis. Exporting these classification results allows implementation into the object-based classification as artificial channels, which will produce results independent of a specific SPOT5 scene, including issues of radiometric and spectral variability. Thus, the assignability of the rule-set to further satellite scenes is improved.
Urban structures, particularly old village cores in the LANDSAT TM scene, were classified and implemented into the main rule-set. The localization of old village cores was necessary to later differentiate urban structure types in the SPOT5 scene while at the same time enhancing the independence of the rule-set.
Land-cover information was used both to separate image parts of less interest and to distinguish urban structure types in their local context. Coarse classes, such as water, vegetation, bare soil and sealed surfaces, were distinguished for the years 1990 (LANDSAT TM) and 2005 (SPOT5).
The preclassification was based on the following threshold approaches: SWIR-Band (LC-class: water); NDVI (LC-class: vegetation); PCA4 (roof with blue sheet); Soil-Index ((Band2-Band1) × (Band4-Band3) × 4)/PCA1/Sobel-Operator (Edge-Detection Algorithm) for the LC-class bare soil.
Table 1 illustrates all used thresholds and dedicated LC-classes.
Table 1.
Overview of the thresholds used for preclassification.
Table 1.
Overview of the thresholds used for preclassification.
| | LC-Class | Vegetation | Water | Bare Soil | Blue roof |
|---|
| Threshold | |
|---|
| NDVI | x | x | | |
| Band 5 | | x | | |
| Soil-Index | | | x | |
| PCA1 | | | x | |
| Sobel | | | x | |
| PCA4 | | | | x |
The main traffic network was manually delineated in pan-sharpened SPOT5 because current data were not available for public use. Afterwards, the network was imported as a raster file into the main object-based classification, which forces the polygon to be delineated along roads during the polygon building segmentation process in the eCognition software. Regarding the differentiation of roads and housing areas, which have similar spectral characteristics, additional information—in this case, the location of roads operating as a polygon boundary—is necessary to obtain more accurate polygons.
In the subsequent classification steps, the results for the LANDSAT TM (1990) and the SPOT5 (2005) scenes were integrated as auxiliary data. Changes of the LC types were subsequently handled as multi-temporal features in the classification process, mainly to create comparative conditions.
3.2. Object-Based Classification of Migrant Housing
The classification was performed with multi-resolution image segmentation as a first step. A detailed explanation is given in Baatz
et al. [
32]. The possibility of setting different criteria concerning polygon properties enables the emphasis of aspects such as colour or shape in comparison to compactness. The pan-sharpened SPOT5 scene was segmented on different levels.
Table 2 shows the specific settings for the different processing levels that were used for segmentation.
Table 2.
Detailed information on settings for the segmentation processes.
Table 2.
Detailed information on settings for the segmentation processes.
| Level name (scale factor used for segmentation process) | Channels 1 (Green); 2 (Red); 3 (NIR); 4 (SWIR); 5 (Pan) | Shape* | Compactness | Number of polygons | Mean polygon size [m2] |
|---|
| 120 | 1-2-3-4-5 | 0.4 | 0.6 | 1,010 | 31,129 |
| 50 | 1-2-5 | 0.4 | 0.6 | 1,111 | 8,554 |
| 30 | 1-2-5 | 0.4 | 0.6 | 110 | 7,867 |
| 10 | 1-2-5 | 0.1 | 0.5 | 305 | 506 |
In the first cycle, the delineated traffic network was included as a thematic layer. This condition forces the resulting polygon boundaries to follow the existing spatial structures defined by the infrastructure. Aiming at a coarse classification of LC types, the polygon size is defined as large (scale factor set at 120), with a greater emphasis on spectral homogeneity, whereas aspects of shape are subordinated as shown in
Table 2. Compactness is taken into account at 60%. One condition for the classification of LC types, such as
water,
vegetation and
bare soil, is that 85% or more of each polygon is covered by a single LC type. To fulfil this condition, the comparison of LC in the LANDSAT TM scene with the SPOT5 scene was used on this first level. To analyze areas of
migrant housing, the LANDSAT TM and SPOT5 data were processed on the assumption that the existing urban structure types in the SPOT5 scenes in areas that did not have urban structure types in the LANDSAT TM scene are more likely to be
migrant housing. Polygons fulfilling all conditions are assigned to their respective classes. Successful classification results were merged to reduce data size. Polygons not fulfilling any condition were assigned to a separate class (‘unclassified’). The classification results on level 120 (classified as “sealed area” and “unclassified”) were used for segmentation on level 50 in the second step of the hierarchical classification. Segmentation took place at a more detailed level to differentiate the existing heterogeneity. Therefore, the number of polygons resulting from the segmentation was even higher than on level 120, even though the analyzed area had already been reduced (see
Table 2). Criteria such as ‘mean layer value’ and relational features as ‘length/width’ were also taken into account. The existing class descriptions can be reused for the second classification process. The size of the polygons is the main difference, whereas all class descriptions, with all set parameters included, remain the same.
Maintaining this processing approach on levels 30 and 10, specific properties (neighbourhood relation of single buildings and shading; brightness; rectangular fit; certain range of area of single houses) assignable to the classification migrant housing were analyzed on these detailed levels, whereas the majority of other LC/LU types was already separated. Building up relational conditions starting from the level of single house areas, the approach attempted to reconstruct areas of migrant housing regardless of the alignment of single houses, keeping in mind the development of a stable and transferable rule-set. The results derived from analyzing the selected polygons were then transferred onto the whole analysis area and included in the classification process (bottom-up operation). Again, the differentiation based on relationship and neighbourhood aspects aims at transferability to other satellite scenes.
4. Results and Discussion
The results show that the classification of
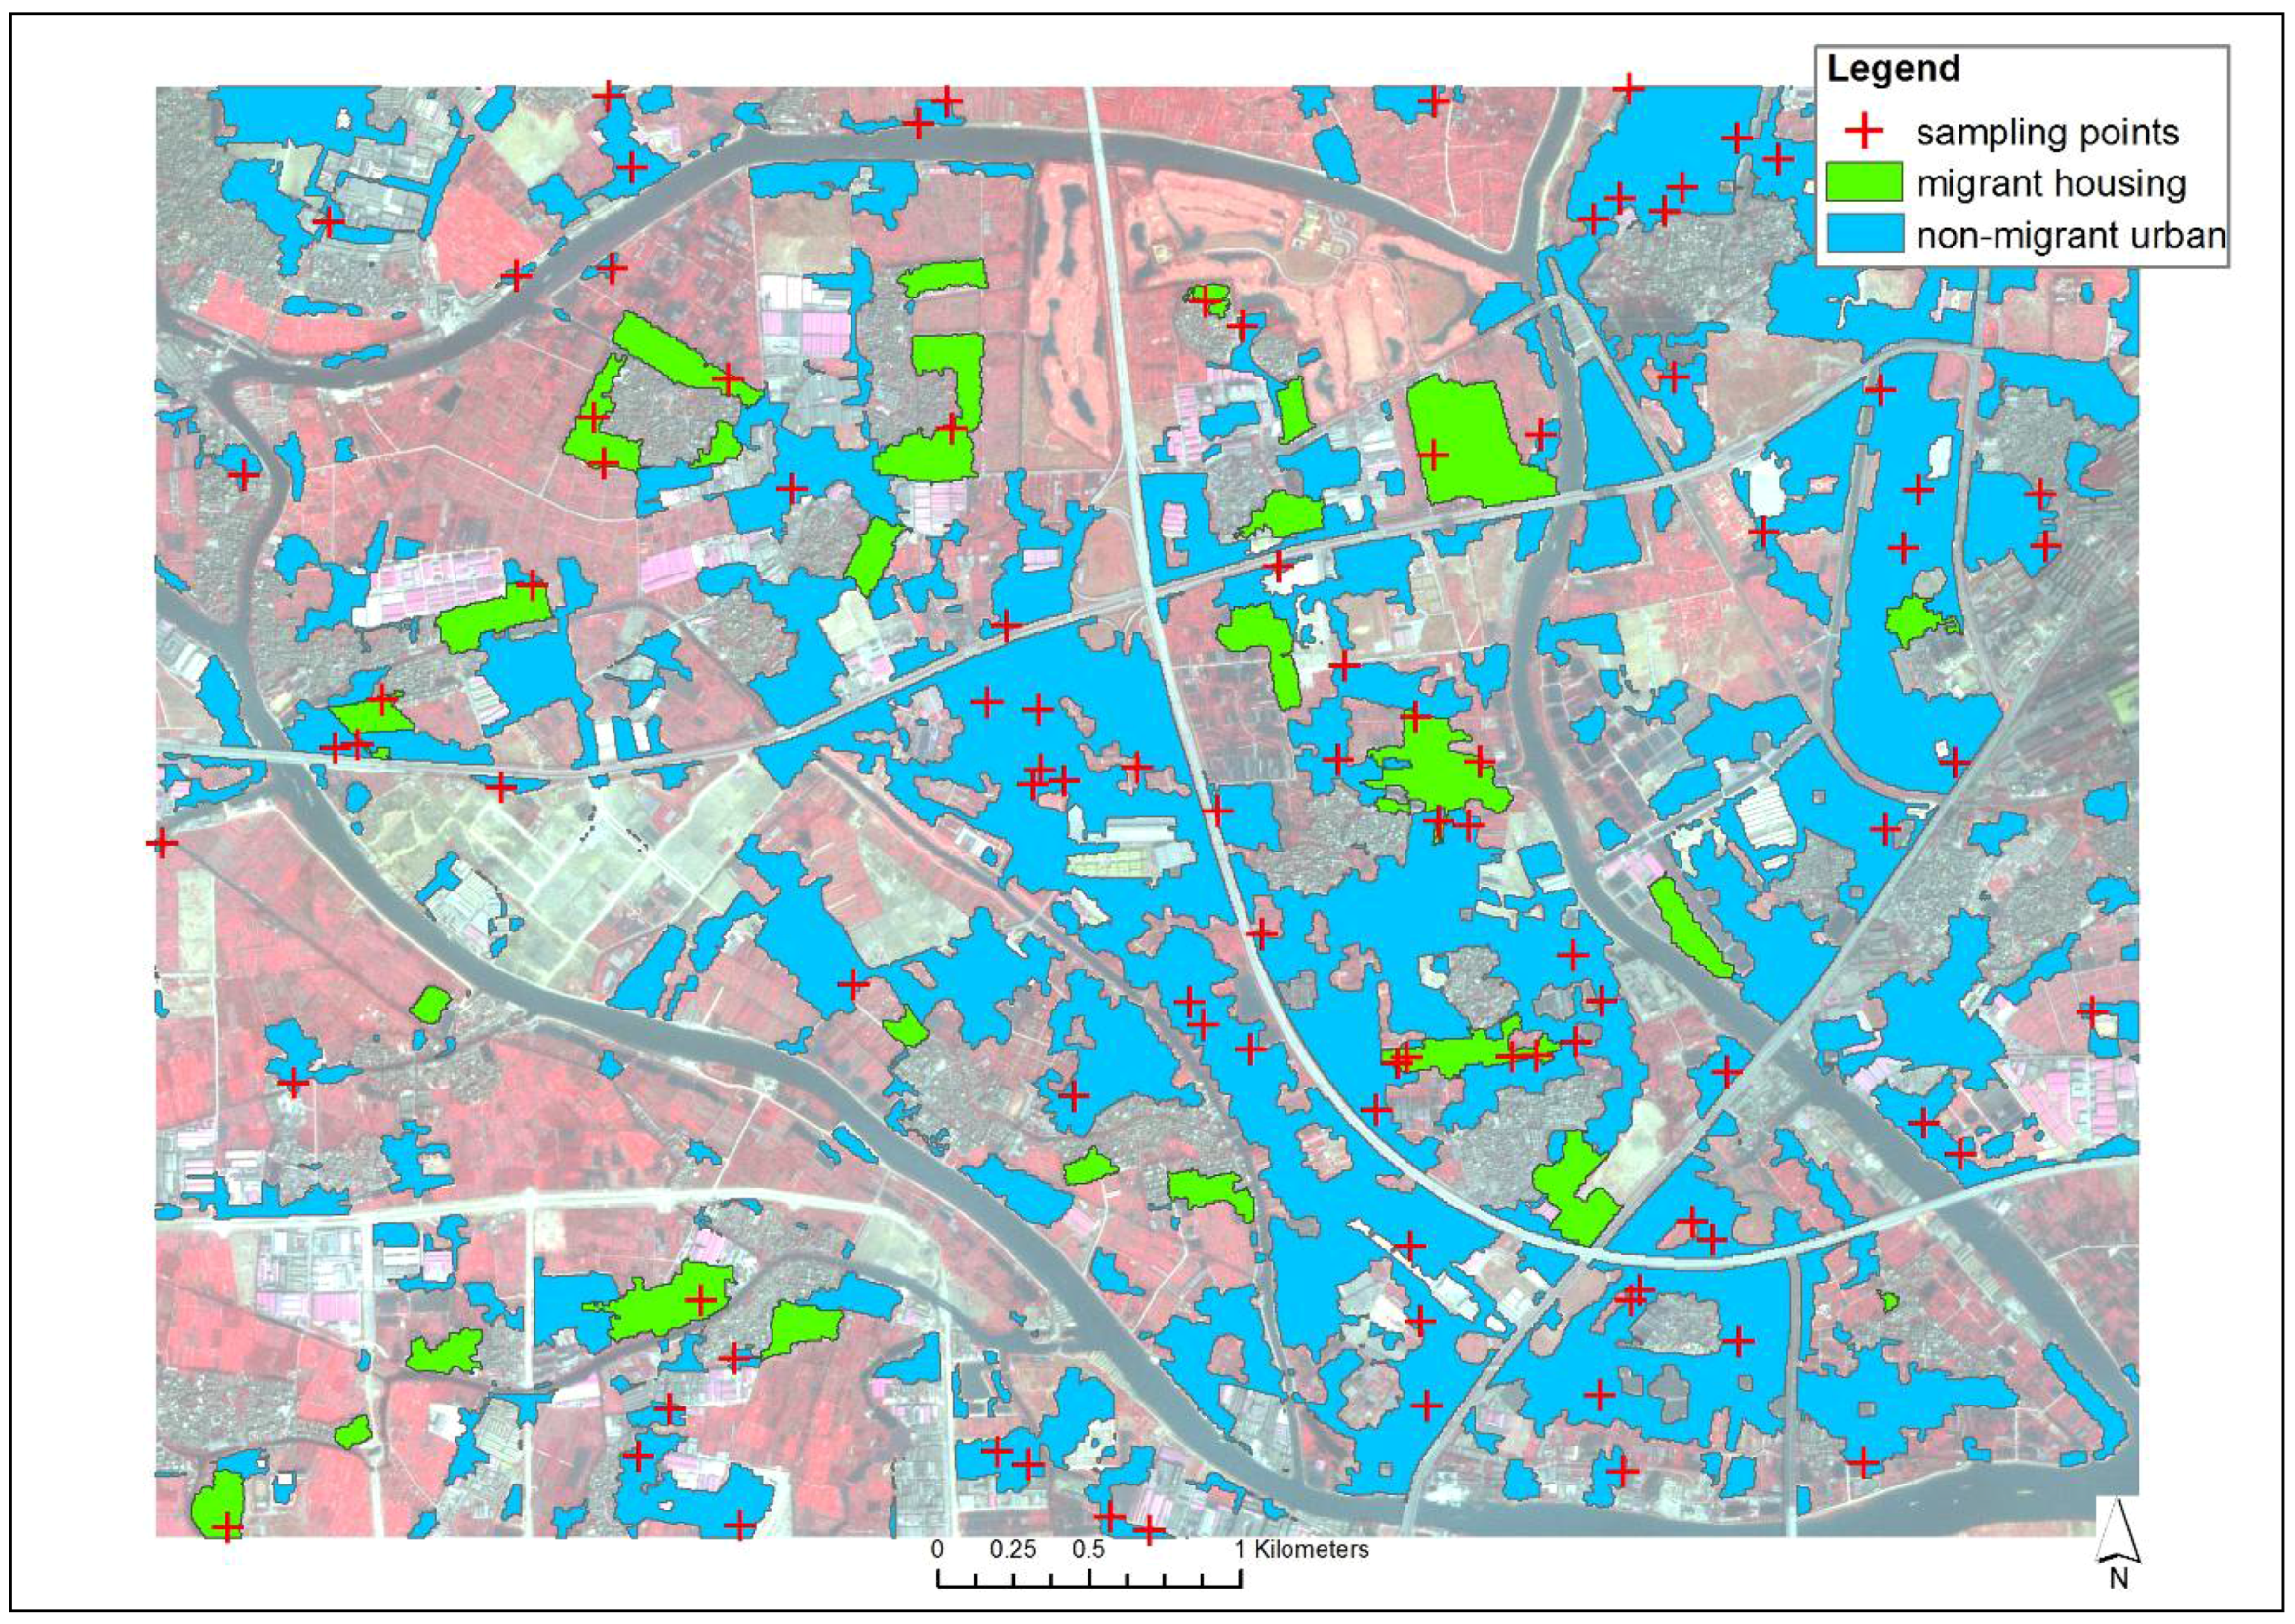
migrant housing in areas with different types of LC and LU (besides settlement) was possible with an overall accuracy of 68.0%. The resulting layers shown in
Figure 4 cover the remaining area with the assumed existence of the urban structure type
migrant housing after masking out processing. In
Figure 4, the overall classification result is illustrated and divided into two data sets: the green layer shows the classification result of
migrant housing, and the blue layer shows the classification result of non-migrant urban areas.
The accuracy assessment took place via the analysis of 100 randomly distributed sampling points (see
Figure 4: red crosses). The sampling points were distributed over the total extent of the classification results of
migrant housing and non-migrant urban areas. The precise results of the accuracy assessment are shown in
Table 3.
Figure 4.
Results of the classification of migrant housing.
Figure 4.
Results of the classification of migrant housing.
Table 3.
Accuracy of the migrant housing classification process.
Table 3.
Accuracy of the migrant housing classification process.
| Reference Data | Classification Data | Row total | Producer’s accuracy [%] | Errors of Omission [%] |
|---|
| Migrant | Non-migrant urban | Other |
|---|
| Migrant | 10 | 2 | 0 | 12 | 83.33 | 16.67 |
| Non-migrant urban | 6 | 56 | 2 | 64 | 87.50 | 12.50 |
| Other | 2 | 20 | 2 | 24 | 8.33 | 91.67 |
| Column total | 18 | 78 | 4 | 100 | | |
| User’s accuracy [%] | 55.56 | 71.79 | 50 | | | |
| Errors of Commission [%] | 44.44 | 28.21 | 50 | | | |
| Overall accuracy [%] | 68.00 |
| Mean accuracy [%] | 59.72 |
| Kappa Coefficient [%] | 0.33 |
Table 3 displays the results of the accuracy assessment. There is an overall accuracy of 68.00%. The value of the mean accuracy is 59.72%, and the calculated Kappa coefficient has a value of 0.33. For the migrant class (
i.e.,
migrant housing), a
user’s accuracy of 55.56% and a
producer’s accuracy of 83.33% are attained.
The chosen classification approach aimed to classify migrant housing in a mega-urban area using only optical satellite data to fulfil two main objectives: the development of a transferable methodology to map large, fast-growing regions such as the PRD and to keep costs at a moderate level. In order to enable the analysis of past states of the region and its former expansion, we focused on optical satellite data, since almost complete coverage for the PRD for several years is available at a maintainable cost level. In this analysis, the classification results reach an overall accuracy of 68.00% and a mean accuracy of 59.72%. The kappa coefficient reaches a value of 0.33. The equation for the computation of the coefficient includes the value for the classification result of the other class. Since, for producer’s accuracy, this value (8.33%) is low in comparison to the values for migrant and non-migrant urban classes ,the resulting coefficient value is also low. Anyhow, the aim was the explicit classification of migrant housing. Therefore, the accuracy of the class labelled ‘other’ represents an error value for the migrant and non-migrant urban classes but does not contain a real value for accuracy since it was not considered to be classified. The reasons for the accuracy values obtained for the classification of migrant and non-migrant urban classes are given below.
The settings used for the classification are more distinct for dissimilar LC types (e.g., sealing–vegetation). In comparison, the delineation inside heterogeneous urban areas holds substantial challenges for classifying
migrant housing. In addition to the LC properties mentioned above, the basic spatial alignment of
migrant housing complexes is critical. Although the spatial alignment of single houses is static, the spatial alignment of
migrant housing complexes varies depending on the location. There are strict rectangular alignments in both wide environments and polygonal alignments, for instance, close to riverbanks (see
Figure 5).
Figure 5.
Rectangular and polygonal alignment of migrant housing.
Figure 5.
Rectangular and polygonal alignment of migrant housing.
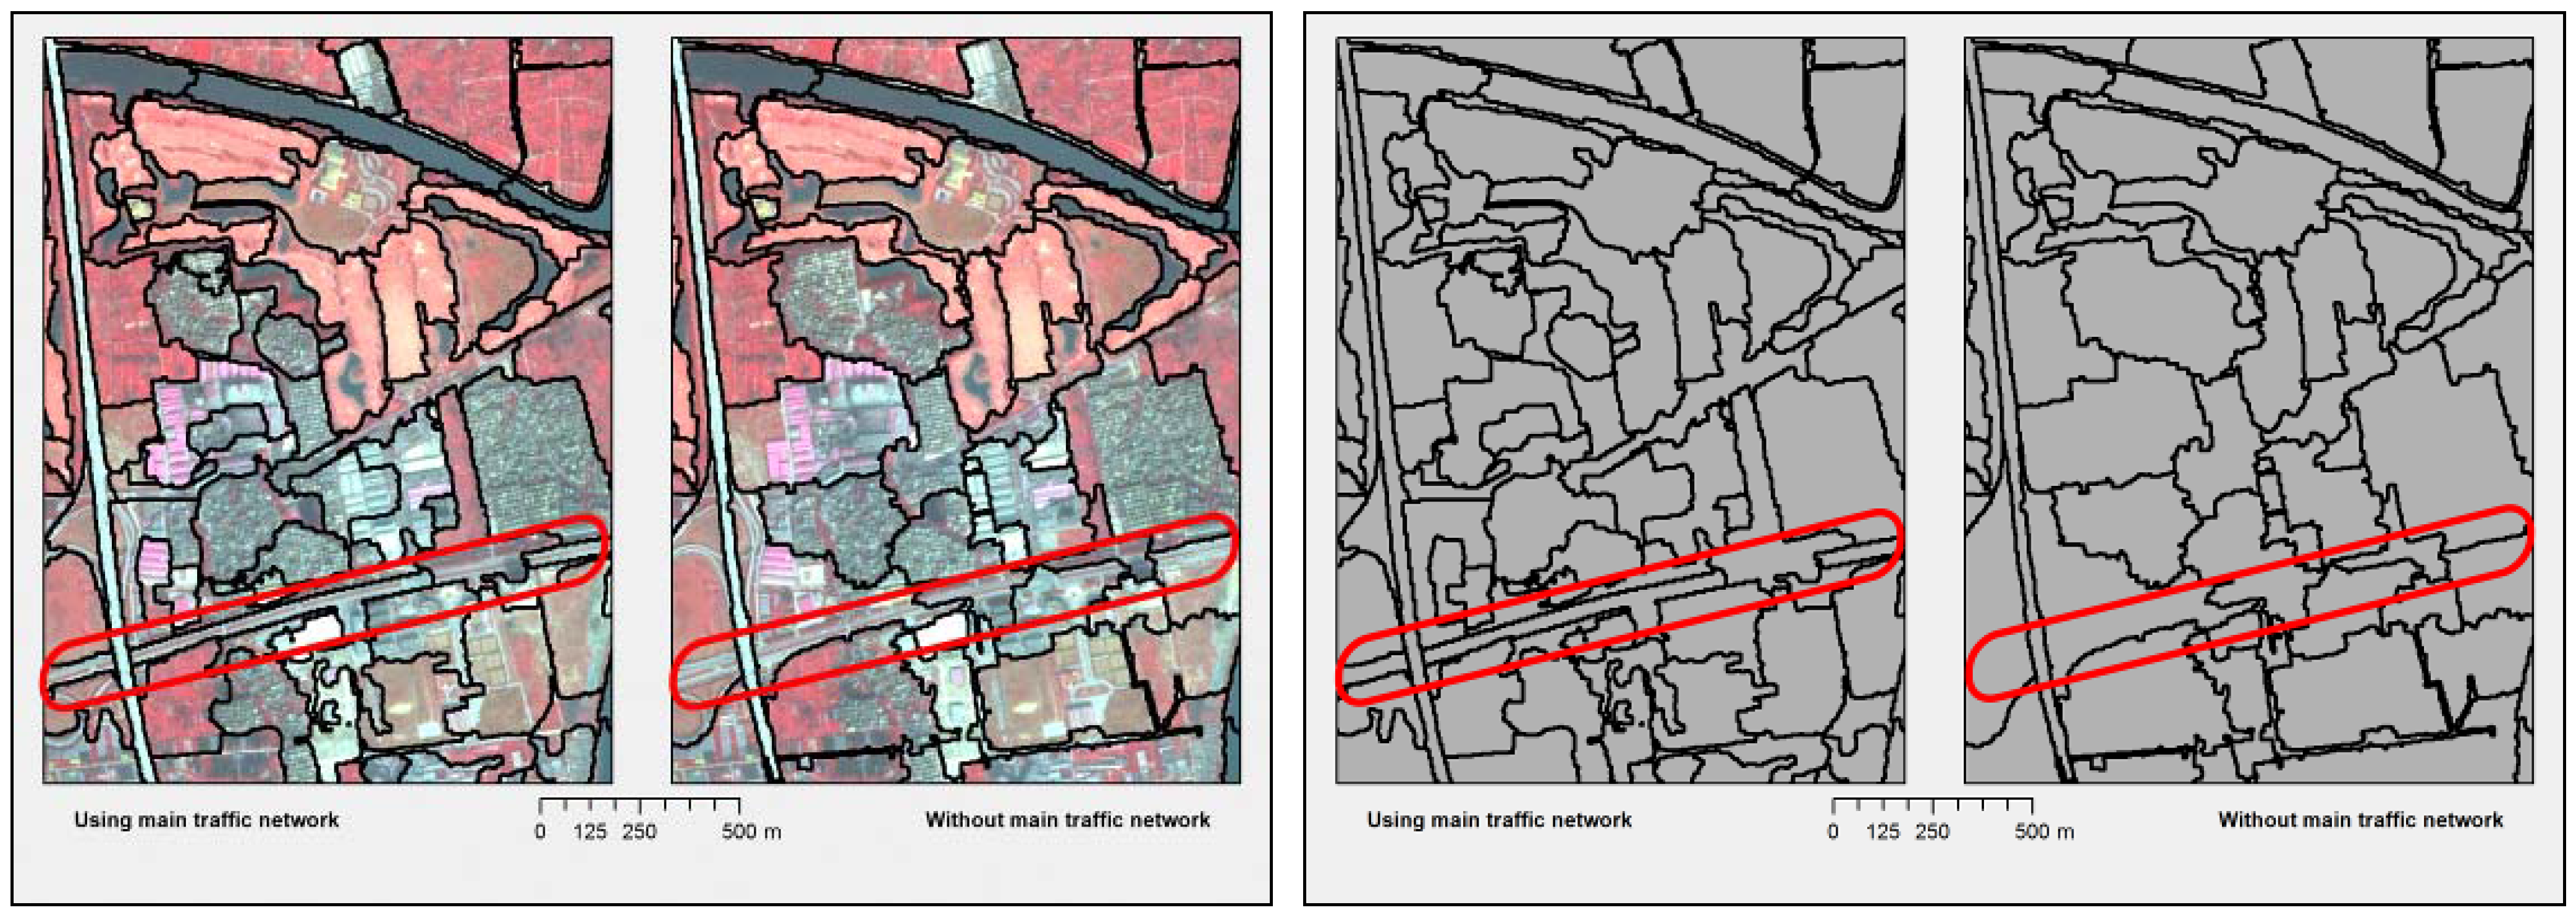
Implementing the road network as a thematic layer improves the segmentation process in eCognition software, as illustrated in
Figure 6. As indicated within the highlighted area (red line), the polygons comply with real limitations given by the infrastructure result if the traffic network is included in the segmentation process (left image). In comparison, the polygons resulting from a segmentation process without including the traffic network depict the real circumstances less accurately (red line; right image).
Figure 6.
Comparison of the segmentation process with/without included traffic network.
Figure 6.
Comparison of the segmentation process with/without included traffic network.
The obtained results show that the chosen approach delivers acceptable results given the average accuracy from the classification process, taking into account the different scale levels of the SPOT5 data compared with the detailed, structured migrant housing as the object to be classified. The importance of the additional data included in the classification process is thereby highlighted.
Establishing relationships between single houses and their alignments using the whole extent of the SPOT5 data would lead to the impractical task of covering an unknown number of possible alignments and, thus, classification rules. Therefore, the assignment of classification rules containing exceptionally detailed and specific conditions was performed for limited areas with a high potential of containing areas of migrant housing. Another example for such a detailed condition is the relation building-shading.
The usage of additional data is considered for successful improvement of the classification process. Since the presented approach of implementing a delineated road network led to better segmentation results, it is recommended to maintain addition of traffic and/or other additional data. Also, independence from spectral aspects of different satellite scenes might be lowered by using additional data.
Using satellite data with higher resolution is a point that has been considered. However, the classification of migrant housing is unlikely to be improved by using satellite data with higher resolution. Higher resolution does not automatically mean better general suitability. Accordingly, any ad hoc-evaluation of different sensors is not possible.
In a subsequent working step, the first demographic estimations may be calculated. Information regarding the number of persons living in one building of such housing complexes deviates from the empirical interview analysis of our project partners. The total number of migrant housing buildings may be calculated and multiplied with an average number of inhabitants, leading to current information regarding population (e.g., total amount, density, distribution).


