Article

Investigating the Relationship between the Inter-Annual Variability of Satellite-Derived Vegetation Phenology and a Proxy of Biomass Production in the Sahel

1
European Commission, Joint Research Centre, Institute for Environment and Sustainability, Via E. Fermi 2749, I-21027 Ispra (VA), Italy
2
South African National Space Agency, Pretoria 0087, South Africa
3
Institute of Remote Sensing and Digital Earth, Chinese Academy Of Science, Dengzhuang South Road 9, Haidian District, Beijing 100094, China
4
Ecological Monitoring Centre, Rue Léon Gontran Damas, BP 15 532 Dakar, Senegal
*
Author to whom correspondence should be addressed.
Remote Sens. 2014, 6(6), 5868-5884; https://0-doi-org.brum.beds.ac.uk/10.3390/rs6065868
Submission received: 9 April 2014 / Revised: 5 June 2014 / Accepted: 6 June 2014 / Published: 20 June 2014
(This article belongs to the Special Issue Remote Sensing in Food Production and Food Security)

Abstract

:
In the Sahel region, moderate to coarse spatial resolution remote sensing time series are used in early warning monitoring systems with the aim of detecting unfavorable crop and pasture conditions and informing stakeholders about impending food security risks. Despite growing evidence that vegetation productivity is directly related to phenology, most approaches to estimate such risks do not explicitly take into account the actual timing of vegetation growth and development. The date of the start of the season (SOS) or of the peak canopy density can be assessed by remote sensing techniques in a timely manner during the growing season. However, there is limited knowledge about the relationship between vegetation biomass production and these variables at the regional scale. This study describes the first attempt to increase our understanding of such a relationship through the analysis of phenological variables retrieved from SPOT-VEGETATION time series of the Fraction of Absorbed Photosynthetically Active Radiation (FAPAR). Two key phenological variables (growing season length (GSL); timing of SOS) and the maximum value of FAPAR attained during the growing season (Peak) are analyzed as potentially related to a proxy of biomass production (CFAPAR, the cumulative value of FAPAR during the growing season). GSL, SOS and Peak all show different spatial patterns of correlation with CFAPAR. In particular, GSL shows a high and positive correlation with CFAPAR over the whole Sahel (mean r = 0.78). The negative correlation between delays in SOS and CFAPAR is stronger (mean r = −0.71) in the southern agricultural band of the Sahel, while the positive correlation between Peak FAPAR and CFAPAR is higher in the northern and more arid grassland region (mean r = 0.75). The consistency of the results and the actual link between remote sensing-derived phenological parameters and biomass production were evaluated using field measurements of aboveground herbaceous biomass of rangelands in Senegal. This study demonstrates the potential of phenological variables as indicators of biomass production. Nevertheless, the strength of the relation between phenological variables and biomass production is not universal and indeed quite variable geographically, with large scattered areas not showing a statistically significant relationship.

Graphical Abstract

1. Introduction

The Sahel, a semi-arid region on the southern border of the Sahara desert, is characterized by a marked inter-annual climatic variability. The region has witnessed a number of food security crises in recent decades (e.g., [1,2]) following the more severe droughts during the 1970s and the 1980s [3]. Early warning monitoring systems aim at detecting unfavorable crop and pasture conditions as early as possible during the growing season to inform governments, regional and international stakeholders about impending risks [4,5]. For this purpose, the analysis of optical remote sensing (RS) data relies on high temporal frequency observations provided by moderate to coarse spatial resolution satellite instruments (e.g., Satellite Pour l’Observation de la Terre, SPOT-VEGETATION; and Moderate-resolution Imaging Spectroradiometer, MODIS) to evaluate vegetation biomass production and crop yield (e.g., [6]). Vegetation conditions are commonly assessed on the basis of anomalies of the current value of the RS indicator (typically the normalized difference vegetation index, NDVI [7]), with respect to a value extracted, for the same period of the year, from a reference temporal profile. This reference is often represented by what is assumed to be the “normal” condition [8], i.e., the “long-term” average computed on the entire RS time series. The main disadvantage of this approach is that the comparison is made at predefined dates within the year regardless of the actual plant growth stage. In this way, a precocious or delayed start of the predefined growing season is implicitly assumed to have an effect on plant condition. For instance, an earlier (or later) than usual development will in any case generate a positive (or negative) NDVI anomaly in the initial part of the season, even if the overall production is not actually affected. Approaches accounting for vegetation phenology in the analysis of overall growing season productivity have recently been proposed to overcome this possible limitation [911].
The study of phenology is important, because the timing and the temporal characteristics of vegetation growth directly control vegetation productivity (for a review, see Richardson et al. [12]). In particular, the length of the growing season was found to be positively correlated with carbon uptake in different ecosystems, ranging from deciduous forests, savannahs, grasslands and crops [1316]. These findings mainly reflect the fact that plants manage to make optimal use of energy, water and other resources when these are available.
Phenology information could be used for crop and pasture monitoring, as the start of the growing season can be derived early in the season from satellite data [17,18]. Furthermore, the start of the growing season can also be forecasted using climatic indices [19]. Despite this attractive feature, current knowledge about the relationship between phenology and gross primary production (GPP) in the Sahel is limited. Proud and Rasmussen [20] analyzed NDVI data from Meteosat Second Generation and rainfall estimates from the Tropical Rainfall Monitoring Mission and showed that a delay or false start (i.e., initial green-up followed by a setback) of the rainy season had a significant negative effect on the growth of vegetation. Anomalies in the timing of the start of the growing season have recently been considered as explanatory variables in designing empirical drought indices using data mining techniques [21,22]. However, the link between the timing of the start of the season, as derived from remote sensing indicators, and vegetation production at the end of the growing season has not been clearly identified.
Water availability is the main limiting factor for plant growth in warm semi-arid and arid regions. Ecosystems are highly sensitive not only to the annual rainfall amount, but also to the rainfall distribution (timing, continuity and duration of the wet season), which, in turn, controls the vegetation development patterns. The timing of precipitation was found to be as important as changes in the total amount of precipitation in controlling vegetation productivity in water-limited ecosystems [23]. A delayed onset of rain is thought to exert a detrimental effect on seasonal GPP by delaying plant growth and preventing full vegetation development [19]. On the other hand, an early onset may enhance initial productivity and water reserve depletion, thus inhibiting later photosynthesis and also reducing overall production [12]. Furthermore, the magnitude and type of effect resulting from the altered timing and amount of a rainfall event can be quite specific for different plant species, functional types and communities [24].
In addition, it is unclear whether a delayed onset of vegetation development has the same effect on crops and natural vegetation seasonal productivity. For example, nearly all crops are sensitive to temperature and some to photoperiod as well. Seeding or planting exactly after the first abundant rains to catch maximum water is a typical risk minimization farming strategy in the south of Sahel and in other semi-arid areas of the world [25]. Because plants experience different temperature and photoperiod conditions as a consequence of variable rain onsets and sowing dates, crop performances are expected to be sensitive to anomalies in the start of the season. For example, when photosensitive crop varieties are planted too late (for instance, because of replanting after a first crop failure due to the late onset of the rainy season), the “flowering signal” is received by a plant when it is still very young. As a consequence, it will start flowering when the biomass is not fully developed, with detrimental effects on final grain yield. Sowing delays can therefore translate into yield reduction [26]. However, farmers may rely on multiple cultivars with different lengths of growing cycle to cope with rainfall variability [27], partially compensating for the possible negative effects of late planting [28,29].
More arid areas in the north of the Sahel are less suitable for crops and are typically exploited for grazing. Such areas enjoy only a one to two month-long growing season, because of the short duration of the West African monsoon. Here, the herbaceous vegetation is also sensitive to the photoperiod, and a delayed rainfall onset season may have an effect on seasonal productivity as well.
Present climate change has already altered both the amount and the seasonal distribution of rainfall worldwide and especially in the dry tropics [30], with consequences on vegetation phenology (e.g., [19,31,32]). Gaining insights into the possible effect of these changes on crop and pasture production in semi-arid regions is important to develop appropriate adaptation strategies, particularly in such semi-arid areas, where the impact on terrestrial ecosystems is expected to be more dramatic [33,34].
Several studies analyzed the changes or trends in phenological variables as possible indicators of climate change (e.g., [3537]). Others have addressed the long-term Sahel desertification/re-greening trends (see Dardel et al. [38] for a comprehensive introduction and a recent contribution to the debate) and their possible causes (e.g., [3942]).
So far, only Groten and Ocatre [43] have addressed the relationship between remote sensing-derived phenology and biomass production. They qualitatively analyzed the start of the season anomaly for a single year in Burkina Faso and found it to be related to partial crop failure. However, large-scale and multi-annual investigations on the relation between different key phenological variables and vegetation biomass production are missing. A better understanding of the role of the timing of the start of season on vegetation development is also important to evaluate, and possibly improve, the fixed phenology settings often used in crop development simulation models and in many RS-based empirical approaches.
In this study, we aim to improve the understanding of the relationship between phenology and biomass production in the Sahel. For this purpose, we use phenological variables derived from satellite observations (for a review of the methods see de Beurs and Henebry [44]), as they can effectively map phenological events over large areas for an extended time period. Key phenological variables are derived from the analysis of FAPAR (Fraction of Absorbed Photosynthetically Active Radiation) data from SPOT-VEGETATION instrument for the period of 1998–2012. The cumulative FAPAR value (CFAPAR) over the growing season is used as an indicator of biomass production, as CFAPAR appears to be a suitable proxy of GPP, biomass production [38,4550] and of crop yield (e.g., [5153]). The correlation between CFAPAR and the key phenological variables and an indicator of the maximum productivity attained during the growing season is then mapped over the Sahel. Finally, ground measurements of herbaceous aboveground biomass collected over rangeland sites in Senegal are used to assess the strength of the link between CFAPAR and biomass production and to test the consistency of the correlations between CFAPAR and phenological variables.

2. Materials and Methods
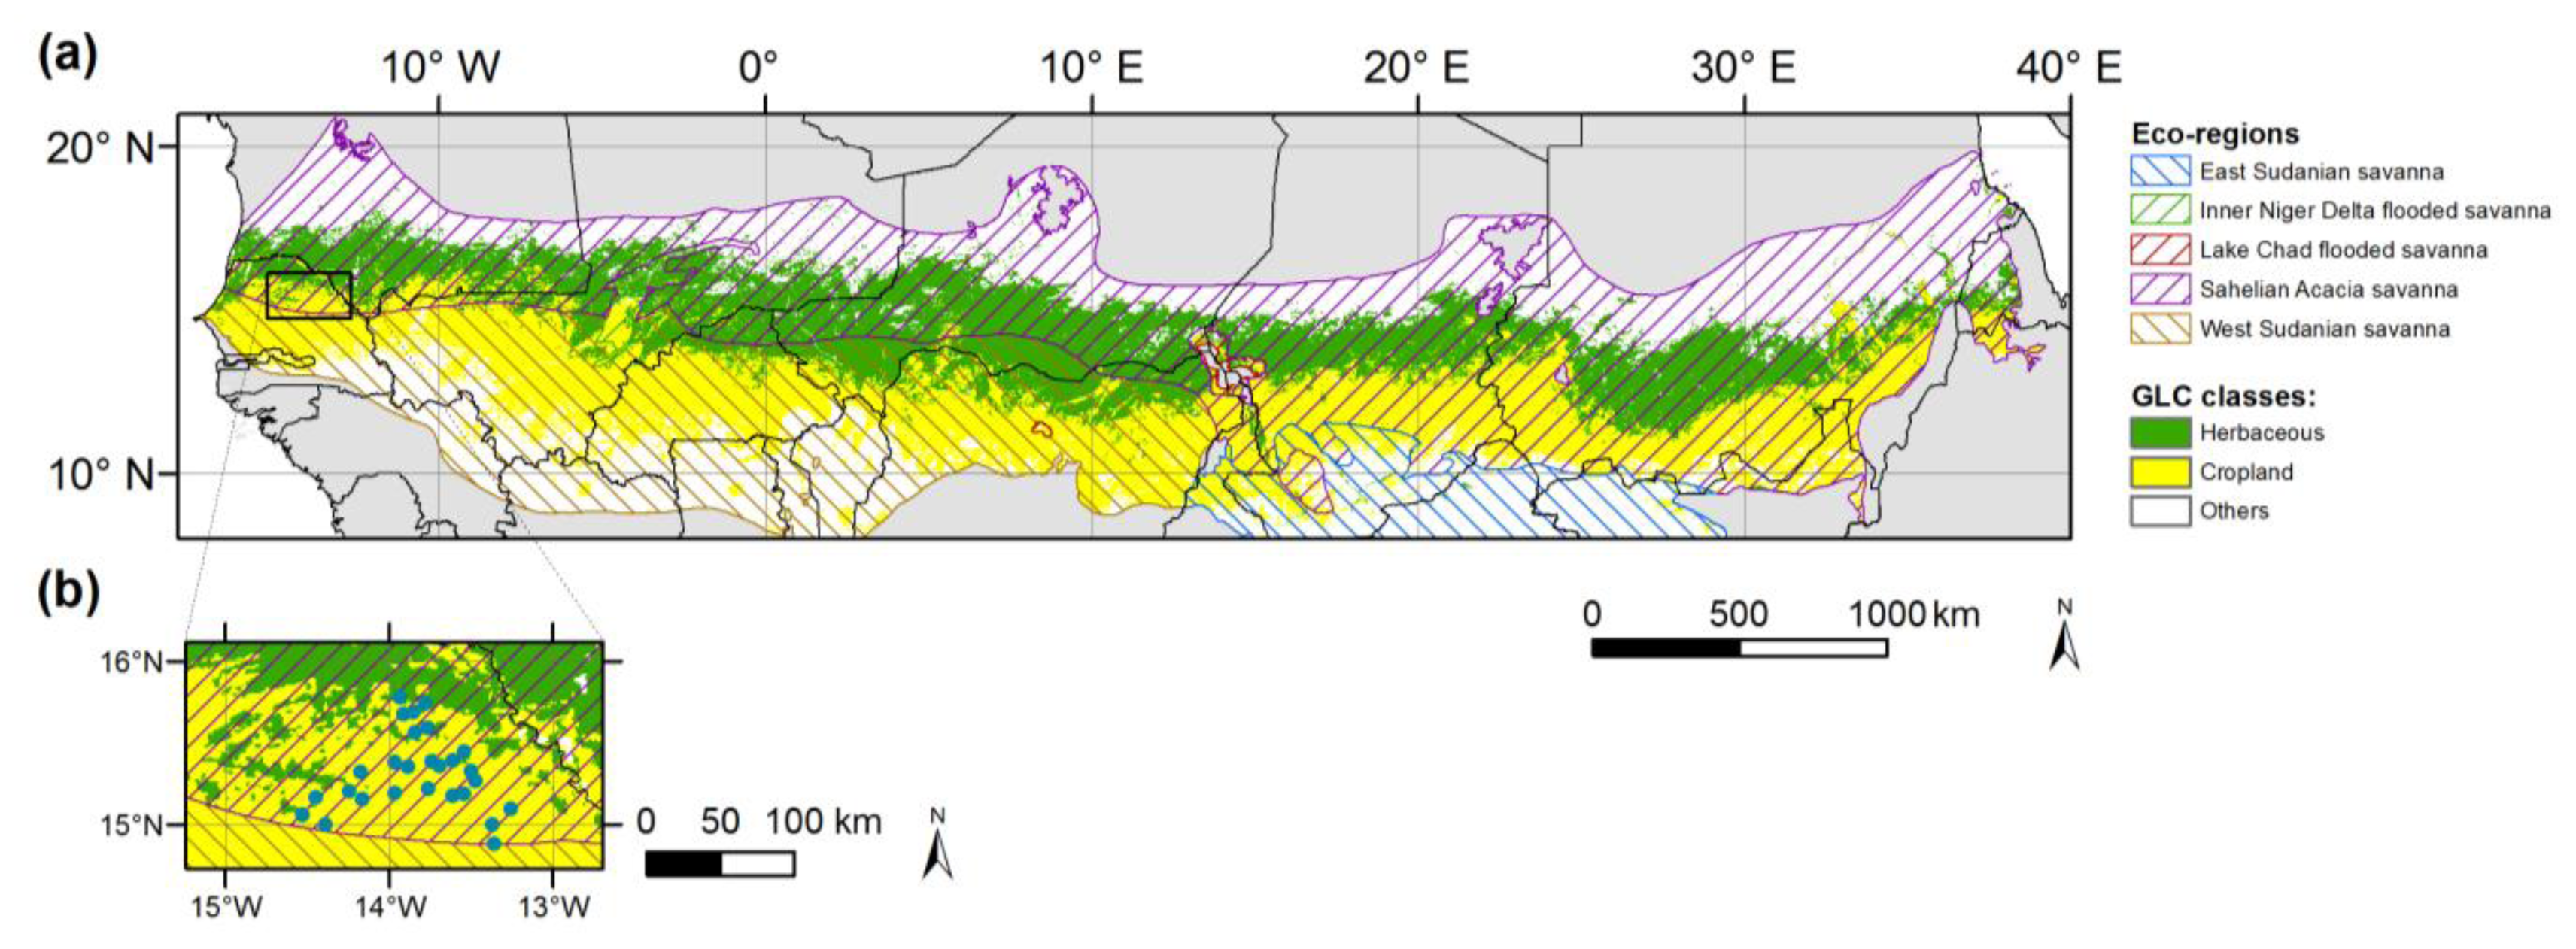
2.1. Study Area

The analysis is conducted in the Sahel, a semi-arid transition zone in Africa between the Sahara desert to the north and a humid tropical savannah to the south. The Sahel is marked by a steep north-south gradient in annual precipitation. Frequent drought conditions [1] expose the often vulnerable local communities relying on rain-fed pastures and crops to food security crises, as occurred recently in 2010 and 2012 [2,5,29] and, more dramatically, in the 1970s and 1980s [3]. Climatic drivers of rainfall and of agro-pastoral production are not uniform over the Sahel. The western part of the Sahel is influenced by the North Atlantic Oscillation, whereas the eastern part is influenced by the El Niño Southern Oscillation [54]. The study area is limited to the cropland and herbaceous covers according to GLC2000 (Global Land Cover 2000 [55]) and to the five main eco-regions of the Sahel [56] located in the latitude band between 8 and 21°N (Figure 1).

2.2. Remote Sensing Data and Field Measurements

In this study, we used FAPAR as the primary source of information about vegetation status, because it directly measures the amount of incident radiation absorbed by the plant canopy, one of the key drivers of plant development and GPP [57]. The results described in this paper were generated using time series of maximum value composited dekadal (defined as a 10-day period) FAPAR of the JRC-MARS archive (Joint Research Centre of the European Commission, Monitoring Agricultural Resources Unit). In this product, FAPAR is estimated using the CYCLight algorithm [58] applied to calibrated, cloud-screened and atmospherically corrected (SMAC algorithm [59]) SPOT-VEGETATION (VGT) imagery at a 1/112° (about 1 km) spatial resolution for the period of April 1998–January 2013 (nearly 15 years).
Field measurements of above-ground biomass at the end of the growing season were performed by the Centre de Suivi Ecologique (CSE, Dakar, Senegal) over pastoral sites in the Matam region (Figure 1a,b), an area of transition between cropland and herbaceous land cover according to GLC2000. It is worth noting that a large fraction of the sampling sites is classified as cropland in GLC2000 albeit agriculture is negligible at these sites (crops are present only in few sites, with less than 1% of total area cropped). Herbaceous dry matter biomass was estimated along 1 km × 1 m transects with the stratified sampling method described in Diouf and Lambin [60]. The transect is stratified into four strata according to vegetation type and estimated herbaceous biomass. Then, between 35 and 100 plots (depending on the spatial heterogeneity of the site) of 1 m2 are randomly distributed in each stratum. The aboveground herbaceous biomass of each plot is clipped, and the fresh weight is determined in situ. A sub-sample of the clipped biomass is dried in an oven to measure the dry weight and to estimate the dry to fresh weight ratio. Mean site dry biomass is finally extrapolated as the average of the biomass of each stratum weighted by its relative contribution (proportion of transect occupied by the stratum). A total number of 33 sites were available in an area covering roughly 100 km × 100 km. Sampling sites were revisited yearly in late October from 2005 to 2011. Missing data in the database are due to logistic difficulties and bush fires that occurred before planned field missions. Furthermore, the data of five sites were not used in the present analysis, as they reported anomalous inter-annual variability of biomass production compared to neighboring sites. As a result, a total of 167 data points for 28 sites were available for the validation exercise. A 3 × 3-pixel window centered on the coordinates of the transect midpoint was used to extract the average of the remote-sensing indicator. Visual inspection of all sites on Google Earth imagery did not reveal the presence of a spatial heterogeneity in vegetation cover that was incompatible with the extraction window used.

2.3. Methods

Phenological variables were retrieved from the FAPAR time series using the model-fit approach described in Meroni et al. [9]. Briefly, the seasonality (being uni- or bi-modal) is detected analyzing the autocorrelation of the FAPAR time series. Then, the seasonal FAPAR trajectory is fitted with a double hyperbolic tangent model. Finally, the start and end of season (SOS and EOS) are deemed to occur whenever the value of the modeled time series exceeds the initial base value by 20% of the growing amplitude and whenever the modeled value drops below the final base value plus 20% of the decay amplitude, respectively. The length of the growing season (GSL), the maximum FAPAR value (Peak), as well as the cumulative FAPAR value during the growing season (CFAPAR) are computed on the fitted model. When required, SOS is expressed in terms of anomaly (ΔSOS, the actual SOS minus its mean value). The retrieval of phenology in the Sahel is challenging because satellite observations may be hampered by the presence of scattered clouds, especially during the wet season, and this can interfere with the detection of specific events, such as the SOS. Additionally, rain-fed arid ecosystem can exhibit “false starts”, or complete season failures [44]. All of these factors may affect the correct phenology retrieval and introduce bias in the analysis. Relying on a model of the growing period, rather than the raw measurements themselves, is expected to deliver reasonable phenology dates, even if these occur on cloudy days, as the model functional form is fitted to the available observations.
CFAPAR is defined as the integral of FAPAR during the growing period. Its magnitude is therefore a function of the shape of the FAPAR seasonal trajectory (including the maximum amplitude attained) and of the integration limits (start and end of season) defining the growing season. As these phenological parameters interact in a complex way in the determination of CFAPAR, their effect cannot be evaluated theoretically. For instance, a longer than usual growing season may be characterized by lower vegetation growth, resulting in lower CFAPAR. On the contrary, a shorter season may experience more rapid growth and result in a higher CFAPAR. In addition, no a priori assumptions based on the functional form of the trajectory can be made when the season is shifted in time (delayed or earlier than usual start and end of the season), as frequently happens in terrestrial ecosystems.
In this study, we aim at visualizing the relative importance of such phenological features in determining the seasonal CFAPAR over different geographical settings in the Sahel region. For this purpose, we analyze the correlations of the seasonal biomass production, represented here by CFAPAR, with the retrieved key phenology parameters (GSL and ΔSOS) and the maximum productivity indicator (Peak). This analysis is intended to provide a first assessment of the relative importance of GSL, ΔSOS and Peak rather than to define a statistical framework for estimating the biomass production, as the various parameters are not statistically independent.
The plausibility of using CFAPAR as a proxy of biomass production was checked using field measurements. In addition, the observed correlation of the phenological parameters with CFAPAR was compared to the correlation of phenological parameters with measured biomass.

3. Results and Discussion

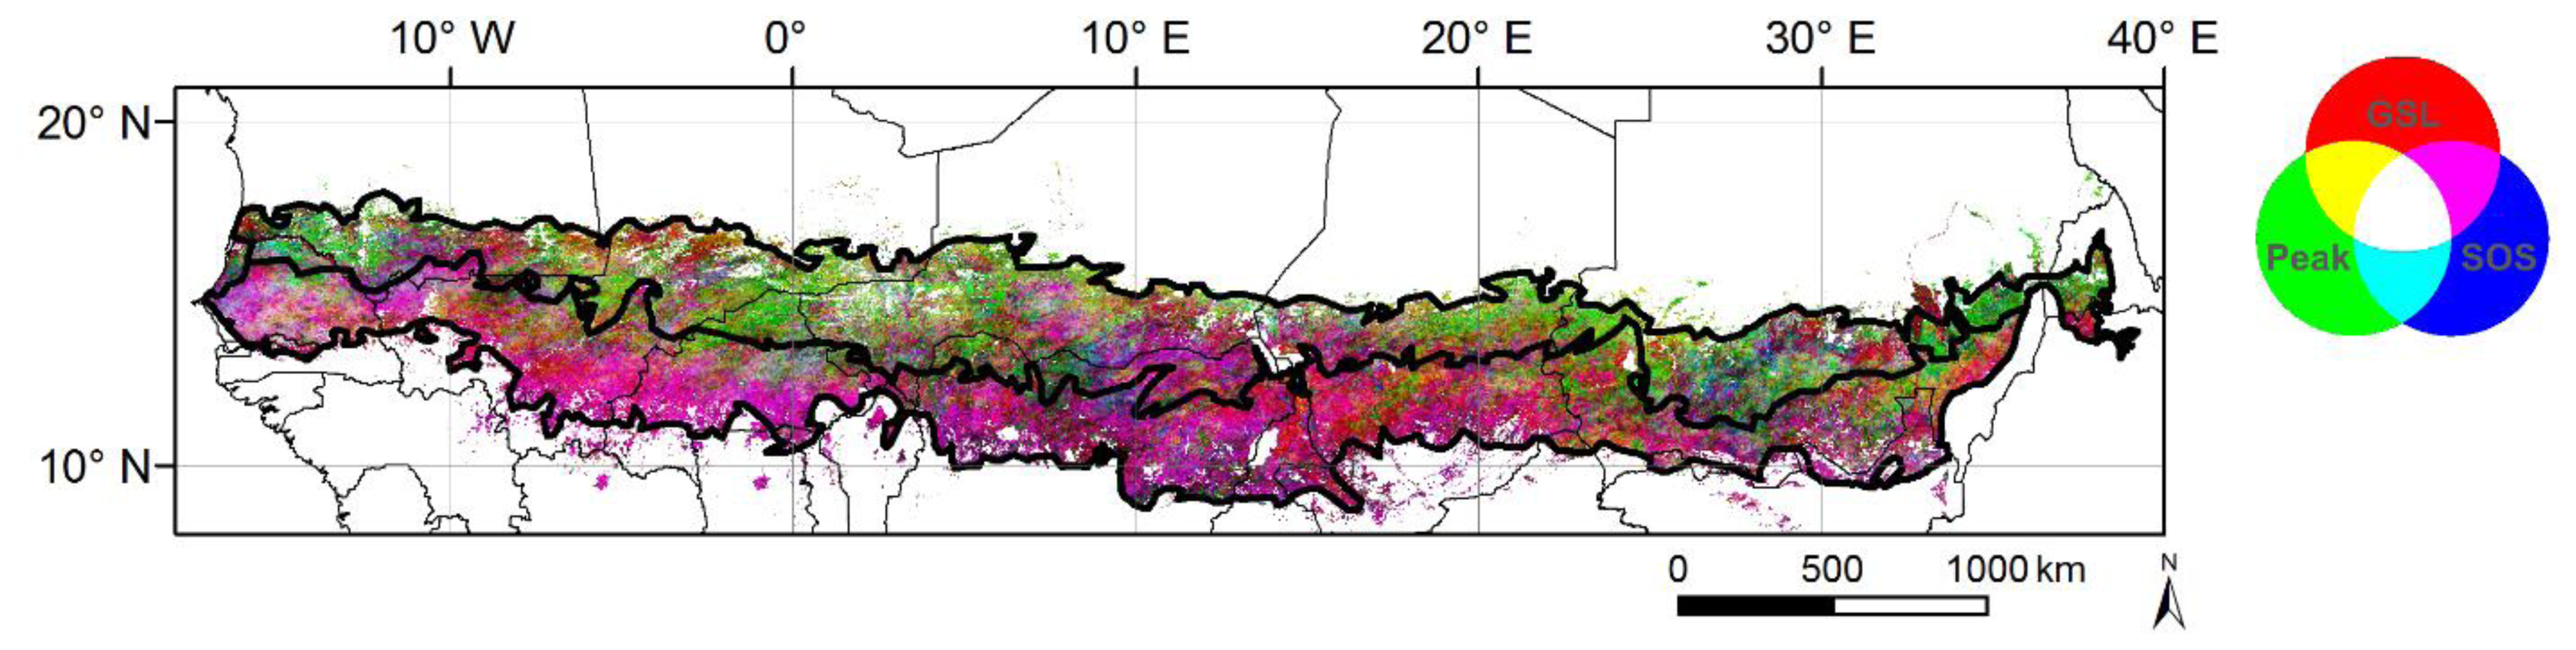
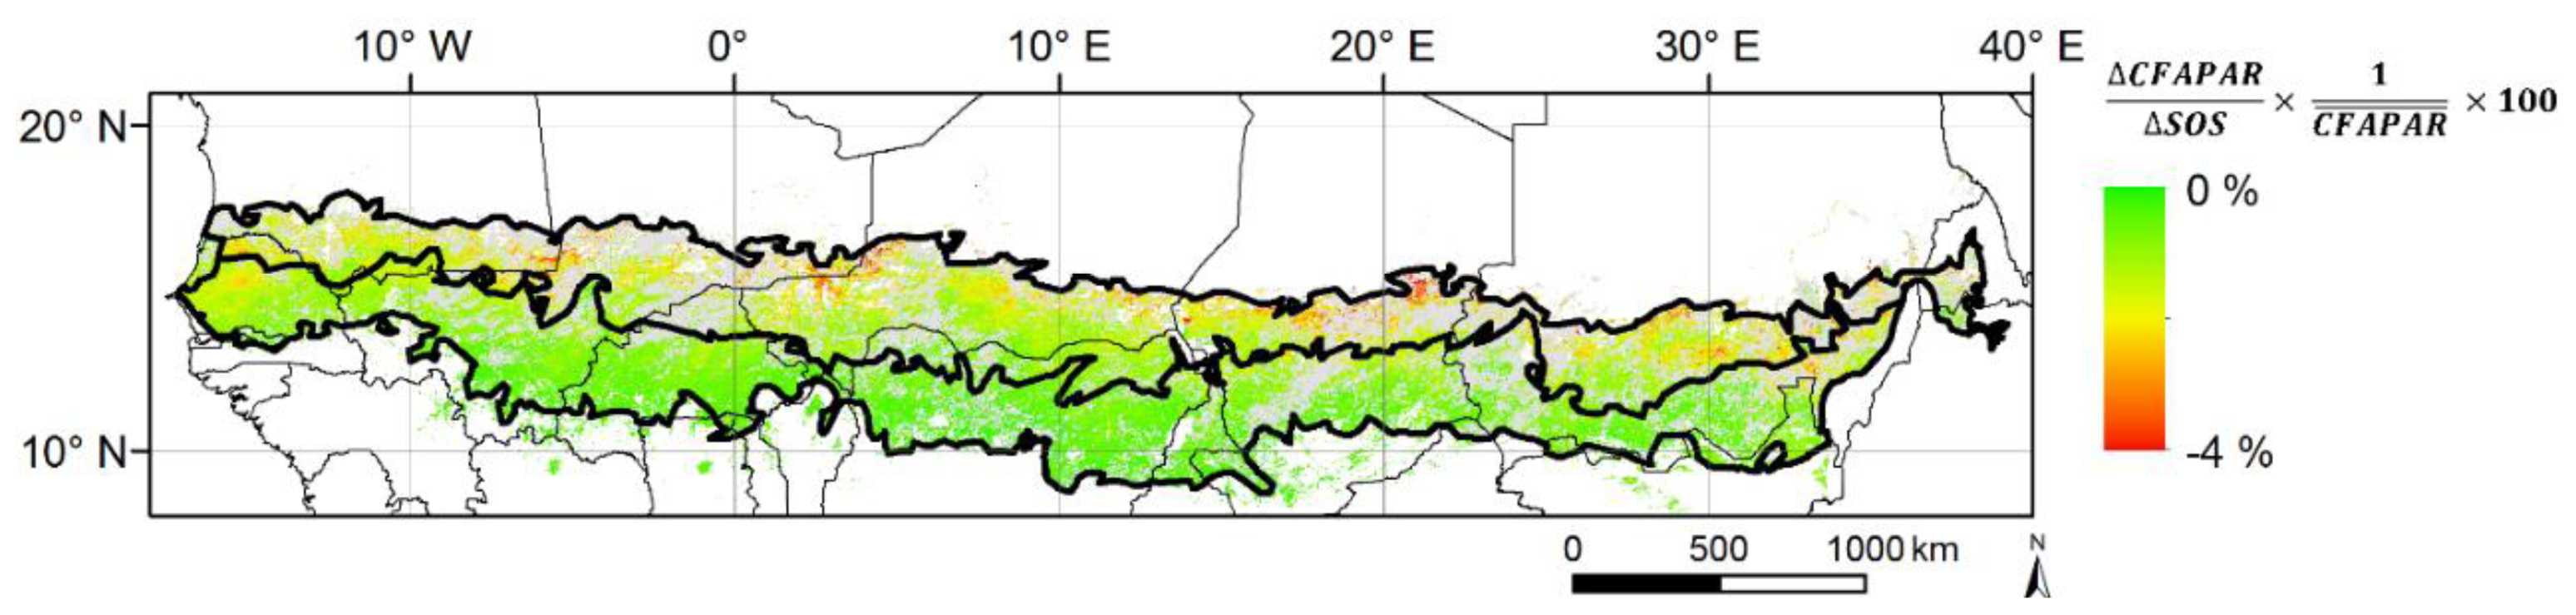
3.1. Spatial Patterns of Phenology

The study area experiences one growing season per year, ranging roughly from June/July to October/December, depending on the location. Figure 2 shows the spatial variability of average SOS, EOS, GSL and the proxy of seasonal biomass production, CFAPAR. A clear latitudinal gradient in all phenological variables is present: GSL increases from north to south along with CFAPAR.
The start and end of the season are modulated by the seasonal migration of the Inter-Tropical Convergence Zone, which results in a shorter and poorer growing season in the north of the study area. The interannual variability of such variables is relevant and reflects the high climatic variability characterizing the region. For instance, the mean value of the coefficient of variation of GSL over the whole study area during the period of 1998–2012 is 21% and ranges from 15% in the southern agricultural band to 28% in the northern grassland band. Phenological dates and spatial patterns are similar to those found in other studies using different satellite instruments (NOAA-AVHRR, MODIS) and different phenology retrieval methods (e.g., [32,61]).

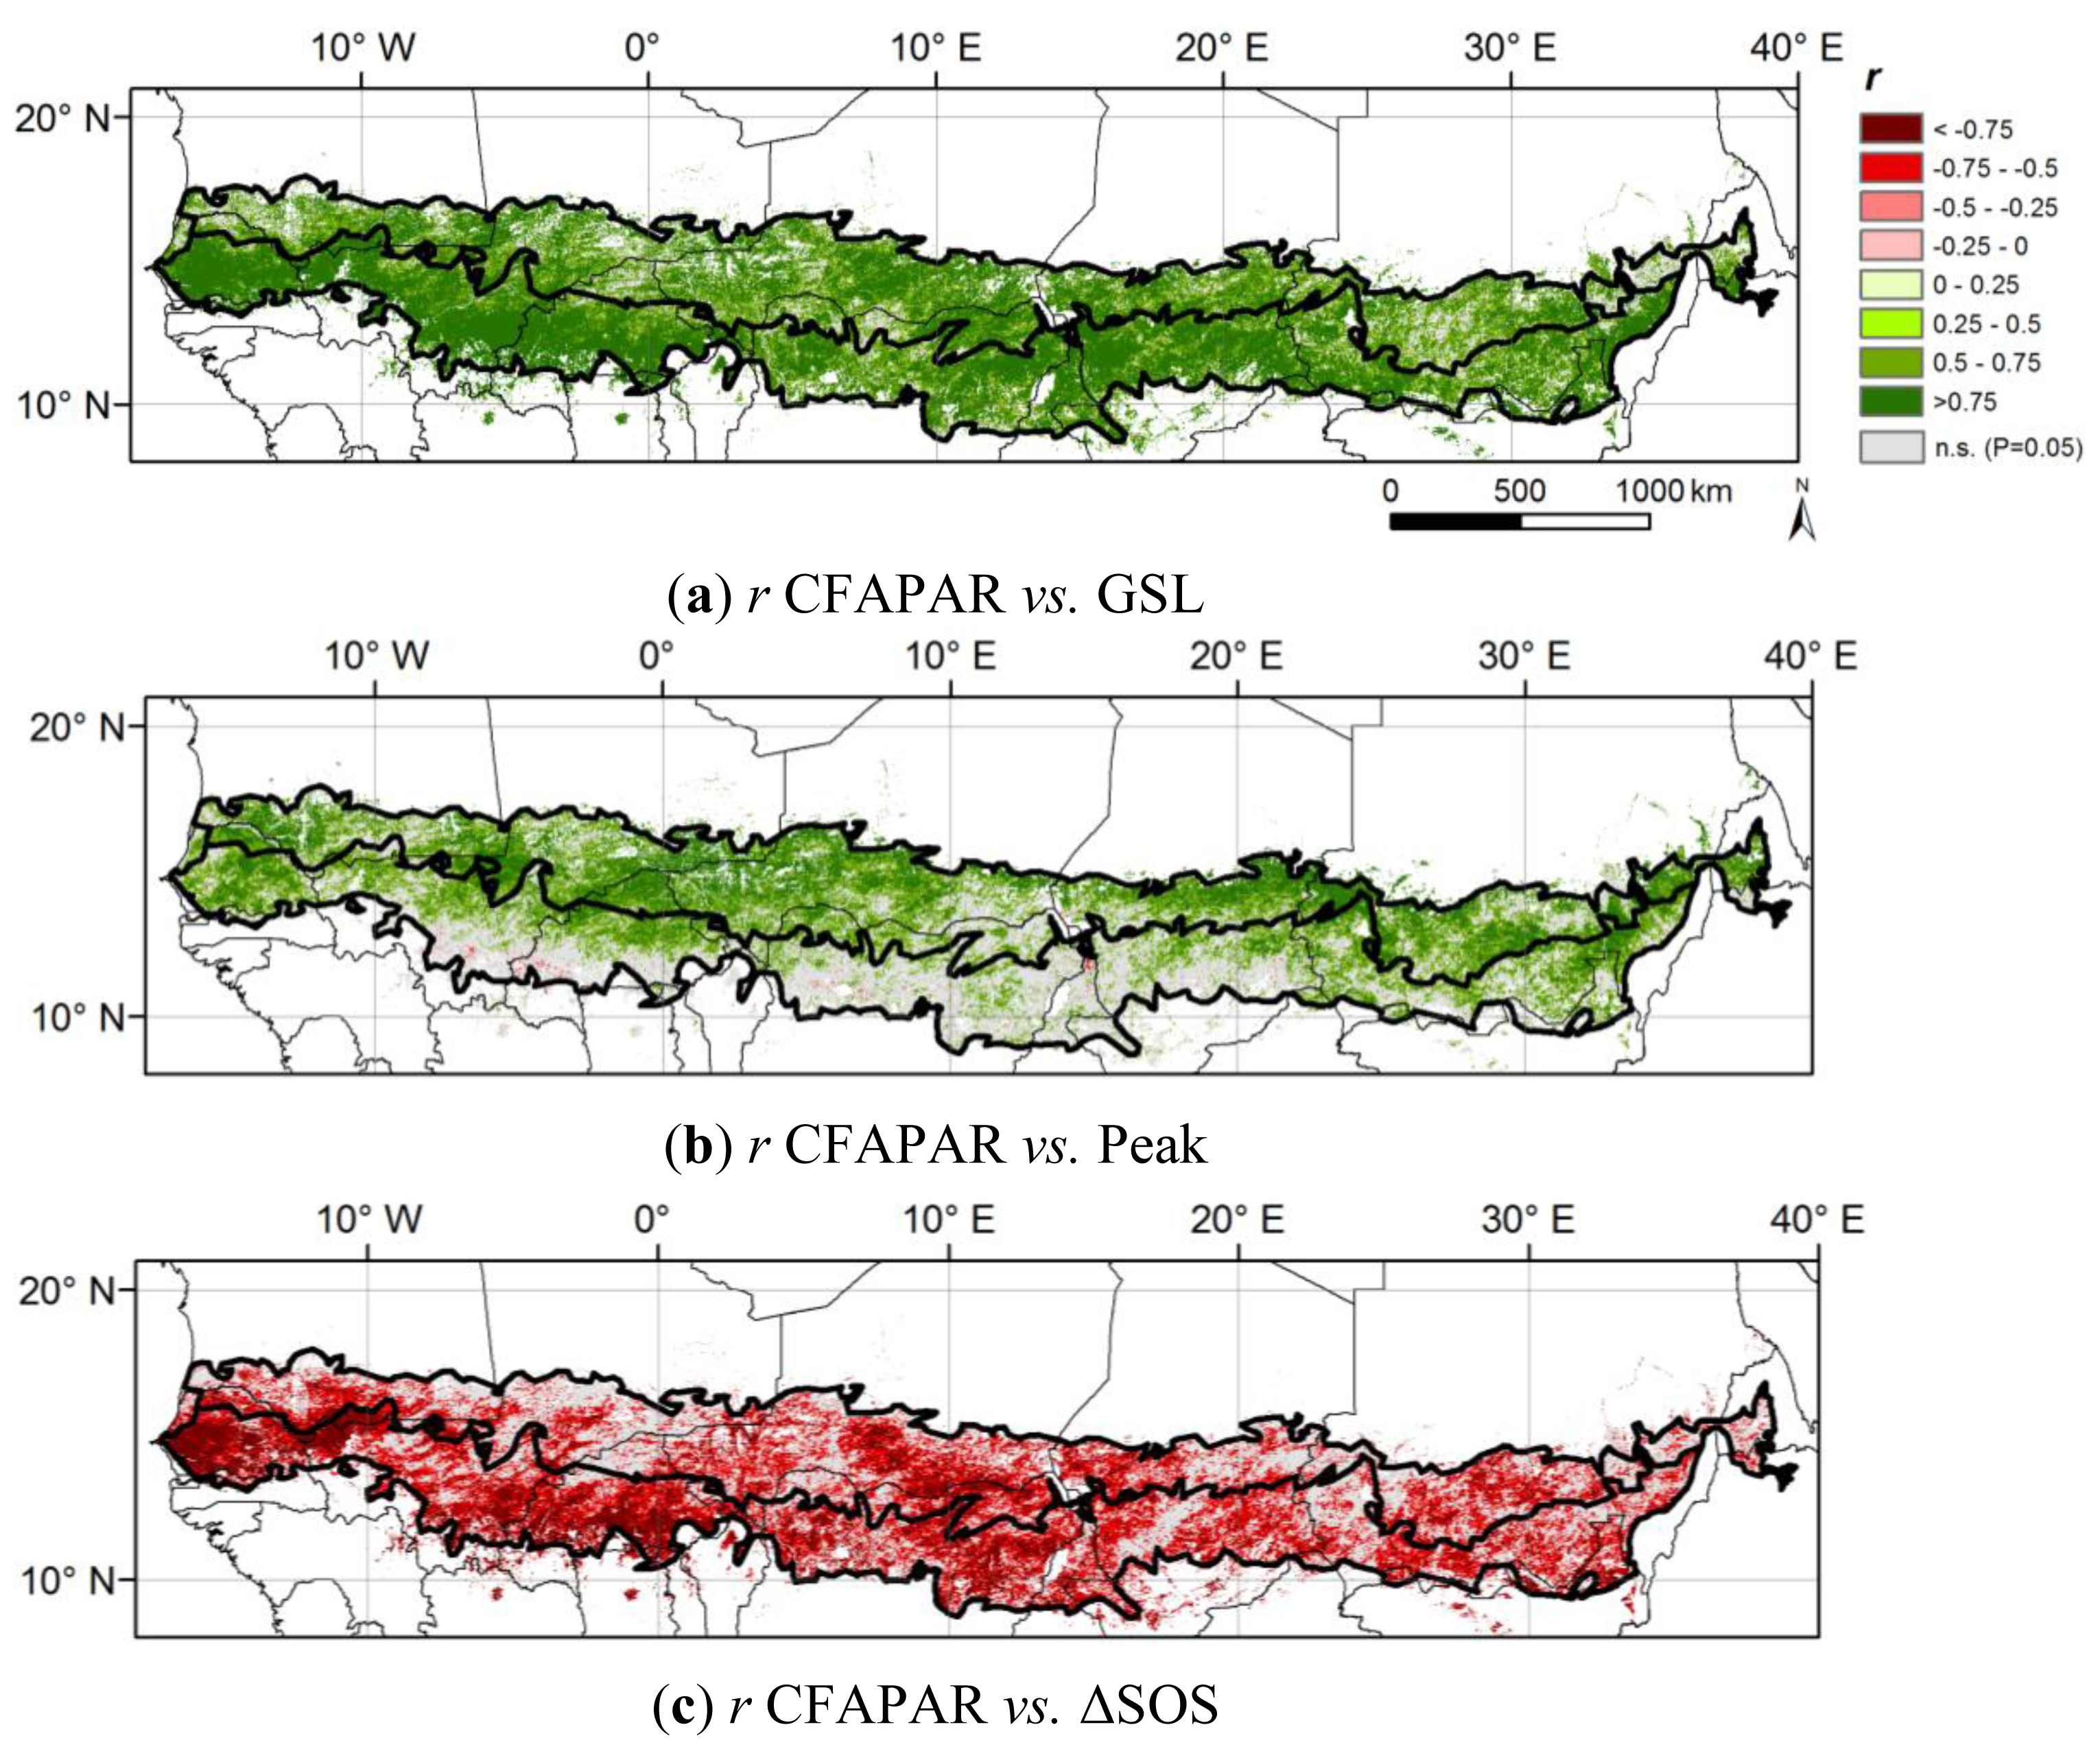
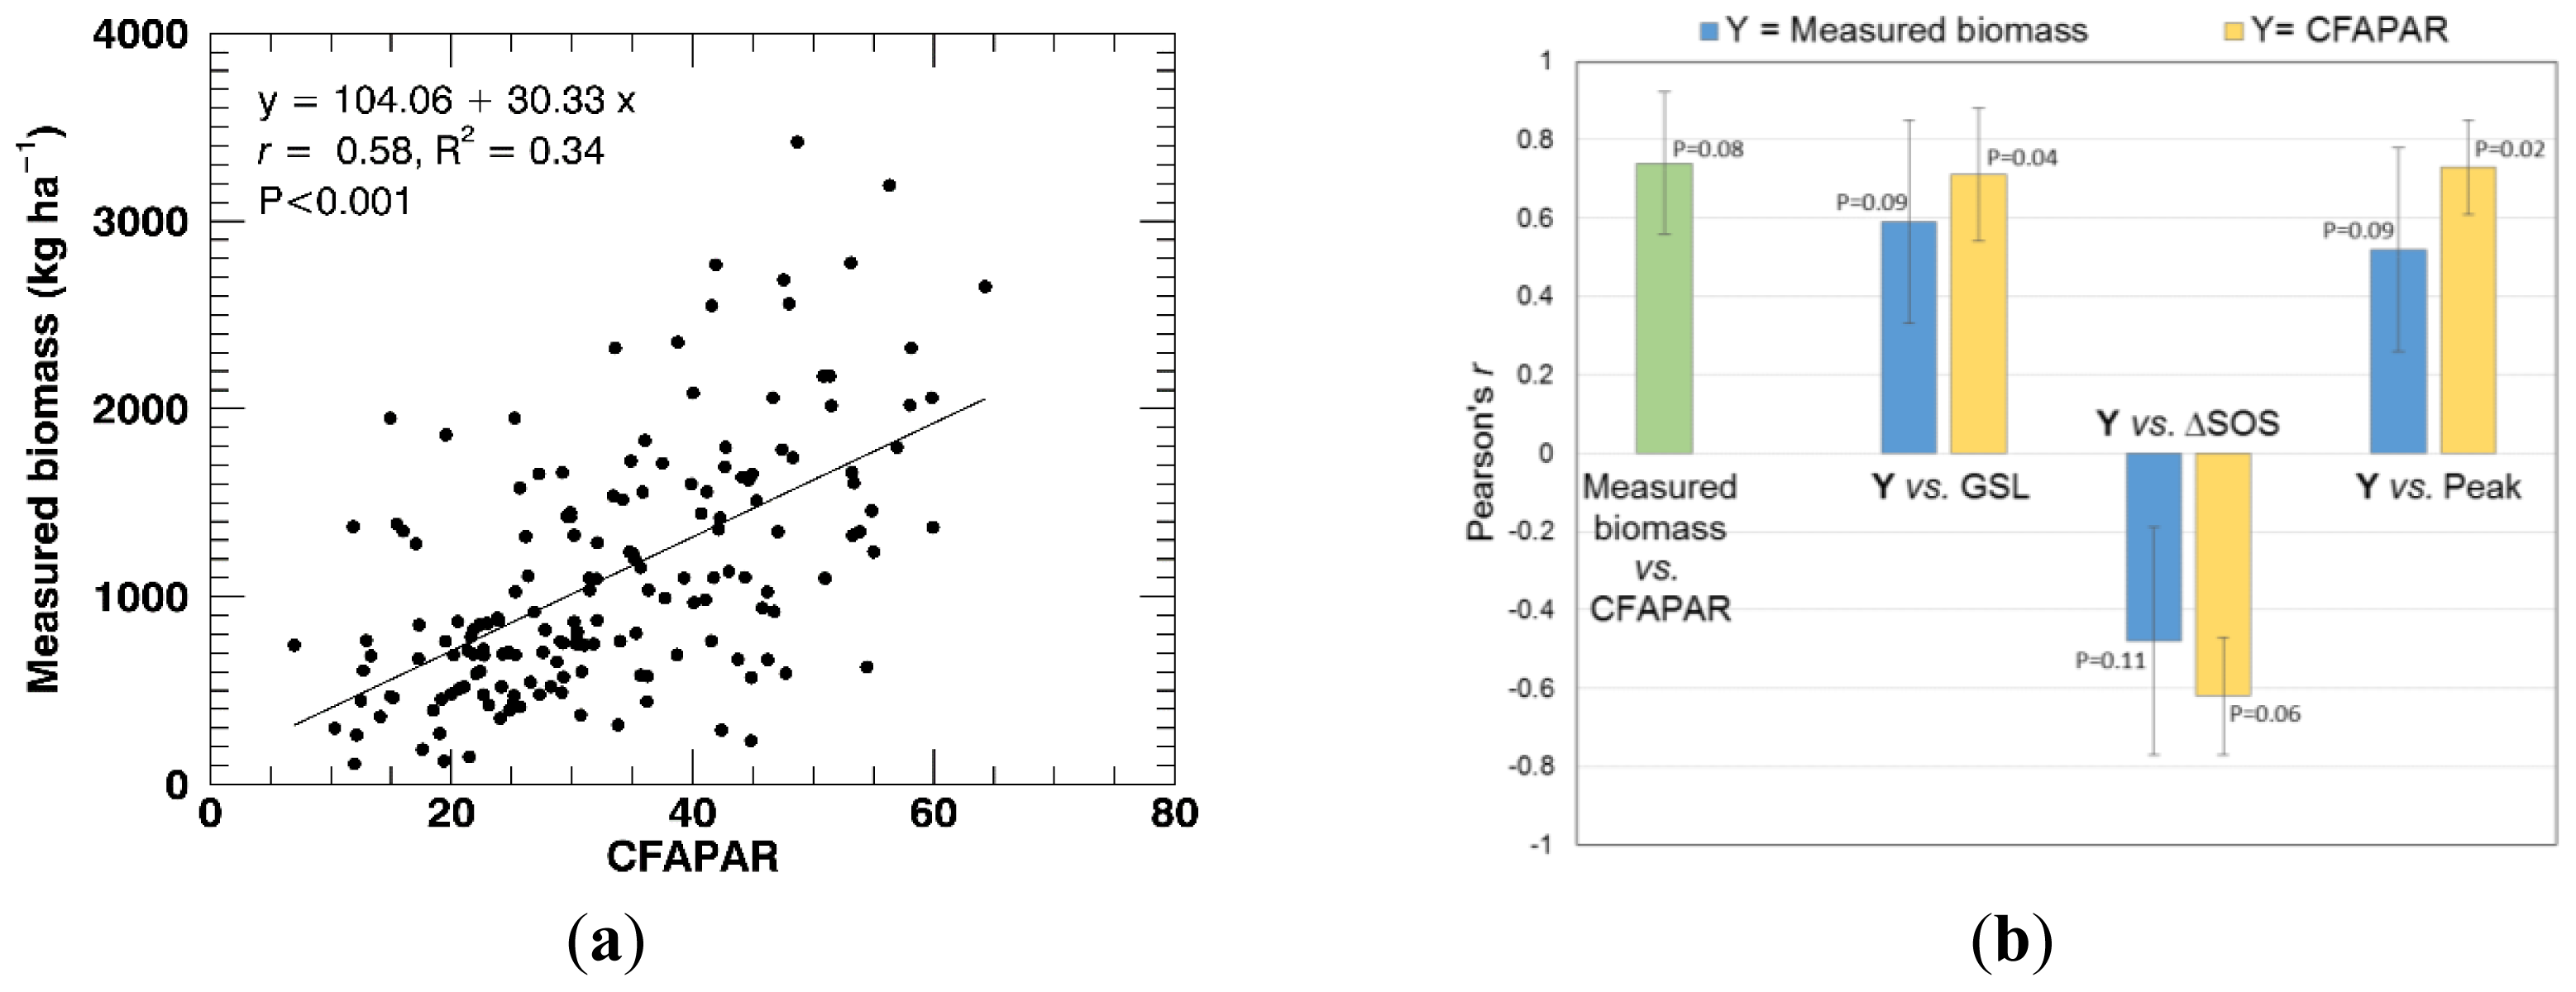
3.2. Correlation of CFAPAR with Phenological Variables

The analysis of the spatial patterns of mean phenology of Section 3.1 highlights the presence of a strong spatial correlation among the phenological variables. In this section, we are interested in testing whether the correlation between CFAPAR and the phenological variables holds in time, as well, i.e., where and to what extent the seasonal CFAPAR at a given location can be explained by a variation in one or more key phenological parameters.
Figure 3 shows the coefficient of determination of the linear regression of CFAPAR against GSL, Peak value and ΔSOS as an RGB color composite. The dominance of red and magenta colors, especially in the southern agriculture band, highlights the importance of GSL and SOS. However, in large areas in the northern grassland band, Peak, i.e., the maximum biomass development attained during the season, is the most important factor (as shown by the dominance of greenish colors).
Figure 4 shows separately the correlation coefficients of the three variables considered with CFAPAR (only pixels with significant regression at the 0.05 p-level are mapped). A positive correlation with GSL holds for most of the Sahel (Figure 4a). This finding is in agreement with the general expectation that longer growing seasons correspond to higher biomass production levels [12], and with previous studies relating crop production [62] and rangeland production [63] to GSL in the region.
The correlation with GSL is weaker in the northern grassland band where Peak also plays a major role (Figure 4b) and is positively correlated with CFAPAR. This result is in agreement with Eklundh and Olsson [64], Heumann et al. [35] and Dardel et al. [38], who found that the re-greening trend observed in northern Sahel (a positive NDVI temporal trend in these studies) could be mainly explained by an increase in NDVI seasonal amplitude. The widespread absence of a significant correlation between the vegetation production proxy and Peak in the agricultural band raises questions about the general reliability of using the seasonal maximum of a remote sensing indicator as a suitable proxy of final crop yield, as is done in many studies [8].
The anomaly in SOS is negatively correlated with CFAPAR (Figure 4c) over large areas of the region, meaning that a delay in SOS is significantly associated with a reduction in CFAPAR. This correlation is more widespread and stronger in the southern agricultural band rather than in the northern grasslands: the percentage of pixels showing a significant relationship (at the 0.05 p-level) between ΔSOS and CFAPAR is 66% in the agricultural band and 50% in the grassland band. In addition, taking into account only significant pixels, the mean absolute correlation is significantly higher (0.01 p-level) in the agricultural band (r = −0.71) than in the grassland band (r = −0.67). On the contrary, Peak is more important in the grassland band (76% of pixels with significant correlation, mean r = 0.75) than in cropland band (42% of pixels with significant correlation, mean r = 0.66).
These findings show that besides the ubiquitous importance of GSL (grassland: 79% of pixels with significant correlation, mean r = 0.75; cropland: 91% of pixels with significant correlation, mean r = 0.8), biomass production in the more arid grassland band in the north is sensitive to the maximum greenness the vegetation attained given the limited water availability and, to a lesser degree, to the timing of vegetation onset (and presumably, to the timing of rainfall).
On the contrary, in the southern band, where croplands are more widespread and where the growing season is generally longer, the timing of SOS appears to be more critical for biomass production and promising as an early indicator of seasonal performance. In this area, crops are sown as soon as enough precipitation is received for effective crop growth; late sowing delays plant growth and may prevent full biomass development before flowering.
It is worth noting that exceptions to this behavior are not infrequent: no significant correlation is found between ΔSOS and CFAPAR in scattered and large areas of the region. In such areas, where the timing of season start has no effect on seasonal production, vegetation monitoring and biomass production forecast should not be based on SOS. At the same time, this finding questions the reliability of the traditional approach using the anomaly of a remote sensing indicator (e.g., NDVI) to assess vegetation status, as a delay in SOS leads to a negative anomaly during the green-up period without any actual effect on final production in these areas where no significant correlation is found between ΔSOS and CFAPAR.
By limiting the analysis to the pixels showing a significant correlation between ΔSOS and CFAPAR, we can highlight the influence of the SOS delay on the final biomass production of each single pixel. Figure 5 shows the variation in CFAPAR per unit variation in SOS (i.e., the CFAPAR decrease associated with a one-day delay in SOS), expressed in terms of the percentage of the pixel-level mean CFAPAR value. Despite the fact that ΔSOS is more strongly correlated with CFAPAR in the southern agricultural band, the relative impact of SOS variation is higher in the north, because CFAPAR and GSL are reduced from south to north (see Figure 2). In other words, the annual production of the herbaceous dominated areas in the north, characterized by a short pulse of vegetation growth, is more susceptible to changes in SOS, although not in a spatially-consistent manner.

3.3. Consistency Check with Ground Measurements

Figure 6a shows the correlation between field measurements of herbaceous dry biomass in Senegal and CFAPAR (r = 0.58). The relationship is significant (p < 0.001) and corroborates our assumption that the CFAPAR can be used as proxy of biomass production. However, a relevant scatter is present, and the total biomass variance (i.e., temporal and spatial variability together) explained by the linear regression is limited to 34%.
The average correlation between measured biomass and CFAPAR at each site (Figure 6b) represents the temporal component of the overall correlation shown in Figure 6a, where data points of different years and locations are pooled together. This average temporal correlation is increased (r = 0.74, Figure 6b) with respect to the overall one, indicating that the relationship between measured biomass and CFAPAR holds at the pixel level and it is degraded when different locations are pooled together. This fact does not represent a major concern with respect to the correlations presented in Section 3.2, as the analysis was performed at the pixel level as well.
The reduction in sample size available for the regression analyses shown in Figure 6a,b (n = 167 for the global regression and n = 3 to 7 for the site-level regressions, respectively) contributes toward explaining the increase of the average p-value of the site-level regressions of measured biomass vs. CFAPAR, as compared to the global regression. Nevertheless, Figure 6b shows that the correlation sign and strength between the variables and CFAPAR agrees with that of the same variables and measured biomass. Even if geographically limited to the Matam region in Senegal, this consistency check adds some confidence to our phenological analysis at the Sahel level.
The lower correlation found when comparing the RS-derived variables to measured biomass production rather than to the RS-derived CFAPAR may be explained by the fact that CFAPAR is computed over the full growing season (i.e., EOS is determined for each season), whereas field measurements are performed in the proximity of the actual end of the season, at some arbitrary day in October (the exact date may change site by site, and it is not available). The reduced statistical significance of the relationship between RS-derived variables and measured biomass can be partially explained by the smaller sample size available for the two type of regressions (n = 3 to 7 when using measured biomass and n = 15 when using CFAPAR). Other causes of disagreement between CFAPAR and field measured biomass may include: spatial mismatch between the RS footprint (3 × 3 pixels) and the field transect; and possible biomass removal by animal grazing (undetected by single end-of-season biomass field measurements).

4. Conclusions

We retrieved key phenological and maximum productivity variables from a 15-year time series of SPOT-VEGETATION Fraction of Absorbed Photosynthetically Active Radiation (FAPAR) using a model-fit approach, and we determined their correlation with a proxy of seasonal biomass production (CFAPAR, the cumulative FAPAR during the growing season). Our analysis over the entire Sahel region shows that: (i) the growing season length (GSL) exhibits the strongest correlation with CFAPAR over the entire study area (mean r = 0.78); (ii) the correlation with start of season (SOS) is stronger and more widespread in the agricultural band in the south (mean r = −0.71); whereas, (iii) the indicator of the maximum productivity attained during the growing season (Peak) is more important in the northern and dryer grassland band (mean r = 0.75).
In order to increase the confidence in the analysis, we tested these correlations against field measurements of herbaceous biomass production in Senegal. For this specific dataset, we verified that: (i) there is a significant relationship between actual biomass production and CFAPAR; and (ii) the correlation between phenological variables and CFAPAR is consistent with the correlation between such variables and measured biomass.
Our results show that there is potential for the use of the SOS anomaly, which is detectable during the first stages of vegetation development, as an early warning indicator of end-of-season biomass production and, hence, crop yield. The use of Peak, detectable in a later stage of the season, appears to have more potential for monitoring grassland rather than cropland biomass production.
However, a large heterogeneity exists in the strength of the relation between CFAPAR, on the one hand, and SOS and Peak, on the other. This implies that both variables should be used with care as indicators of seasonal pasture production or crop yield, that is, only where a significant correlation could be ascertained. Under this condition, the use of such phenological variables can provide relevant early warning information and improve risk management systems.
Further analysis at the local level is needed to identify the characteristics and processes that determine the spatial patterns of the observed correlations, as well as to further validate the results in different areas of the Sahel.

Acknowledgments

The authors thank Ferdinando Urbano and Ana Perez-Hoyos of the Joint Research Centre of the European Commission for their support in the preparation of land cover information.
  • Author ContributionsMichele Meroni designed the research, processed the remote sensing data and drafted the manuscript. Michel Verstraete significantly contributed to the development of the phenology retrieval algorithm. Felix Rembold and Rene Gommes supported the interpretation of the correlation analysis. Anne Schucknecht and Gora Beye assisted in the analysis of ground measurements and in the validation exercise. All authors revised the manuscript and contributed to the discussion of the results.

Conflicts of Interest

The authors declare no conflict of interest.

References

  1. Dai, A. Drought under global warming: A review. Wiley Interdiscip. Rev.: Clim. Chang 2011, 2, 45–65. [Google Scholar]
  2. FAO—Food and Agriculture Organization of the United Nations, The Food and Nutrition Crisis in the Sahel, Urgent Action to Support the Resilience of Vulnerable Populations; Technical Report; FAO: Rome, Italy, 2012.
  3. Nicholson, S.E. The West African Sahel: A review of recent studies on the rainfall regime and its interannual variability. ISRN Meteorol 2013, 2013, 453521:1–453521:32. [Google Scholar]
  4. Atzberger, C. Advances in remote sensing of agriculture: Context description, existing operational monitoring systems and major information needs. Remote Sens 2013, 5, 949–981. [Google Scholar]
  5. Boyd, E.; Cornforth, R.J.; Lamb, P.J.; Tarhule, A.; Lélé, M.I.; Brouder, A. Building resilience to face recurring environmental crisis in African Sahel. Nat. Clim. Chang 2013, 3, 631–637. [Google Scholar]
  6. Brown, M.E. Famine Early Warning Systems and Remote Sensing Data; Springer Verlag: Berlin/Heidelberg, Germany, 2008. [Google Scholar]
  7. Rouse, J.W.; Haas, R.H.; Schell, J.A.; Deering, D.W.; Harlan, J.C. Monitoring the Vernal Advancements and Retro Gradation of Natural Vegetation; NASA: Greenbelt, MD, USA, 1974; p. 371. [Google Scholar]
  8. Rembold, F.; Atzberger, C.; Savin, I.; Rojas, O. Using low resolution satellite imagery for yield prediction and yield anomaly detection. Remote Sens 2013, 5, 1704–1733. [Google Scholar]
  9. Meroni, M.; Verstraete, M.M.; Rembold, F.; Urbano, F.; Kayitakire, F. A phenology-based method to derive biomass production anomaly for food security monitoring in the Horn of Africa. Int. J. Remote Sens 2014, 35, 2471–2492. [Google Scholar]
  10. Meroni, M.; Fasbender, D.; Kayitakire, F.; Pini, G.; Rembold, F.; Urbano, F.; Verstraete, M. Early detection of production deficit hot-spots in semi-arid environment using FAPAR time series and a probabilistic approach. Remote Sens. Environ 2014, 142, 57–68. [Google Scholar]
  11. Rojas, O.; Vrieling, A.; Rembold, F. Assessing drought probability for agricultural areas in Africa with coarse resolution remote sensing imagery. Remote Sens. Environ 2011, 115, 343–352. [Google Scholar]
  12. Richardson, A.D.; Keenan, T.F.; Migliavacca, M.; Ryu, Y.; Sonnentag, O.; Toomey, M. Climate change, phenology, and phenological control of vegetation feedbacks to the climate system. Agric. For. Meteorol 2013, 169, 156–173. [Google Scholar]
  13. Baldocchi, D. Breathing of the terrestrial biosphere: Lessons learned from a global network of carbon dioxide flux measurement systems. Aust. J. Bot 2008, 56, 1–26. [Google Scholar]
  14. Churkina, G.; Schimel, D.; Braswell, B.H.; Xiao, X.M. Spatial analysis of growing season length control over net ecosystem exchange. Glob. Chang. Biol 2005, 11, 1777–1787. [Google Scholar]
  15. Ma, S.; Baldocchi, D.D.; Xu, L.; Hehn, T. Inter-annual variability in carbon dioxide exchange of an oak/grass savanna and open grassland in California. Agric. For. Meteorol 2007, 147, 157–171. [Google Scholar]
  16. Richardson, A.D.; Black, T.A.; Ciais, P.; Delbart, N.; Friedl, M.A.; Gobron, N.; Hollinger, D.Y.; Kutsch, W.L.; Longdoz, B.; Luyssaert, S.; et al. Influence of spring and autumn phenological transitions on forest ecosystem productivity. Philos. Trans. R. Soc. B: Biol. Sci 2010, 365, 3227–3246. [Google Scholar] [Green Version]
  17. White, M.A.; Nemani, R.R. Real-time monitoring and short-term forecasting of land surface phenology. Remote Sens. Environ 2006, 104, 43–49. [Google Scholar]
  18. Zhang, X.; Golberg, M.D.; Yu, Y. Prototype for monitoring and forecasting fall foliage coloration in real time from satellite data. Agric. For. Meteorol 2012, 158–159, 21–29. [Google Scholar]
  19. Brown, M.E.; de Beurs, K.M.; Vrieling, A. The response of African land surface phenology to large scale climate oscillations. Remote Sens. Environ 2010, 114, 2286–2296. [Google Scholar]
  20. Proud, S.M.; Rasmussen, L.V. The influence of seasonal rainfall upon Sahel vegetation. Remote Sens. Lett 2011, 2, 241–249. [Google Scholar]
  21. Brown, J.; Wardlow, B.; Tadesse, T.; Hayes, M.; Reed, B. The Vegetation Drought Response Index (VegDRI): A new integrated approach for monitoring drought stress in vegetation. GISci. Remote Sens 2008, 45, 16–46. [Google Scholar]
  22. Wu, J.; Zhou, L.; Liu, M.; Zhang, J.; Leng, S.; Diao, C. Establishing and assessing the Integrated Surface Drought Index (ISDI) for agricultural drought monitoring in mid-eastern China. Int. J. Appl. Earth Obs. Geoinf 2013, 23, 397–410. [Google Scholar]
  23. Xu, L.K.; Baldocchi, D.D. Seasonal variation in carbon dioxide exchange over a Mediterranean annual grassland in California. Agric. For. Meteorol 2004, 123, 79–96. [Google Scholar]
  24. Peñuelas, J.; Filella, I.; Zhang, X.; Llorens, L.; Ogaya, R.; Lloret, F.; Comas, P.; Estiarte, M.; Terrades, J. Complex spatiotemporal phenological shifts as a response to rainfall changes. New Phytol 2004, 161, 837–846. [Google Scholar]
  25. UNEP and ICRAF—United Nations Environment Programme and Word Agroforestry Centre, Climate Change and Variability in the Sahel Region: Impacts and Adaptation Strategies in the Agricultural Sector; Report 44, Technical Report; UNEP and ICRAF: Nairobi, Kenya, 2006.
  26. Buerkert, A.; Moser, M.; Kumar, A.K.; Furst, P.; Becker, K. Variation in grain quality of peral millet from Sahelian West Africa. Field Crop Res 2001, 69, 1–11. [Google Scholar]
  27. Ahmed, M.M.; Sanders, J.H.; Nell, W.T. New sorghum and millet cultivar introduction in Sub-Saharan Africa: Impacts and research agenda. Agric. Syst 2000, 64, 55–65. [Google Scholar]
  28. Akponikpe, P.B.I. Effect of Sowing Date on the Development and Yield of Seven Sahelian Millet Genotypes under Non-Limiting and Water Nutrient Supply: Experiment and Modelling. Ph.D. Dissertation, Université Catholique de Louvain, Louvain-la-Neuve, Belgium, 2008. [Google Scholar]
  29. FAO and WFP—Food and Agriculture Organization of the United Nations and World Food Programme, Crop and Food Security Assessment Mission to South Sudan; Special Report, Technical Report; FAO and WFP: Rome, Italy, 2012.
  30. Feng, X.; Porporato, A.; Rodriguez-Iturbe, I. Changes in rainfall seasonality in the tropics. Nat. Clim. Chang 2013, 3, 1–5. [Google Scholar]
  31. De Jong, R.; Verbesselt, J.; Zeiles, A.; Shaepman, M.E. Shift in global vegetation activity trends. Remote Sens 2013, 5, 1117–1133. [Google Scholar]
  32. Vrieling, A.; de Leeuw, J.; Said, M.Y. Length of growing period over Africa: Variability and trends from 30 years of NDVI time series. Remote Sens 2013, 5, 982–1000. [Google Scholar]
  33. IPCC—Intergovernmental Panel on Climate Change, Climate Change 2007; Synthesis Report; Core Writing Team; Pachauri, R.K.; Reisinger, A. (Eds.) IPCC: Geneva, Switzerland, 2007; p. 104.
  34. Weltzin, J.F.; Loik, M.E.; Schwinning, S.; Williams, D.G.; Fay, P.A.; Haddad, B.M.; Harte, J.; Huxman, T.E.; Knapp, A.K.; Lin, G.; et al. Assessing the response of terrestrial ecosystems to potential changes in precipitation. BioScience 2003, 53, 941–952. [Google Scholar]
  35. Heumann, B.W.; Seaquist, J.W.; Eklundh, L.; Jönsson, P. AVHRR derived phenological change in the Sahel and Soudan, Africa, 1982–2005. Remote Sens. Environ 2007, 108, 385–392. [Google Scholar]
  36. Julien, Y.; Sobrino, J.A. Global land surface phenology trends from GIMMS database. Int. J. Remote Sens 2009, 30, 3495–3513. [Google Scholar]
  37. White, M.A.; Thornton, P.E.; Running, S.W. A continental phenology model for monitoring vegetation responses to interannual climatic variability. Glob. Biogeochem. Cycles 1997, 11, 217–234. [Google Scholar]
  38. Dardel, C.; Kergoat, L.; Hiernaux, P.; Mougine, E.; Grippa, M.; Tucker, C.J. Re-greening of Sahel: 30 Years of remote sensing data and field observations (Mali, Niger). Remote Sens. Environ 2014, 140, 350–364. [Google Scholar]
  39. Boschetti, M.; Nutini, F.; Brivio, P.A.; Bartholomé, E.; Stroppiana, D.; Hosilo, A. Identification of environmental anomaly hot spots in West Africa from time series of NDVI and rainfall. ISPRS J. Photogramm. Remote Sens 2013, 78, 26–40. [Google Scholar]
  40. Fensholt, R.; Rasmussen, K. Analysis of trends in the Sahelian “rain-use efficiency” using GIMMS NDVI, RFE and GPCP rainfall data. Remote Sens. Environ 2010, 115, 438–451. [Google Scholar]
  41. Fensholt, R.; Langanke, T.; Rasmussen, K.; Reenberg, A.; Prince, S.D.; Tucker, C.; Scholes, R.J.; Le, Q.B.; Bondeau, A.; Eastman, R.; et al. Greenness in semi-arid areas across the globe 1981–2007—An earth observing satellite based analysis of trends and drivers. Remote Sens. Environ 2012, 121, 144–158. [Google Scholar]
  42. Giannini, A.; Biasutti, M.; Verstraete, M.M. A climate model-based review of drought in the Sahel: Desertification, the re-greening and climate change. Glob. Planet. Chang 2008, 64, 119–128. [Google Scholar]
  43. Groten, S.M.E.; Ocatre, R. Monitoring the length of the season with NOAA. Int. J. Remote Sens 2002, 23, 2797–2815. [Google Scholar]
  44. De Beurs, K.M.; Henebry, G.M. Spatio-Temporal Statistical Methods for Modelling Land Surface Phenology. In Phenological Research; Hudson, I.L., Keatley, M.R., Eds.; Springer Science: London, UK, 2010; pp. 77–208. [Google Scholar]
  45. An, N.; Price, K.P.; Blair, J.M. Estimating above-ground net primary productivity of the tallgrass prairie ecosystem of the Central Great Plains using AVHRR NDVI. Int. J. Remote Sens 2013, 34, 3717–3753. [Google Scholar]
  46. Hanan, N.P.; Prince, S.D.; Begue, A. Modelling vegetation primary production during HAPEX-Sahel using production efficiency and canopy conductance model formulations. J. Hydrol 1997, 189, 651–675. [Google Scholar]
  47. Fensholt, R.; Sandholt, I.; Rasmussen, M.S.; Stisen, S.; Diouf, A. Evaluation of satellite based primary production modelling in the semi-arid Sahel. Remote Sens. Environ 2006, 105, 173–188. [Google Scholar]
  48. Jung, M.; Verstraete, M.; Gobron, N.; Reichstein, M.; Papale, D.; Bondeau, A.; Robustelli, M.; Pinty, B. Diagnostic assessment of European gross primary production. Glob. Chang. Biol 2008, 14, 2349–2364. [Google Scholar]
  49. Mbow, C.; Fensholt, R.; Rasmussen, K.; Diop, D. Can vegetation productivity be derived from greenness in a semi-arid environment? Evidence from ground-based measurements. J. Arid Environ 2013, 97, 56–65. [Google Scholar]
  50. Tucker, C.J.; Vanpraet, C.L.; Sharman, M-J.; van Ittersum, G. Satellite remote sensing of total herbaceous biomass production in the Senegalese Sahel: 1980–1984. Remote Sens. Environ 1985, 17, 233–249. [Google Scholar]
  51. Funk, C.C.; Budde, M.E. Phenologically-tuned MODIS NDVI-based production anomaly for Zimbabwe. Remote Sens. Environ 2009, 113, 115–125. [Google Scholar]
  52. Lobell, D.B.; Asner, G.P.; Ortiz-Monasterio, J.I.; Benning, T.L. Remote sensing of regional crop production in the Yaqui Valley, Mexico: Estimates and uncertainties. Agric. Ecosyst. Environ 2003, 94, 205–220. [Google Scholar]
  53. Meroni, M.; Verstraete, M.; Marinho, M.; Sghaier, N.; Leo, O. Remote sensing based yield estimation in a stochastic framework—Case study of Tunisia. Remote Sens 2013, 5, 539–557. [Google Scholar]
  54. Stige, L.C.; Stave, J.; Chan, K.-S.; Cianelli, L.; Pettorelli, N.; Glantz, M.; Herren, H.R.; Stenseth, N.C. The effect of climate variation on agro-pastoral production in Africa. PNAS 2006, 103, 3049–3053. [Google Scholar]
  55. Bartholomé, E.M.; Belward, A.S. GLC2000: A new approach to global land cover mapping from Earth Observation data. Int. J. Remote Sens 2005, 26, 1959–1977. [Google Scholar]
  56. Olson, D.M.; Dinerstein, E.; Wikramanayake, E.D.; Burgess, N.D.; Powell, G.V.N.; Underwood, E.C.; D’Amico, J.A.; Itoua, I.; Strand, H.E.; Morrison, J.C.; et al. Terrestrial ecoregions of the world: A new map of life on Earth. Bioscience 2001, 51, 933–938. [Google Scholar]
  57. Prince, S.D.; Goward, S.N. Global primary production: A remote sensing approach. J. Biogeogr 1995, 22, 815–835. [Google Scholar]
  58. Weiss, M.; Baret, F.; Eerens, H.; Swinnen, E. FAPAR over Europe for the Past 29 Years: A Temporally Consistent Product Derived from AVHRR and VEGETATION Sensor. Proceedings of the Third RAQRS Workshop, Valencia, Spain, 27 September–1 October 2010; pp. 428–433.
  59. Rahman, H.; Dedieu, G. SMAC: A simplified method for the atmospheric correction of satellite measurements in the spectrum. Int. J. Remote Sens 1994, 15, 123–143. [Google Scholar]
  60. Diouf, A.; Lambin, E.F. Monitoring land-cover changes in semi-arid regions: Remote sensing data and field observation in the Ferlo, Senegal. J. Arid Environ 2001, 48, 129–148. [Google Scholar]
  61. Butt, B.; Turner, M.D.; Singh, A.; Brotten, L. Use of MODIS NDVI to evaluate changing latitudinal gradients of rangeland phenology in Sudano-Sahelian West Africa. Remote Sens. Environ 2011, 115, 3367–3376. [Google Scholar]
  62. Somé, L.; Sivakumar, M.V.K. Analyse de la Longueur de la Saison Culturale en Fonction de la Date de Début de Pluies au Burkina Faso; Compte rendu des travaux No. 1; Division du Sol et Agroclimatologie, Institut d’Etudes et de Recherches Agricoles: Ouagadougou, Burkina Faso, 1994. [Google Scholar]
  63. Townshend, J.R.G.; Justice, C.O. Analysis of the dynamics of African vegetation using the normalized difference vegetation index. Int. J. Remote Sens 1986, 7, 1435–1445. [Google Scholar]
  64. Eklundh, L.; Olsson, L. Vegetation index trends for the African Sahel 1982–1999. Geophys. Res. Lett 2003, 30, 1430–1433. [Google Scholar]
Figure 1. (a) The study area encompassing the main Sahel eco-regions. The herbaceous and cropland land covers are the union of GLC2000 (Global Land Cover 2000) herbaceous cover dominated classes (Classes 13 to 15) and cropland classes (Classes 16 to 18), respectively. Blue points in Senegal refer to the location of field measurements sites (zoom in (b)).
Remotesensing 06 05868f1
Figure 2. Average start (SOS) (a), end (EOS) (b) and length (c) of the growing season and the cumulative Fraction of Absorbed Photosynthetically Active Radiation (CFAPAR) value (d) during the growing season. Average values are computed over the set of phenological variables extracted from the FAPAR time series (n = 15, years 1998–2012). Phenological variables and CFAPAR are shown for the herbaceous and cropland land covers (other classes in white) and the five main eco-regions of the Sahel (other regions in grey).
Remotesensing 06 05868f2
Figure 3. Visualization of the correlation between CFAPAR vs. GSL, Peak value and ΔSOS in the RGB color space. The composite is based upon the coefficients of determination (R2) of the linear regression CFAPAR vs. GSL (Red), Peak (Green) and ΔSOS (Blue); no stretching is applied. Main land cover types are represented by the thick black lines (two simplified polygons, herbaceous cover in the north and crop cover in the south).
Remotesensing 06 05868f3
Figure 4. Correlation coefficient between CFAPAR and GSL (a); Peak (b); ΔSOS (c). Land cover polygons (thick black lines) are as in Figure 3. Pixels where the linear regression is not significant (n.s.) at p = 0.05 are masked in grey.
Remotesensing 06 05868f4
Figure 5. Percentage of variation of the mean seasonal biomass production proxy (CFAPAR) for a one-day anomaly in the timing of SOS. The metric is computed as the slope of the linear regression CFAPAR vs. ΔSOS expressed as a percentage of the pixel-level mean CFAPAR. Pixels where the linear regression is not significant (n.s.) at p = 0.05 are masked in grey.
Remotesensing 06 05868f5
Figure 6. (a) Linear regression statistics and scatterplot between measured biomass (years 2005–2011) and CFAPAR; (b) average of the site-level correlation coefficients and statistical significance: the green bar refers to the correlation between measured biomass and CFAPAR; the blue and yellow bars refer to the correlations of GSL, ΔSOS and Peak vs. measured biomass (blue) or CFAPAR (yellow), respectively. Error bars refer to ±1 standard deviation.
Remotesensing 06 05868f6

