Validation of Global Evapotranspiration Product (MOD16) using Flux Tower Data in the African Savanna, South Africa

 ,
,
Abstract
: Globally, water is an important resource required for the survival of human beings. Water is a scarce resource in the semi-arid environments, including South Africa. In South Africa, several studies have quantified evapotranspiration (ET) in different ecosystems at a local scale. Accurate spatially explicit information on ET is rare in the country mainly due to lack of appropriate tools. In recent years, a remote sensing ET product from the MODerate Resolution Imaging Spectrometer (MOD16) has been developed. However, its accuracy is not known in South African ecosystems. The objective of this study was to validate the MOD16 ET product using data from two eddy covariance flux towers, namely; Skukuza and Malopeni installed in a savanna and woodland ecosystem within the Kruger National Park, South Africa. Eight day cumulative ET data from the flux towers was calculated to coincide with the eight day MOD16 products over a period of 10 years from 2000 to 2010. The Skukuza flux tower results showed inconsistent comparisons with MOD16 ET. The Malopeni site achieved a poorer comparison with MOD16 ET compared to the Skukuza, and due to a shorter measurement period, data validation was performed for 2009 only. The inconsistent comparison of MOD16 and flux tower-based ET can be attributed to, among other things, the parameterization of the Penman-Monteith model, flux tower measurement errors, and flux tower footprint vs. MODIS pixel. MOD16 is important for global inference of ET, but for use in South Africa’s integrated water management, a locally parameterized and improved product should be developed.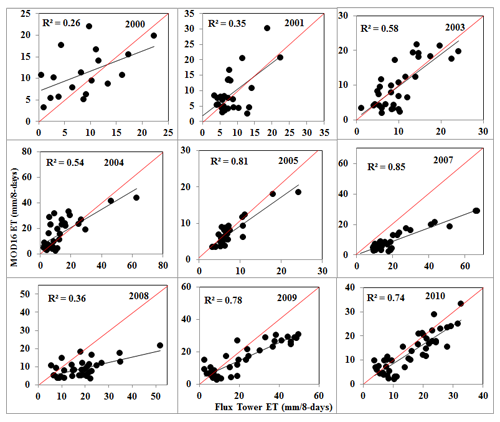
1. Introduction
Globally, water is an important resource required for the daily sustenance and survival of human beings. Water is crucial to facilitate livelihoods and economic growth, e.g., vital for the industrial and agricultural sector. Today, irrigated agriculture is the main fresh water user, accounting for about 70% of the water from lakes, rivers and ground aquifers [1]. In South Africa, almost 50% of the available surface water resource usage is attributed to agricultural activities. In essence, South Africa is a semi-arid environment, with evaporation rates exceeding the rates of precipitation by a considerable margin [2]. Therefore, it is crucial to develop methods or tools to quantify water use and availability (e.g., evapotranspiration, ET) over large spatial scales in order to inform decision makers on sustainable utilization and management of this resource. For example, the program by the South African Department of Water Affairs (DWA) to verify and validate country’s water use is critical [2] for water use license purposes, which requires information on ET, water use and river flows. This program is also linked to the legal requirement on the sustainable utilization of water resources outlined in the National Water Act (Act 36 of 1998).
ET is the second most important element of the hydrological cycle after precipitation because it facilitates the continuation of precipitation by replacing the vapor lost through condensation [3]. ET is listed as one of 48 observation priorities of water societal benefit area (Water SBA) by the Group on Earth Observation; see GEO [4,5]. GEO is an intergovernmental organization working to improve availability, access and use of earth observation to benefit society [5]. ET is also crucial for the transportation of minerals and nutrients required for plant growth; creates a beneficial cooling process to plant canopies in many climates; and influences the Earth’s energy and water balance because of the direct association with latent heat flux (LE). ET consumes large amounts of energy during the conversion of liquid water to vapor, hence playing an important role in hydrology, agriculture, climatology and meteorology. Accurate estimates of ET contribute to improved quantification of the catchment water balance and in the facilitation of decision making for sustainable water resource management [6–8].
ET is a difficult component to measure, especially in arid and semi-arid regions where the magnitude of the ET flux is relatively smaller than in wetter regions. In these areas, plants are prone to water stress and are adapted accordingly to prolonged dry conditions. ET is highly variable over space and time, depending on landscape heterogeneity, topography, climate, vegetation type, soil properties, management and environmental constraints [7,9]. The conventional point-based ET estimation methods do not capture large spatial scale variability of ET and are very difficult to obtain due to time and cost constraints. These methods include (i) direct measurements with porometry and lysimeters [10]; (ii) atmospheric measurements, including energy balance and micrometeorological techniques like Bowen ratio [11], eddy covariance [12], scintillometry [13], as well as methods based on weather data, for example; used for the calculation of the Penman-Monteith reference grass evapotranspiration (ETo) and crop coefficient [9]; (iii) soil measurements [14] and the application of the soil water balance. The in situ estimation of ET using the above techniques was successful in a number of agricultural and natural environments within South Africa, e.g., natural vegetation [15], wetlands [13] and crops [16].
Remote sensing-based techniques have the capability to estimate spatial and temporal variation of ET from catchment to global scales. Several studies reviewed different remote sensing techniques used to estimate ET [17–19]. They are classified into;
empirical methods that involve the use of statistically-derived relationships between ET and vegetation indices such as the normalized difference vegetation index (NDVI) or the enhanced vegetation index (EVI) [20–25],
residual methods of surface energy balance (single- and dual-source models) [8,26] which include the Surface Energy Balance Algorithm over Land (SEBAL) [27,28], Surface Energy Balance System (SEBS) [8,29,30] and Mapping EvapoTranspiration at high Resolution with Internalized Calibration (METRIC) [6,31,32],
physically-based methods that involve the application of the combination of Penman-Monteith [7,33,34] and Priestley-Taylor types of equations [35–39], and
Data assimilation methods adjoined to the heat diffusion equation [40] and through the radiometric surface temperature sequences [41].
Various remote sensing-based ET estimation algorithms (e.g., SEBS, SEBAL and METRIC) have been partially evaluated in South Africa [42]. Although estimates of net radiation and ET were accurate, the soil and sensible heat fluxes were more complex and challenging to determine. Furthermore, Sun et al. [43] used local flux tower data (Skukuza) to evaluate a remote sensing-based continental ET product at 3 km resolution, which was developed by combining data from the MODIS sensor and SEVIRI sensor onboard the geostationary-orbiting MSG satellite. Although the results were reasonable during the wet season, low correlations were observed during the dry season, due to factors such as, the spatial scale differences between the satellite sensor and flux tower observations. In South Africa, SEBAL was used to provide information on water use efficiency of irrigated crops, including grapes, deciduous fruits, sugarcane, and grain crops [29]. A recent study by Gibson et al. [29], discussed the use of SEBS in South Africa for various agricultural and natural systems, and finally recommended the validation of existing global ET products in South Africa to encourage their use.
Remote sensing-based global estimates of ET have been produced by different algorithms. For example, the MODerate Resolution Imaging Spectroradiometer (MODIS) MOD16 [7,34], and the EUMETSAT MSG ET product [43]. The MOD16 ET product has a spatial resolution of 1 km and is available on an eight-day, monthly and yearly basis. The EUMETSAT MSG ET product is available at 3 km spatial resolution every 30 min or daily. These products have been calibrated and validated mainly in the Northern hemisphere, with sites located in North and South America, Europe, Asia and sometimes Australia. For instance, Cleugh et al. [33] applied the Penman-Monteith algorithm and MODIS data to estimate ET for the Australian continent. Mu et al. [7,34] modified this algorithm and used flux tower data from Ameriflux stations to validate the global MOD16 product. Kim et al. [44] later validated the global product using Asiaflux stations. Jia et al. [36] evaluated spatiotemporal MODIS ET product in the Hai river basin. Inaccuracies, such as over- or underestimation, and no relationship were observed between the flux tower and MOD16 ET estimates in the above publications. Errors or uncertainties are assumed to be caused by misclassification of landcover types from the global MODIS land cover product, scaling from flux tower to landscape, and algorithm limitations. Accurate classification of land cover type is critical for ET estimation. In South Africa, the first attempt to evaluate the MOD16 ET was done by Jovanovic et al. [45], using historical in situ ET measurements. Jovanovic et al. [45] found that the MOD16 method underestimated ET, but the in situ data collected was not sufficient to evaluate remote sensing based products. Most of this in situ ET data were for small fields, not sufficient to cover a 1 km × 1 km pixel. There is a need to evaluate global remote sensing products again at long term monitoring sites in South Africa.
The main objective of this study is to evaluate the MOD16 global ET product using eddy covariance flux tower-derived ET in the savanna and woodland biome in the Kruger National Park, South Africa. Thirty-minute latent heat fluxes (LE) were acquired from the CARBOAFRICA project for Skukuza and Malopeni towers, and converted to daily ET. The flux tower-derived ET was then summed to an eight-day ET corresponding to the MOD16 ET values for comparison.
2. Materials and Methods
The historical flux tower data records from two sites in the Kruger National Park were used. The flux tower data were preprocessed to acquire daily, eight-day and monthly ET. The measured ET from the flux tower was then compared to the modelled MOD16 global ET product. We used basic statistical metrics, including the coefficient of determination, root mean square error and bias, to assess MOD16 ET against measured ET.
2.1. Study Area and Flux Tower Instrument
Two eddy covariance flux tower sites, Skukuza and Malopeni, were selected (Figure 1). From 2000 to 2005, the Skukuza flux tower was equipped with a closed path gas analyser for carbon dioxide and water, but from 2006 this changed to a Licor Li7500 open path gas analyser with a Campbell Scientific CSAT sonic anemometer. The Malopeni flux tower is equipped with a Licor Li7500 gas analyser and a Gill WindMaster Pro sonic anemometer. These flux towers contributed to the CARBOAFRICA network, a project which ran from 2007 to 2010, and was designed to contribute to the quantification, understanding and prediction of the carbon cycle and energy fluxes in Sub-Saharan Africa. Though these two sites are located in Kruger National Park, their localities present an interesting contrast in weather, soil, geology and vegetation types.
Established in 2000, the Skukuza flux tower (25.0197°S, 31.4969°E), lies at 365 m above the sea level, in an area with 547 mm/year of mean annual rainfall, which falls between November and April [46]. The annual temperature ranges between 14.5 and 29.5 °C. This site lies at the boundary of two distinct savanna vegetation types which include broad-leafed Combretum savanna and fine-leafed Acacia savanna. These contrasting savanna types occur on soils of differing texture, water holding capacity and nutrient levels, and are characterized by different physical structure, physiology and phenology [46]. These two savanna types are typical of the southern Kruger National Park, and placing the flux tower on the ecotone allows for an integrated measurement of the fluxes over these different savanna types.
The Malopeni flux tower (23.8325°S, 31.2145°E) is located in the northern part of KNP approximately 130 km north-west of Skukuza and 12 km from the town of Phalaborwa. The tower was established in 2009 on a site dominated by the broad-leaf Colophospermum mopane characteristic of a hot and dry savanna, 384 m above the sea level, with a mean annual rainfall of 472 mm/year [47]. Temperature ranges between 12.4 and 30.5 °C.
2.2. Flux Tower Data
To evaluate the global 1 km, eight-day MOD16 ET product, eddy covariance LE data from the Skukuza (2000–2010) excluding 2002 and 2006, and Malopeni (2009) flux towers were used. LE for 2002 and 2006 were excluded from the analysis, since the measurement years were incomplete. The 16 m and 7 m measurement height of Skukuza and Malopeni towers, respectively, are adequate to validate the 1 km pixel of MOD16. The size of eddy covariance source area or footprint does not only depend on instrument height [48], but also on the wind direction and velocity, atmospheric stability and the underlying surface conditions [49]. The source area or footprint modelling was not carried out because the location of the flux tower was homogeneous. The LE data observed every 30 min were MODIS-driven estimation of terrestrial latent heat flux in China based on a modified Priestley-Taylor algorithm converted to daily ET using equations presented in Mu et al. [34]. In addition, only reliable 30 min measurements were prioritized, exceeding 40 per day. The derived daily ET was further summed over eight days for each year to match the MOD16 ET product. Some of the data were excluded from analysis because of insufficient ET measurements. The number of the 30 min ET measurements per day (over 40) was prioritized in the validation process, to avoid compromising the completeness and reliability of the flux tower data. For further analysis, eight day summations were done to create monthly ET for Malopeni and Skukuza.
2.3. MOD16 Global ET Data
The MOD16 ET product with temporal resolution of eight days and spatial resolution of 1 km, were acquired for free from the University of Montana’s Numerical Terradynamic Simulation group (ftp://ftp.ntsg.umt.edu/pub/MODIS/NTSG_Products/MOD16/MOD16A2.105_MERRAGMAO/). The ET values corresponding to Skukuza from 2000–2010 and 2009 for the Malopeni sites were extracted from each pixel of the MOD16 ET images using ArcGIS 10×. The algorithm used to derive the MOD16 ET product was modified by Mu et al. [7,34], from Cleugh et al. [33]’s Penman-Monteith derived model.
2.4. Rainfall Data
The rainfall data sets were collected from the South African Weather Service (SAWS) for Skukuza and Phalaborwa rainfall stations, for the dates corresponding to the ET data. Skukuza station is approximately 20 km away from the flux tower, while Phalaborwa rainfall station is located approximately 10 km away from the Malopeni flux tower. We used rainfall data to interpret variability in ET in relation with the wetness conditions in the landscape and the response of vegetation to drought and water stress.
2.5. Data Analysis
For assessing the relationship between the MOD16 ET and flux tower derived ET, the coefficient of determination (R2), root mean square error (RMSE) (Equation (1)), bias (Equation (2)) and percent bias (PBias) (Equation (3)) were used. These statistical techniques were commonly used for comparing pairs of variables, e.g., Sun et al. [43]. The R2 was used to determine the strength of the relationship between the flux tower measured and the MOD16 modelled ET. Bias, on the other hand, is a measure of how a modelled value deviates from the true value, and indicates whether there is under- or overestimation, while the percent bias is a percentage of bias relative to the observed mean.
The RMSE, Bias and PBias were computed using the following equations:
3. Results
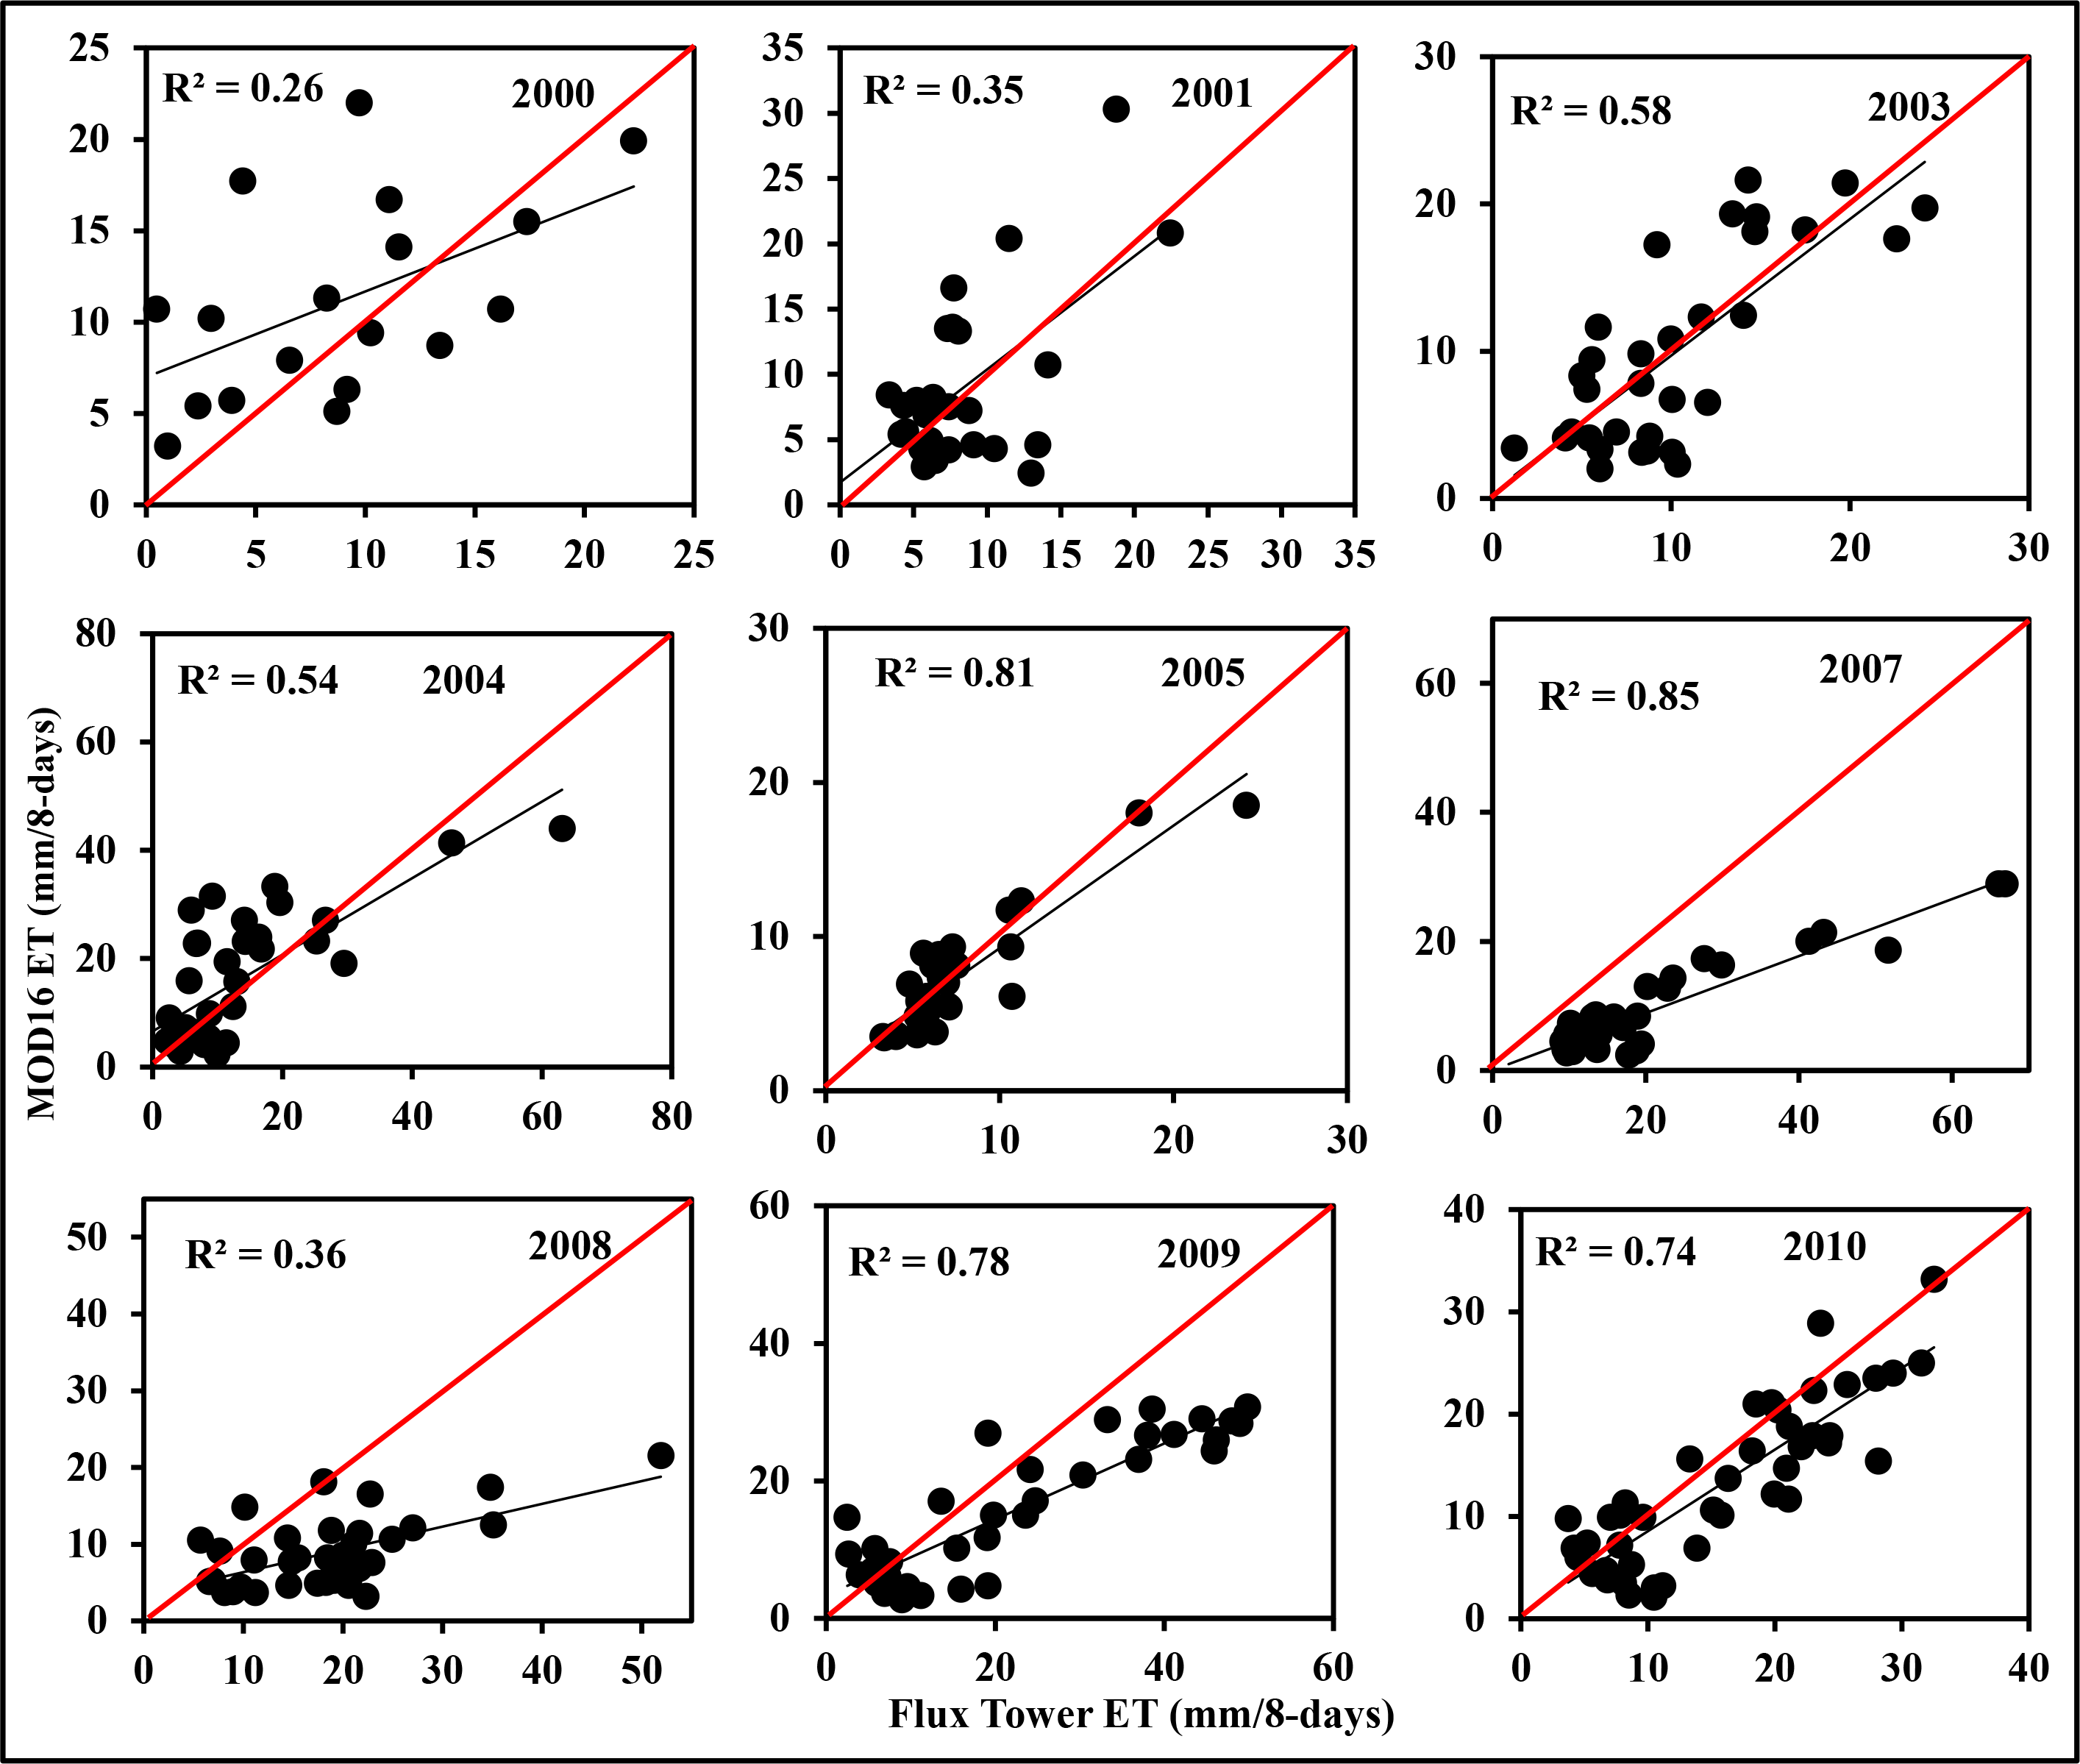
For the Skukuza site, the results show an inconsistent comparison of the flux tower and MOD16 ET values over a period of time (Table 1; Figure 2). From 2000–2010, excluding 2002 and 2006, the highest correlations were obtained in 2005 and 2007 achieving R2 of 0.81 and 0.85, respectively. According to the RMSE, 2003 (R2 = 0.58, RMSE = 3.4 mm/8-days) and 2005 (R2 = 0.81, RMSE = 2 mm/8-days) achieved the lowest values which indicate reasonable accuracy of the MOD16 ET product. In the years 2003 and 2005, the relationship is almost 1:1, with 2005 yielding the lowest RMSE, with the second highest R2. In 2009 and 2010, there is almost a complete set of measurements from the flux tower measurements (36 and 44 out 45 eight-day periods, respectively). In 2009 and 2010, the validation results (R2 = 0.78 and 0.74, respectively) are poorer compared to 2005 and 2007 based on the lower coefficient of determination, as well as the higher RMSE (7.39 and 4.3 mm/8-days). In general, Skukuza results showed that there is an overestimation of MOD16 ET in 2000 and 2004, with a Bias ranging from 2.80 to 3.08 mm/8-days (22.4–33.33% of the observed mean) (Table 1). Whilst, there was evidence of high underestimation of MOD16 ET in 2007, 2008, 2009 and 2010 with Bias ranging from −12.1 to −2.6 mm/eight-days (−55.7 to −16.44% of the observed mean). The 2003 and 2005 results, specifically, yielded low Bias and PBias which confirms the reasonable prediction of MOD16 during these years.
The eight-day and monthly comparison of the ET in Skukuza between January 2000 and December 2010 are shown in Figures 3 and 4. Flux tower ET values are generally higher than MOD16, especially during summer months (December–February), when most of the data gaps occur. During winter season (June–August), when the flux record is more complete, MOD16 and flux tower ET are closely related. This is a confirmation of the results for Bias and PBias showing systematic underestimation of ET by MODIS ET.
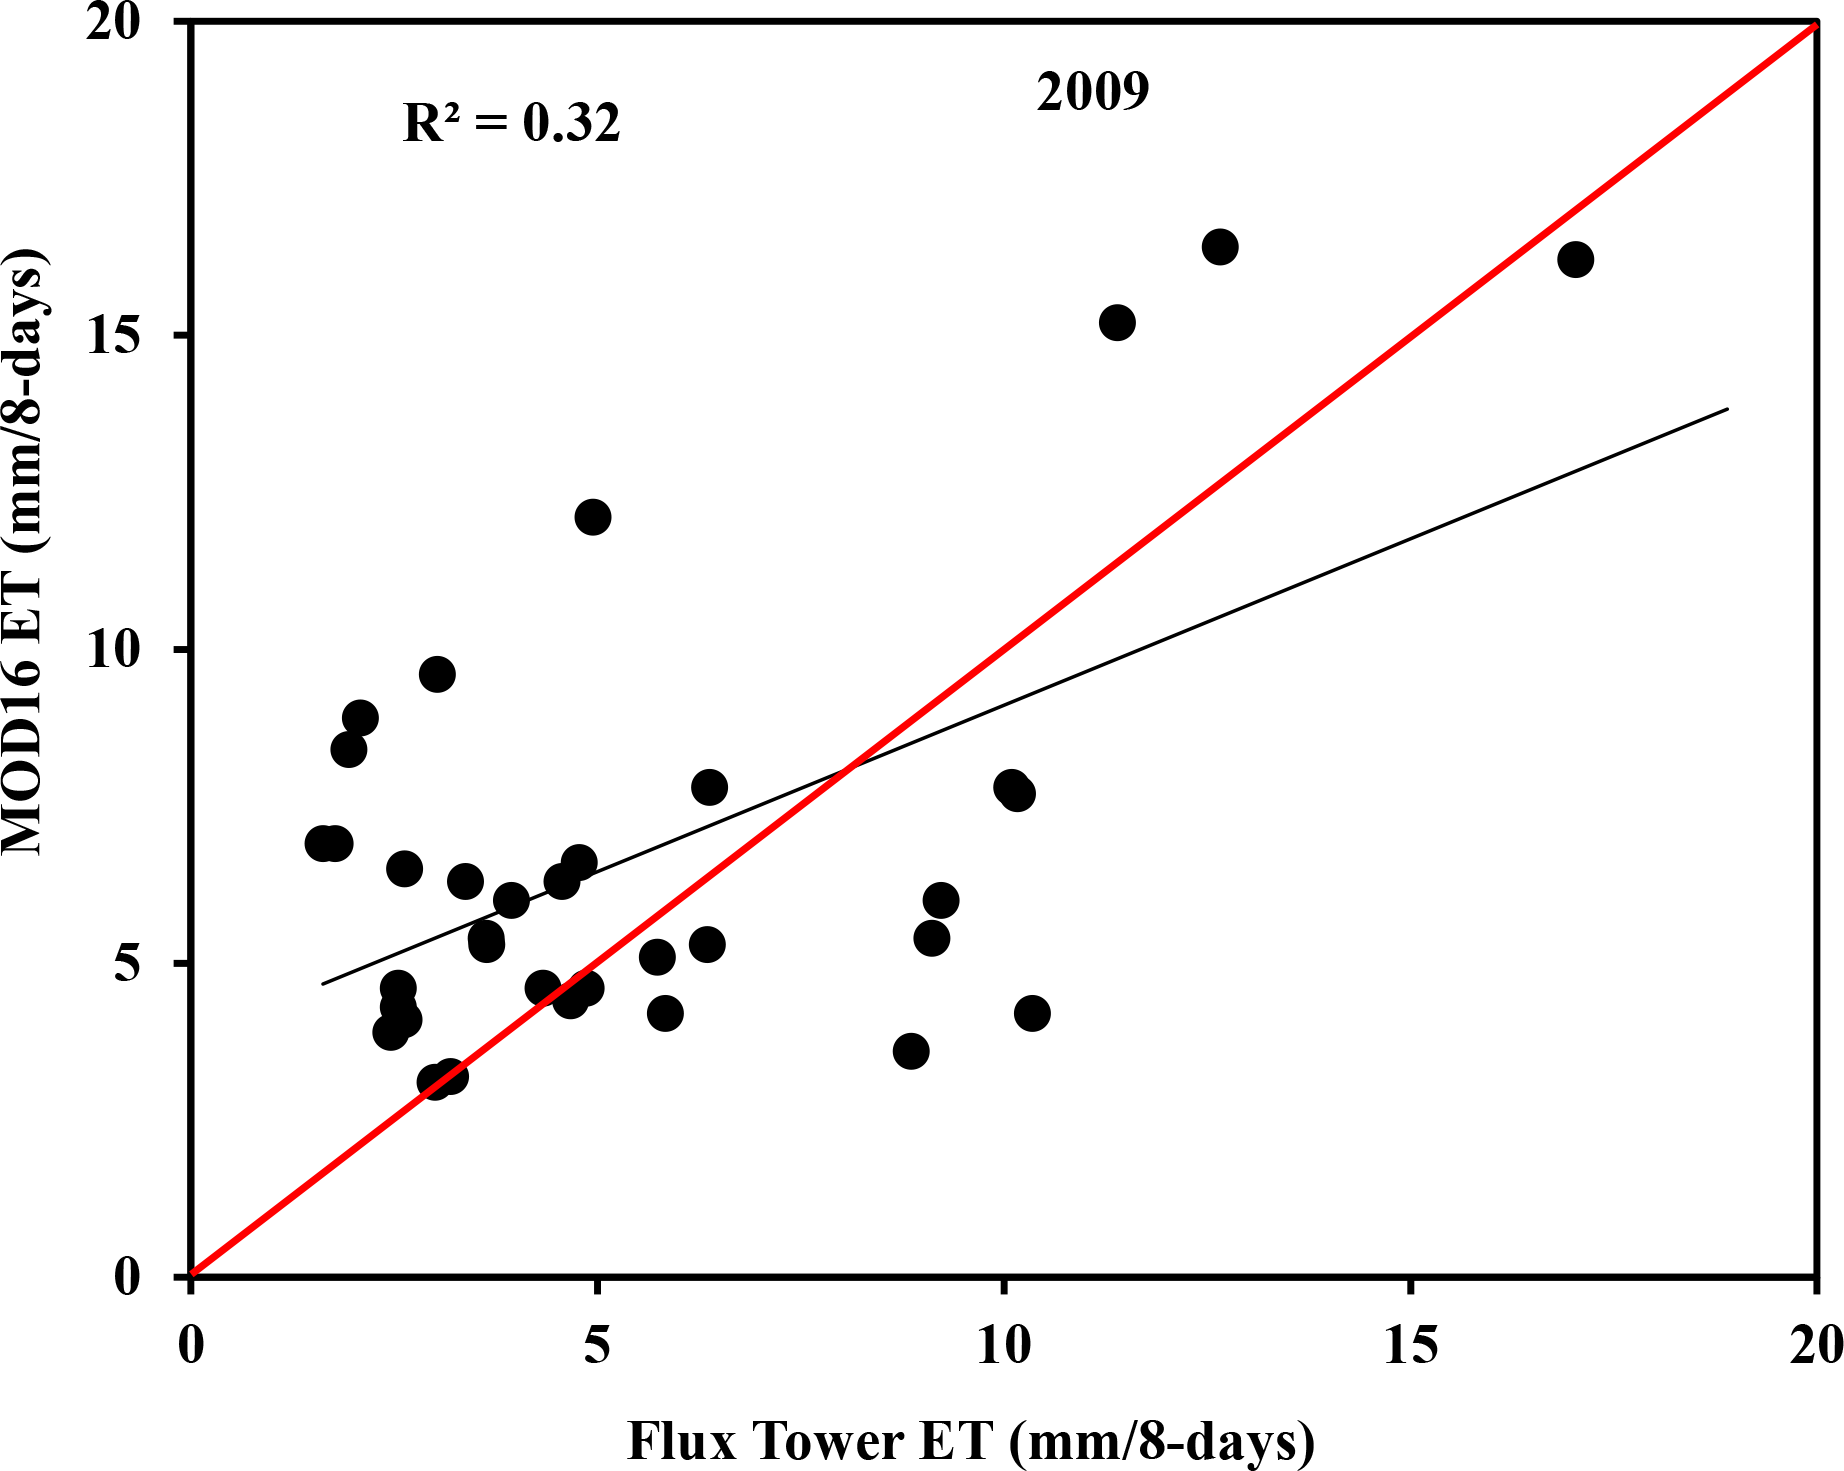
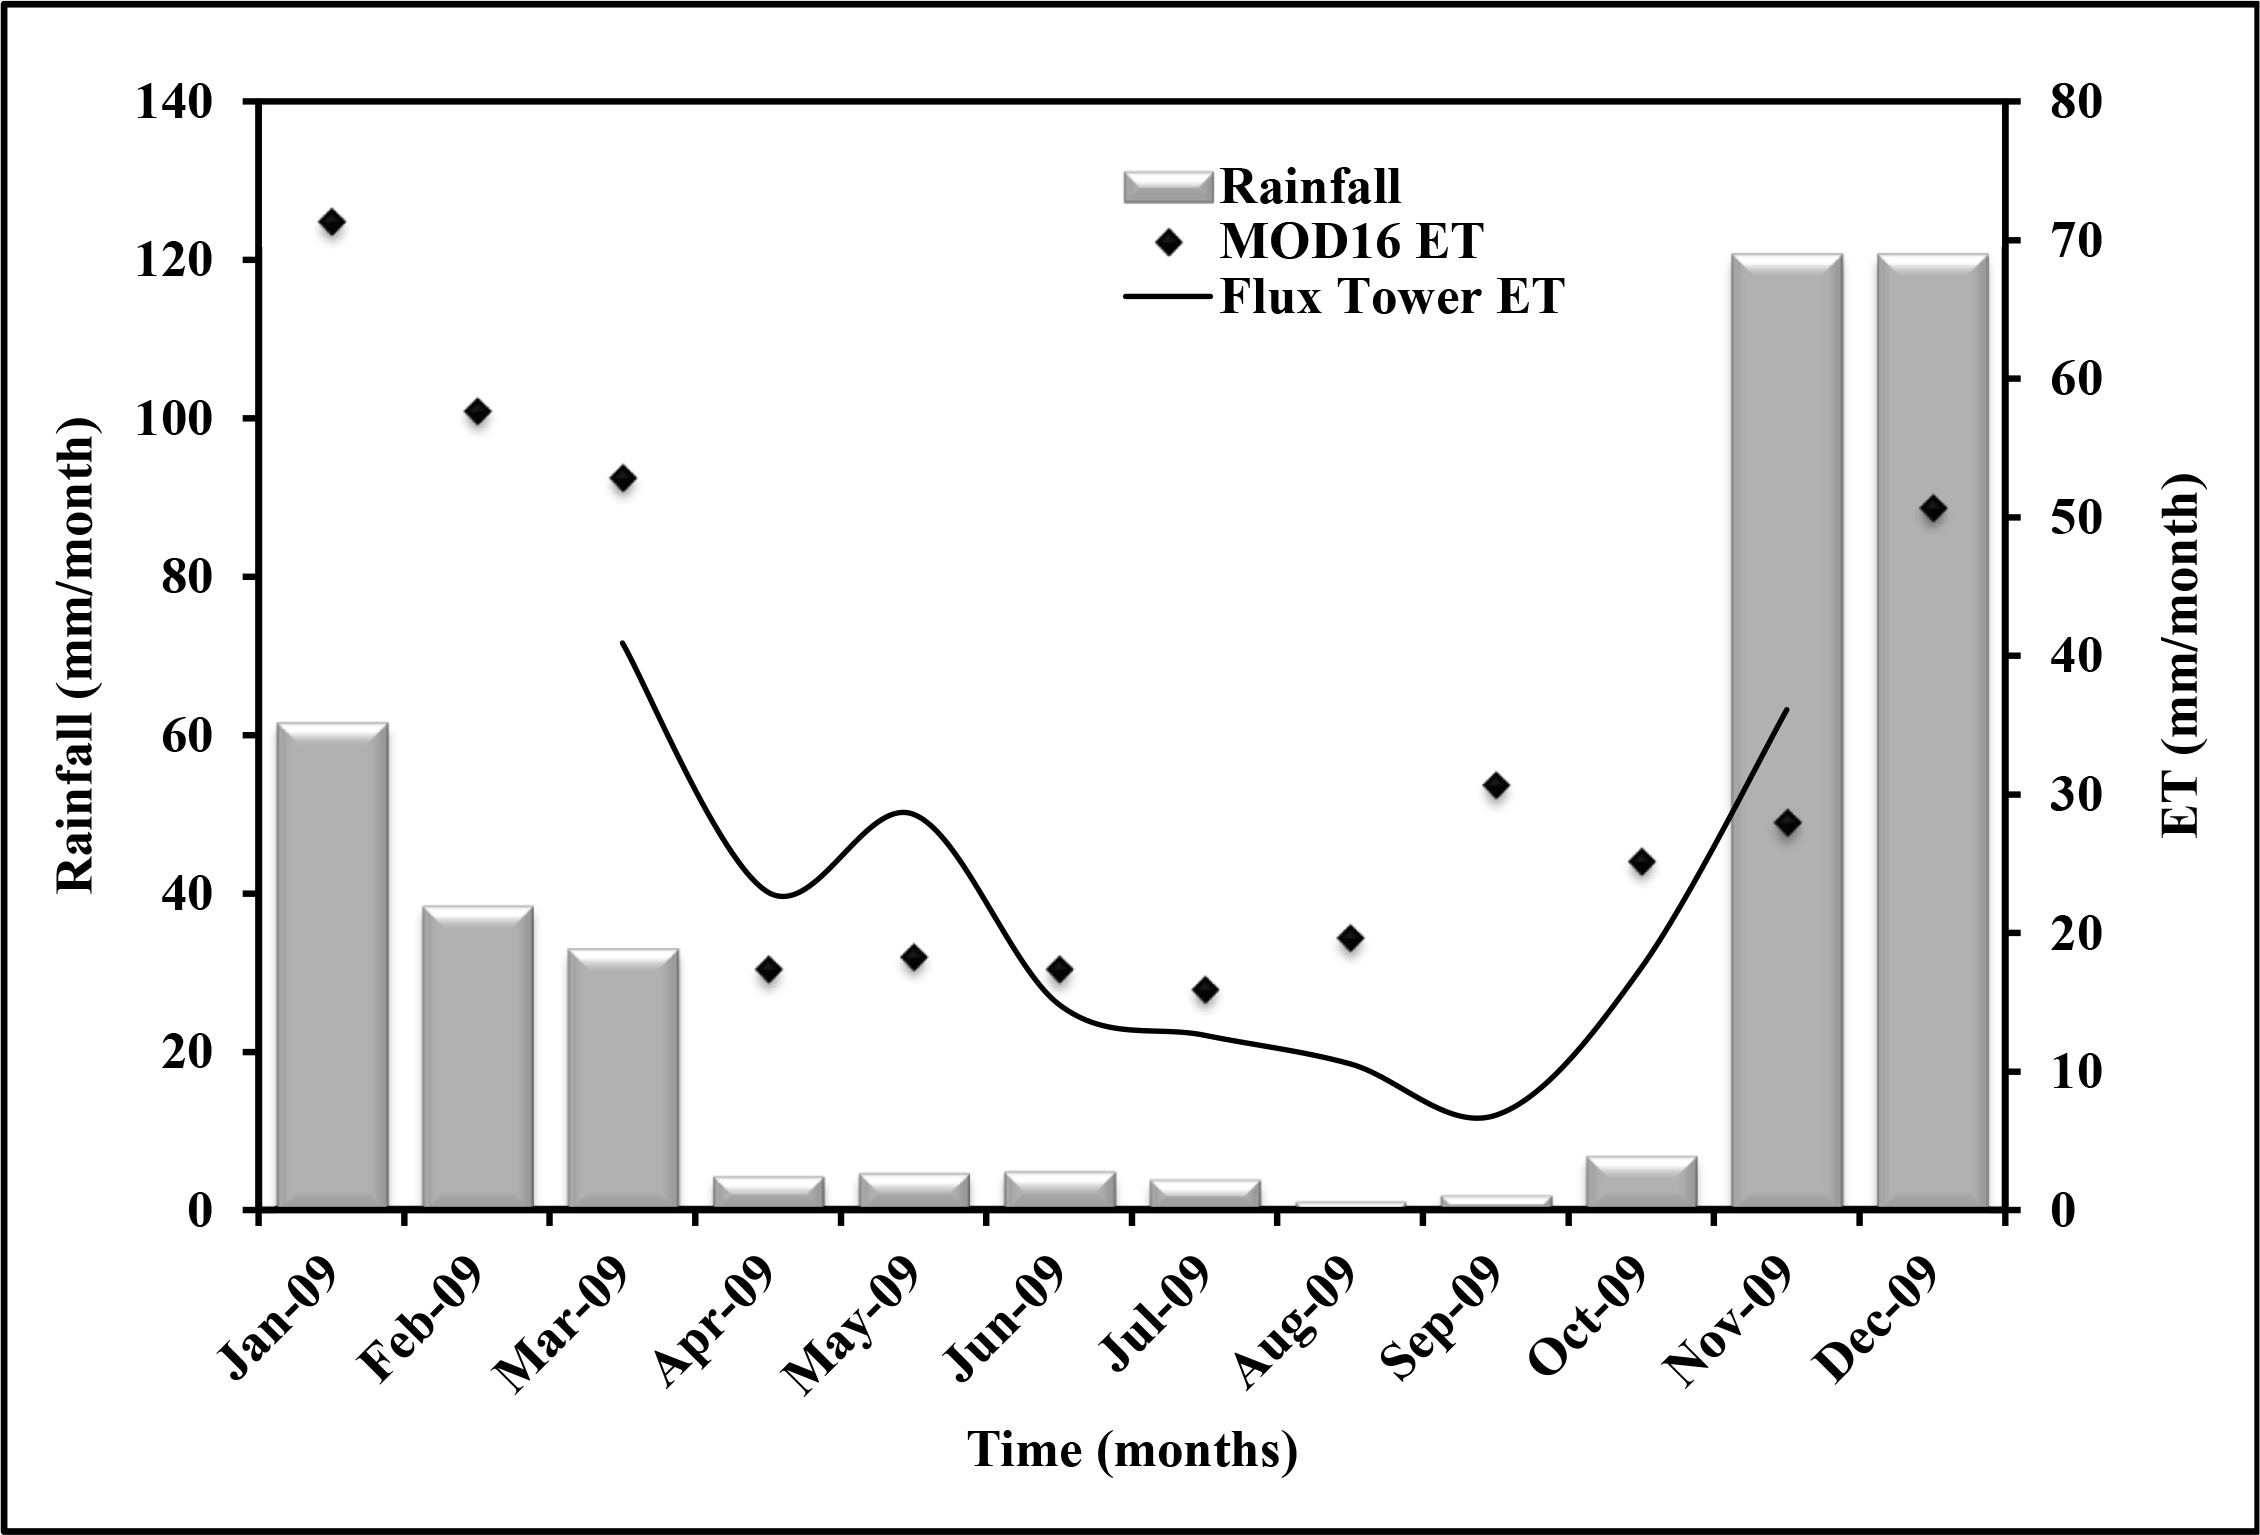
For the Malopeni site, the results show a relatively good RMSE (3 mm/8-days) with 35 out of 45 eight-day flux tower measurements (Table 1; Figure 5). Malopeni’s validations are similar to those of Skukuza in 2001, 2003 and 2005 in terms of RMSE. In terms of the R2-value (0.23), Malopeni validation is the lowest. Generally, the results of Malopeni show that MOD16 ET is overestimated (Bias = 1.18, PBias = 21% of the observed mean). Figures 6 and 7 show the time series visualization of eight-day and monthly ET. In both the eight-day and monthly time series, MOD16 ET started to increase around August–September while flux tower ET continues to drop.
Figure 8 shows all-period data (2000–2010) comparison of eight day and monthly modelled MOD16 and measured flux tower ET for Skukuza as well as monthly for Malopeni in 2009. Results indicate a poor relationship between modelled MOD16 and measured flux tower ET. Eight-day and monthly comparisons yielded R2 of 0.20 and 0.16, respectively. Monthly comparison for Malopeni obtained R2 of 0.33, which is relatively higher than the correlation achieved in Skukuza site. This could be a consequence of the number of data points used, only one year for Malopeni and several years for Skukuza used. Generally, the results show that there is a poor relationship between MOD16 and flux tower ET when using all data sets from various dates in each site.
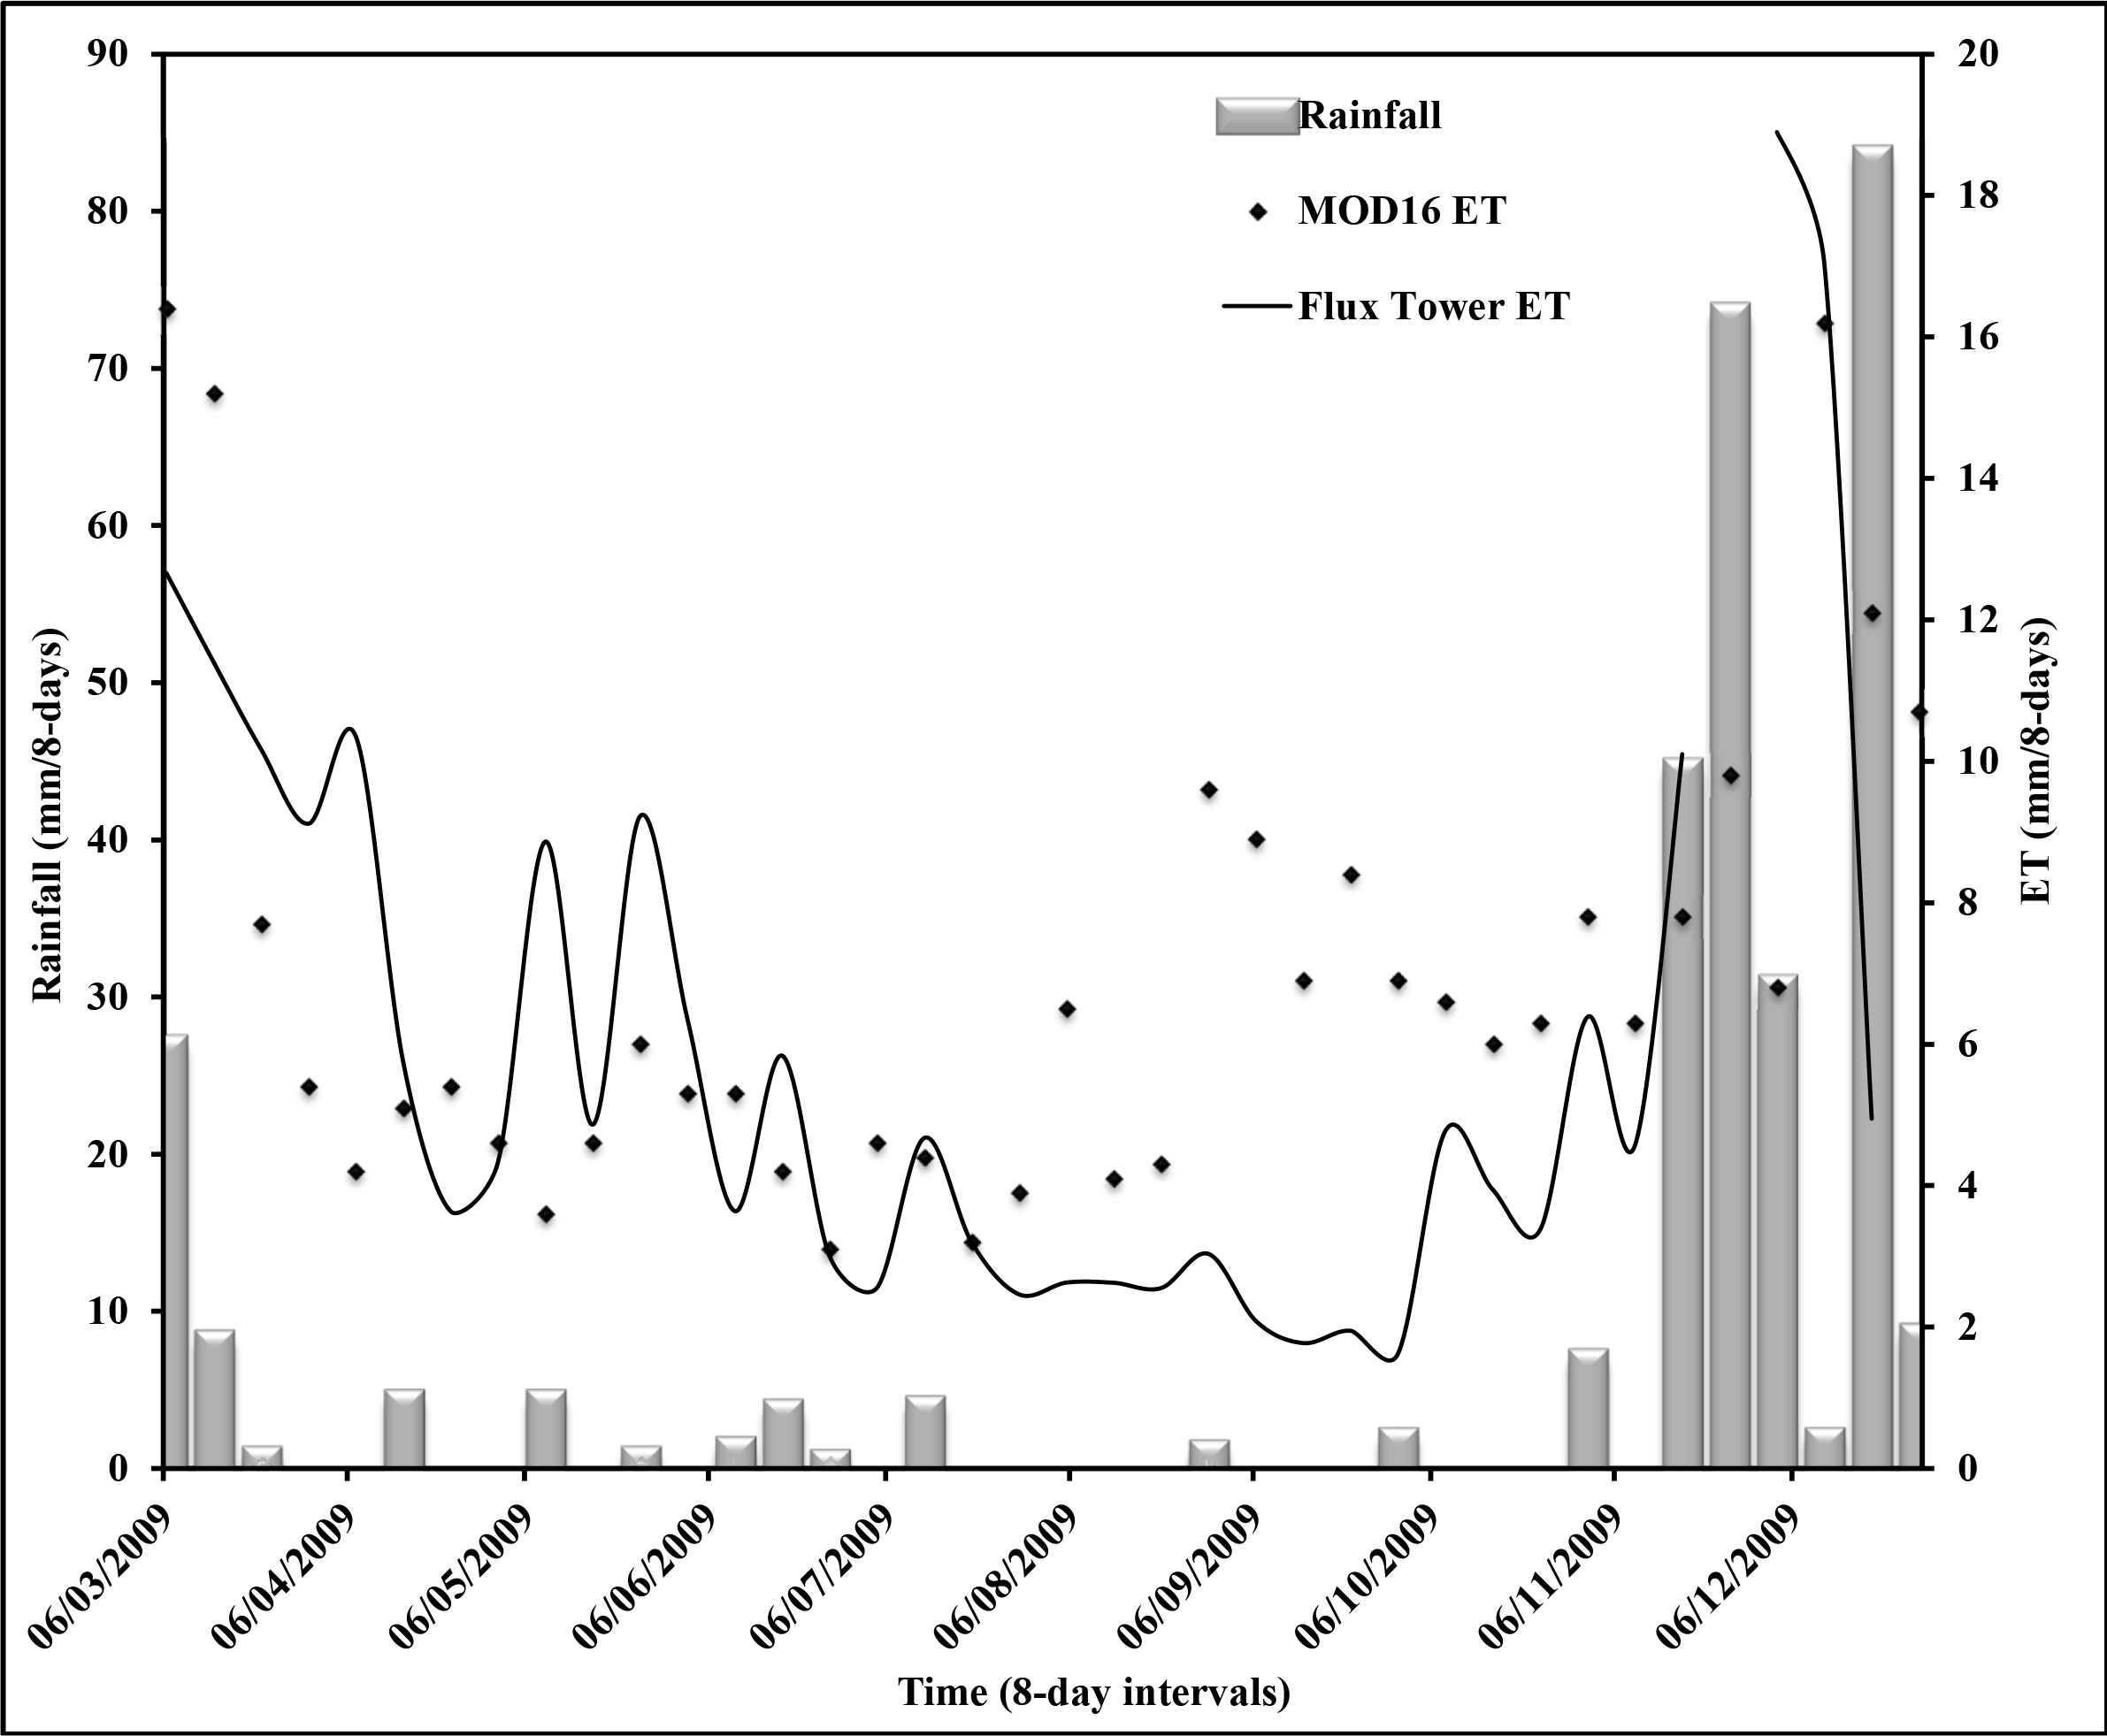
General trends as depicted by Figures 3 and 4 for Skukuza as well as Figures 6 and 7 for Malopeni show that both the flux tower and MODIS ET are to some extent related to rainfall variability (see Table 2). Table 2 shows further analysis of the relationship between rainfall and flux tower measured as well as MOD16 modelled ET for eight days and monthly data. Generally, there is a significant relationship between rainfall and ET. High rainfall peaks are associated with high ET values. In addition, missing flux tower ET values are associated with high rainfall or towards the end of the rainy season, since the measurements from the flux instruments become unreliable when wet.
4. Discussion
The paper focused on the evaluation of the MOD16 modelled ET product in South African savannas using flux tower measured ET. Discrepancies between MOD16 ET and flux tower ET can originate from a number of factors, including the parameterization (input data) of the Penman-Monteith model, flux tower measurement error, flux tower footprint vs. MODIS pixel size as well as the limitations of the algorithm, most of which were identified by Mu et al. [7,34]. The main input data for the MODIS ET modelling include MODIS derived global products such as land cover [50], albedo, leaf area index (LAI), fraction of photosynthetic absorbed radiation (FPAR) as well as meteorological data. These input parameters are coarse scale products, generally poorly or not validated in the semi-arid conditions of South Africa, which are likely to generate significant ET prediction errors. For instance, MODIS global land cover (MOD12Q1) is a relatively coarse product (500 m) which inadequately captures the heterogeneity of savanna ecosystems. Further, the global MODIS based LAI or FPAR products have not been validated in Southern Africa. For generating the LAI product, an inversion of the physically-based model such as PROSAIL is used [51]. However, a backup algorithm based on LAI vs. NDVI relationship is used, when the inversion of the physically based model does not provide a solution [51]. In the semi-arid environments like South Africa, it is likely that the LAI is based on the latter approach because of the global parameterization. Therefore, it is crucial that the input data such as land cover, FPAR and LAI are also assessed and validated in the local context, and improved when needed. This exercise will help determine and document error propagation within the MOD16 algorithm and support the development of local parameterization of models for an integrated water management system. Sensitivity analyses are required to identify the variables which influence the ET output the most, and to document the level of agreement between input and output errors.
Uncertainties associated with the flux tower measurements could have also influenced the results. The flux towers have an energy balance closure problem due to the fact that the sum of the net radiation and the ground heat flux is sometimes larger than the sum of the turbulent fluxes of latent and sensible heat [52]. The energy balance closure problem was not corrected in this paper due to the lack of reliable ground heat flux measurement. Flux tower measurements are largely influenced by weather conditions. During rainy and stormy days, flux tower sensors either record abnormal values or simply do not record any data. The missing flux tower measurements affected the cumulative eight-day ET. The advantage of having full eight-day measurements was evident in the 2010 datasets, which provided the best overall relationship between the flux tower and MOD16 ET measurements. The low correlations obtained during the dry season are similarly observed in other regions and probably related to a lag in detecting the plant water stress using remote sensing techniques [53]. The relationship between rainfall with flux tower and MOD16 ET (Table 2) demonstrated that rainfall has a significant influence in the variability of ET, and hence the estimation of ET.
Spatial discrepancy may still exist between the footprint of the flux tower measurements and the MODIS pixel. The height of the sensors on a flux tower [48], wind direction or velocity, atmospheric stability and underlying surface conditions influence the size of the eddy covariance source area [49]. The measurement heights of Skukuza and Malopeni are 16 m and 7 m, respectively, thus the footprints of these towers are 1.6 km and 0.7 km, respectively. The Skukuza flux tower footprint provides a better match to the MODIS pixel size compared to the Malopeni flux tower. In addition, the layout of a single 1 km pixel may not directly match the flux tower footprints and may add further spatial discrepancy between the two. Footprint modelling is a means to reduce the spatial discrepancy between flux tower measurements and MODIS pixel [36], but this was beyond the scope of this study.
Shortcomings associated with the algorithm itself could have influenced the differences between flux tower and MOD16 ET. Mu et al. [34] argued that several physical factors such as micro-climate, plant biophysics for site specific species and landscape heterogeneity influence the soil surface evaporation and plant transpiration processes, which likely affect MOD16 ET estimation accuracy. The MOD16 ET does not account for disturbance history or species composition and stand age [7,34], which could also add further uncertainty. The algorithm makes the assumption that the stomata close during the night, while studies such as Musselman and Minnick [54] have reported stomata opening during the night. This induces underestimation of daily ET because of the bias imposed by night time vegetation transpiration [34].
5. Conclusions
The study evaluated the quality of the MOD16 ET global products. Generally, MOD16 is poor and the accuracy is not consistent over a period of time in selected savanna ecosystem sites. The quantification of errors associated with the MOD16 ET product in the savanna ecosystem presents new findings. The MOD16 product underestimated ET with errors ranging from 2–7 mm/8 days in the Skukuza site and 3 mm/8 days in the Malopeni site. The evaluation of this product and quantified errors has been undertaken exhaustively for the first time in the dry savanna ecosystem, especially in South Africa. Rainfall was found to significantly (p < 0.05) influence ET distribution and is associated with the missing data. Several factors could have influenced the inconsistency between MOD16 and flux tower derived ET, including parameterization of the model, scaling from flux tower measurement to a pixel as well as limitations associated with the algorithm used. For further evaluation of MOD16, footprint modelling for the eddy covariance source area should be done to ensure spatial representativeness or to reduce errors associated with scaling from flux tower measurements to a pixel. In addition, the energy balance closure problem should be analyzed, provided that there is reliable soil heat flux data. In future, there is a need to develop locally parameterized models for consistent estimation and mapping of ET in South Africa. It is important to understand existing ET estimation methods in order to improve ET estimation for the South African environment. In addition, future activities should also focus on the improvement of the estimation accuracy of other remote sensing derived input variables such as LAI, albedo and land cover. Accurate and consistent estimation and mapping of ET is crucial for understanding plant or crop water use which is an important component of integrated water resource management.
Acknowledgments
We would like to thank Council for Scientific and Industrial Research for the funding. We are also grateful to CARBOAFRICA project for providing access to the flux tower data. We would also like to thank University of Montana and NASA for the free access to MOD16 Global ET data.
Author Contributions
The manuscript was developed as part of the project entitled “Monitoring of water availability using geo-spatial data and earth observations” funded by the Council for Scientific and Industrial Research led by Nebo Jovanovic, and all the co-authors in this paper are co-investigators in this project. Abel Ramoelo was the main author involved in data collection, data analysis, and paper writing. Nobuhle Majozi contributed to the data collection and paper writing. Nebo Jovanovic and Renaud Mathieu played a supervisory role, involved in the inception of the project idea and contributed to the paper writing. Alecia Nickless was involved in data collection and preprocessing as well as paper writing. Sebinasi Dzikiti contributed to the data analysis and paper writing. Each author contributed immensely to the development of this manuscript.
Conflicts of Interest
The authors declare no conflict of interest.
References
- Cai, X.; Rosegrant, M.W. Global water demand and supply projections, Part 2: Results and prospects to 2025. Water Int 2002, 27, 170–182. [Google Scholar]
- Department of Water Affairs and Forestry (DWAF). A Guide to Verifying the Extent of Existing Lawful Water Use, Available online: www.dwaf.gov.za/WAR/documents/VerificationGuide2EdNov06.pdf (accessed on 1 2014).
- Brutsaert, W. Hydrology: An Introduction, 4th ed; Cambridge University Press: New York, NY, USA, 2009. [Google Scholar]
- Group on Earth Observation. GEO Task US-09-01a: Critical Earth Observations Priorities Water Societal Benefit Area. Final SBA Report. Available online: http://sbageotask.larc.nasa.gov/water.html (accessed on 22 October 2013).
- Group on Earth Observations. GEO Task US-09-01a Critical Earth Observation Priorities. Final Report, 2nd ed Available online: http://sbageotask.larc.nasa.gov/docpres.html (accessed on 22 October 2013).
- Allen, R.G.; Tasumi, M.; Morse, A.; Trezza, R.; Wright, J.L.; Bastiaanssen, W.; Robison, C.W. Satellite-based energy balance for mapping evapotranspiration with internalized calibration (METRIC)—Applications. J. Irrig. Drain Eng.–ASCE 2007, 133, 395–406. [Google Scholar]
- Mu, Q.; Heinsch, F.A.; Zhao, M.; Running, S.W. Development of a global evapotranspiration algorithm based on MODIS and global meteorology data. Remote Sens. Environ 2007, 111, 519–536. [Google Scholar]
- Su, Z. The surface energy balance system (SEBS) for estimation of turbulent heat fluxes. Hydrol. Earth Syst. Sci 2002, 6, 85–100. [Google Scholar]
- Allen, R.G.; Pereira, L.S.; Raes, D.; Smith, M. Crop Evapotranspiration-Guidelines for Computing Crop Water Requirements-FAO Irrigation and Drainage Paper 56; FAO: Rome, Italy, 1998. [Google Scholar]
- Allen, R.G.; Howell, T.A.; Pruitt, W.O.; Walter, I.A.; Jensen, M.E. Lysimeters for Evapotranspiration and Environmental Measurements; American Society of Civil Engineers: New York, NY, USA, 1991; p. 456. [Google Scholar]
- Bowen, I.S. The ratio of heat losses by conduction and by evaporation from any water surface. Phys. Rev 1926, 27. doi: http://0-dx-doi-org.brum.beds.ac.uk/10.1103/PhysRev.27.779. [Google Scholar]
- Monteith, J.; Unsworth, M. Principles of Environmental Physics, 2nd ed; Edward Arnold: London, UK, 1990. [Google Scholar]
- Everson, C.S.; Clulow, A.; Mengitsu, M. Feasibility Study on the Determination of Riparian Evaporation in Non-Perennial Systems; WRC Report No. TT 424/09; Water Research Commission: Pretoria, South Africa, 2009. [Google Scholar]
- Hillel, D. Introduction to Soil Physics; Academic press: New York, NY, USA, 1982. [Google Scholar]
- Clulow, A.D.; Everson, C.S.; Jarmain, C.; Mengistu, M. Water-Use of the Dominant Natural Vegetation Types of the Eastern Shores Area, Maputaland; WRC Report 1926/1/12; Water Research Commission: Pretoria, South Africa, 2012. [Google Scholar]
- Oelofse, A.; van Averbeke, W. Nutritional Value and Water Use of African Leafy Vegetables for Improved Livelihoods; WRC Report No. TT 535/12; Water Research Commission: Pretoria, South Africa, 2012. [Google Scholar]
- Li, Z.L.; Tang, R.; Wan, Z.; Bi, Y.; Zhou, C.; Tang, B.; Yan, G.; Zhang, X. A review of current methodologies for regional evapotranspiration estimation from remotely sensed data. Sensors 2009, 9, 3801–3853. [Google Scholar]
- Liang, S.; Wang, K.; Zhang, X.; Wild, M. Review on estimation of land surface radiation and energy budgets from ground measurement, remote sensing and model simulations. IEEE J. Sel. Top. Appl 2010, 3, 225–240. [Google Scholar]
- Wang, K.; Dickinson, R.E. A review of global terrestrial evapotranspiration: Observation, modeling, climatology, and climatic variability. Rev. Geophys 2012, 50. [Google Scholar] [CrossRef]
- Glenn, E.P.; Huete, A.R.; Nagler, P.L.; Hirschboeck, K.K.; Brown, P. Integrating remote sensing and ground methods to estimate evapotranspiration. Crit. Rev. Plant Sci 2007, 26, 139–168. [Google Scholar]
- Nagler, P.L.; Cleverly, J.; Glenn, E.; Lampkin, D.; Huete, A.; Wan, Z. Predicting riparian evapotranspiration from MODIS vegetation indices and meteorological data. Remote Sens. Environ 2005, 94, 17–30. [Google Scholar]
- Nagler, P.L.; Glenn, E.P.; Nguyen, U.; Scott, R.L.; Doody, T. Estimating riparian and agricultural actual evapotranspiration by reference evapotranspiration and MODIS Enhanced Vegetation Index. Remote Sens 2013, 5, 3849–3871. [Google Scholar]
- Tian, J.; Su, H.; Sun, X.; Chen, S.; He, H.; Zhao, K. Impact of the spatial domain size on the performance of the Ts-VI triangle method in terrestrial evapotranspiration estimation. Remote Sens 2013, 5, 1998–2013. [Google Scholar]
- Nagler, P.L.; Morino, K.; Murray, R.S.; Osterberg, J.; Glenn, E.P. An empirical algorithm for estimating agricultural and riparian evapotranspiration using MODIS enhanced vegetation index and ground measurements of ET. I. Description of method. Remote Sens 2009, 1, 1273–1297. [Google Scholar]
- Murray, R.S.; Nagler, P.L.; Morino, K.; Glenn, E.P. An empirical algorithm for estimating agricultural and riparian evapotranspiration using MODIS enhanced vegetation index and ground measurements of ET. II. Application to the Lower Colorado River, U.S. Remote Sens 2009, 1, 1125–1138. [Google Scholar]
- Bastiaanssen, W.; Menenti, M.; Feddes, R.; Holtslag, A. A remote sensing surface energy balance algorithm for land (SEBAL). 1. Formulation. J. Hydrol 1998, 212, 198–212. [Google Scholar]
- Ruhoff, A.L.; Paz, A.R.; Collischonn, W.; Aragao, L.E.O.C.; Rocha, H.R.; Malhi, Y.S. A MODIS-based energy balance to estimate evapotranspiration for clear-sky days in Brazilian tropical savannas. Remote Sens 2012, 4, 703–725. [Google Scholar]
- Alexandridis, T.K.; Cherif, I.; Chemin, Y.; Silleos, G.N.; Stavrinos, E.; Zalidis, G.C. Integrated methodology for estimating water use in Mediterranean agricultural areas. Remote Sens 2009, 1, 445–465. [Google Scholar]
- Gibson, L.A.; Jarmain, C.; Eckardt, F.E. Estimating evapotranspiration using remote sensing and the surface energy balance system—A South African perspective. Water SA 2013, 39, 477–484. [Google Scholar]
- Jin, X.; Guo, R.; Xia, W. Distribution of actual evapotranspiration over Qaidam Basin, an arid area in China. Remote Sens 2013, 5, 6976–6996. [Google Scholar]
- Trezza, R.; Allen, R.G.; Tasumi, M. Estimation of actual evapotranspiration along the Middle Rio Grande of New Mexico using MODIS and Landsat imagery with the METRIC Model. Remote Sens 2013, 5, 5397–5423. [Google Scholar]
- Hankerson, B.; Kjaersgaard, J.; Hay, C. Estimation of evapotranspiration from fields with and without cover crops using remote sensing and in situ methods. Remote Sens 2012, 4, 3796–3812. [Google Scholar]
- Cleugh, H.A.; Leuning, R.; Mu, Q.; Running, S.W. Regional evaporation estimates from flux tower and MODIS satellite data. Remote Sens. Environ 2007, 106, 285–304. [Google Scholar]
- Mu, Q.; Zhao, M.; Running, S.W. Improvements to a MODIS global terrestrial evapotranspiration algorithm. Remote Sens. Environ 2011, 115, 1781–1800. [Google Scholar]
- Priestley, C.H.B.; Taylor, R.J. On the assessment of surface heat flux and evaporation using large scale parameters. Mon. Weather Rev 1972, 100, 81–92. [Google Scholar]
- Jia, Z.; Liu, S.; Xu, Z.; Chen, Y.; Zhu, M. Validation of remote sensed evapotranspiration over the Hai river basin, China. J. Geophys. Res.: Atmos 2012, 117. [Google Scholar] [CrossRef]
- Fisher, J.B.; Tu, K.P.; Baldocchi, D.D. Global estimates of the land-atmosphere water flux based on monthly AVHRR and ISLSCP-II data, validated at 16 FLUXNET sites. Remote Sens. Environ 2008, 112, 901–919. [Google Scholar]
- Yao, Y.; Liang, S.; Cheng, J.; Liu, S.; Fisher, J.B.; Zhang, X.; Jia, K.; Zhao, X.; Qin, Q.; Zhao, B.; et al. MODIS-driven estimation of terrestrial latent heat flux in China based on a modified Priestley-Taylor algorithm. Agr. Forest Meteorol 2013, 171–172, 187–202. [Google Scholar]
- Bateni, S.M.; Liang, S. Estimating surface energy fluxes usind a dual-source data assimilation approach adjoined to the heat diffusion equation. J. Geophys. Res.: Atmos 2012, 117. [Google Scholar] [CrossRef]
- Yao, Y.; Liang, S; Zhao, S; Zhang, Y.; Qin, Q.; Cheng, Q.; Jia, J.; Xie, X.; Zhang, N.; Liu, M. Validation and application of the modified satellite-based Priestley-Taylor Algorithm for mapping terrestrial evapotranspiration. Remote Sens 2014, 6, 880–904. [Google Scholar]
- Caparrini, F.; Castelli, F.; Entekhabi, D. Estimation of surface turbulent fluxes through assimilation of radiometric surface temperature sequences. J. Hydrometeorol 2004, 5, 145–159. [Google Scholar]
- Jarmain, C.; Mengitsu, M.; Jewitt, G.; Kongo, V.; Bastiaanssen, W. A Methodology for Near-Real Time Spatial Estimation of Evaporation; WRC Report 1751-1-09; Water Research Commission: Pretoria, South Africa, 2009. [Google Scholar]
- Sun, Z.; Gebremichael, M.; Ardö, J.; Nickless, A.; Caquet, B.; Merboldh, L.; Kutschi, W. Estimation of daily evapotranspiration over Africa using MODIS/Terra and SEVIRI/MSG data. Atmos. Res 2012, 112, 35–44. [Google Scholar]
- Kim, H.W.; Hwang, K.; Mu, Q.; Lee, S.O.; Choi, M. Validation of MODIS 16 global terrestrial evapotranspiration products in various climates and land cover types in Asia. KSCE J. Civ. Eng 2012, 16, 229–238. [Google Scholar]
- Jovanovic, N.; Masiyandima, M.; Naiken, V.; Dzikiti, S.; Gush, M. Remote Sensing Applications in Water Resources Management—Desktop Validation and Draft Paper; CSIR Report No. CSIR/NRE/ECOS/IR/2011/0097/A; CSIR: Pretoria, South Africa, 2012. [Google Scholar]
- Scholes, R.; Gureja, N.; Giannecchinni, M.; Dovie, D.; Wilson, B.; Davidson, N.; Piggot, K.; McLoughlin, C.; van der Velde, K.; Freeman, A.; et al. The environment and vegetation of the flux measurement site near Skukuza, Kruger National Park. Koedoe 2001, 44, 73–83. [Google Scholar]
- Kirton, A.; Scholes, R.J. Site Characterization of the Malopeni Flux Tower Site, Kruger National Park, South Africa. Available online: http://www.carboafrica.net/downs/ws/accra/6-Posters/Malopeni_Site_Characterisation.pdf (accessed on 1 April 2014).
- Burba, G.; Anderson, D. A Brief Practical Guide to Eddy Covariance Flux Measurements, Principles and Workflow Examples for Scientific and Industrial Applications; LI-COR Biosciences: Lincoln, NE, USA, 2010. [Google Scholar]
- Liu, S.M.; Xu, Z.W.; Zhu, Z.Z.; Jia, Z.L.; Zhu, M.J. Measurements of evapotranspiration from eddy-covariance systems and large aperture scintillometers in the Hai River Basin, China. J. Hydrol 2013, 22, 24–38. [Google Scholar]
- Friedl, M.A.; McIver, D.K.; Hodges, J.C.F.; Zhang, X.Y.; Muchoney, D.; Strahler, A.H.; Woodcock, C.E.; Gopal, S.; Schneider, A.; Cooper, A.; et al. Global land cover mapping from MODIS: Algorithms and early results. Remote Sens. Environ 2002, 83, 287–302. [Google Scholar]
- Myneni, R.B.; Hoffman, S.; Knyazikhin, Y.; Privette, J.L.; Glassy, J.; Tian, Y.; Wang, Y.; Song, X.; Zhang, Y.; Smith, G.R.; et al. Global products of vegetation leaf area and fraction of absorbed PAR from year one of MODIS data. Remote Sens. Environ 2012, 83, 214–231. [Google Scholar]
- Aubinet, M. Estimates of the annual net carbon and water exchange of forests: The EUROFLUX methodology. Adv. Ecol. Res 2000, 30, 113–175. [Google Scholar]
- Glenn, E.P.; Neale, M.U.; Doug, J.H.; Nagler, P.L. Vegetation index-based crop coefficients to estimate evapotranspiration by remote sensing in agricultural and natural resources. Hydrol. Process 2011, 25, 4050–4062. [Google Scholar]
- Musselman, R.C.; Minnick, T.J. Nocturnal stomatal conductance and ambient air quality standards for azone. Atmos. Environ 2000, 34, 719–733. [Google Scholar]


| Flux Tower | Year | R2 | RMSE (mm/8-days) | Bias (mm/8 day) | PBias (%) | No. of Measurements * |
|---|---|---|---|---|---|---|
| Skukuza | 2000 | 0.26 | 5.22 | 3.08 | 33.33 | 18 |
| 2001 | 0.35 | 3.60 | 0.58 | 6.63 | 26 | |
| 2003 | 0.58 | 3.40 | −0.31 | −3.02 | 32 | |
| 2004 | 0.54 | 8.00 | 2.85 | 22.38 | 37 | |
| 2005 | 0.81 | 2.00 | −0.24 | −3.20 | 26 | |
| 2007 | 0.85 | 6.00 | −12.11 | −55.71 | 32 | |
| 2008 | 0.36 | 7.40 | −9.47 | −51.68 | 34 | |
| 2009 | 0.78 | 7.39 | −6.46 | −29.50 | 36 | |
| 2010 | 0.74 | 4.30 | −2.57 | −16.44 | 44 | |
| Malopeni | 2009 | 0.23 | 3.00 | 1.18 | 21.20 | 35 |
*A complete yearly eight days measurements should be 45, as per MOD16 dates.
| Sites | Types | Duration | R2 | RMSE(mm/8-days) | * P < 0.05 |
|---|---|---|---|---|---|
| Skukuza | Flux Tower | 8day | 0.14 | 8.85 | Yes |
| Mon | 0.01 | 28.1 | No | ||
| MOD16 | 8day | 0.15 | 9.41 | Yes | |
| Mon | 0.16 | 33.9 | Yes | ||
| Malopeni | Flux Tower | 8day | 0.01 | 5.02 | No |
| Mon | 0.41 | 8.99 | Yes | ||
| MOD16 | 8day | 0.11 | 4.60 | Yes | |
| Mon | 0.32 | 13.77 | Yes | ||
*95% confidence level, where YES indicates significance; Mon = Monthly.
© 2014 by the authors; licensee MDPI, Basel, Switzerland This article is an open access article distributed under the terms and conditions of the Creative Commons Attribution license (http://creativecommons.org/licenses/by/3.0/).
Share and Cite
Ramoelo, A.; Majozi, N.; Mathieu, R.; Jovanovic, N.; Nickless, A.; Dzikiti, S. Validation of Global Evapotranspiration Product (MOD16) using Flux Tower Data in the African Savanna, South Africa. Remote Sens. 2014, 6, 7406-7423. https://0-doi-org.brum.beds.ac.uk/10.3390/rs6087406
Ramoelo A, Majozi N, Mathieu R, Jovanovic N, Nickless A, Dzikiti S. Validation of Global Evapotranspiration Product (MOD16) using Flux Tower Data in the African Savanna, South Africa. Remote Sensing. 2014; 6(8):7406-7423. https://0-doi-org.brum.beds.ac.uk/10.3390/rs6087406
Chicago/Turabian StyleRamoelo, Abel, Nobuhle Majozi, Renaud Mathieu, Nebo Jovanovic, Alecia Nickless, and Sebinasi Dzikiti. 2014. "Validation of Global Evapotranspiration Product (MOD16) using Flux Tower Data in the African Savanna, South Africa" Remote Sensing 6, no. 8: 7406-7423. https://0-doi-org.brum.beds.ac.uk/10.3390/rs6087406