Subsidence Detected by Multi-Pass Differential SAR Interferometry in the Cassino Plain (Central Italy): Joint Effect of Geological and Anthropogenic Factors?

 , , , ,
Abstract
: In the present work, the Differential SAR Interferometry (DInSAR) technique has been applied to study the surface movements affecting the sedimentary basin of Cassino municipality. Two datasets of SAR images, provided by ERS 1–2 and Envisat missions, have been acquired from 1992 to 2010. Such datasets have been processed independently each other and with different techniques nevertheless providing compatible results. DInSAR data show a subsidence rate mostly located in the northeast side of the city, with a subsidence rate decreasing from about 5–6 mm/yr in the period 1992–2000 to about 1–2 mm/yr between 2004 and 2010, highlighting a progressive reduction of the phenomenon. Based on interferometric results and geological/geotechnical observations, the explanation of the detected movements allows to confirm the anthropogenic (surface effect due to building construction) and geological causes (thickness and characteristics of the compressible stratum).1. Introduction
Differential SAR Interferometry (DInSAR) is a powerful remote sensing technique aiming at the investigation of the Earth’s surface movements due to natural and/or anthropogenic phenomena like earthquakes [1–4], small and large scale movements [5,6], volcanic eruptions [7–9] and subsidence induced by urban expansion or fluids extraction [10,11].
Indeed, important properties offered by the SAR technology as the global coverage, the all-time and all-weather applicability (sunlight independence and the capability to work in any atmospheric conditions) made DInSAR an important tool for the seismic and volcanic hazard mitigation, the landslides monitoring, the management of agricultural activities [12], and the study of the glaciers behavior [13,14].
Since 2000, advanced DInSAR techniques like Permanent Scatterers (PS) [15,16], Small Baseline Subsets (SBAS) [17] and Interferometric Point Target Analysis (IPTA) [18] have been developed. These techniques deeply exploit the capabilities of the satellites, allowing to work with large dataset of SAR images related to the same area but acquired in different times and with different perpendicular baselines. This approach, also named multi-pass DInSAR, allows improving the capabilities to, provide precise measurements of surface deformation rates and estimating the displacement time series with millimetric accuracy.
In this paper, the SBAS and IPTA approaches have been applied to different datasets of ERS 1–2 and Envisat images in order to investigate and map the surface deformations that characterize the city of Cassino, Central Italy, from 1992 to 2010. Cassino city may be regarded as an example of middle size Italian urban settlements, even though characterized by peculiar socio-economical, historical and geological features, and the presence of strategic infrastructures as the Campania aqueduct, and the Busso-Paliano methane pipeline, owned by the Società Gasdotti Italia.
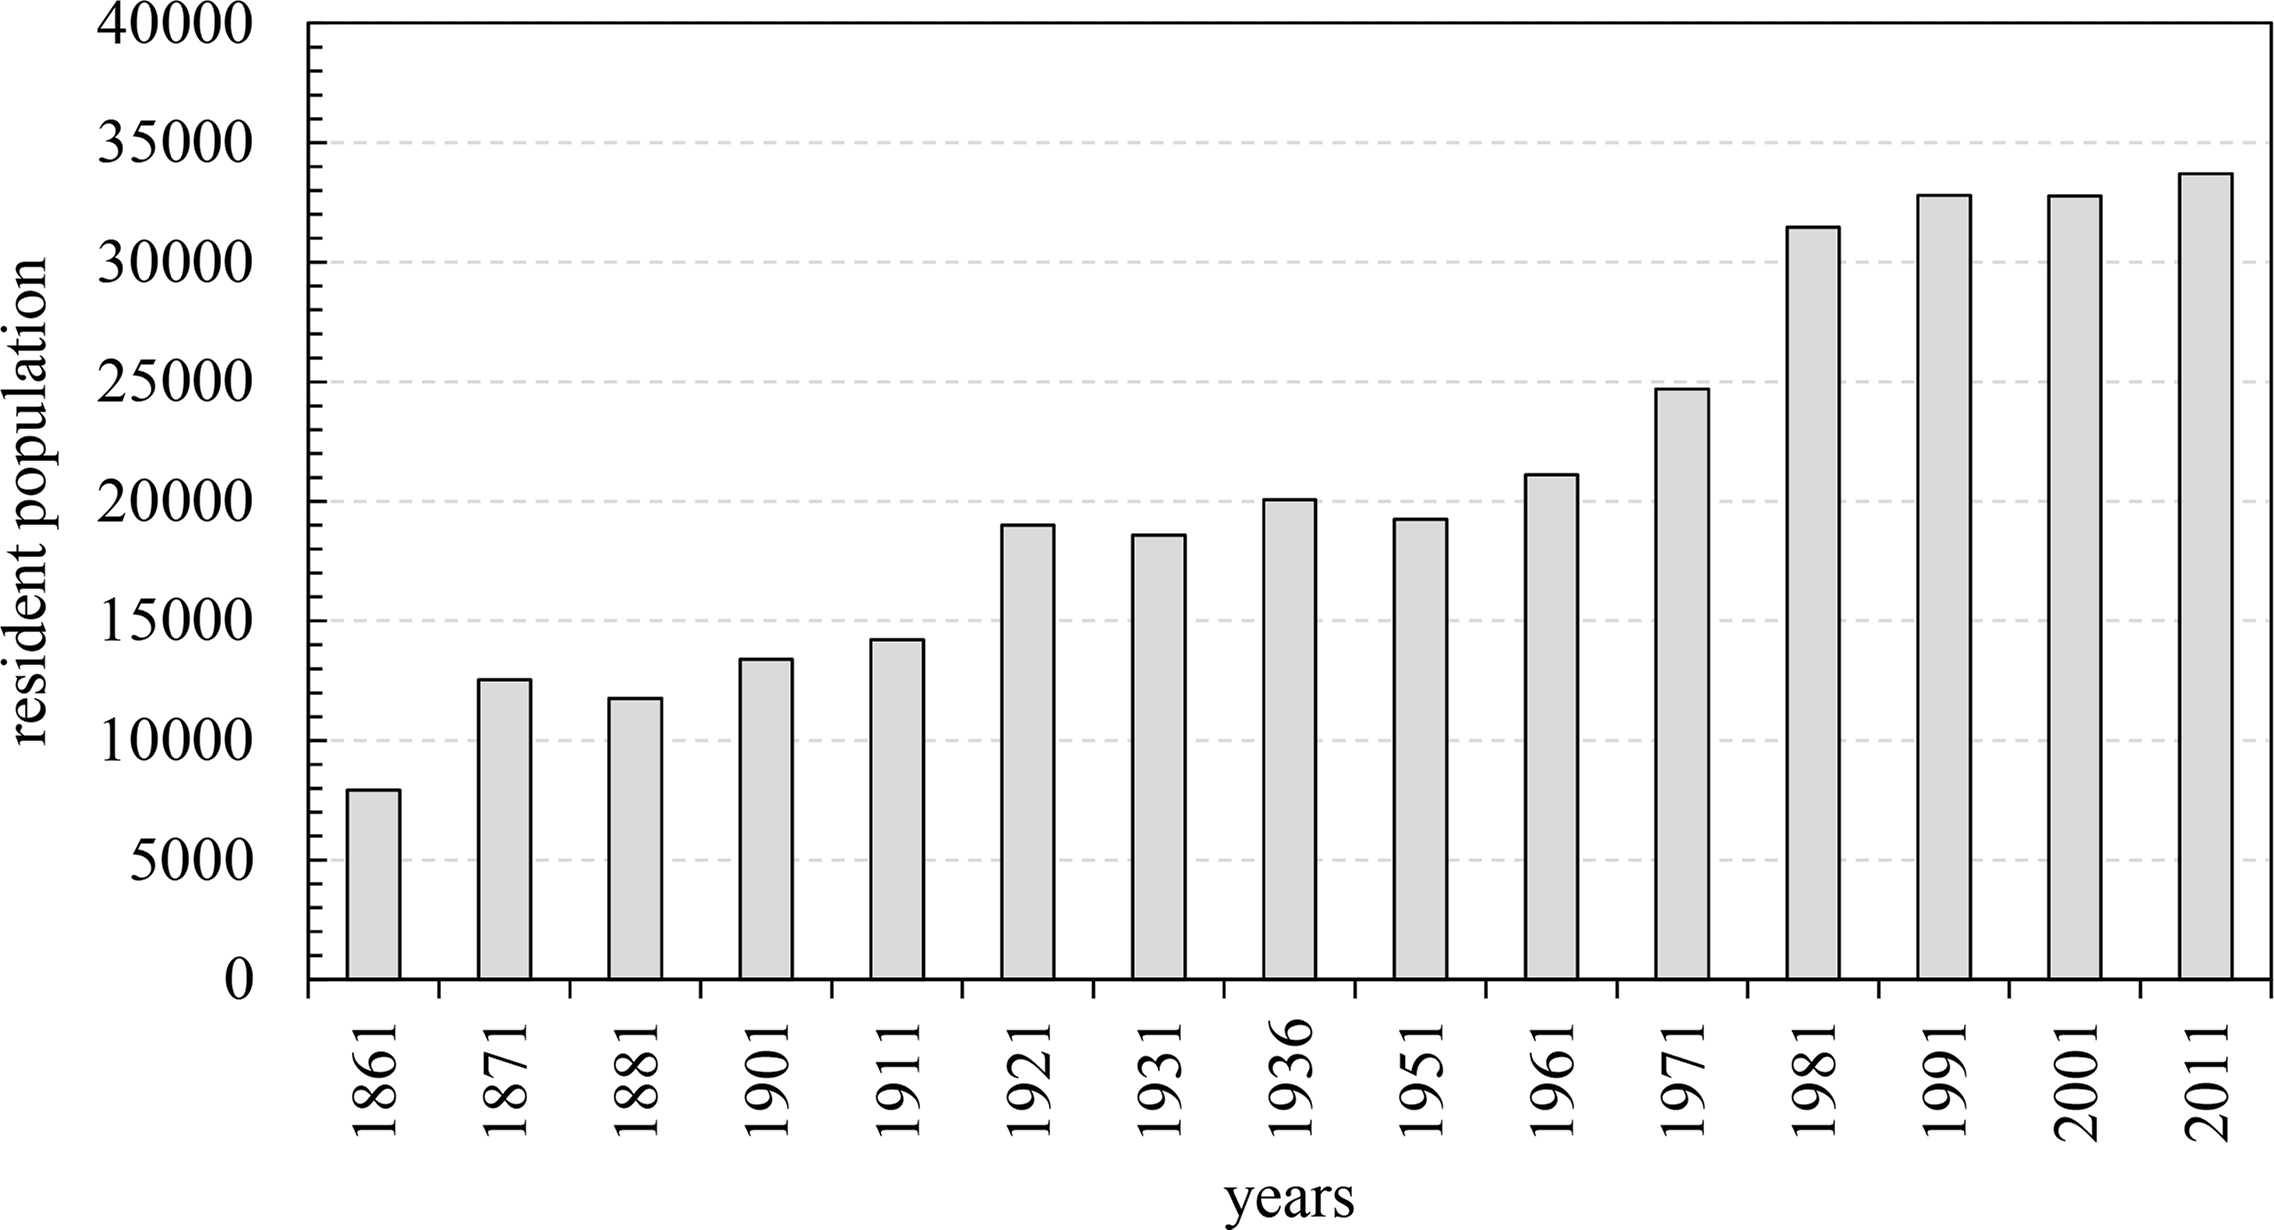
During the Second World War, this area was theatre of a long lasting battle and the city was completely destroyed. Since then Cassino has been rebuilt and the population has increased from about twenty to forty thousand people (Figure 1). Over this period, the urban area has considerably expanded in an alluvial plain at the foot of the Montecassino Abbey, characterized by the presence of soft soils that are prone to settle if loaded.
2. Geological and Hydrogeological Framework
The investigated area is located in a peripheral sector of the central Apennines on the left side of the Latina Valley, among the Cairo Mt. (NW), Venafro Mts. (NE) and Aurunci Mts. (S). The area is represented by a Quaternary intermontane basin [19] bounded by Mesozoic-Cenozoic carbonatic reliefs. As well described in literature [20,21], stratigraphic succession points out the presence of dolostone and limestone with an age between Lias and lower Tortonian. Moving towards, sandstone with marls and gray clays interbedded represent the syn-orogenetic sequence of the upper Tortonian foredeep [22]. Then, the deposition of sand and gravel banks (i.e., piggy-back deposits) scans the chain-progress system by diachronic stages, between lower Messinian and lower Pliocene [23,24].
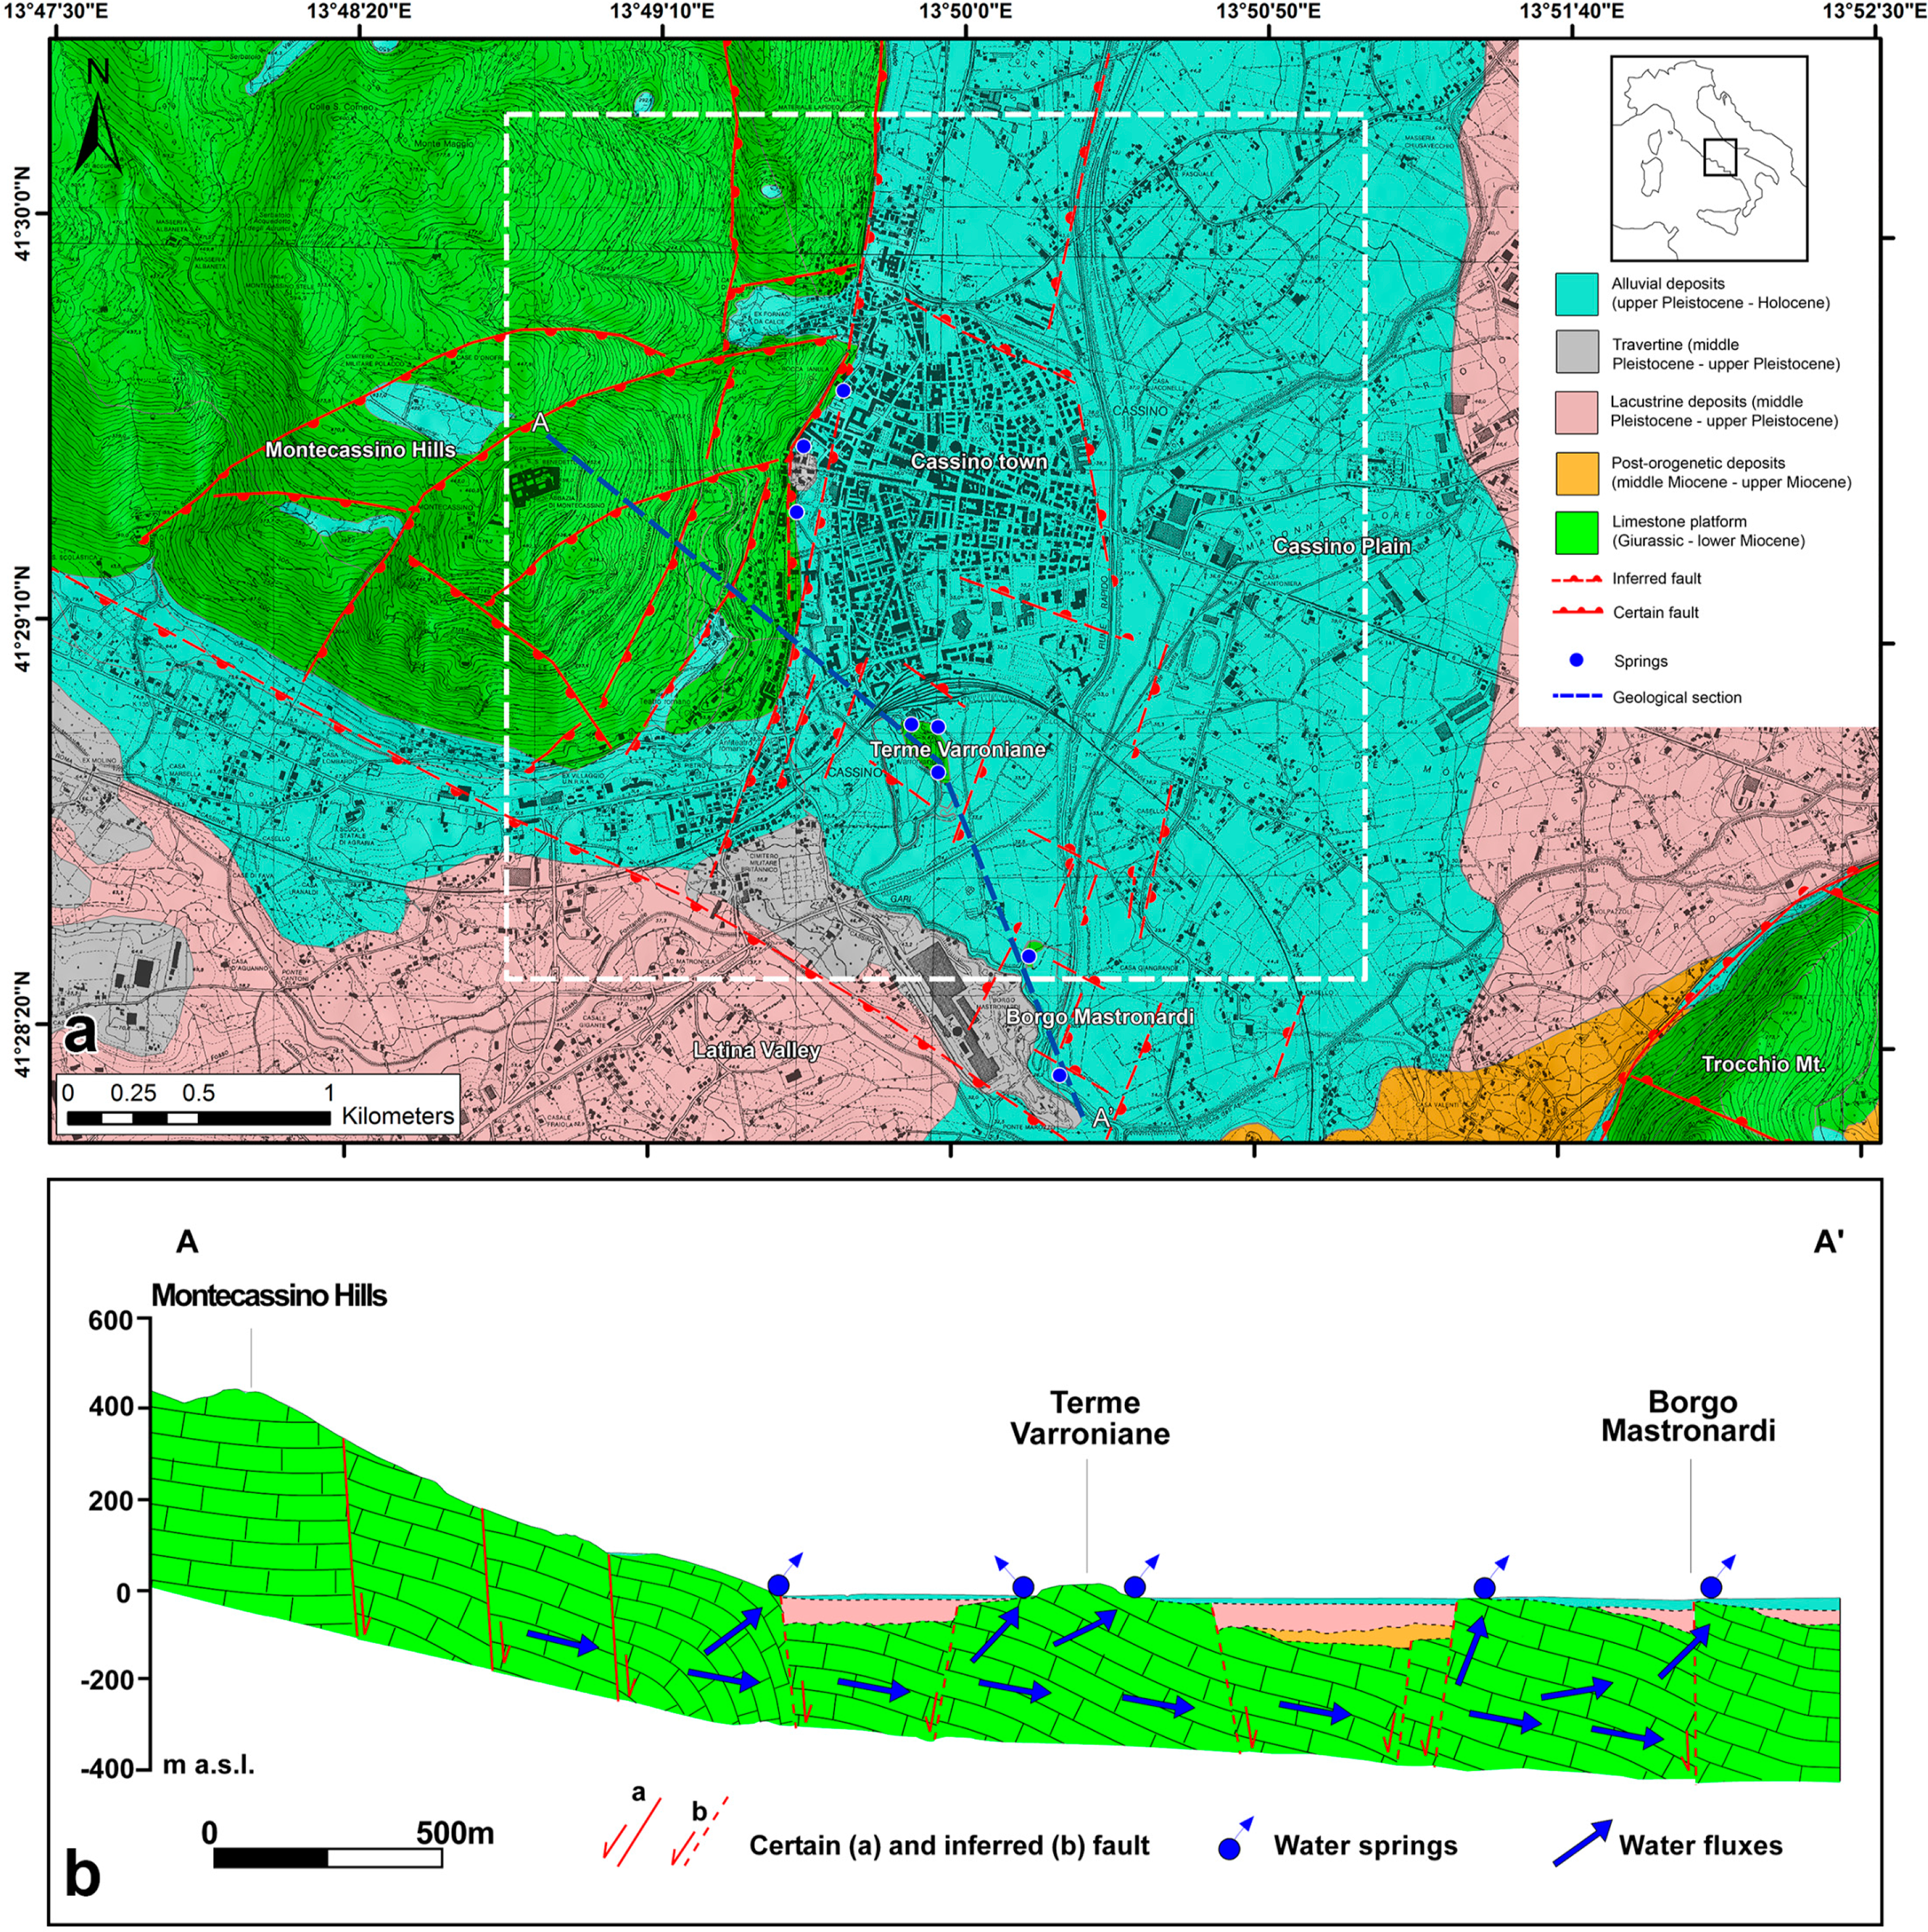
Along the Latina Valley, thrust-tectonics and late Quaternary faults generated a passage from an epi-continental environment to a lacustrine one, aided by the obstruction role played by the Roccamonfina volcano. From middle Pleistocene to upper Pleistocene, lacustrine sandy silts and silty clays with rare volcanic levels characterize the lowland sectors of the Cassino area [25]. Generated by a mixing between mineral and shallow waters, travertine plateaus upwards close the lacustrine series. Thus, alluvial deposits mark the passage towards current environmental conditions, characterized by the presence of coarse and fine-grained materials, mostly loose and/or normal consolidated. The localization and spatial distribution of the described units are shown in Figure 2a.
The structural setting of the plain is characterized by extensional features, superposed on a fold and thrust geometry related to the contractional phases. The main element is the active fault Atina-San Pietro Infine [19,26–28], which shows tectonic evidences since the Lias age [29]. The NW-SE and NE-SW ones (Figure 2a) are the prevailing fault with normal features and a horst and graben geometry. The Terme Varroniane and Borgo Mastronardi carbonatic outcrops (Figure 2a,b) can be considered two horsts of the above-mentioned system. Nonetheless, additional buried horsts [19] have been detected under the quaternary deposits, portraying a complex trend of the bedrock (i.e., sandstone and limestone). On the other hand, the western boundary has a NNE-SSW trend with a complex geometry with the prevalence of contractional features. After a detailed geological analysis, it is supposed the presence of an anticline fold along the whole Montecassino-Cassino slope [19].
The analysis of the Quaternary thickness and the relationship between lacustrine deposits and the older units outline as the basin was most likely to be already established before the lacustrine event, in accordance with a horst and graben geometry. In fact, lacustrine deposits locally lay on the Mesozoic-Cenozoic limestone, upper Tortonian sandstone and piggy-back deposits, showing erosional events (Figure 2b). However the sin-sedimentary action of the most tectonic elements (e.g., Atina-San Pietro fault), it is demonstrated by the huge variation of lacustrine thickness, ranging from few meters to more than 140 m [19].
From the geotechnical point of view, the deposits filling the basin are formed by lacustrine (fine grained) and fluvial (coarse grained) materials. The lacustrine fine-grained deposits appear as normalconsolidated, or slightly overconsolidated, with high values of the compressibility index. The fluvial coarse-grained soil consists of rounded particles, transported from the surrounding mountains by the rivers and deposited in the valley as debris fans. They appear as loose or slightly packed [30].
Finally, hydrogeological data are useful to support the geological model proposed. Gari springs (discharges of 13–15 m3/s) are scattered through the urban area of Cassino [31], by several springs and linear contributions along the Gari River. Highly permeable for karst, limestone represents the main hydrogeological reservoir, as well as sandstone, can be considered the regional aquiclude. Gari springs distribution and the discharge analysis ensures the continuity of the carbonatic structure and fit with the horst and graben model proposed before (Figure 2b). In this context laterally fed by the main karst reservoir, the lacustrine and alluvial deposits represent a multi-stratified aquifer. Therefore, aquifers show a water level nearly coincident with the ground level.
3. Multipass DInSAR Approach
DinSAR technique is based on the principle that, thanks to the very high stability of the satellite orbits, it is possible to exploit the informative contribution carried by the phase difference between two or more SAR images looking at the same scene from comparable geometries.
The phase difference, also named interferometric phase, is related to the different path of the signal back-scattered from the ground to the satellites and it is mainly due to possible surface displacements occurred in the time span between the two acquisitions [32].
Unfortunately, in the interferometric phase there are also other contributions that can affect the accuracy of the surface displacement measurements. In detail, the interferometric phase, φ, can be expressed as follows:
φDISP is the surface displacement contribution.
φTOP is related to the topography of the investigated scene and can be removed with an external Digital Elevation Model (DEM). According with the accuracy of the DEM some residual errors might be present also after this step.
φATM is the atmospheric contribution. It is related to the changes of the atmospheric conditions between different acquisitions that imply a difference of the signal path.
φFLAT is the “Flat Earth” contribution and can be minimized using precise orbital parameters.
φNOISE is mainly due to temporal decorrelation effects typical of snowy or vegetated area. Additionally, this contribution takes into account all other possible error sources like orbital uncertainties or thermal noise.
The availability of a large set of data and the multi-pass DinSAR approach, thanks to achieving a more accurate estimation, among the others, of atmospheric contribution and topographic phase component, allow reducing error sources and provide narrow constraints that limit the impact of noise.
In addition, the dense data temporal sampling makes it possible to study the temporal evolution of a phenomenon in order to provide time series and rate of the deformation process.
Considering a dataset composed by N SAR images, the multipass DinSAR approach leads the vectorial form of the problem expressed in Equation (1) where:
SAR data processing techniques dealing with the solution of problem above have been developed.
In urban scenarios and in all cases where the full pixel resolution is necessary, the Persistent Scatterers (PS) technique [15,16] is preferable. PS is a single-master approach working on full spatial resolution wrapped interferograms based on the concept that some natural or man-made point-targets are able to maintain the same properties during the entire acquisitions interval thus showing a very high coherence value.
On the other hand, the Small Baseline Subsets (SBAS) proposed by [17] counteracts the error sources working on multi-looked data and selecting the interferograms characterized by small perpendicular baseline. Therefore, it works better than PS in lower coherence areas and can be properly used in the study of medium and large-scale phenomena.
Furthermore, the IPTA analysis [18] works on PS in iterative way so that it is able to progressively improve the parameters estimation.
IPTA is also able to use a multi-baseline approach [33] that allows it to work with subsets of interferograms computed on high coherence and/or intensity points only, thus, merging SBAS and PS approaches. The main difference with SBAS approach is the capability to improve the parameters estimation in the interferometric phase. In addition, IPTA works on vector data structures thus allowing to reduce the computational time and data storage. This technique also exploits a weighting factor that penalizes fast velocity variations in phase variations thus providing a quasi-linear behavior of the time series. Thus, according to a priori knowledge of the deformation process, in the study of phenomena showing a quasi-linear slow deformation (subsidence, volcano uplift, etc.), small values of the weighting factor might be used in order to avoid slight seasonal oscillations. On the other hand, high values of the weighting factor might be exploited where isolated atmospheric spikes occur in the time series.
4. Cassino SAR Data
The ERS 1–2 dataset is composed of 45 SAR images acquired from April 1992 to September 2000 along descending orbit (Table S1 in supplementary files). In order to process, data such as the SBAS algorithm [17] (ENVI SARscape software) have been applied.
First, the images have been multi-looked by a factor of 4 in range and 20 in azimuth direction, respectively. Smoothed data with lower noise (speckle) level and a square pixel (spatial resolution of ∼80 × 80 m) have been obtained representing a good starting point for the interferometric SAR processing.
The DInSAR processing has generated 124 interferograms, based on the following constraints: maximum spatial perpendicular baseline and maximum temporal baseline fixed to 400 m and 1500 days, respectively.
The topographic phase component was removed using the 90 m Digital Elevation Model (DEM) provided by the Shuttle Radar Topography Mission (SRTM).
The second dataset consists of 33 Envisat SAR images spanning from October 2004 to August 2010 (Table S1 in supplementary material). They were also acquired along descending orbit with an incidence angle of 23° and an orbit inclination with respect to the geographic north equal to −167°.
In this case the multi baseline approach [33] proposed in the framework of the IPTA technique [18] and implemented in GAMMA software packages has been used. Envisat SAR data are characterized by a spatial resolution of about 20 m in range and 4 m in azimuth and ground coverage of about 100 × 100 kilometers. All the images were preliminary cut around the Cassino plain and then multilook factors of 2 and 10 (in range and azimuth direction respectively) have been applied in order to achieve a pixel size equal to 40 × 40 m in both directions.
The maximum perpendicular spatial baseline has been set to 400 m while the temporal baseline is between 1 and 350 days, with more than 90 interferograms. Although some of them have been discarded due to large decorrelated and noisy areas (probably due to the large vegetated areas in Central Italy), or atmospheric residuals and unwrapping problems, a consistent number of interferograms have been used for the study. Additionally, for Envisat data, SRTM DEM was used to remove the topographic phase. As stated above, fast ground changes hamper the possibility to study a specific area by means of DInSAR, being very sensitive to temporal decorrelation effects. In addition, in order to overcome or reduce this problem, the Goldstein filter [34] was applied, and high coherence and intensity thresholds (0.5 and 1.8, respectively) were used to select the points where estimating the displacement time series following the multi-baseline IPTA approach [33].
Such approach returned almost 5000 points like PS [15,16] clearly concentrated in the urbanized areas in the Cassino plain.
Furthermore, in order to provide a cross-validation of the results, two additional data processings have been performed. The IPTA method has been applied to the ERS 1–2 dataset whereas the Envisat dataset has been processed by SBAS approach. These results are shown in the supplementary material and they are in a general good agreement, as discussed in the following sections, thus providing a further evidence of the quality of the results.
5. Results and Discussion
The results in terms of surface velocity rate and displacement time series have been retrieved from both datasets considering the area bounded by the white box in Figure 2. The Line-of-Sight (LOS) velocity rate shows a quite stable behavior in the southern part of the city (displacements close to zero), whereas it is possible to note a subsidence rate growing from the center of the plain to the northern side (Figure 3a,b). The same patterns have been obtained by processing the ERS data with IPTA and the ENVISAT data with the SBAS approach (see Figure S1a,b in the supplementary material).
Despite the similar deformation pattern, the comparison of the 1992–2000 ERS 1–2 data series (Figure 3a) with the younger 2004–2010 Envisat data (Figure 3b) highlights that the subsidence rate slows down from about 5–6 mm/yr (± 1 mm) to about 2.5 mm/yr (± 1 mm) in the area where the larger subsidence is detected (NE of the urban area). Similar trends are also observed in the other more stable areas.
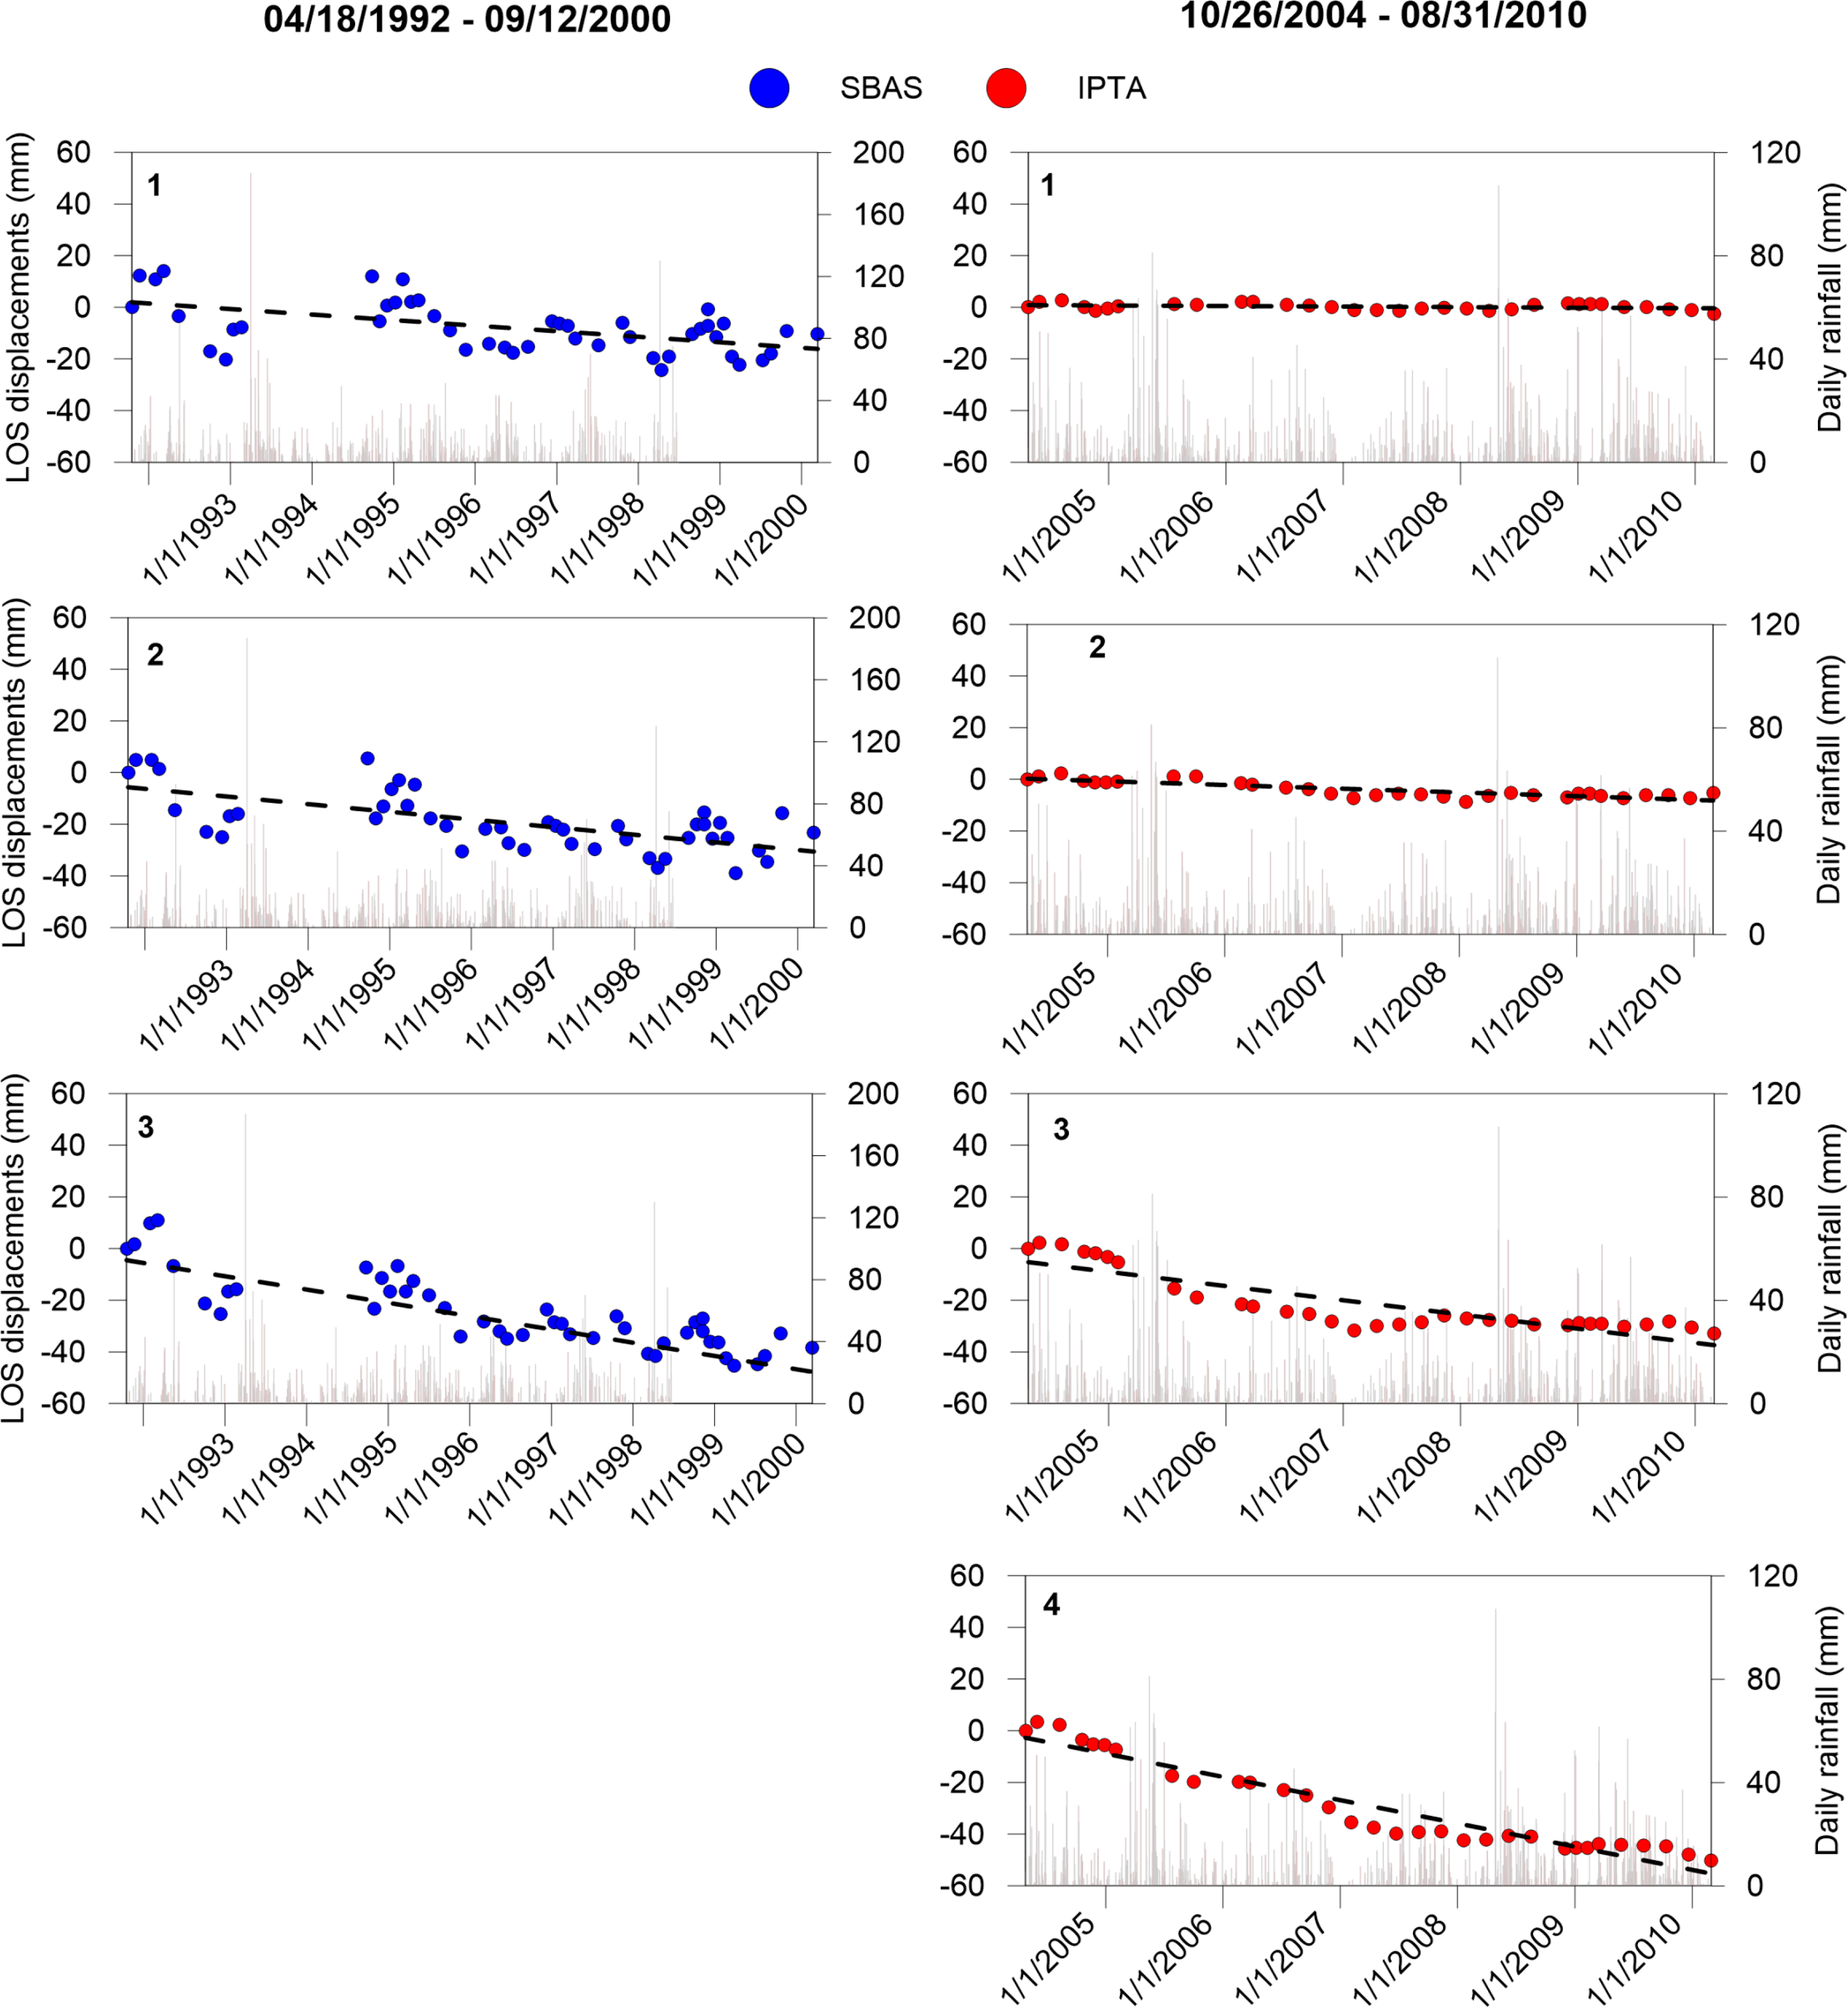
This behavior is confirmed by the time series of cumulated LOS deformation for some target points, located in the southern (point 1), central (point 2) and northern (point 3) part of the investigated area (Figure 3a,b).
The ERS 1–2 (1992–2000) time series (Figure 4) show a seasonal deformation due to the oscillation of the groundwater table during the dry and rainy season, as observed by the comparison with rainfall data [35]. This effect causes a change in ground stress and a consequent compression or dilation of the Quaternary shallow soils, as confirmed by the plot of Overconsolidation Ratio (OCR) (supplementary Figure S2), being maximum close to the ground surface and rapidly decreasing with depth [30]. Instead, the Envisat time series (2004–2010) appear more smoothed since they have been estimated using a weighting factor of 2 to reduce the slight oscillations around the linear trend. However, neglecting the seasonal effects it is possible to observe and compare a linear deformation trend for all points. The total subsidence increases moving from south (point 1) to north (point 3) of the plain. The point 1 appears stable in both datasets whereas the points 2 and 3 subside in a more accentuated way considering the ERS 1–2 data than Envisat data, clearly indicating a slowing down of the subsidence for the two investigated time span. Similar deformation trends are observed comparing the time series obtained in the same points from the ERS data, processed with IPTA method, and the ENVISAT data, processed with the SBAS approach (see Figure S3 in the supplementary material).
Since the same deformation pattern, characterized by the similar trend, is observed for both datasets, it is reasonable to expect a linear trend also during the interval 2000–2004 not covered by SAR data, thus this allows to suppose that the subsidence phenomenon detected in different periods is due to the same cause.
The observed subsidence is strictly related to the presence of the soft soils constituting the alluvial valley of Cassino plain. The recent alluvial deposits are the most susceptible to settle because of the superimposition of different loads related to the urbanization such as man-made fills, infrastructures (e.g., road embankments, railways, aqueducts), buildings [11], and, finally, the lowering of water table level due to the overexploitation of the aquifer [10].
In the present case, the detected deformation cannot be ascribable to the lowering of the water table induced by groundwater exploitation. Indeed, most of the water wells are located to the south of the urban center, capturing water from the deep aquifer, and the springs identified in Figure 2 have not suffered flow reductions in the last 20 years. Furthermore, groundwater overexploitation generally produces higher values of subsidence rate, in the order of several centimeters per year [10,36]. Therefore, the urban development of Cassino in the last century has been taken into account in order to explain the observed phenomenon.
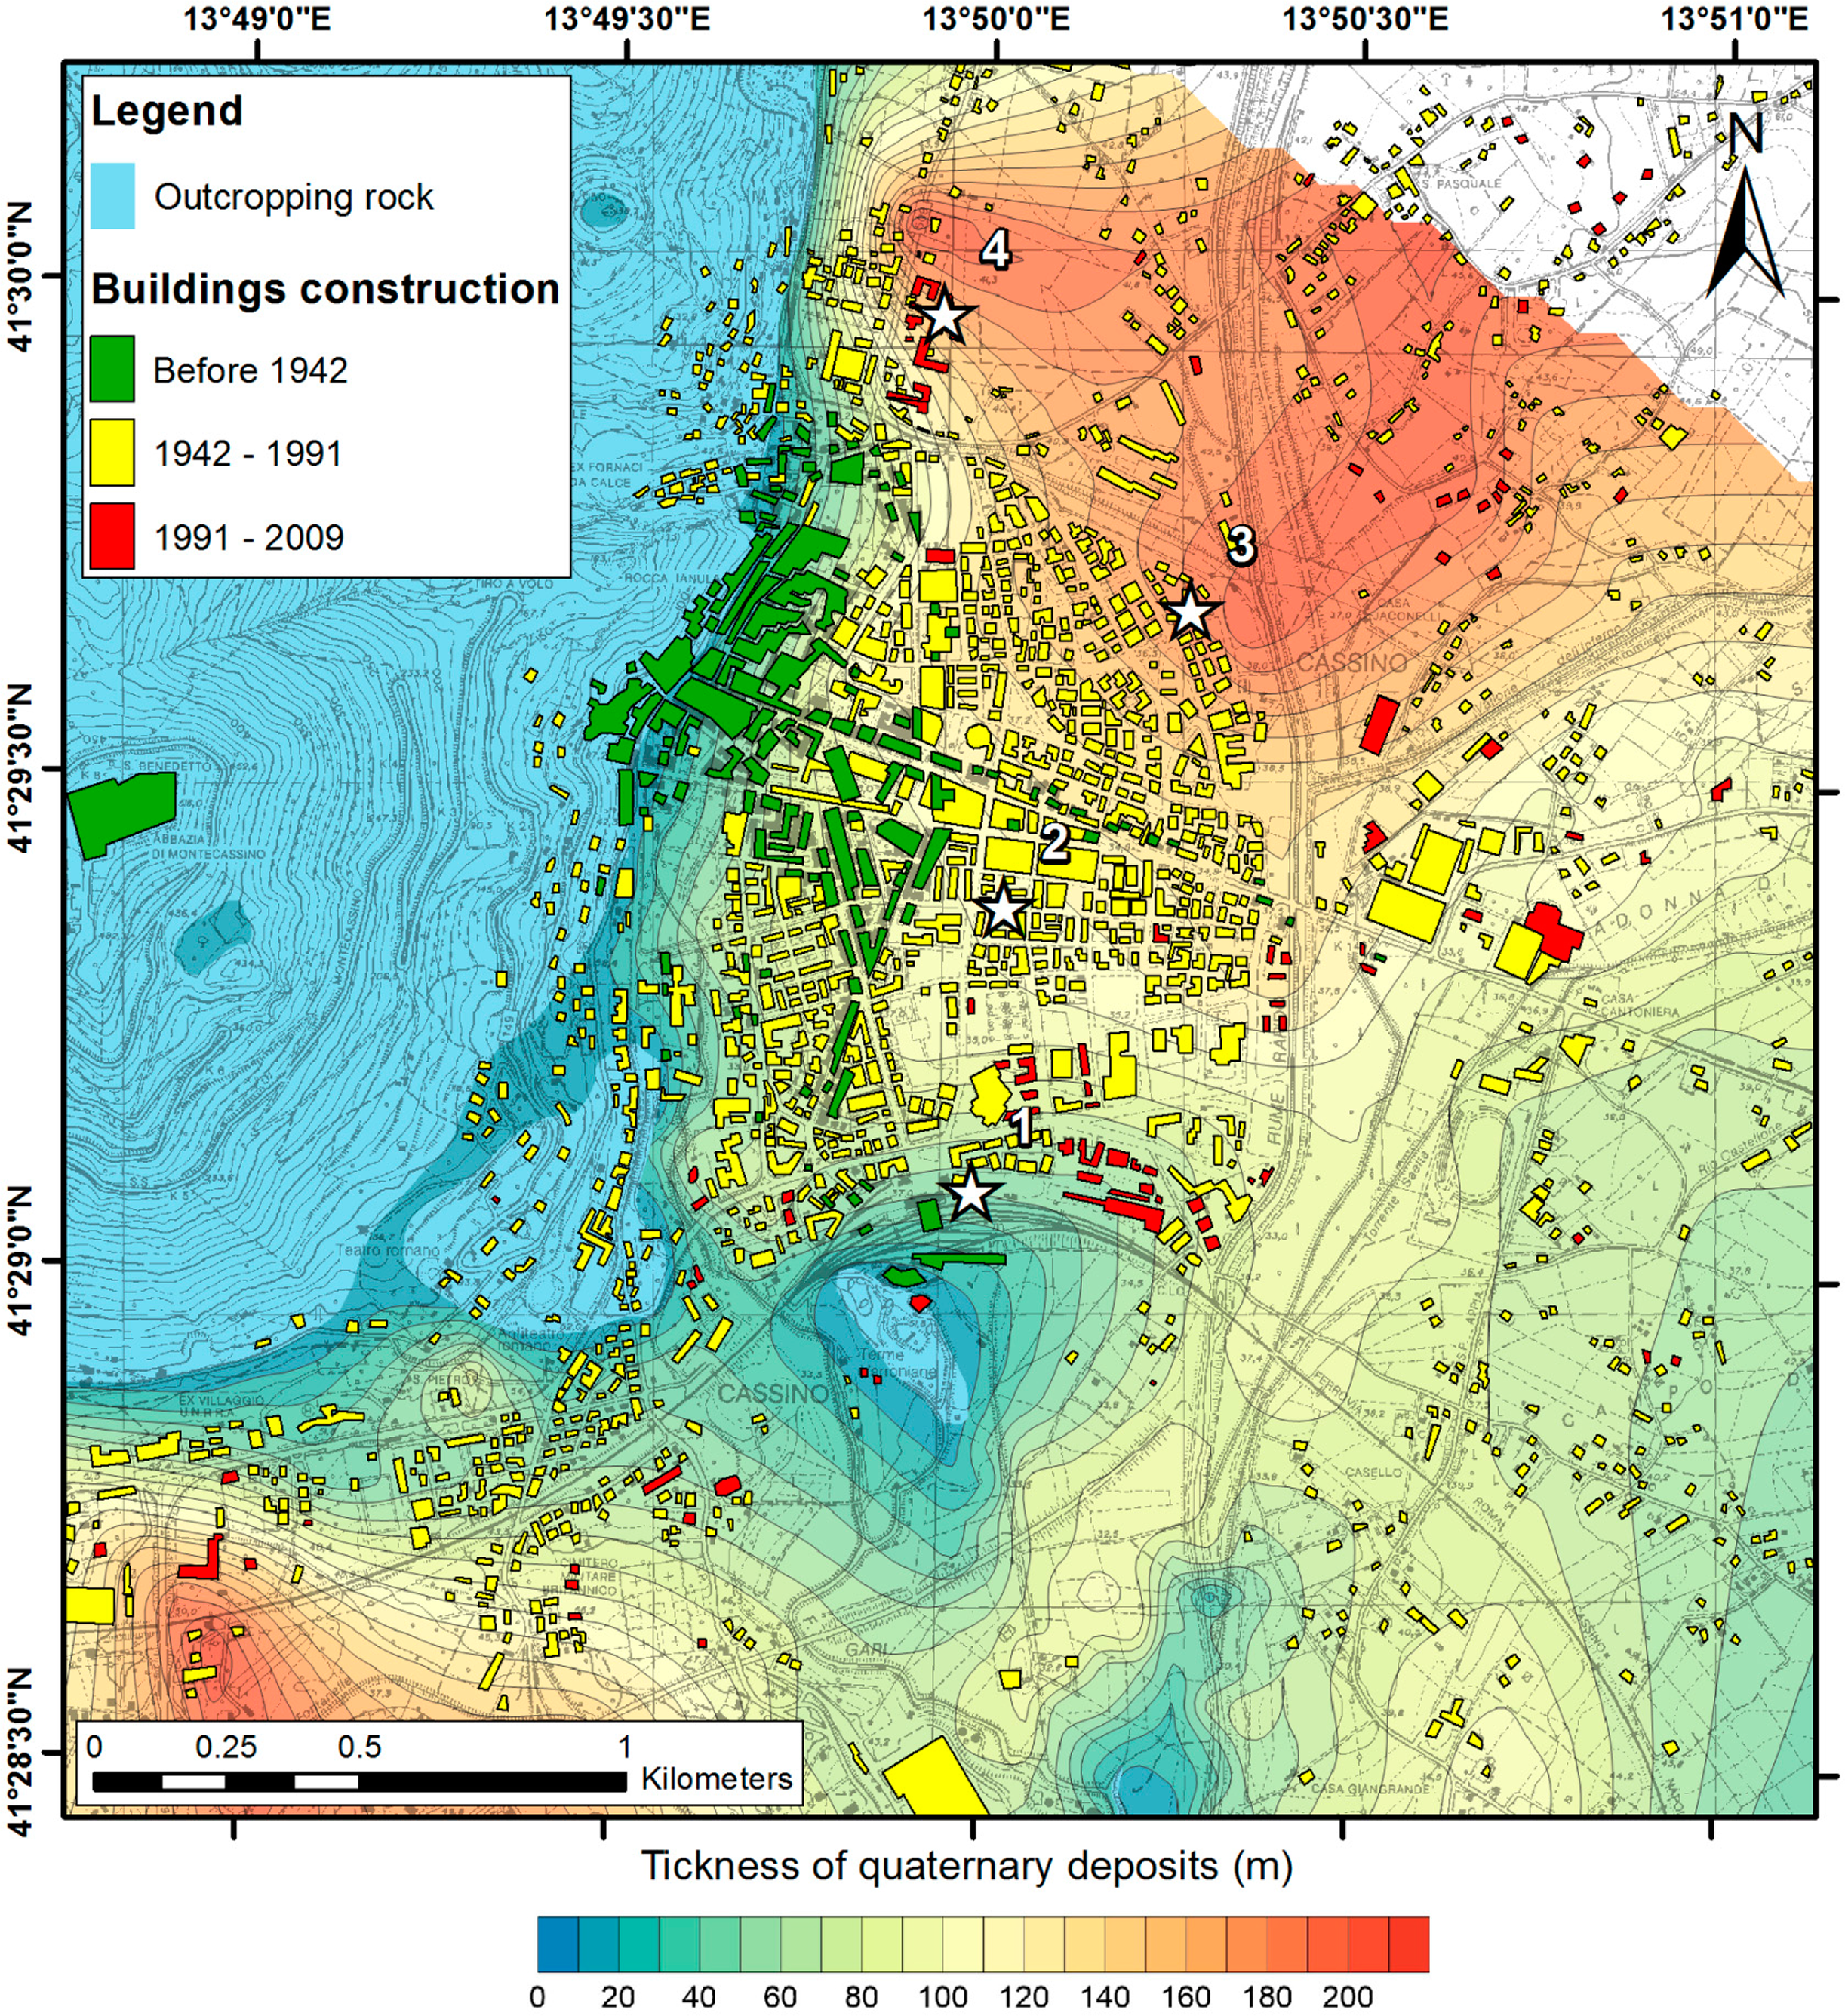
As observed in Figure 5, most of the buildings constituting the urban center have been built between the 1950s and 1990s, after the Second World War. Probably the greatest urban sprawl happened during the 1970s–1980s, according to the population growth (Figure 1), hence, about 10–30 years before the observation periods of ERS 1–2 and Envisat data.
Generally, such external loads produce settlements, which can be considered as the combination of primary consolidation processes and secondary compression, in agreement with the consolidation theory [37]. The settlements ascribable to the primary consolidation process are largely greater than those ones due to the secondary compression, the last ones being strictly related to viscous behavior of very fine-grained soils and, especially, of organic soils. Generally the magnitude and the time needed to complete the primary consolidation process depends on the thickness and compressibility of the loaded soils, on the hydraulic conductivity and on drainage condition and paths, being in some cases (i.e., thick layer of a very low permeability deposits involved in 1D consolidation process) very long such as some tens of years.
According to the geotechnical characteristics of the soils [30], the relatively fast decreasing trend observed by the comparison of DInSAR time series referring to 1992–2000 and 2004–2010 (Figure 4) suggests that an exponentially decreasing subsidence affects the alluvial deposits mainly due to the urbanization and the construction of buildings.
Regarding the observed subsidence pattern in Figure 3a,b, it is a clear consequence of the different thickness and lithology characterizing the soft alluvial deposits filling the Cassino basin. As a matter of fact, observing the contour map of the alluvial sediment thickness in Figure 5 [19,38], stable areas are located where the thickness of the alluvial deposits is smaller (point 1) as a direct consequence of the shorter time required to complete the consolidation process.
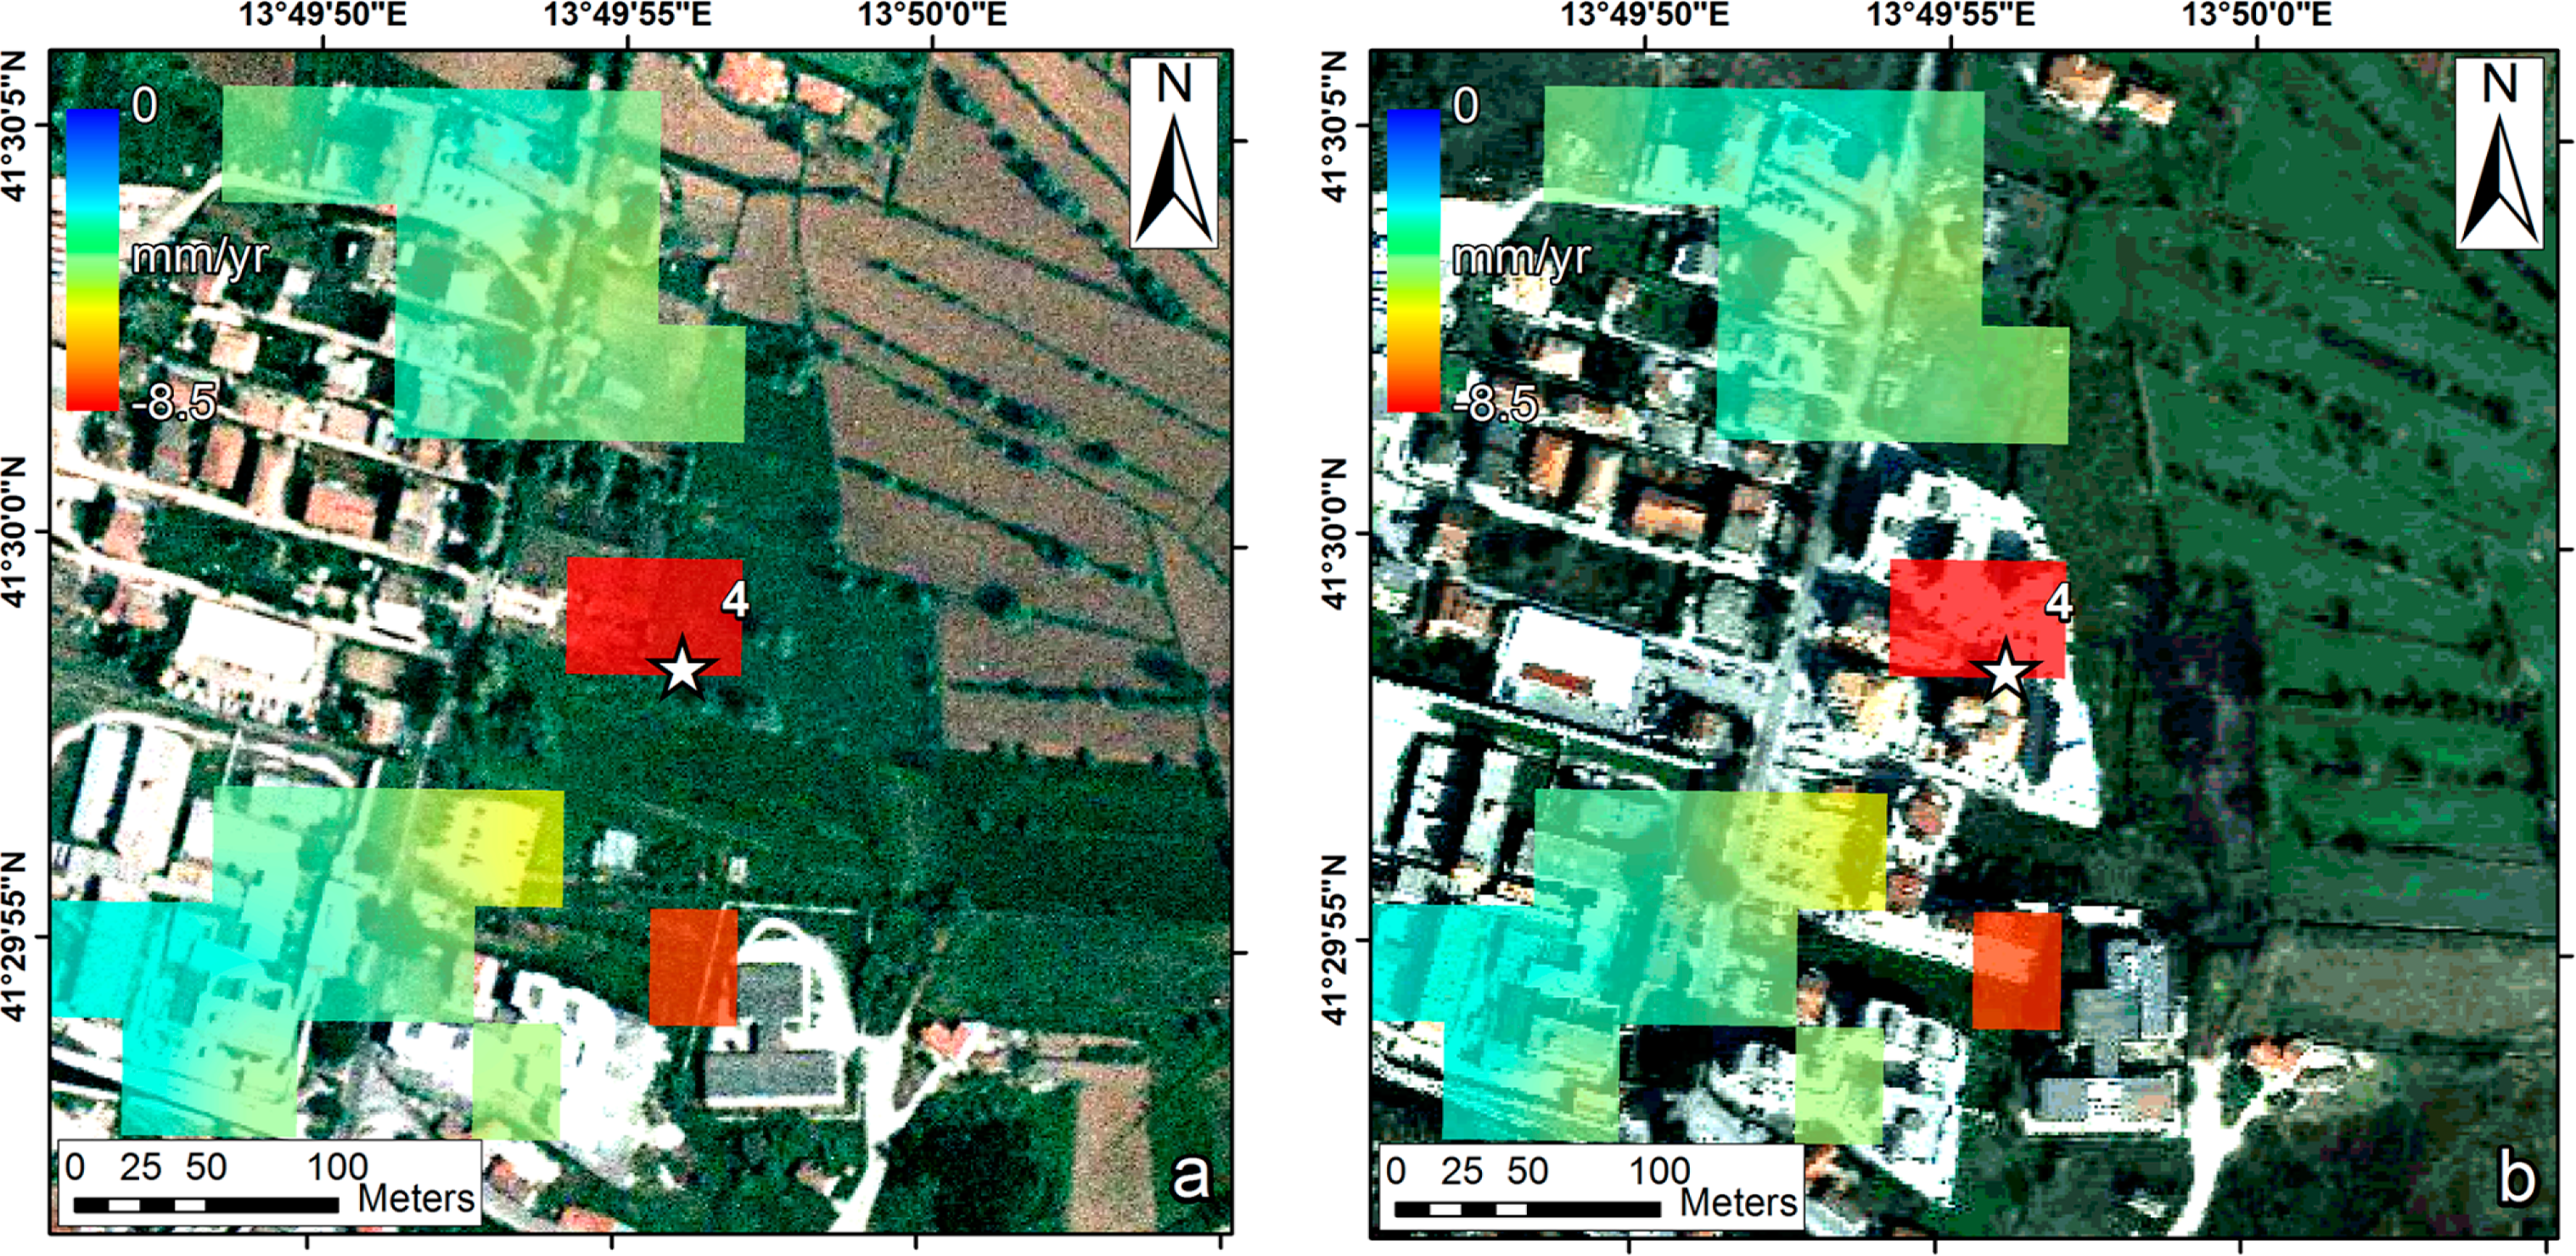
A further validation of the urbanization-induced subsidence is given by observing in the Envisat velocity map the occurrence of high rate of subsidence close to 9 mm/yr (± 1 mm) north of the city center (point 4 in Figure 3b), than to the smaller values (1–2 mm/yr ± 1 mm) detected in the surrounding areas. The observed isolated case occurs on recent, four-storey residential buildings, constructed in the last 10–15 years, as it is easy to infer observing the 2000 and 2009 digital orthophoto in Figure 6a,b, where the buildings are present only in the 2009 image. Time series of the detected displacement in the area (point 4 in Figures 3 and 6) reveal a total LOS displacement of about six centimeters in six years probably due to the ongoing consolidation process.
6. Conclusions
In the present study, the capabilities of multi-pass SAR Interferometry have been exploited to detect and investigate slow surface movements in the city of Cassino (Central Italy).
Two datasets of SAR images have been used, provided by ERS 1–2 (1992–2000) and Envisat (2004–2010) satellites thus covering from 1992 to 2010.
More precisely, SBAS and IPTA DInSAR approaches have been applied to the ERS 1–2 and Envisat dataset, respectively. Although slight differences in SBAS and IPTA processing chains, the outcomes are consistent each other, thus providing a convincing evidence of the robustness of the method.
Experimental results show a surface subsidence affecting the Cassino plain and characterized by a decreasing rate from 1992 to 2010, testifying a progressive reduction of the ongoing phenomenon. Concerning the spatial distribution, the detected subsidence tends to be more pronounced in the northern part of the city where it reaches values of about 5–6 mm/yr (± 1 mm) in 1992–2000 and 2–3 mm/yr (± 1 mm) between 2004 and 2010. On the other hand, the rest of the city is more stable, with a pattern of subsidence decreasing from the center to the southern part where it has values close to zero.
The cross-validation of the outcomes relies on two additional processing performed by applying the same technique and the same processing parameters to both dataset. These results, shown in the supplementary material, are in agreement with those presented in the main text.
The main achievements from remote sensing data have been fully explained and validated by a multidisciplinary approach, aiming at analyzing the relation with the geological setting and the anthropogenic activities leading to the urban development.
In fact, the detected deformation pattern is related to the joint effect of the urban expansion, leading to consolidation of soft soil deposits characterizing the Cassino plain, and the different thickness of the latters. The detected uneven deformation pattern and the different displacement time histories are clearly related to the different thickness of quaternary soft deposits. Indeed, in the northern part of the city both the subsidence rate peaks and the highest thickness of the deposits are present, suggesting that the consolidation process is still active. Instead, the lower subsidence rate detected in the southern part is probably due to the presence of thinner compressible deposits, for which the consolidation process is almost finished.
Supplementary Information
remotesensing-06-09676-s001.pdfAcknowledgments
The authors thank the European Space Agency (ESA) for providing ERS 1–2 and Envisat data.
Author Contributions
Marco Polcari and Matteo Albano developed the project, analyzed the data and wrote the manuscript. Marco Moro, Michele Saroli and Michele Lancia gave a significant contribution to improve the geological knowledge of the city of Cassino and deeply helped to provide the interpretation of the experimental results. Cristiano Tolomei and Salvatore Stramondo deeply contributed to the SAR data processing and to improve the quality of this manuscript.
Conflicts of Interest
The authors declare no conflict of interest.
References and Notes
- Massonet, D.; Rossi, M.; Carmona, C.; Adragna, F.; Peltzer, G.; Feigl, K.; Rabaute, T. The displacement field of the Landers earthquake mapped by radar interferometry. Nature 1993, 364, 138–142. [Google Scholar]
- Peltzer, G.; Rosen, P. Surface displacements of the 17 May 1993 Eureka Valley, California, earthquake observed by SAR interferometry. Science 1995, 268, 1333–1336. [Google Scholar]
- Stramondo, S.; Tesauro, M.; Briole, P.; Sansosti, E.; Salvi, S.; Lanari, R.; Anzidei, M.; Baldi, P.; Fornaro, G.; Avallone, A.; et al. The September 26, 1997 Colfiorito, Italy, earthquakes: Modeled coseismic surface displacement from SAR interferometry and GPS. Geophys. Res. Lett 1999, 26, 883–886. [Google Scholar]
- Stramondo, S.; Vannoli, P.; Cannelli, V.; Polcari, M.; Melini, D.; Samsonov, S.; Moro, M.; Bignami, C.; Saroli, M. X and C-band SAR surface displacement for the 2013 Lunigiana earthquake (Northern Italy): a breached relay ramp? IEEE J. Sel. Top. Appl. Earth Obs. Remote Sens 2014. [Google Scholar] [CrossRef]
- Moro, M.; Chini, M.; Saroli, M.; Atzori, S.; Stramondo, S.; Salvi, S. Analysis of large, seismically induced, gravitational deformations imaged by high-resolution COSMO-SkyMed synthetic aperture radar. Geology 2011, 39, 527–530. [Google Scholar]
- Strozzi, T.; Farina, P.; Corsini, A.; Ambrosi, C.; Thuring, M.; Zilger, J.; Wiesmann, A.; Wegmüller, U.; Werner, C. Survey and monitoring of landslide displacements by means of L-band satellite SAR interferometry. Landslides 2005, 2, 193–201. [Google Scholar]
- Massonet, D.; Briole, P.; Arnaud, A. Deflation of Mount Etna monitored by spaceborne radar interferometry. Nature 1995, 375, 567–570. [Google Scholar]
- Salvi, S.; Atzori, S.; Tolomei, C.; Allievi, J.; Ferretti, A.; Rocca, F.; Prati, S.; Stramondo, S.; Feuillet, N. Inflation rate of the Colli Albani volcanic complex retrieved by the permanent scatterers SAR interferometry technique. Geophys. Res. Lett 2004, 31, 1–4. [Google Scholar]
- Foumelis, M; Trasatti, E.; Papageorgiou, E.; Stramondo, S.; Parcharidis, I. Monitoring Santorini volcano (Greece) breathing from space. Geophys. J. Int 2013, 193, 161–170. [Google Scholar]
- Stramondo, S.; Saroli, M.; Tolomei, C.; Moro, M.; Doumaz, F.; Pesci, A.; Loddo, F.; Baldi, P.; Boschi, E. Surface movements in Bologna (Po Plain—Italy) detected by multitemporal DInSAR. Remote Sens. Environ 2007, 110, 304–316. [Google Scholar]
- Stramondo, S.; Bozzano, F.; Marra, F.; Wegmuller, U.; Cinti, F.R.; Moro, M.; Saroli, M. Subsidence induced by urbanization in the city of Rome detected by advanced InSAR technique and geotechnical investigations. Remote Sens. Environ 2008, 112, 3160–3172. [Google Scholar]
- Wegmüller, U.; Werner, C. Retrieval of vegetation parameters with SAR interferometry. IEEE Trans. Geosci. Remote Sens 1997, 35, 18–24. [Google Scholar]
- Goldstein, R.; Engelhard, R.; Kam, B.; Frolich, R. Satellite radar interferometry for monitoring ice sheet motion: application to an Antarctic ice stream. Science 1993, 262, 1525–1530. [Google Scholar]
- Kenyi, L.W.; Kaufmann, V. Estimation of rock glacier surface deformation using SAR interferometry data. IEEE Trans. Geosci. Remote Sens 2003, 41, 1512–1515. [Google Scholar]
- Ferretti, A.; Prati, C.; Rocca, F. Nonlinear subsidence rate estimation using permanent scatterers in differential SAR interferometry. IEEE Trans. Geosci. Remote Sens 2000, 38, 2202–2212. [Google Scholar]
- Ferretti, A.; Prati, C.; Rocca, F. Permanent scatterers in SAR interferometry. IEEE Trans. Geosci. Remote Sens 2001, 39, 8–20. [Google Scholar]
- Berardino, P.; Fornaro, G.; Lanari, R.; Sansosti, E. A new algorithm for surface deformation monitoring based on small baseline differential SAR interferograms. IEEE Trans. Geosci. Remote Sens 2002, 40, 2375–2383. [Google Scholar]
- Werner, C.; Wegmuller, U.; Strozzi, T.; Wiesmann, A. Interferometric point target analysis for deformation mapping. In Proceedings of the 2003 IEEE International Geoscience and Remote Sensing Symposium, Toulouse, France, 21–25 July 2003; pp. 4362–4364.
- Saroli, M.; Lancia, M.; Albano, M.; Modoni, G.; Moro, M.; Scarascia Mugnozza, G. New geological data on the Cassino intermontane basin, central Apennines, Italy. Rend. Lincei 2014. [Google Scholar] [CrossRef]
- Accordi, B.; Angelucci, A.; Sirna, G. Note Illustrative Della Carta Geologica D’ITALIA alla Scala 1:100.000 Fogli 159 e 160 Frosinone e Cassino; Servizio Geologico Italiano: Roma, Italy, 1967. [Google Scholar]
- Corda, L.; Brandano, M. Aphotic zone carbonate production on a Miocene ramp, Central Apennines, Italy. Sediment. Geol 2003, 161, 55–70. [Google Scholar]
- Cipollari, P.; Cosentino, D. Miocene unconformities in the Central Apennines: Geodynamic significance and sedimentary basin evolution. Tectonophysics 1995, 252, 375–389. [Google Scholar]
- Centamore, E.; di Manna, P.; Rossi, D. Kinematic evolution of the Volsci Range: A new overview. Boll. Soc. Geol. Ital 2007, 126, 159–172. [Google Scholar]
- Pasquali, V.; Castorina, F.; Cipollari, P.; Cosentino, D.; Lo Mastro, S. I depositi tardo-orogenici della Valle Latina meridionale: Stratigrafia e implicazioni cinematiche per l’evoluzione dell’Appennino Centrale. Boll. Soc. Geol. Ital 2007, 126, 101–118. [Google Scholar]
- Devoto, G. Lacustrine Pleistocene in the lower Liri Valley. Geol. Romana 1965, 4, 291–368. [Google Scholar]
- Bosi, V. Evidenze di attività Tettonica durante il Pleistocene Medio–Olocene nel Lazio sud–orientale ed aree attigue. Pubbl. Ist. Naz. Geof. Roma 1995, 564, 1–32. [Google Scholar]
- Barchi, M.; Galadini, F.; Lavecchia, G.; Messina, P.; Michetti, A.M.; Peruzza, L.; Pizzi, A.; Tondi, E.; Vittori, E. Sintesi delle Conoscenze Sulle Faglie Attive in Italia Centrale; CNR Gruppo Nazionale Difesa Terremoti: Roma, Italy, 2000. [Google Scholar]
- Roberts, P.G.; Michetti, A.M.; Cowie, P.; Morewood, N.C.; Papanikolau, I. Fault slip-rate variations during crustal-scale strain localization, central Italy. Gephys. Res. Lett 2002. [Google Scholar] [CrossRef]
- Cavinato, G.P.; Sirna, M. Elementi di tettonica transpressiva lungo la linea di Atina (Lazio Meridionale). Mem. Soc. Geol. Ital 1988, 41, 1179–1190. [Google Scholar]
- Modoni, G.; Saroli, M.; Darini, G. Characterization at urban scale of the subsoil of Cassino. In Proceedings of the XIV European Conference on Soil Mechanics and Geotechnical Engineering ECSMGE, Madrid, Spain, 24–27 September 2007; pp. 1727–1732.
- Boni, C.F.; Bono, P.; Capelli, G. Schema Idrogeologico dell’Italia Centrale. Carta Idrogeologica, C. Idrologica, C. dei Bilanci Idrogeologici, Scala 1:500000. Mem. Ital. Geol. Soc. (Ital.) 1986, 35, 991–1012. [Google Scholar]
- Bürgmann, P.; Rosen, P.A.; Fielding, E.J. Synthetic aperture radar interferometry to measure Earth’s surface topography and its deformation. Annu. Rev. Earth Planet. Sci 2000, 28, 169–209. [Google Scholar]
- Werner, C.; Strozzi, T.; Wegmuller, U. Deformation time-series of the lost-hills oil field using a multi-baseline interferometric SAR inversion algorithm with finite difference smoothing constraints. In Proceedings of AGU Fall Meeting, San Francisco, CA, USA, 3–7 December 2012.
- Goldstein, R.; Werner, C. Radar interferogram filtering for geophysical applications. Geophys. Res. Lett 1998, 25, 4035–4038. [Google Scholar]
- Ufficio Idrografico e Mareografico di Roma. Available online: http://www.idrografico.roma.it/default.aspx (accessed on 24 April 2014).
- Chaussard, E.; Wdowinski, S.; Cabral-Cano, E.; Amelung, F. Land subsidence in central Mexico detected by ALOS InSAR time-series. Remote Sens. Environ 2014, 140, 94–106. [Google Scholar]
- Terzaghi, K.; Peck, R.B. Soil Mechanics in Engineering Practice; John Wiley & Sons: Hoboken, NJ, USA, 1967. [Google Scholar]
- Albano, M.; Lancia, M.; Saroli, M.; Modoni, G.; Scarascia Mugnozza, G.; Croce, P. Seismic microzonation of the Cassino plain. In Engineering Geology for Society and Territory—Volume 5; Springer International Publishing: Cham, Switzerland, 2015; pp. 1115–1118. [Google Scholar]


© 2014 by the authors; licensee MDPI, Basel, Switzerland This article is an open access article distributed under the terms and conditions of the Creative Commons Attribution license (http://creativecommons.org/licenses/by/4.0/).
Share and Cite
Polcari, M.; Albano, M.; Saroli, M.; Tolomei, C.; Lancia, M.; Moro, M.; Stramondo, S. Subsidence Detected by Multi-Pass Differential SAR Interferometry in the Cassino Plain (Central Italy): Joint Effect of Geological and Anthropogenic Factors? Remote Sens. 2014, 6, 9676-9690. https://0-doi-org.brum.beds.ac.uk/10.3390/rs6109676
Polcari M, Albano M, Saroli M, Tolomei C, Lancia M, Moro M, Stramondo S. Subsidence Detected by Multi-Pass Differential SAR Interferometry in the Cassino Plain (Central Italy): Joint Effect of Geological and Anthropogenic Factors? Remote Sensing. 2014; 6(10):9676-9690. https://0-doi-org.brum.beds.ac.uk/10.3390/rs6109676
Chicago/Turabian StylePolcari, Marco, Matteo Albano, Michele Saroli, Cristiano Tolomei, Michele Lancia, Marco Moro, and Salvatore Stramondo. 2014. "Subsidence Detected by Multi-Pass Differential SAR Interferometry in the Cassino Plain (Central Italy): Joint Effect of Geological and Anthropogenic Factors?" Remote Sensing 6, no. 10: 9676-9690. https://0-doi-org.brum.beds.ac.uk/10.3390/rs6109676