GPR Laboratory Tests For Railways Materials Dielectric Properties Assessment


Abstract
: In railways Ground Penetrating Radar (GPR) studies, the evaluation of materials dielectric properties is critical as they are sensitive to water content, to petrographic type of aggregates and to fouling condition of the ballast. Under the load traffic, maintenance actions and climatic effects, ballast condition change due to aggregate breakdown and to subgrade soils pumping, mainly on existing lines with no sub ballast layer. The main purpose of this study was to validate, under controlled conditions, the dielectric values of materials used in Portuguese railways, in order to improve the GPR interpretation using commercial software and consequently the management maintenance planning. Different materials were tested and a broad range of in situ conditions were simulated in laboratory, in physical models. GPR tests were performed with five antennas with frequencies between 400 and 1800 MHz. The variation of the dielectric properties was measured, and the range of values that can be obtained for different material condition was defined. Additionally, in situ GPR measurements and test pits were performed for validation of the dielectric constant of clean ballast. The results obtained are analyzed and the main conclusions are presented herein.1. Introduction
In the last decades, railways have been subjected to a fast development in terms of traffic speeds and axle loads. On the other hand, the requirements of passengers comfort and safety have to be maintained at high levels and the environmental demands have to be fulfilled [1]. In particular, higher traffic speeds result in an increase of the dynamic effects during operation, and consequently lead to a faster degradation of the track. Also, climatic changes enable increased track deterioration. These aspects result in a worse track performance, that can also influence other railway components, and it can increase the risk of derailment.
Monitoring actions are usually performed by using track inspection vehicles [2,3]. They enable the evaluation of track condition and the detection of geometric defects, which are corrected later on, if needed. They present the main advantages of inducing the similar dynamic loads as regular trains, measuring at the traffic speed and also of performing the track assessment in a continuous way, without traffic interdictions. Currently in Portugal it is used a self-propelled inspection vehicle, a Plasser and Theurer EM-120, running at a maximum speed of 120 km/h. The vehicle allows the evaluation of all track geometric parameters using an inertial system, rail profile wear and corrugation with independent laser systems, catenary static geometric parameters and also track gauge with a laser system. Measurements of the short-wave defects of the track (<1 m) are also performed occasionally in the Portuguese network. Anyway, aforementioned procedure does not detect the real causes of a rail level deficiency, which can be caused by the presence of ballast pockets, fouled ballast, poor drainage, subgrade settlements and transitions problems [4–8]. Therefore, an important factor for maintenance decision is the substructure condition assessment. With this aim, suitable techniques have to be chosen. Non-destructive tests represent an efficient monitoring tool, as they allow to evaluate infrastructure characteristics in a continuous or quasi-continuous way, saving time and costs. For example equipment that are used successfully for pavements evaluation, such as Ground Penetrating Radar (GPR) and Falling Weight Deflectometer (FWD), can be used also for railway evaluation [9,10].
In the last years, the development of new GPR systems with higher antenna frequencies, better data acquisition systems, more user friendly software and new algorithms for calculation of materials properties have been leading to more generalized use of GPR also for railways. In some countries, GPR tests have been performed along tracks with the aim of detecting zones with problems in both ballast and subsoil layers. First results have shown that GPR is a reliable technique to assess track geometry problems and consequently to improve maintenance planning [11–16].
In particular, with the aim of improving GPR data analysis through an appropriate interpretation, reliable information of dielectric properties of tested materials is required. These characteristics affect GPR signal propagation, reflection and data resolution; therefore, it is important to study which factors influence the dielectric constants and in which degree. Then, a proper calibration phase is always required, namely by performing in situ tests pits and laboratory tests.
In particular, laboratory tests for determining the dielectric properties of infrastructure materials have been performed along several years in different countries, as materials used in the infrastructure are different for different design procedures [17–24].
In this paper, an extensive experimental work was done for the assessment of dielectric properties in laboratory for railway infrastructures materials and their sensitivity to different conditions, in terms of both water content and fouling level, with GPR antennas of five different frequencies. Also, results are presented of a railtrack survey including GPR measurements with 400 MHz antenna and in situ test pits done aiming to validate the laboratory results.
This information can contribute for a better interpretation of GPR measurements performed on Portuguese railways.
2. Case Studies
2.1. Introduction
In Portugal, railway monitoring is performed by using Plasser and Theurer EM-120 track inspection. This equipment is able to assess track performance by detecting geometric defects, among other parameters, but does not enable the identification of their causes. For a better railway evaluation at network level and in order to develop an efficient maintenance policy, the National Railway Administration (REFER) acquired three GPR antennas, of 400 MHz, produced by Ingegneria dei Sistemi (IDS). As consequence, a research project between REFER and National Laboratory for Civil Engineering (LNEC) is ongoing aiming at improving the data interpretation process and the calibration of the default values, generally used for GPR interpretation in commercial software, to realistic values of materials used in Portuguese railways, in different in situ condition.
In order to improve the data interpretation for the antennas recently acquired by REFER and the GPR applicability for the Portuguese railways condition, dedicated laboratory tests were carried out on railway materials. In particular, the aim was to determine their dielectric properties and their sensitivity to water content and fouling level.
LNEC’s experience in laboratory for materials characterization with GPR began 15 years ago, when GPR tests were performed for the first time on Portuguese railways [18,20]. Therefore, beside the recently acquired antenna all the laboratory tests were performed also with four other antennas of frequencies between 500 and 1800 MHz, generally used for railways and pavement evaluation at LNEC.
2.2. Physical Models
Several GPR laboratory tests were performed in order to measure the dielectric constant values of the railway materials and their sensitivity to water content, fouling level and antennas frequencies.
Two materials and mixtures of them in different proportion, simulating a third material, were characterized in laboratory according to the required specifications. The materials are:
▪ a clean granite ballast;
▪ a silt soil;
▪ a fouled ballast, as a mixture of the first two.
The most recently developed index, proposed in literature, was considered for fouling simulation, namely the “Relative Ballast Fouling Ratio” (Rb-f) [21]. It represents the ratio between solid volume of the ballast particles (passing a 9.5 mm sieve) and ballast particles (retained on a 9.5 mm sieve).
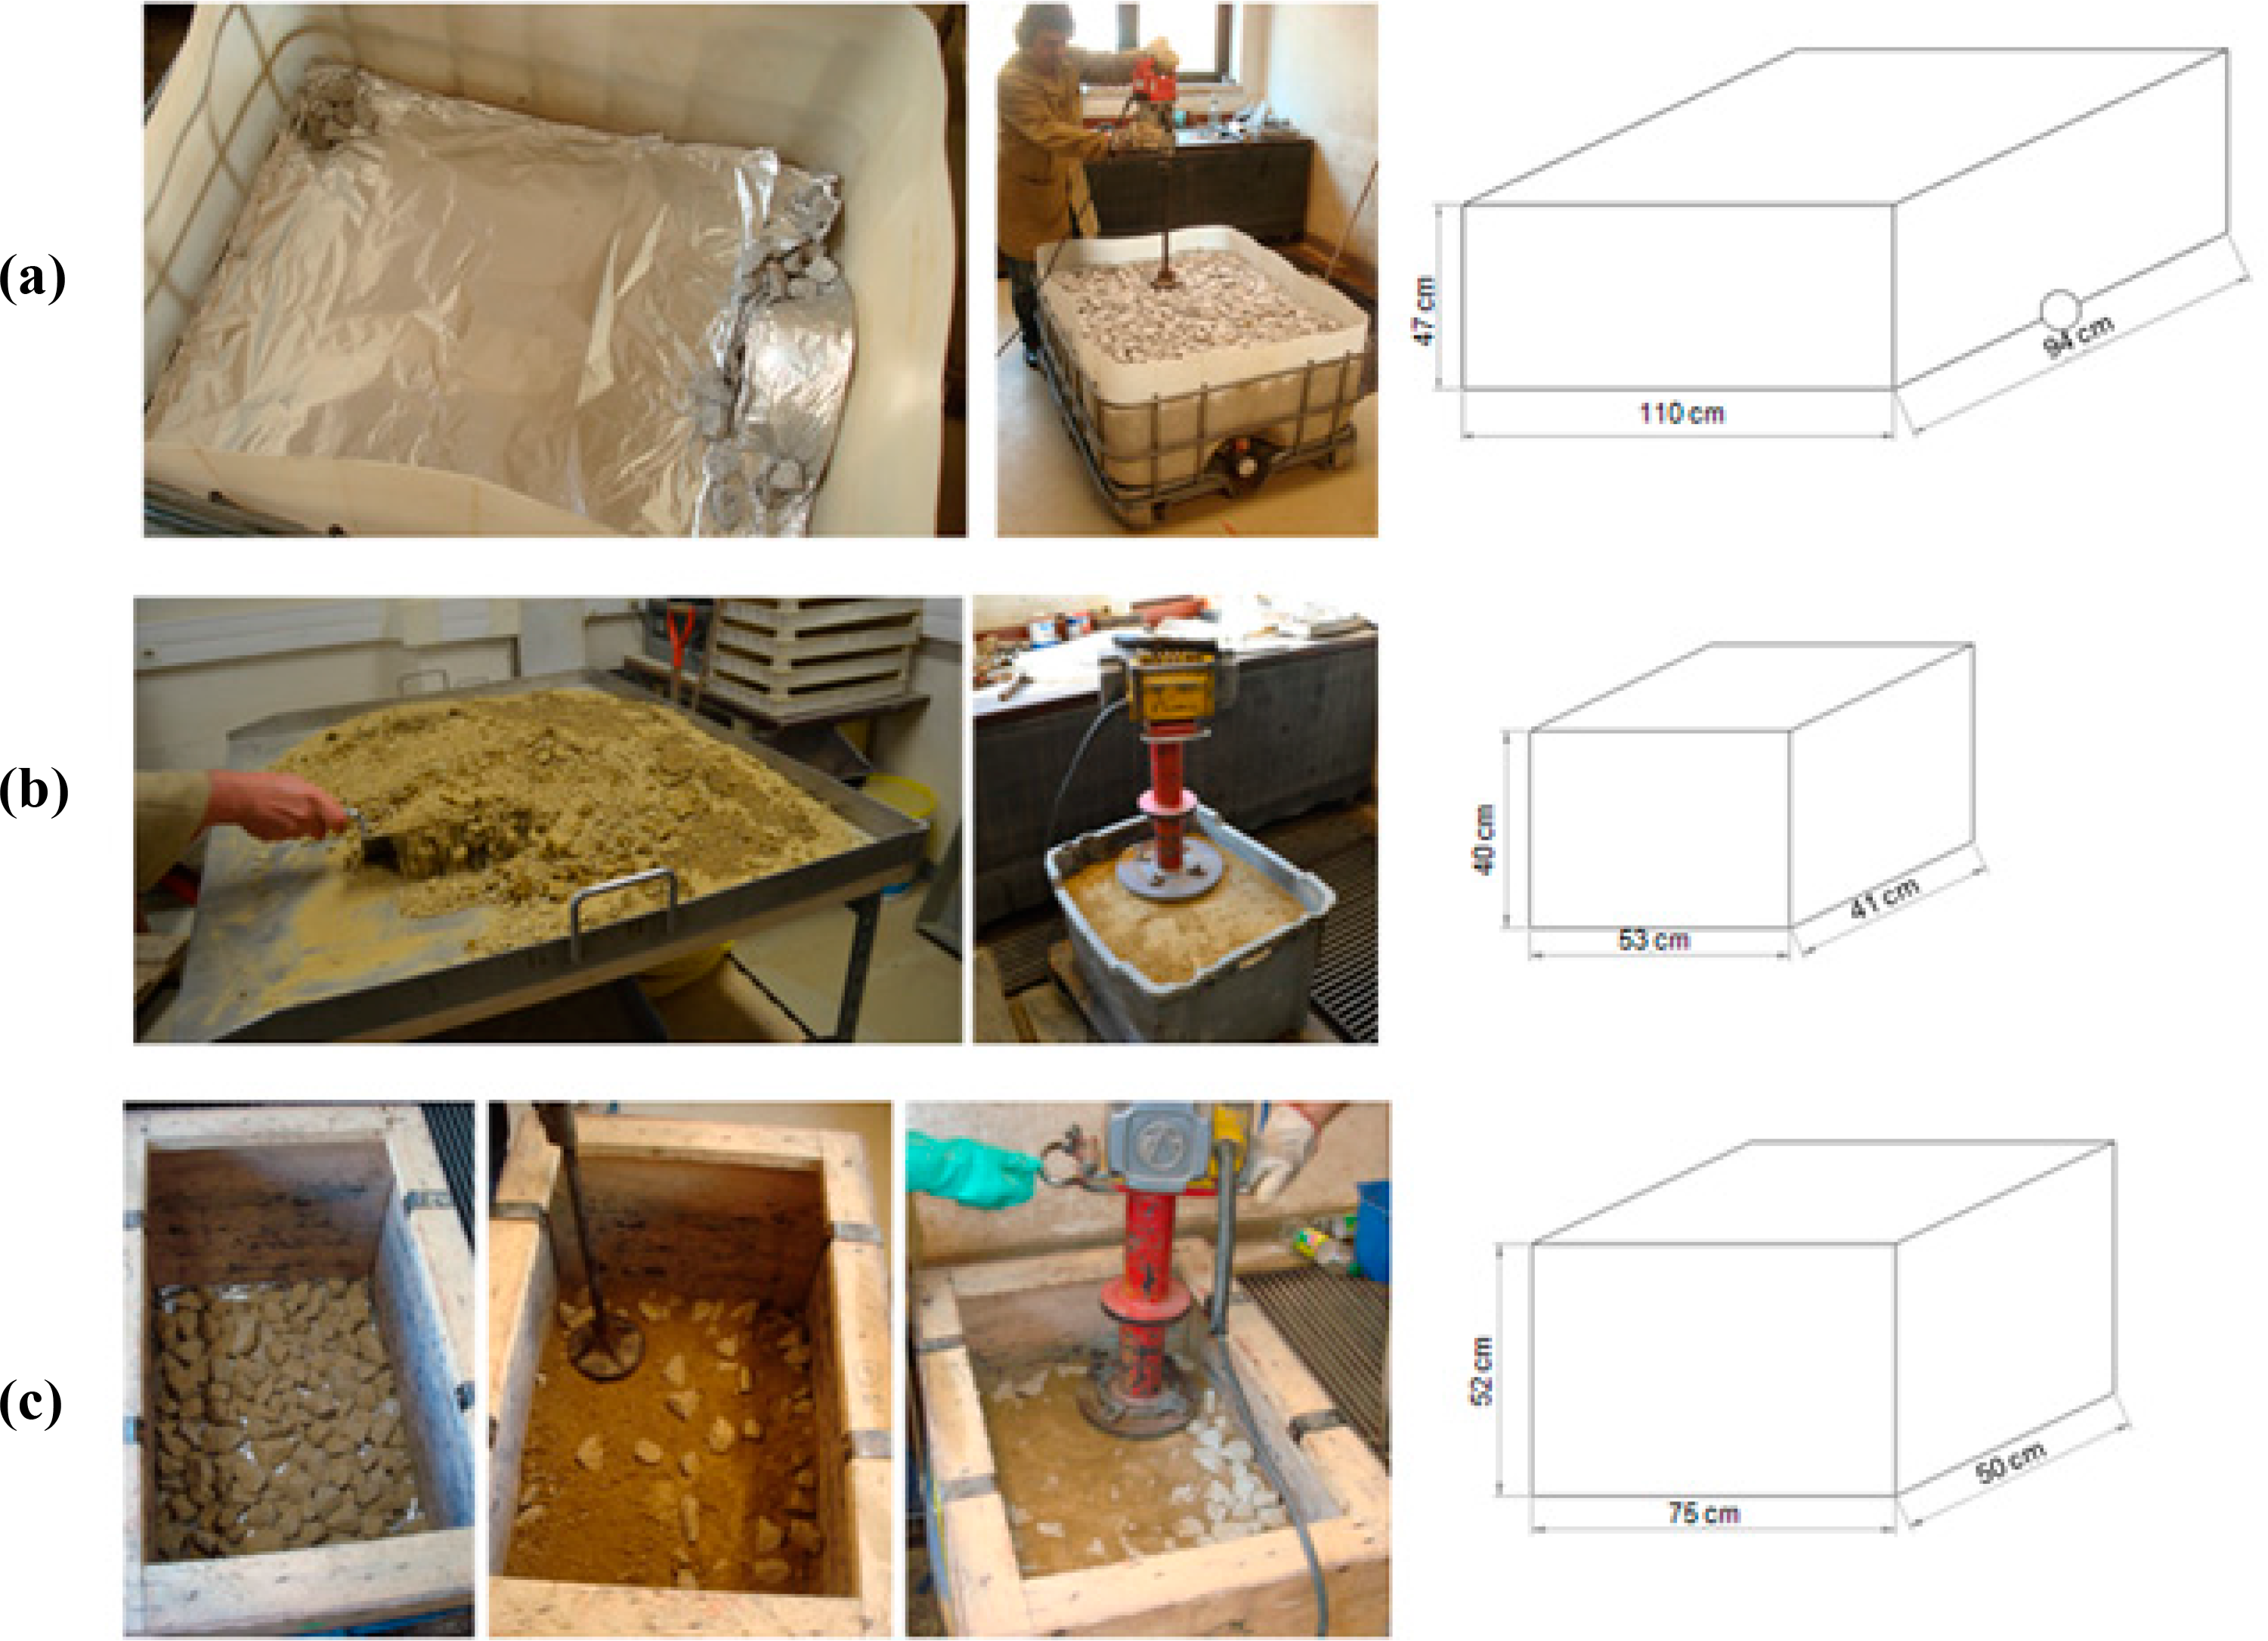
For the construction of the physical models, different boxes and two hand compactors were used, one lighter and one heavier, respectively.
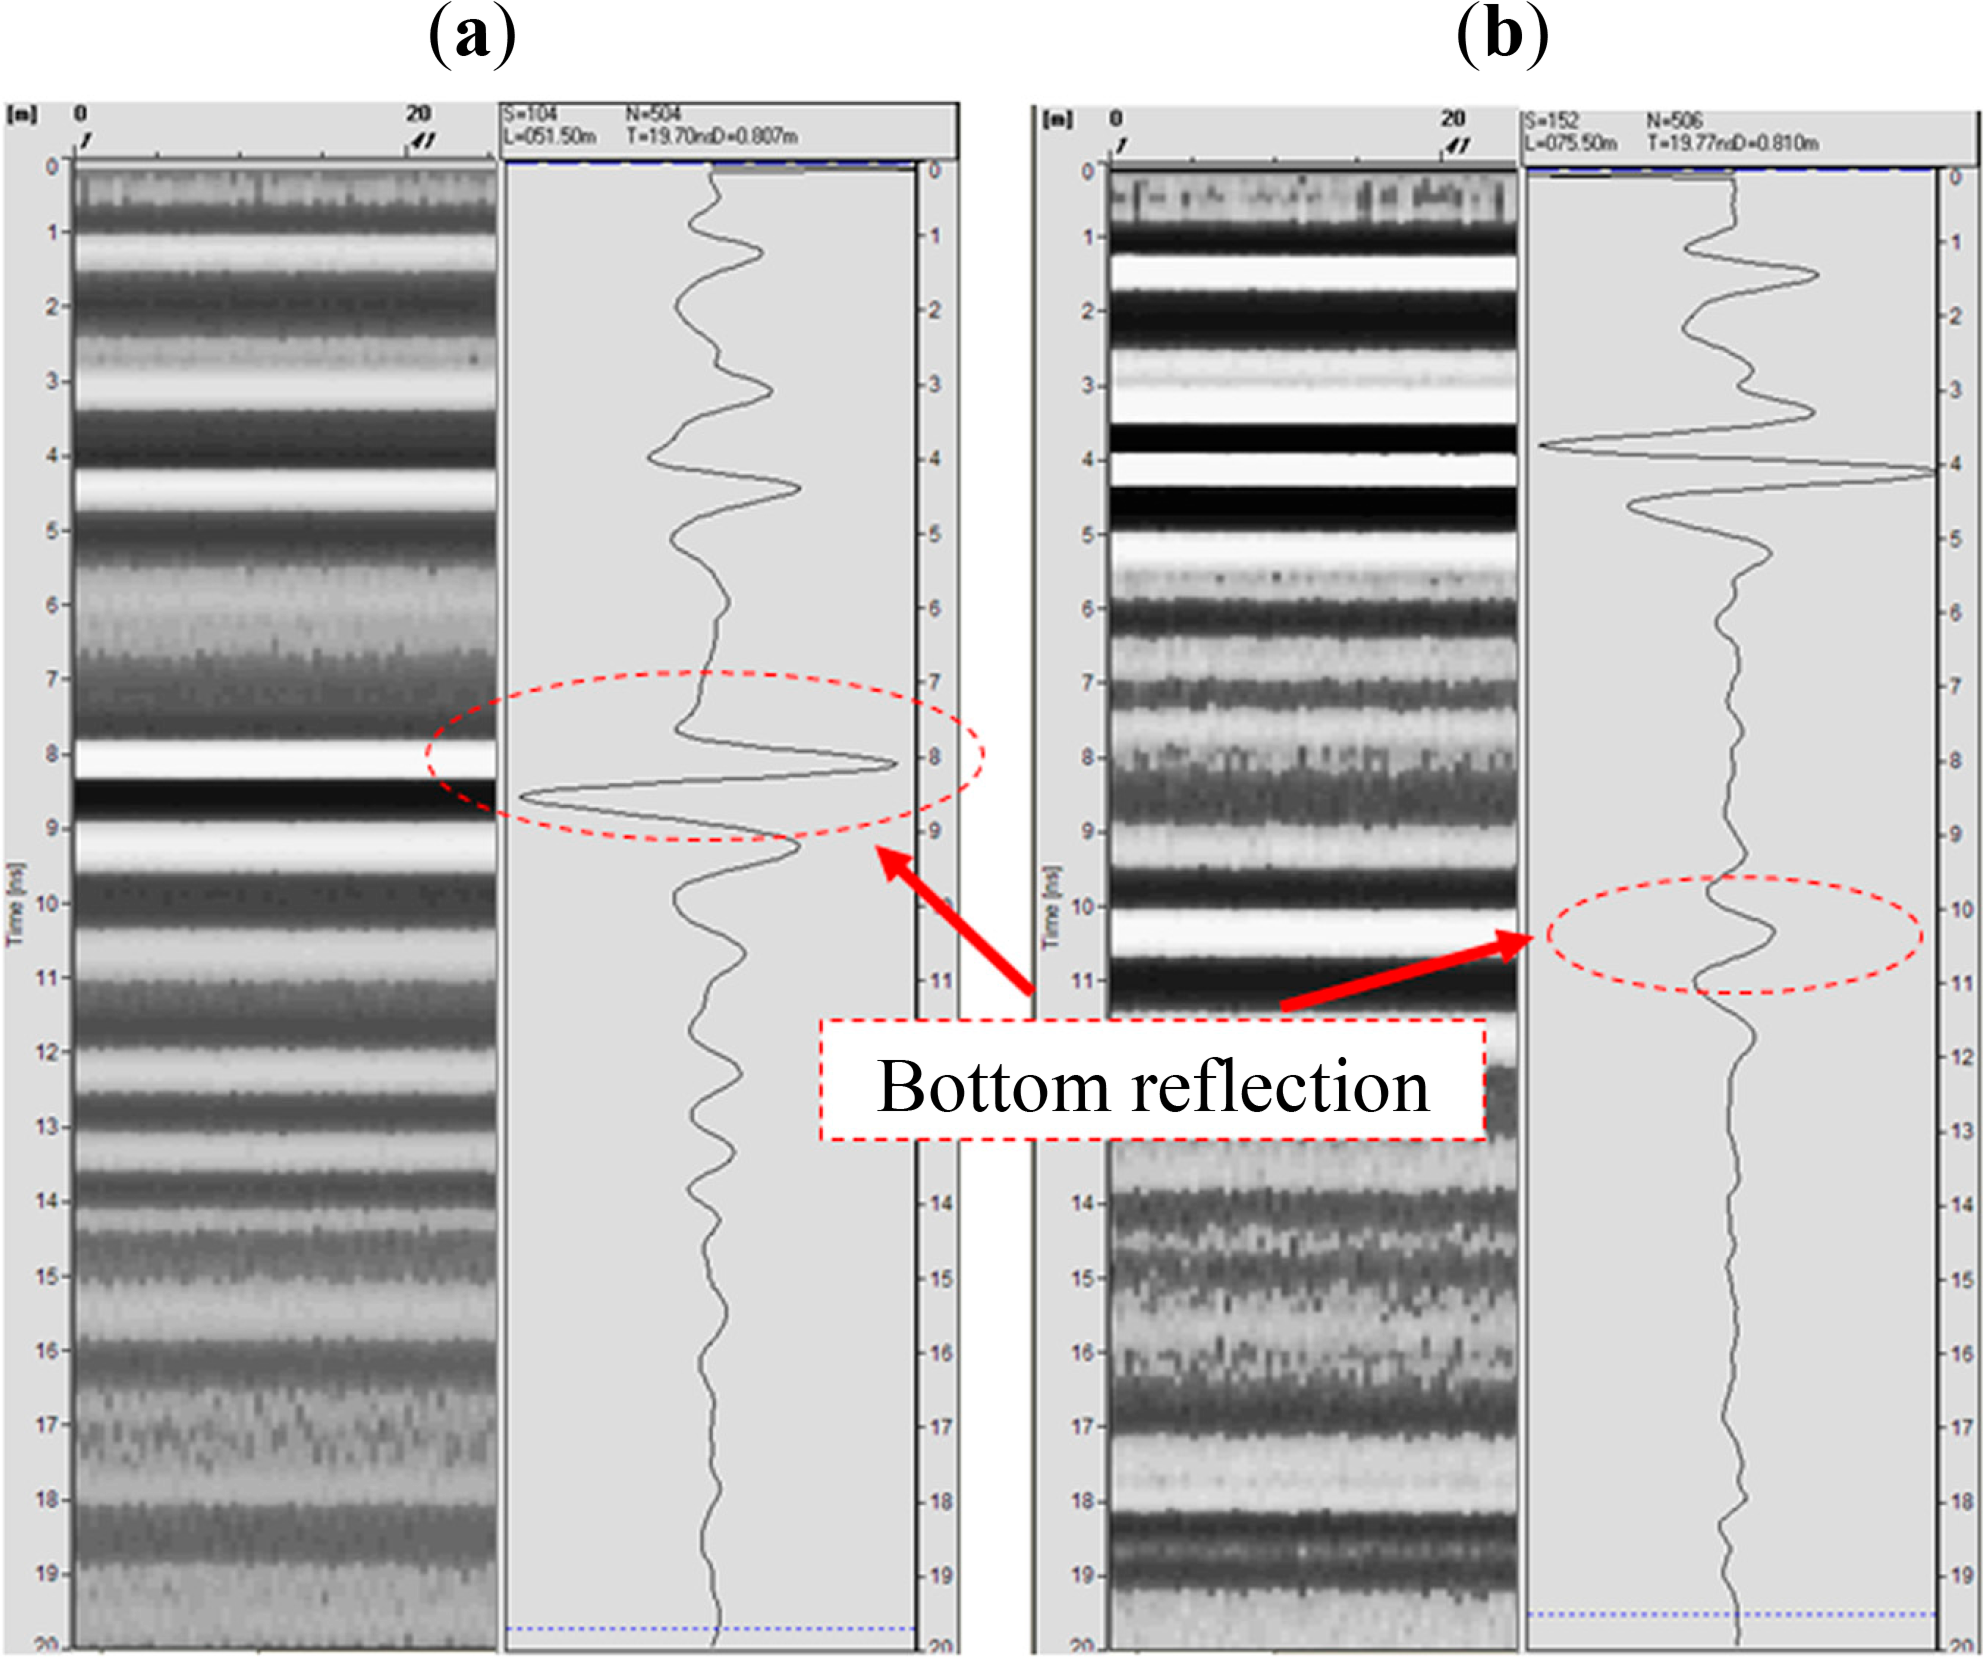
Before laying the materials into the boxes, aluminum sheets were placed at the bottom of the boxes with the aim of improving the detection of the bottom reflection of the physical model by obtaining a high reflection amplitude, as metal is an ideal reflector, and for enabling a better GPR analysis (Figure 1).
For the granite clean ballast, after its characterization in laboratory, a final thickness of 40 cm was constructed in physical model, as for high speed lines ballast thickness generally varies between 30 and 40 cm. For this scope, the ballast was oven dried up to constant weight and then it was laid into a plastic box of 1.10 × 0.94 × 0.47 m3 and compacted. In order to obtain a high level of compaction, the physical sample was constructed by compacting four sub-layers of 10 cm each, during about 15 min per sub-layer, and obtaining a final thickness of 38.8 cm.
The silt soil was tested in a plastic box of 0.53 × 0.41 × 0.40 m3. As one of the scopes of these tests was to study the sensitivity of the dielectric constant to water presence, four water content values were simulated in laboratory (6%; 8%; 10% and 12%), in particular two lower and two higher than the optimum value (8.4%), that was previously determined. Before placing the material into the box, the soil was put on metal trays, and water was added in the corresponding amount and mixed with soil thoroughly in order to obtain homogeneity. For each water content value simulated in laboratory, a physical model was set up. In order to obtain a final thickness of about 30 cm, five sub-layers of 6 cm were compacted for 6 min each. After each sub-layer construction, the surface of the sub-layer was grooved for avoiding the detection of different inner sub-layers interfaces with GPR. Also, for verifying the water content at the end of each model construction, measurements using a nuclear density gauge (Troxler) were performed and, at the end of the GPR tests, a sand-cone density test was made for each physical model. These tests have provided information on the compaction of the samples.
The physical model of the fouled ballast was constructed in a wooden box with a volume of 0.50 × 0.75 × 0.52 m3. Five fouling levels, Rb-f values, were chosen to be simulated during tests, namely the average value of each fouling range, as shown in Table 1. Also in this case, four water content values were adopted for the silt soil (6%, 8%, 10% and 12%) used to simulate the fouling of the ballast, except for the first fouling level (Index 1). In fact, in this case, only 8.4% water content was simulated, as the quantity of added soil was very small and a variation of water content would have almost no effect on the dielectric properties. For the other four models, fouled ballast was compacted with 6% of water, previously mixed with the fine soil on metal trays, and then added to ballast. For saving time, the higher water content values were obtained by adding water to the finished model.
For compaction, four sub-layers of 7.5 cm were compacted during 10 min each, obtaining a final thickness of 30 cm. In the case of Index 55, the volume of the mixture was higher, and also the compaction time (12 min), than the previous cases due to a higher fine content. In this case a 35.7 cm final thickness was obtained.
A synthesis of the case studies is presented in Table 2.
2.3. GPR Equipment Used
Three different GPR systems, in terms of types of antennas, were used for the present research (Figure 2).
The first system was composed by two pair of GSSI air-coupled antennas, a transmitter and a receiver, with 1 GHz and 1.8 GHz of frequency and a SIR 20 two channel control unit. Antennas were suspended in order to provide the correct configuration, typical for this type of antennas. Thus, they were mounted at about 45 cm above the tested material surface.
The second system was composed by two GSSI ground-coupled antennas of 500 MHz and 900 MHz frequency and a SIR 10H control unit.
The third system was an “Ingegneria de Sistemi” (IDS) antenna with a frequency of 400 MHz, that is the one used for Portuguese railway monitoring and it is composed by a dedicated four channel antenna control unit (CU SRS). Antenna configuration, in terms of orientation and elevation, was studied. For the verification of the influence of the orientation on the material surface (x-y), the antenna was placed in two different positions, rotated of 90°, and it was evaluated to be indifferent for the boxes used in this study. For the elevation, different heights were tested in order to better detect the reflected signal. So, in order to simulate a ground-coupled position, the antenna was placed directly on the surface; and for a suspended position, similar to in situ measurement configuration, the antenna was suspended above the surface, at about 30 cm. For the boundary condition verification, tests were performed before the construction of the models, by measuring the signal with metal plate next to the box walls. No significant interferences were noticed.
For each test performed with suspended antennas, three different measurements were made in order to improve the detection of the top and of the bottom of the material layer.
Initially, a large metal plate was placed on the surface of the specimens and the reflected wave was recorded. This is a typical procedure for air-coupled antennas calibration. In the second test, a smaller metal plate was used, in order to detect both the top and the bottom reflections for the material tested. The third measurement was done following the in situ measurement procedure, with no metal plate at the top of the sample.
2.4. Troubleshooting of Interpretation
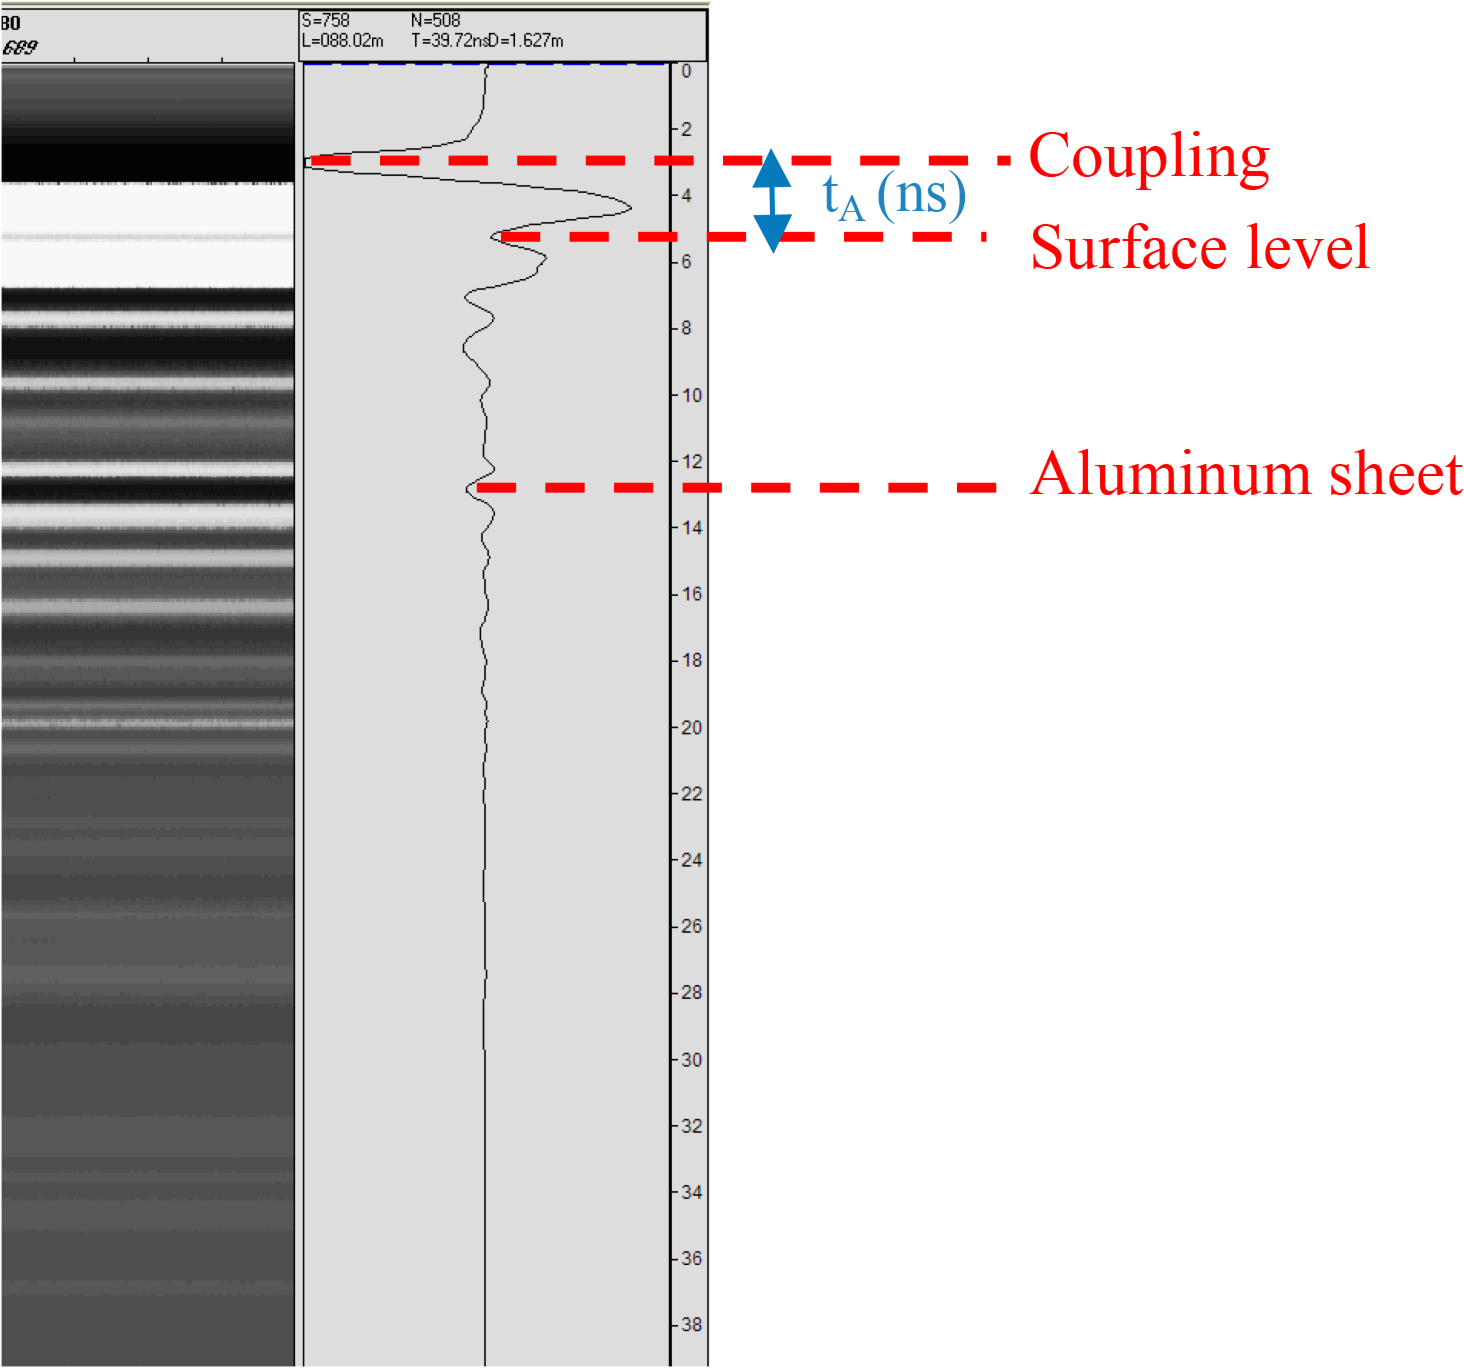
One of the difficulties during the data interpretation was to identify the ballast surface signal, so called definition of “zero” level, in the ground-coupled antennas signal, mainly regarding the IDS antenna. In in situ GPR surveys, zero level corresponds to the ballast surface. In this laboratory study, its detection was different depending on the GPR system. For air-coupled GSSI antennas, the maximum positive reflection was picked as zero level. For ground-coupled antennas, GSSI and IDS, zero was considered as coincident with the direct wave coupling. In the case of IDS suspended antenna there were difficulties in identifying clearly the surface reflection. Therefore, based on recommendations of the producers, and together with them, a new methodology was established for the zero definition and an accurate data interpretation (Figure 3). The methodology is described herein:
▪ coupling time (Tx-Rx) was measured (tC);
▪ knowing the antenna elevation from surface, the wave travel time in the air was measured (tA) using the air dielectric constant;
▪ zero level (S) was given by the sum of both terms:
Also, in the case of IDS suspended antenna, several multiple reflections were noticed in the file and this fact turned difficult to detect the bottom reflection. However, this was solved through to the comparison with data of IDS antenna in ground–coupled mode, for which, bottom reflection was definitely clearer.
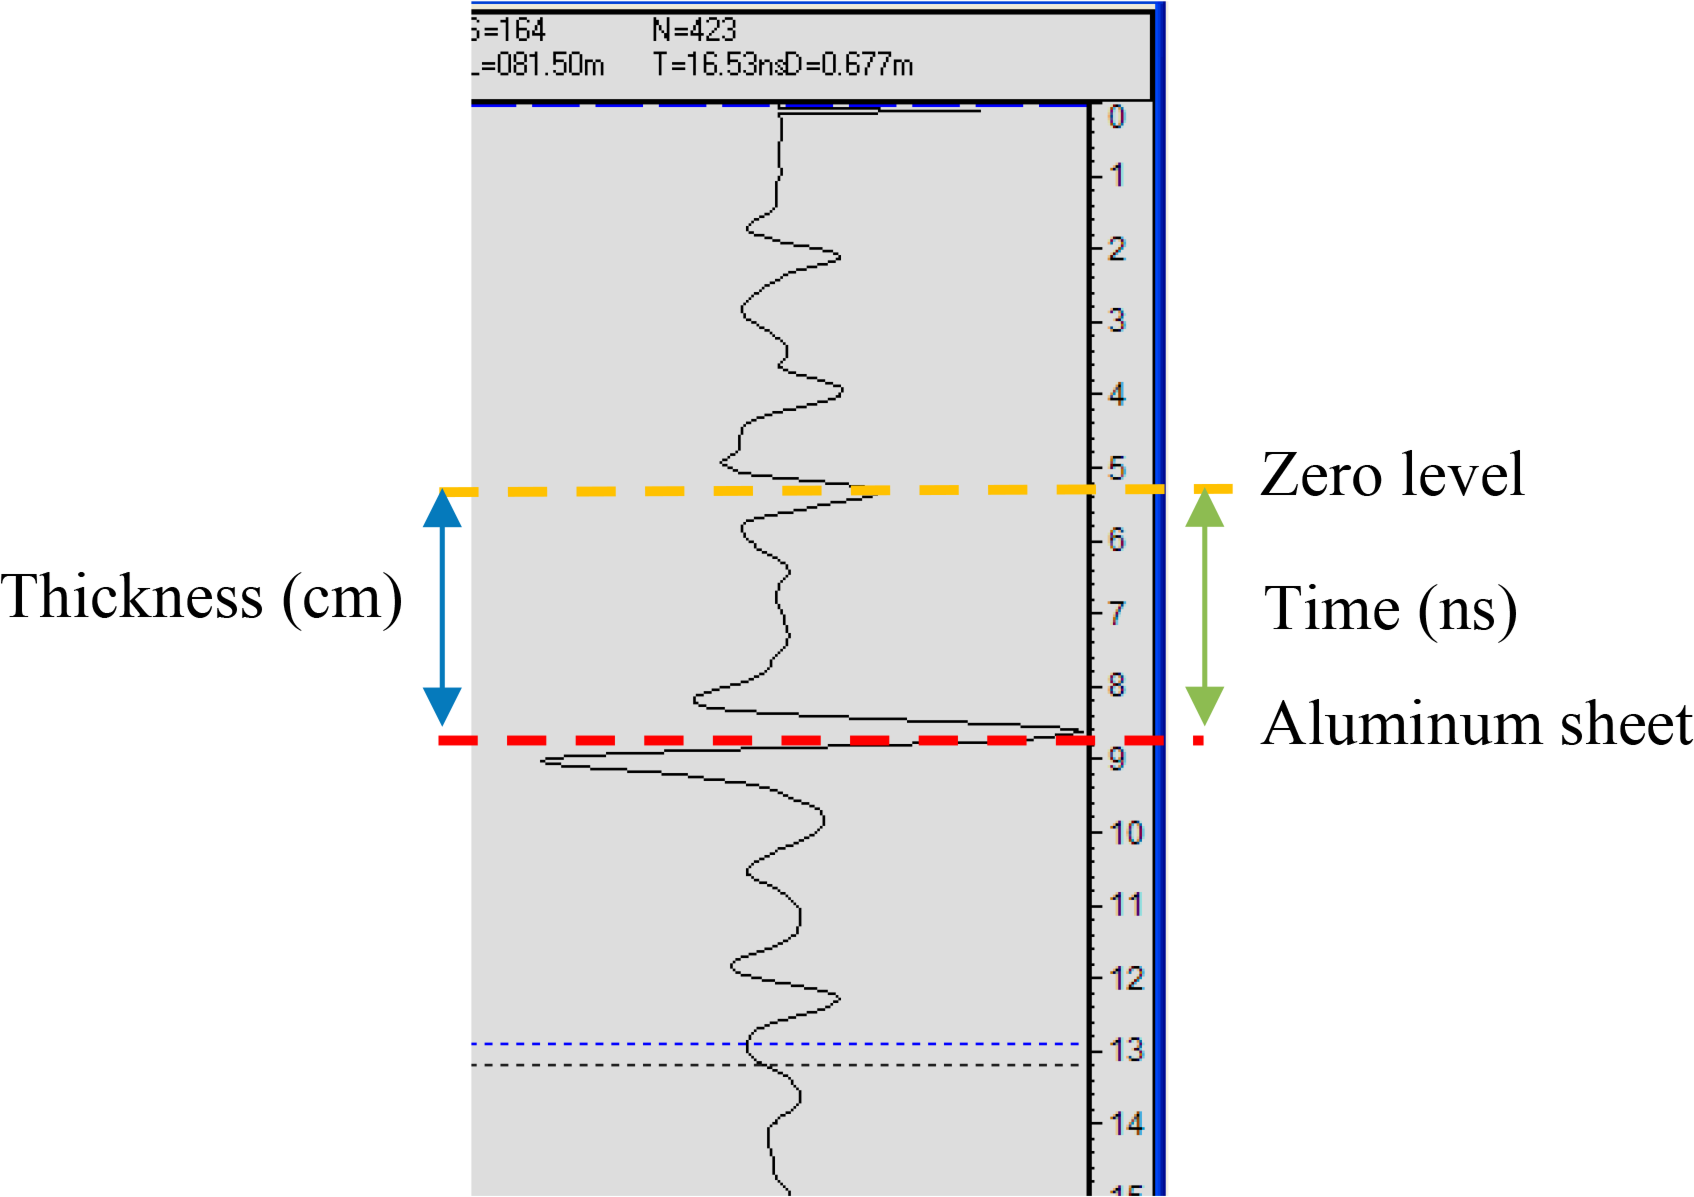
Once established the zero level, the dielectric constant values were determined based on the material thickness, that was known, and the wave travel time (ns) from the surface to the bottom of the studied material (Figure 4) using Equation (2):
▪ ɛr is the relative dielectric constant;
▪ c is the wave velocity in the free space (3 × 10⁸ m/s);
▪ t is the travel time;
▪ h is the layer thickness.
3. Analysis and Discussion of the Laboratorial Results
3.1. Clean Ballast
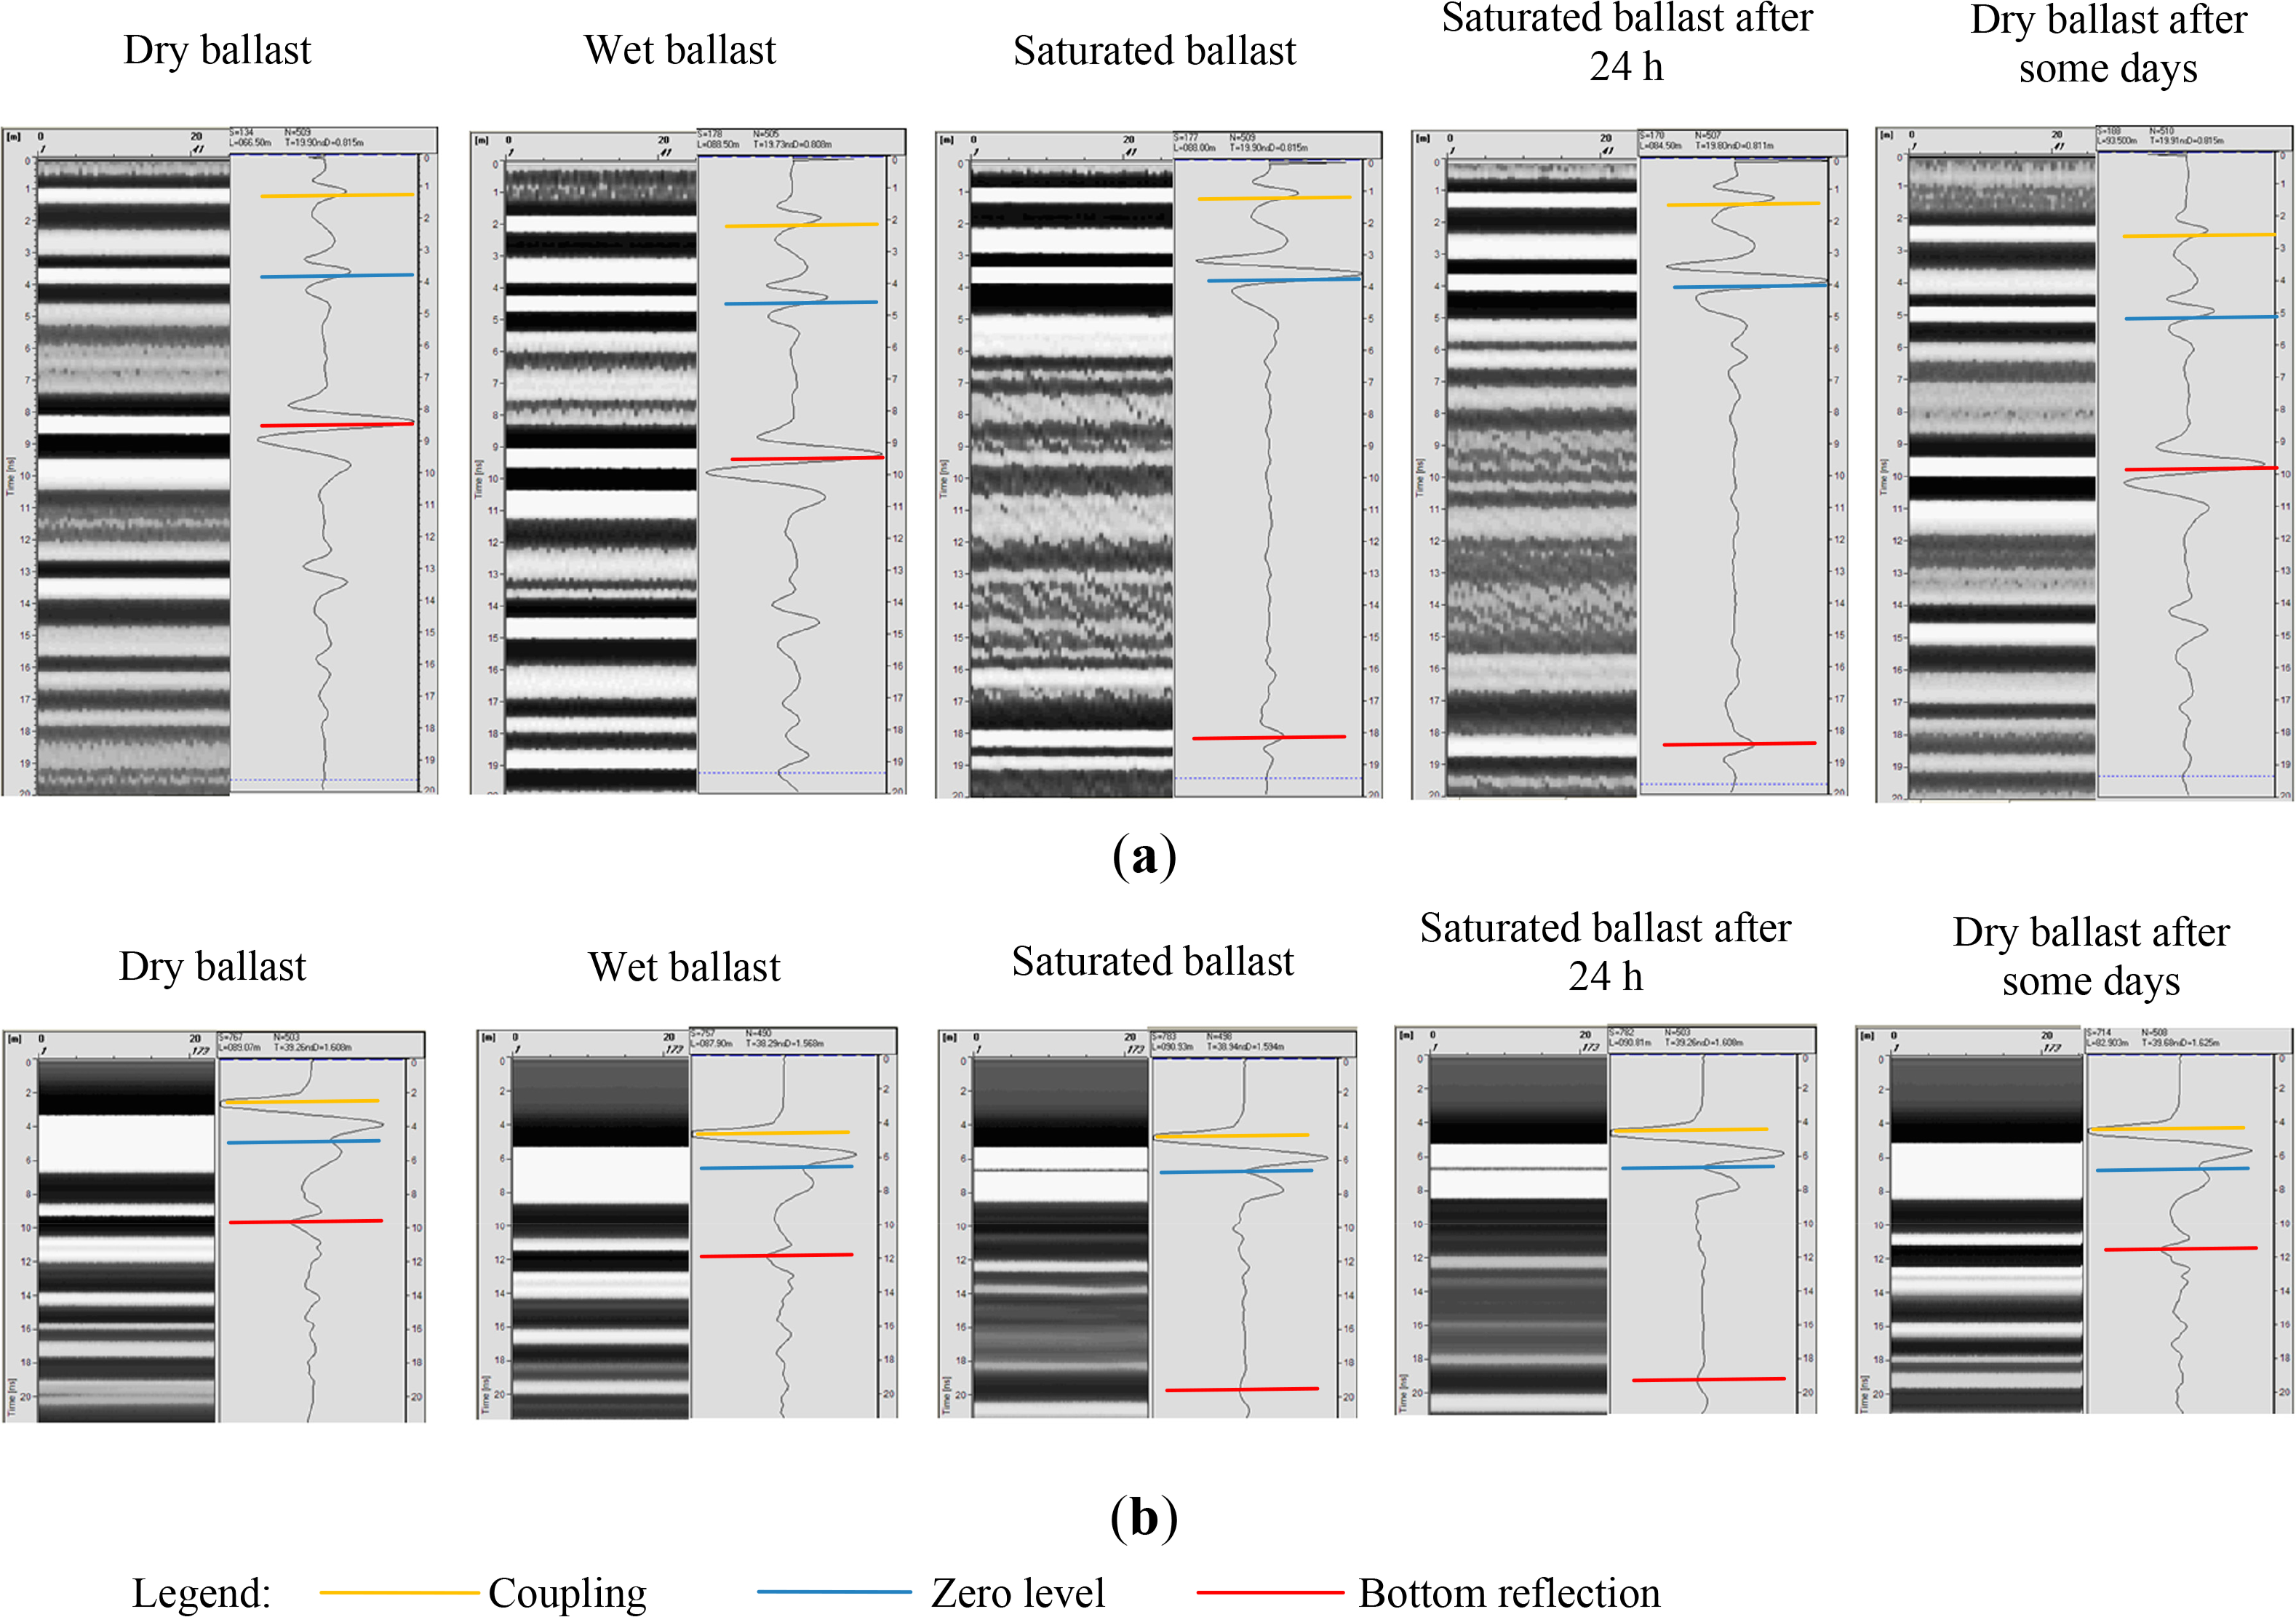
For the clean ballast, many GPR surveys were performed in consecutive steps, namely from dry to saturated conditions passing through wet condition and then returning to dry condition. As example, part of the different GPR responses for the simulated ballast conditions are shown in Figure 5. Changes in time response are clearly visible due to the presence of water, mainly in saturated conditions.
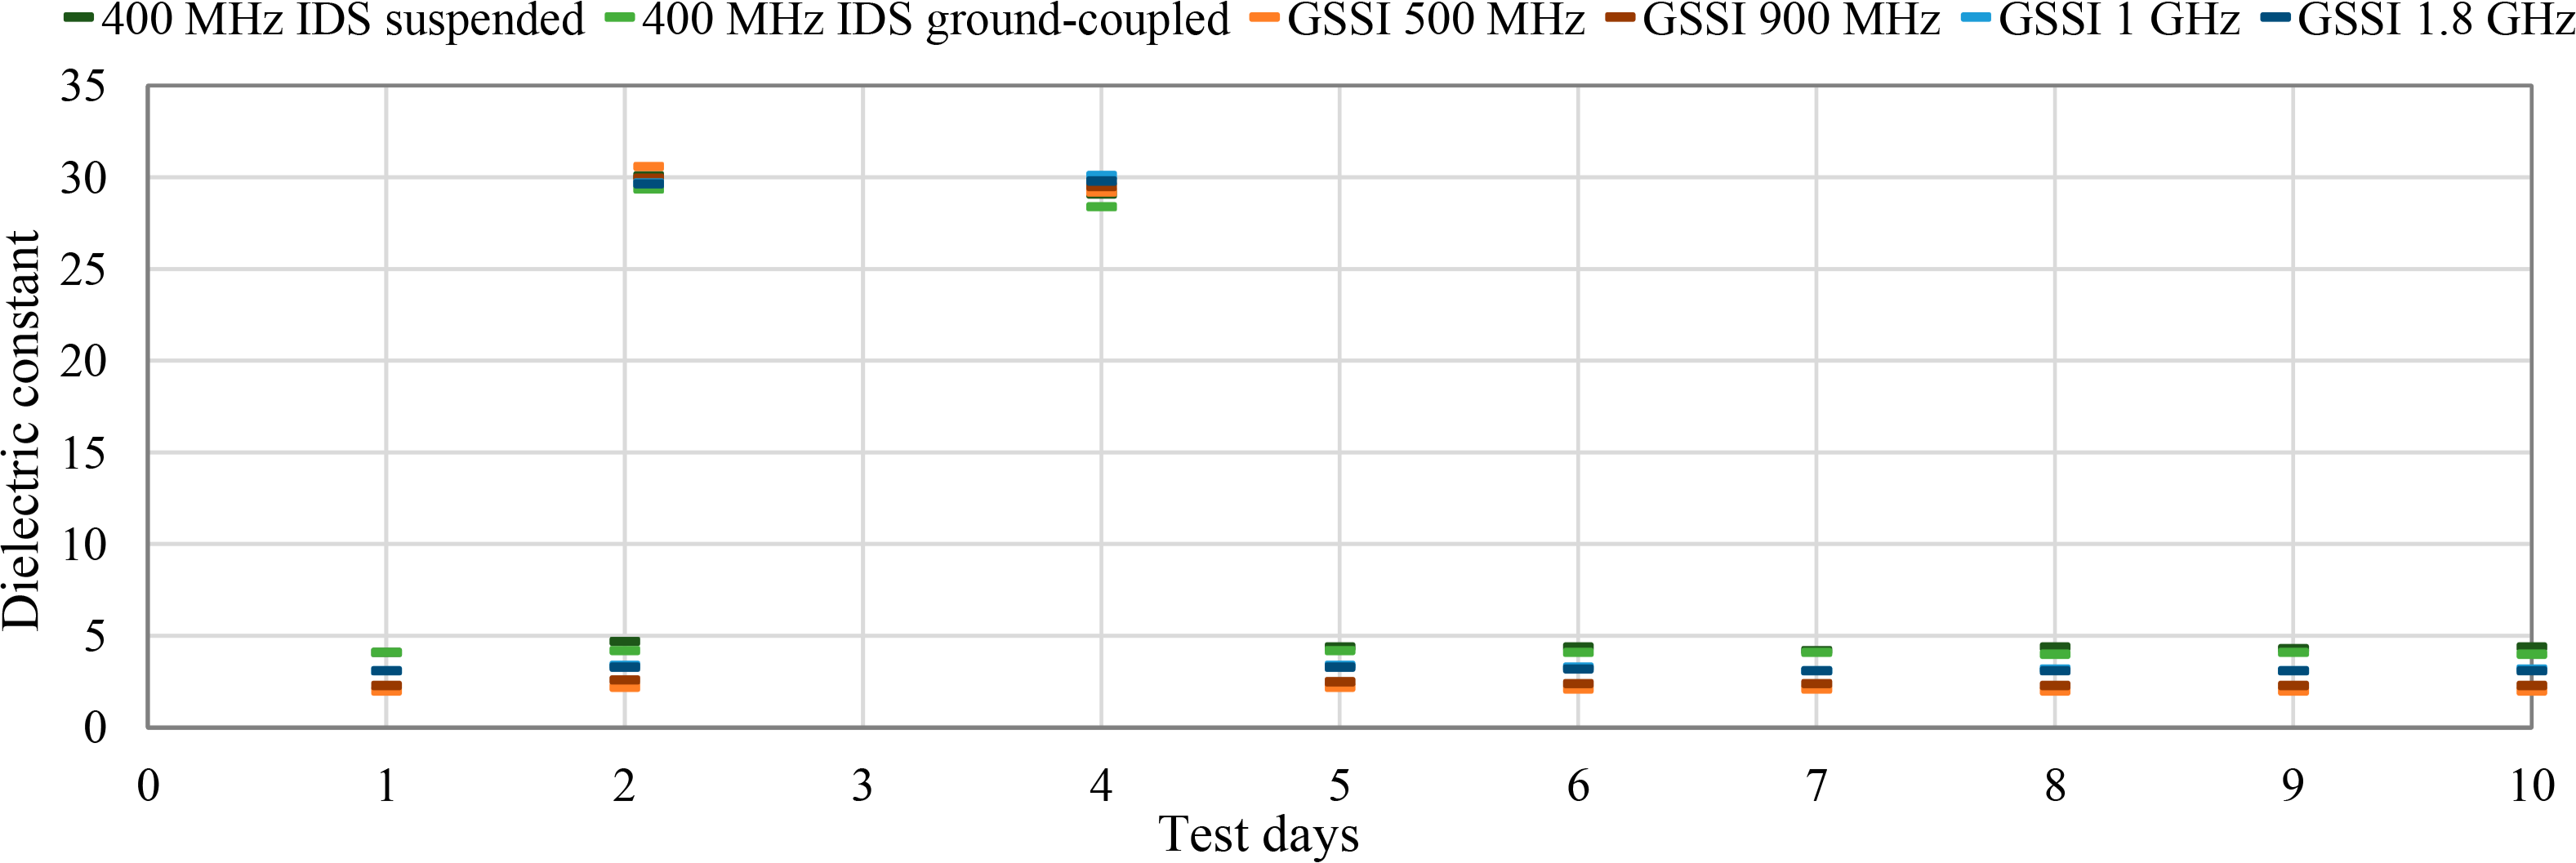
After GPR surveys in dry condition (day 1 in Figure 6), namely after that the material had been oven dried, water was added simulating a rainy event (wet condition, the lower values of day 2, in Figure 6). Then, for the saturated conditions, the box was filled with water up to the surface. GPR surveys were performed immediately after filling with water (the higher values of day 2 in Figure 6) and, for saturated condition, after 48 h (day 4 in Figure 6), when no more variation in weight was registed for the ballast particles. In the last testing phase, after the water had been removed, GPR tests were carried out every day at about the same hour (days 5 to 10 in Figure 6), until dielectric constant value was equal to the one measured initially, for dry condition. For each phase, all of antennas were used and installed according to their system.
As expected, there is an increase of dielectric constant values with water content (Figure 6), as has been found by other authors [17,22]. It can be notice that after the water removal, there is a quick decrease in the dielectric constants, reaching values similar to dry condition.
Comparing the five systems, in general, a definite trend among GSSI antennas occurs: the higher the frequency, the higher the dielectric values. In particular, for 1 GHz and 1.8 GHz antennas results are almost similar. On the other hand, IDS antenna shows higher values comparing the others, even more when it is suspended.
Generally, the values of dielectric constants are above 25 for saturated condition.
For granite dry clean ballast, the dielectric constant values that were obtained for different antennas are of 4.1 for IDS antenna and between 2 and 3.1 for the GSSI antennas. These are the values that should be considered as reference during interpretation of future tests. Nevertheless, in situ they can be higher than those obtained in laboratory tests, due to the normal deterioration of ballast and presence of more fine particles. In the next section, an in situ measurement is presented that aimed to validate the values for clean granite ballast for IDS antennas measurements, in a railway track under operation.
3.2. Fine Soil
For the fine soil, and for each water content value, more than one GPR survey was performed for obtaining a better reliability of results, generally once or twice a day.
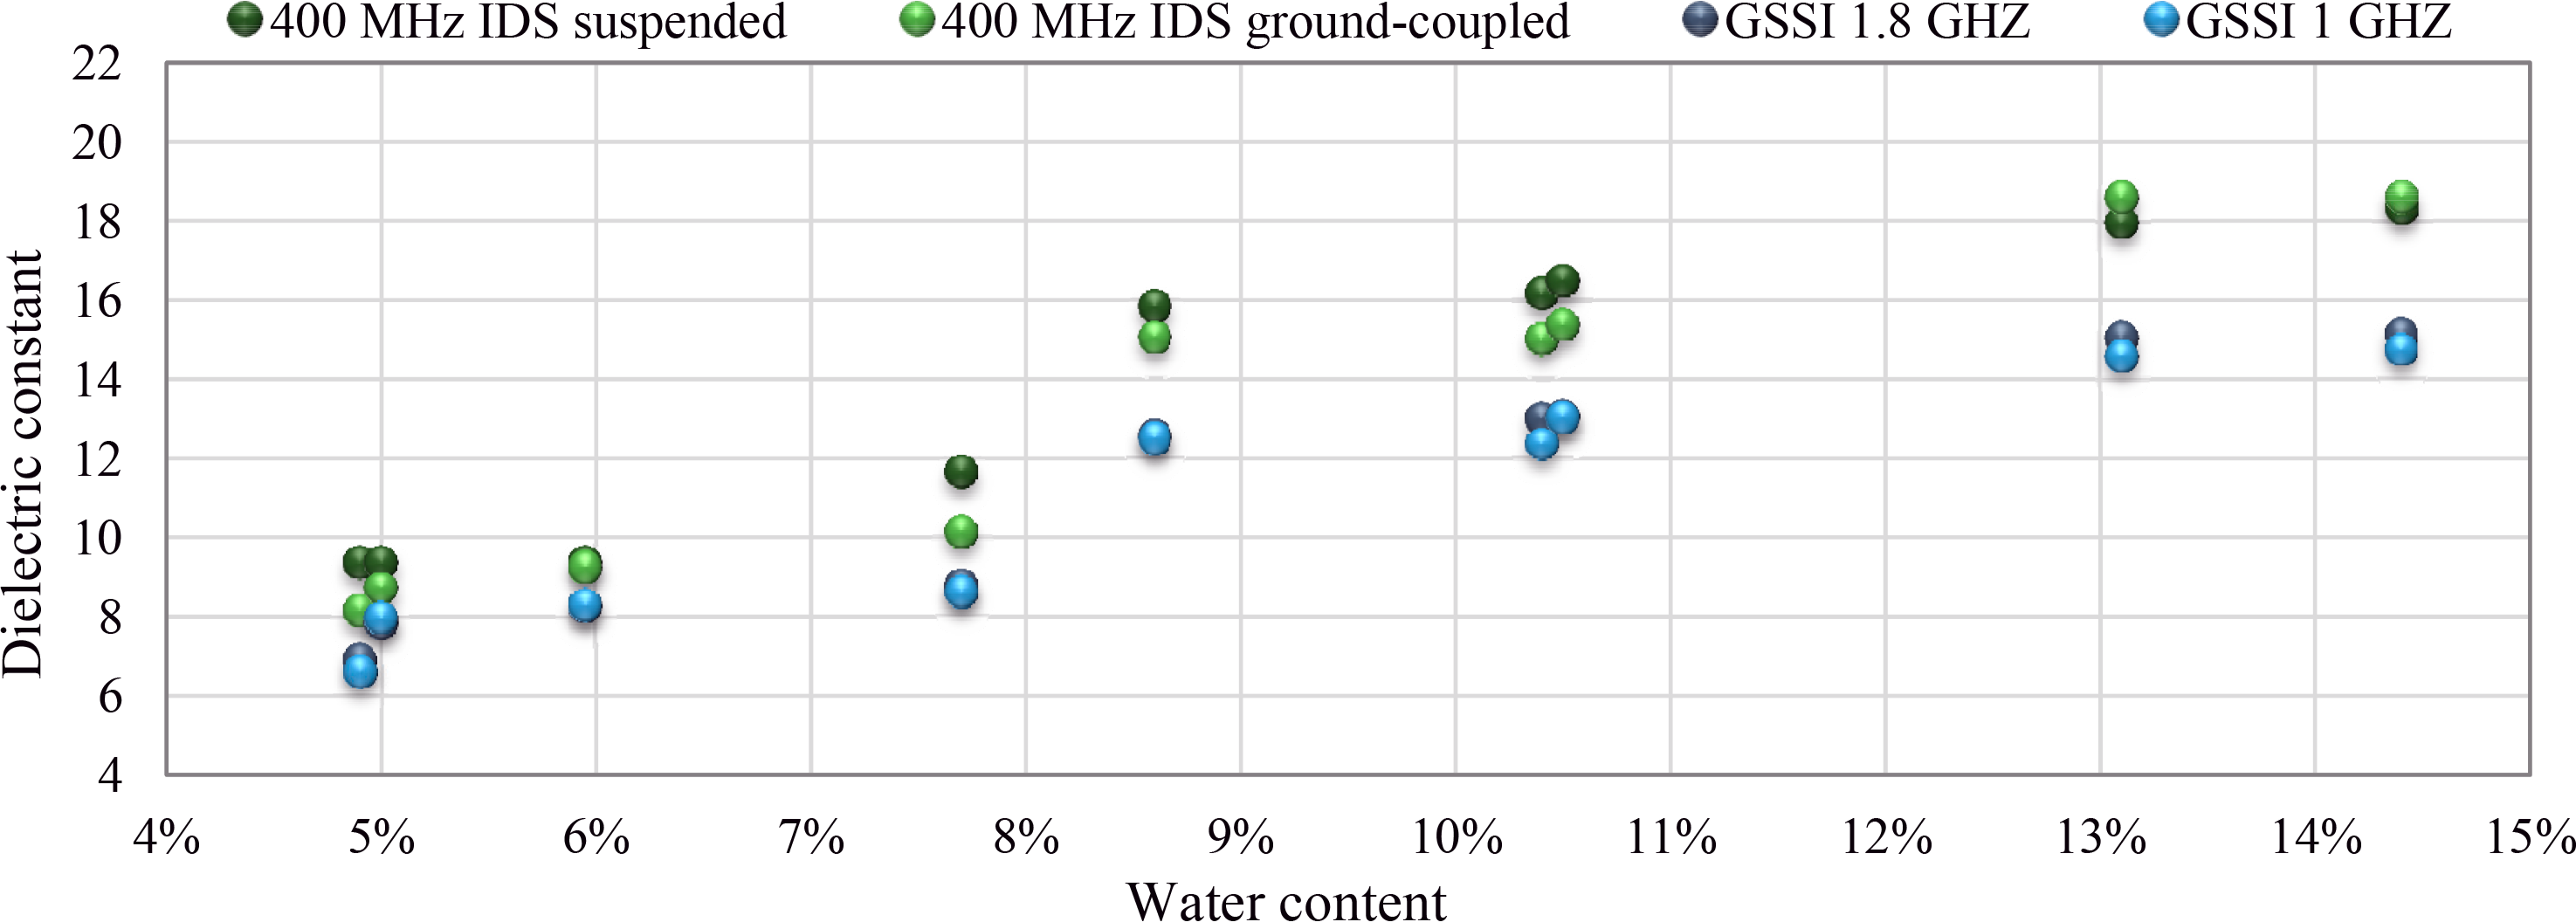
In general, for each antenna, the dielectric constant value increases with the water content (Figure 7), as presented by other authors [19]. For the values obtained close to the optimum water content (8.4%) the dielectric constant is higher than the value that corresponds to the quasi-linear observed tendency. This can be due to the fact that maximum compaction is achieved with this water content, so this can explain a higher density and, consequently, higher dielectric constant.
Also in this case, IDS antenna shows values higher than the ones obtained with 1 GHz and 1.8 GHz GSSI antennas that present very similar values. The difference between the values obtained with IDS and GSSI antennas increases with the increase of water content. Regarding GSSI low frequencies antennas, no results are presented herein, as during the measurements the acquisition system failed and had to be changed, resulting in some errors in the gain window location of the test files. Ajustments were performed and for the following tests there were no problems.
As a conclusion, one can say that for the fine silt soil, for lower water content, less than 6%, the dielectric constant values are around 9 for IDS and 8 for GSSI, and they increase gradually with the increase in water content so, for water content above 12%, the values are around 18 for IDS and 15 for GSSI.
3.3. Fouled Ballast
For Index 1, two GPR measurements were carried out with all antennas: the first one immediately after the model construction and the second one after 72 h. Dielectric constant values are quite similar to the ones obtained for clean granite ballast.
For indexes 6, 15 and 35, two GPR measurements were performed for each water content, namely one after the construction (6%) or the addition of water (8%, 10%, 12%), and the other one two hours after, in order to enable the water penetration and to create a homogenous mixture. In the case of Index 55, GPR surveys were performed passed two hours after the construction and then two hours after each addition of water. In addition, at the end of the four water content study, more water was added for simulating soaked conditions. After that, the fouled ballast was left to air-dry. In this case, more GPR surveys were performed [24].
Wave amplitude changes with ballast fouling conditions are represented in Figure 8. It can be observed that for low fouled ballast the amplitude is higher than for the high fouled ballast; this is due to the presence of fine soil and therefore, a higher conductivity, that causes a faster GPR signal energy dissipation. The surface reflection is higher in the case of high fouled ballast, Figure 8b, due to the increased difference in dielectric constant between air and specimen surface, very closed in the second case due to the voids filled with soil.
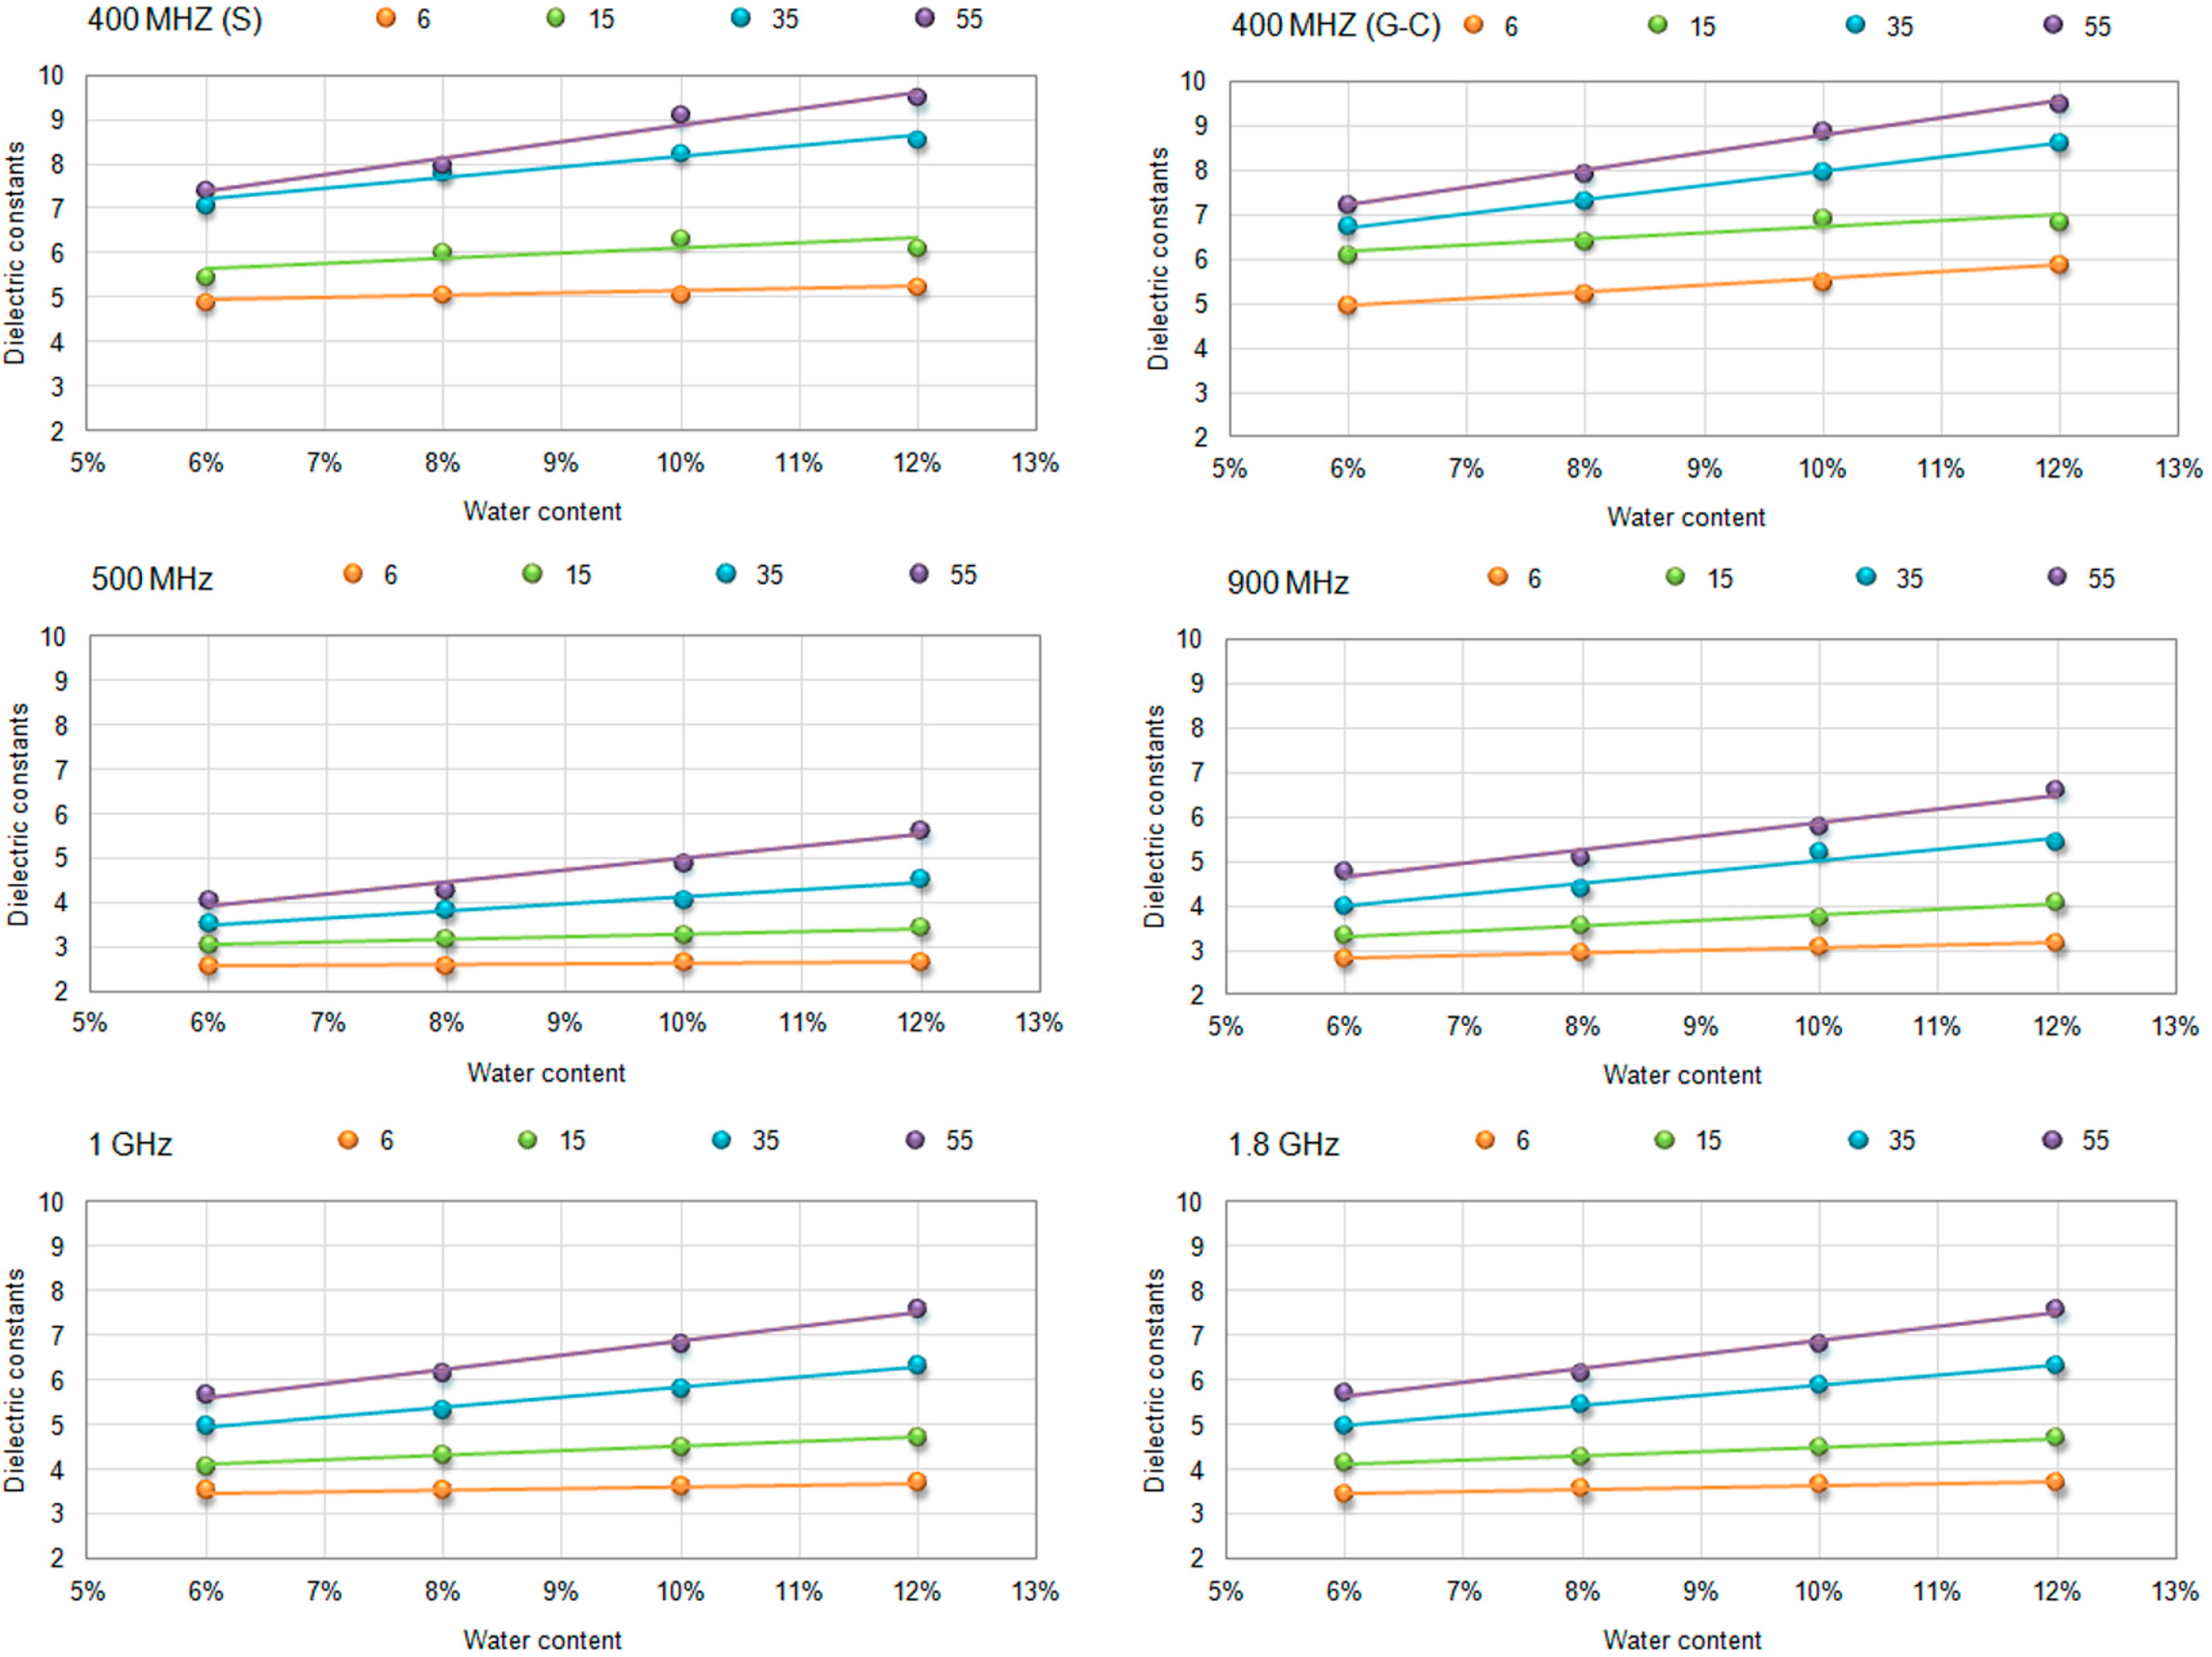
In Figure 9 the variation of dielectric constant values for IDS suspended antenna is represented for all the combinations of fouled material tested. It was observed that the fouling condition influences significantly the dielectric values of the ballast. As example, for IDS suspended antenna a dielectric constant values increment of about 80% is obtained by passing from a moderately fouled ballast (Rb-f = 6) to a highly fouled ballast (Rb-f = 55) for the maximum water content value (12%), while a variation of about 28% is resulted from the minimum water content value (6%) to the maximum one (w = 12%) for the highest fouled ballast. In fact, the higher the level of fouling, the higher is the trapped water and consequently the dielectric constant will be higher. Comparing the different GPR systems, IDS suspended antenna has shown higher values in both cases, indicating therefore a major sensibility to ballast condition changes, reflected in a major dielectric constant values variation.
The average and the coefficient of variation values obtained during the tests performed on fouled ballast are resumed in Tables 3 and 4. Those values increase with the fouling index and with water content.
In order to define a range of variation of dielectric constants, expected to be found on future railway surveys, Table 5 reports minimum (Index 6; w = 6%) and maximum (Index 55; w = 12%) values obtained for each antenna, for fouled ballast in different condition of water content and fouling.
4. In Situ Validation for Clean Ballast through Test Pits
In order to verify the dielectric constant value of in situ granite clean ballast a railtrack survey was performed with EM 120 (Figure 10) on an existing line that was recently re-ballasted. During this survey measurements using IDS 400 MHz antenna were done and twelve test pits were performed between sleepers. The thickness measurements between rails were taken into account for calibration. The track structure consists on granite ballast overlaying the soil, without any sub ballast layer. The initial limestone ballast was replaced with granite ballast. Some pits presented a certain fouling level, due probably to the fact that during ballast renewal, the existing layer was not completely removed from the track, as it can be observed in Figure 10. Anyway, only measurements of clean ballast thickness were done in order to validate the dielectric constants evaluated in the laboratory tests.
Dielectric constant values were calculated for clean ballast (Figure 11). It should be mentioned that the values obtained in situ are similar to the ones determined in laboratory tests, namely an average dielectric constant of 4.8 was measured. This slightly higher value can be due to the presence of old limestone ballast that affects the dielectric constant. The main problem for the test pits performed on exiting line in presence of old fouled layers is the real thicknesses measurement, due to a gradual passage from clean to fouled conditions.
5. Conclusions
For GPR railways studies, the knowledge of dielectric constant represents a crucial aspect for obtaining good results in terms of ballast thickness and high quality surveys. In order to improve the GPR interpretation, several laboratory tests were performed at LNEC and the main results are presented and analyzed in this paper.
Three materials were considered: a granite clean ballast, a silt soil and a mixture of them in order to recreating the fouling condition of the ballast. Five fouling levels were simulated, by taking into account the Relative Ballast Fouling Ratio, and different water contents were also reproduced. Five GPR systems were used in order to compare their responses: IDS antenna, used during railway surveys in Portugal, and LNEC’s GSSI ground-coupled and air-coupled antennas.
For clean ballast, as expected, dielectric constant values change with water content and a great variation was obtained for saturated and partially saturated conditions. As example, for IDS suspended antenna, the values increase from about 4 (dry condition) to 30 (saturated).
For fine soil, values have shown a linear increment of dielectric constant with the water content, for each GPR system.
For the fouling ballast, results have shown a linear increment for both fouling levels and water content variation, in different proportion: dielectric properties are more affected by fouling variation than water content. However it should be noted that the water content was changed only between 6% and 12%.
IDS antenna has always shown higher values, even more in suspended position, comparing with the GSSI antennas. The difference, taking into account that the frequencies of IDS antenna and GSSI 500 MHz antenna are very similar, it can be caused by the antenna configuration due to different manufacturers. For the GSSI antennas, it can be observed that the higher the frequency the higher dielectric constant values. GSSI air-coupled antennas have confirmed more similar results than other antennas that can be due to their higher frequency. It should be highlighted that the use of default dielectric constants has to be made with caution as the responses of different brands antennas are distinct.
For in situ validation the dielectric constant for clean ballast is consistent with the values obtained in laboratory. The main problem for fouling layers evaluation is the presence of other materials, such as old limestone ballast that increases the dielectric constant of the material.
Therefore, for railways, the knowledge of dielectric constant values represents a crucial aspect for obtaining good results in terms of ballast thickness and high quality surveys. On the other hand, detection of fouling and water conditions still represents a challenge for GPR railways surveys.
As future developments, the use of more advanced processing techniques, as inversion or scattering analysis may improve the evaluation of the influence of water content and fouling level on the dielectric constant. Even more, numerical modeling can contribute to generalize the results obtained.
Acknowledgments
The authors acknowledge REFER for the equipment and in situ tests performed.
This work benefited from networking activities carried out within the EU funded COST Action TU1208 “Civil Engineering Applications of Ground Penetrating Radar”.
Part of the work was conducted in the framework of the TC202 national committee of the Portuguese Geotechnical Society (SPG) “Transportation Geotechnics”, in association with the International Society for Soil Mechanics and Geotechnical Engineering (ISSMGE-TC202).
Author Contributions
All authors contributed to this text.
Conflicts of Interest
The authors declare no conflict of interest.
References
- INNOTRACK: Concluding Technical Report. Available online: http://www.innotrack.net/IMG/pdf/innotrack_concl_20techn_report_lowres.pdf (accessed on 16 September 2014).
- Modern Railway Track. Available online: http://www.esveld.com/MRT_Selection.pdf (accessed on 16 September 2014).
- Track Compendium: Formation, Permanent Way, Maintenance, Economics. Available online: http://www.eurailpress.de/leseprobe/148/download/magazine.pdf (accessed on 16 September 2014).
- Selig, E.T.; Waters, J.M. Track Geotechnology and Substructure Management; Thomas Telford: London, UK, 1994. [Google Scholar]
- Gallagher, G.P.; Leiper, Q.; Williamson, R.; Clark, M.R.; Forde, M.C. The application of time domain ground penetrating radar to evaluate railway track ballast. NDT E Int 1999, 32, 463–468. [Google Scholar]
- Manacorda, G.; Morandi, D.; Sarri, A.; Staccone, G. Customized GPR system for railroad track verification. In Proceedings of the Ninth International Conference on Ground Penetrating Radar (GPR2002), Santa Barbara, CA, USA, 29 April–2 May 2002; pp. 719–723.
- Fontul, S.; Fortunato, E.; de Chiara, F. Non-destructive tests for railway infrastructure stiffness evaluation. In Proceedings of the Thirteenth International Conference on Civil, Structural and Environmental Engineering Computing, Chania, Crete, 6–9 September 2011; Topping, Y., Ed.; 2011; Paper 16. [Google Scholar]
- Hyslip, J.P.; Chrismer, S.; LaValley, M.; Wnek, J. Track quality from the ground up. In Proceedings of the AREMA Conference, Chicago, IL, USA, 16–19 September 2012.
- Brough, M.; Stirling, A.; Ghataora, G.; Madelin, K. Evaluation of railway trackbed and formation: A case study. NDT E Int 2003, 36, 145–156. [Google Scholar]
- Fontul, S. Structural Evaluation of Flexible Pavements Using Non-Destructive Tests. Ph.D. Thesis, Departamento de Engenharia Civil, Universidade de Coimbra, Coimbra, Portugal. 2004. [Google Scholar]
- Jack, R.; Jackson, P. Imaging attributes of railway track formation and ballast using ground probing radar. NDT E Int 1999, 32, 457–462. [Google Scholar]
- Hugenschmidt, J. Railway track inspection using GPR. J. Appl. Geophys 2000, 43, 147–155. [Google Scholar]
- Sussmann, T.R.; Selig, E.T.; Hyslip, J.P. Railway track condition indicators from ground penetrating radar. NDT E Int 2003, 36, 157–167. [Google Scholar]
- Smekal, A.; Berggren, E.G.; Silvast, M. Monitoring and substructure condition assessment of existing railway lines for upgrading to higher axle loads and speeds. In Proceedings of the 7th World Congress on Railway Research, Montreal, QC, Canada, 5–7 June 2006.
- Plati, C.; Loizos, A.; Papavasiliou, V. Inspection of railroad ballast using geophysical method. Int. J. Pavement Eng 2010, 11, 309–317. [Google Scholar]
- Silvast, M.; Nurmikolu, A.; Wiljanen, B.; Levomaki, M. An inspection of railway ballast quality using ground penetrating radar in Finland. Proc. Inst. Mech. Eng. Part F J. Rail Rapid Transit 2010, 224, 345–351. [Google Scholar]
- Clark, M.R.; Gillespie, R.; Kemp, T.; McCann, D.M.; Forde, M.C. Electromagnetic properties of railway ballast. NDT E Int 2001, 34, 305–311. [Google Scholar]
- Fortunato, E. Renovação de Plataformas Ferroviárias. Estudos Relativos à Capacidade de Carga. Ph.D. Thesis, Departamento de Engenharia Civil, Porto, Faculdade de Engenharia da Universidade do Porto, Porto, Portugal. 2005. [Google Scholar]
- Saarenketo, T. Electrical Properties of Road Materials and Subgrade Soils and the Use of Ground Penetrating Radar in Traffic Infrastructure Surveys. Ph.D. Thesis, Faculty of Science, University of Oulu, Oulu, Finland. 2006. [Google Scholar]
- Fortunato, E.; Pinelo, A.; Matos Fernandes, M. Characterization of the fouled ballast layer in the substructure of a 19th century railway track under renewal. Soils Found 2010, 50, 55–62. [Google Scholar]
- Indraratna, B.; Su, L.; Rujikiatkamjorn, C. A new parameter for classification and evaluation of railway ballast fouling. Can. Geotech. J 2011, 48, 322–326. [Google Scholar]
- Zhang, Q.; Gascoyne, J.; Eriksen, A. Characterisation of ballast materials in trackbed using ground penetrating radar: Part 1. In Proceedings of 5th IET Conference on Railway Condition Monitoring and Non-Destructive Testing (RCM 2011), Derby, UK, 29–30 November 2011.
- Anbazhagan, P.; Su, L.; Indraratna, B.; Rujikiatkamjorn, C. Model track studies on fouled ballast using ground penetrating radar and multichannel analysis of surface wave. J. Appl. Geophys 2011, 74, 175–184. [Google Scholar]
- De Chiara, F. Improving of Railway Track Diagnosis Using Ground Penetrating Radar. Ph.D. Thesis, Sapienza University of Rome, Rome, Italy. 2014. [Google Scholar]


| Category | Rb-f (%) | Laboratory Fouling Index (%) |
|---|---|---|
| Clean ballast | <2 | 1 |
| Moderately clean ballast | 2–10 | 6 |
| Moderately fouled ballast | 10–20 | 15 |
| Fouled ballast | 20–50 | 35 |
| Highly fouled ballast | ≥50 | 55 |
| Case Studies | Material Condition | |
|---|---|---|
| Fouling Index | Water Content w (%) | |
| Clean ballast | - | Dry, wet, saturated and dried in time |
| Soil | - | 6%, 8%, 10% and 12% |
| Fouled Ballast | 1 | 8.4% |
| 6 | 6%, 8%, 10% and 12% | |
| 15 | 6%, 8%, 10% and 12% | |
| 35 | 6%, 8%, 10% and 12% | |
| 55 | 6%, 8%, 10% and 12% | |
| FI | 6 | 15 | 35 | 55 | ||||
|---|---|---|---|---|---|---|---|---|
| AV | CV | AV | CV | AV | CV | AV | CV | |
| 400 MHz IDS S | 5.09 | 0.02 | 6.00 | 0.06 | 7.93 | 0.07 | 8.49 | 0.10 |
| 400 MHz IDS G | 5.42 | 0.06 | 6.60 | 0.05 | 7.66 | 0.09 | 8.41 | 0.10 |
| 500 MHz GSSI | 2.63 | 0.02 | 3.23 | 0.04 | 3.99 | 0.09 | 4.74 | 0.13 |
| 900 MHz GSSI | 3.02 | 0.04 | 3.68 | 0.07 | 4.78 | 0.12 | 5.57 | 0.13 |
| 1.0 GHz GSSI | 3.58 | 0.02 | 4.40 | 0.05 | 5.61 | 0.09 | 6.55 | 0.11 |
| 1.8 GHz GSSI | 3.57 | 0.03 | 4.41 | 0.05 | 5.67 | 0.09 | 6.57 | 0.11 |
where: FI is the fouling index; S antenna in suspended position;G antenna in ground-coupled position; AV is the average value; CV is the coefficient of variation value.
| w % | 6 | 8 | 10 | 12 | ||||
|---|---|---|---|---|---|---|---|---|
| AV | CV | AV | CV | AV | CV | AV | CV | |
| 400 MHz IDS S | 6.22 | 0.17 | 6.72 | 0.18 | 7.20 | 0.22 | 7.36 | 0.24 |
| 400 MHz IDS G | 6.28 | 0.13 | 6.74 | 0.15 | 7.34 | 0.17 | 7.73 | 0.18 |
| 500 MHz GSSI | 3.31 | 0.17 | 3.47 | 0.18 | 3.74 | 0.23 | 4.07 | 0.28 |
| 900 MHz GSSI | 3.75 | 0.20 | 4.00 | 0.20 | 4.46 | 0.24 | 4.84 | 0.27 |
| 1.0 GHz GSSI | 4.56 | 0.18 | 4.82 | 0.21 | 5.18 | 0.24 | 5.58 | 0.27 |
| 1.8 GHz GSSI | 4.58 | 0.19 | 4.85 | 0.21 | 5.20 | 0.24 | 5.58 | 0.27 |
where: w % is the water content and the other symbols are same as Table 3.
| ɛ min | ɛ max | |
|---|---|---|
| 400 MHz IDS ground-coupled | 5.0 | 9.5 |
| 400 MHz IDS suspended | 4.9 | 9.5 |
| 500 MHz GSSI | 2.6 | 5.7 |
| 900 MHz GSSI | 2.8 | 6.6 |
| 1.0 GHz GSSI | 3.5 | 7.6 |
| 1.8 GHZ GSSI | 3.4 | 7.6 |
© 2014 by the authors; licensee MDPI, Basel, Switzerland This article is an open access article distributed under the terms and conditions of the Creative Commons Attribution license (http://creativecommons.org/licenses/by/4.0/).
Share and Cite
De Chiara, F.; Fontul, S.; Fortunato, E. GPR Laboratory Tests For Railways Materials Dielectric Properties Assessment. Remote Sens. 2014, 6, 9712-9728. https://0-doi-org.brum.beds.ac.uk/10.3390/rs6109712
De Chiara F, Fontul S, Fortunato E. GPR Laboratory Tests For Railways Materials Dielectric Properties Assessment. Remote Sensing. 2014; 6(10):9712-9728. https://0-doi-org.brum.beds.ac.uk/10.3390/rs6109712
Chicago/Turabian StyleDe Chiara, Francesca, Simona Fontul, and Eduardo Fortunato. 2014. "GPR Laboratory Tests For Railways Materials Dielectric Properties Assessment" Remote Sensing 6, no. 10: 9712-9728. https://0-doi-org.brum.beds.ac.uk/10.3390/rs6109712