1. Introduction
In Castilla-Leon region, wine cellars constitute a patrimonial legacy of singular value. The types of materials and forms of construction are very diverse. In addition, the wine industry plays an important role in the agricultural economy in this region. It is a sophisticated industry, which provides a high added value, but deeply rooted in socio-cultural customs and traditions. This strong combination between modern and traditional systems has made the wine industry the main key for economic development in these areas. Through regulatory policies, the traditional production and marketing systems related to wine have been improved, providing also added value on all heritage elements related to wine.
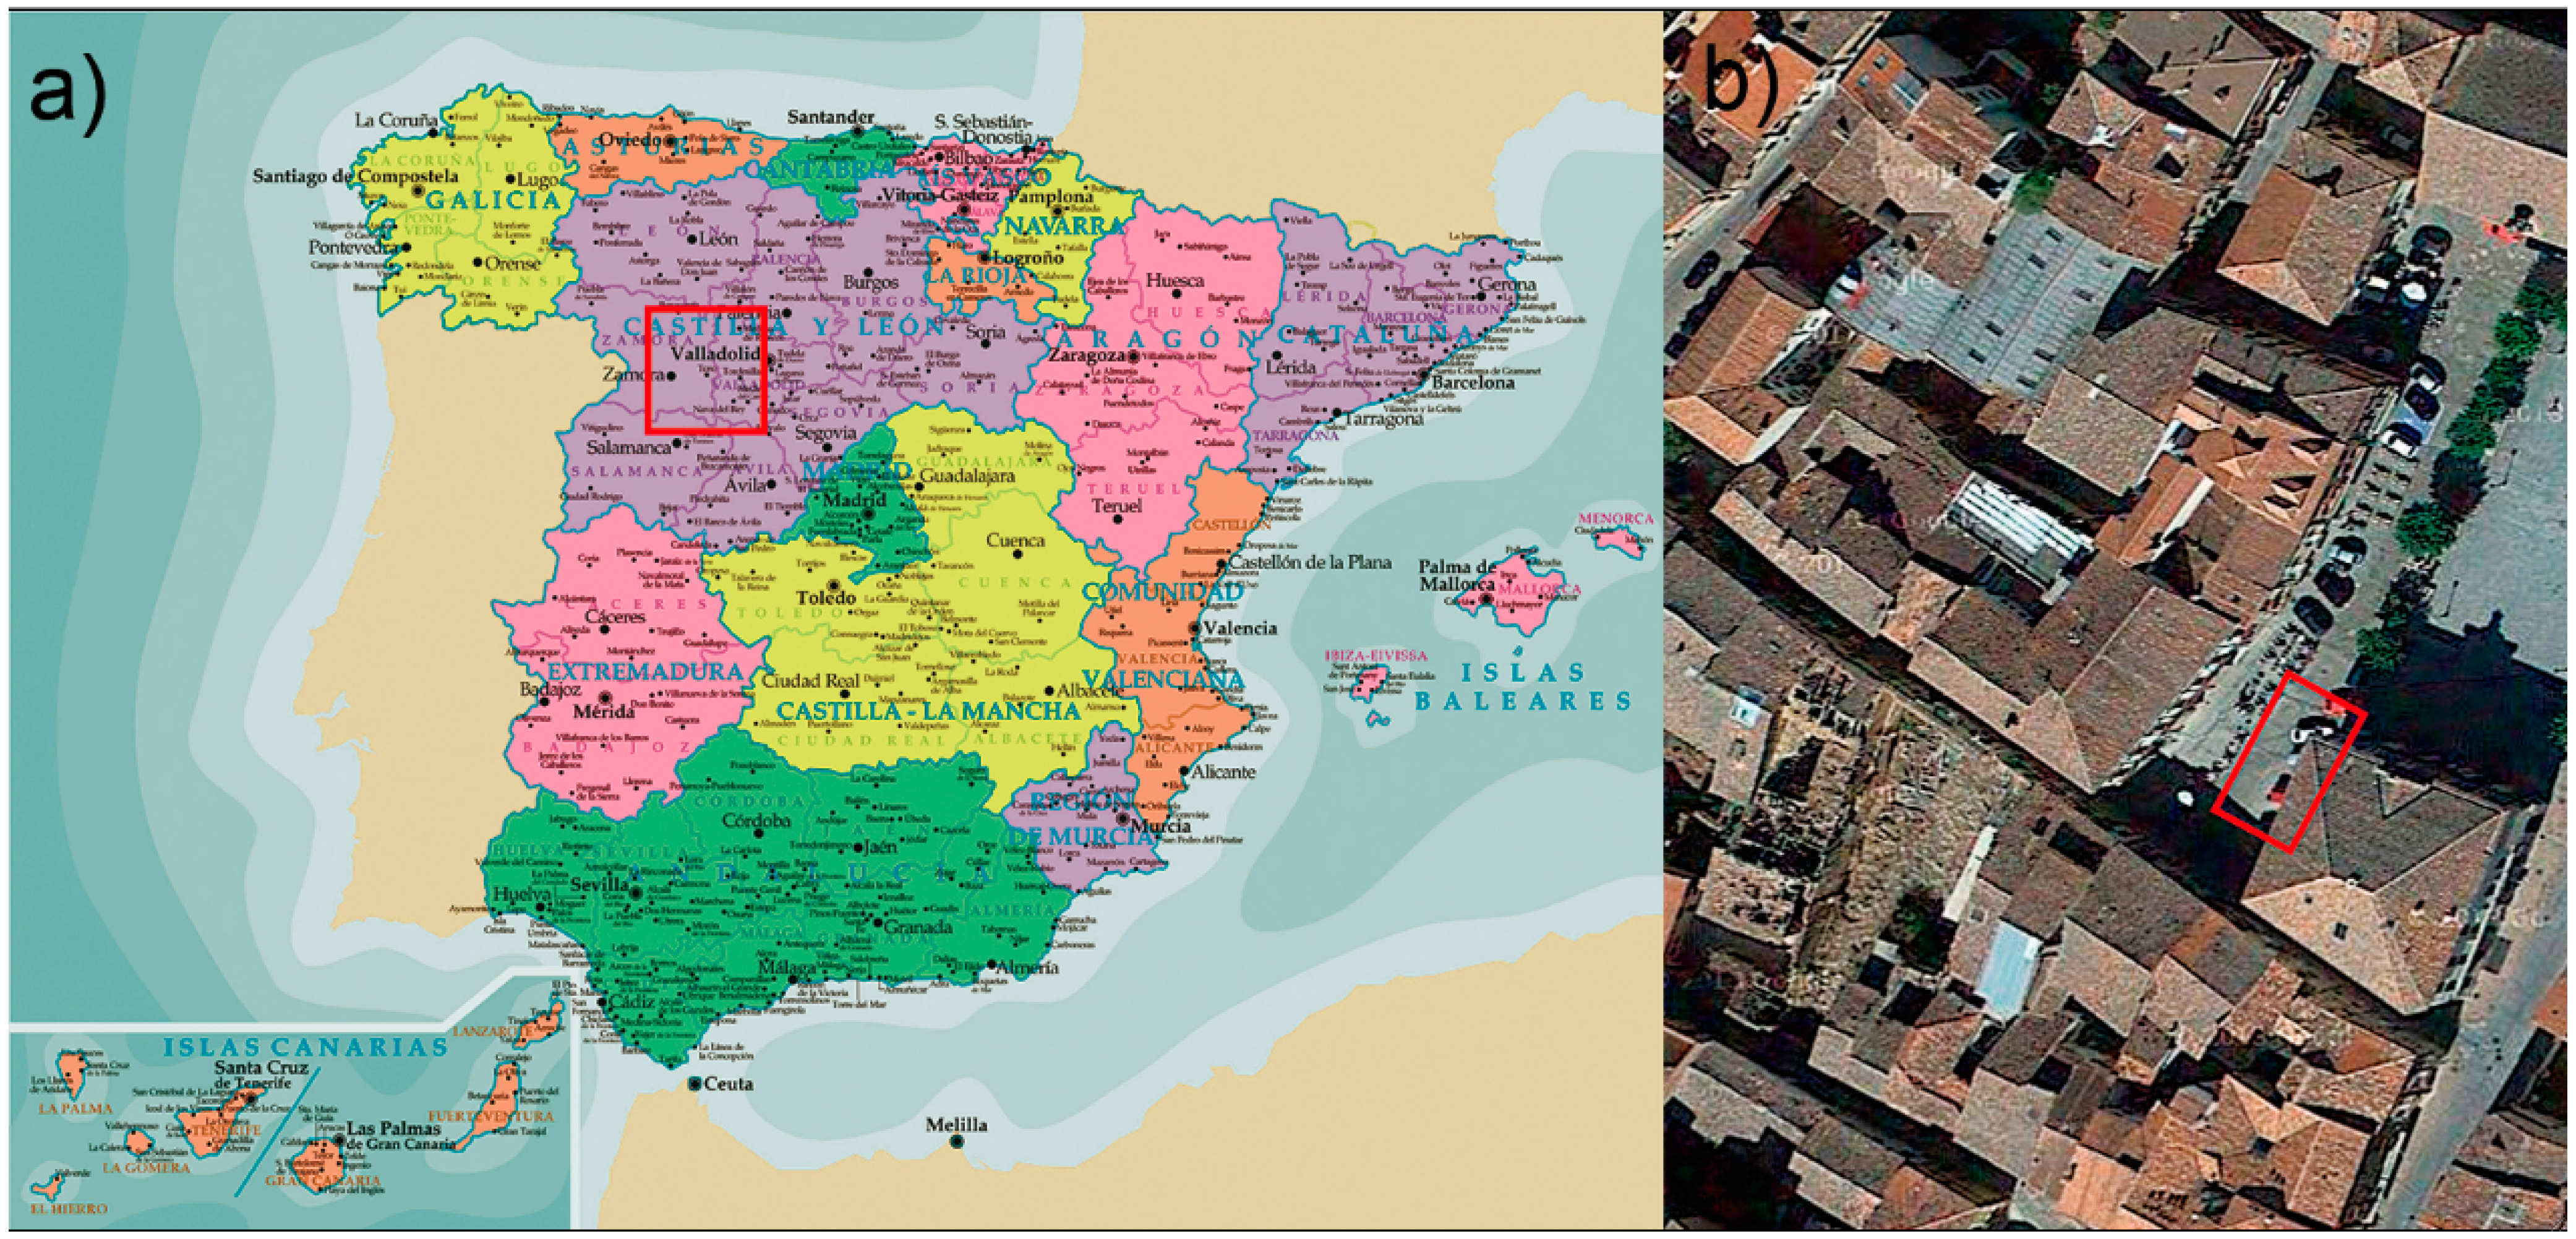
In this paper, we focus on the study case of “Toro’s Council” wine cellar due to its complex geometry, unknown materials, internal structure analysis and, last, but not least, its heritage restoration. The underground structure is located in the municipality of Toro (Zamora) in the west of Spain (
Figure 1a). This wine cellar was built centuries ago as a part of a noble building of great historical and architectural value; today, it forms part of the underground of the Town Hall of Toro (
Figure 1b). Over the years, this historic building has suffered decay, invasion of vegetation in walls, paths and even major changes as a result of urban development. At present, policies to promote the wine regions are clearly committed to architectural restoration and rehabilitation of this wine cellar. Thereby, they recover their importance by fitting to more modern uses, becoming elements that reinforce the cultural identity. However, given the underground features of this wine cellar, it has been necessary to integrate different sensors, such as terrestrial laser scanner (TLS) and non-invasive ground penetrating radar (GPR), in order to perform thorough research.
Figure 1.
(a) Location of the wine cellar: Toro, Zamora, Spain; (b) top view and location of the “Toro’s Council” wine cellar.
Figure 1.
(a) Location of the wine cellar: Toro, Zamora, Spain; (b) top view and location of the “Toro’s Council” wine cellar.
The conjunctions of TLS and GPR provide us a whole metric 3D structure of the external and internal areas inside the wine cellars. In particular, GPR geophysical methods enable the identification of the size, shape and direction of inaccessible areas, such as walled, hidden areas or areas where there have been landslides. Multidisciplinary approaches have been applied for the documentation of historic structures, as is the case of: [
1], who applied GPR and photogrammetric techniques to document megalithic tombs; and [
2,
3], who applied digital photogrammetry and GPR, to evaluate structural damages and possible failures of a mediaeval bridge. Recently a combination of GPR and electrical resistivity tomography (ERT) techniques has been applied to reveal hidden archaeological structures in a mausoleum [
4] and in the Acropolis to reveal a bronze foundry complex [
5]. On the other hand, in the context of geology and not for archaeological and heritage documentation, [
6] used a combination of geomatics and geophysical methodologies for geomorphology characterization of a small mountainous catchment in Scotland. Specifically, they used a TLS (Riegl LPM-i800HA) to create a detailed digital terrain model (DTM) and the Differential Global Positioning System (DGPS) to complement the other geophysical techniques. In a similar way, [
7] used TLS data in combination with GPR and ERT to evaluate the stability of cliff sites; more recently, [
8] employed a multidisciplinary approach based on GPR, ERT and TLS to investigate the responses of slope stability due to climatic changes in high alpine rock walls.
In this paper, we perform a detailed characterization of the geometry and internal material for the structural evaluation of an underground wine cellar. The approach developed copes with the external geometry applying TLS equipment and with the internal structure using GPR data. Finally, a structural evaluation of the wine cellar based on the previous data and supported by the finite element method (FEM) is applied. The paper is structured as follows: after this introduction,
Section 2 describes the sensors used, as well as the methodology developed, putting special emphasis on the pass from the laser point cloud to the computer-aided design (CAD) model, as well as its structural analysis.
Section 3 outlines the experimental results, including a technical discussion. A final section is devoted to put across the main concluding remarks.
2. Materials and Methods
When performing a structural modelling of any structure, several models must be considered. First, a conceptual model that represents the physical reality of the structure has to be defined by means of its geometrical description and boundary conditions. Then, a mathematical model that describes the behavior of the structure has to be established. The mathematical or structural model basically refers to the relationships between the variables and parameters that describe the physical model, the constitutive law of materials and the basic theories that model the structural behavior. In this article, the reconstruction of the physical model is assisted by geomatic methods, such as TLS and GPR. Then, the structural modelling was performed following the basis of the classical plate theory by using FEM.
2.1. Geometric Reconstruction
A geomatic survey was conducted in order to generate a 3D model accurately describing the structure of the wine cellar. For that purpose, TLS and GPR techniques were integrated.
2.1.1. Terrestrial Laser Scanner for External Geometry
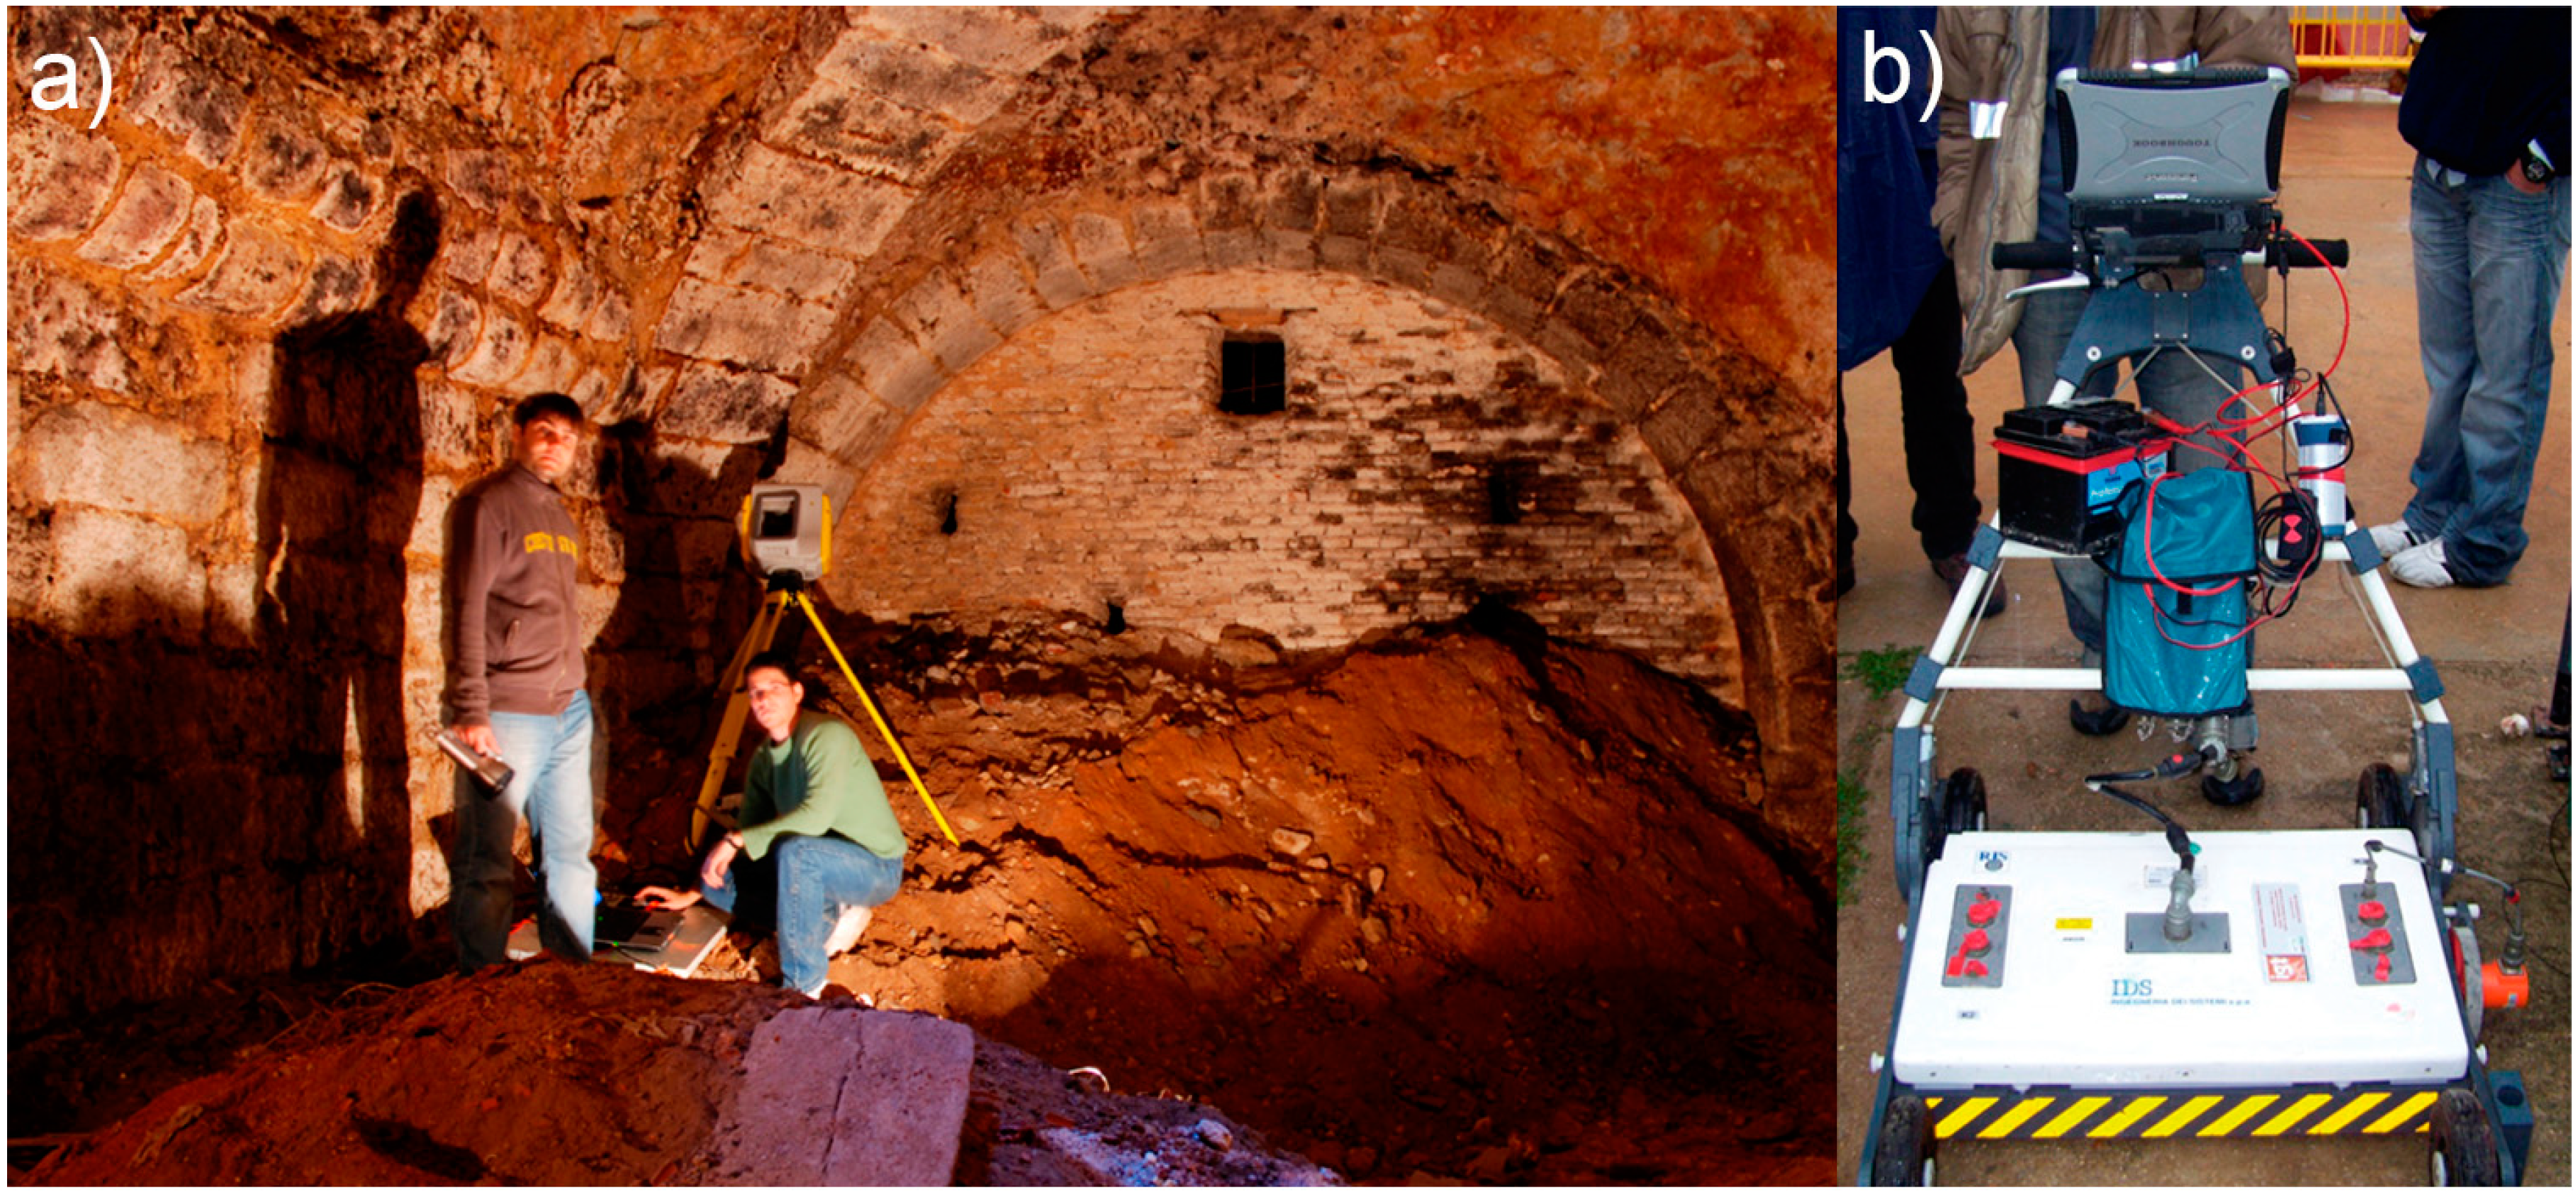
A time-of-flight (ToF) TLS, Trimble GX, was used for recording external geometry (
Figure 2a). This scanner covers a field of view of 360° in the horizontal direction and 60° in the vertical direction, enabling the collection of full panoramic views. The distance measurement is obtained with a nominal accuracy of 2 mm at a 10-m range using a wave length of 532 nm. The vertical angular step-width is 0.0014°, and the horizontal one 0.0012°. The diameter of the laser spot is 1 mm at 10 m. The system is able to measure 5000 points per second. The scanner incorporates a dual axis compensator, so the vertical Z-direction is perfectly defined during data acquisition.
Because of the vertical direction limitation, four scanner stations with a resolution of 1 cm at 10 m were required to enclose the whole area. The resulting point cloud (about 4 million) not only generated three-dimensional coordinates (XYZ) of points, but also their intensity values (I) processed using 8-bit electronics. Likewise, all of the profiles defined in the geophysical prospection were identified with artificial targets and georeferenced with the TLS in order to reach valid conclusions. In particular, as we seek to integrate the underground geometry (GPR) of the wine cellar with the results of TLS survey, it was necessary to define a network of control points defined by planar targets performing as a local reference coordinate system. The definition of the reference system is a key factor enabling the results of different methodologies (TLS and GPR) to be merged and compared.
This operation requires the location of these targets along the profiles defined for the GPR measurements, as well as several targets placed in other vertical walls and their own floor for aligning the four scanner stations that enclose the whole external geometry.
2.1.2. Ground Penetrating Radar for Internal Structure
A GPR equipment, RIS MF HI-MOD 200–600 MHz (
Figure 2b), was used in order to provide information about the internal structure and materials of the cellar, achieving greater efficiency in occluded areas. This equipment was chosen due to its favorable compromise between spatial resolution and depth of detection. This antenna provides 6 m in-depth penetration (under optimum conditions) and a vertical resolution of 5 cm, which indicates the differentiation of two adjacent signals, like different events [
9].
Data were acquired with trace intervals of 2 cm and time windows of 100 ns. A total of 4 parallel profiles were surveyed with a distance between profiles of 1 m. Since there was not too much information available about the modification works done in the wine cellar over time, the walls selected were those that at first sight appeared to be built later than the original wine cellar construction, a feature that could indicate the continuity of the wine cellar behind the wall. The workflow followed in the definition of the profiles tries to solve two mains problems: (i) tracing profiles with enough length to distinguish the reflections correctly, so that vertical profiles were surveyed; (ii) providing the best interpretation of the profiles based on the TLS georeferencing.
On the other hand, two additional profiles were surveyed and considered as a reference. These reference profiles consist of registering data (TLS and GPR) at locations in which the composition of what exists underground was previously known. The
in situ procedure consisted of using the walls whose faces are visible following the procedure presented in [
10]. The external geometric model was achieved using the TLS, whereas the morphologic composition of the wall was deducted from the visible walls. Then, a georeferenced grid (at both of the wall faces), using flat reflective targets, marked the path of the antennas during the calibration, and so, this combined information assisted the calibration model and, thus, the registration of TLS and GPR under the same coordinate system. In this way, a first reference profile was surveyed in a wall with a known hole behind; a second reference profile was surveyed in a wall where the composition of material behind was known (conglomerate in a reddish brown clay matrix, corresponding to “Toro’s Red Facies”).
Figure 2.
(a) Terrestrial laser scanner used for the recording of the external geometry, Trimble GX; (b) ground penetrating radar equipment, RIS MF HI-MOD 200–600 MHz.
Figure 2.
(a) Terrestrial laser scanner used for the recording of the external geometry, Trimble GX; (b) ground penetrating radar equipment, RIS MF HI-MOD 200–600 MHz.
2.1.3. Data Processing
Geometric data processing was performed following four steps:
- Cleaning and segmentation of point clouds. Data preprocessing may also include manual or automated filtering to remove undesired data, such as reflections, noise or sensor artifacts.
- Alignment. The point clouds from each scan are initially represented in the scanner's local coordinate frame. All of the data need to be aligned in a common coordinate system through a process known as alignment. An automated registration method, iterative closest point (ICP) [
11], was applied, supported by the identification of matching points.
- Generating a CAD model. Since the FEM model does not cope with dense laser 3D models, an important step that allows us to pass from 3D point clouds to a solid model was performed. In this case, once the point cloud was converted into a triangulated mesh, cross-sections were extracted, and surface extrusions were performed as follows: first, horizontal and vertical cross-sections were obtained from the mesh in order to represent the basic geometry of the wine cellar. Then, the 3D solid of the wine cellar was modelled by extruding the horizontal cross-section vertically, based on the constraints of the vertical cross-sections.
- Before interpretation of the internal structure, GPR processing filters (low-pass and high-pass filters) were employed in order to reduce any unwanted noise in the raw data. This allowed enhancing the differences in the information composed of the signals received, and an image of the subsurface (radargram) was produced, including all of the features and/or targets of interest. Consequently, GPR data interpretation could be performed easier. Each radargram was processed by Spiview software by applying the following processing workflow: deconvolution (to improve resolution and avoid multiple reflections); Hilbert’s transformation (to obtain some properties of the traversed matter); migration (to provide the true geological position), spectral transformation (to improve resolution and amplify certain signals) and spatial filtering (fast Fourier transform was applied to decrease the effects of noise).
As a result of this process, a final cartographic map in 3D space containing both surface evidence provided by TLS and the GPR interpretation was obtained. In particular, the metric information obtained allowed calibrating radar wave velocities accurately in different zones of the structure, as shown in
Section 2.1.2. Knowledge of the most appropriate radar wave velocity allowed for a more exhaustive interpretation of the GPR data. All of the TLS and GPR data processed were used to build a 3D finite element model of the wine cellar.
2.2. Structural Modeling
As stated above, the geometric model was built to support the structural analysis. Having a detailed geometric reconstruction of the cellar may allow one to perform a realistic structural evaluation of the built up construction. The simulation of the structural behavior was done following the mathematical principles of classical plates theories.
The Mindlin-Reissner theory of plates [
12,
13] is an extension of the Kirchhoff-Love plate theory that takes into account shear deformations through the thickness of a plate. These theories are intended for thick plates in which the normal to mid-surface remains straight, but not necessarily perpendicular to the mid-surface. The Mindlin-Reissner theory is used to calculate the deformations and stresses in a plate whose thickness is of the order of a tenth the planar dimensions, while the Kirchhoff-Love theory is applicable to thinner plates.
2.2.1. Materials
Modelling the material properties of a historical masonry structure is quite challenging, particularly in the absence of field and laboratory tests. The construction material of the winery is limestone, and according to [
2,
14,
15], a linear and isotropic elastic behavior is assumed. The main mechanical properties of limestone are defined according to [
11], the specific weight (γ) being 27 kN/m
3, the compressive strength established as 4 × 10
4 kN/m
2, the tensile strength taken as a tenth of the compressive strength, the Young’s modulus of elasticity (E) with a value of 3.2 × 10
6 kN/m
2 and a value of 0.2 for the Poisson’s coefficient (Ʋ) taken according to [
16].
2.2.2. Boundary Conditions
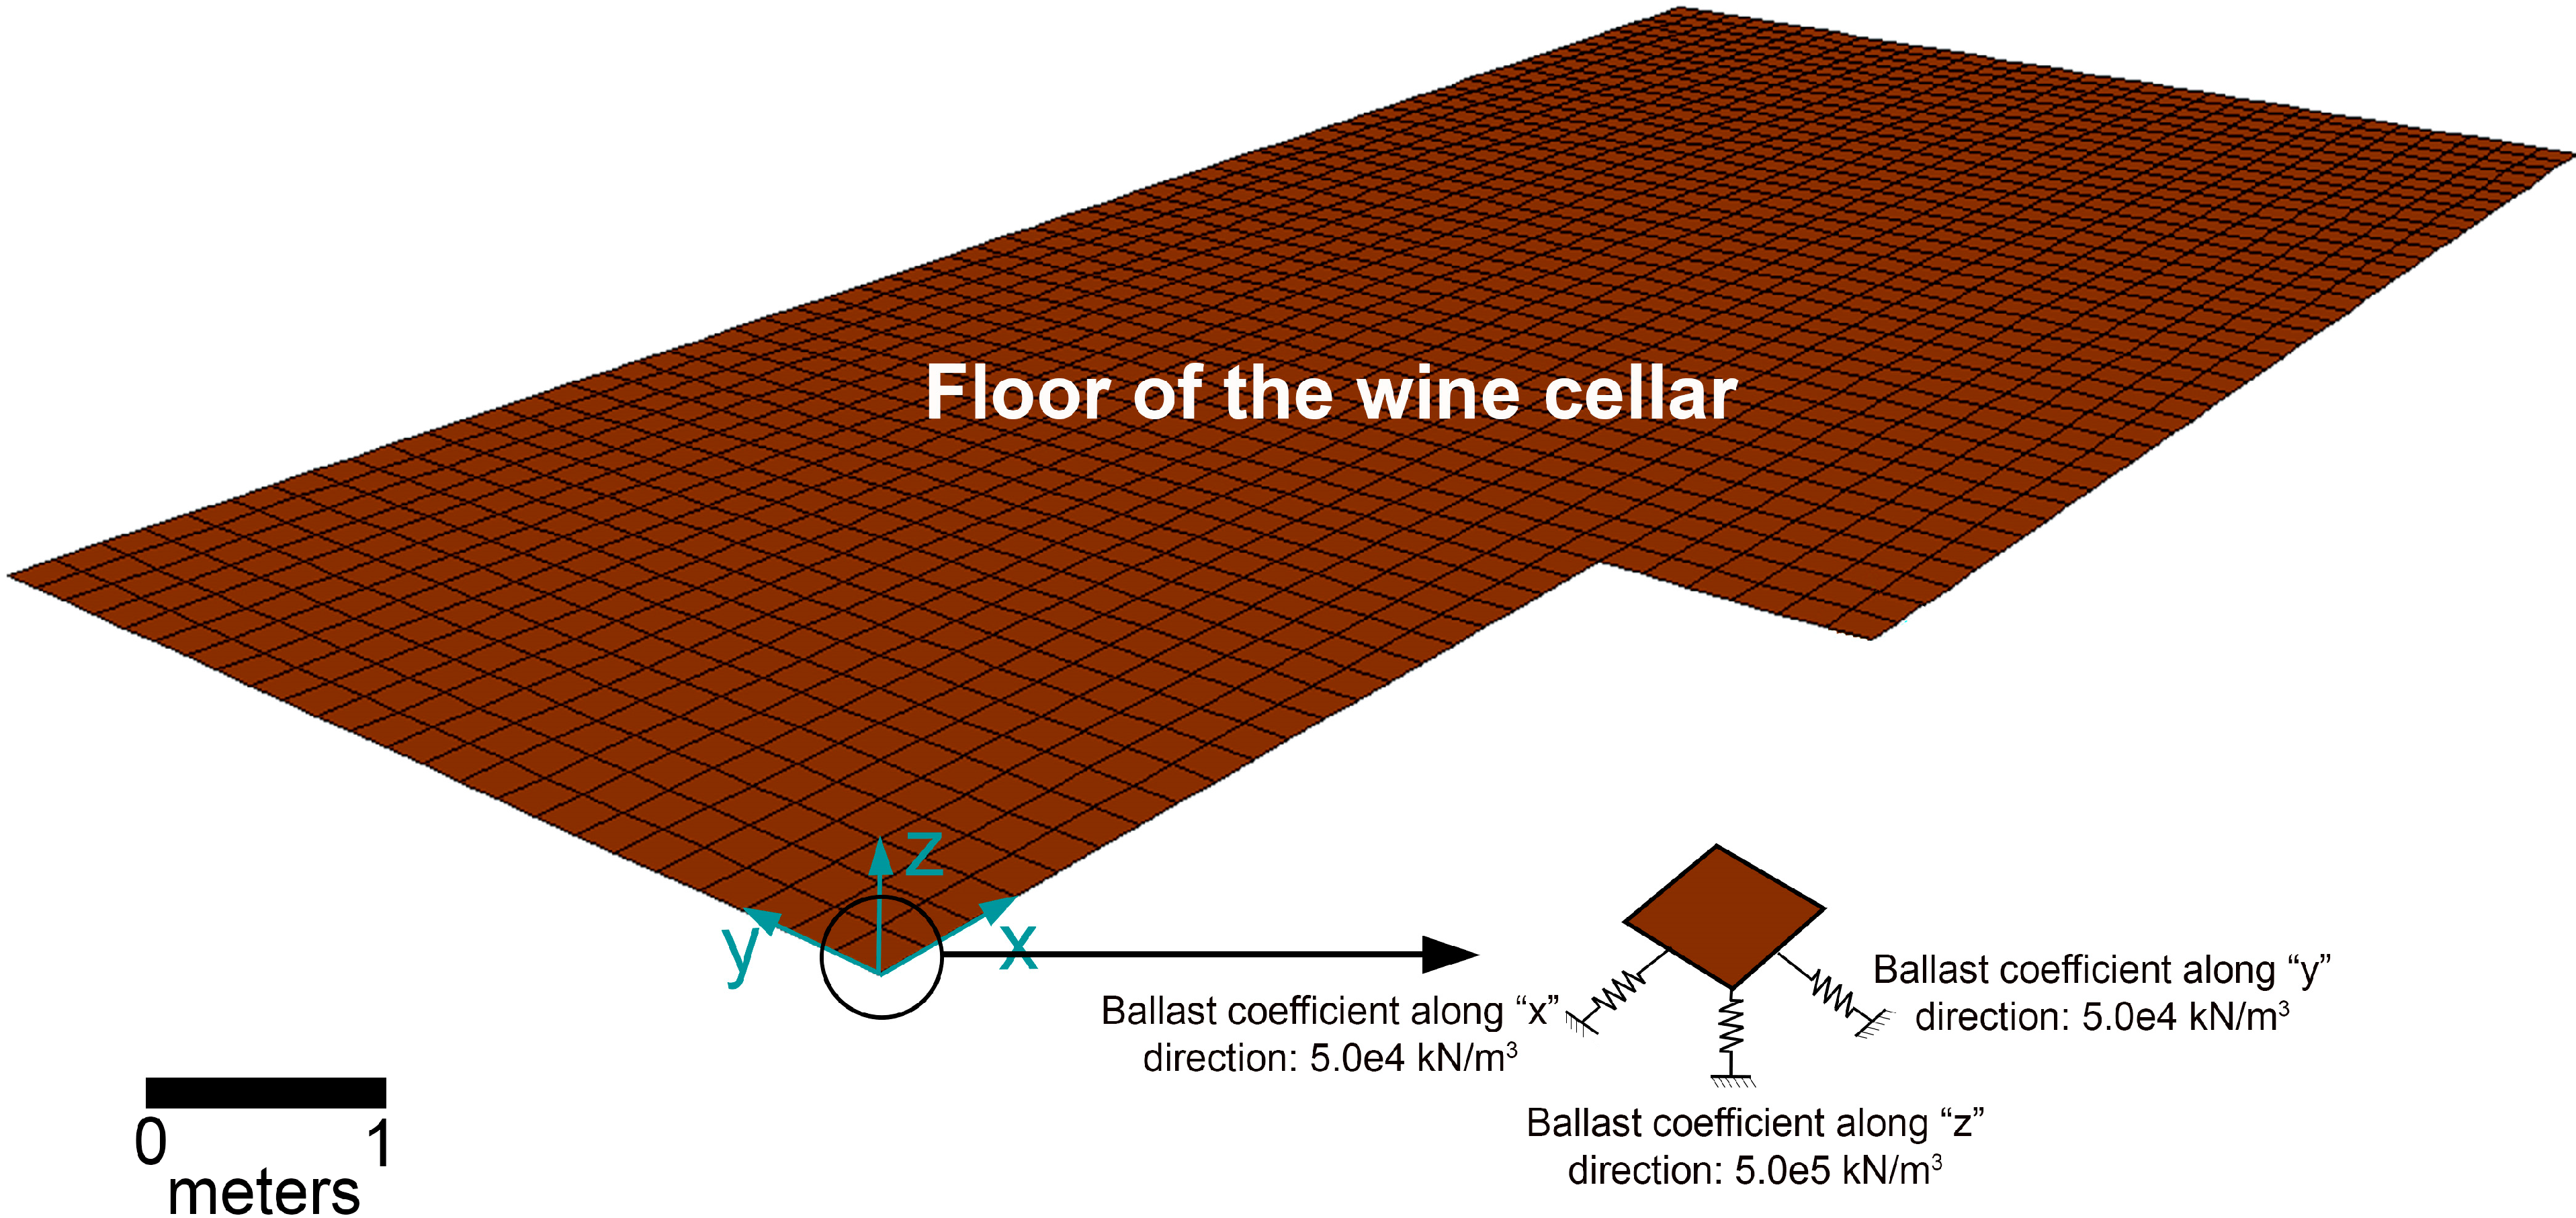
Due to the peculiarity of the construction (i.e., a wine cellar), only constraints on the soil are defined, which restrict the movements in the two horizontal directions and in the vertical. These constraints are modeled by linear elastic supports, with an elastic coefficient, calculated on the basis of a ballast coefficient that represents the interaction soil-winery.
More specifically, these supports are modeled through the area elements of the ground of the winery with a ballast coefficient estimated as 5 × 10
5 kN/m
3 in the vertical direction according to [
17,
18]. This is a high value because of being a consolidated soil for years. A ballast coefficient in both horizontal directions was used to compensate for the asymmetry of loads. The ballast coefficient for horizontal loads was equivalent to a tenth of the vertical one.
Figure 3 shows the floor model of the wine cellar with the boundary conditions imposed at one of the shell elements; the same boundary conditions are applied to the rest of shell elements.
Figure 3.
Boundary conditions at the floor of the wine cellar.
Figure 3.
Boundary conditions at the floor of the wine cellar.
2.2.3. The Computational Model
Once the conceptual model was created, it was exported to the Drawing Exchange Format (DXF), which allowed the importation of the 3D model into the software for structural analysis. The software SAP 2000 was used to perform the structural computations [
19].
For the structure under study, the FEM was defined using a planar shell model whose elements are defined by 4 nodes with 6 degrees of freedom each (shell-thick type), which take into account the contribution of the shear stiffness of the plate, according to the theory of plates in [
12,
13]. As a result, a model consisted of 8087 nodes and 8122 elements.
Planar elements instead of volumetric ones were selected due to the constant thickness of cellar walls. This simplification allowed carrying out calculations with a better computational performance, preserving the accuracy of the structural model. The averaged thickness of walls was found to be 0.4 m in the elevation walls of the cellar and 0.4 m for the upper walls, corresponding to the barrels.
It is important to note that two large categories of computational models exists: discontinuum models and continuum models. In a discrete or discontinuum model formulation, the structure is divided into large discrete deformable parts connected with interfaces [
20]. A unilateral law, possibly with friction, describes the behavior of the contact surface in each interface, while the discrete elements are assumed to behave elastically. When modelling a masonry structure, building discrete models seems to be a more realistic approach for the representation of the mechanical behavior of the structure. Nevertheless, this approach is computationally very costly, first, due to the geometric description of all of their masonry blocks and also interfaces, and second, due to the requirement of difficult numerical methods [
21].
In continuum model approaches, the walls are assumed to be composed of a single material whose mechanical behavior is described by a non-linear constitutive law [
22] or the different mechanical behavior between stone and mortar and the anisotropy induced by them are taken into account on the basis of a homogenization theory [
23]. For the computational modelling of the wine cellar presented here, a continuum model was used. In particular, a 3D FEM based on the overall geometry taken from TLS was considered, whereas the GPR survey gave important general information about the internal composition of the wine cellar walls. As a result, on site measurements could be applied to make the computer simulation more reliable.
The purpose of the structural modelling was to detect critical zones in the structure and compare these zones with both geomatic results and visual inspection. Cracking is one of the main failure problems of masonry structures. It is assumed that cracking happens when stress reaches a critical failure surface.
2.2.4. Loading Conditions
Different actions were taken into account for the structural simulation:
- Dead load (DL): defined by the specific weight and the volume of the structural elements of the wine cellar according to the geomatic results.
- The permanent load of the ground (
PLg ground) is one of the most important loads over the wine cellar and represents the thrust caused by soil on the walls and vaults. The maximum thrust on walls has been calculated using the Rankine theory [
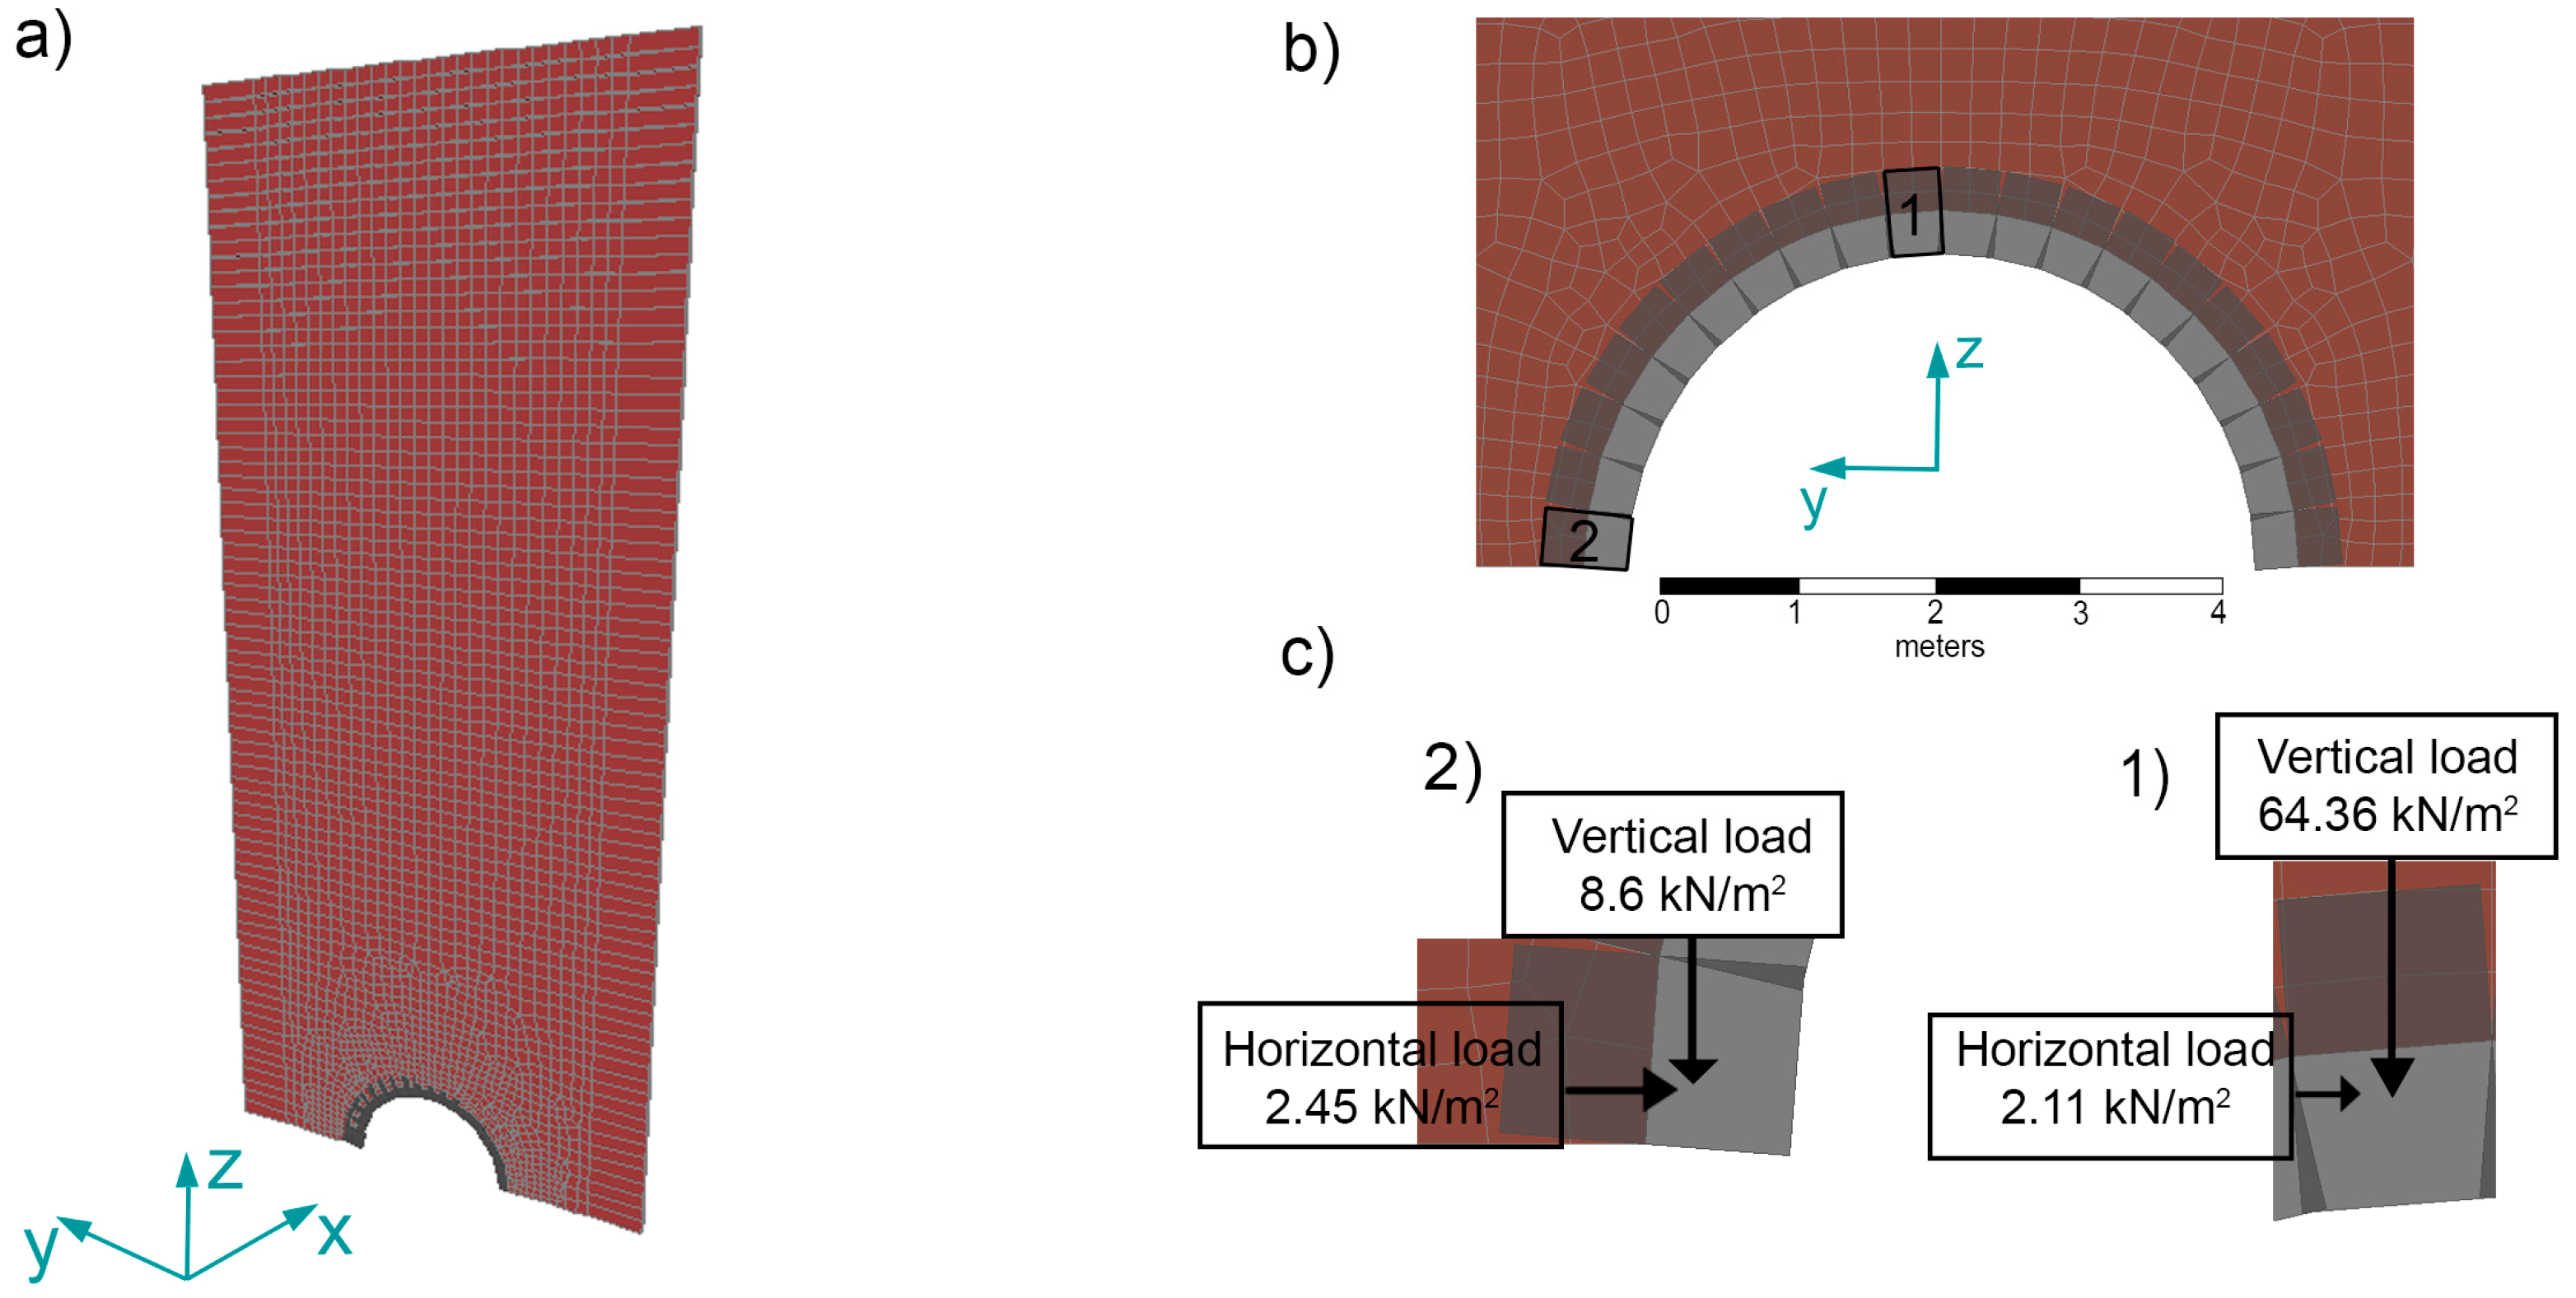
24], considering active thrust, since it is assumed that the displacement of walls is subtle. The soil thrust on the walls defining the envelope of the building is considered to be a trapezoidal load. The wine cellar comprises 8 walls with different geometry and upper bounds, so that there are different values of thrust on each wall. As an example,
Figure 4 shows the value of soil thrust on two walls of the wine cellar.
The soil thrust on the vault required a different calculation: due to the curved shape of the vault, the soil thrust would result in a hardly-measurable inclined load. This was therefore modelled through finite elements; the vault and the soil above were independently modelled in order to obtain an estimation of the soil loading over the vault as realistic as possible.
- The data considered for the soil were: specific weight of 18 kN/m
3, modulus of elasticity (
E) of 8 × 10
4 kN/m
2 and an internal angle of friction of 30°, according to [
18]. Historic documents relate that the height of soil over the vault is 19 m. The model of the vault and the soil consists of a 1 m-thick flat model (
Figure 5a). The vault was modeled through 30 discrete bar-type elements, with a length of 25 cm each and a cross-section defined by a thickness of 40 cm and a width of 10 cm.
Figure 4.
Values of soil thrust on two walls of the wine cellar.
Figure 4.
Values of soil thrust on two walls of the wine cellar.
This model provided a value for the thrust caused by soil and the permanent load of the building (
PLb building) at each element of 5 kN/m
2 [
25].
Figure 5 shows forces acting for two of the elements; the others were obtained analogously.
Figure 5.
(a) Ground-vault model; (b) ground-vault mesh detail; (c) vertical and horizontal thrust (due to weight soil and the permanent load of the building above the wine cellar) over two vault elements.
Figure 5.
(a) Ground-vault model; (b) ground-vault mesh detail; (c) vertical and horizontal thrust (due to weight soil and the permanent load of the building above the wine cellar) over two vault elements.
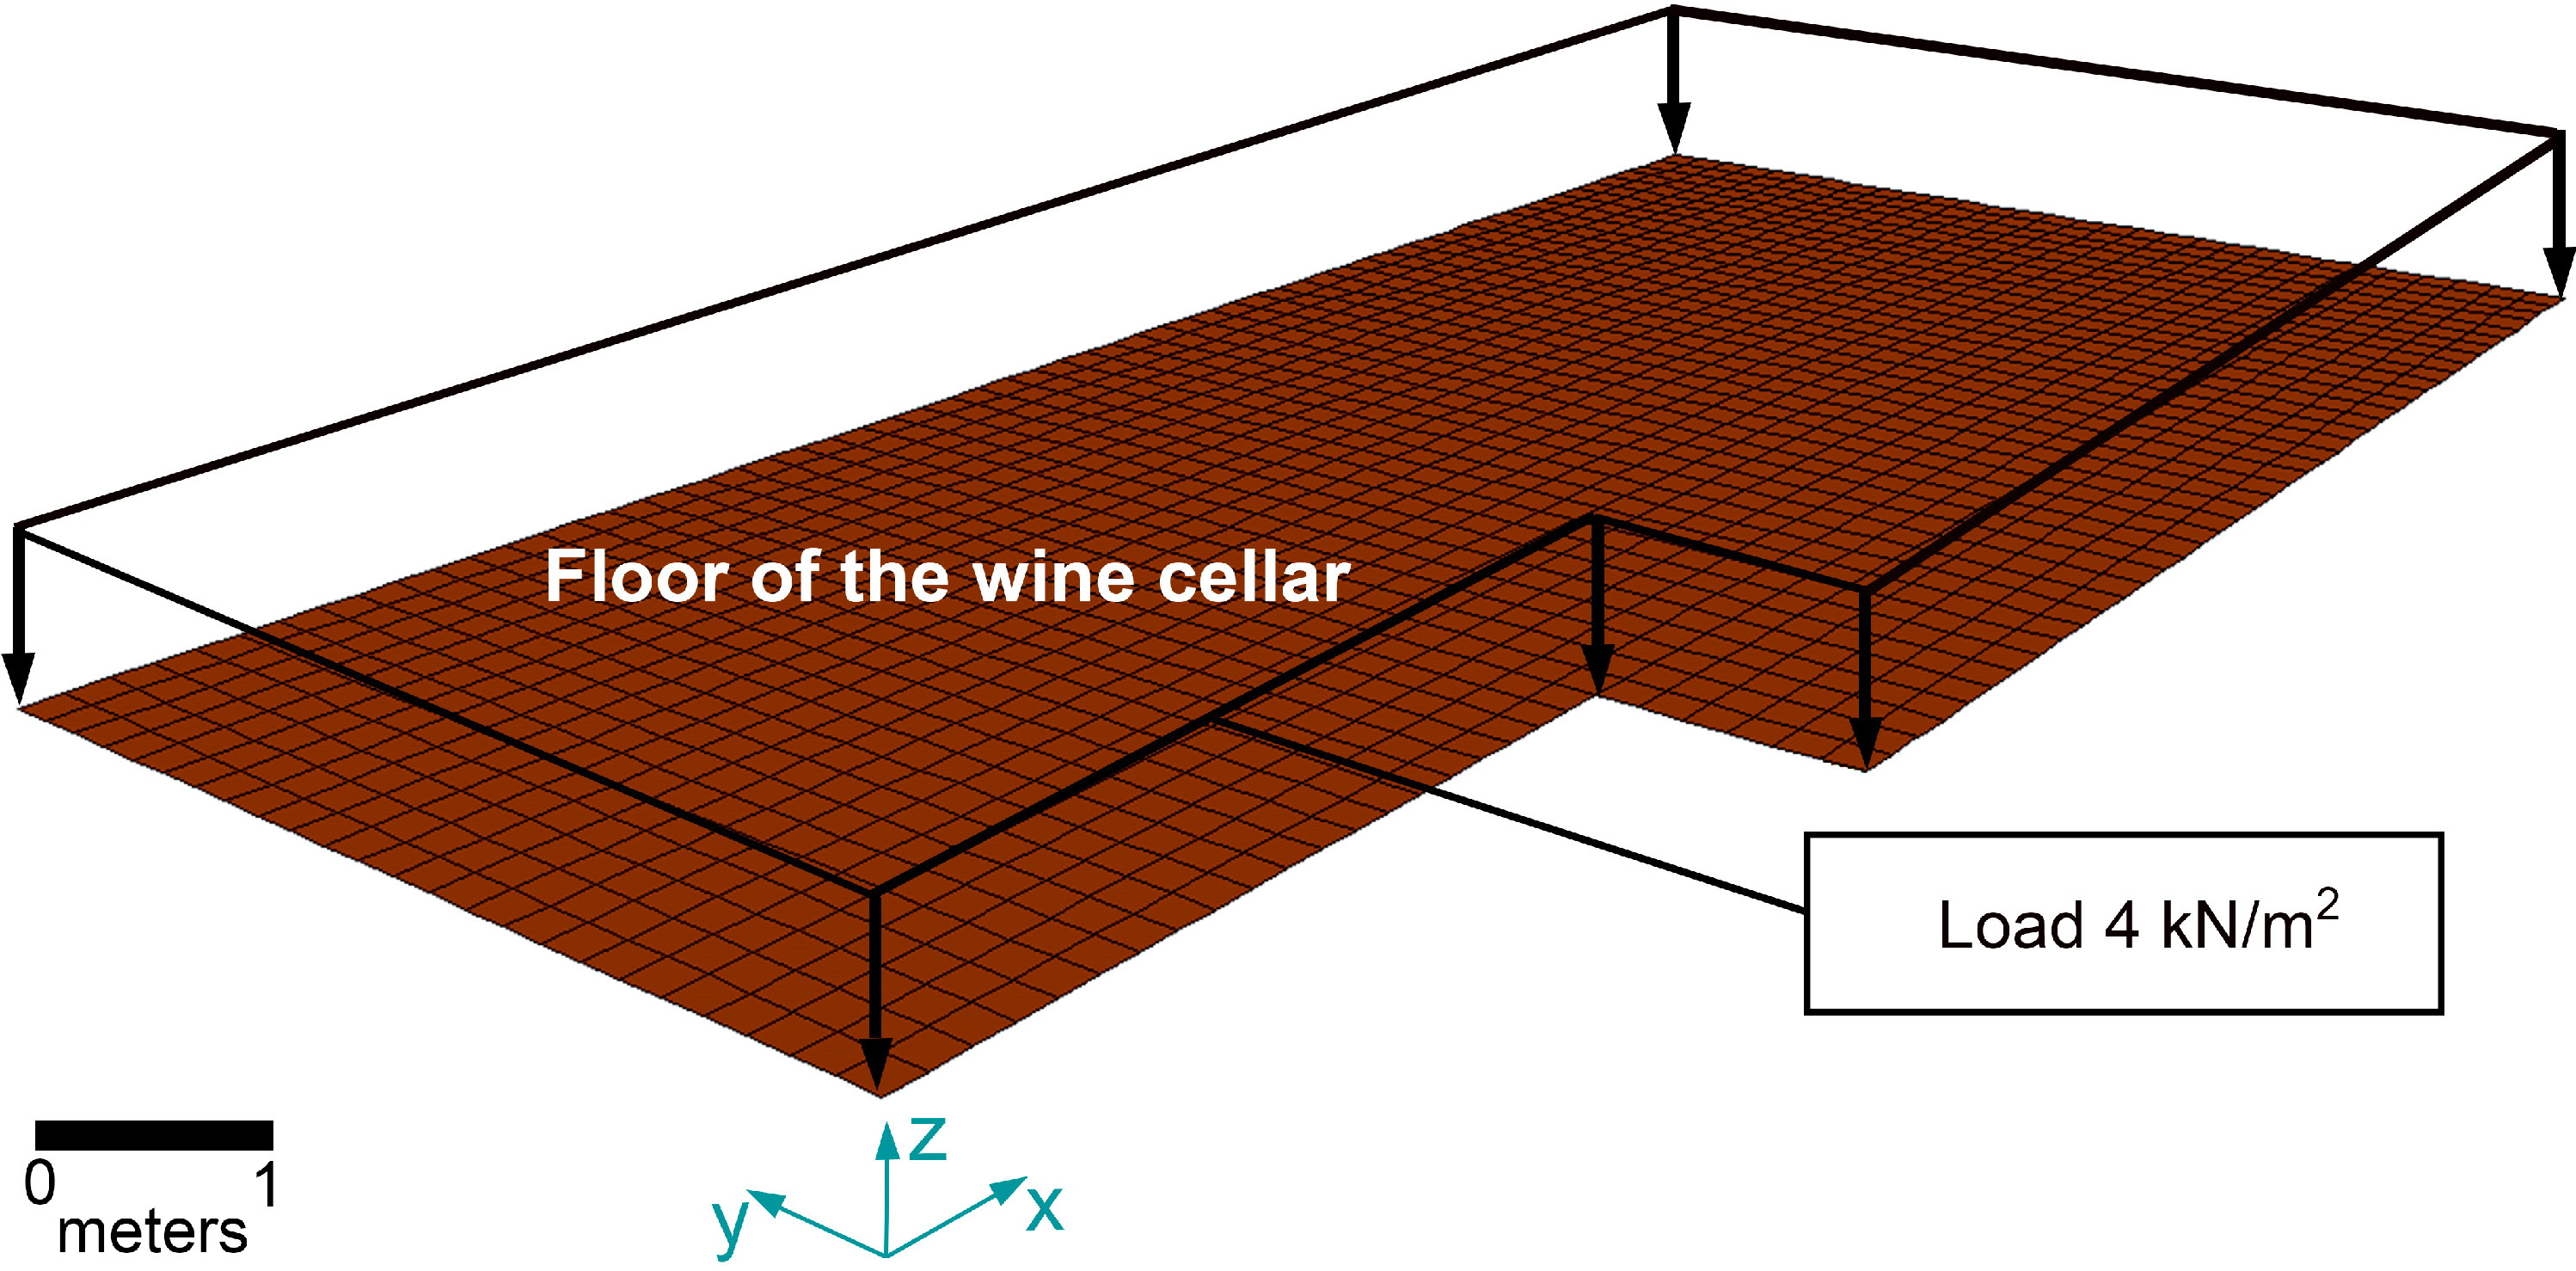
- Live loads (
LL) are those loads due to the presence of people inside the cellar and the building; values were taken from [
25]. This load includes a service overload of 3 kN/m
2 in the upper building (
Sb Building use) and a service overload of 4 kN/m
2 in the cellar (
Sc Cellar use). Following the same procedure explained above, the new live loads on the vault of the cellar were estimated. The service load of 4 kN/m
2 was introduced as a uniformly distributed load (
Figure 6)
Figure 6.
Service load of 4 kN/m2 on the floor of the wine cellar.
Figure 6.
Service load of 4 kN/m2 on the floor of the wine cellar.
The limit states are states beyond which the structure no longer satisfies the design performance requirements; these are classified as ultimate limit state and serviceability limit state. The ultimate limit state (
ULS) [
26] concerns the safety of people and/or the safety of the structure and is the state associated with structural collapse or other similar structural failures, such as excessive deformation, transformation of the structure or any part of it into a mechanism, rupture (cracking) and loss of stability of the structure or any part of it, including supports and foundations. The serviceability limit state (
SLS) [
26] concerns the functioning of the structure or structural members under normal use and the comfort of people. Both limit states will be analyzed for the wine cellar. There are two live loads applied to different areas; therefore, two loading combinations will be calculated for each of these states with different safety coefficients. The combinations of loads and coefficients were estimated according to [
26].
Table 1 details the load combinations and the applied coefficients for each limit state and the type of load.
Table 1.
Load combinations and applied coefficients according to the limit state and the type of load. SLS, serviceability limit state; ULS, ultimate limit state.
Table 1.
Load combinations and applied coefficients according to the limit state and the type of load. SLS, serviceability limit state; ULS, ultimate limit state.
| Limit State | Load-Coefficient Type |
|---|
| | DL | Sb | Sc | PLb | PLg |
| SLS1 | 1 | 0.7 | 1 | 1 | 1 |
| SLS2 | 1 | 1 | 0.7 | 1 | 1 |
| ULS1 | 1.35 | 1.5 | 1.05 | 1.5 | 1.35 |
| ULS2 | 1.35 | 1.05 | 1.5 | 1.5 | 1.35 |
3. Experimental Results and Discussion
The described method has been tested for one of the most representative cellars of the region of Toro, Zamora (Spain): The Town-Hall Cellar. The construction of the cellar of the Town-Hall of Toro took place in 1778 according to the headstones that lie next to the main entrance door. The famous royal architect Ventura Rodriguez signed the project, and the construction was carried out by the notorious local architect, Mr. Francisco Díez Pinilla. The cellar is buried 19 m deep compared to the entrance level of the town hall. The cellar is divided in two areas; the first one has a rectangular shape 5-m long and 3-m wide, surrounded by 2.5 m-high walls and covered by a vault with a 3-m span. The second area has a 3 m-wide squared plan covered by a barrel vault whose walls are located at different heights: 5 m and 2.5 m respectively. The materials used for the construction were rectangular limestone blocks (40-cm wide and 25-cm high), all joined with mortar.
The different results obtained in each phase of the present methodology are described in the following paragraphs.
3.1. Geometric Model
The external and internal geometry of the wine cellar was acquired from a combination of TLS and GPR [
27], respectively. More precisely, it was necessary to scan at four laser stations. Each scan provides a horizontal coverage of 360° acquiring a point cloud with an average of 1-cm resolution at 10 m and using two single shots per point. The data collection settings ensured more than 50% overlap between clouds of points, guarantying the best alignment. In this way, we obtained a total of approximately eight million raw points in XYZ coordinates for the geometric definition of the interior of the wine cellars. Regarding the internal geometry, four profiles were defined with enough length to distinguish the reflections correctly. The standard procedure is performing horizontal profiles (in a plane orthogonal to the plumb line). However, with walls of reduced width, it was necessary to acquire vertical profiles. In addition, radar profiles were geo-referenced based on geometric data collected by TLS, which constituted a significant advantage towards the success of profile interpretation (
Figure 7).
Figure 7.
3D laser model with the GPR profiles georeferenced.
Figure 7.
3D laser model with the GPR profiles georeferenced.
As a result of the processing and registration of TLS and GPR, a final geometric 3D model with internal (GPR) and external (TLS) properties was obtained. This 3D geometric model is a CAD product, which will be considered in the structural analysis.
3.2. Structural Analysis
3.2.1. Finite Element Model
The format and volume of the geometric data acquired by a laser scanner present important limitations in order to be converted to a finite element model of the construction. For this reason, a semi-automatic process has been carried out with the commercial software, Geomagic, which allowed the laser point cloud to be converted into a solid CAD model. Once the solid geometric model was defined, the structure of the wine cellar could be evaluated through finite element modeling (FEM). SAP2000 software [
19] was used to perform the structural evaluation.
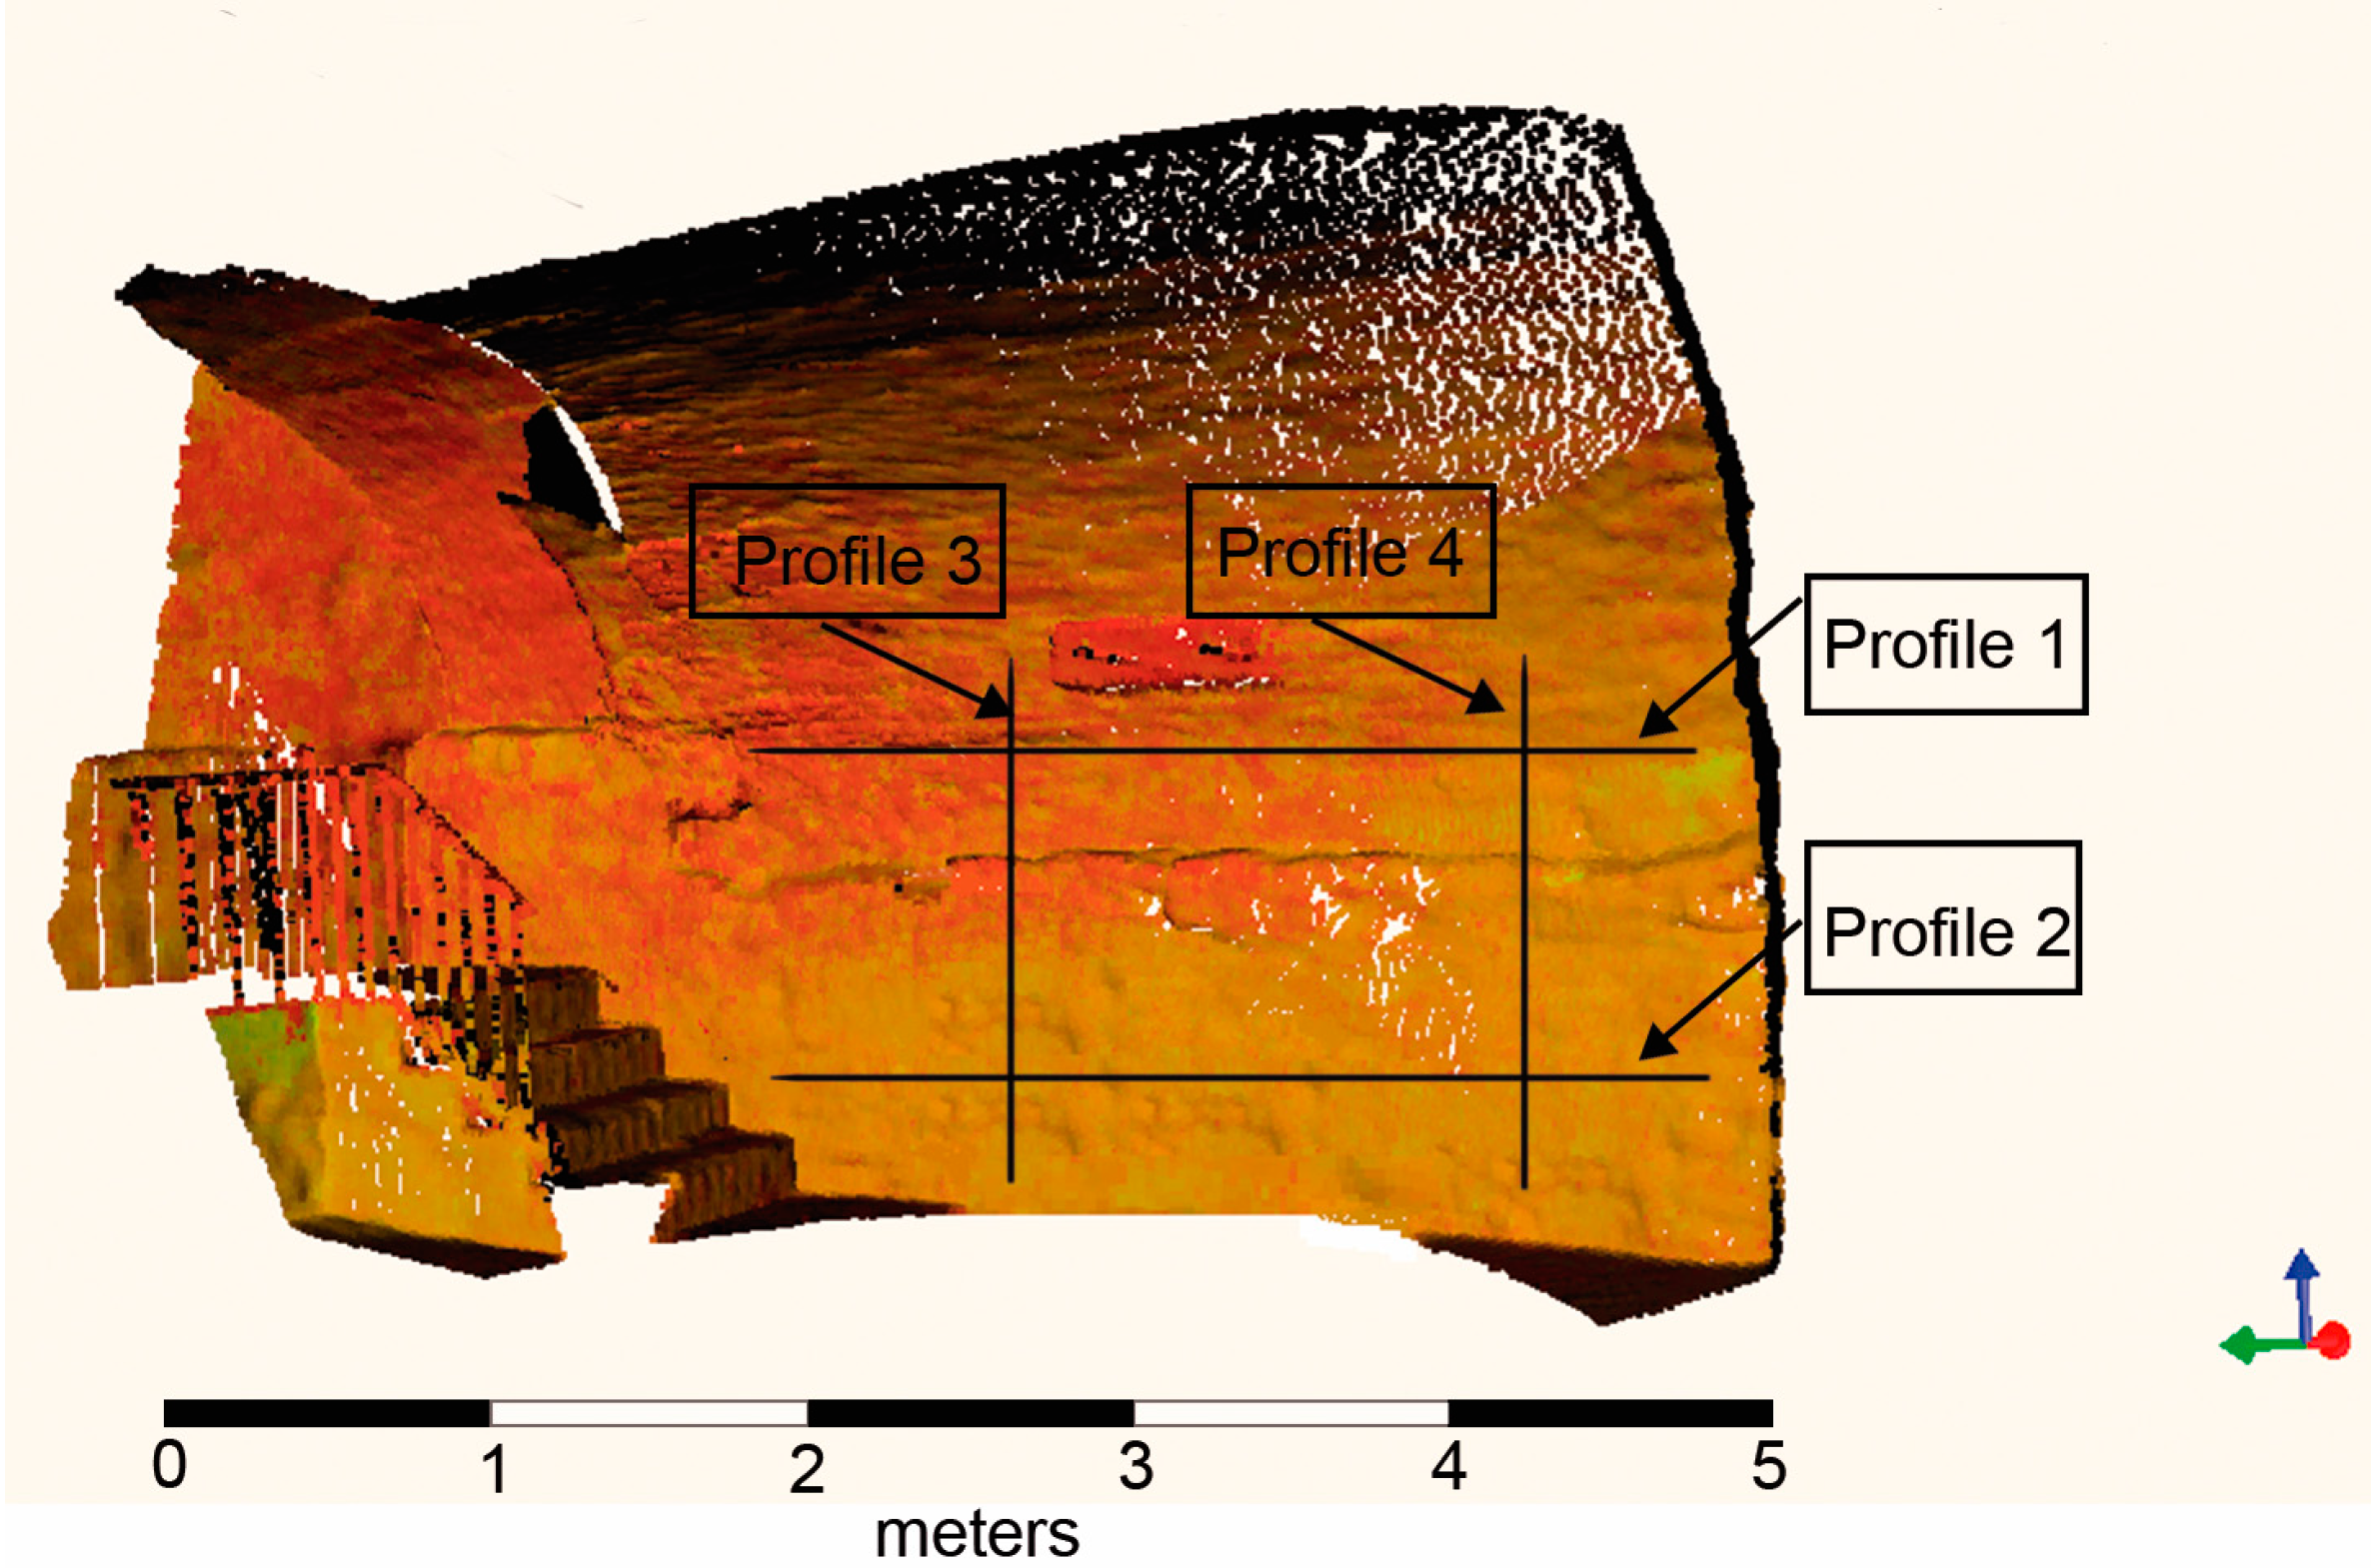
The structural analysis was focused in the zone of the wine cellar shown in
Figure 8a, which presents the 3D model of the whole cellar. The reason for choosing this part of the winery was motivated by the results found in the GPR campaign, which showed important information about the internal composition of the walls. In this zone, the interpretation showed the existence of materials of low compactness and high porosity, as well as the presence of air voids (red color) behind some of the wine cellar walls (
Figure 8b).
Figure 9 shows the FEM model of the cellar from laser data.
Figure 8.
(a) 3D surface model of the wine cellar and the area of study selected for performing the structural evaluation (top view); (b) radargrams that show the presence of air voids and porous materials.
Figure 8.
(a) 3D surface model of the wine cellar and the area of study selected for performing the structural evaluation (top view); (b) radargrams that show the presence of air voids and porous materials.
Figure 9.
Generation of the FEM model of the cellar from laser data.
Figure 9.
Generation of the FEM model of the cellar from laser data.
3.2.2. Results and Discussion of the Structural Analysis
The first part of the analysis examines the principal compressive and tensile stresses in the model as [
2,
15,
28,
29] for the purpose of comparing them with the tensile and compression fracture stress of limestone. Even though other authors have developed methodologies for the analysis of masonry vaults based on the collapse mechanism [
30], the work performed in the wine cellar does not evaluate such procedures.
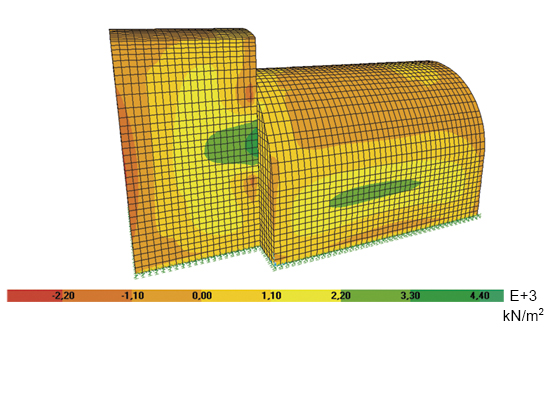
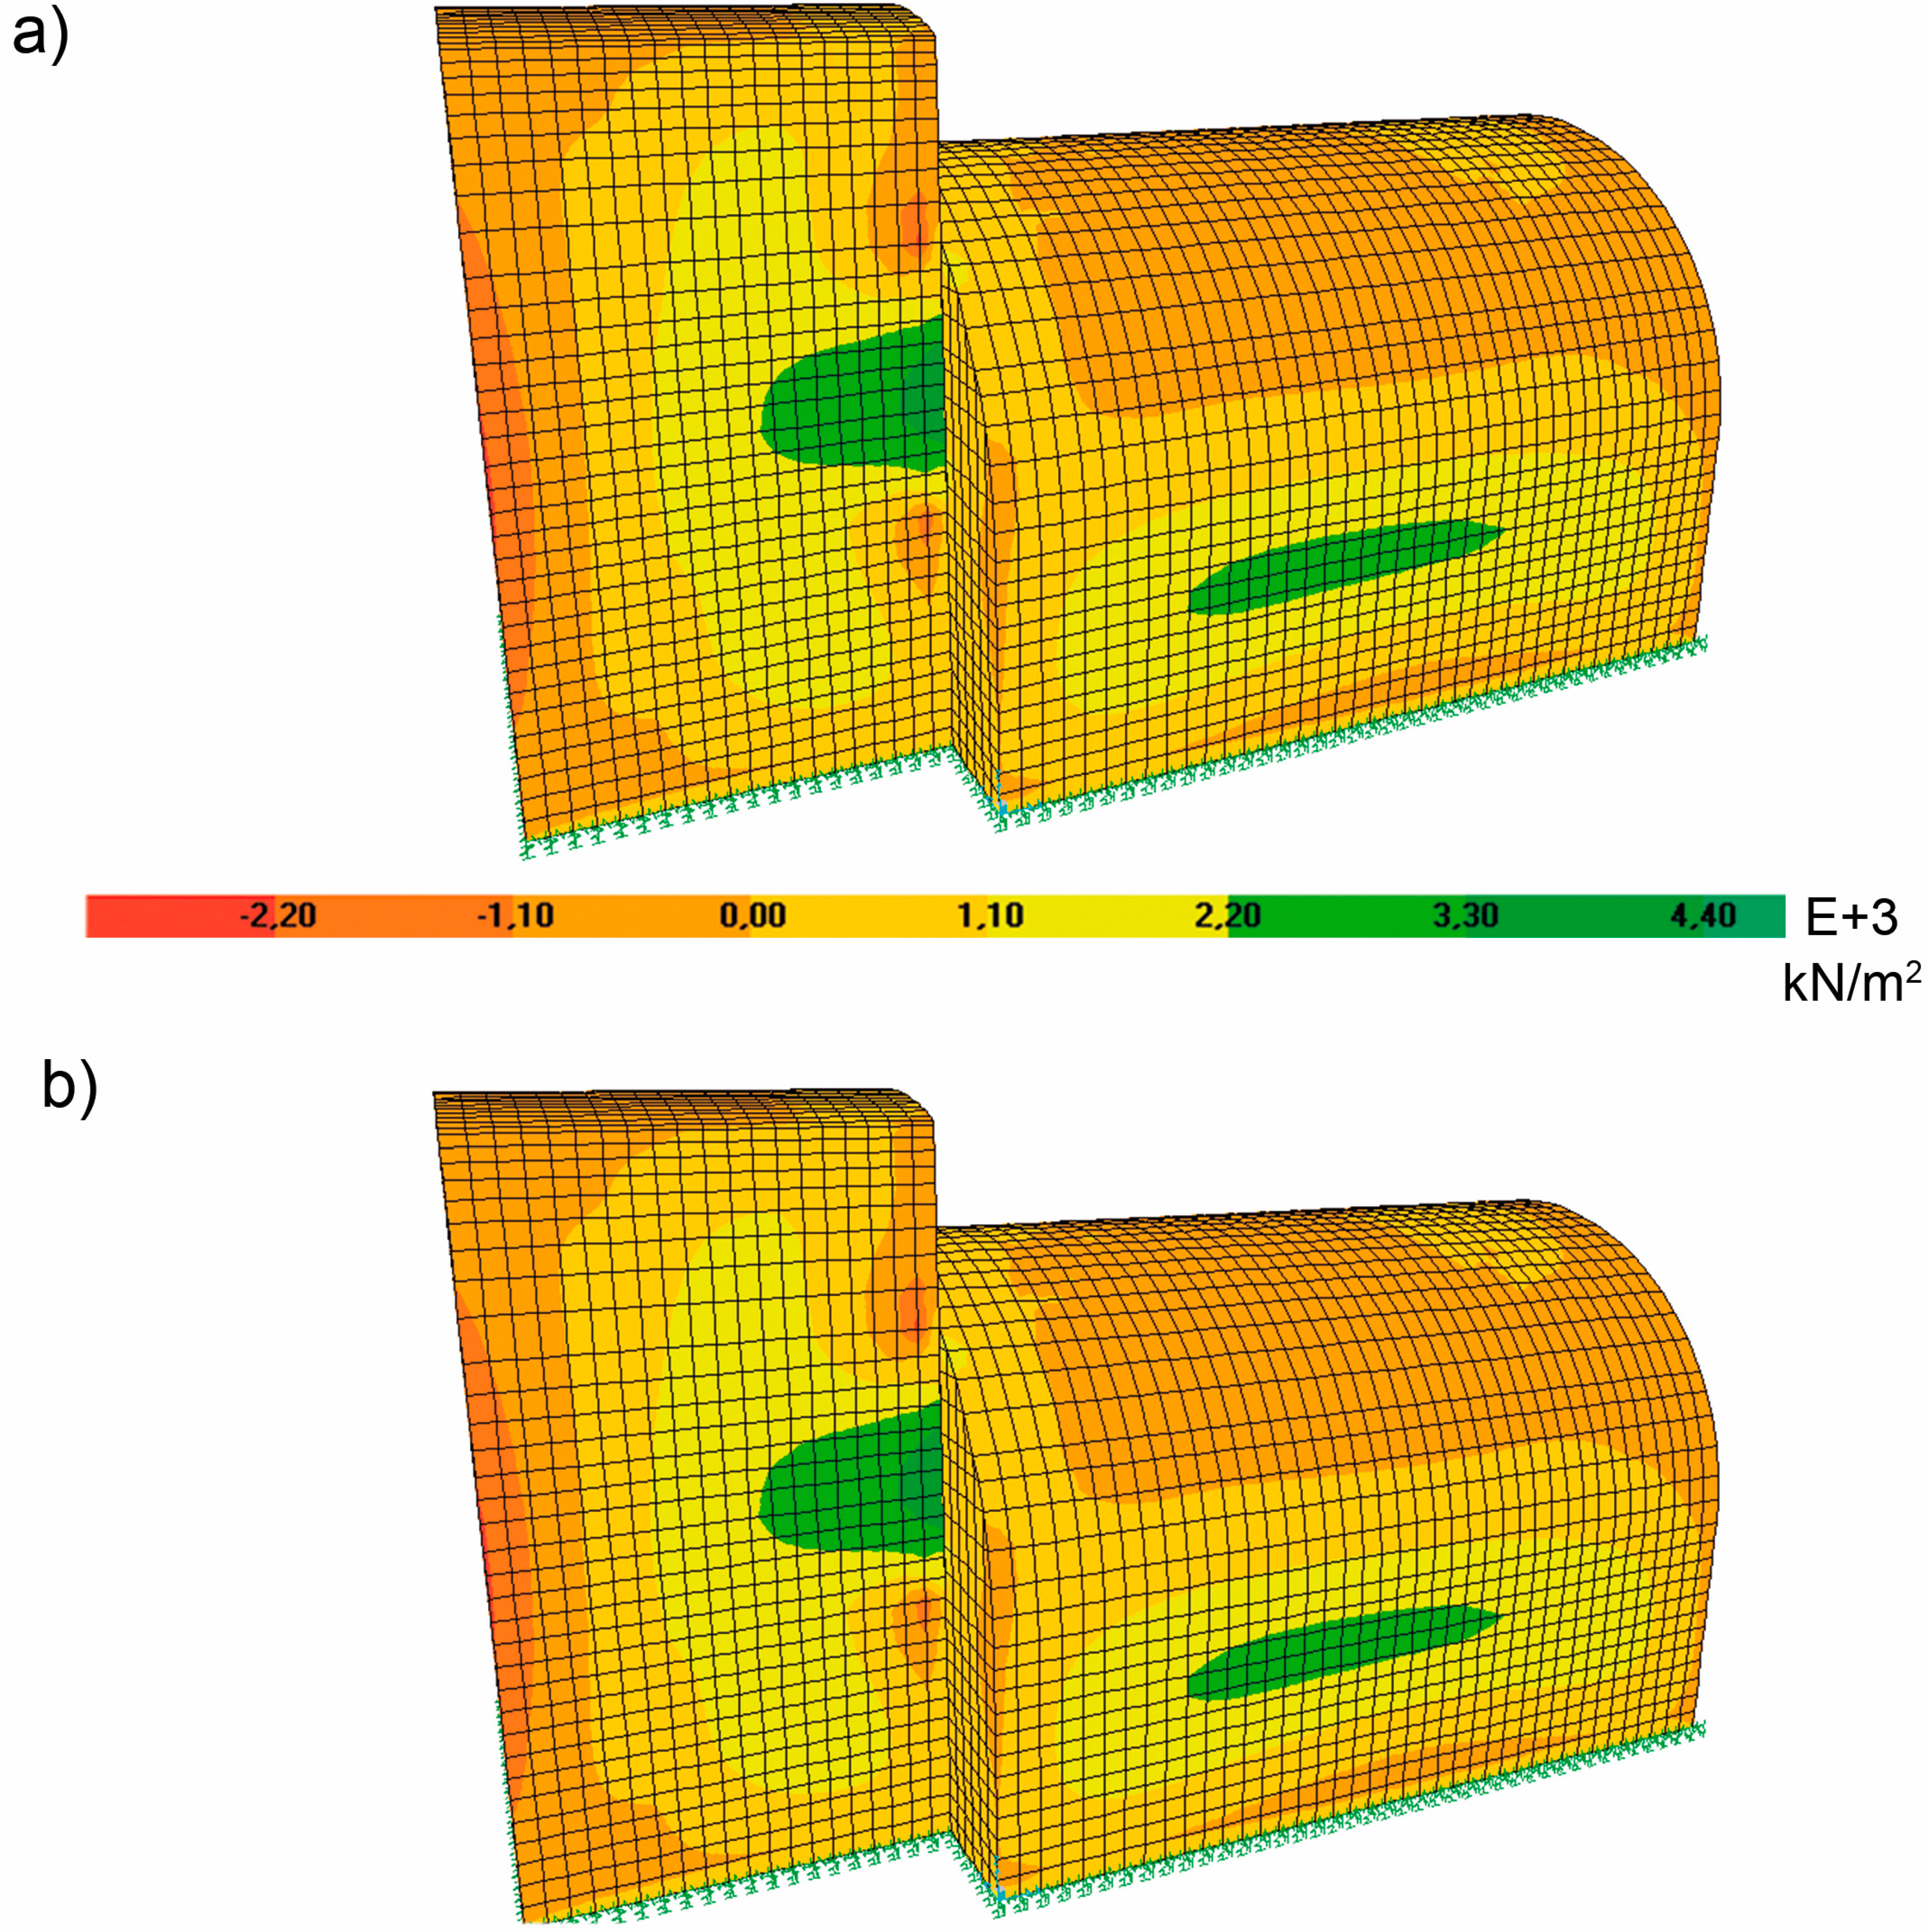
Due to the existence of two ultimate limit states, the following shows the principal stresses of the inner-face of the cellar of both states, taking the thickness of elevation and upper walls as the averaged value (0.4 m) provided by the GPR (
Figure 10).
Figure 10.
(a) Maximum principal stresses (kN/m2) in ULS1 (with averaged thickness values); (b) maximum principal stresses (kN/m2) in ULS2 (with averaged thickness values).
Figure 10.
(a) Maximum principal stresses (kN/m2) in ULS1 (with averaged thickness values); (b) maximum principal stresses (kN/m2) in ULS2 (with averaged thickness values).
It can be appreciated that the principal tensile and compressive stresses are slightly higher in the
ULS1 (
Figure 10a) than in the
ULS2 (
Figure 10b). In the
ULS1, higher compressive stresses occur in the vault with values of 2 × 10
3 kN/m
2, which do not exceed the compressive strength of limestone, which is 4 × 10
4 kN/m
2 (obtained in
Section 2.2.1). Consequently, it can be assumed that cracking in the vault will not occur. On the other hand, the highest values of tensile stresses would be found at the walls of the wine cellar due to the tensile stresses that the bending moments would cause on the walls of the cellar, provoked by soil pressure.
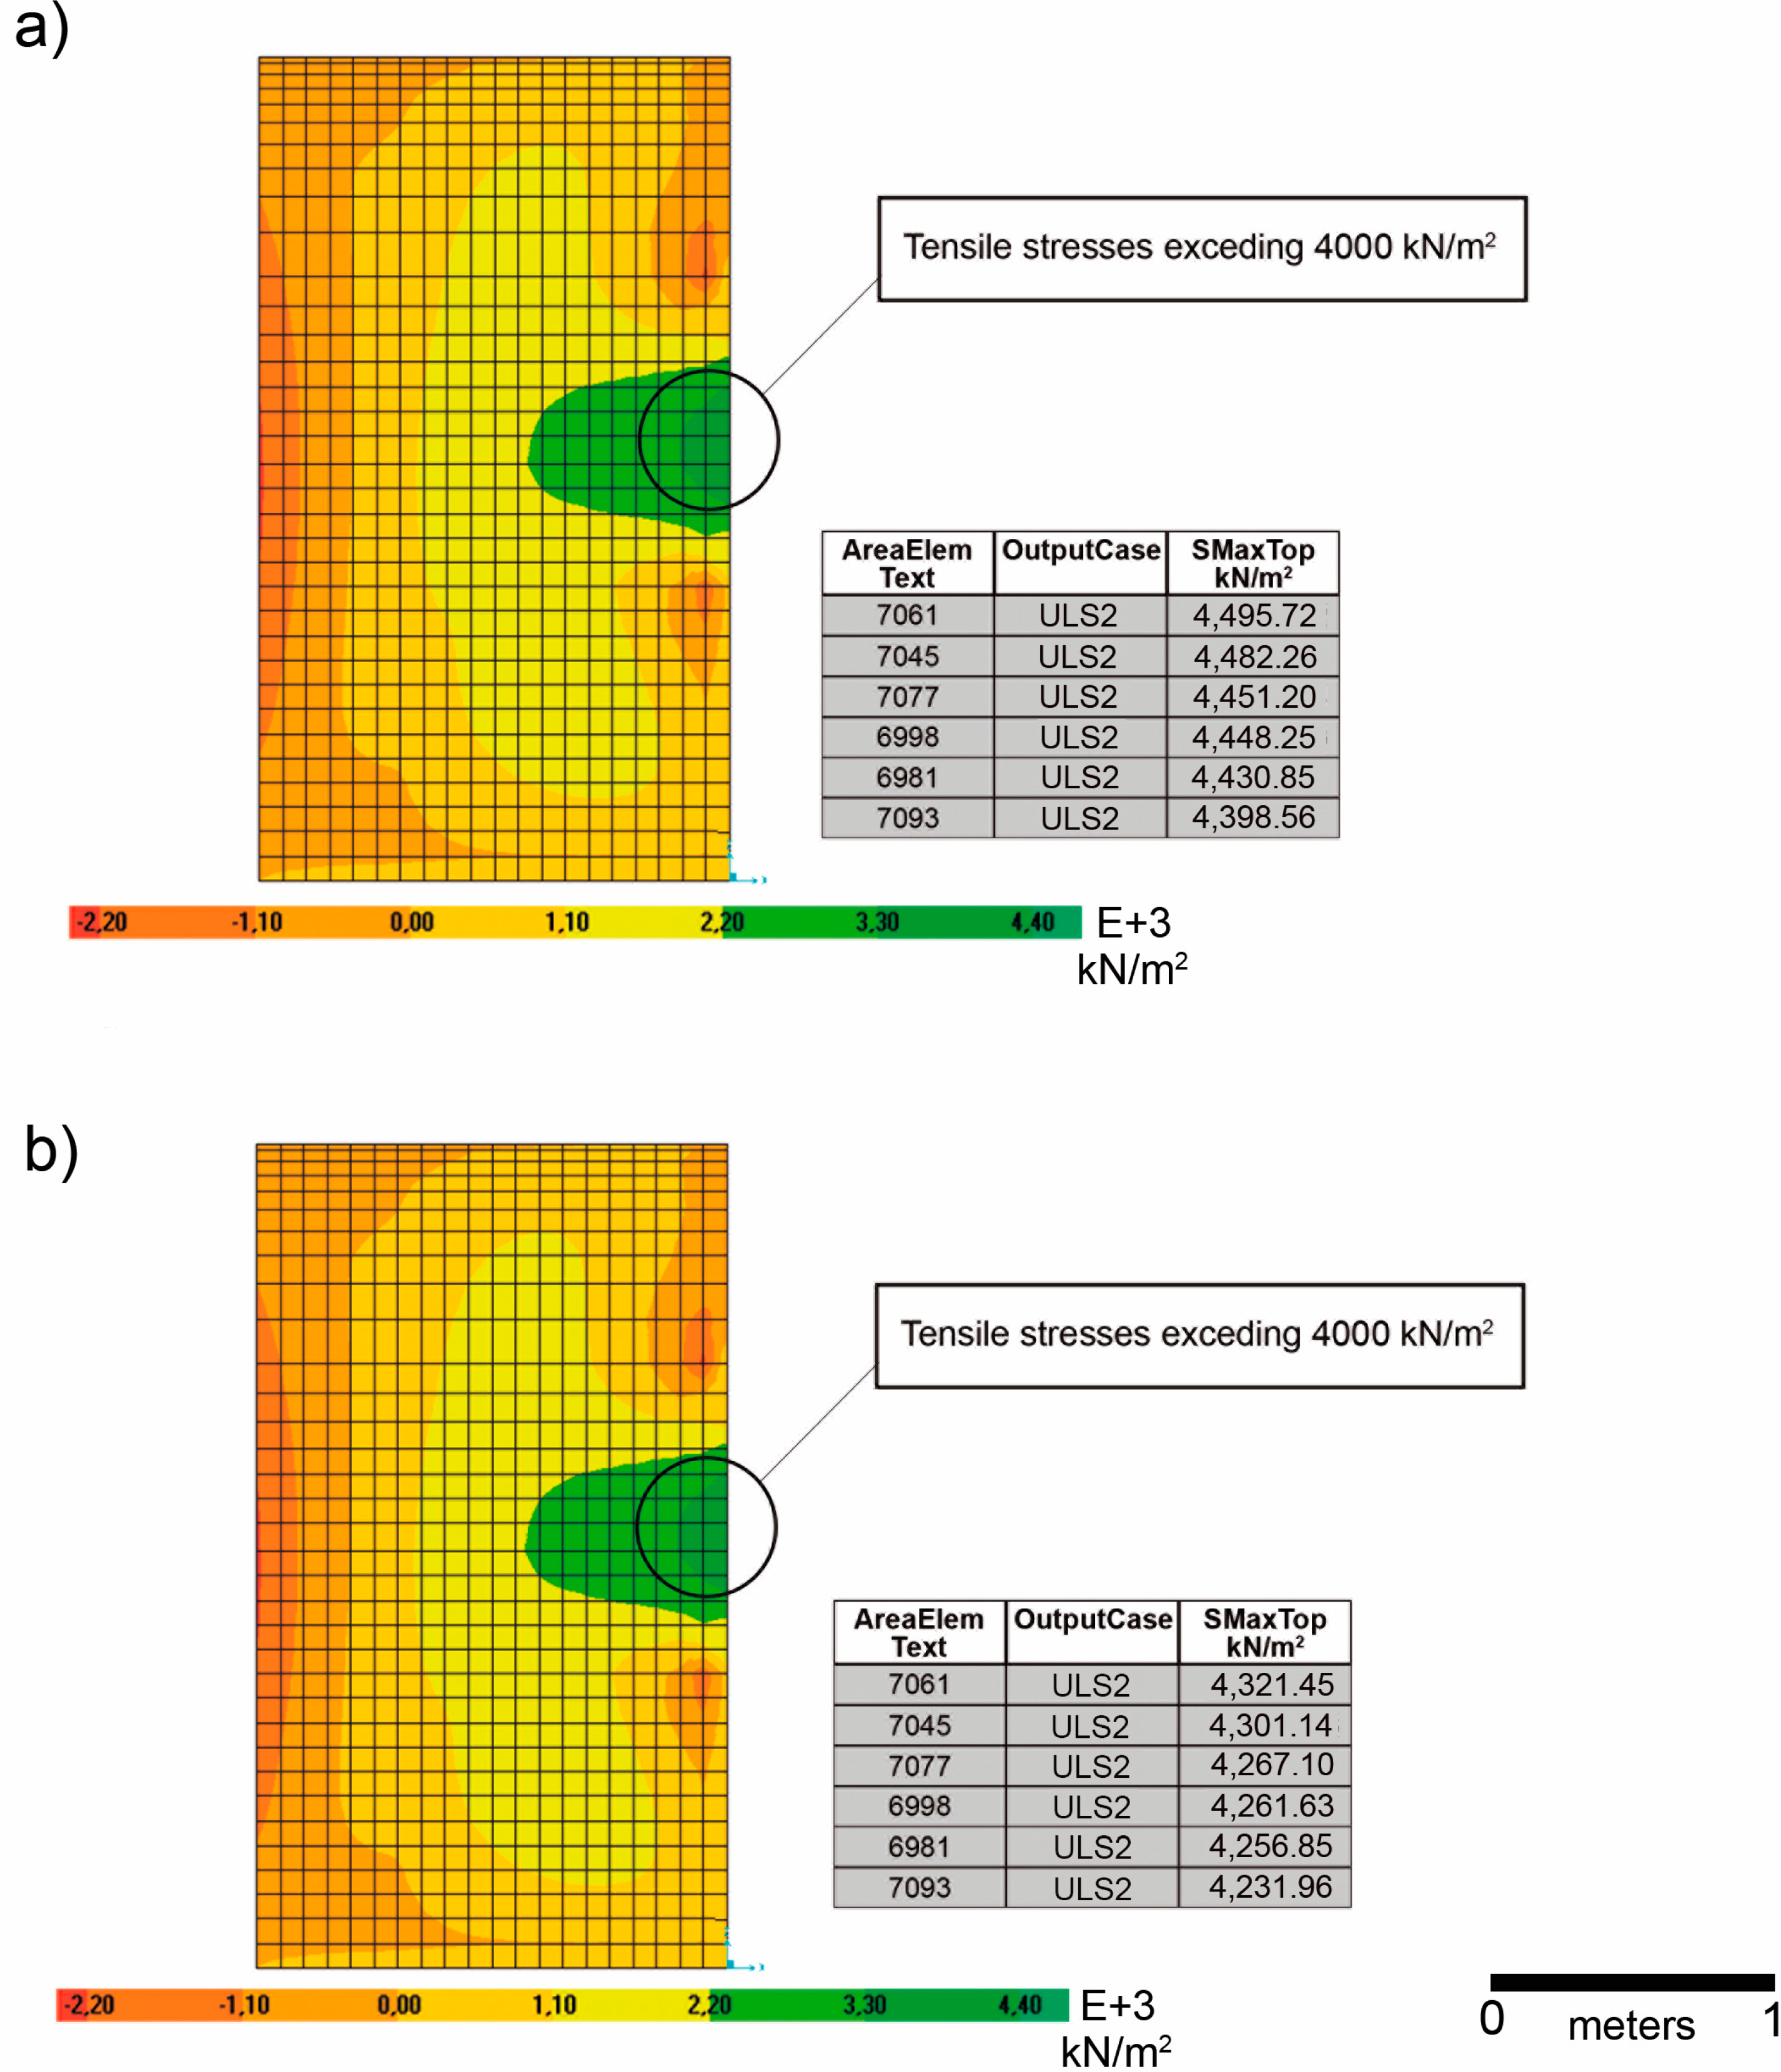
Figure 11a shows a small area where values near 4000 kN/m
2can be found. These values would mean that the tensile fracture point of the limestone has been exceeded. It is expected that the masonry might crack in that area, so a visual inspection of the site was conducted checking for the cracking of masonry in that area. The region of maximum tensile stresses is confined in a very specific area in the cellar, but after the visual inspection, a pattern of fissures in the walls could not be observed. Only an isolated masonry block presented a vertical fissure (
Figure 11b).
Figure 11.
(a) Area of the wall with tensile stresses (kN/m2) exceeding the tensile breaking point of limestone and the output table of calculation results; (b) photograph of the cracked masonry inside the cellar.
Figure 11.
(a) Area of the wall with tensile stresses (kN/m2) exceeding the tensile breaking point of limestone and the output table of calculation results; (b) photograph of the cracked masonry inside the cellar.
Since the tensile breaking point of limestone in both ULSs is only exceeded in a very small area, it is not necessary to limit its loads; the fissuration of a single piece of masonry does not endanger the stability and structural safety of the entire cellar. Although the initial load hypotheses are assumed to be correct, these loads should be established as the maximum allowed, since the increase of loading could produce the breaking of the wall and, thus, affect the stability and structural safety of the wine cellar. In this case, a new structural analysis would be required, taking into account the new loading conditions.
3.3. Validation of Results
Considering the averaged thickness values (0.4 m) provided by the GPR and its standard deviation (±2 cm), a sensibility analysis has been performed with the aim of assessing the variation of principal tensile according with the thickness. To this end, the maximum principal tensile for the elevation wall subjected to the major stresses, taking a thickness of 0.38 m and 0.42 m, were obtained.
Figure 12 outlines the principal tensile for the different wall thickness according to
ULS2.
Figure 12.
(a) Maximum principal tensile (kN/m2) for the elevation wall with a thickness of 0.38 m; (b) maximum principal tensile (kN/m2) for the elevation wall with a thickness of 0.42 m.
Figure 12.
(a) Maximum principal tensile (kN/m2) for the elevation wall with a thickness of 0.38 m; (b) maximum principal tensile (kN/m2) for the elevation wall with a thickness of 0.42 m.
The results obtained show that the maximum principal tensile for the 0.38-m elevation wall is slightly higher (1%) than that obtained for the averaged thickness (0.40 m). Analogously, a slight decrease is observed when the thickness of the elevation wall is 0.42 m. Anyway, the variations of tensile strength are insignificant due to the reduced standard deviations of the GPR, which confirms that the averaged thickness values considered for the walls are suitable for the structural analysis performed.
The second part of the analysis is a study of the deformations [
15,
29] in order to identify areas of excessive deformations that could jeopardize the functionality of the building.
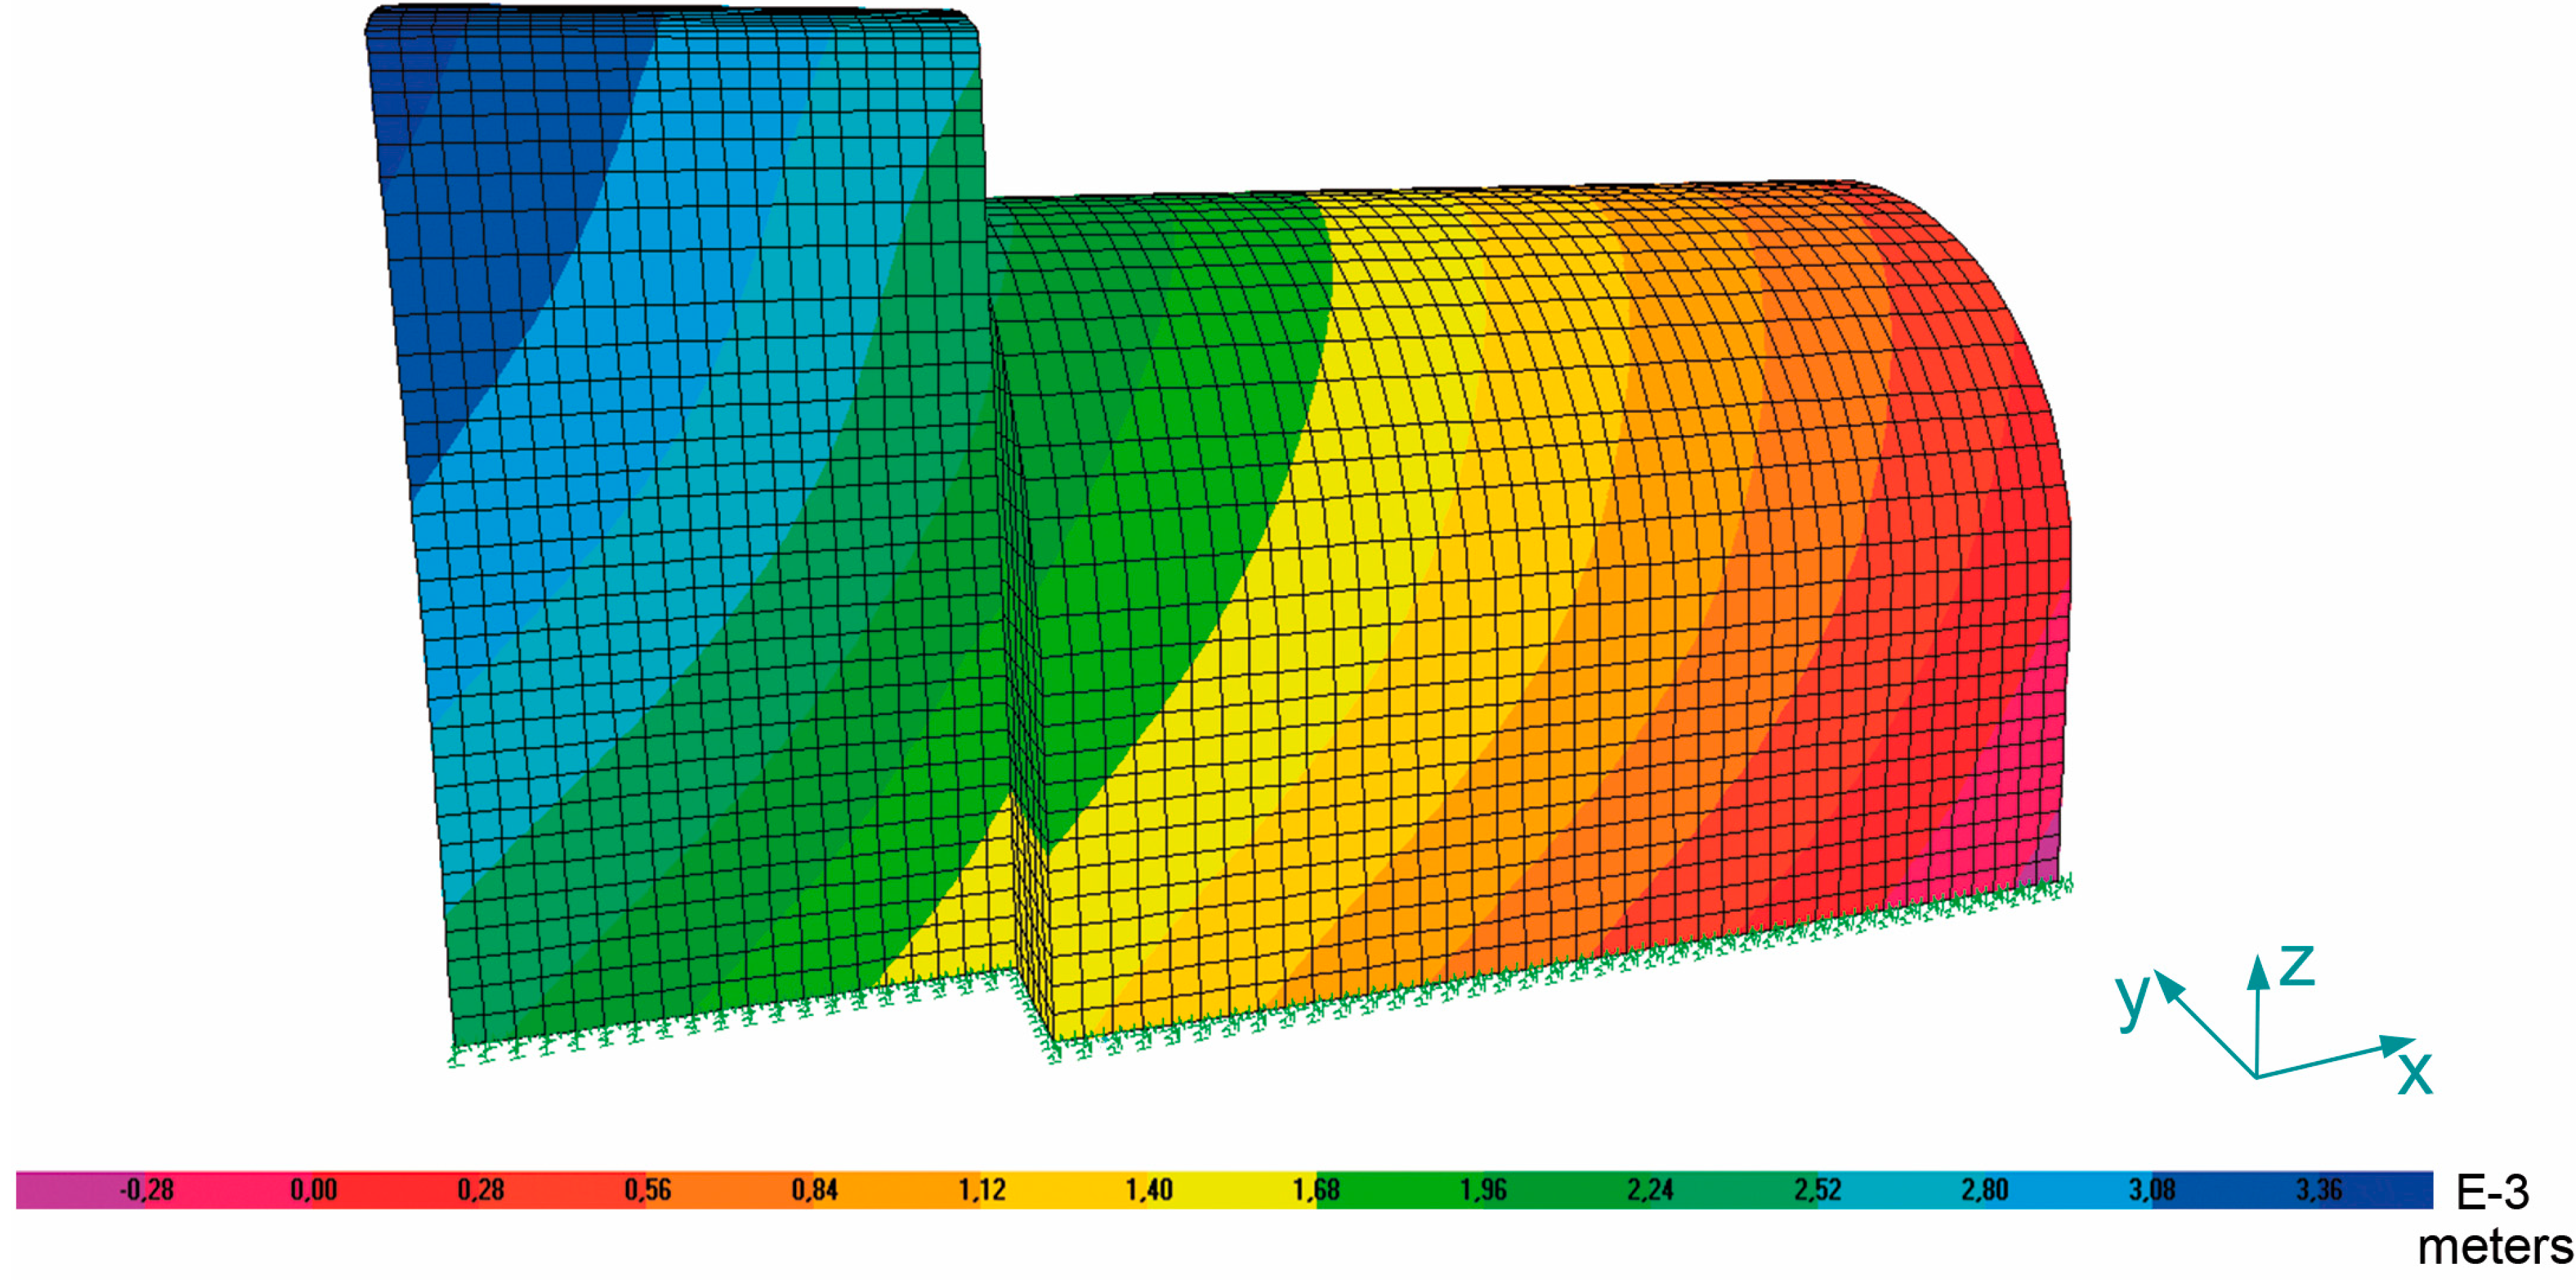
Figure 13 shows the greatest deformations along the Y-axis of the
SLS1 model. The deformations are in the order of millimeters, the highest value being 3.36 mm. It is observed that these are small values, and this is largely due to the underground confinement of the cellar, which prevents large deformations and does not put at risk its functionality.
Figure 13.
The deformation of the cellar (×200) along the Y-axis of the global model and in the SLS1 model.
Figure 13.
The deformation of the cellar (×200) along the Y-axis of the global model and in the SLS1 model.
4. Conclusions
In recent years, the perception of the role of multidisciplinary science and technology by the stakeholders of the conservation and restoration of historical buildings has changed. In all major fields, geomatic methods and techniques are now seen as central for the study and diagnosis of this type of historical construction.
This paper presents a methodology to evaluate the structural condition of traditional constructions using non-destructive technologies to collect both the external geometry and inner characteristics of the structure. While the terrestrial laser scanner provided only the visible surroundings of the structure with a precision of ±1cm, the ground penetration radar provided a more complete geometry for the construction, focusing on the inner structure. GPR provided information about the internal composition of constructive elements, providing the thickness of walls with averaged errors of ±2 cm. Furthermore, it helped to discard the bulging of the structural walls, collapses and material shortages. The geometric model built using this integral approach allowed for building a more realistic finite element model of the cellar.
Structural simulation for both stresses and deformations through FEM allowed for identifying critical structural elements subjected to excessive tensile stress (4496 kN/m2). The tensile state allows us to discover a small area of the wall where the tensile stresses of limestone are overpassed (without endangering the stability and structural safety of the entire cellar. Nevertheless, this situation requires establishing the maximum loading state allowed, so that an increase in loading conditions would require a new structural analysis. The deformations obtained are in the order of millimeters (with a maximum value of 3.36 mm in the Y transversal direction of the main structure), so the functionality of the wine cellar is not under suspicion.
A sensibility analysis was performed in order to quantify the validity of GPR precision to carry out structural analysis. The differences in wall thickness caused by the precision of GPR (±2%) reflected that the tensile stress varies less than ±1%. As a result, GPR can be accepted as accurate enough for the subsequent structural analysis of the wine cellar.
Among its limitations, the lack of further mechanical information about the properties of the materials, both soil and masonry, is remarkable. Furthermore, the methodology presented here does not account for the soil-structure interaction, so these effects must be evaluated in the future, in order to increase the accuracy of the structural simulation of the wine cellar.
Finally, through this multidisciplinary study, an accurate, reliable and non-destructive diagnosis of the current state of the cellar could be obtained: from its apparent health based on the external geometry to the stress and possible failure based on its internal structure. Therefore, a complete compilation of all of the useful information about the wine cellar is presented through this study.


 and
and 


