Daily Area of Snow Melt Onset on Arctic Sea Ice from Passive Microwave Satellite Observations 1979–2012

Abstract
:
1. Introduction
2. Data
3. Methods


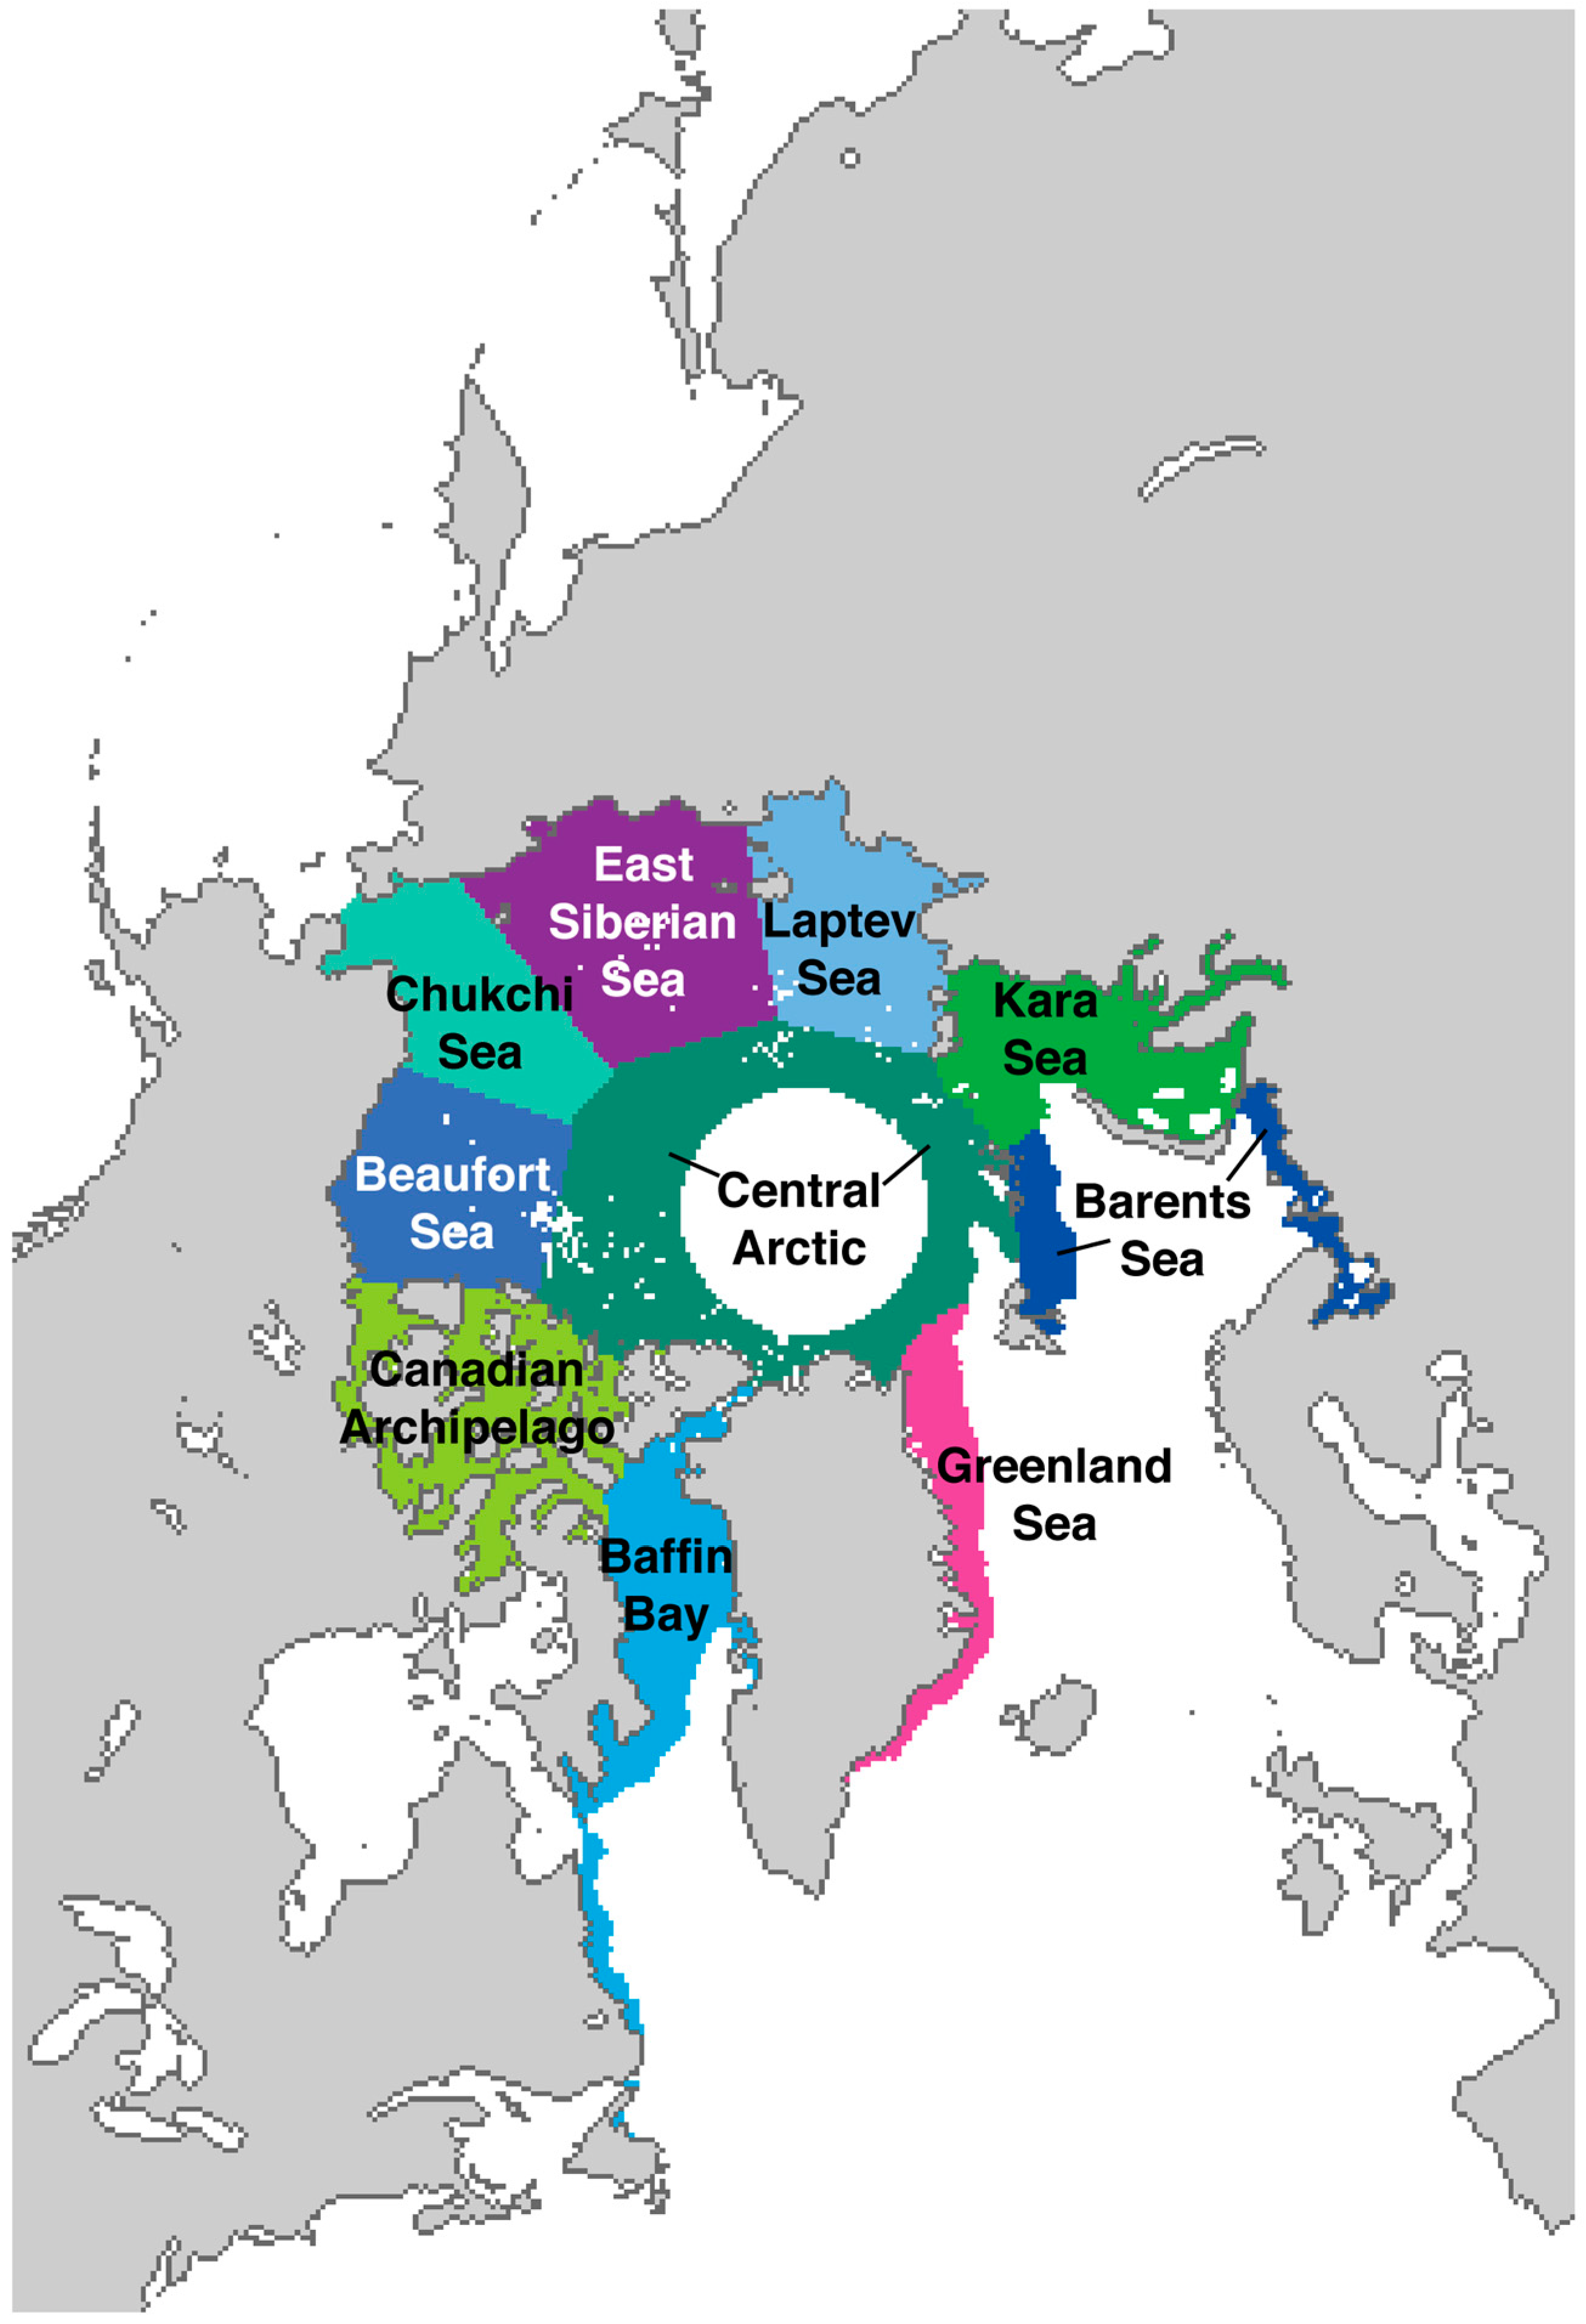
| Region | Region Area (105 km2) | Mean MO Date (DOY) | Mean Standard Deviation (Days) | Mean Range (Days) |
|---|---|---|---|---|
| Arctic Ocean | 87.5 | 22 May (141.9) | 8.7 | 30.4 |
| Barents Sea | 3.5 | 4 April (93.9) | 12.2 | 52.2 |
| Kara Sea | 8.3 | 11 May (130.5) | 12.8 | 54.0 |
| Laptev Sea | 8.4 | 25 May (144.9) | 11.7 | 51.2 |
| East Siberian Sea | 12.6 | 31 May (150.1) | 14.5 | 47.4 |
| Chukchi Sea | 8.2 | 17 May (136.3) | 12.7 | 48.0 |
| Beaufort Sea | 9.0 | 28 May (148.0) | 9.9 | 35.2 |
| Canadian Archipelago | 7.4 | 29 May (149.0) | 7.7 | 32.2 |
| Central Arctic | 17.9 | 10 June (160.9) | 9.5 | 37.7 |
| Baffin Bay | 8.2 | 1 May (120.6) | 10.0 | 35.2 |
| Greenland Sea | 4.0 | 29 April (118.9) | 11.1 | 38.7 |
4. Typical Variability in Melt Onset Dates
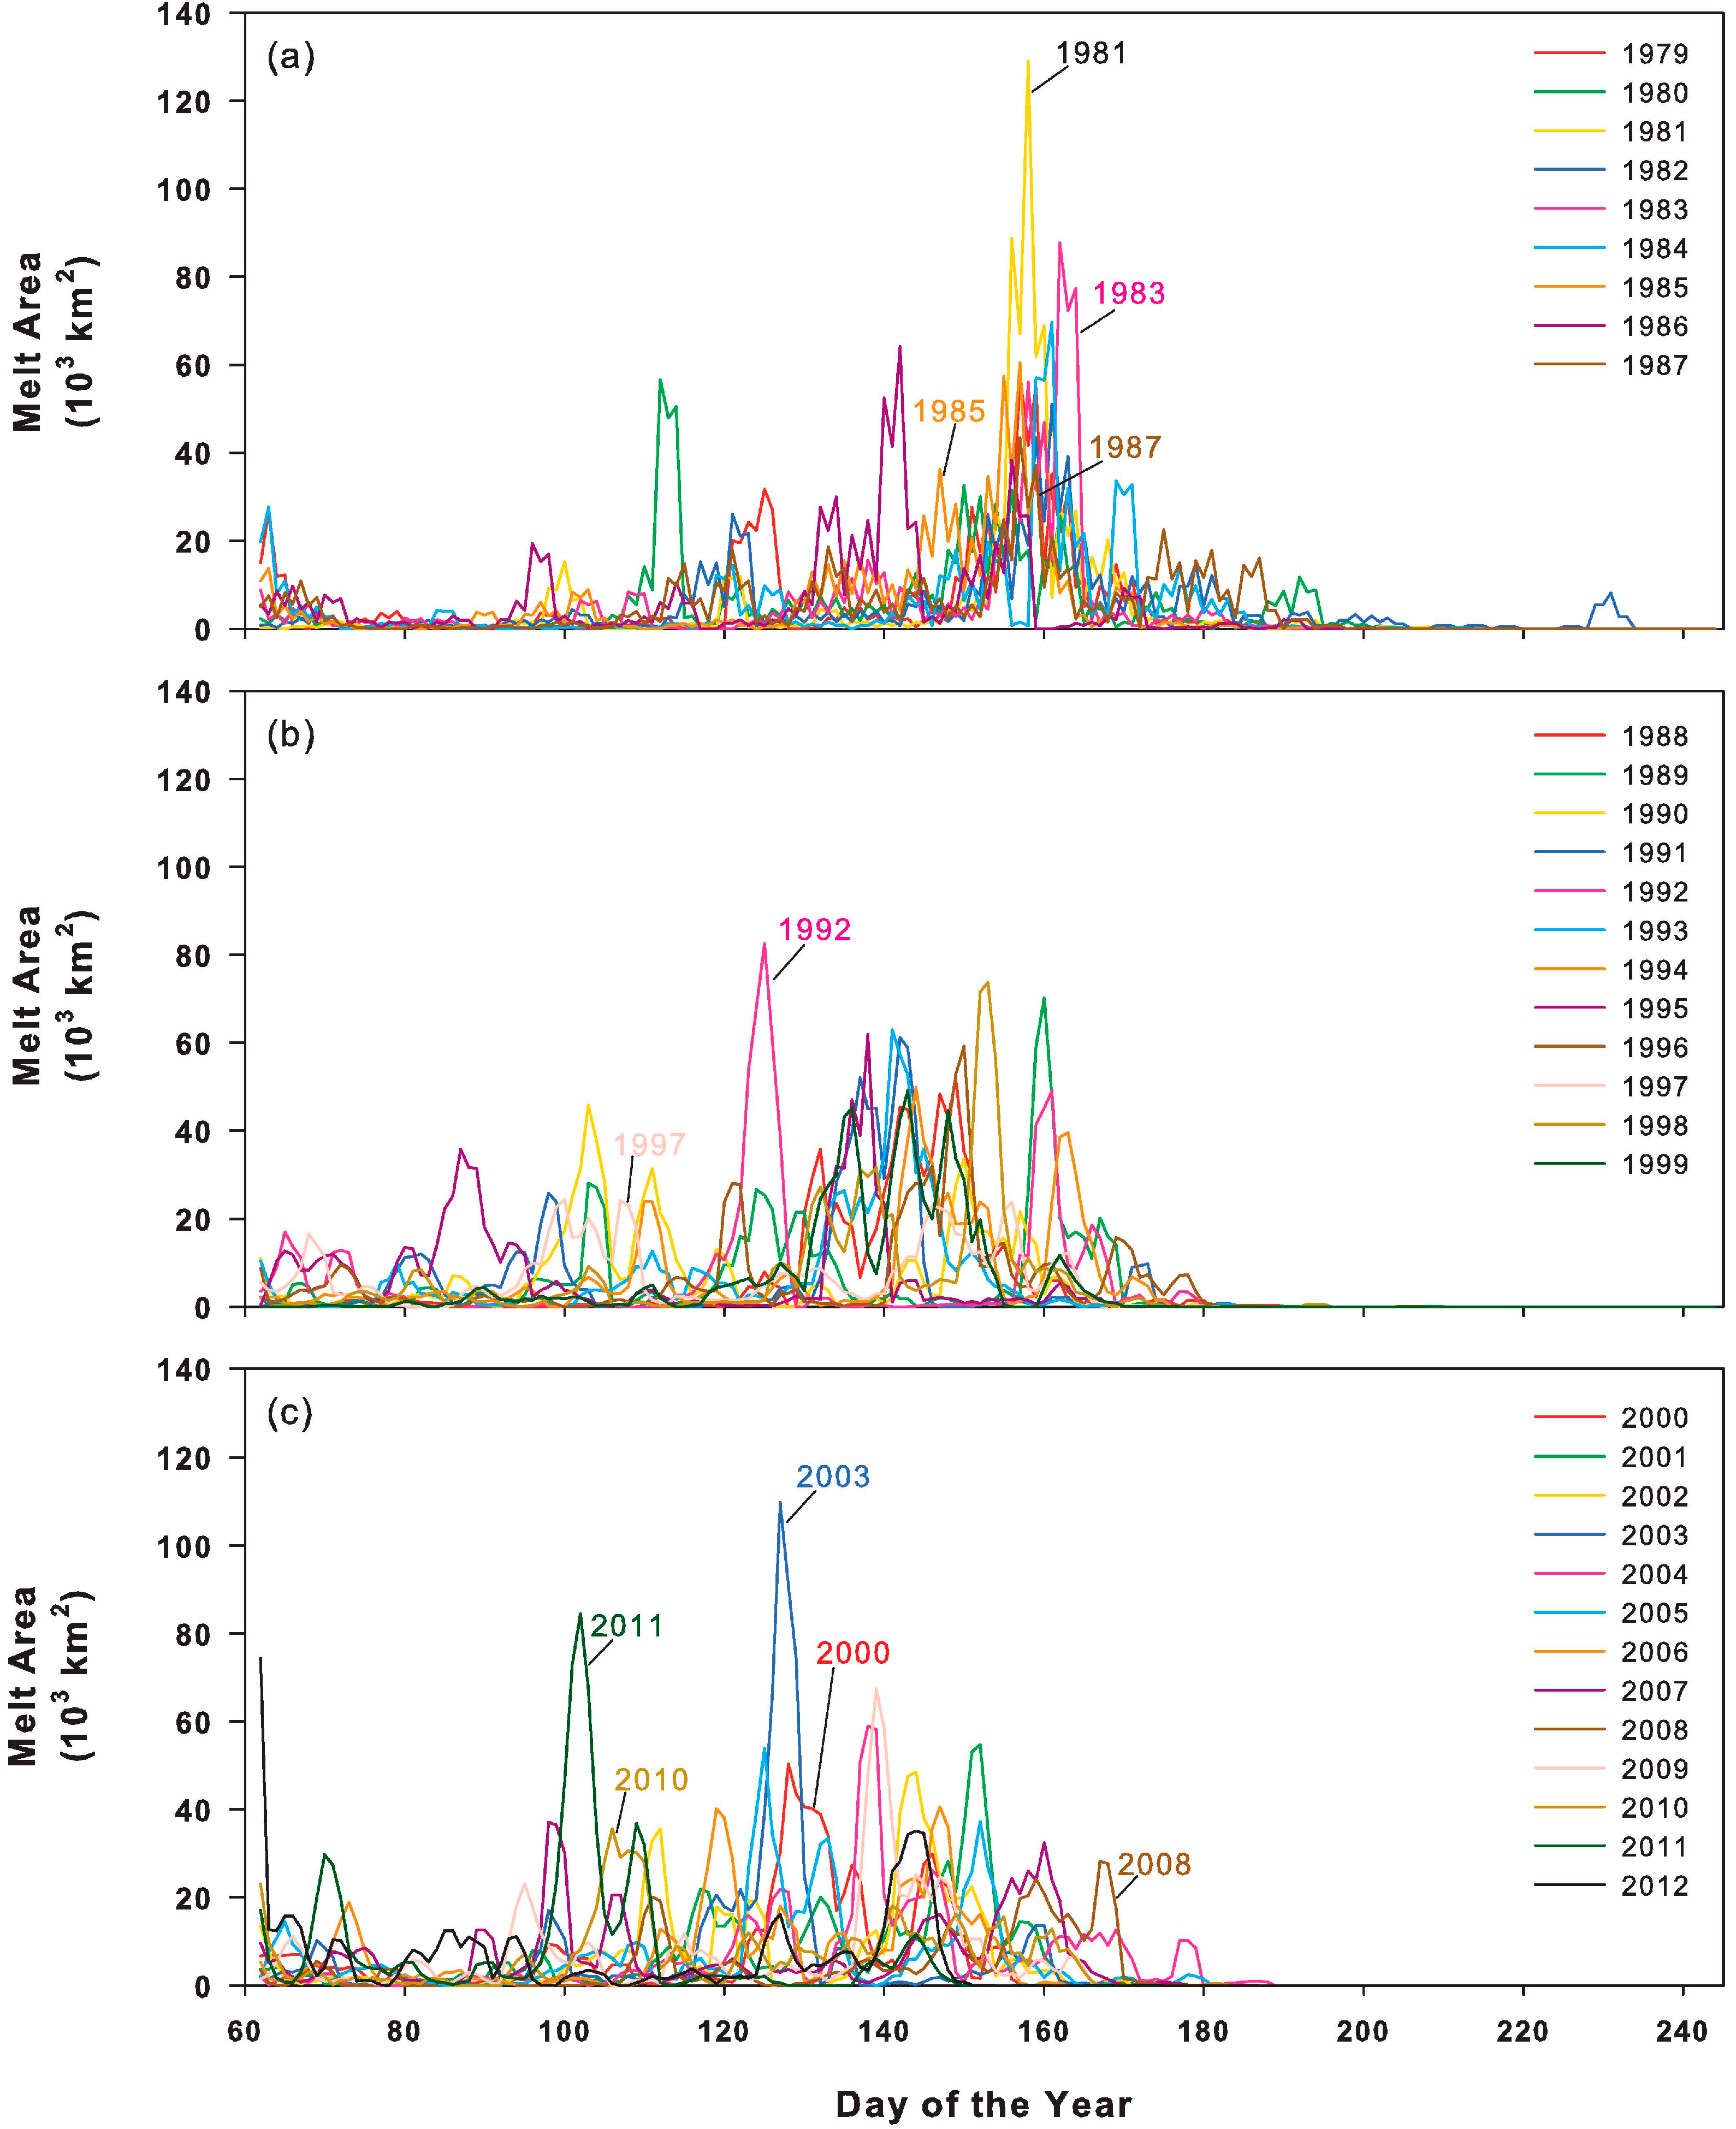
5. Daily Melt Onset Areas
5.1. Timing and Magnitude of Melt Onset Events
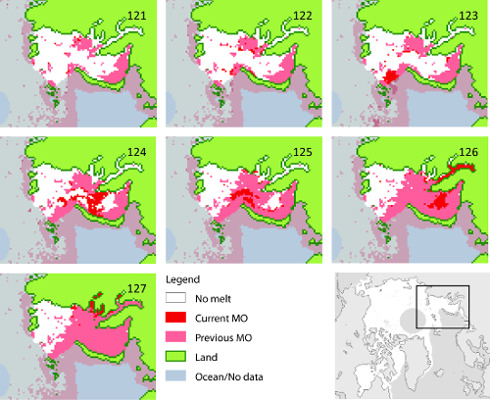
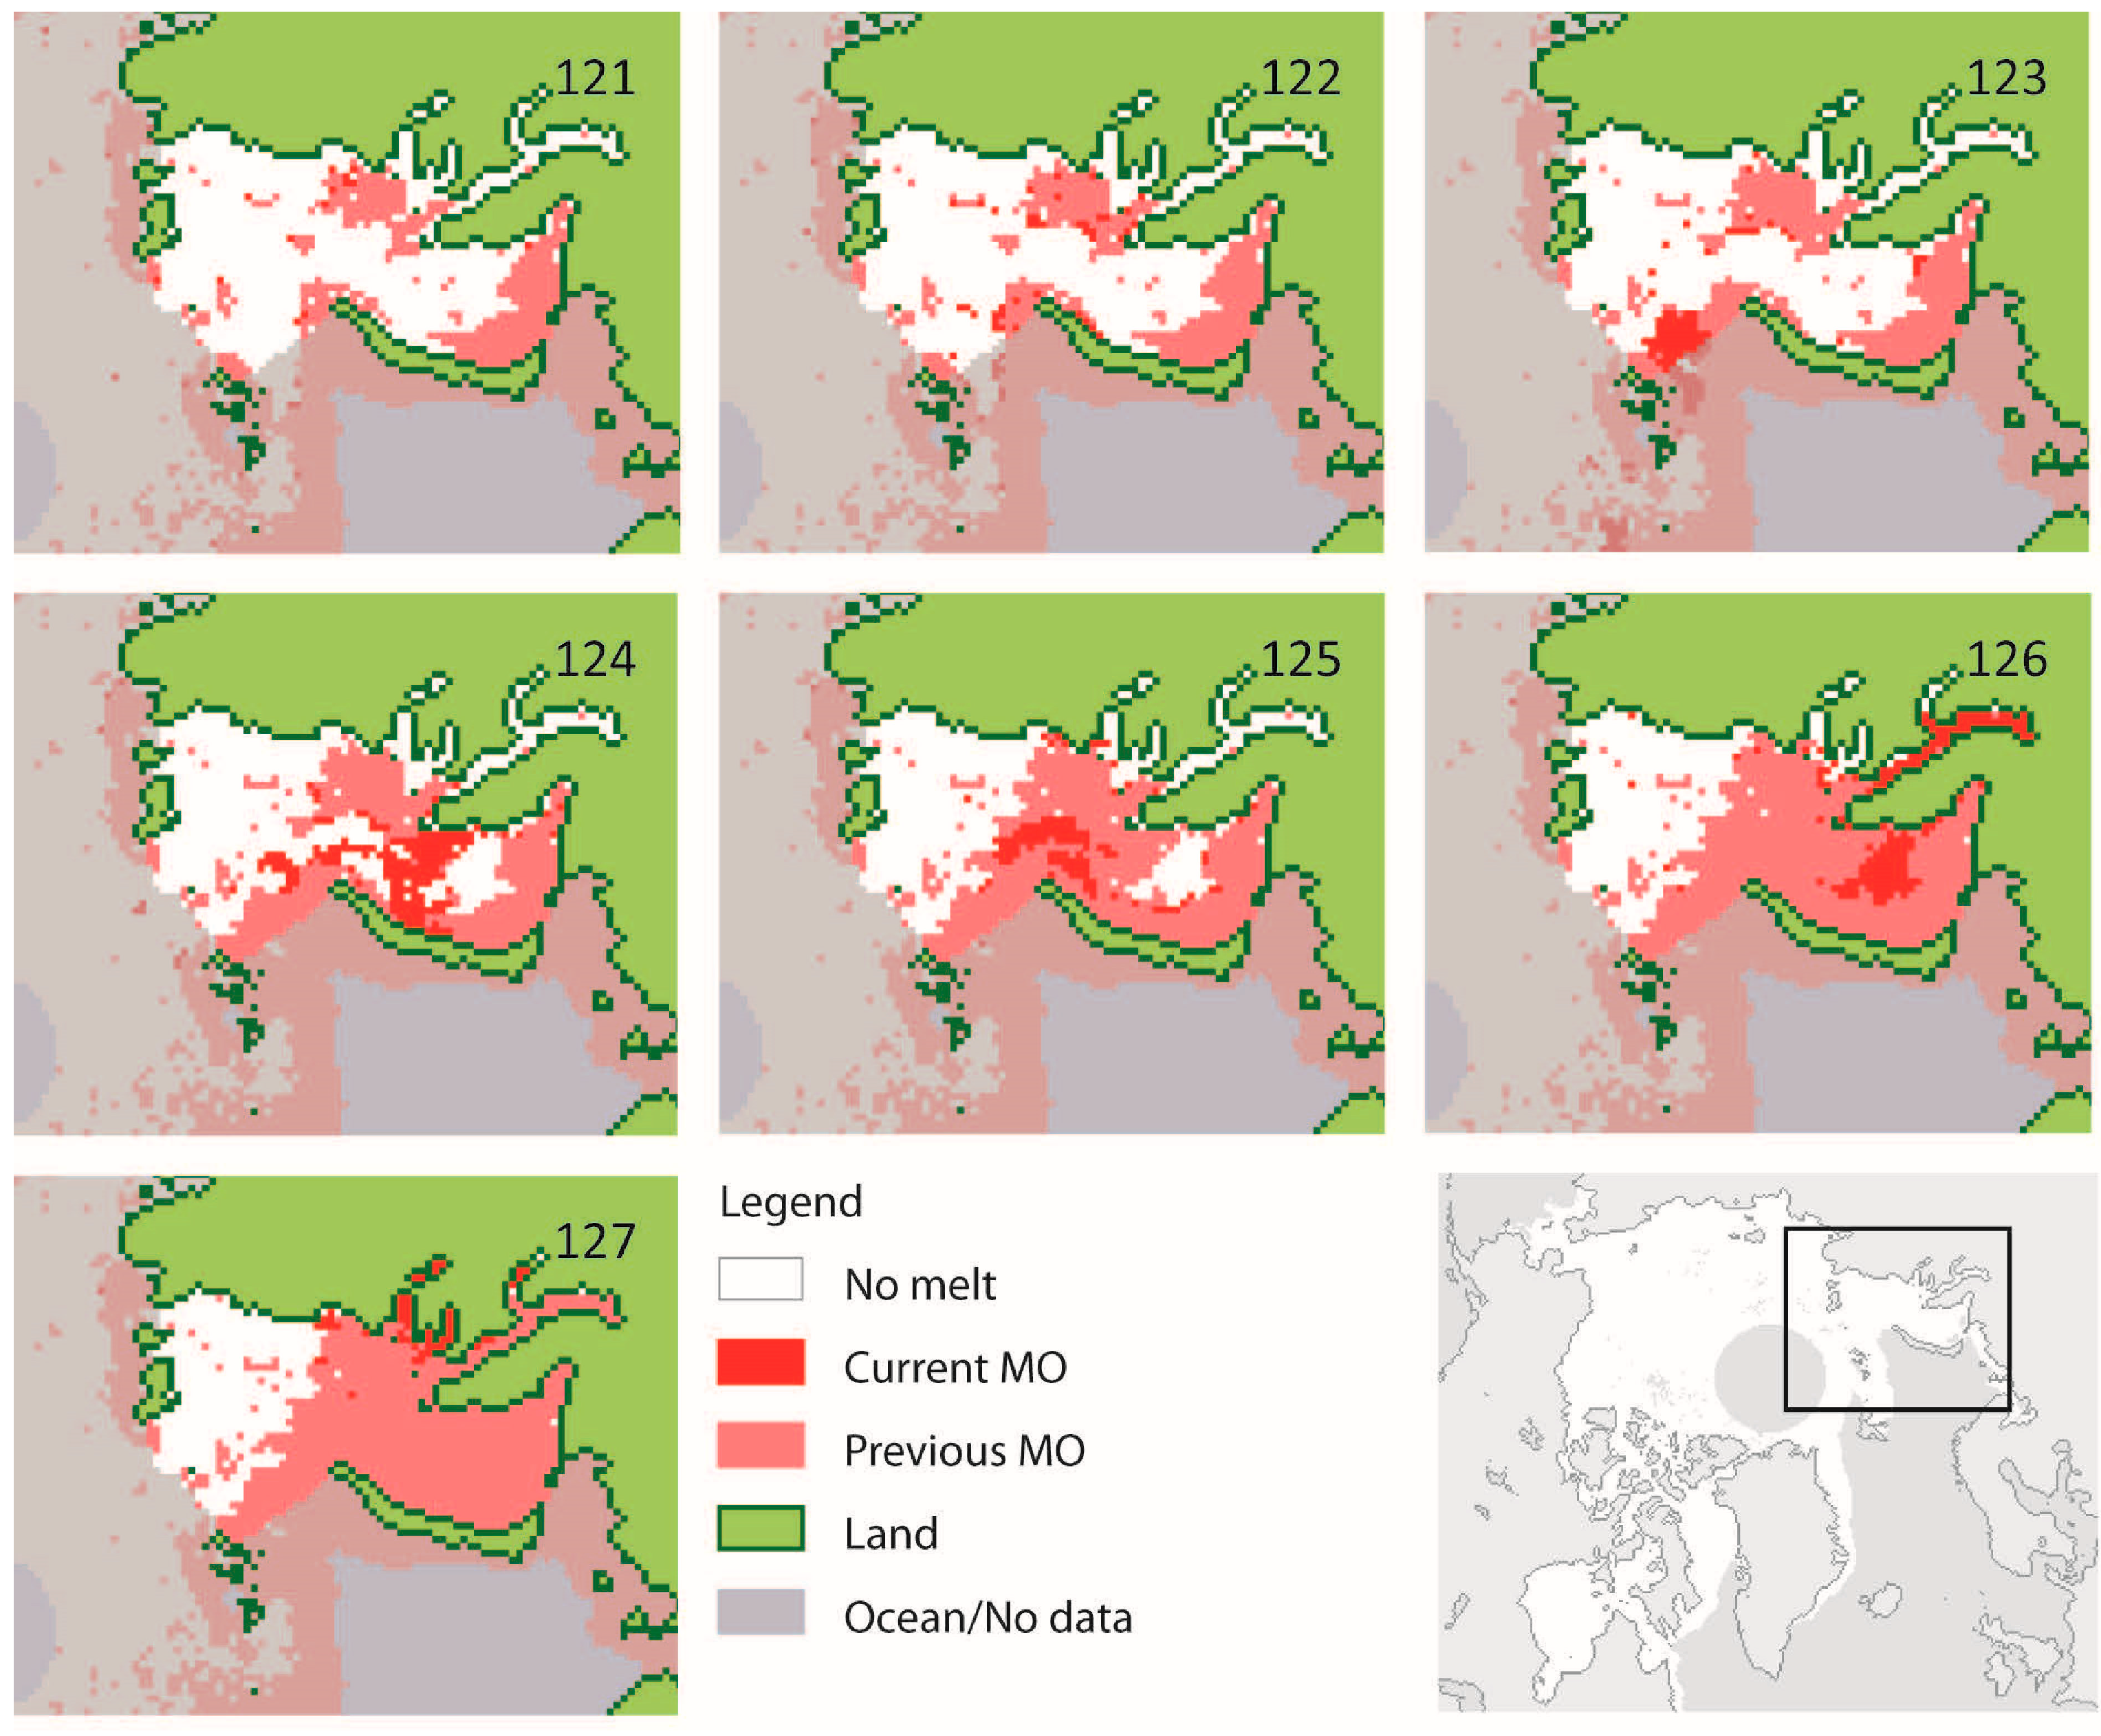
5.2. Melt Onset Event Case Study: Kara Sea

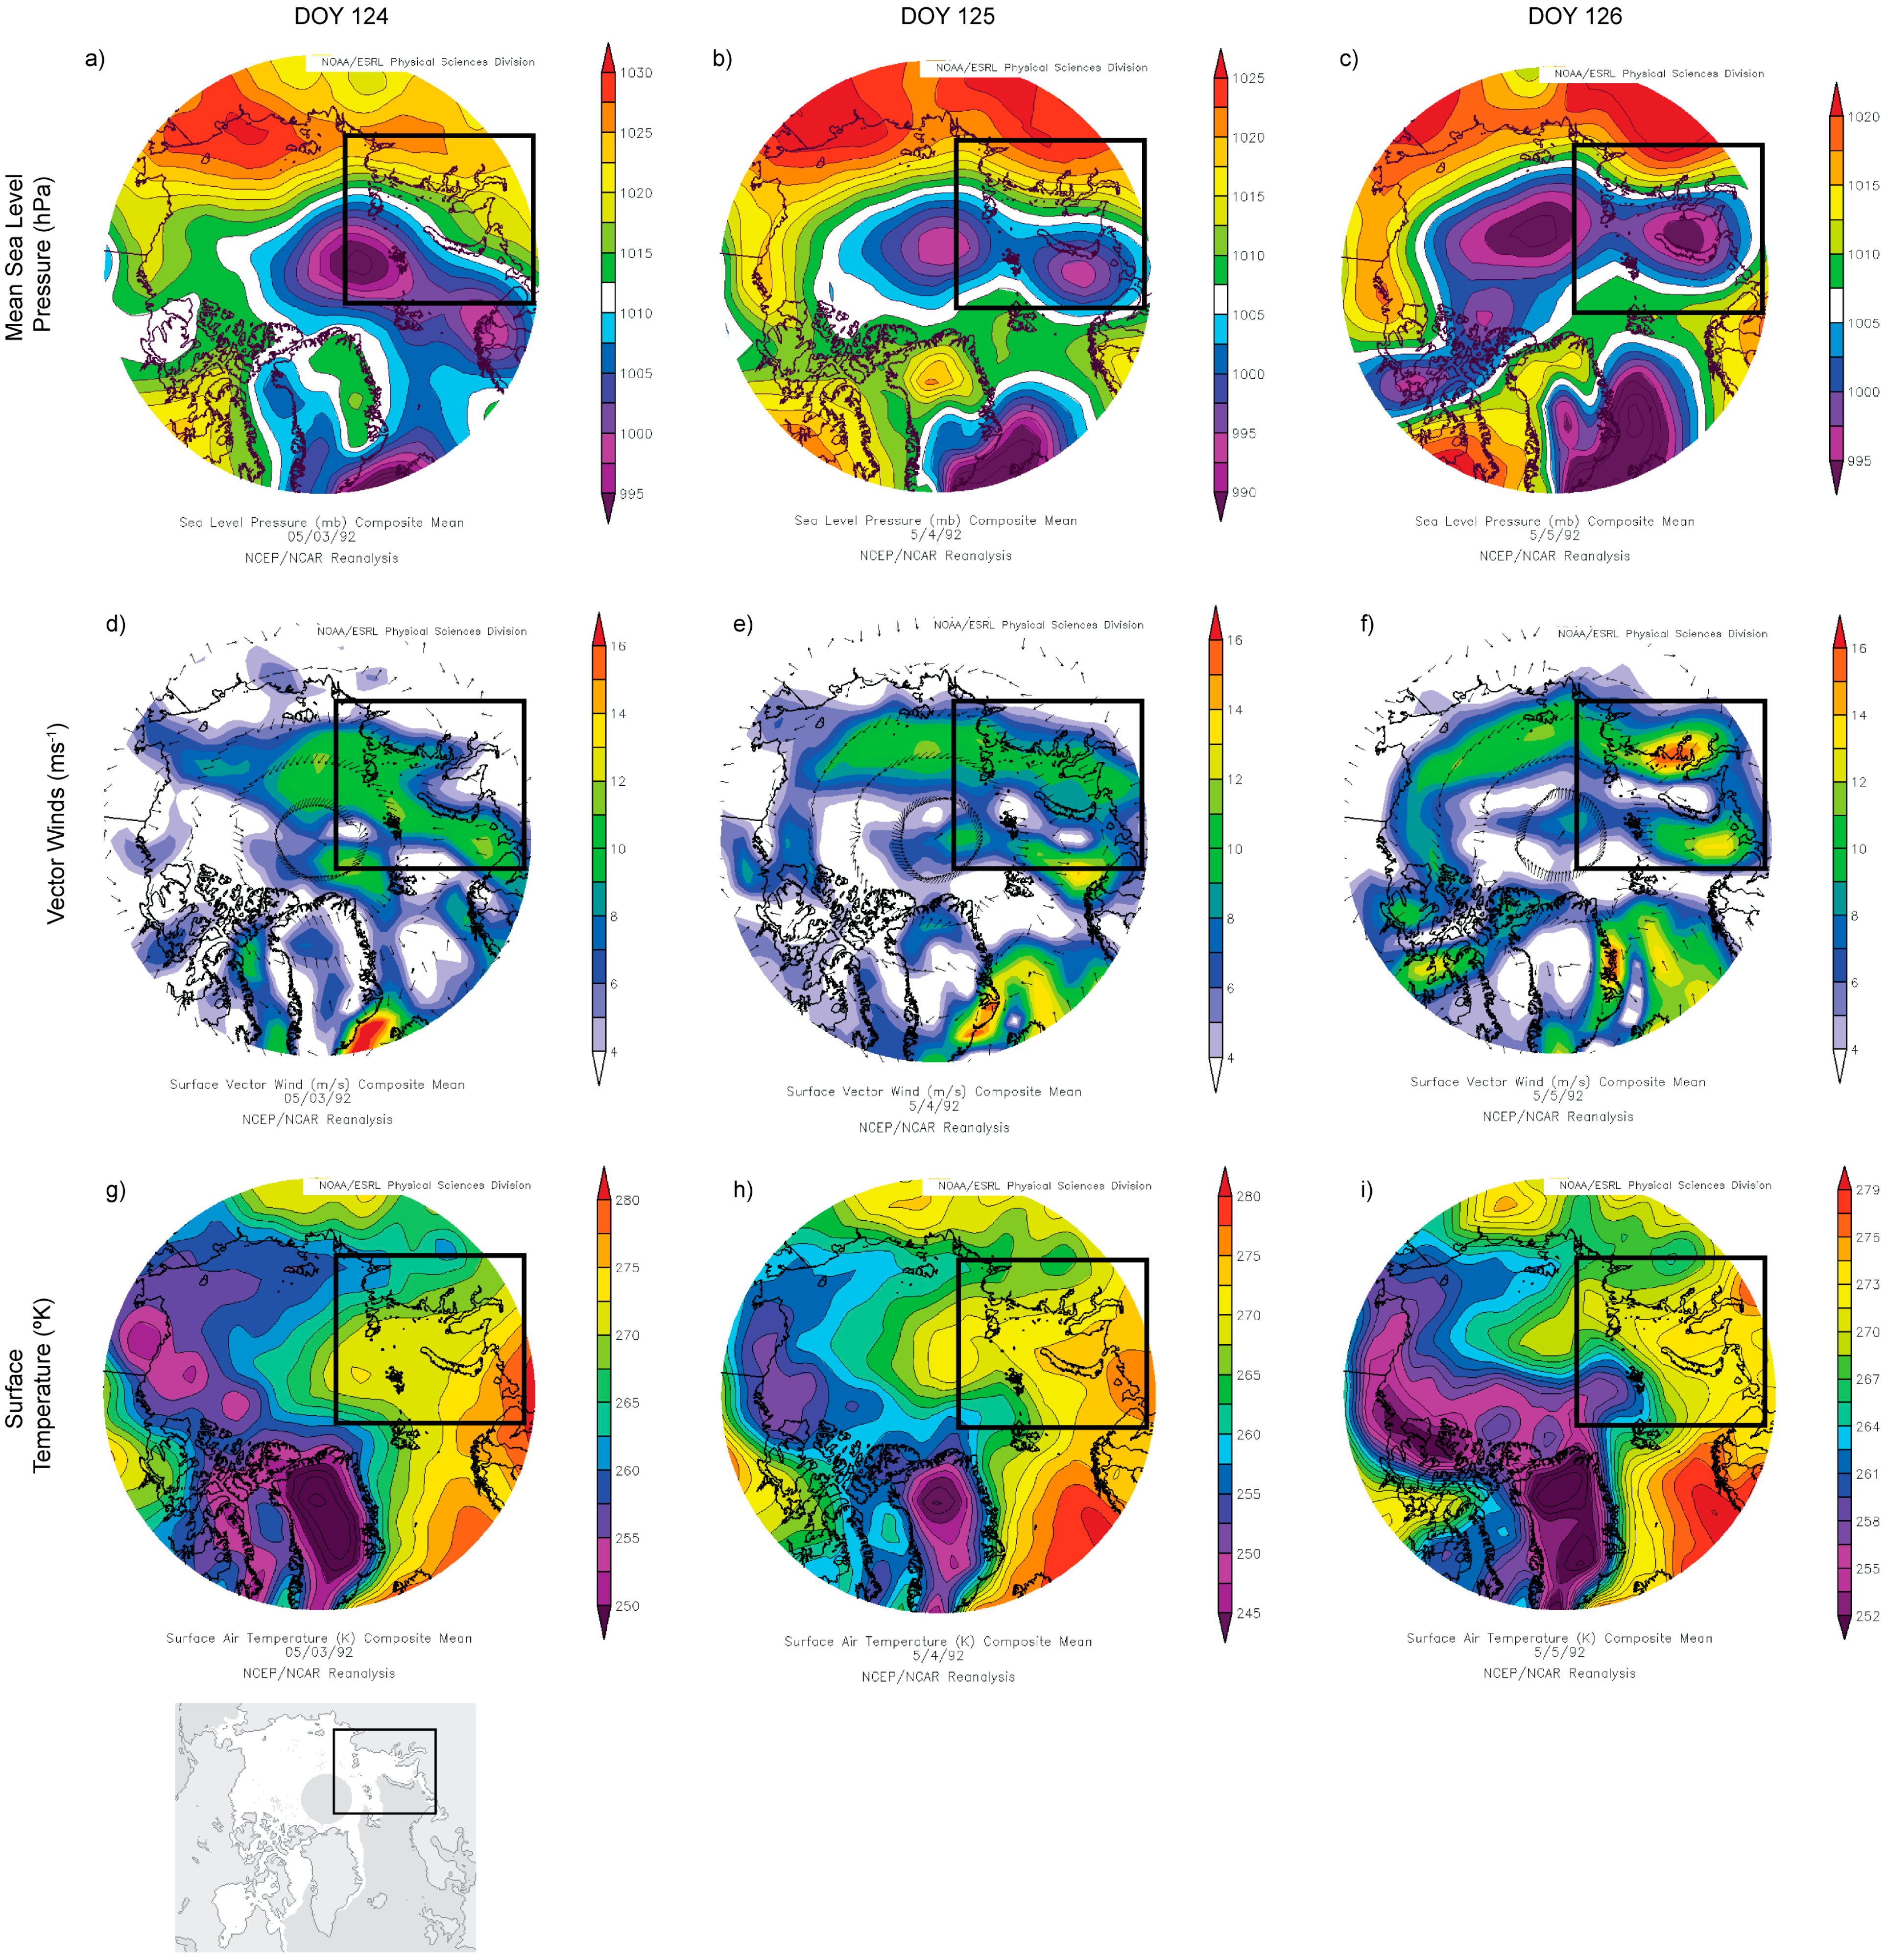
5.2.1. Kara Sea 1992


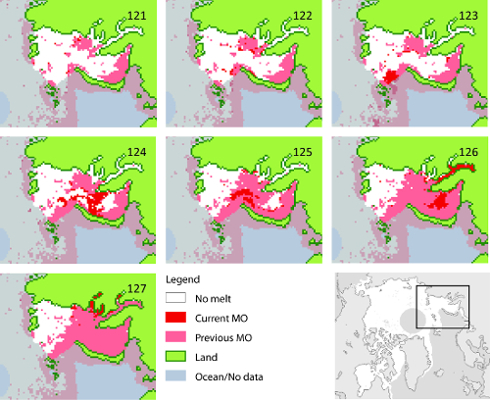
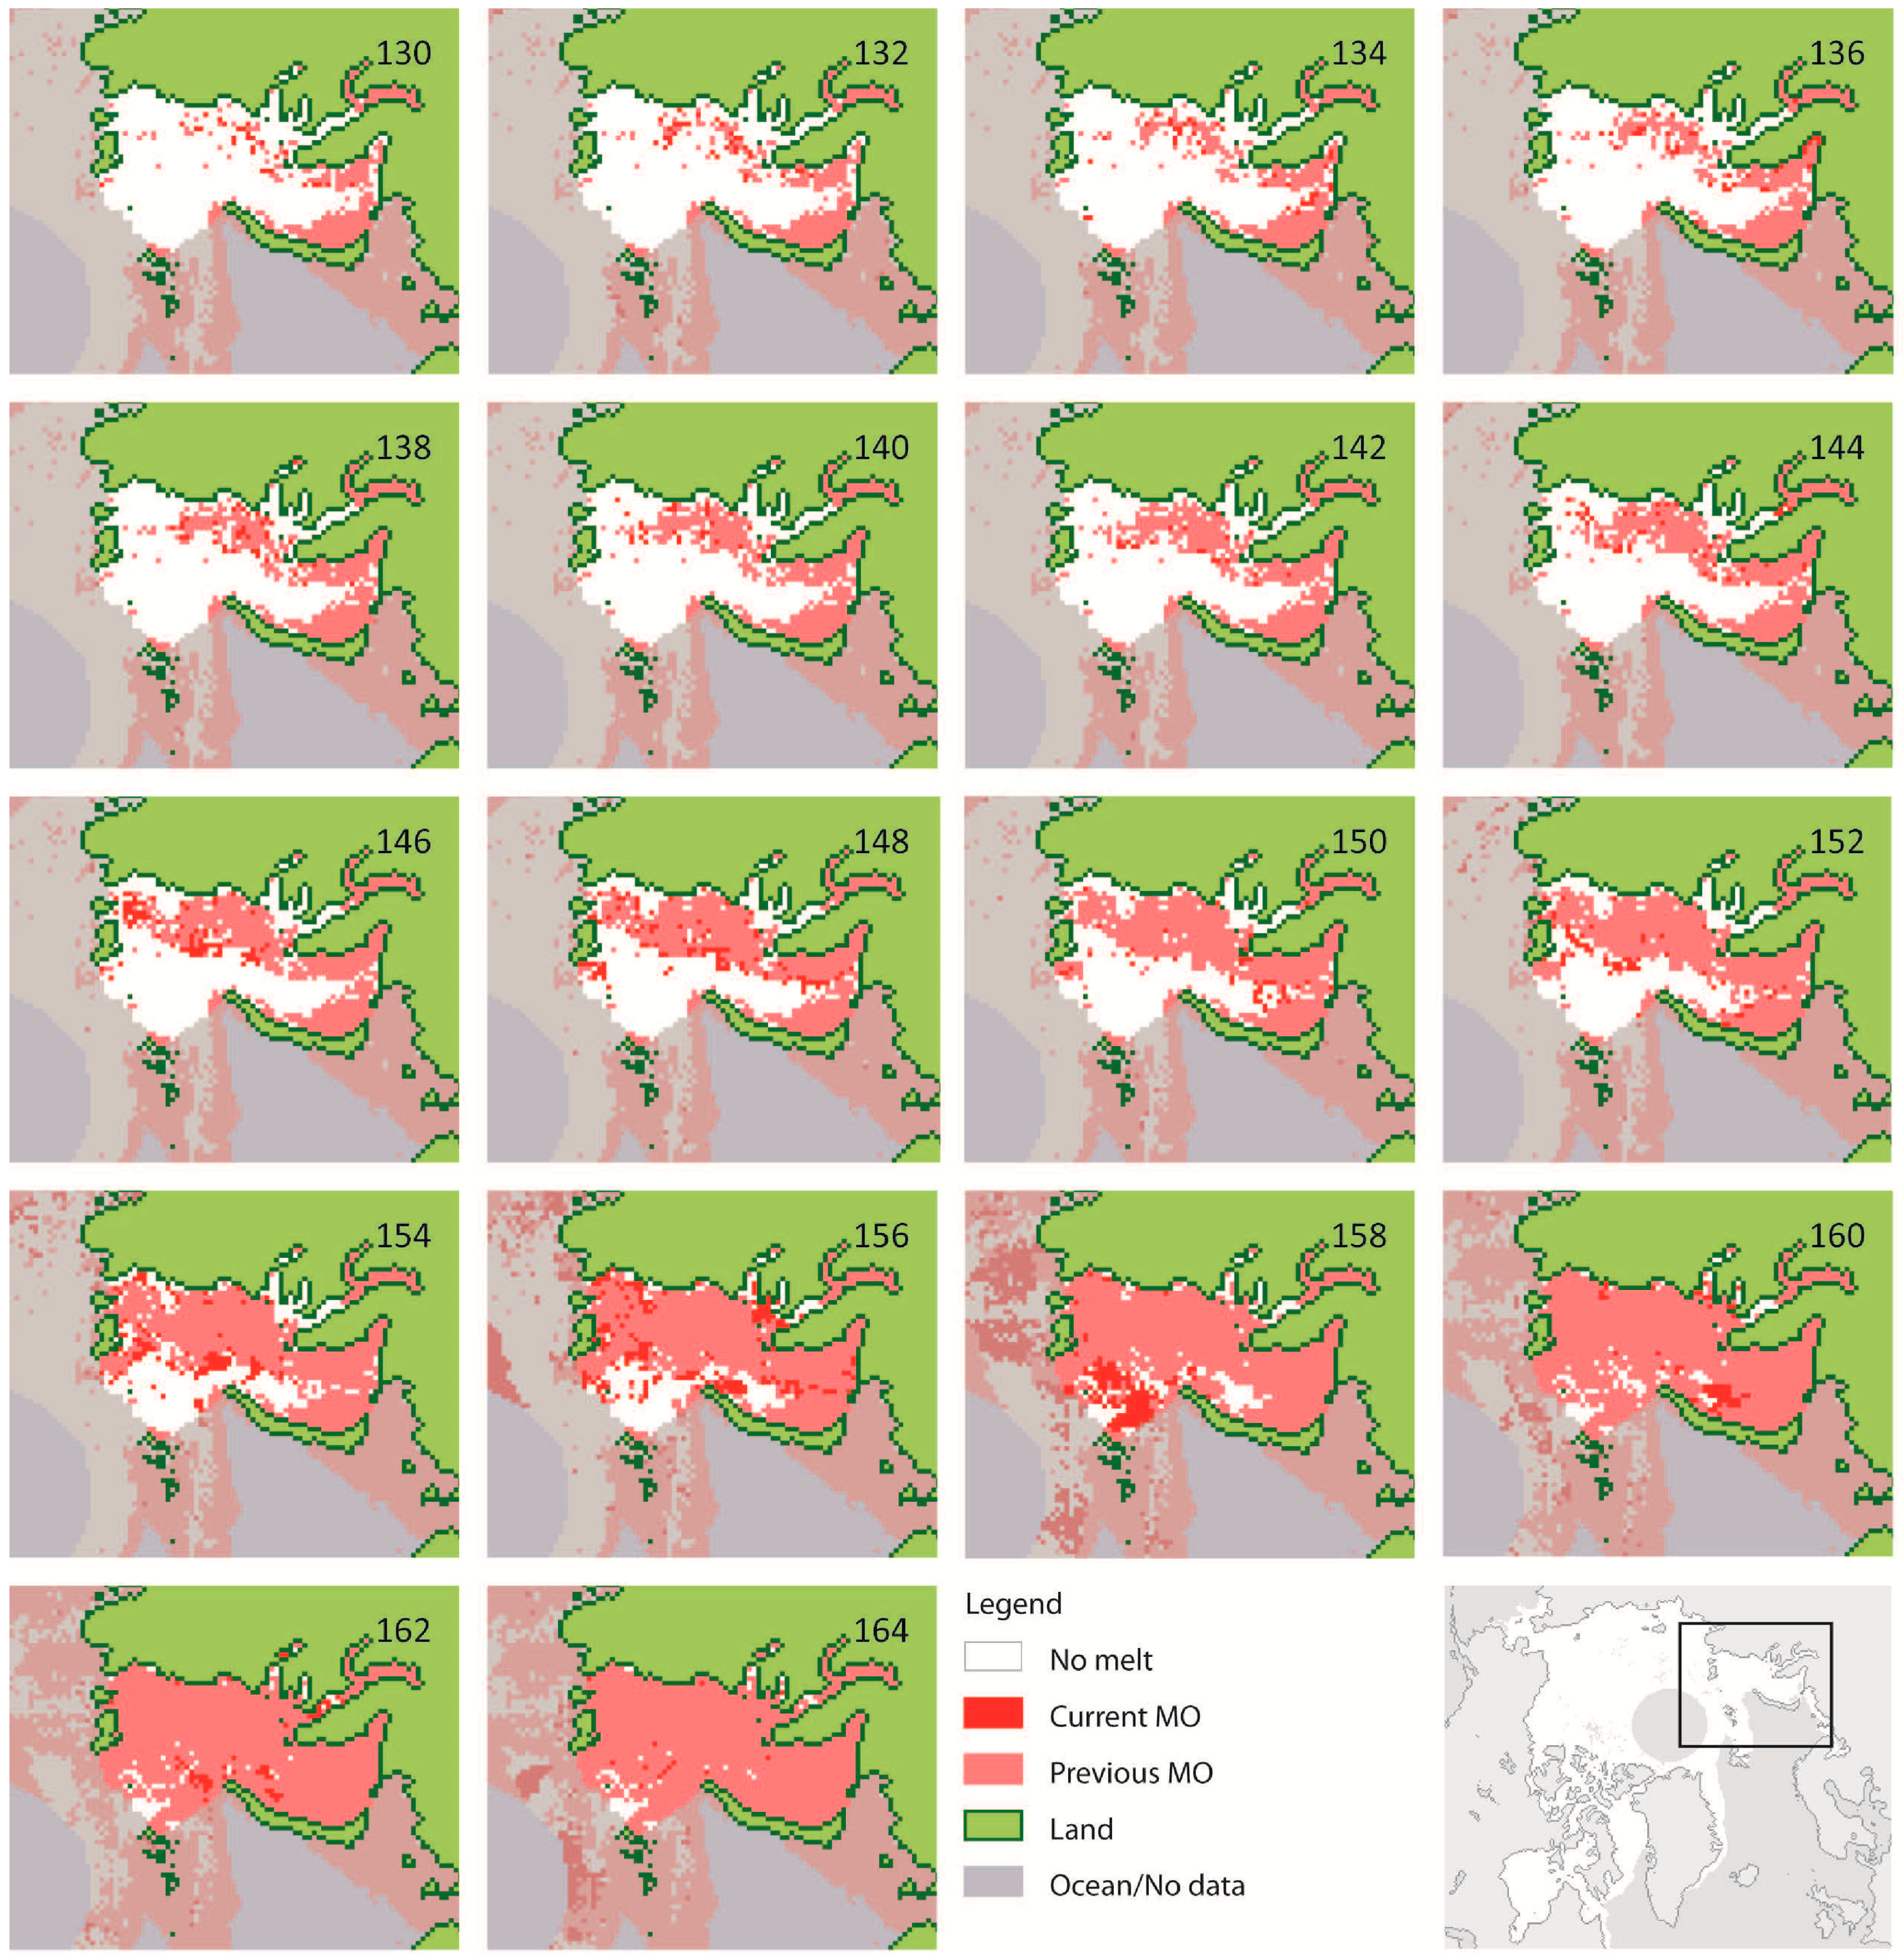
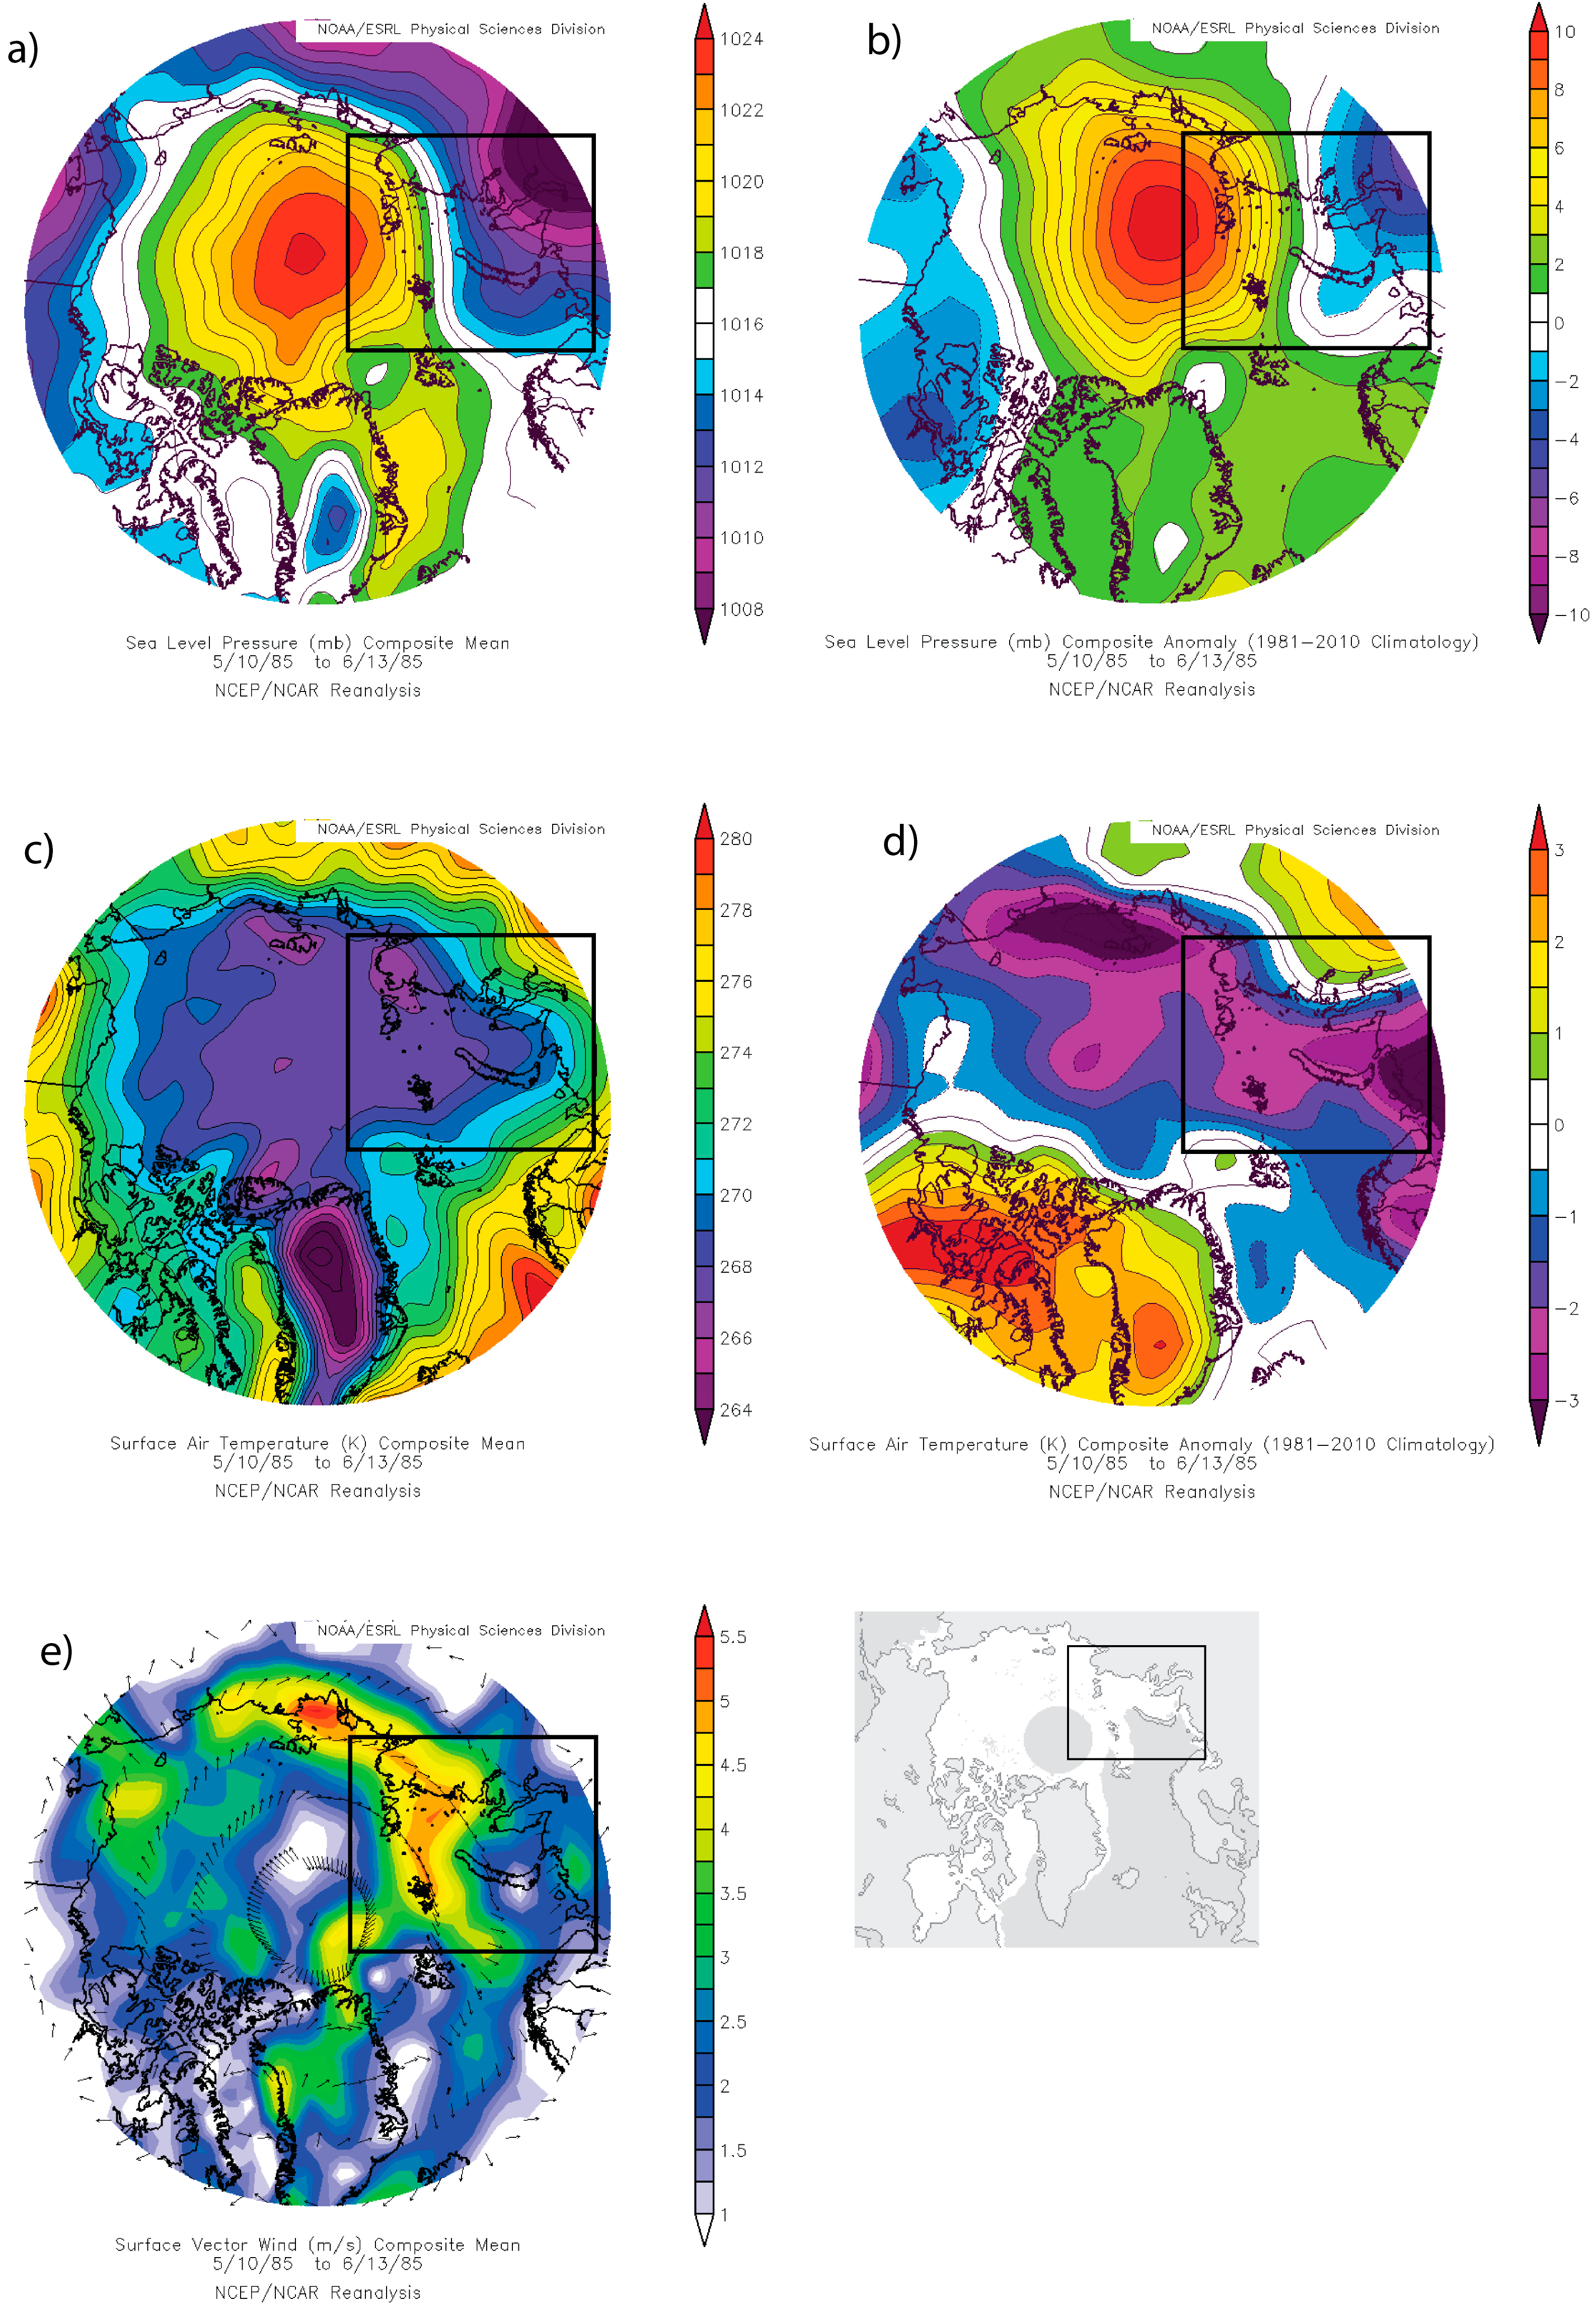
5.2.2. Kara Sea 1985


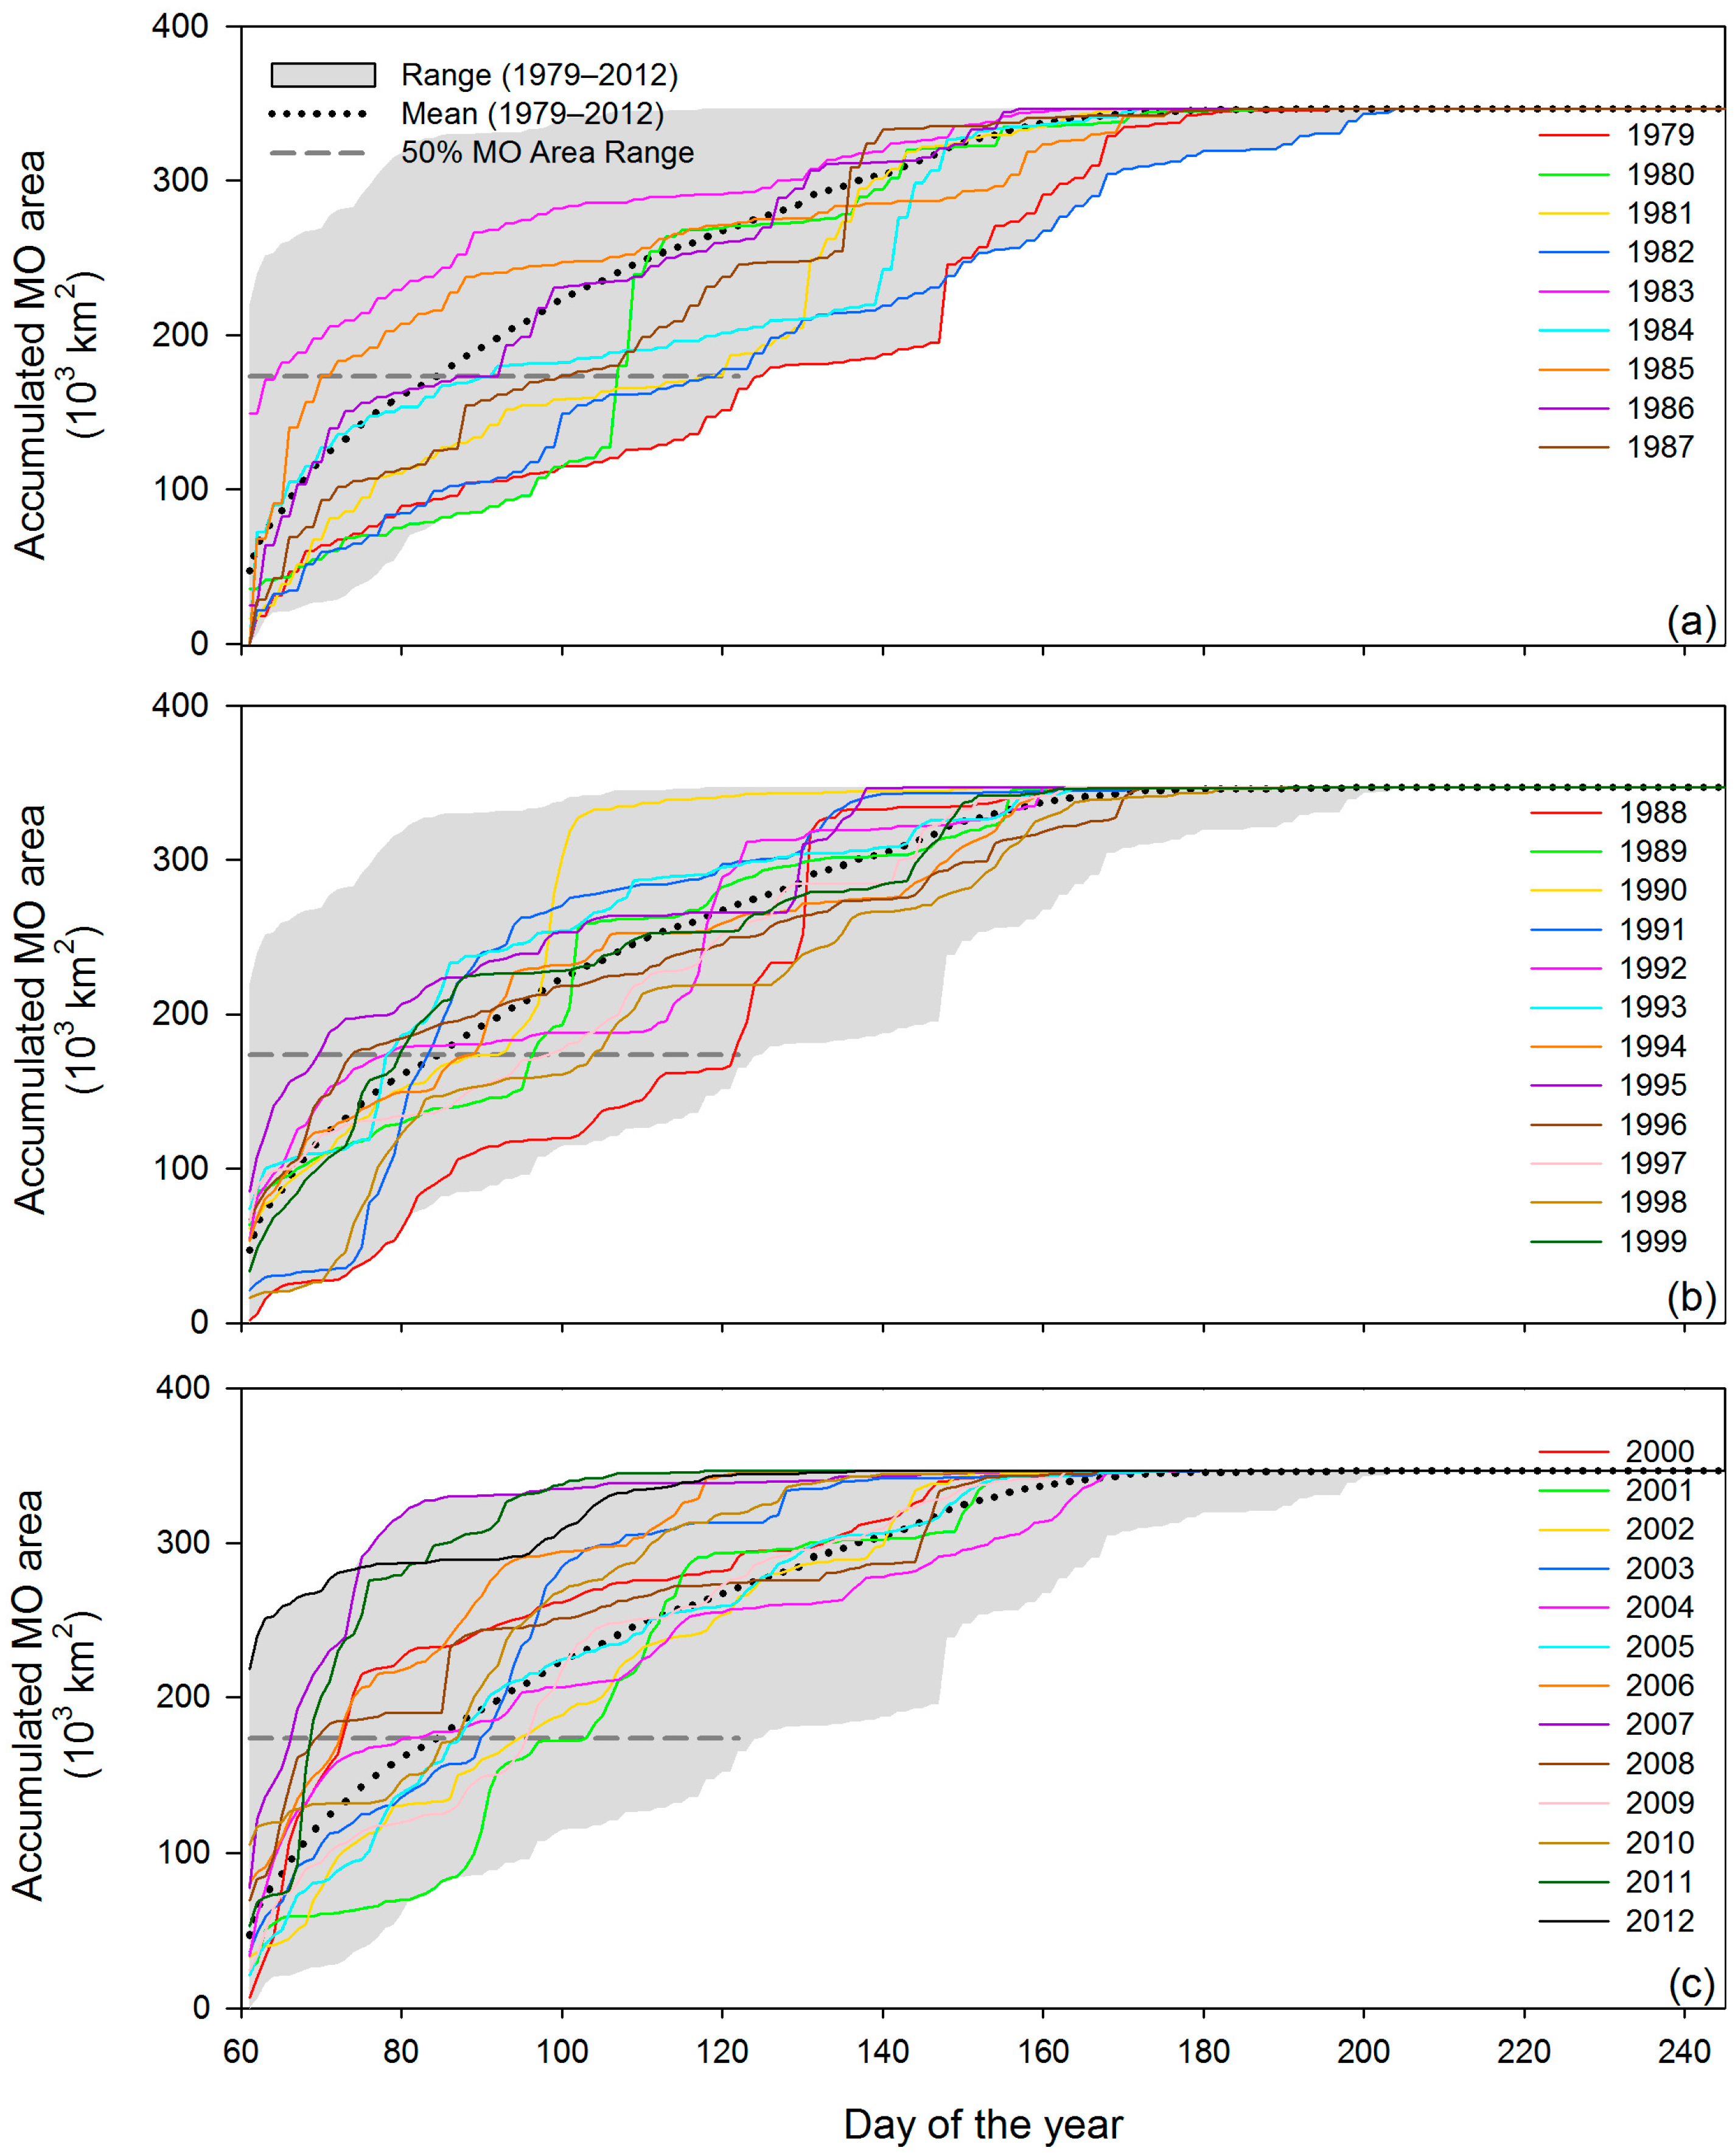
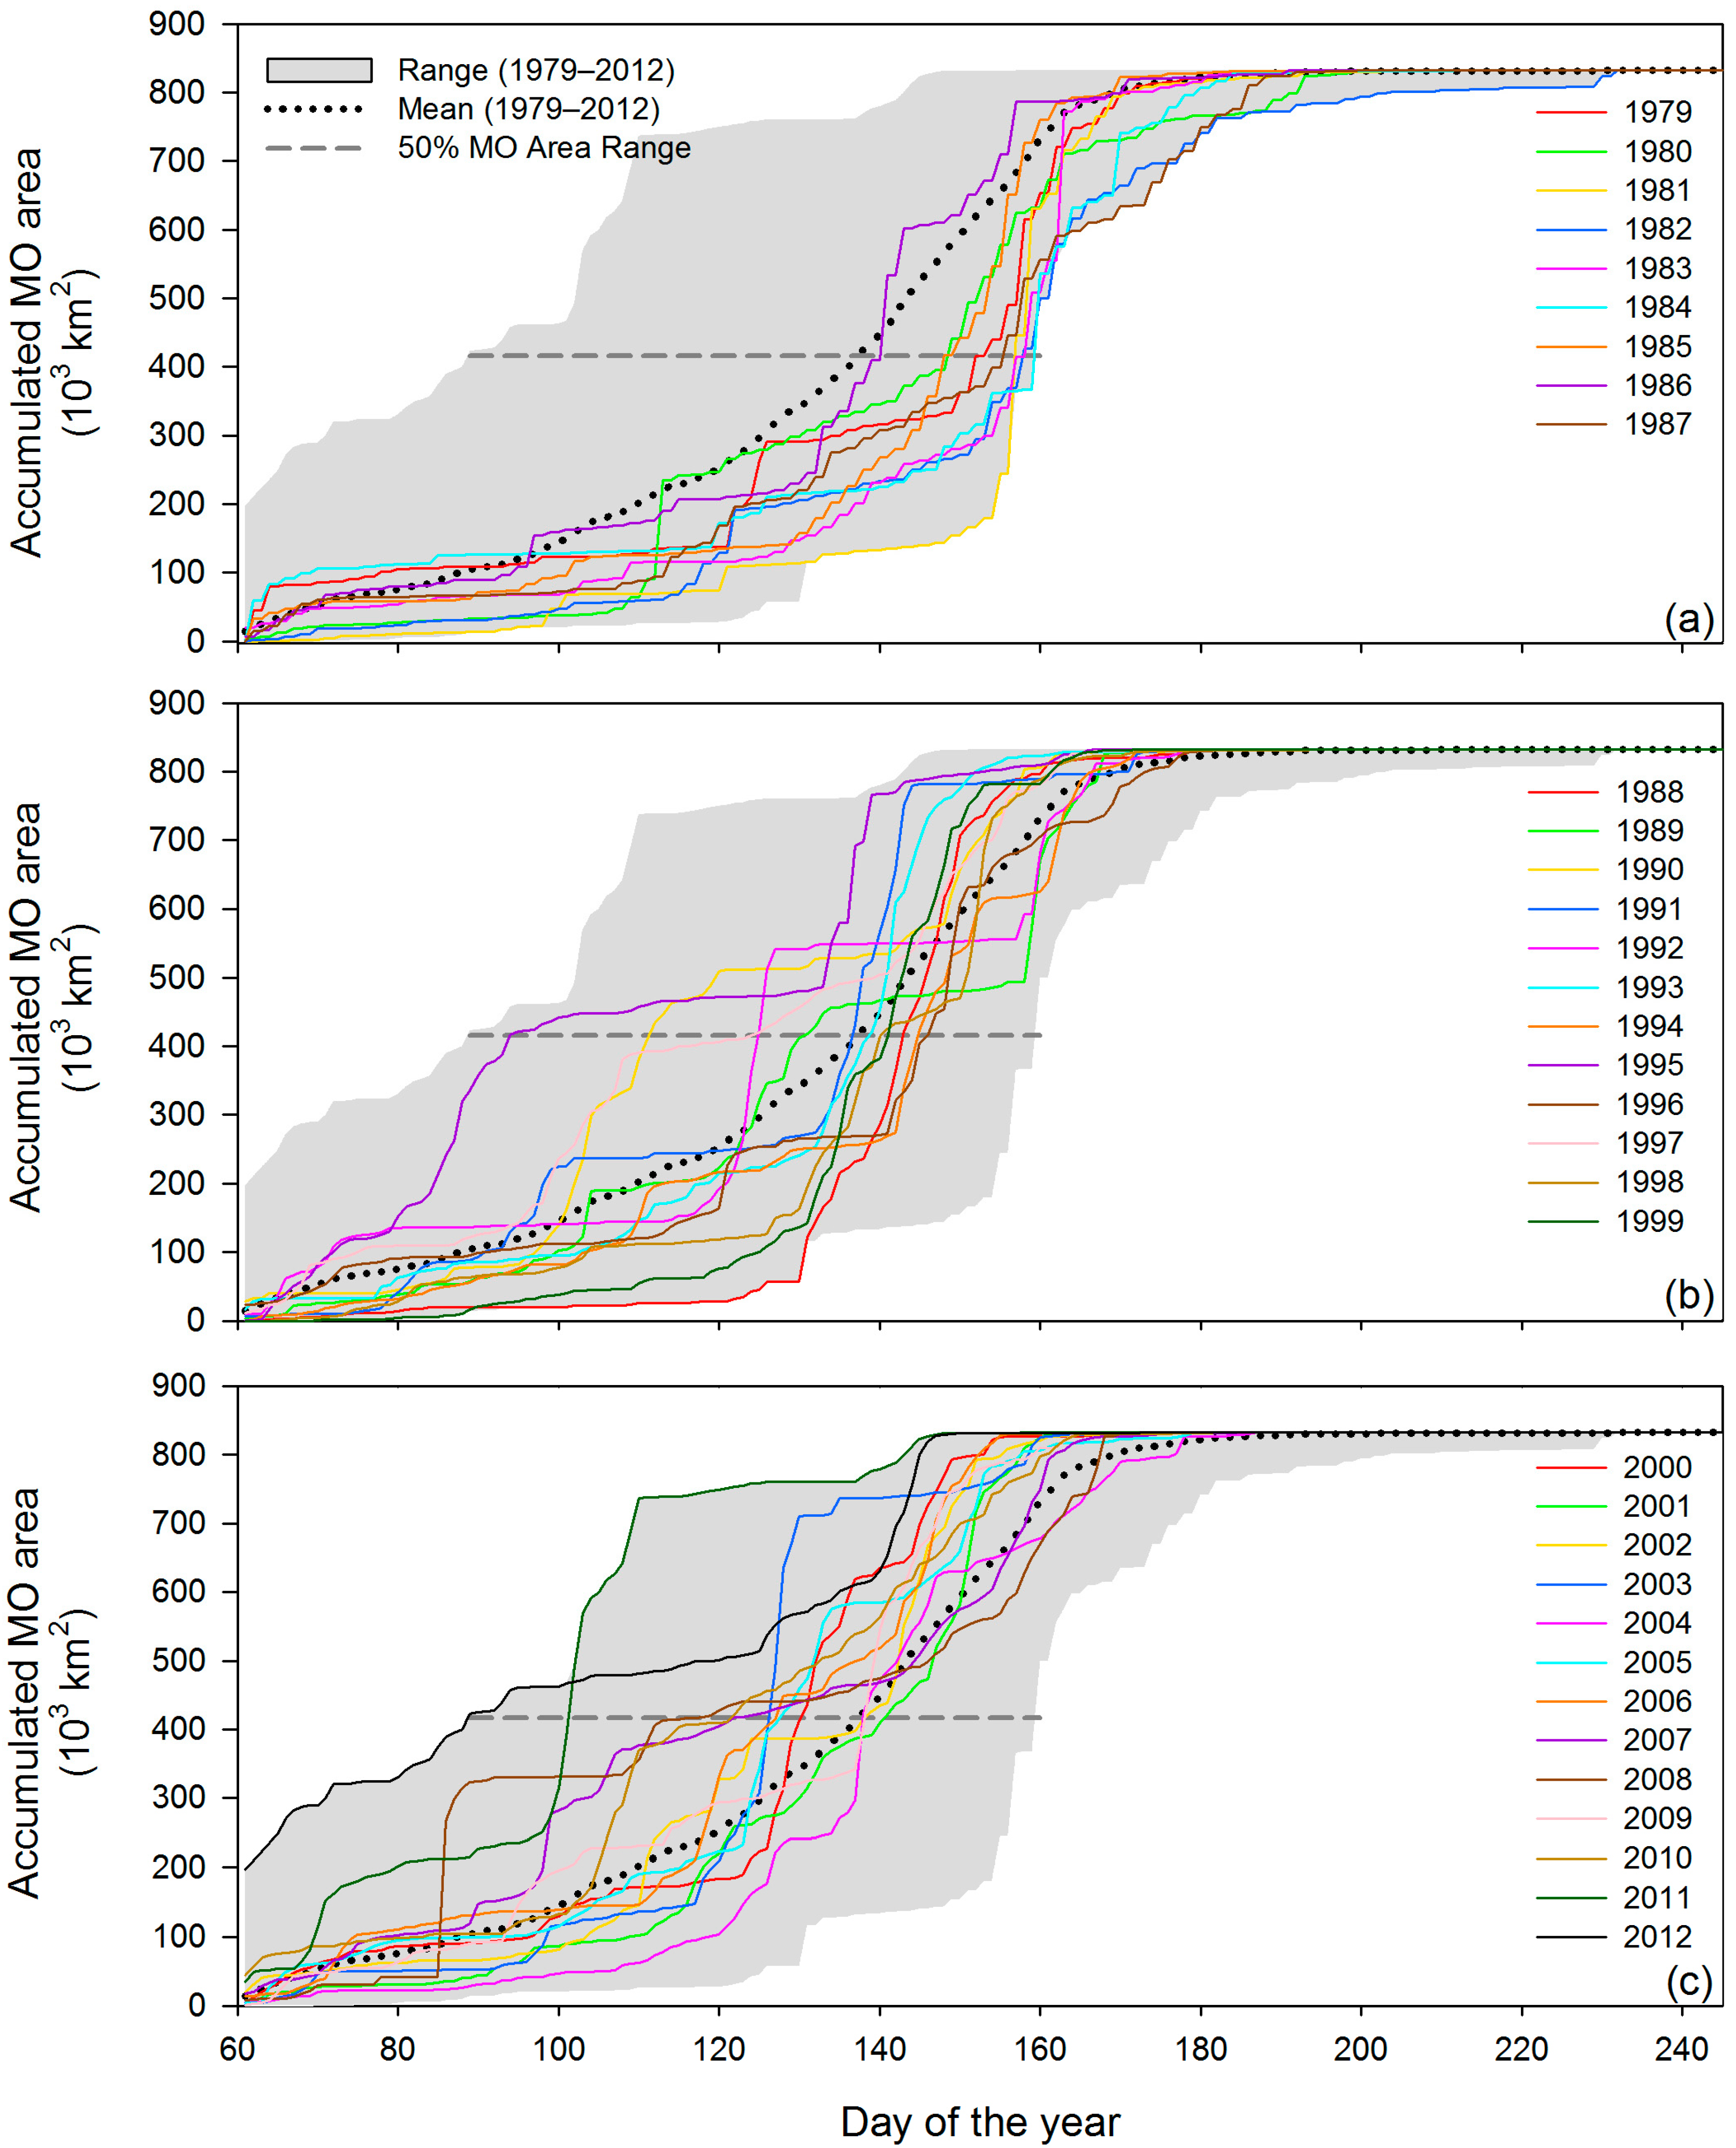
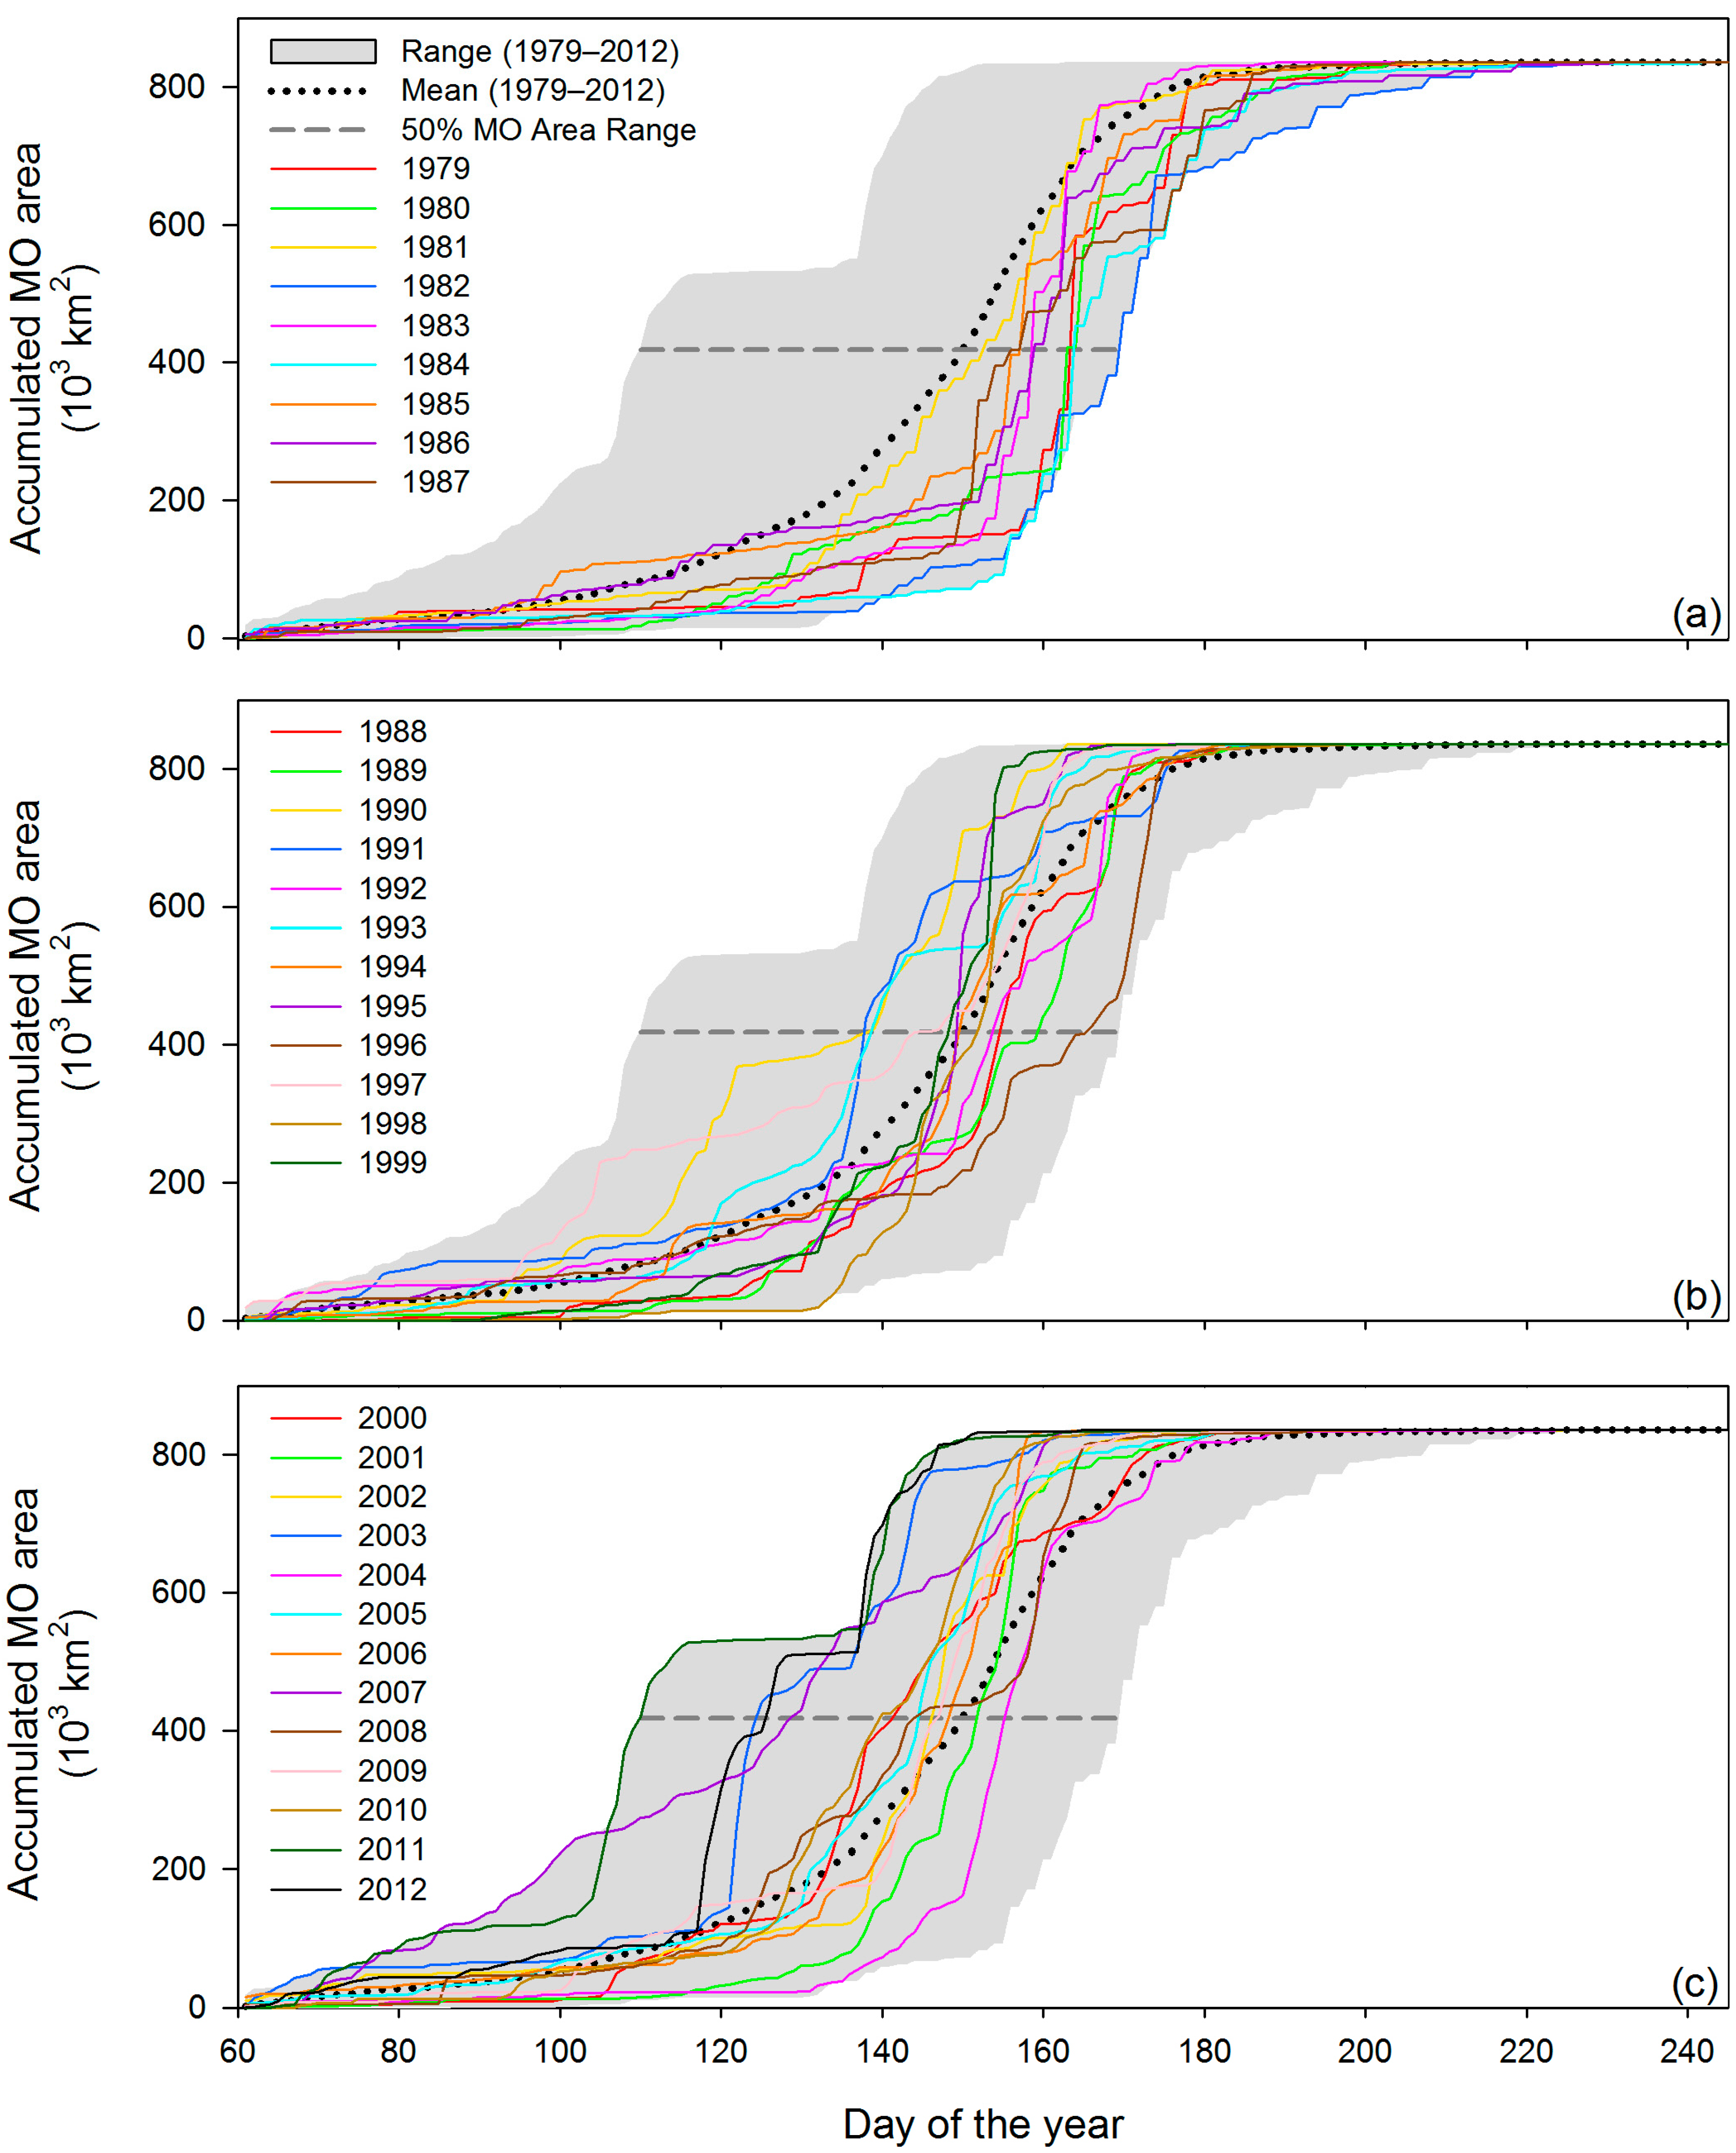
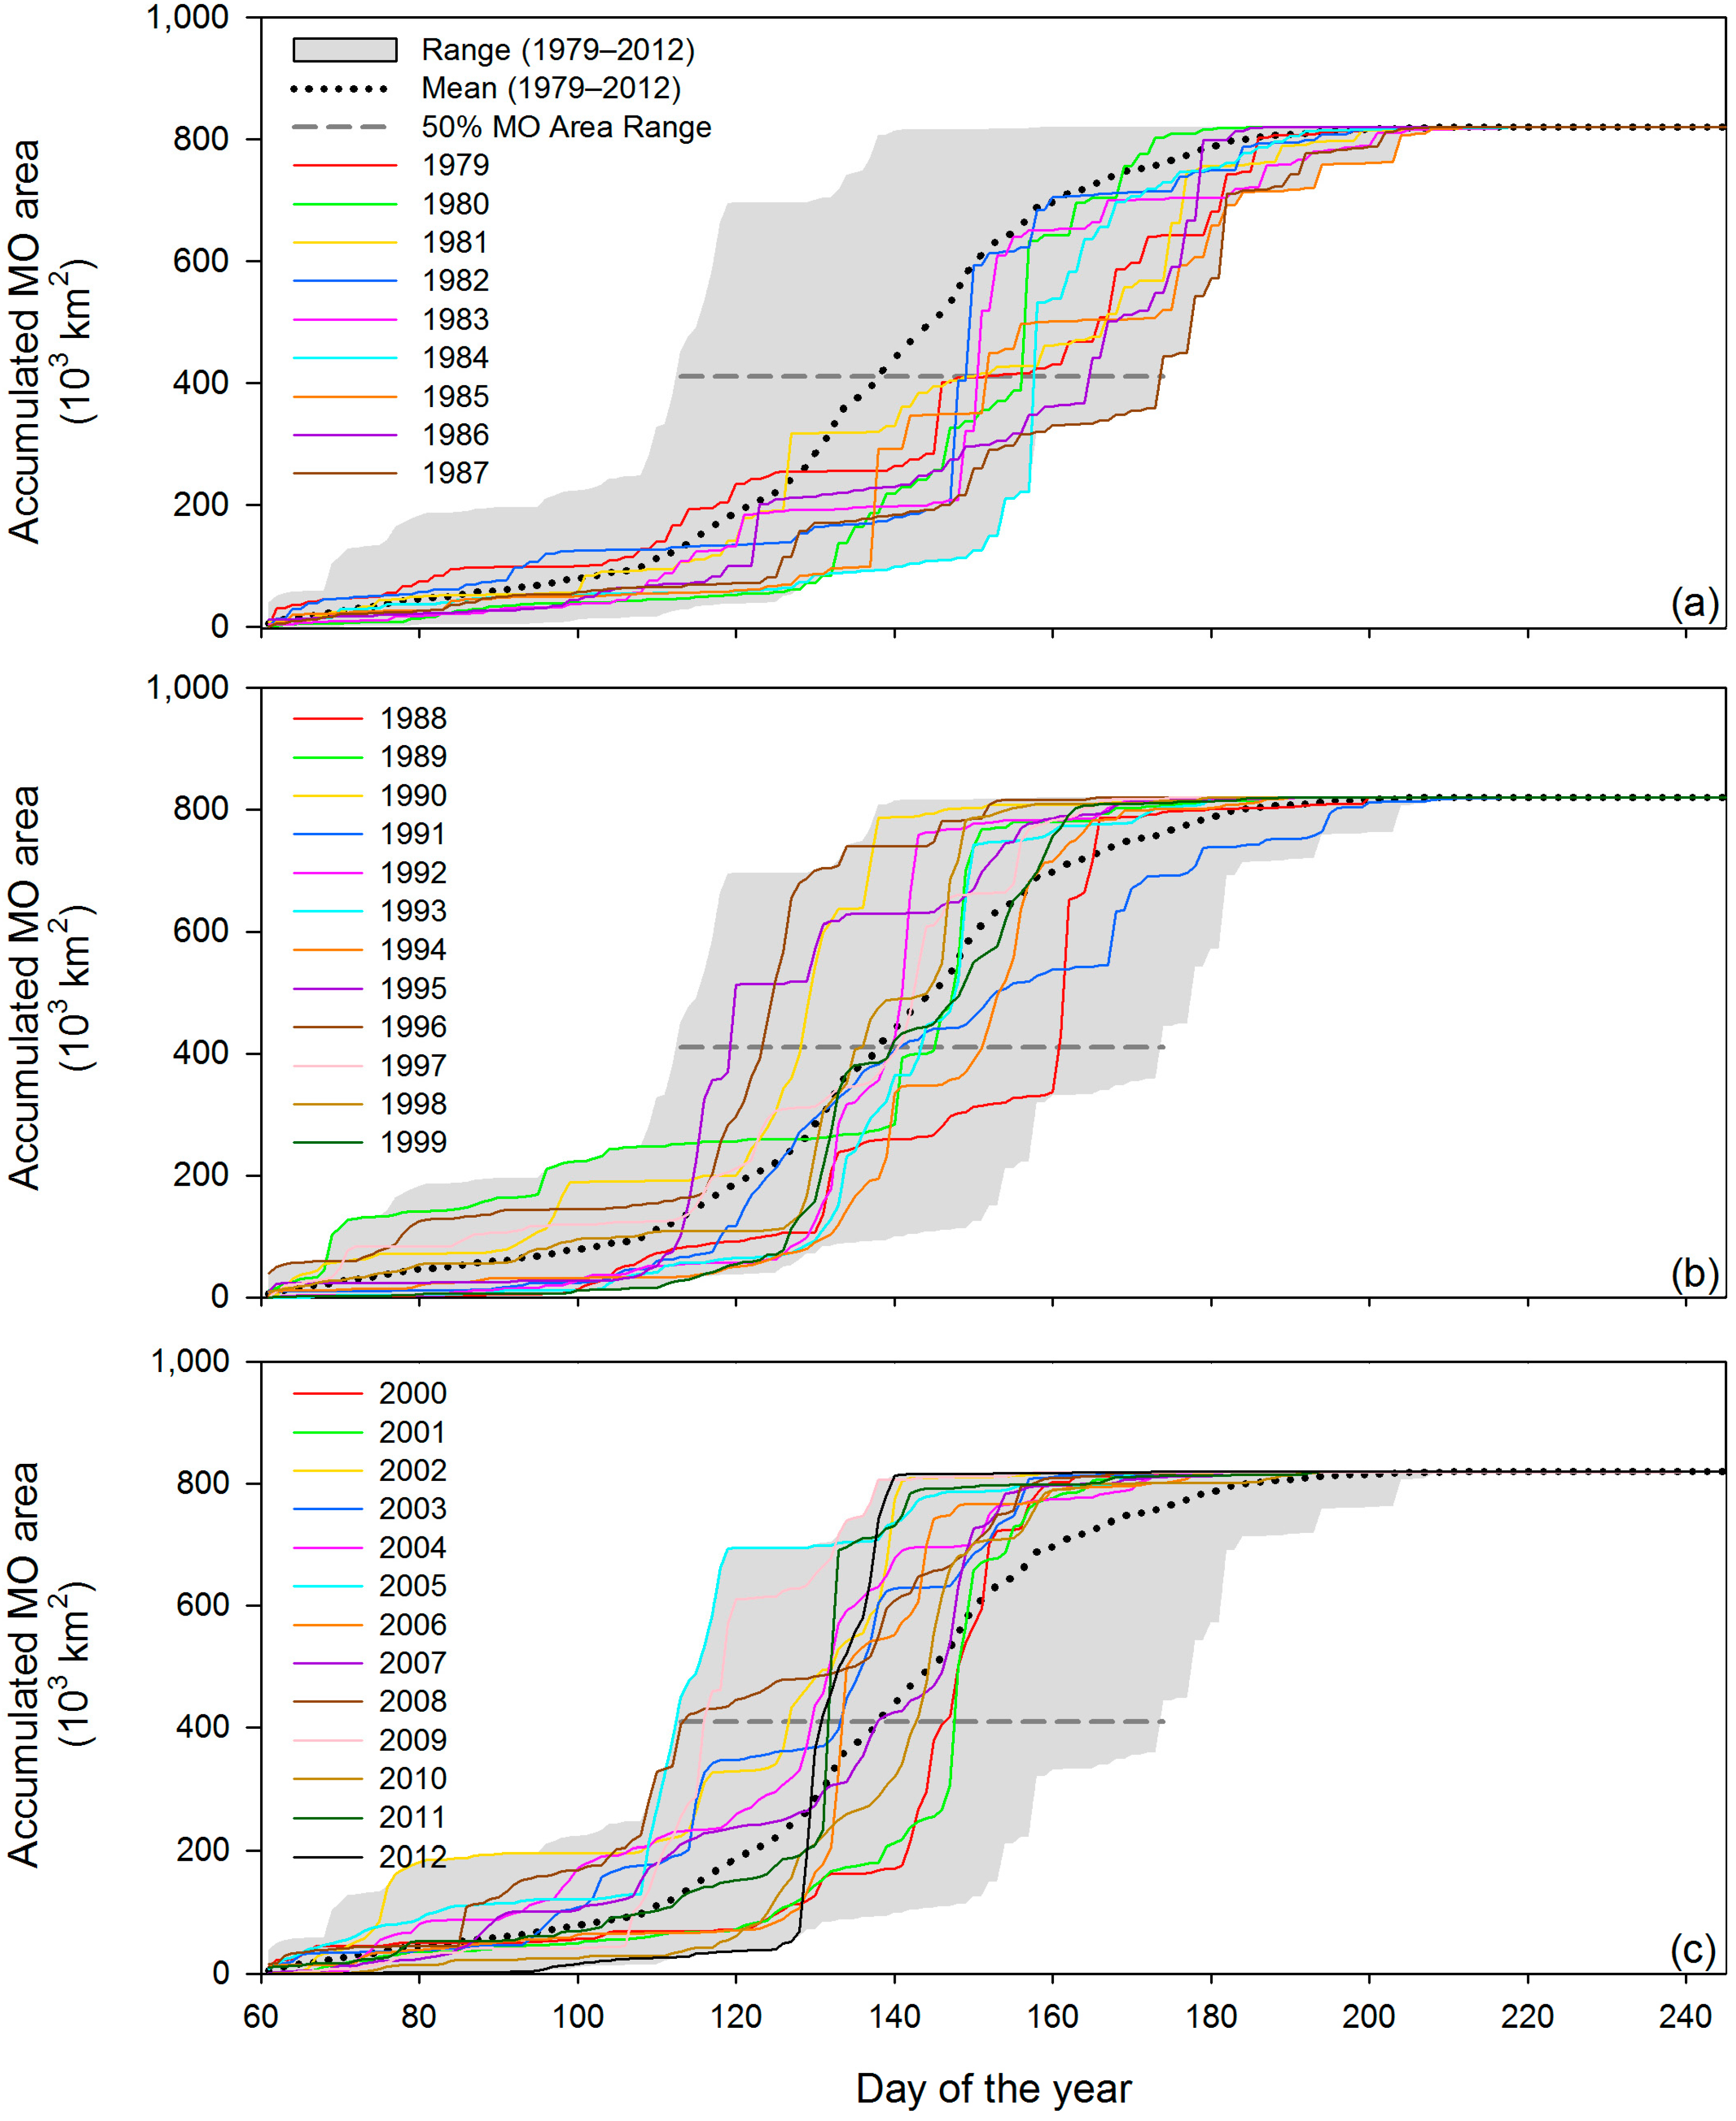
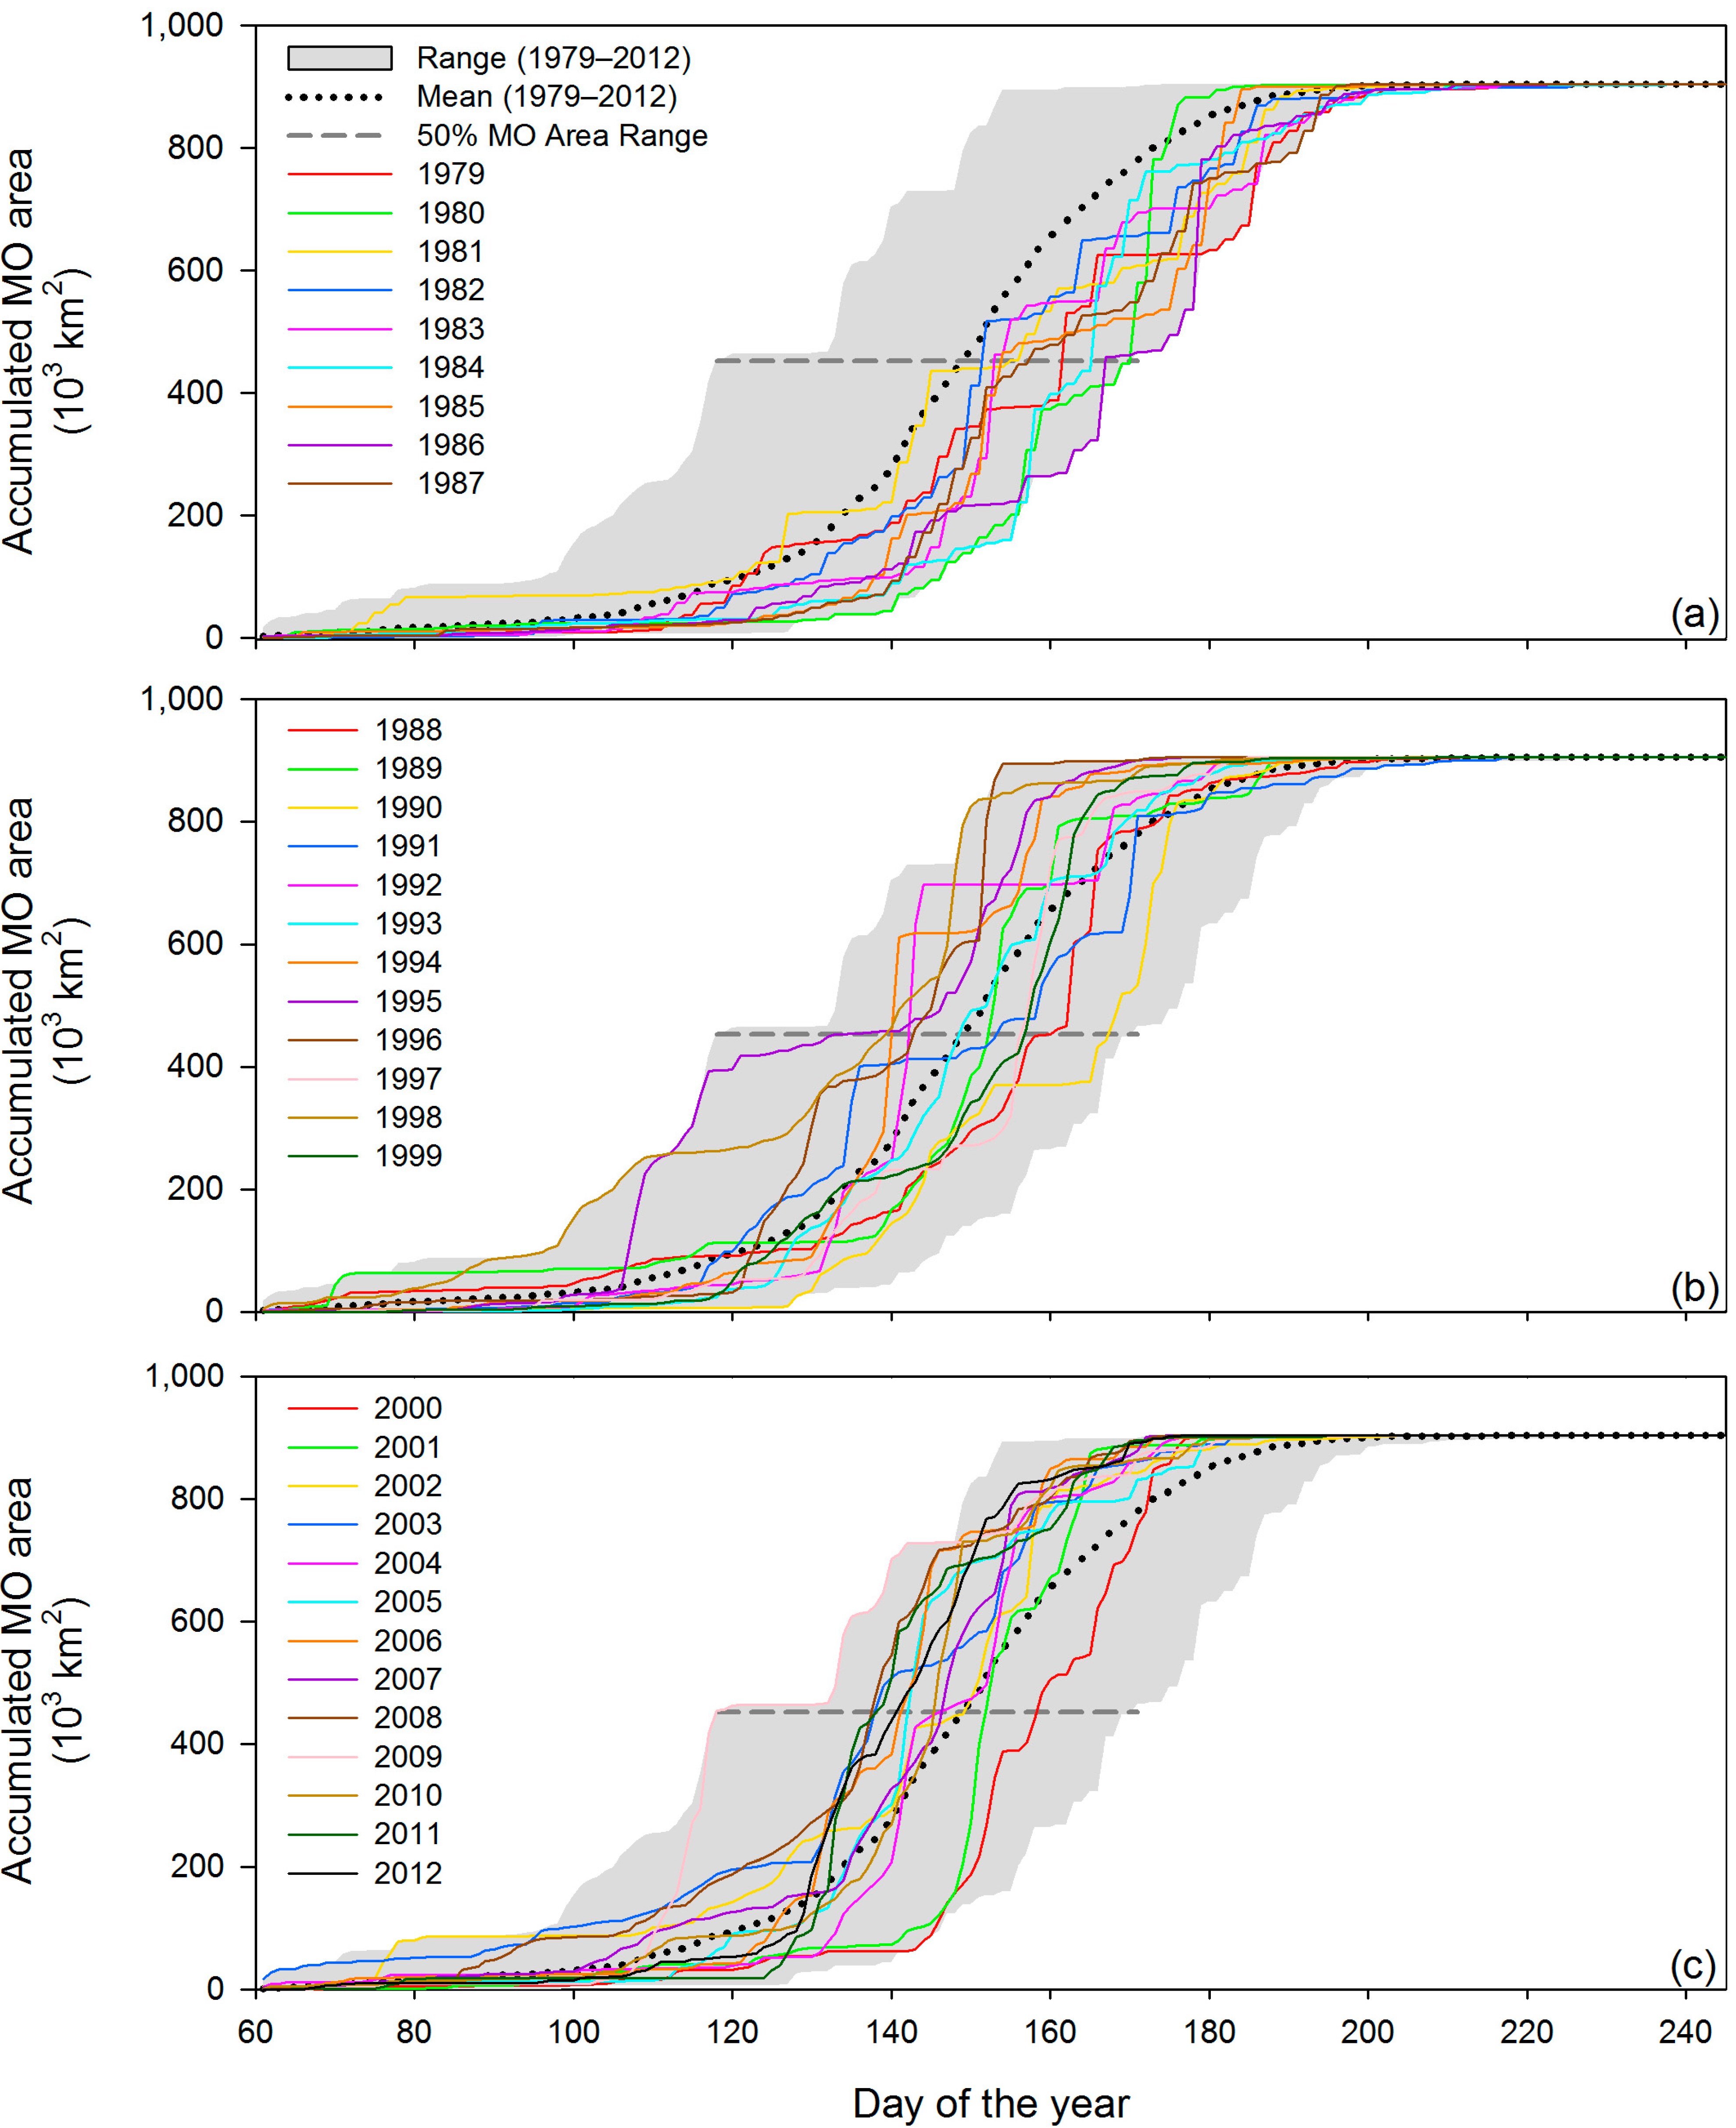
6. Annual Accumulations of Melt Onset Area
6.1. Inter-Annual Variability in the Arctic Ocean

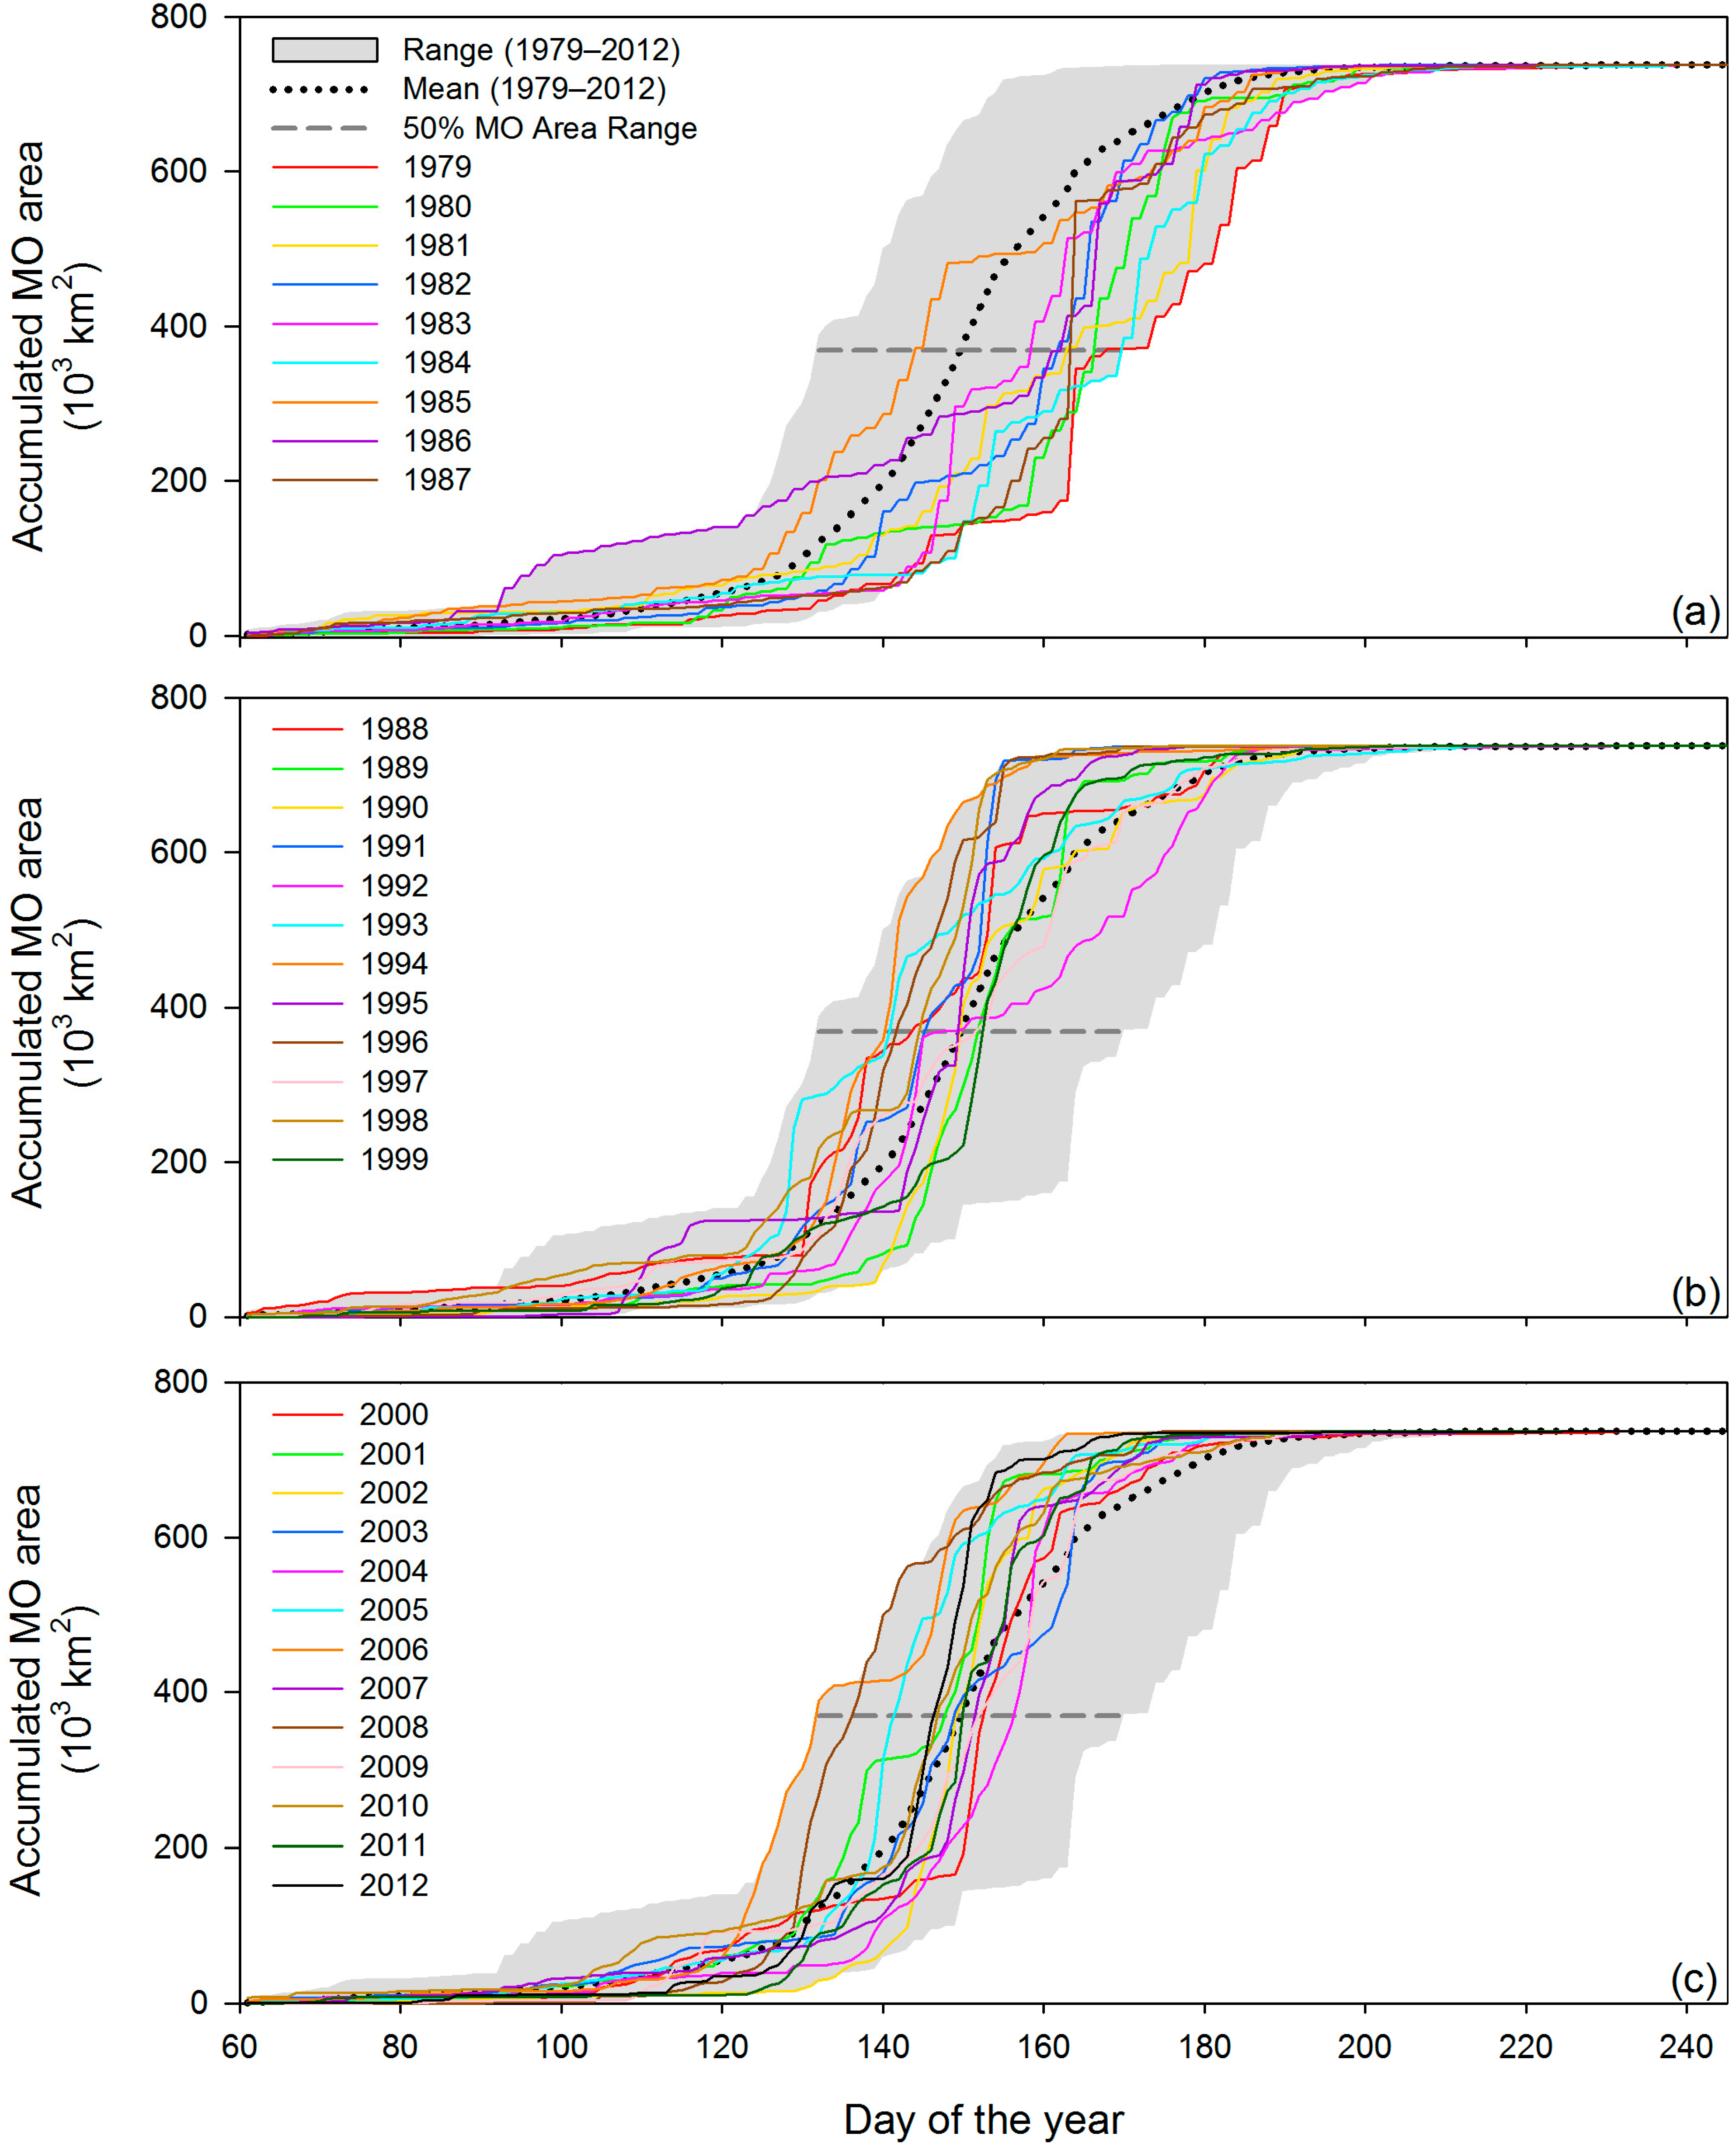
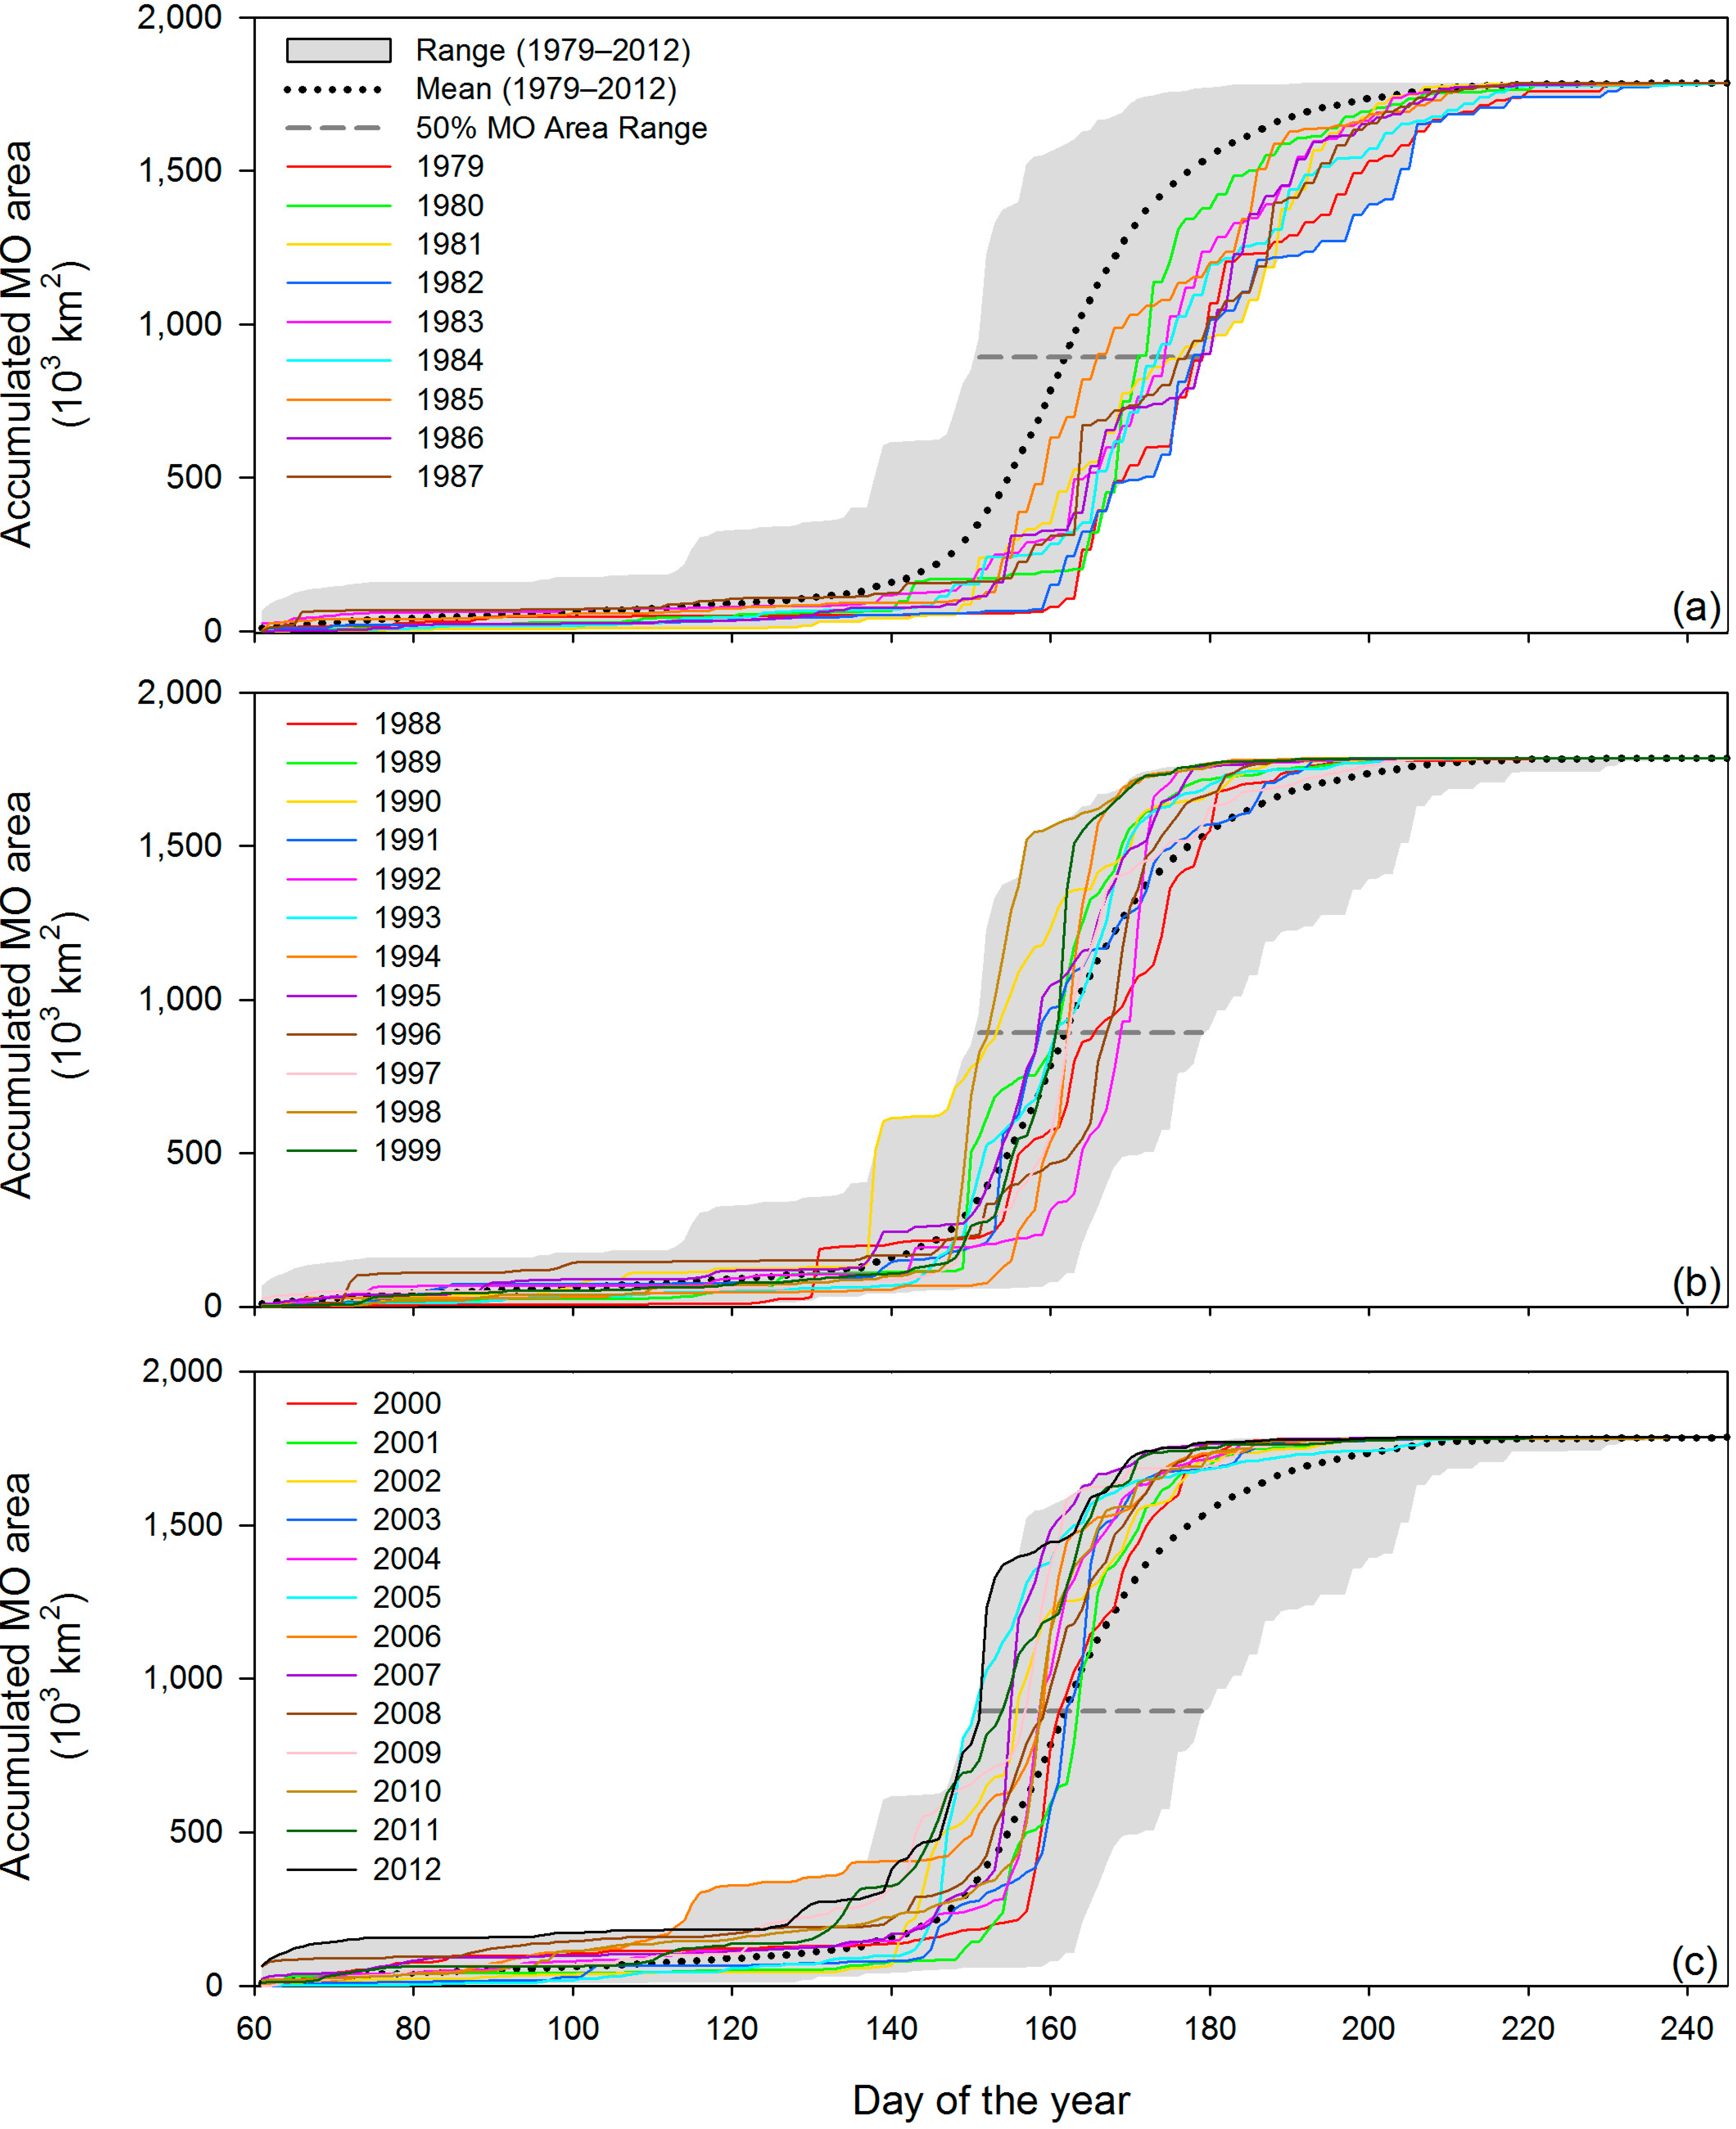
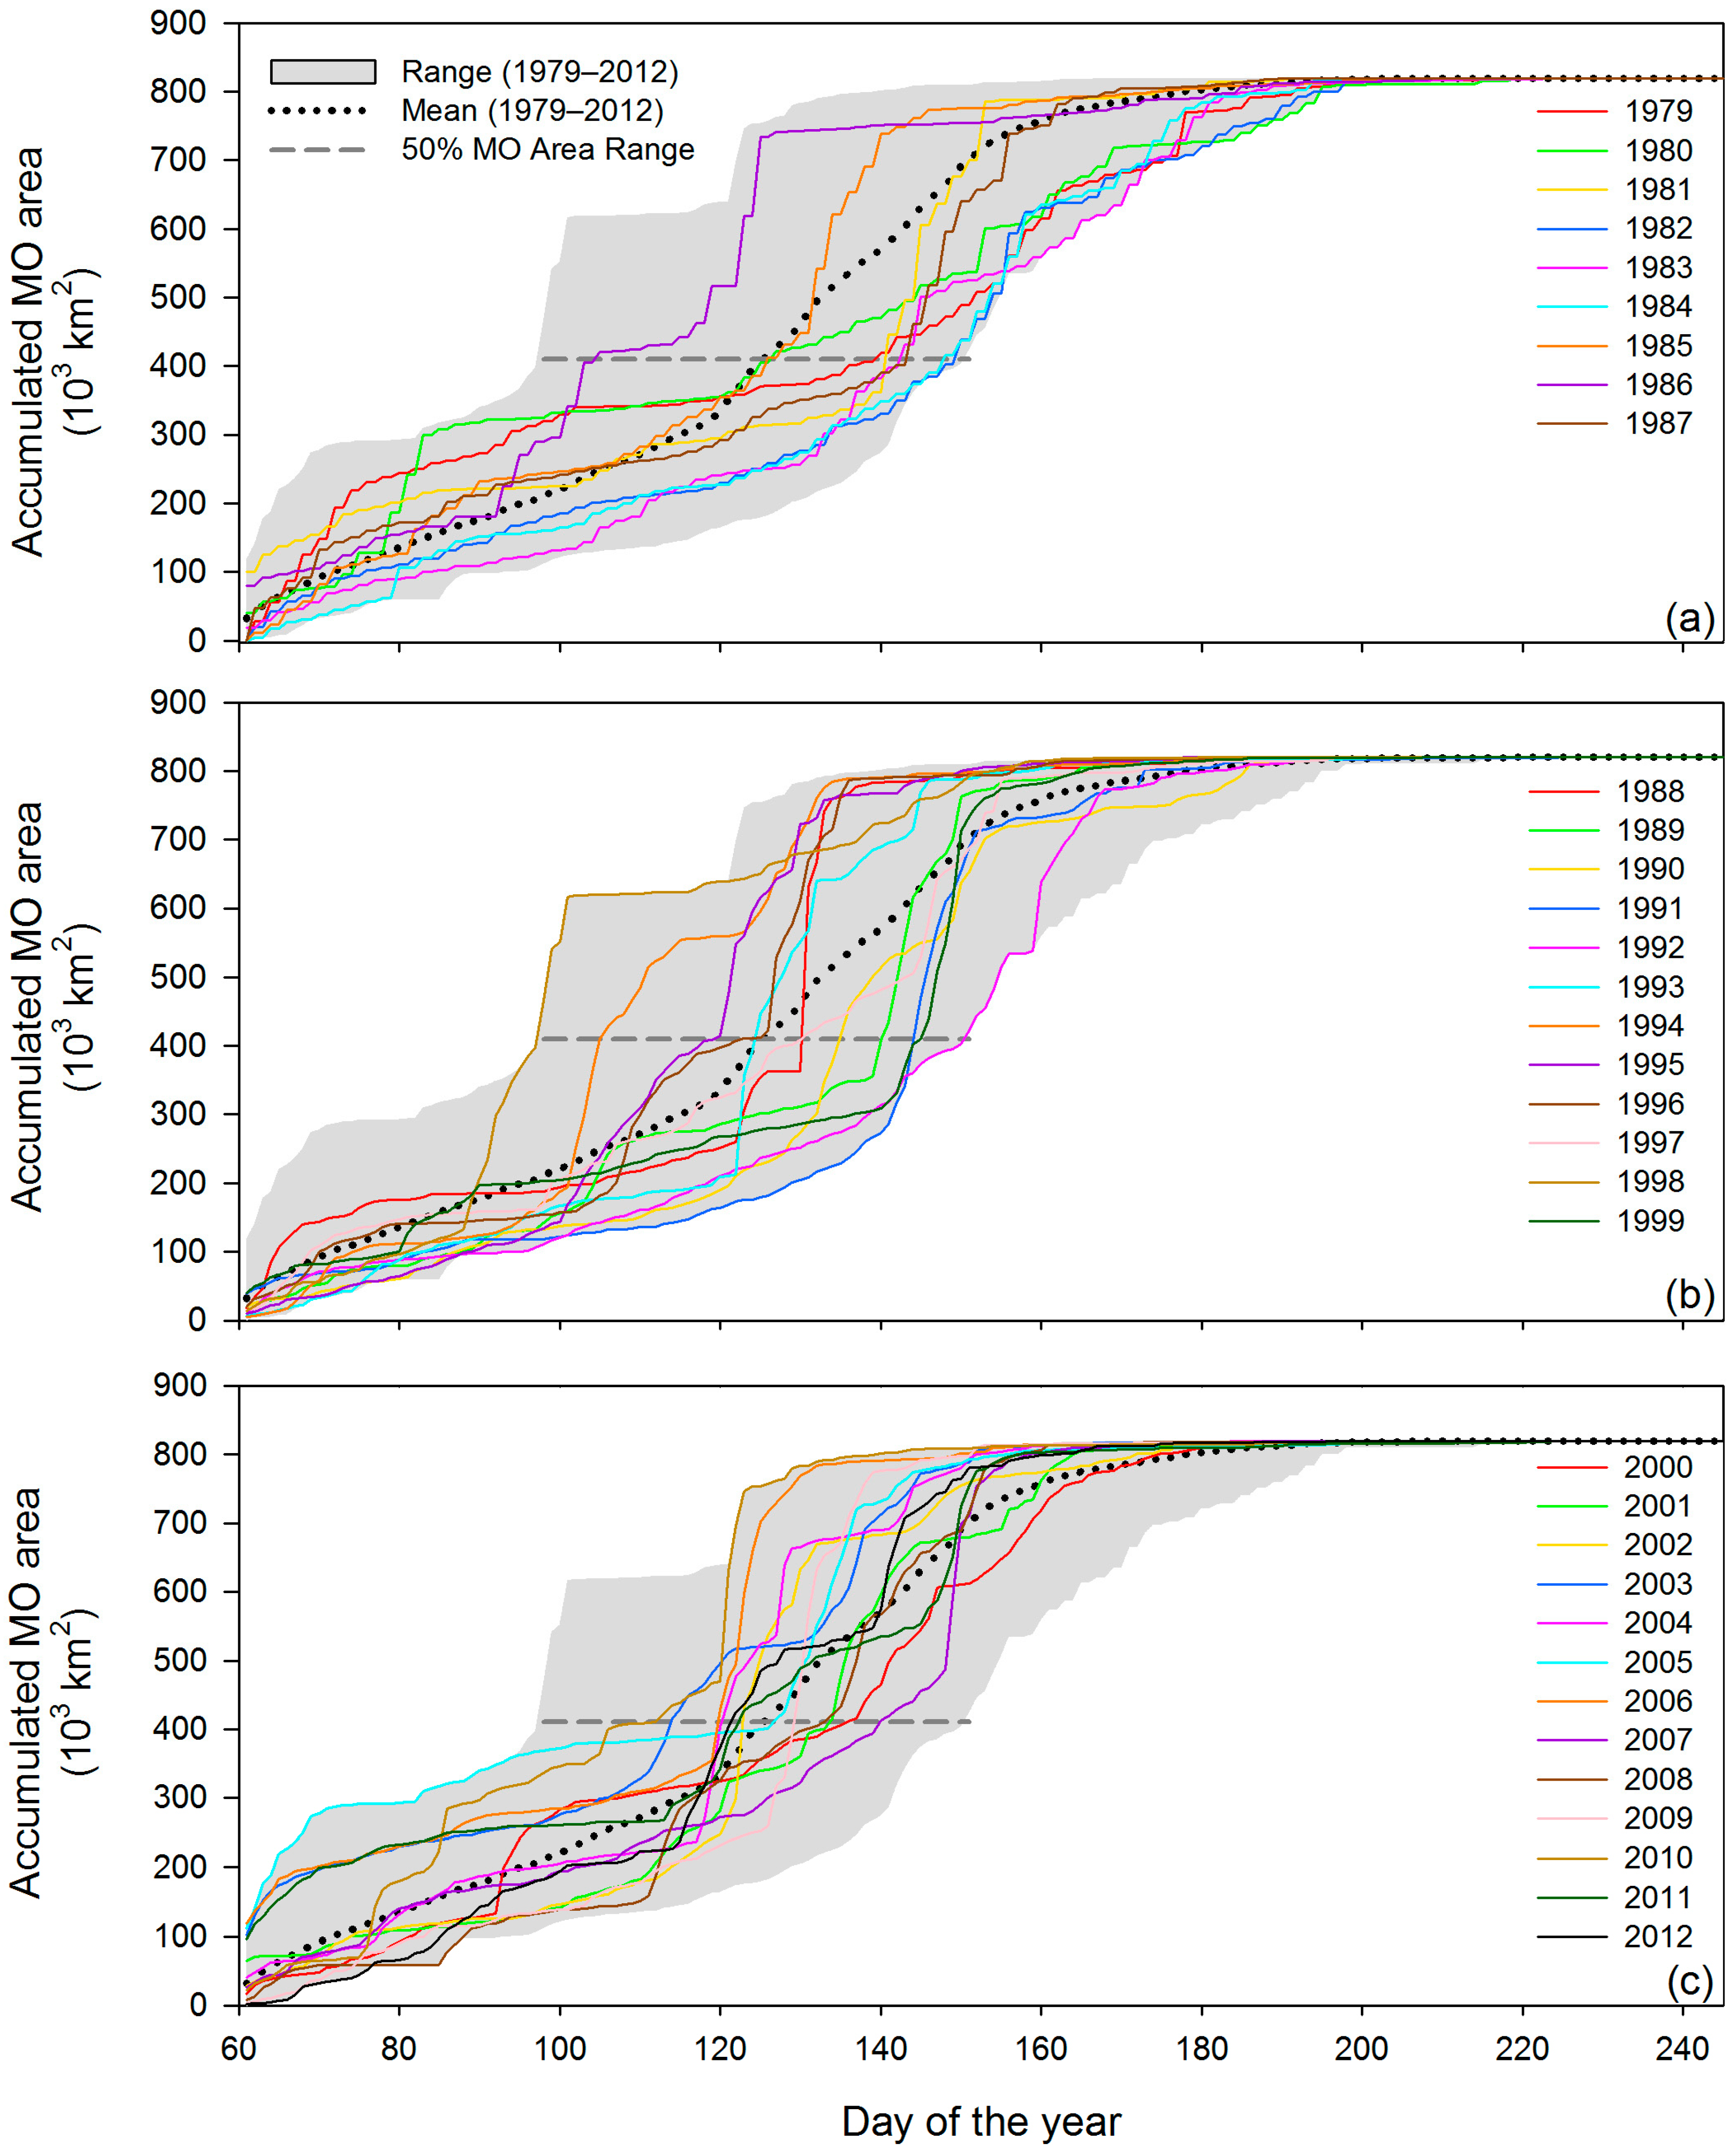
6.2. Variability in Arctic Ocean Sub-Regions


| Region | 50% MO Area Range (Days) | Mean 50% MO Area Date (DOY) |
|---|---|---|
| Arctic Ocean | 30 | 148.8 |
| Barents Sea | 61 | 88.6 |
| Kara Sea | 71 | 134.8 |
| Laptev Sea | 60 | 148.6 |
| East Siberian Sea | 45 | 151.4 |
| Chukchi Sea | 61 | 140.9 |
| Beaufort Sea | 53 | 149.9 |
| Canadian Archipelago | 38 | 151.2 |
| Central Arctic | 28 | 163.7 |
| Baffin Bay | 53 | 129.7 |
| Greenland Sea | 60 | 122.6 |
7. Summary and Conclusions
Supplementary Files
Supplementary File 1Acknowledgments
Author Contributions
Conflicts of Interest
References
- Parkinson, C.L.; Comiso, J.C. On the 2012 record low arctic sea ice cover: Combined impact of preconditioning and an August storm. Geophys. Res. Lett. 2013, 40, 1356–1361. [Google Scholar] [CrossRef]
- Comiso, J.C.; Parkinson, C.L.; Gersten, R.; Stock, L. Accelerated decline in the arctic sea ice cover. Geophys. Res. Lett. 2008, 35. [Google Scholar] [CrossRef]
- Kwok, R.; Cunningham, G.F.; Wensnahan, M.; Rigor, I.; Zwally, H.J.; Yi, D. Thinning and volume loss of the arctic ocean sea ice cover: 2003–2008. J. Geophys. Res. 2009, 114. [Google Scholar] [CrossRef]
- Nghiem, S.V.; Rigor, I.G.; Perovich, D.K.; Clemente-Colón, P.; Weatherly, J.W.; Neumann, G. Rapid reduction of arctic perennial sea ice. Geophys. Res. Lett. 2007, 34. [Google Scholar] [CrossRef]
- Lindsay, R.W.; Zhang, J.; Schweiger, A.; Steele, M.; Stern, H. Arctic sea ice retreat in 2007 follows thinning trend. J. Clim. 2009, 22, 165–176. [Google Scholar] [CrossRef]
- Ogi, M.; Wallace, J.M. Summer minimum arctic sea ice extent and the associated summer atmospheric circulation. Geophys. Res. Lett. 2007, 34. [Google Scholar] [CrossRef]
- Simmonds, I.; Rudeva, I. The great arctic cyclone of August 2012. Geophys. Res. Lett. 2012, 39. [Google Scholar] [CrossRef]
- Wang, L.; Wolken, G.J.; Sharp, M.J.; Howell, S.E.L.; Derksen, C.; Brown, R.D.; Markus, T.; Cole, J. Integrated pan-arctic melt onset detection from satellite active and passive microwave measurements, 2000–2009. J. Geophys. Res. 2011, 116. [Google Scholar] [CrossRef]
- Curry, J.A.; Schramm, J.L.; Ebert, E.E. Sea ice-albedo climate feedback mechanism. J. Clim. 1995, 8, 240–247. [Google Scholar] [CrossRef]
- Perovich, D.K.; Nghiem, S.V.; Markus, T.; Schweiger, A. Seasonal evolution and interannual variability of the local solar energy absorbed by the arctic sea ice—Ocean system. J. Geophys. Res. 2007, 112. [Google Scholar] [CrossRef]
- Perovich, D.K.; Polashenski, C. Albedo evolution of seasonal arctic sea ice. Geophys. Res. Lett. 2012, 39. [Google Scholar] [CrossRef]
- Stroeve, J.C.; Markus, T.; Boisvert, L.; Miller, J.; Barrett, A. Changes in arctic melt season and implications for sea ice loss. Geophys. Res. Lett. 2014, 41. [Google Scholar] [CrossRef]
- Belchansky, G.I.; Douglas, D.C.; Platonov, N.G. Duration of the arctic sea ice melt season: Regional and interannual variability 1979–2001. J. Clim. 2004, 17, 67–80. [Google Scholar] [CrossRef]
- Markus, T.; Stroeve, J.C.; Miller, J. Recent changes in arctic sea ice melt onset, freezeup, and melt season length. J. Geophys. Res. 2009, 114. [Google Scholar] [CrossRef]
- Drobot, S.D.; Anderson, M.R. An improved method for determining snowmelt onset dates over arctic sea ice using scanning multichannel microwave radiometer and special sensor microwave/imager data. J. Geophys. Res. 2001, 106, 24033–24049. [Google Scholar] [CrossRef]
- Smith, D.M. Observation of perennial arctic sea ice melt and freeze-up using passive microwave data. J. Geophys. Res. 1998, 3, 27753–27769. [Google Scholar] [CrossRef]
- Anderson, M.R. Snow melt on sea ice surfaces as determined from passive microwave satellite data. In Large Scale Effects of Seasonal Snow Cover, Proceedings of an International Symposium Held During the XIXth General Assembly of the International Union of Geodesy and Geophysics, Vancouver, BC, Canada, 9–22 August 1987; pp. 329–342.
- Anderson, M.R.; Drobot, S.D. Spatial and temporal variability in snowmelt onset over arctic sea ice. Ann. Glaciol. 2001, 33, 74–78. [Google Scholar] [CrossRef]
- Drobot, S.D.; Anderson, M.R. Comparison of interannual snowmelt-onset dates with atmospheric conditions. Ann. Glaciol. 2001, 33, 79–84. [Google Scholar] [CrossRef]
- Serreze, M.C.; Maslanik, J.A.; Key, J.R.; Kokaly, R.F.; Robinson, D.A. Diagnosis of the record minimum in arctic sea ice area during 1990 and associated snow cover extremes. Geophys. Res. Lett. 1995, 22, 2183–2186. [Google Scholar] [CrossRef]
- Bliss, A.C.; Anderson, M.R. Daily accumulated area of snow melt onset on arctic sea ice. In Proceedings of the American Geophysical Union fall meeting, San Francisco, CA, USA, 3–7 December 2012.
- Anderson, M.R.; Bliss, A.C.; Drobot, S.D. Snow Melt Onset over Arctic Sea Ice from SMMR and SSM/I-SSMIS Brightness Temperatures; Version 3.0 (1979–2012); NASA DAAC at the National Snow and Ice Data Center: Boulder, CO, USA, 2014. [Google Scholar]
- National Snow and Ice Data Center. Documentation: Polar Stereographic Projection and Grid. Available online: https://nsidc.org/data/polar_stereo/ps_grids.html (accessed on 28 March 2014).
- Stroeve, J.; Maslanik, J.; Li, X. An intercomparison of DMSP F11- and F13-Derived sea ice products. Remote Sens. Environ. 1998, 64, 132–152. [Google Scholar] [CrossRef]
- Abdalati, W.; Steffen, K.; Otto, C.; Jezek, K.C. Comparison of brightness temperatures from SSMI instruments on the DMSP F8 and F11 satellites for Antarctica and the Greenland ice sheet. Int. J. Remote Sens. 1995, 16, 1223–1229. [Google Scholar] [CrossRef]
- Jezek, K.C.; Merry, C.; Cavalieri, D.; Grace, S.; Bedner, J.; Wilson, D.; Lampkin, D. Comparison Between SMMR and SSM/I Passive Microwave Data Collected Over the Antarctic Ice Sheet; Byrd Polar Research Center Technical Report, no. 91–03; The Ohio State University: Columbus, OH, USA, 1991. [Google Scholar]
- Meier, W. (NASA Goddard Space Flight Center Cryospheric Sciences Laboratory, Greenbelt, MD, USA). Provided correlation coefficients derived from data DMSP F13–F17 satellite overlap periods to adjust passive microwave brightness temperatures used in the calculation of melt onset dates, 2011.
- Livingstone, C.E.; Singh, K.P.; Gray, L. Seasonal and regional variations of active/passive microwave signatures of sea ice. IEEE Trans. Geosci. Remote Sens. 1987, GE-25, 159–172. [Google Scholar] [CrossRef]
- Meier, W.N.; Stroeve, J.; Fetterer, F. Wither arctic sea ice? A clear signal of decline regionally, seasonally and extending beyond the satellite record. Ann. Glaciol. 2007, 46, 428–434. [Google Scholar]
- Parkinson, C.L.; Cavalieri, D.J.; Gloersen, P.; Zwally, H.J.; Comiso, J.C. Arctic sea ice extents, areas, and trends, 1978–1996. J. Geophys. Res. 1999, 104, 20837–20856. [Google Scholar] [CrossRef]
- Kalnay, E.; Kanamitsu, M.; Kistler, R.; Collins, W.; Deaven, D.; Gandin, L.; Iredell, M.; Saha, S.; White, G.; Woollen, J.; et al. The NCEP/NCAR 40-year reanalysis project. Bull. Am. Meteor. Soc. 1996, 77, 437–471. [Google Scholar] [CrossRef]
- The NCEP/NCAR Reanalysis Project at the NOAA/ESRL Physical Sciences Division. Available online: http://www.esrl.noaa.gov/psd/ (accessed on 3 October 2014).
- Screen, J.A.; Simmonds, I. The central role of diminishing sea ice in recent arctic temperature amplification. Nature 2010, 464, 1334–1337. [Google Scholar] [CrossRef]
- Serreze, M.C.; Barrett, A.P.; Stroeve, J.C.; Kindig, D.N.; Holland, M.M. The emergence of surface-based arctic amplification. Cryosphere 2009, 3, 11–19. [Google Scholar] [CrossRef]
- Serreze, M.C.; Francis, J.A. The arctic amplification debate. Clim. Chang. 2006, 76, 241–264. [Google Scholar] [CrossRef]
- Bennartz, R.; Shupe, M.D.; Turner, D.D.; Walden, V.P.; Steffen, K.; Cox, C.J.; Kulie, M.S.; Miller, N.B.; Pettersen, C. July 2012 Greenland melt extent enhanced by low-level liquid clouds. Nature 2013, 496, 83–86. [Google Scholar] [CrossRef] [PubMed]
- Crane, R.G.; Anderson, M.R. Springtime microwave emissivity changes in the southern Kara Sea. J. Geophys. Res. 1994, 99, 14303–14309. [Google Scholar] [CrossRef]
© 2014 by the authors; licensee MDPI, Basel, Switzerland. This article is an open access article distributed under the terms and conditions of the Creative Commons Attribution license (http://creativecommons.org/licenses/by/4.0/).
Share and Cite
Bliss, A.C.; Anderson, M.R. Daily Area of Snow Melt Onset on Arctic Sea Ice from Passive Microwave Satellite Observations 1979–2012. Remote Sens. 2014, 6, 11283-11314. https://0-doi-org.brum.beds.ac.uk/10.3390/rs61111283
Bliss AC, Anderson MR. Daily Area of Snow Melt Onset on Arctic Sea Ice from Passive Microwave Satellite Observations 1979–2012. Remote Sensing. 2014; 6(11):11283-11314. https://0-doi-org.brum.beds.ac.uk/10.3390/rs61111283
Chicago/Turabian StyleBliss, Angela C., and Mark R. Anderson. 2014. "Daily Area of Snow Melt Onset on Arctic Sea Ice from Passive Microwave Satellite Observations 1979–2012" Remote Sensing 6, no. 11: 11283-11314. https://0-doi-org.brum.beds.ac.uk/10.3390/rs61111283