Use of Satellite SAR for Understanding Long-Term Human Occupation Dynamics in the Monsoonal Semi-Arid Plains of North Gujarat, India

Abstract
:
1. Introduction
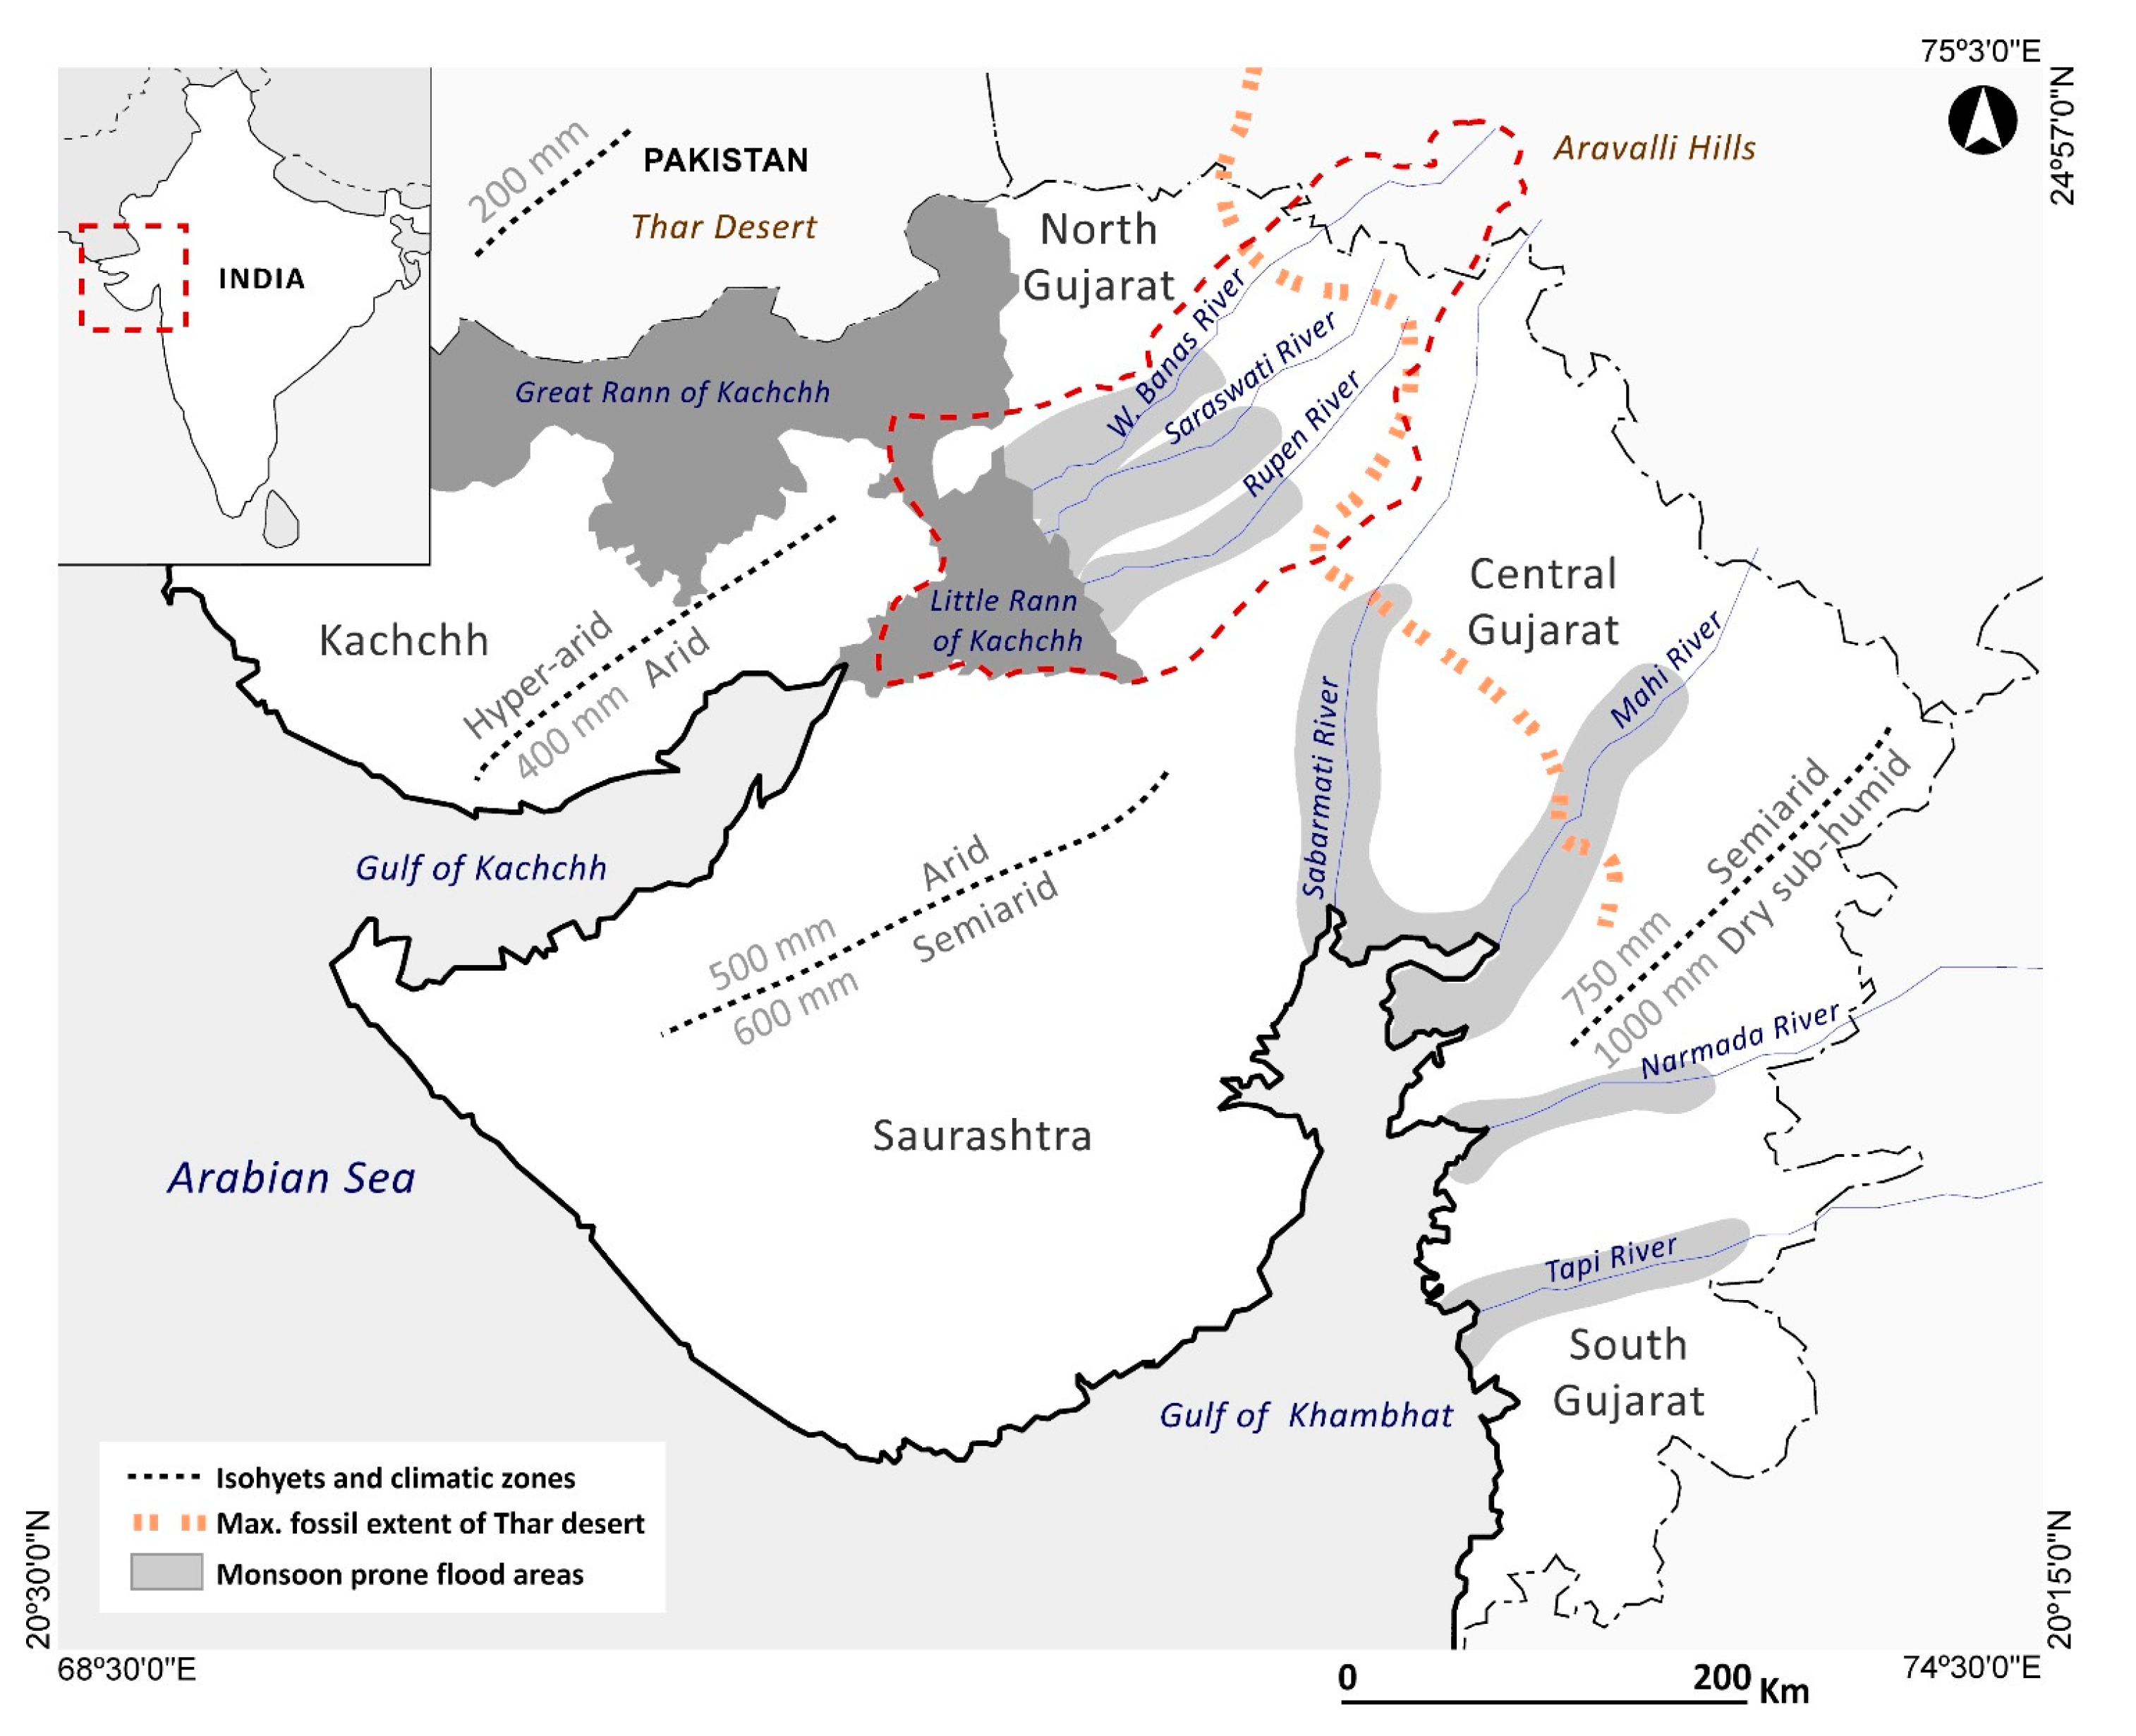
2. Study Area: Regional Settings and Modern Landscape Dynamics


3. Materials and Methods
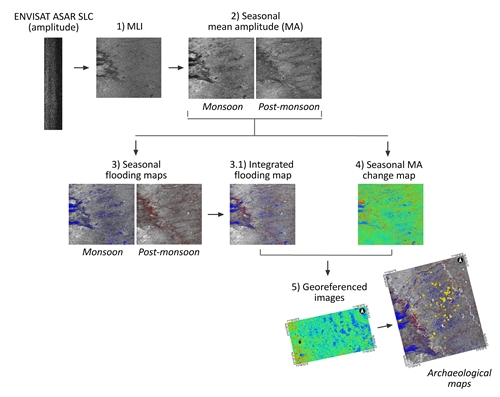
3.1. Data Processing


3.2. Limitations of Using Seasonal MA Scenes

| Yearly Seasonal Subdivision | Average Precipitation (mm) | ||
|---|---|---|---|
| (1871–2011) | |||
| Mean | Median | Stdv | |
| June to September (JJAS) Monsoon | 1107 | 1040 | 492 |
| October to January (ONDJ) Post-monsoon | 50 | 25 | 61 |
| February to May (FMAM) Dry season | 30 | 11 | 54 |
| Seasonal Mean Precipitation (mm) for ENVISAT Life Mission (2002–2011) | |||
|---|---|---|---|
| ENVISAT Mission Years | Acquired Scenes | Monsoon | Post-Monsoon |
| 2002 | 850 | 6 | |
| 2003 | 1490 | 10 | |
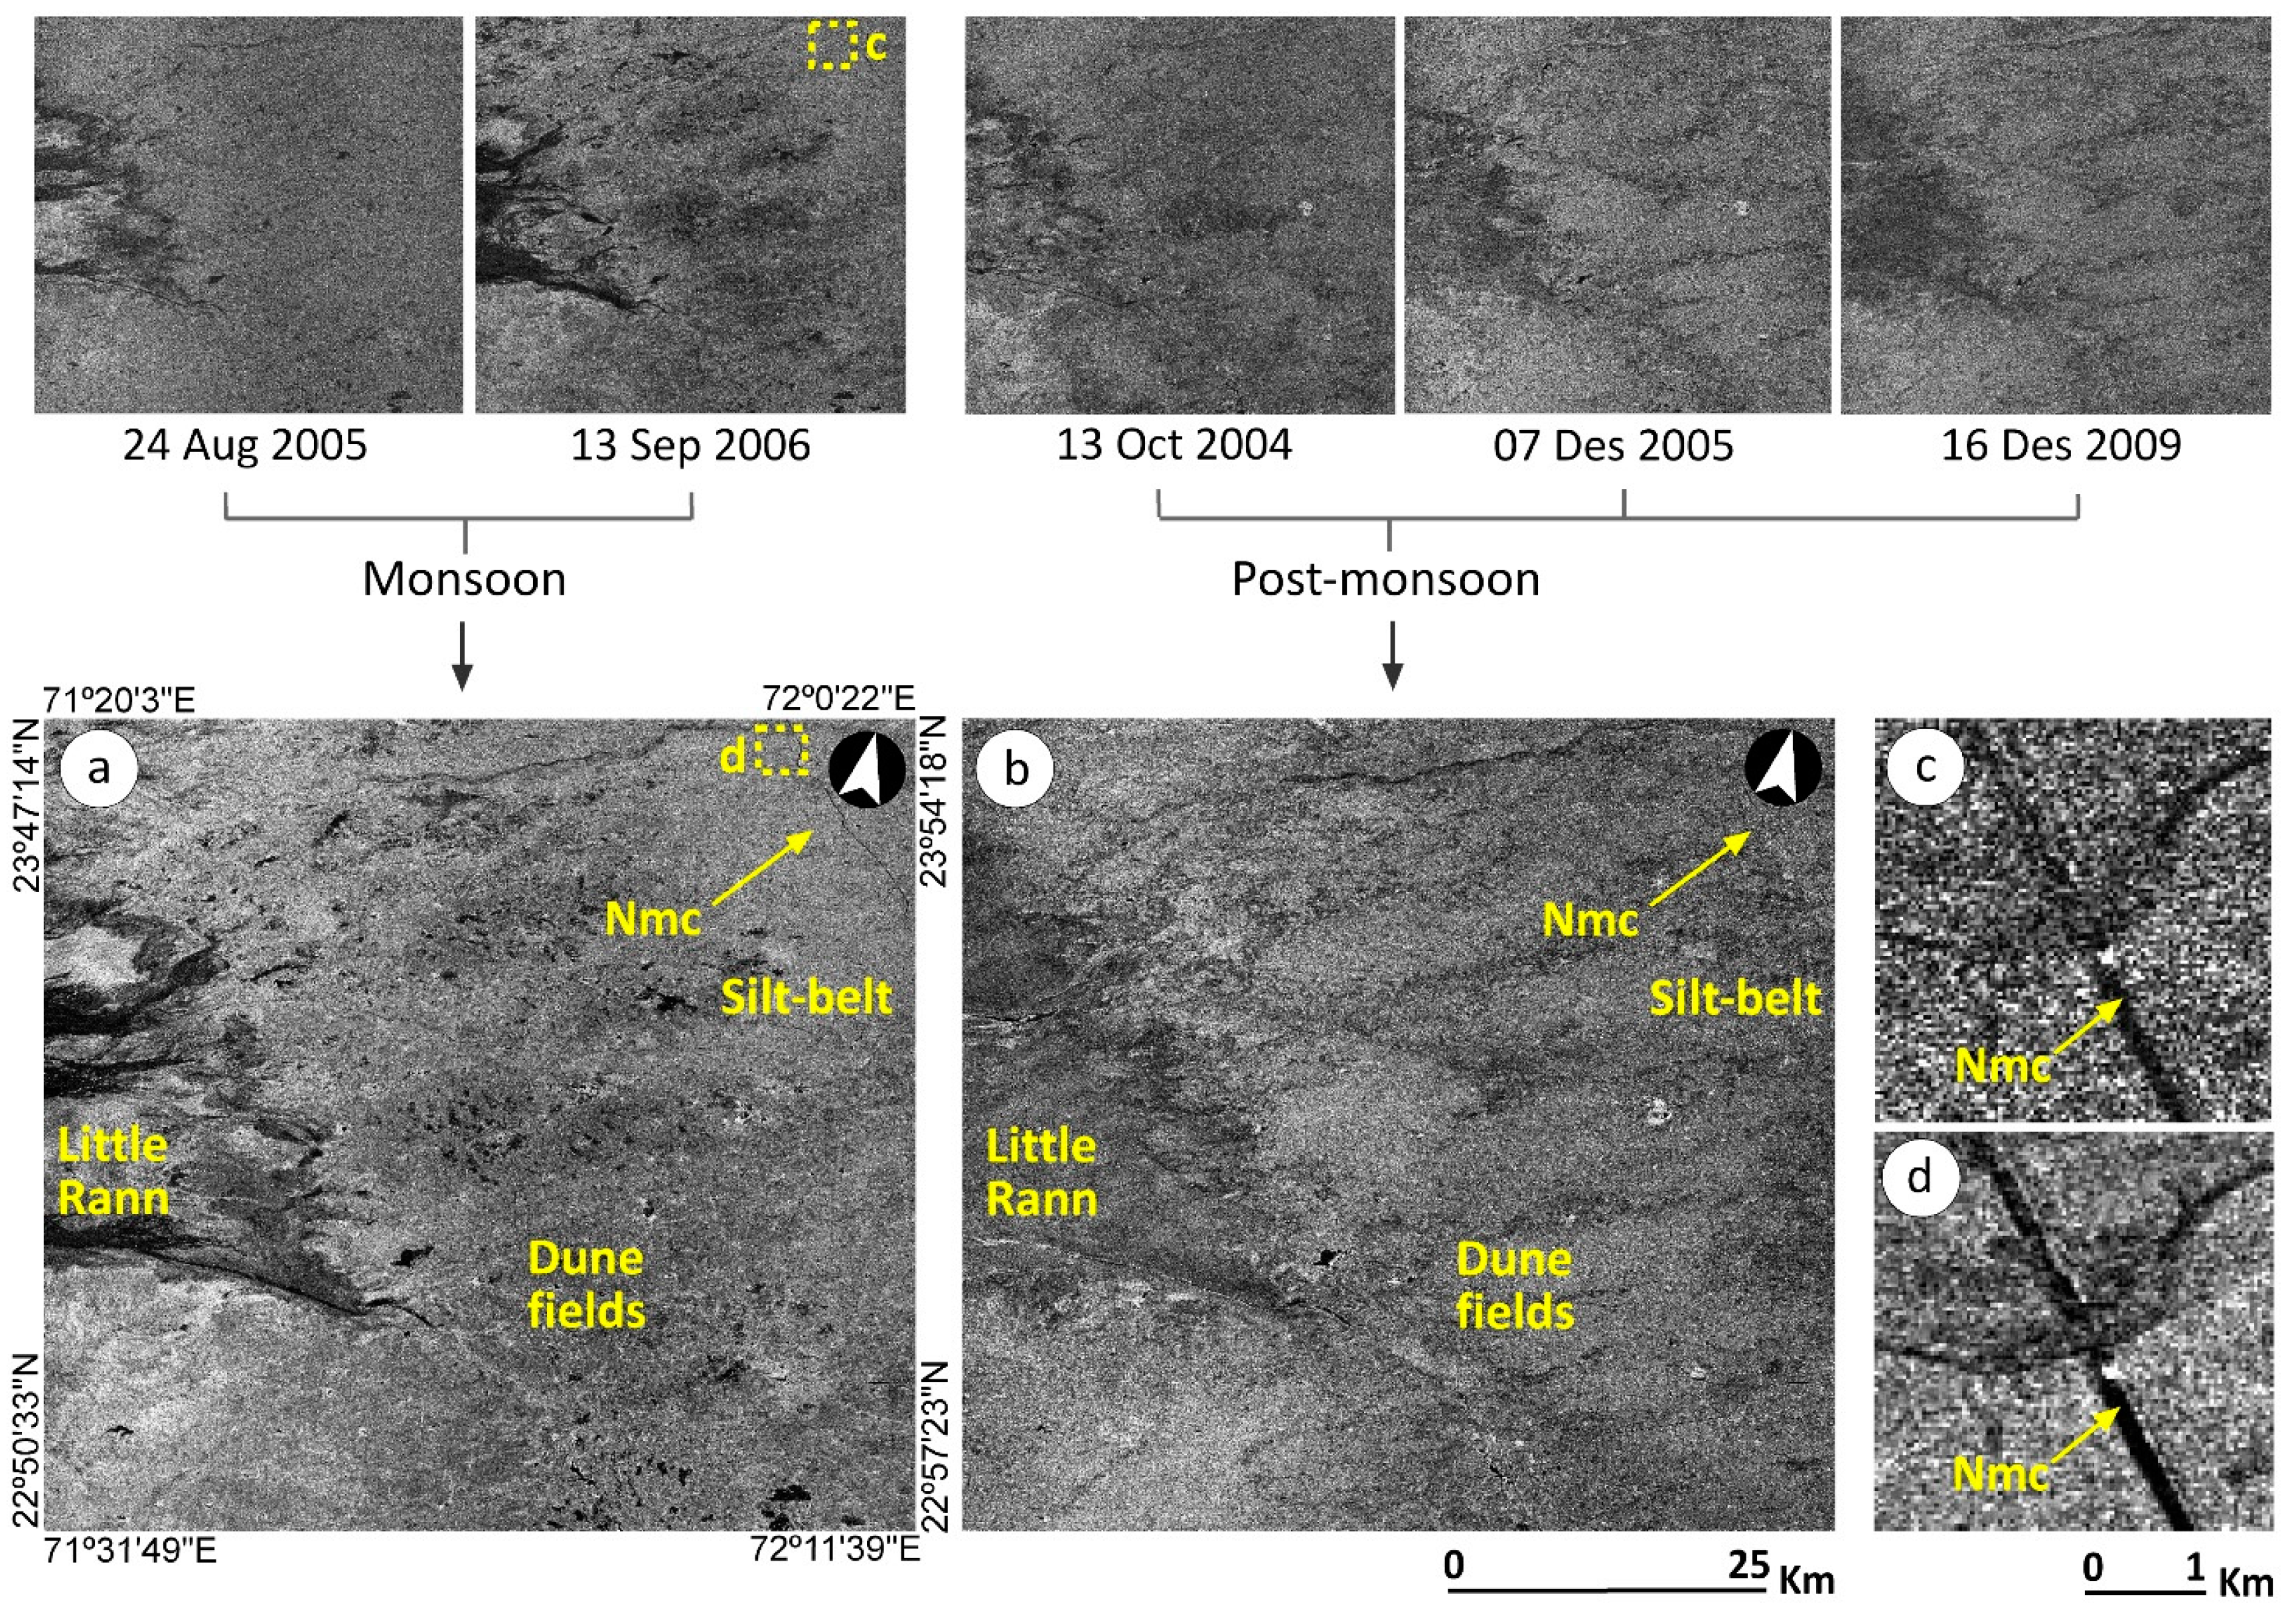
| 2004 | 13 Oct | 984 | 50 |
| 2005 | 24 Aug; 13 Dec | 1426 | 4 |
| 2006 | 13 Sep | 1692 | 5 |
| 2007 | 2346 | 7 | |
| 2008 | 1379 | 37 | |
| 2009 | 16 Dec | 1414 | 9 |
| 2010 | 2235 | 116 | |
| 2011 | 1641 | 6 | |
3.3. Empirical MA Threshold for Identification of Flooded Areas

3.4. Backscattering Signal Seasonal Change
3.5. Georeferencing of Subsets of Interest
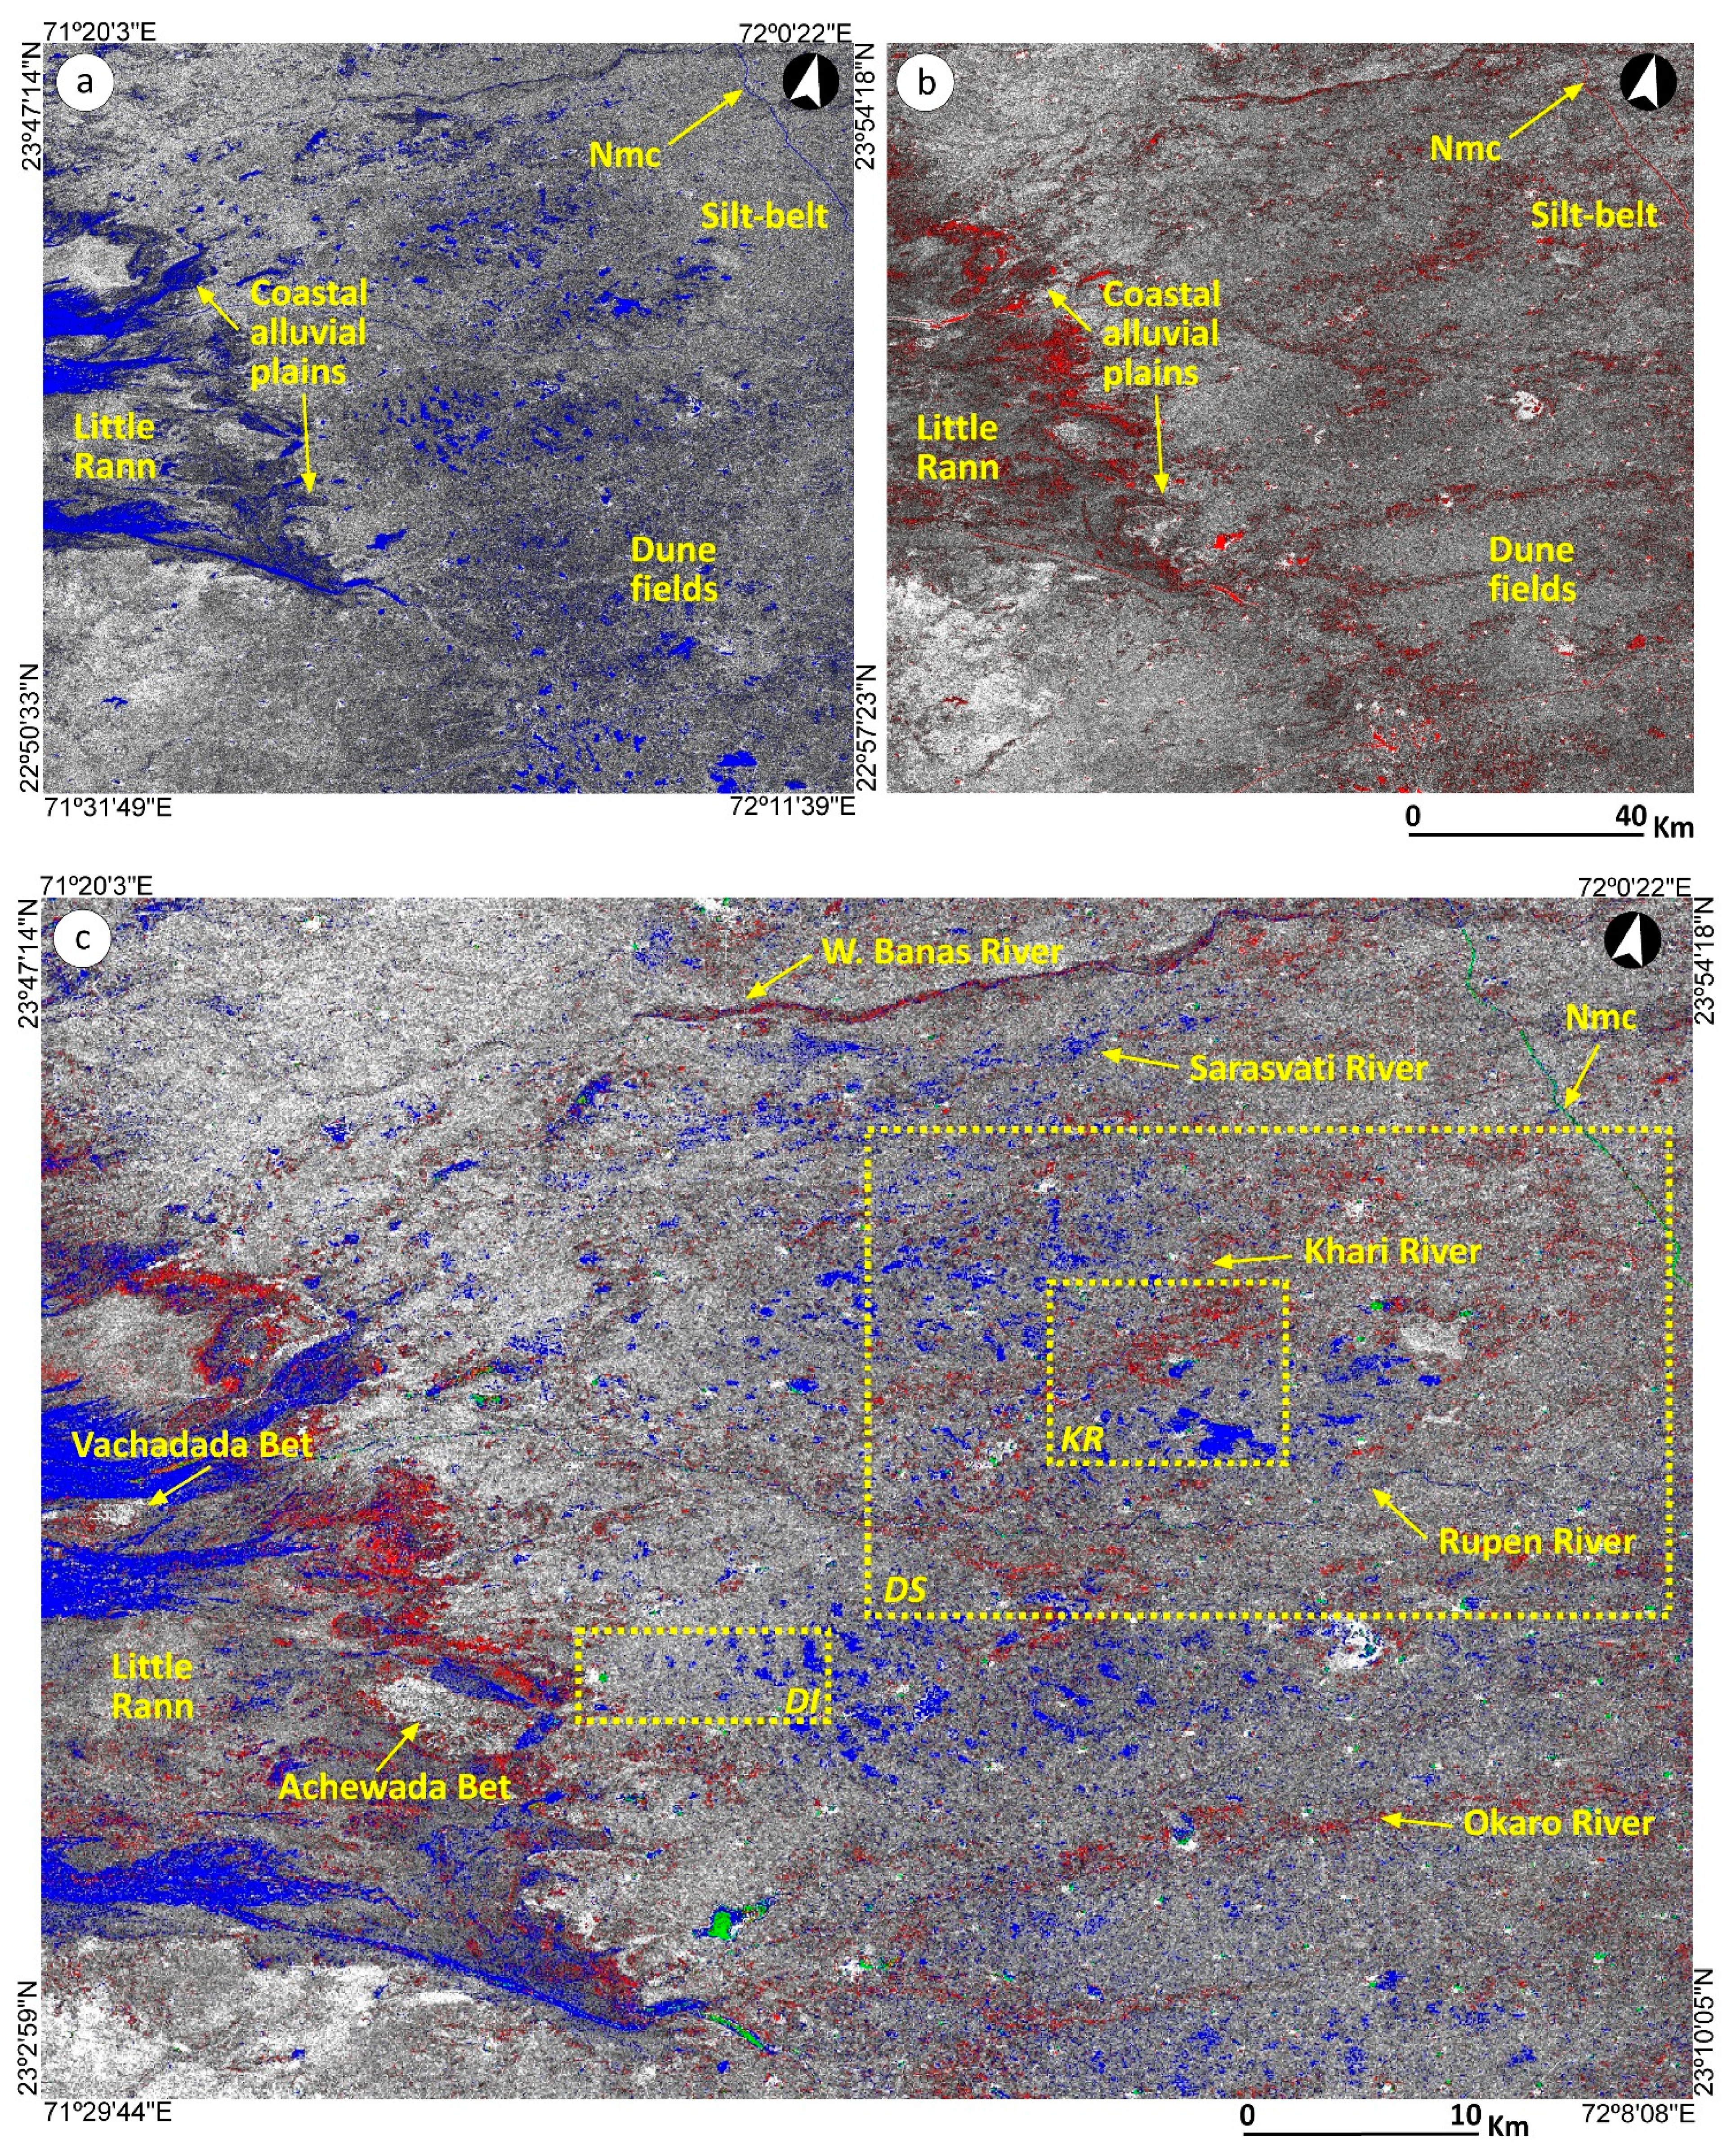
4. Results: Regional and Local Observations of Hydrological Dynamics
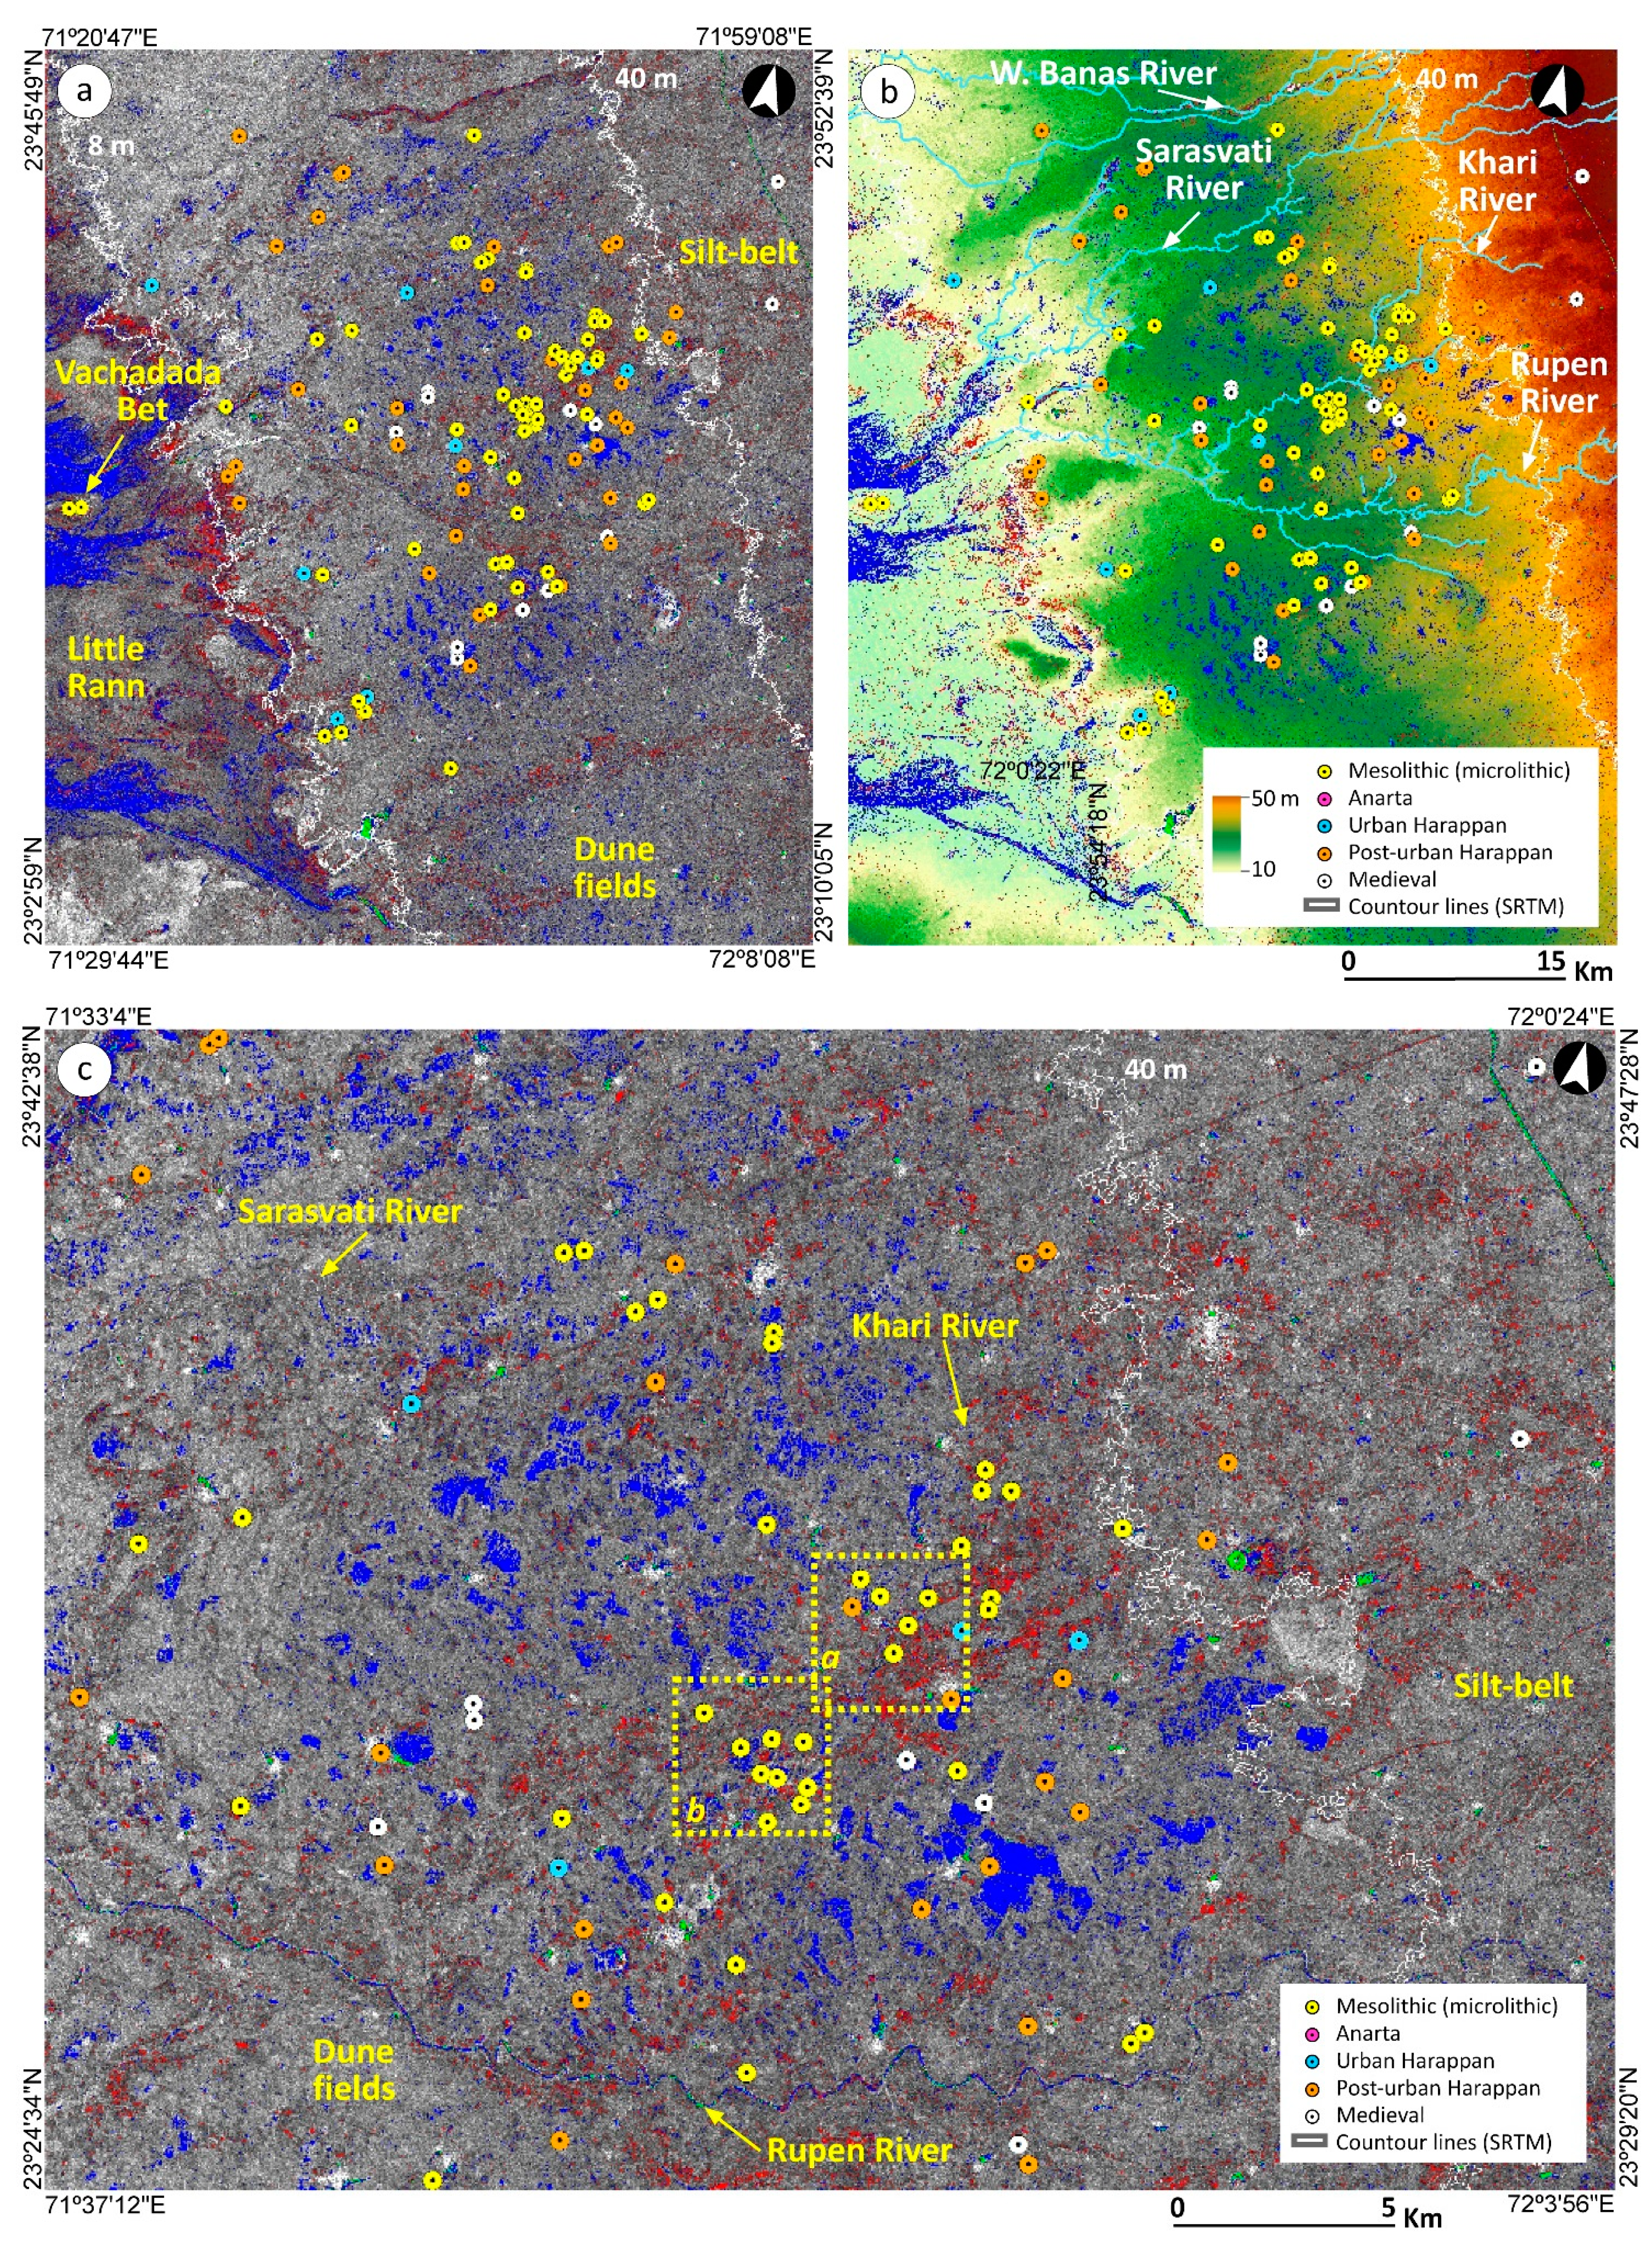
- Khari River (KR): This area integrates the Khari River basin area (a left bank tributary of the Rupen River) and is characterised by the presence of well-preserved dome dunes. This area has been largely explored in consecutive archaeological missions and contains several archaeological sites and scatters of dispersed materials.
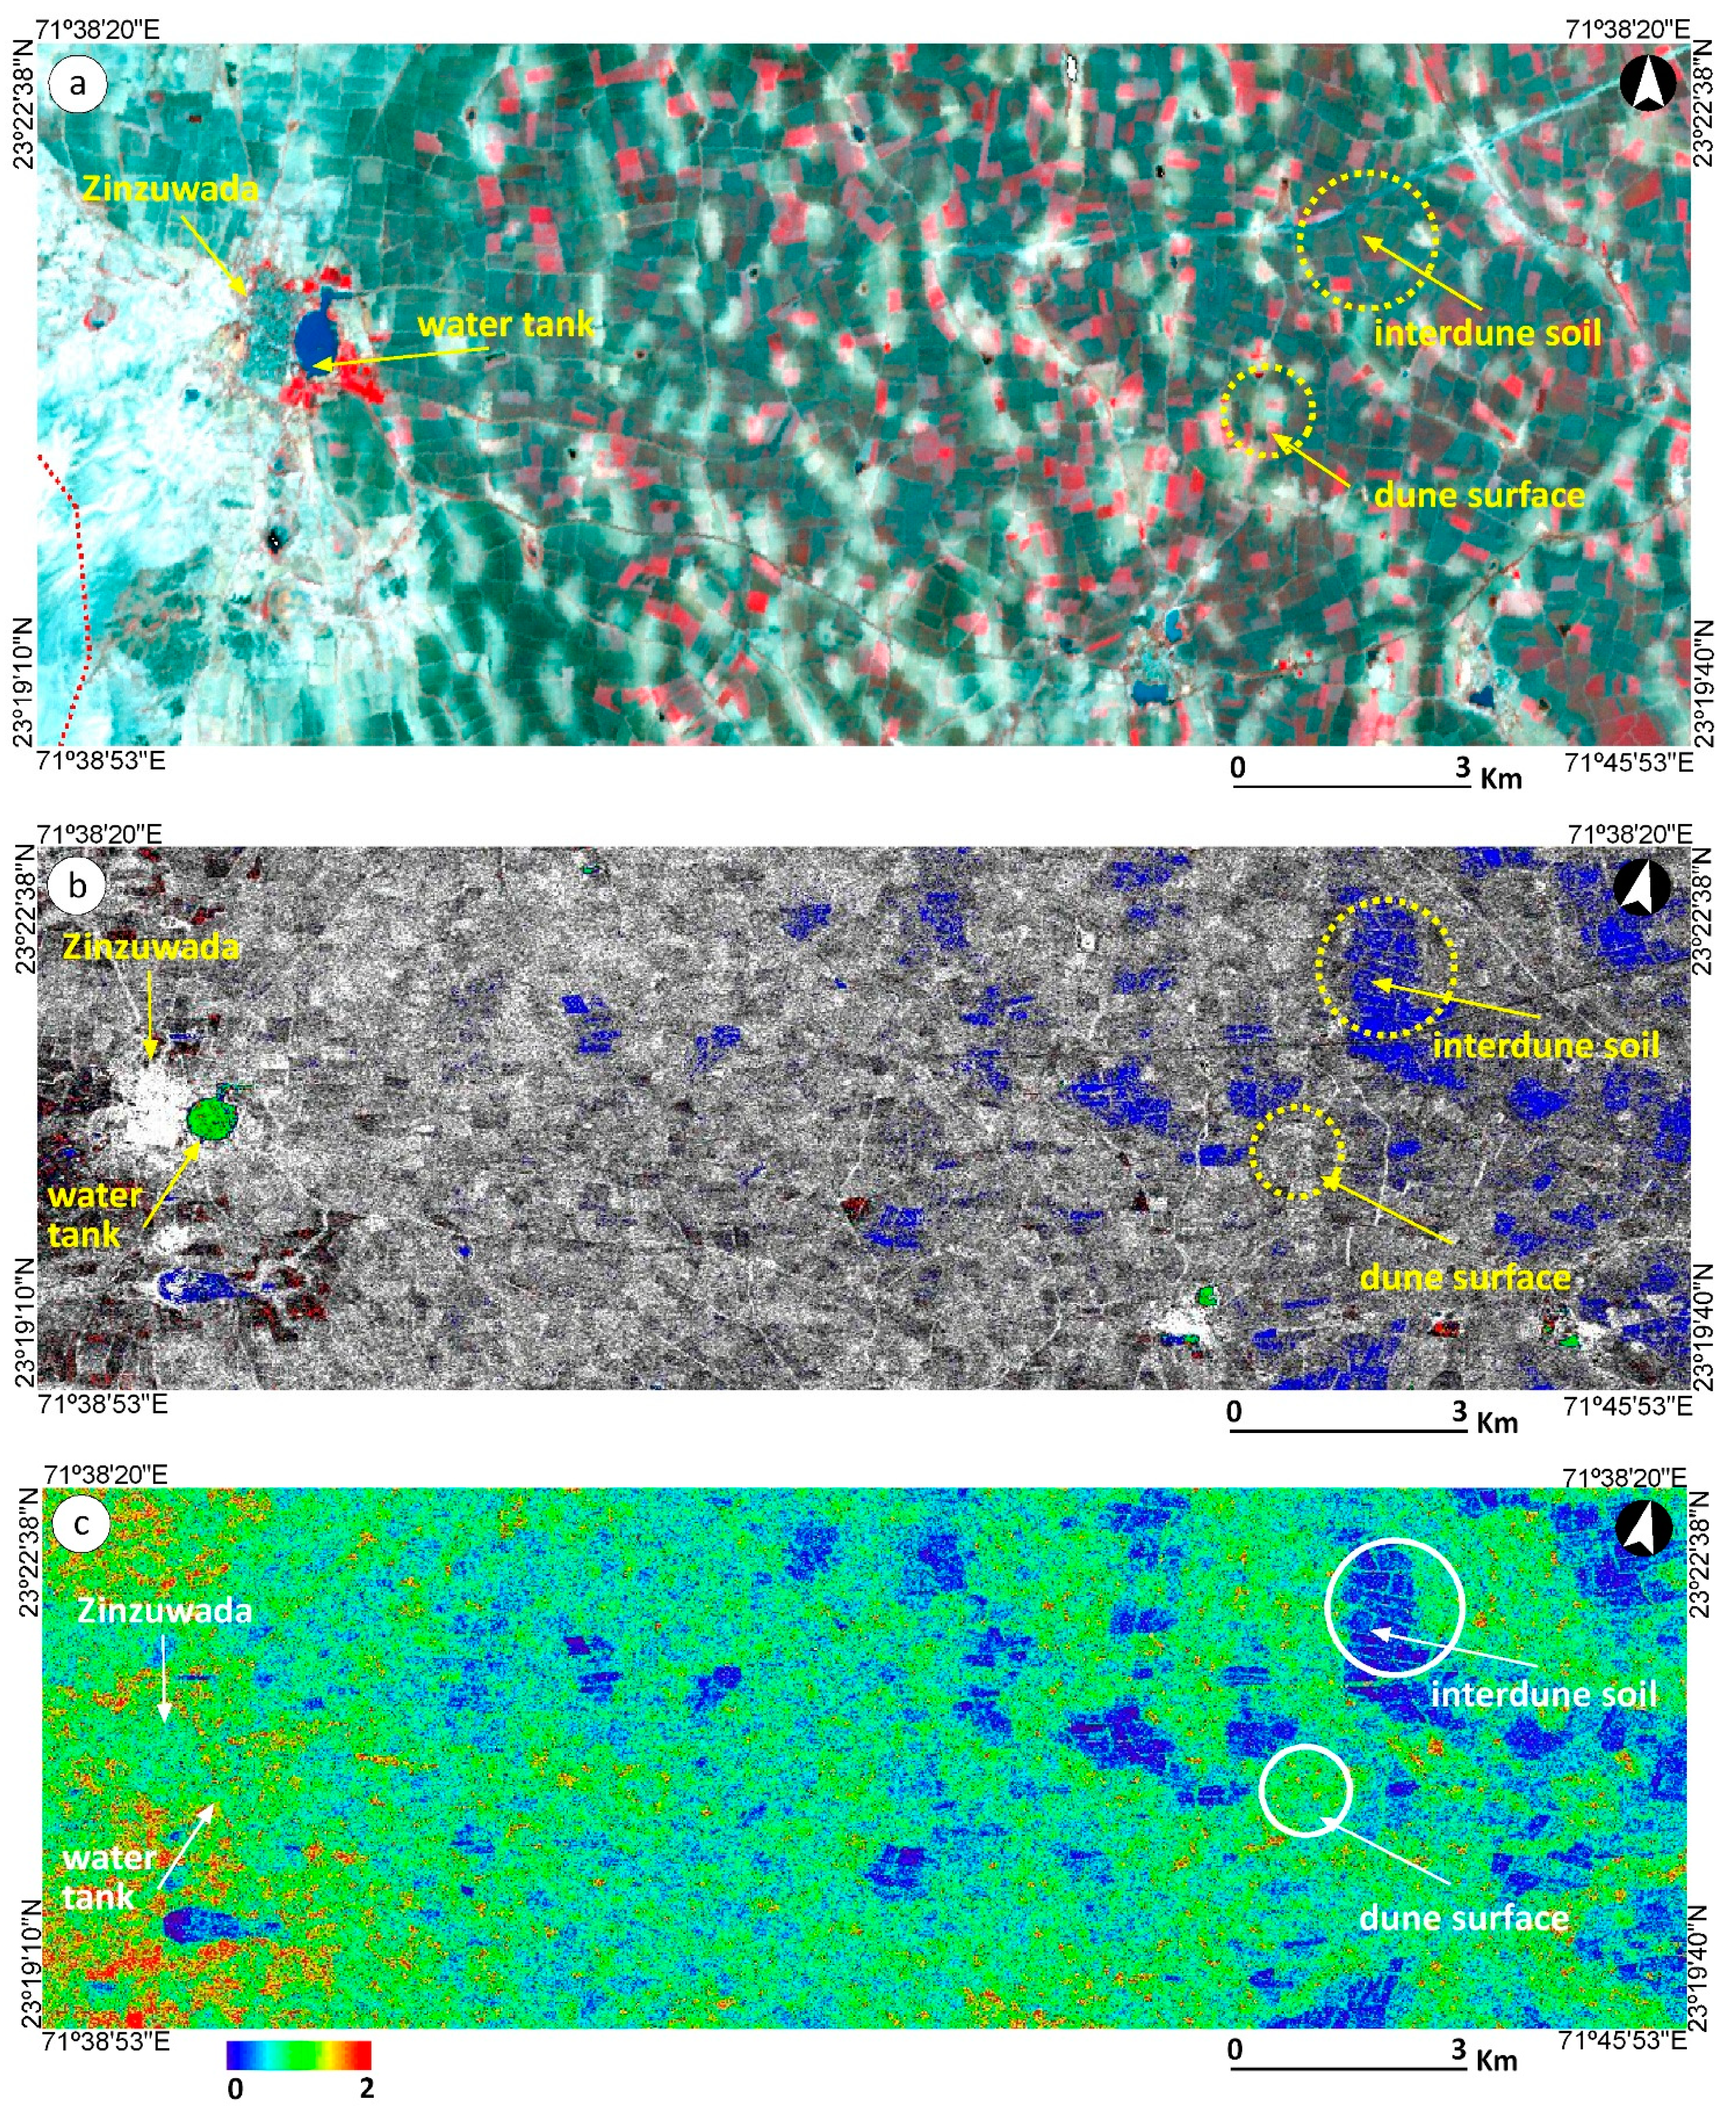
- Dune and interdune fields (DI): coastal area with fossilized dunes near Zinzuwada village. Despite the well-preserved linear dunes and fertile interdunes, to date no archaeological evidence has been found in this area.
- Dune fields/Silt-belt (DS): This subset includes the lower Silt-belt alluvial plains (between the Narmada main canal and the WCBMF boundary) and the dune and interdune fields located between the eastern banks of the Saraswati River and the western banks of the Rupen River.

4.1. Little Rann of Kachchh
4.2. River Catchment Areas
4.3. Village Tanks and Lakes

4.4. Interdune Waterlogging

5. Discussion
5.1. Tectonic Influence and Modern Disturbances
- In the Silt-belt, unconfined aquifers and permeable silty soils favour water infiltration and water table recharge, reducing run-off and increasing soil pedogenesis.
- In the dune/interdune fields, rain falling on impermeable saturated soils runs off.
- River basins act as ecological corridors between the two areas, with presence of humid soils along the watersheds independently of the surrounding context.
5.2. Implications for Archaeology


6. Conclusions
Acknowledgements
Author Contributions
Conflicts of Interest
References
- Agrawal, D.P.; Pande, B.M. Ecology and Archaeology of Western India; Naurang Rai: Anand Nagar, India, 1977. [Google Scholar]
- Allchin, R.; Allchin, B. Pathways to settled life: The Mesolithic and early Neolithic. In The Rise of Civilization in India and Pakistan; Cambridge University Press: Cambridge, UK, 1982. [Google Scholar]
- Fuller, D.Q.; Madella, M. Issues in Harappan archaeology: Retrospect and prospect. In Protohistory: Archaeology of the Harappa Civilization; Settar, R., Korisettar, R., Eds.; Manohar: Delhi, India, 2002; pp. 317–390. [Google Scholar]
- Madella, M.; Fuller, D.Q. Palaeoecology and the Harappan civilisation of South Asia: A reconsideration. Quat. Sci. Rev. 2006, 25, 1283–1301. [Google Scholar]
- Farooqui, A.; Gaur, A.S.; Prasad, V. Climate, vegetation and ecology during Harappan period: Excavations at Kanjetar and Kaj, mid-Saurashtra coast, Gujarat. J. Archaeol. Sci. 2013, 40, 2631–2647. [Google Scholar] [CrossRef]
- Thomas, K.D. Minimizing risk? Approaches to pre-Harappan human ecology on the north-west margin of the Greater Indus system. In Indus Ethnobiology: New Perspectives from the Field; Weber, S.A., Belcher, W.R., Eds.; Lexington Books: Lanham, MD, USA, 2003; pp. 397–430. [Google Scholar]
- Meadow, R. The origins and spread of agriculture and pastoralism in northwestern South Asia. In The Origins and Spread of Agriculture and Pastoralism in Eurasia; Harris, D.R., Ed.; UCL Press: London, UK, 1996; pp. 390–412. [Google Scholar]
- Khadkikar, A.S.; Mathew, G.; Malik, J.N.; Gundu Rao, T.K.; Chowgaonkar, M.P.; Merh, S.S. The influence of the south-west Indian monsoon on continental deposition over the past 130 kyr, Gujarat, western India. Terra Nova 1999, 11, 273–277. [Google Scholar] [CrossRef]
- Chamyal, L.S.; Maurya, D.M.; Raj, R. Fluvial systems of the drylands of western India: A synthesis of Late Quaternary environmental and tectonic changes. Quat. Int. 2003, 104, 69–86. [Google Scholar] [CrossRef]
- Sharma, C.S.; Behera, M.D.; Mishra, A.; Panda, S.N. Assessing flood induced land-cover changes using remote sensing and fuzzy approach in Eastern Gujarat (India). Water Resour. Manag. 2011, 25, 3219–3246. [Google Scholar] [CrossRef]
- Ajithprasad, P. Holocene adaptations of the Mesolithic and Chalcolithic settlements in north Gujarat. In Monsoon and Civilizations; Yasuda, Y., Shinde, V., Eds.; Roli Books: New Delhi, India, 2004; pp. 115–132. [Google Scholar]
- Ajithprasad, P. Chalcolithic cultural patterns and the early Harappan interaction in Gujarat. In Cultural Relations between the Indus and the Iranian Plateau During the Third Millenium BCE; Osada, T., Witzel, M., Eds.; Harvard Oriental Series: Cambridge, UK, 2011; pp. 11–42. [Google Scholar]
- Rajesh, S.V.; Krishnan, K. Chalcolithic cultures of Gujarat (c. 3950–900 BCE): An aappraisal. In Pracyabodha. Indian Archaeology and Tradition; Mani, B.R., Singhvi, A.K., Kumar, R., Eds.; B.R. Publishing Corporation: New Delhi, India, 2014; pp. 194–205. [Google Scholar]
- Balbo, A.L.; Rondelli, B.; Cecília Conesa, F.; Lancelotti, C.; Madella, M.; Ajithprasad, P.; Conesa, F.C. Contributions of geoarchaeology and remote sensing to the study of Holocene hunter–gatherer and agro-pastoral groups in arid margins: The case of North Gujarat (Northwest India). Quat. Int. 2013, 308–309, 53–65. [Google Scholar] [CrossRef]
- Rajesh, S.V.; Krishnan, K.; Ajithprasad, P.; Sonawane, V.H. Evaluating the Anarta tradition in the light of Material culture from Loteshwar and other sites in Gujarat. Man Environ. 2013, 38, 10–45. [Google Scholar]
- Bhan, K.K. Pastoralism in Late Harappan Gujarat, western India: An ethnoarchaeological approach. In Linguistics, Archaeology and the Human Past; Osada, T., Uesugi, A., Eds.; Research Institute for Humanity and Nature: Kyoto, Japan, 2011; pp. 1–27. [Google Scholar]
- Ajithprasad, P.; Sonawane, V.H. The Harappa culture in North Gujarat: A regional paradigm. In Linguistics, Archaeology and the Human Past; Osada, T., Uesugi, A., Eds.; Research Institute for Humanity and Nature: Kyoto, Japan, 2011; pp. 223–269. [Google Scholar]
- Sonawane, V.H. Early farming communities of Gujarat, India. Indo-Pac. Prehist. Assoc. Bull. 2000, 19, 137–146. [Google Scholar]
- Madella, M.; Ajithprasad, P.; Lancelotti, C.; Rondelli, B.; Balbo, A.L.; French, C.A.I.; Rodríguez, D.; García-Granero, J.J.; Yannito, V.; Rajesh, S.V.; et al. Social and environmental transitions in arid zones: The North Gujarat Archaeological Project—NoGAP. Antiq. Proj. Gallery 2010, 84, 1–4. [Google Scholar]
- Lancelotti, C.; Caracuta, V.; Fiorentino, G.; Madella, M.; Ajithprasad, P. Holocene monsoon dynamics and human occupation in Gujarat: Stable isotopes analyses on plant remains. J. Multidiscip. Stud. Archaeol. 2013, 1, 288–300. [Google Scholar]
- Madella, M.; Rondelli, B.; Lancelotti, C.; Balbo, A.; Zurro, D.; Campillo, X.R.; Stride, S. Introduction to simulating the past. J. Archaeol. Method Theory 2014. [Google Scholar] [CrossRef]
- Conesa, F.C.; Madella, M.; Galiatsatos, N.; Balbo, A.L.; Rajesh, S.V.; Ajithprasad, P. CORONA photographs in monsoonal semi-arid environments: Addressing archaeological surveys and historic landscape dynamics over north Gujarat, India. Archaeol. Prospect. 2014. [Google Scholar] [CrossRef]
- Balbo, A.L.; Rubio-Campillo, X.; Rondelli, B.; Ramírez, M.; Lancelotti, C.; Torrano, A.; Salpeteur, M.; Lipovetzky, N.; Reyes-García, V.; Montañola, C.; et al. Agent-based simulation of Holocene Monsoon precipitation patterns and hunter-gatherer population dynamics in semi-arid environments. J. Archaeol. Method Theory 2014, 21, 426–446. [Google Scholar] [CrossRef]
- Maurya, D.M.; Thakkar, M.G.; Khonde, N.; Chamyal, L.S. Geomorphology of the Little Rann of Kachchh, W. India: Implication for basin architecture and Holocene palaeo-oceanographic conditions. Z. Für Geomorphol. 2009, 53, 69–80. [Google Scholar] [CrossRef]
- Juyal, N.; Chamyal, L.S.; Bhandari, S.; Bhushan, R.; Singhvi, A.K. Continental record of the southwest monsoon during the last 130 ka: Evidence from the southern margin of the Thar Desert, India. Quat. Sci. Rev. 2006, 25, 2632–2650. [Google Scholar] [CrossRef]
- Srivastava, P.; Juyal, N.; Singhvi, A.K.; Wasson, R.J.; Bateman, M.D. Luminescence chronology of river adjustment and incision of Quaternary sediments in the alluvial plain of the Sabarmati River, north Gujarat, India. Geomorphology 2001, 36, 217–229. [Google Scholar] [CrossRef]
- Juyal, N.; Kar, A.; Rajaguru, S.N.N.; Singhvi, A.K. Luminescence chronology of aeolian deposition during the Late Quaternary on the southern margin of Thar Desert, India. Quat. Int. 2003, 104, 87–98. [Google Scholar] [CrossRef]
- Attri, S.D.; Tyagi, A. Climate profile of India; India Meteorological Department: New Delhi, India, 2010. [Google Scholar]
- Singhvi, A.K.; Williams, M.J.; Rajaguru, S.N.; Misra, V.N.; Chawla, S.; Stokes, S.; Chauhan, N.; Francis, T.; Ganjoo, R.K.; Humphreys, G.S. A □200 ka record of climatic change and dune activity in the Thar Desert, India. Quat. Sci. Rev. 2010, 29, 3095–3105. [Google Scholar] [CrossRef]
- Sareen, B.K.; Tandon, S.K.; Bhola, A.M. Slope-deviatory alignment, stream network and lineament orientation of the Sabarmati River system-Neotect. Curr. Sci. 1993, 64, 827–836. [Google Scholar]
- Liu, Z.; Otto-Bliesner, B.; Kutzbach, J.; Li, L.; Shields, S. Coupled climate simulation of the evolution of global monsoons in the Holocene. J. Clim. 2003, 16, 2472–2490. [Google Scholar] [CrossRef]
- McIntosh, J.R. The Ancient Indus Valley: New Perspectives; ABC-CLIO: Santa Barbara, CA, USA, 2008. [Google Scholar]
- Dixit, A.K. Agriculture in a high growth state: Case of Gujarat (1960 to 2006). Econ. Polit. Wkly. 2009, 69, 64–71. [Google Scholar]
- Fishman, R.; Jain, M.; Kishore, A. Patterns of Migration, Water Scarcity and Caste in Rural Northern Gujarat; International Growth Centre: London, UK, 2013. [Google Scholar]
- Ranade, R.; Kumar, M.D.; Management, C.; Projects, L.I. Narmada water for groundwater recharge in north Gujarat. Econ. Political Wkly. 2004, 39, 3510–3513. [Google Scholar]
- Kumar, M.D.; Singhal, L.; Rath, P. Value of groundwater: Case studies in Banaskantha. Econ. Political Wkly. 2004, 39, 3498–3503. [Google Scholar]
- Shah, T.; Bhatt, S.; Shah, R.K.; Talati, J. Groundwater governance through electricity supply management: Assessing an innovative intervention in Gujarat, western India. Agric. Water Manag. 2008, 95, 1233–1242. [Google Scholar] [CrossRef]
- Narula, K.; Fishman, R.; Modi, V.; Polycarpou, L. Addressing the Water Crisis in Gujarat, India; Columbia Water Center: New York, NY, USA, 2011. [Google Scholar]
- Holcomb, D.W.; Shingiray, I. Imaging radar in archaeological investigations: An image processing perspective. In Remote Sensing in Archaeology; Wiseman, J., El-Baz, F., Eds.; Springer: New York, NY, USA, 2007; pp. 11–46. [Google Scholar]
- Hall, O. Remote sensing in social science research. Open Remote Sens. J. 2010, 3, 1–16. [Google Scholar] [CrossRef]
- Lasaponara, R.; Masini, N.; Observation, E. Satellite remote sensing in archaeology: Past, present and future perspectives. J. Archaeol. Sci. 2011, 38, 1995–2002. [Google Scholar] [CrossRef]
- Comer, D.C.; Harrower, M.J. Mapping Archaeological Landscapes from Space; Springer: New York, NY, USA, 2013; pp. 291–313. [Google Scholar]
- Lasaponara, R.; Masini, N. Satellite synthetic aperture radar in archaeology and cultural landscape: An overview. Archaeol. Prospect. 2013, 20, 71–78. [Google Scholar] [CrossRef]
- Oberstadler, R.; Hönsch, H.; Huth, D. Assessment of the mapping capabilities of ERS-1 SAR data for flood mapping: A case study in Germany. Hydrol. Process. 1997, 11, 1415–1425. [Google Scholar] [CrossRef]
- Martinez, J.M.; Le Toan, T. Mapping of flood dynamics and spatial distribution of vegetation in the Amazon floodplain using multitemporal SAR data. Remote Sens. Environ. 2007, 108, 209–223. [Google Scholar] [CrossRef]
- Khan, S.; Hong, Y.; Gourley, J.; Khattak, M.; De Groeve, T. Multi-sensor imaging and space-ground cross-validation for 2010 flood along Indus River, Pakistan. Remote Sens. 2014, 6, 2393–2407. [Google Scholar] [CrossRef] [Green Version]
- Grady, D.O.; Leblanc, M.; Gillieson, D.; O’Grady, D. Use of ENVISAT ASAR Global Monitoring Mode to complement optical data in the mapping of rapid broad-scale flooding in Pakistan. Hydrol. Earth Syst. Sci. 2011, 15, 3475–3494. [Google Scholar] [CrossRef]
- Park, N.; Patel, P.; Srivastava, H.S.; Navalgund, R.R. Use of synthetic aperture radar polarimetry to characterize wetland targets of Keoladeo National Park, Bharatpur, India. Curr. Sci. 2009, 97, 529–537. [Google Scholar]
- Rajawat, A.S.; Verma, P.K.; Nayak, S.; Rajawat, A.S.; Verma, P.K.; Nayak, S. Reconstruction of paleodrainage network in northwest India: Retrospect and prospects of remote sensing based studes. Proc. Indian Natn. Sci. Acad. 2003, 69, 217–236. [Google Scholar]
- Pirasteh, S.; Rizvi, S.M.A.; Ayazi, M.H.; Safari, H.; Ramli, F.M.; Pradhan, B.; Shattri, M.; Mahmoodzadeh, A.; Pirateh, S.; Rizvi, S.M.A.; et al. Using ERS-1 synthetic aperture radar for flood delineation, Bhuj Taluk, Kuchch District-Gujarat, India. Int. Geoinform. Res. Dev. J. 2010, 1, 13–22. [Google Scholar]
- Rajawat, A.S.; Kumar, R.; Murthy, T.V.R.; Haldar, D.; Chakraborty, A.; Kumar, T.; Sneha, R.; Kumar, H.; Mahapatra, M.; Kundu, S. Initial results using RISAT-1 C-band SAR data. Curr. Sci. 2013, 104, 490–501. [Google Scholar]
- Thakker, P.S.; Bhatnagar, G.C.; Rao, M.K.; Raval, M.H. Mapping of palaeo- channels along the river Sabarmati and Banas in Gujarat using Landsat data. In Remote Sensing and Archaeology; Tripathy, A., Ed.; Sundeep Prakashan: New Delhi, India, 2005; pp. 169–175. [Google Scholar]
- Rajani, M.B.; Rajawat, A.S. Potential of satellite based sensors for studying distribution of archaeological sites along palaeo channels: Harappan sites a case study. J. Archaeol. Sci. 2011, 38, 2010–2016. [Google Scholar] [CrossRef]
- Wright, R.; Hritz, C. Satellite remoe sensing imagery: New evidence for site distributions in the upper Indus. In South Asian Archaeology 2007. Prehistoric Periods; Frenez, D., Tosi, M., Eds.; Archaeopress: Oxford, UK, 2013; pp. 315–321. [Google Scholar]
- Sinha, R.; Yadav, G.S.; Gupta, S.; Singh, A.; Lahiri, S.K. Geo-electric resistivity evidence for subsurface palaeochannel systems adjacent to Harappan sites in northwest India. Quat. Int. 2013, 308–309, 66–75. [Google Scholar] [CrossRef]
- Tapete, D.; Cigna, F.; Masini, N; Lasaponara, R. Prospection and monitoring of the archaeological heritage of Nasca, Peru, with ENVISAT ASAR. Archaeol. Prospect. 2013, 20, 133–147. [Google Scholar] [CrossRef]
- Cigna, F.; Tapete, D.; Lasaponara, R.; Masini, N. Amplitude change detection with ENVISAT ASAR to image the cultural landscape of the Nasca region, Peru. Archaeol. Prospect. 2013, 20, 117–131. [Google Scholar] [CrossRef]
- Bartsch, A.; Doubkova, M.; Pathe, C.; Sabel, D.; Wagner, W.; Wolski, P. River flow & wetland monitoring with ENVISAT ASAR Global Mode in the Okavango basin and delta. In Proceedings of the Second IASTED Africa Conference Water Resource Management, Gabarone, Botswana, 8–10 September 2008; pp. 152–156.
- Khan, K.A.; Akhter, G.; Ahmad, Z. Integrated geoscience databanks for interactive analysis and visualization. Int. J. Digit. Earth 2011, 6, 41–49. [Google Scholar]
- Prasad, S.N.; Goyal, S.P.; Rov, P.S.; Singh, S. Changes in wild ass (Equus hemionus khur) habitat conditions in Little Rann of Kutch, Gujarat from a remote sensing perspective. Int. J. Remote Sens. 1994, 15, 3155–3164. [Google Scholar] [CrossRef]
- Sethi, A. Gujarat: National Disaster Risk Reduction Portal; National Institute of Disaster Management: New Delhi, India, 2014. [Google Scholar]
- Agarwal, A.; Narain, S. Making water management everybody’s business: Water harvesting and rural development in India. Gatekeep. Ser. 1999, 87, 3–20. [Google Scholar]
- Babu, P.V. Geomorphology if the cambay basin. J. Indian Soc. Photo-Interpret. 1977, 5, 9–17. [Google Scholar]
- Bhan, K.K. Cultural development of the prehistoric period in north Gujarat with reference to western India. South Asian Stud. 1994, 10, 71–90. [Google Scholar] [CrossRef]
- Patel, A.K. Occupational histories, settlements, and subsistence in western India: What bones and genes can tell us about the origins and spread of Pastoralism. Anthropozoologica 2009, 44, 173–188. [Google Scholar] [CrossRef]
© 2014 by the authors; licensee MDPI, Basel, Switzerland. This article is an open access article distributed under the terms and conditions of the Creative Commons Attribution license (http://creativecommons.org/licenses/by/4.0/).
Share and Cite
Conesa, F.C.; Devanthéry, N.; Balbo, A.L.; Madella, M.; Monserrat, O. Use of Satellite SAR for Understanding Long-Term Human Occupation Dynamics in the Monsoonal Semi-Arid Plains of North Gujarat, India. Remote Sens. 2014, 6, 11420-11443. https://0-doi-org.brum.beds.ac.uk/10.3390/rs61111420
Conesa FC, Devanthéry N, Balbo AL, Madella M, Monserrat O. Use of Satellite SAR for Understanding Long-Term Human Occupation Dynamics in the Monsoonal Semi-Arid Plains of North Gujarat, India. Remote Sensing. 2014; 6(11):11420-11443. https://0-doi-org.brum.beds.ac.uk/10.3390/rs61111420
Chicago/Turabian StyleConesa, Francesc C., Núria Devanthéry, Andrea L. Balbo, Marco Madella, and Oriol Monserrat. 2014. "Use of Satellite SAR for Understanding Long-Term Human Occupation Dynamics in the Monsoonal Semi-Arid Plains of North Gujarat, India" Remote Sensing 6, no. 11: 11420-11443. https://0-doi-org.brum.beds.ac.uk/10.3390/rs61111420