Article

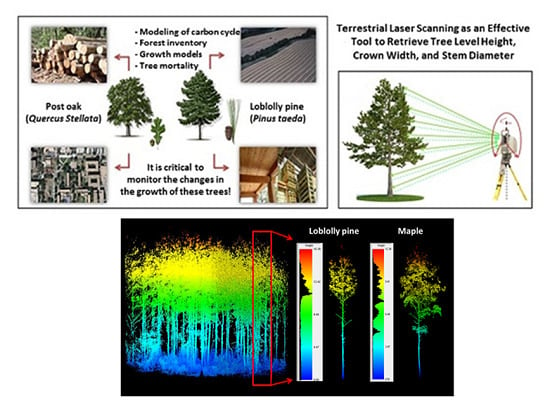
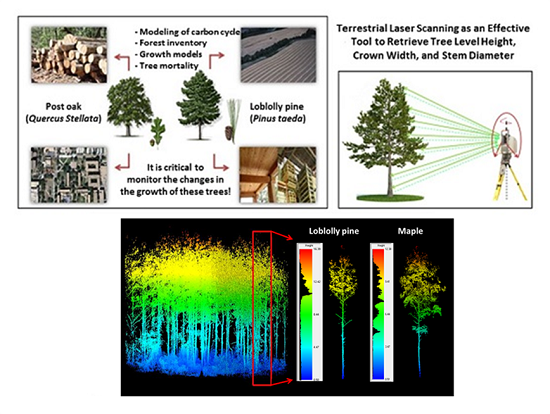
Terrestrial Laser Scanning as an Effective Tool to Retrieve Tree Level Height, Crown Width, and Stem Diameter

LiDAR Applications for the Study of Ecosystems with Remote Sensing (LASERS) Laboratory, Department of Ecosystem Science and Management, Texas A & M University, 1500 Research Parkway Suite B 217, College Station, TX 77843, USA
*
Author to whom correspondence should be addressed.
Remote Sens. 2015, 7(2), 1877-1896; https://0-doi-org.brum.beds.ac.uk/10.3390/rs70201877
Submission received: 16 October 2014 / Revised: 6 January 2015 / Accepted: 19 January 2015 / Published: 9 February 2015

Abstract

:
Accurate measures of forest structural parameters are essential to forest inventory and growth models, managing wildfires, and modeling of carbon cycle. Terrestrial laser scanning (TLS) fills the gap between tree scale manual measurements and large scale airborne LiDAR measurements by providing accurate below crown information through non-destructive methods. This study developed innovative methods to extract individual tree height, diameter at breast height (DBH), and crown width of trees in East Texas. Further, the influence of scan settings, such as leaf-on/leaf-off seasons, tree distance from the scanner, and processing choices, on the accuracy of deriving tree measurements were also investigated. DBH was retrieved by cylinder fitting at different height bins. Individual trees were extracted from the TLS point cloud to determine tree heights and crown widths. The R-squared value ranged from 0.91 to 0.97 when field measured DBH was validated against TLS derived DBH using different methods. An accuracy of 92% (RMSE = 1.51 m) was obtained for predicting tree heights. The R-squared value was 0.84 and RMSE was 1.08 m when TLS derived crown widths were validated using field measured crown widths. Examples of underestimations of field measured forest structural parameters due to tree shadowing have also been discussed in this study. The results from this study will benefit foresters and remote sensing studies from airborne and spaceborne platforms, for map upscaling or calibration purposes, for aboveground biomass estimation, and prudent decision making by the forest management.

Graphical Abstract

1. Introduction

Accurate measures of forest structural parameters and monitoring their changes over time are essential to forest inventory and growth models, managing wildfires, modeling of carbon cycle, and forest management systems [1]. Most extant methods, which include indirect and direct measurement techniques, are limited in their capability to acquire accurate, spatially explicit measurements of forest structural parameters [2,3]. The accuracy of these measurements can be improved using light detection and ranging (LiDAR).
LiDAR, which is an active sensor, emits a series of laser pulses and measures the distance to targets using the speed of light and travel time of the laser pulses to and from a system [4]. Unlike remote sensing systems that use passive optical imagery, LiDAR remote sensing provides detailed information on the horizontal and vertical distribution of vegetation in forests [5]. Applications of LiDAR remote sensing such as measurement of the structure and function of vegetation canopies and estimation of tree height, crown width, basal area, stem volume, and aboveground biomass are elaborated in various studies [4,6,7,8,9]. Nevertheless, small footprint discrete return airborne LiDAR tend to slightly underestimate field measured tree heights, as the laser pulses are not always reflected from treetops. For trees with smaller crown widths or conically shaped crowns, there are chances for the laser pulse to hit the sides of the tree instead of the treetop [10,11]. Airborne LiDAR fails to capture the complete vertical distribution of the canopy [5]. Terrestrial laser scanning (TLS) fills the gap between tree scale manual measurements and large scale airborne LiDAR measurements by providing a wealth of precise information on various forest structural parameters [12] and a digital record of the three dimensional structure of forests at a given time. Hence, to obtain accurate understory information, TLS can produce better results when compared to airborne LiDAR and field measurements [13].
The use of terrestrial or ground-based laser scanners in forestry for mapping vegetation properties and forest management planning has grown dramatically in the last decade [14,15,16]. Terrestrial laser scanners have a high potential to acquire three-dimensional data of standing trees accurately and rapidly through non-destructive methods, which has resulted in the multiple use of this technology in studying forest environments [12,17]. Several studies have shown that TLS is a promising technology in providing objective measures of tree height, diameter at breast height (DBH), canopy cover, stem density, and plot level volumes [18,19]. However, a drawback of this technology is the inability of the laser pulses to penetrate through occluding vegetation, leading to underestimations compared to manually collected field data [15,19,20].
Among the various forest measurements, DBH or stem diameter is an important forest inventory attribute because it serves as a fundamental parameter in tree allometry and estimation of basal area, thus providing valuable information about individual trees and forest stand structure [15]. The automatic detection of DBH from TLS data has been investigated in various studies as listed in Table 1. For example, Huang et al. [10] implemented a circle approximation to retrieve DBH, and they concluded that the circle fitting algorithm resulted in a smaller diameter when there were insufficient surface laser points. Hopkinson et al. estimated DBH by fitting a cylinder primitive to the TLS data. Stems with sparse points were omitted from the analysis. Though the residual dispersion was greater in homogenous plantations, the authors achieved an overall significant correlation with an R-squared value of 0.85 between LiDAR and field measurements for DBH. Bienert et al. [19] determined DBH efficiently using a circle fitting algorithm, and they added that DBH measurements from TLS could be fraught with errors if adequate laser points are not available due to occlusion from other stems [21] concluded that accurate DBH measurements from TLS datasets can be obtained only for unobstructed trees. The previously mentioned studies indicate that TLS can be used to accurately measure individual tree attributes, such as DBH, in datasets with sufficient stem returns. However, no research has been done on retrieving DBH using cylinder fitting with different height bins to account for sparse laser points (Table 1 [10,18,19,21,22,23,24,25,26]).
Table 1. Overview of diameter at breast height (DBH) retrieval methods using terrestrial laser scanning (TLS) datasets and their results.
ReferenceDBH Retrieval MethodNt aNs bResults
[22]Circle fitting at 1.2 m, 1.3 m and 1.4 m AGL cNA dSingle scan and multiple scans (5 positions)NA
[19]Circle fitting at 1.3 m AGL79Single scan and multiple scans (3 positions)SD e ranged from 1.21 to 2.47 cm
[23](a) Single circle fitting at 1.3 m AGL (10 cm thickness)154Single scanRMSE f = 4.2 cm
(b) Multiple circle fitting at 1 m, 1.5 m, 2 m AGL (10 cm thickness)154Single scanRMSE = 3.4 cm
(c) Cylinder fitting between 0.95 and 2.05 m AGL134Single scanRMSE = 7.0 cm
[18]Cylinder fitting between 1.25 and 1.75 m AGL (50 cm thickness)128Multiple scans (5 positions)R2 = 0.85
[10]Circle fitting at 1.3 m AGL (10 cm thickness)26Multiple scans (4 positions)R2 = 0.79
[24]Circular Hough transformation for points between 1.27 and 1.33 m AGL, circle and cylinder fitting (4 cm thickness)8Multiple scans (4 positions)RMSE ranged from 1.9 to 3.7 cm
[25]Hough transformation and circle fitting at 1.3 m AGL11Single scan and multiple scans (4 positions)NA
[21]Circle fitting at 1.3 m AGL12Single scan at site 1 and multiple scans (2 positions) at site 2R2 = 0.92, site 2
[26]Cylinder fitting between 1.28 and 1.32 m AGL (4 cm thickness) and pixel method199Multiple scans (4 positions)R2 > 0.946
a number of trees measured; b number of scans conducted; c Above Ground Level; d Not Available; e Standard Deviation; and f Root Mean Square Error.
In addition to DBH, tree height is also a vital parameter that provides qualitative information about the plot or stand and quantitative information about the tree. Tree height is strongly related to various biophysical characteristics and is a function of species composition and site quality. DBH and tree heights are positively correlated with biomass, since stem diameter increases as trees grow taller, thus, increasing the amount of foliage supported by the trees [27]. A variety of studies have successfully retrieved tree heights using terrestrial laser scanners [10,15]. Hopkinson et al. [18] determined tree heights from TLS data by fitting vector primitives, and their findings revealed that TLS derived tree heights underestimated field measurements by approximately 1.5 m. This underestimation was due to the reduced LiDAR point density in upper canopy, a direct result of the occlusion caused by lower canopy and position of the sensor.
The results were also justified by a weak relationship illustrated between TLS and field-measured heights for taller trees. Chasmer et al. [28] compared field measured heights and TLS derived heights for 15 trees. Their results indicated that TLS derived heights underestimated field measured heights by an approximately 1.2 m due to reduced penetration of laser pulses within the upper canopy. Van der Zande et al. [20] illustrated that TLS point density is negatively correlated with heights in plots that have minimal understory. Thus, a few treetops might be missed by laser hits due to shadowing, which further underestimates various LiDAR derived height metrics. Huang et al. [10] demonstrated an automatic method to determine tree heights from TLS data, and they achieved a correlation of 0.95 for TLS derived tree heights and field measured heights. Moskal et al. [15] estimated tree heights in heterogeneous stands using TLS data by calculating the difference between the lowest and the highest slice plane from horizontal point cloud slicing. Due to shadowing caused by other trees, the laser pulses could not penetrate fully through the complex canopy to reach the top of trees and accounted for only 57.27% accuracy in predicting tree heights.
Crown width (CW) is an important variable, which can be used to estimate biomass, tree volume, and leaf area [29]. An extensive literature study reveals that crown width has so far not been estimated from TLS data and a limited number of studies have derived crown width from airborne LiDAR data. Relationships between airborne LiDAR and field derived crown dimensions are significant, but not very strong, with R-squared values ranging from 0.51 to 0.63 [29,30,31]. Evans et al. [29] addressed the use of LiDAR for forest assessments and proposed two significant domains in which LiDAR could be a major contributor: (1) tree growth and yield modeling at individual tree level for pine plantations using multi-temporal LiDAR data; and (2) implementation of the retrieved individual tree measurements from LiDAR data in immersive visualization environments for the assessment of forest stands.
Until recently, measuring and monitoring forest growth were mostly done using airborne laser scanning, making retrieval of forest attributes and change detection challenging at the individual tree level. Since the potential to retrieve different forest structural parameters using TLS data is not completely tested in the current literature, this study will investigate methods to determine individual tree height, DBH, and crown width, which will benefit foresters and remote sensing studies from airborne and spaceborne platforms, for map upscaling or calibration purposes, for aboveground biomass estimation, and for prudent decision making by the forest management. Since Southern pine forests are extremely productive and bolster forest carbon sequestration capacity, regular monitoring of forests is essential to foresters and planners for managing forest resources and ecosystem services efficiently [32].
The overall aim of this study is to develop innovative methods to retrieve forest structural parameters at individual tree level using LiDAR data sets acquired with TLS for two distinctly different study sites. Innovative aspects of our study consist in (1) developing new methods of deriving tree height, DBH, and crown width from TLS datasets at individual tree level; and (2) investigating the influence of scan settings, such as leaf-on/leaf-off seasons, tree positioning relative to scanner, and processing choices that affect DBH retrieval accuracy.

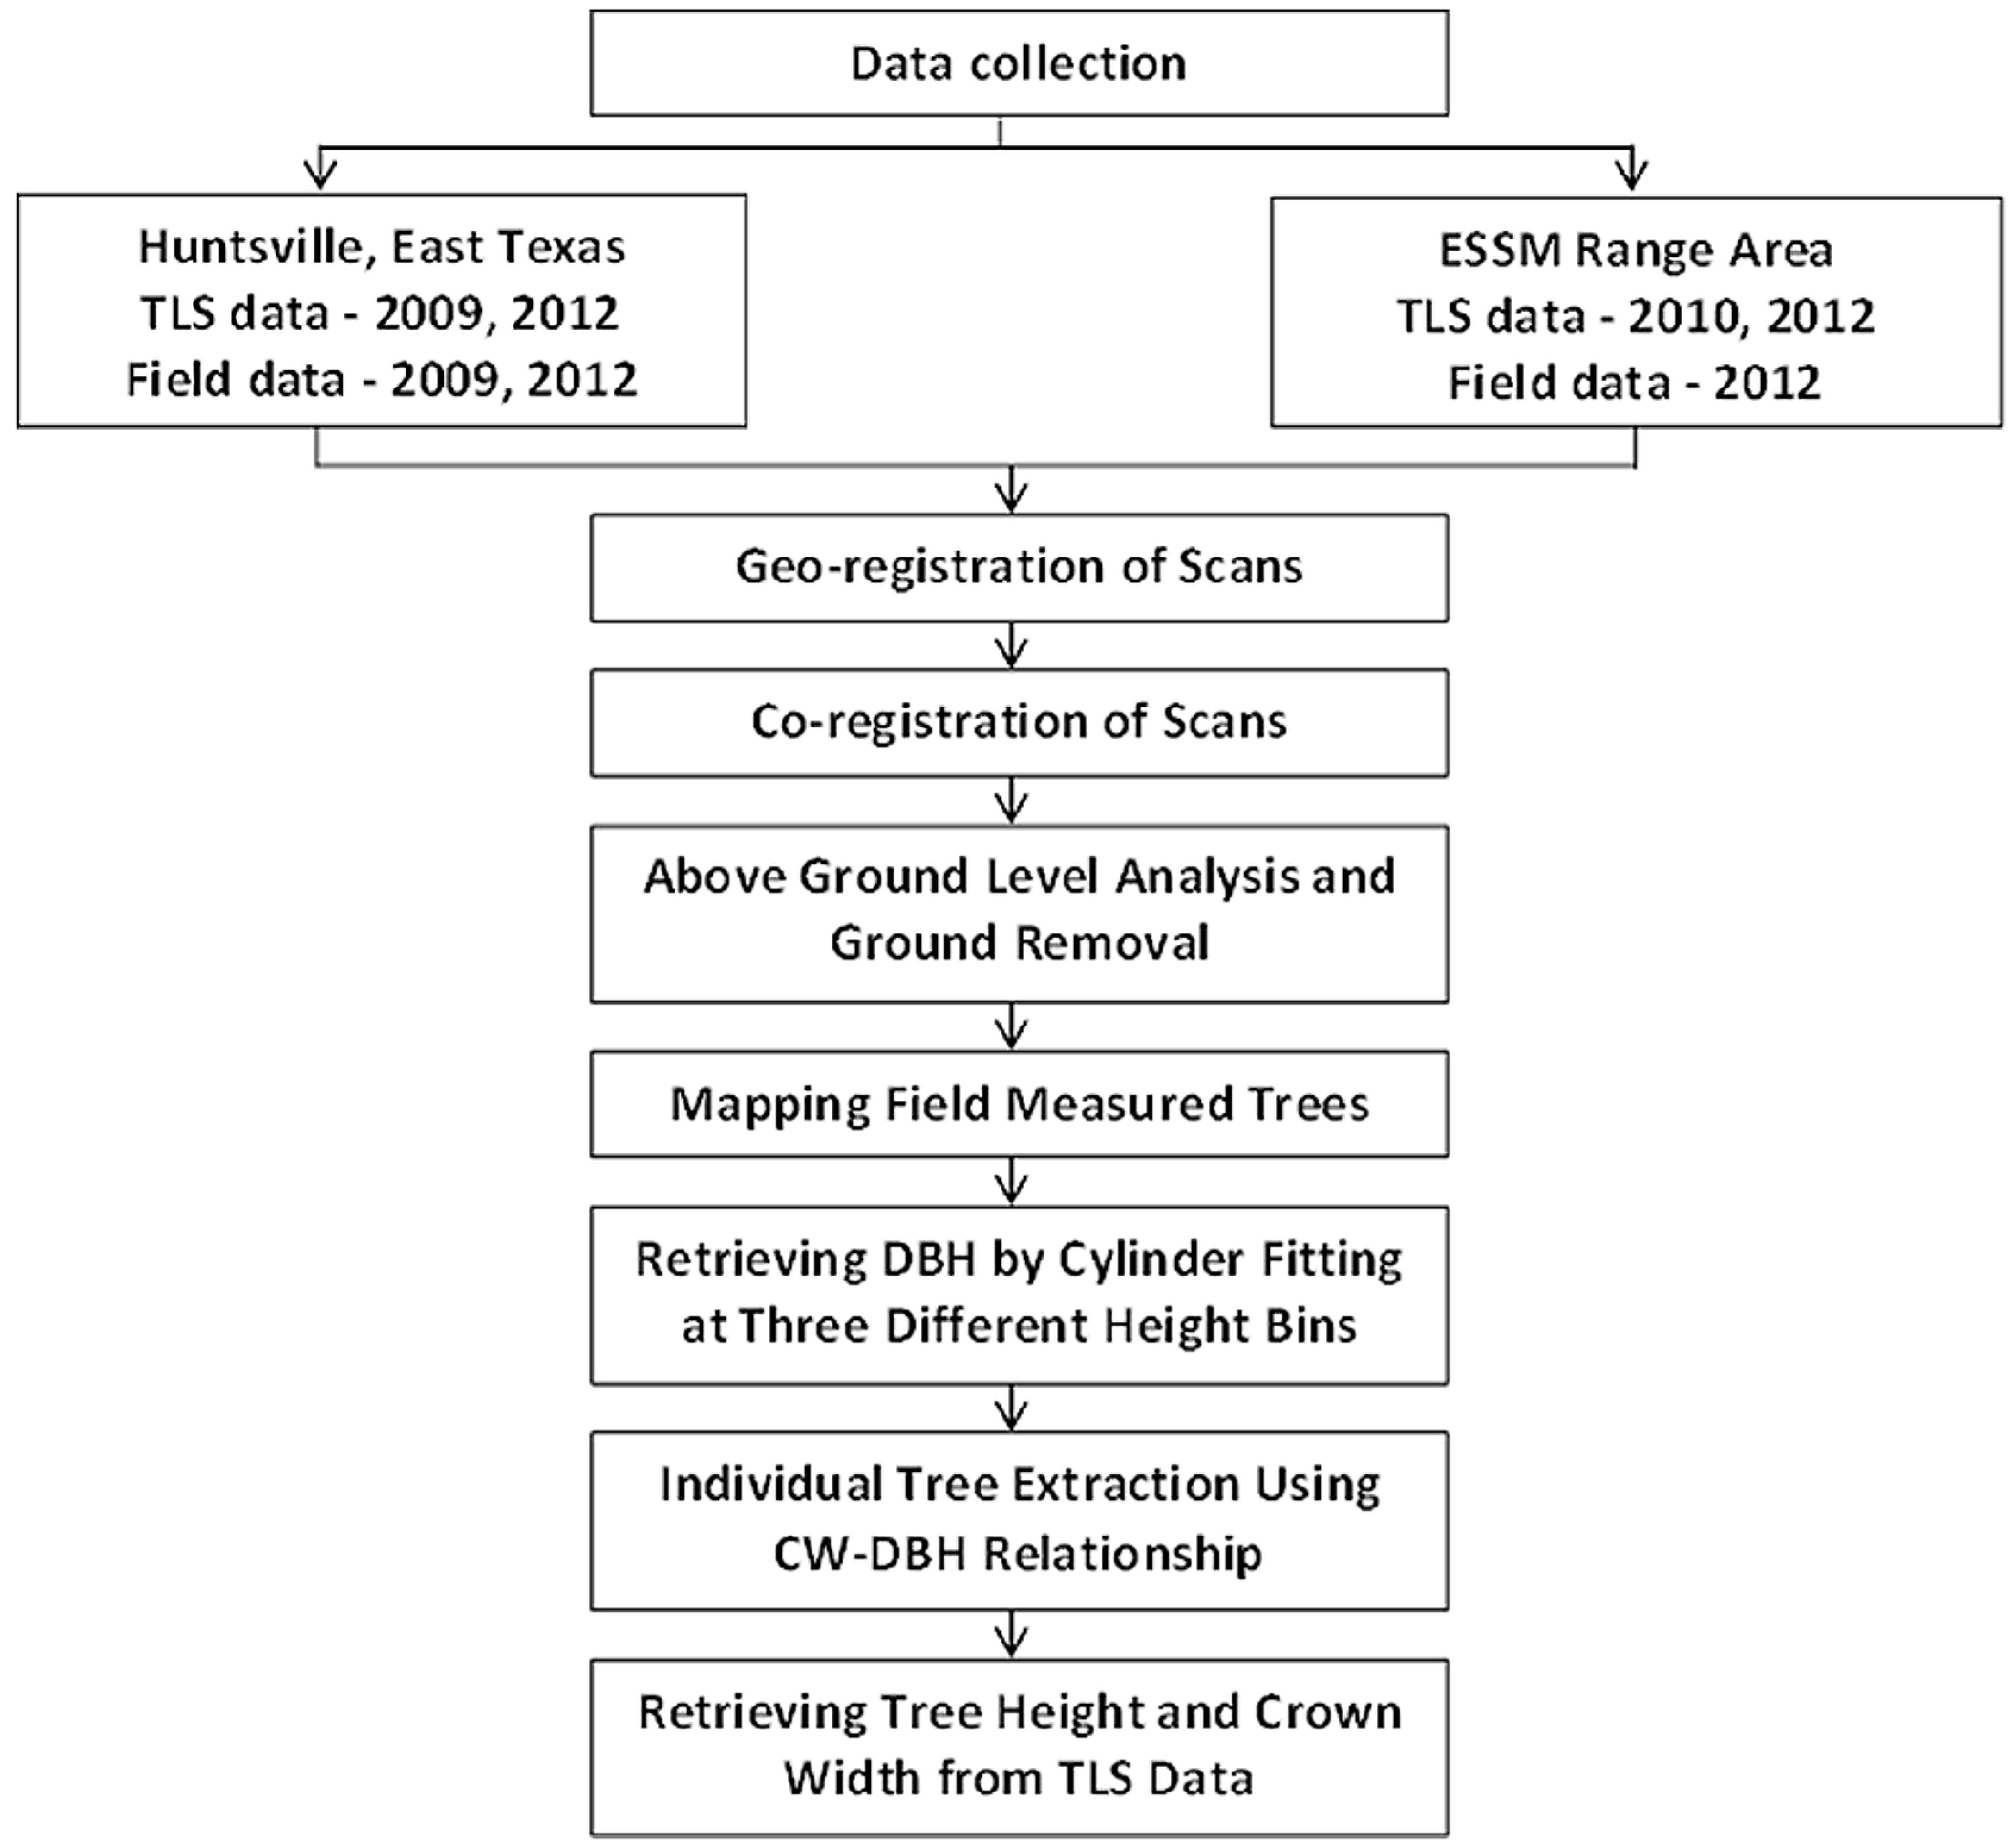
2. Materials and Methods
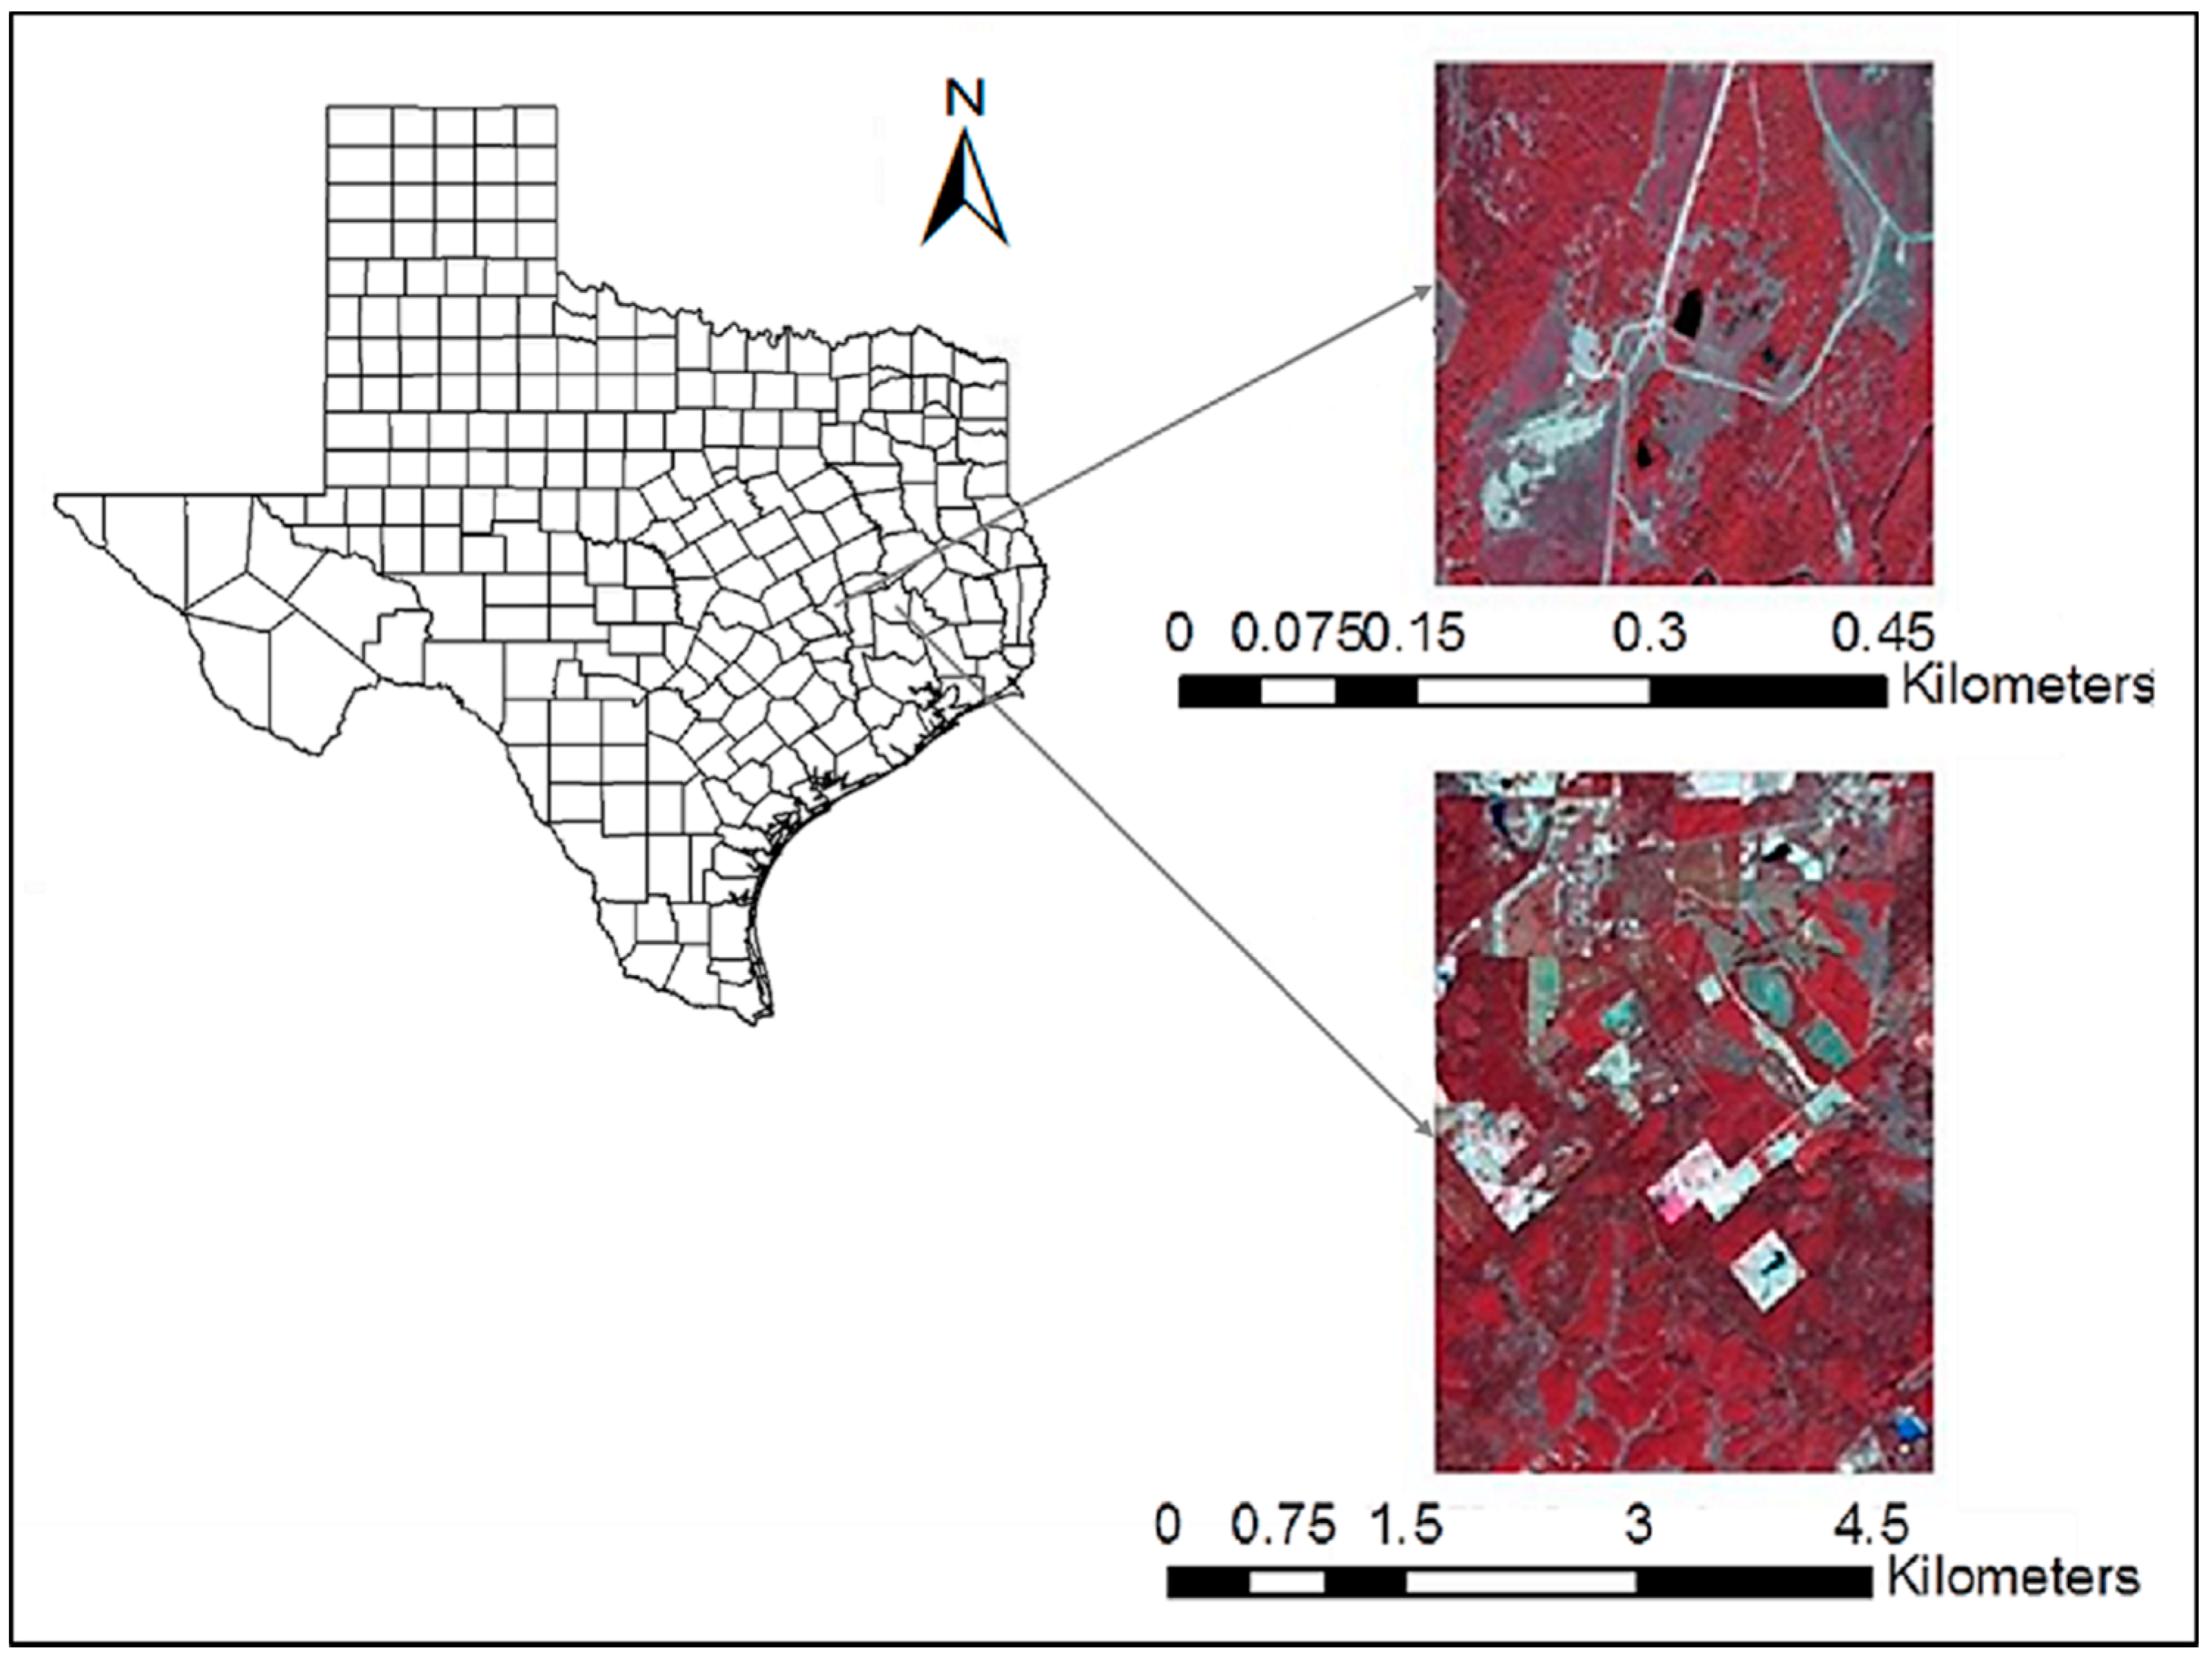
The flowchart presented in Figure 1 shows the research methodology followed in this study. This section includes a description of the study area, descriptions of data used for this study, TLS data processing, and the methods to extract individual trees and retrieve DBH, tree height, and crown width.
Figure 1. Methodology flowchart for this study.
Remotesensing 07 01877 g001

2.1. Study Area

The study area for this research includes two different sites (Figure 2). Site 1, Ecosystem Science and Management (ESSM) range area, is located in College Station, TX, approximately 2.3 km south-east of Easterwood airport (30°34′25.95″N, 96°21′52.53″W). The study site covers an area of approximately 1200 m2 and includes 21 post oak (Quercus stellata) trees. Post oak is a valuable contributor to the urban planting and wildlife food. The slope at this study site varies from 0 to 6 degrees, and the elevation ranges from 56.79 to 70.47 m. Site 2 is located in an area in East Texas near Huntsville, centered within the rectangle defined by 95°24′57″W–30°39′36″N and 95°21′33″W–30°44′12″N. It includes seven circular plots; four plots cover an area of 404.6 m2 (1/10th acre; r = 11.35 m) each and three plots cover an area of 40.468 m2 (1/100th acre; r = 3.59 m) each. The dominant species in this site is loblolly pine (Pinus taeda), while other cover types in this area include upland and bottomland hardwoods, young pine plantations, and old growth pine stands. Loblolly pine is a fast growing pine extensively planted for lumber and pulpwood being widely cultivated in the southern United States. Besides various anthropogenic uses (e.g., furniture, pilings) it is also used as a windbreak and to stabilize eroded soil. The topography of the study area is characterized by gentle slopes with elevation ranging from 62 to 105 m.
Figure 2. Study site 1: Ecosystem science and management (ESSM) range area, located in College Station, TX and study site 2 located in Huntsville, TX.
Remotesensing 07 01877 g002

2.2. Data

2.2.1. Terrestrial Laser Scanning Data

The scans were conducted using Leica ScanStation2, a high point density 3D laser scanner, which emits visible green light pulses (532 nm) with a scan rate of 50,000 pulses per second. Single point accuracies of 4 mm for distance measurement and 6 mm for positional measurement from 1 to 50 m can be achieved with this scanner. The maximum field-of-view is 360° horizontal and 270° vertical. At site 1, leaf-on and leaf-off scans were conducted in November 2010 and February 2012 respectively. Site 1 consisted in a group of 21 post oak trees that were scanned from two opposite directions to avoid laser shadows as much as possible. The different algorithms developed to retrieve DBH were first tested on the data collected at site 1. At site 2, only single scans (360° center scans) were conducted for seven plots in November 2009 and two plots in November 2012. Site 2 followed a plot design similar to U.S. Forest Inventory and Analysis (FIA) plot layout and was also used in previous studies [7,33].
For both sites, two stationary reference targets were used while scanning the plots, which allowed us to geo-register the scans. The position of the scanner was recorded using a differential global positioning system (GPS), and the azimuth to targets was measured using a compass. Scans for both the study sites were conducted with a point spacing of one LiDAR point for every 10 cm × 10 cm at a distance of 50 m. As commonly noted in literature, multiple high-resolution scans were time consuming compared to single scan [19,22]. At study site 1, the scan time was approximately 1.5 h, with two-direction scans conducted in 2010 and 2012. The single scan time for study site 2 was 40 min for each plot. The set up time of the laser scanner and the targets was approximately 15 min per plot.

2.2.2. Ground Inventory Data

At site 1, field measurements (tree height, DBH, and distance and azimuth from plot center) were recorded for each tree. At site 2, tree species, height, DBH, crown width, and distance and azimuth from plot center were recorded for each tree. Crown width was calculated as the average of two values measured along the north-south and east-west directions of the crown. A LTI TruPulse 360-laser range finder was used to find the distance and azimuth to each tree, and measure the tree height and crown width. A diameter tape was used to measure DBH to the nearest tenth of an inch. The coordinates of each plot center and positions of reference targets were recorded by point averaging using a wide area augmentation system (WAAS) enabled Trimble global positioning system (GPS). Post-processing of GPS data included differential correction using Trimble’s Pathfinder software. The differentially corrected points were converted into shapefiles, to allow for the extraction of heights from a digital elevation model (DEM) to the points.

2.3. TLS Data Processing

The 3D virtual point clouds obtained from the scans were unstructured data and were reconstructed by dedicated programs to provide required information such as heights [12]. Registration of the scans for site 1 was done using the Target Point (TP) method [34] in 3D point cloud processing software, Cyclone [35], wherein three common points for both the scans were selected. By obtaining these target points, the individual point clouds were precisely registered or merged together. Since very minor height variation was observed for the study site 1, TP method was selected to register the point clouds [34]. Registration was not required for site 2, since only single scans were conducted at each plot. Once registration was complete, geo-registration was performed, wherein individual scans from two different local coordinate systems were transformed into a common coordinate system. Coordinates of the scanner’s position and azimuth to a stationary target were used to complete the geo-registration. While geo-registering the scans, the X and Y coordinates (easting and northing) for the scanner position were added from the GPS measurements. The Z coordinate (height) was calculated by adding the height of the scanner to the z value obtained from a 0.5 m digital elevation model (DEM) generated from airborne LiDAR data available for the study sites.
The point cloud was further processed in Quick Terrain Modeler (QTM) software [36]. Co-registration of the scans was performed using QTM software. The scans from two different years at both the study sites were aligned together to extract the same area for data processing and analysis. Since reference targets were not used while scanning site 1 in 2010 and site 2 in 2009, co-registration was also used to assign a coordinate system to the unregistered TLS point cloud. The co-registration for a post oak tree scanned in 2010 and 2012 at site 1 is shown in Figure 3. Above ground level (AGL) point heights were calculated in QTM by subtracting DEM values from corresponding point elevations. All the points with heights less than 0.5 m were considered as ground returns and filtered for further analysis. This height threshold was selected to minimize the effects of low-lying vegetation and rocks, and preserve the information useful to estimate different forest structural parameters. In addition, since one of the height bins for the retrieval of DBH using cylinder fitting was from 1.0 to 1.6 m, a height threshold of 0.5 was appropriate.
Figure 3. Co-registration of terrestrial laser scanning (TLS) scans for a post oak tree at site 1.
Remotesensing 07 01877 g003
Figure 4. Mapped trees (represented in red circles) using distance and azimuth overlaid on the terrestrial laser scanning (TLS) point cloud for a 1/10th acre plot, site 2.
Remotesensing 07 01877 g004
The trees at each plot were mapped using the distance and azimuth collected during our field survey, which allowed us to validate LiDAR and field measurements of different forest structural parameters. A “Map Trees” tool was created using Python, which can automatically map the trees using the co-ordinates of the plot center, distance and azimuth to each tree. This tool minimized the field survey time since GPS coordinates for each tree need not be collected. 0.5 m buffers were generated for each mapped tree location and were overlaid on the TLS point cloud to verify if the trees mapped using the “Map Trees” tool matched with the scanned trees (Figure 4).

2.4. Retrieval of Forest Structural Parameters

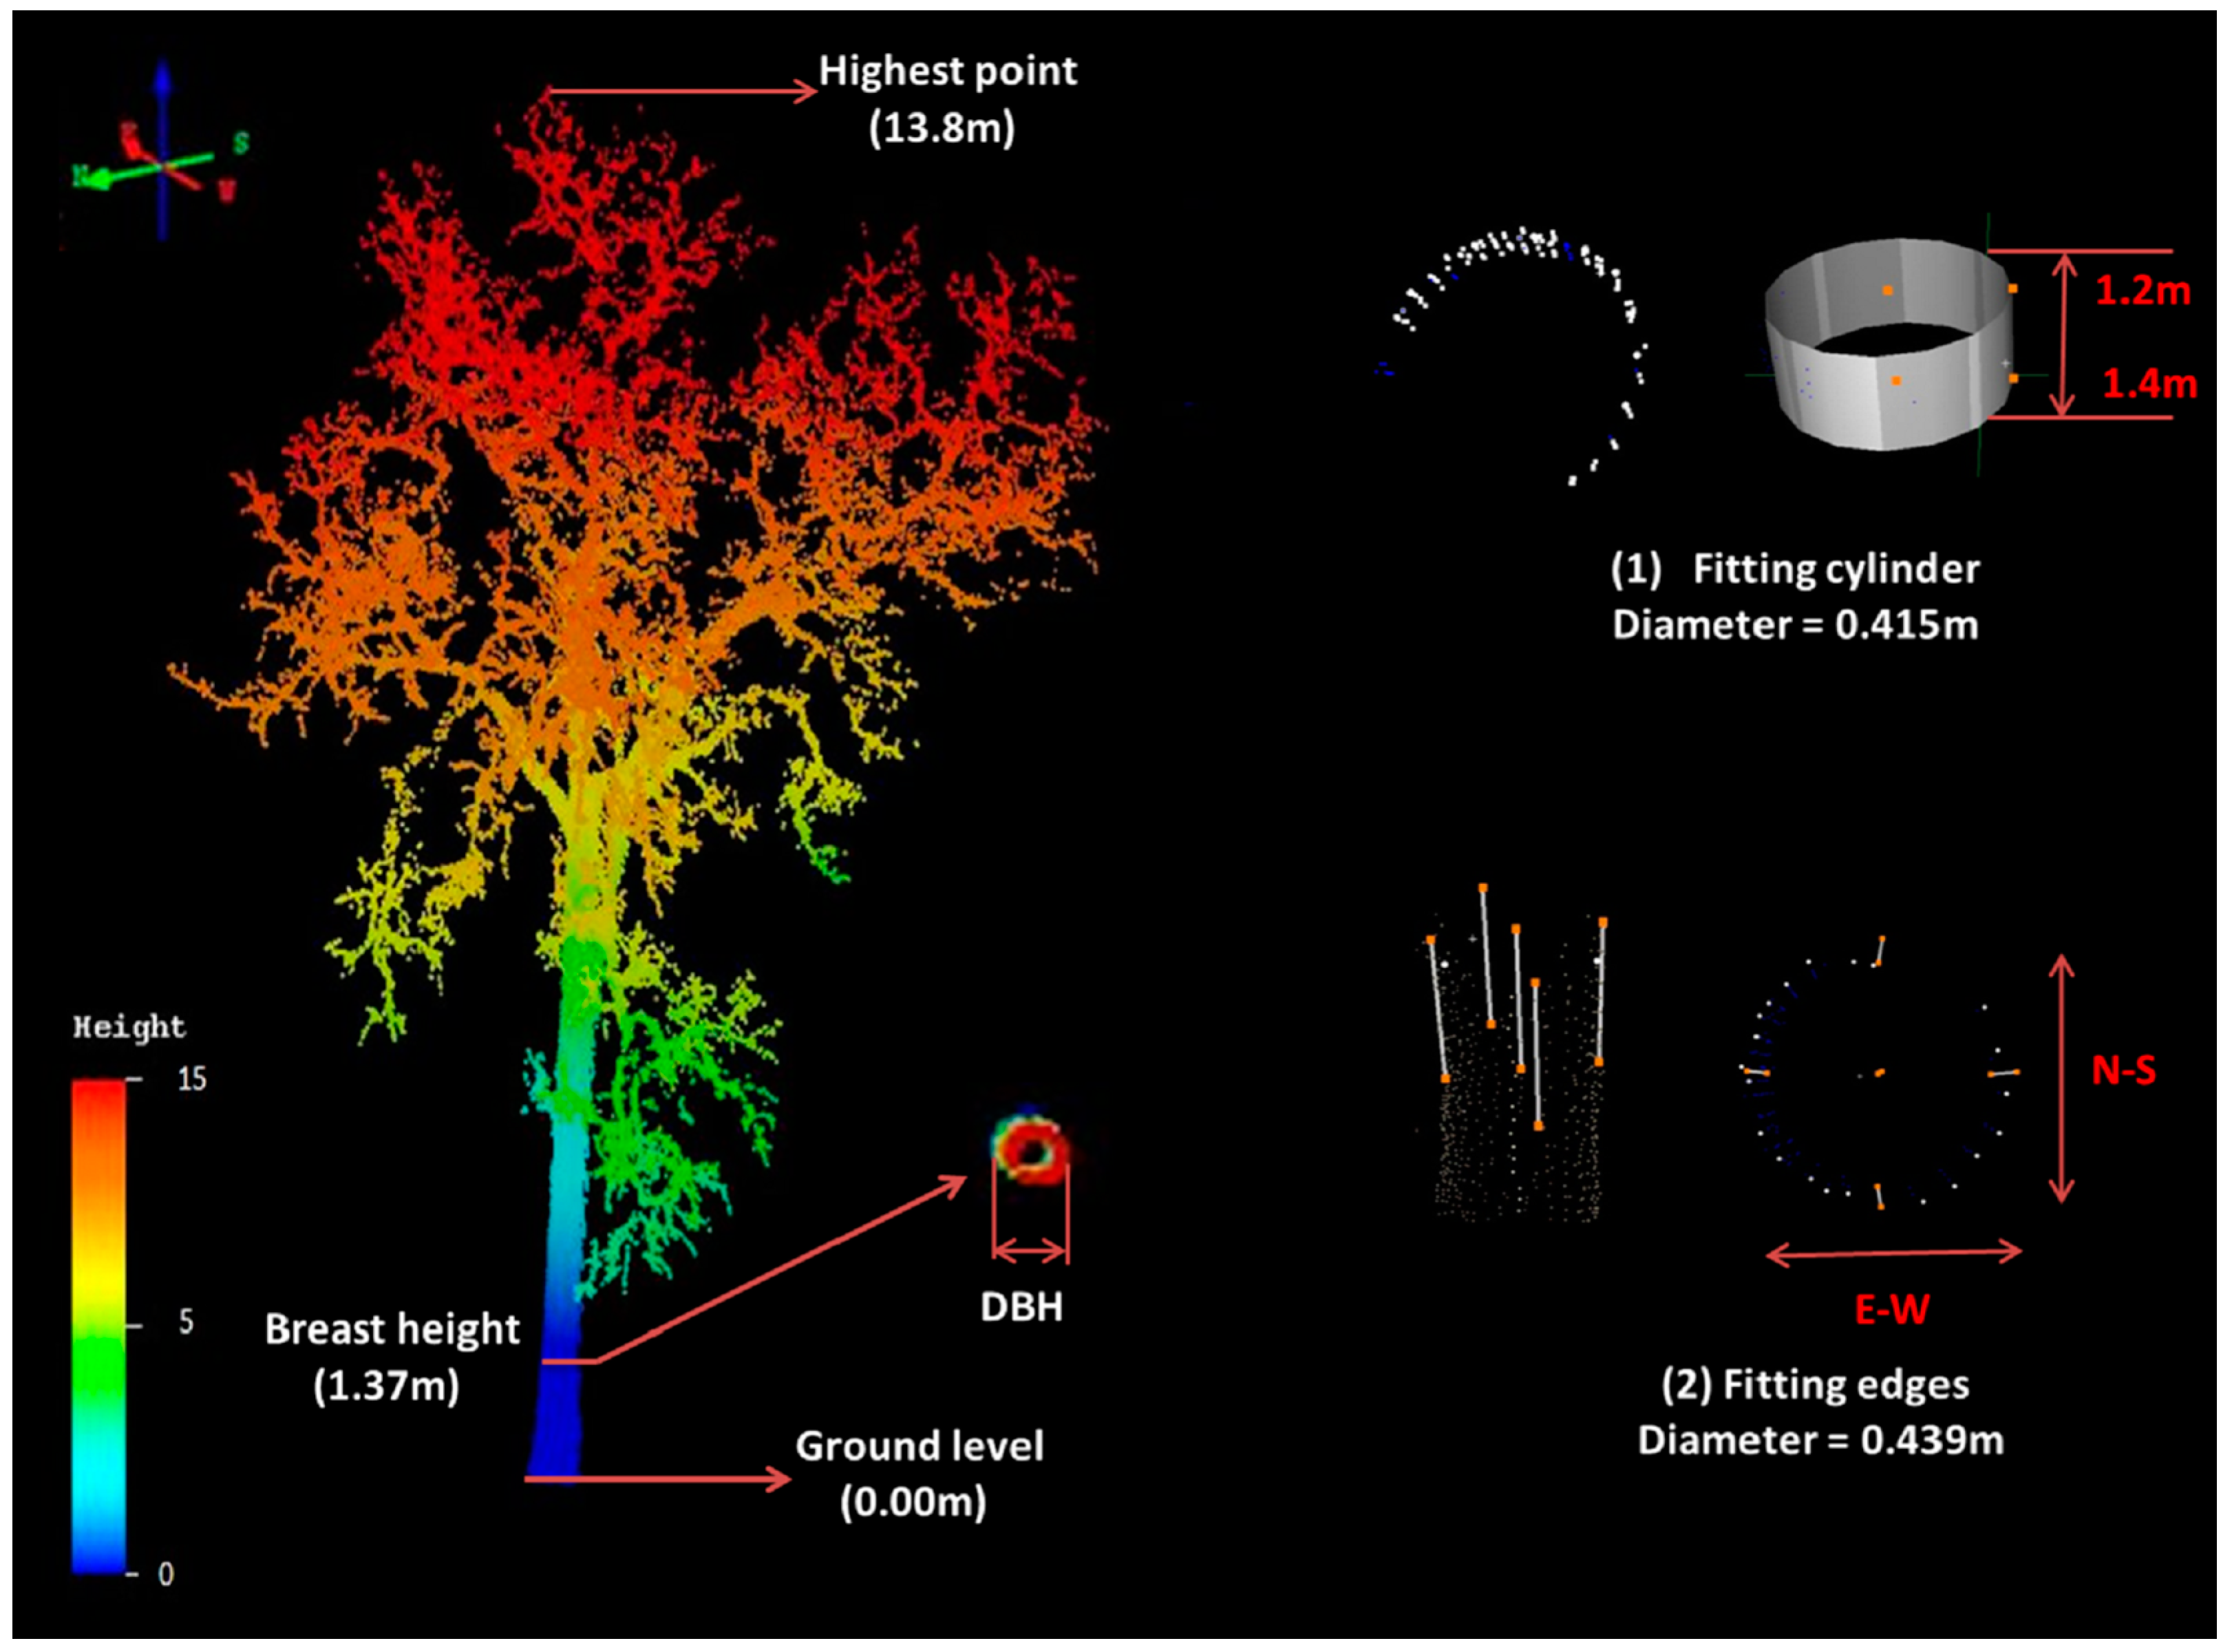
2.4.1. Retrieval of DBH by Cylinder Fitting

For DBH measurements, height bins of two different sizes were extracted for the plot at site 1, and three different sizes were extracted for plots at site 2 using R statistical software (version 2.13.1). Once the height bins were extracted, the point clouds were cleaned manually to remove the remaining low-lying vegetation, to estimate the DBH as the diameter of a cylinder fit with Leica Cyclone. DBH was retrieved from TLS datasets using four different methods for site 1: (a) cylinder fitting on 1.2–1.4 m height bin; (b) cylinder fitting on 1.25–1.35 m height bin; (c) calculation of average diameter between the North-South (N-S) and East-West (E-W) edges; and (d) calculation of average DBH of (a) and (c) (Figure 5). 20 cm and 10 cm height bins were used at site 1 because two-direction scans were conducted and sufficient TLS points were available in the height bins. Hence, increased size height bins were not required. DBH for trees located at site 2 were retrieved by fitting cylinders on three different height bins: (a) 1.2–1.4 m; (b) 1.1–1.5 m; and (c) 1.0–1.6 m. Since only single scans were conducted at site 2; increased size height bins of 20 cm, 40 cm, and 60 cm were required to retrieve DBH. Points that deviated most from a fitted cylinder were considered noise and removed for DBH measurements. The best cylinder fitting method to estimate DBH was also investigated. Further, this study also addressed the influences of tree distance from the scanner, number of points to fit the cylinder, number of scans (single vs. two-direction scans), and height bin size on DBH estimation accuracy.
Figure 5. Diameter at breast height (DBH) retrieval methods by fitting cylinders and fitting edges on the terrestrial laser scanning (TLS) data.
Remotesensing 07 01877 g005

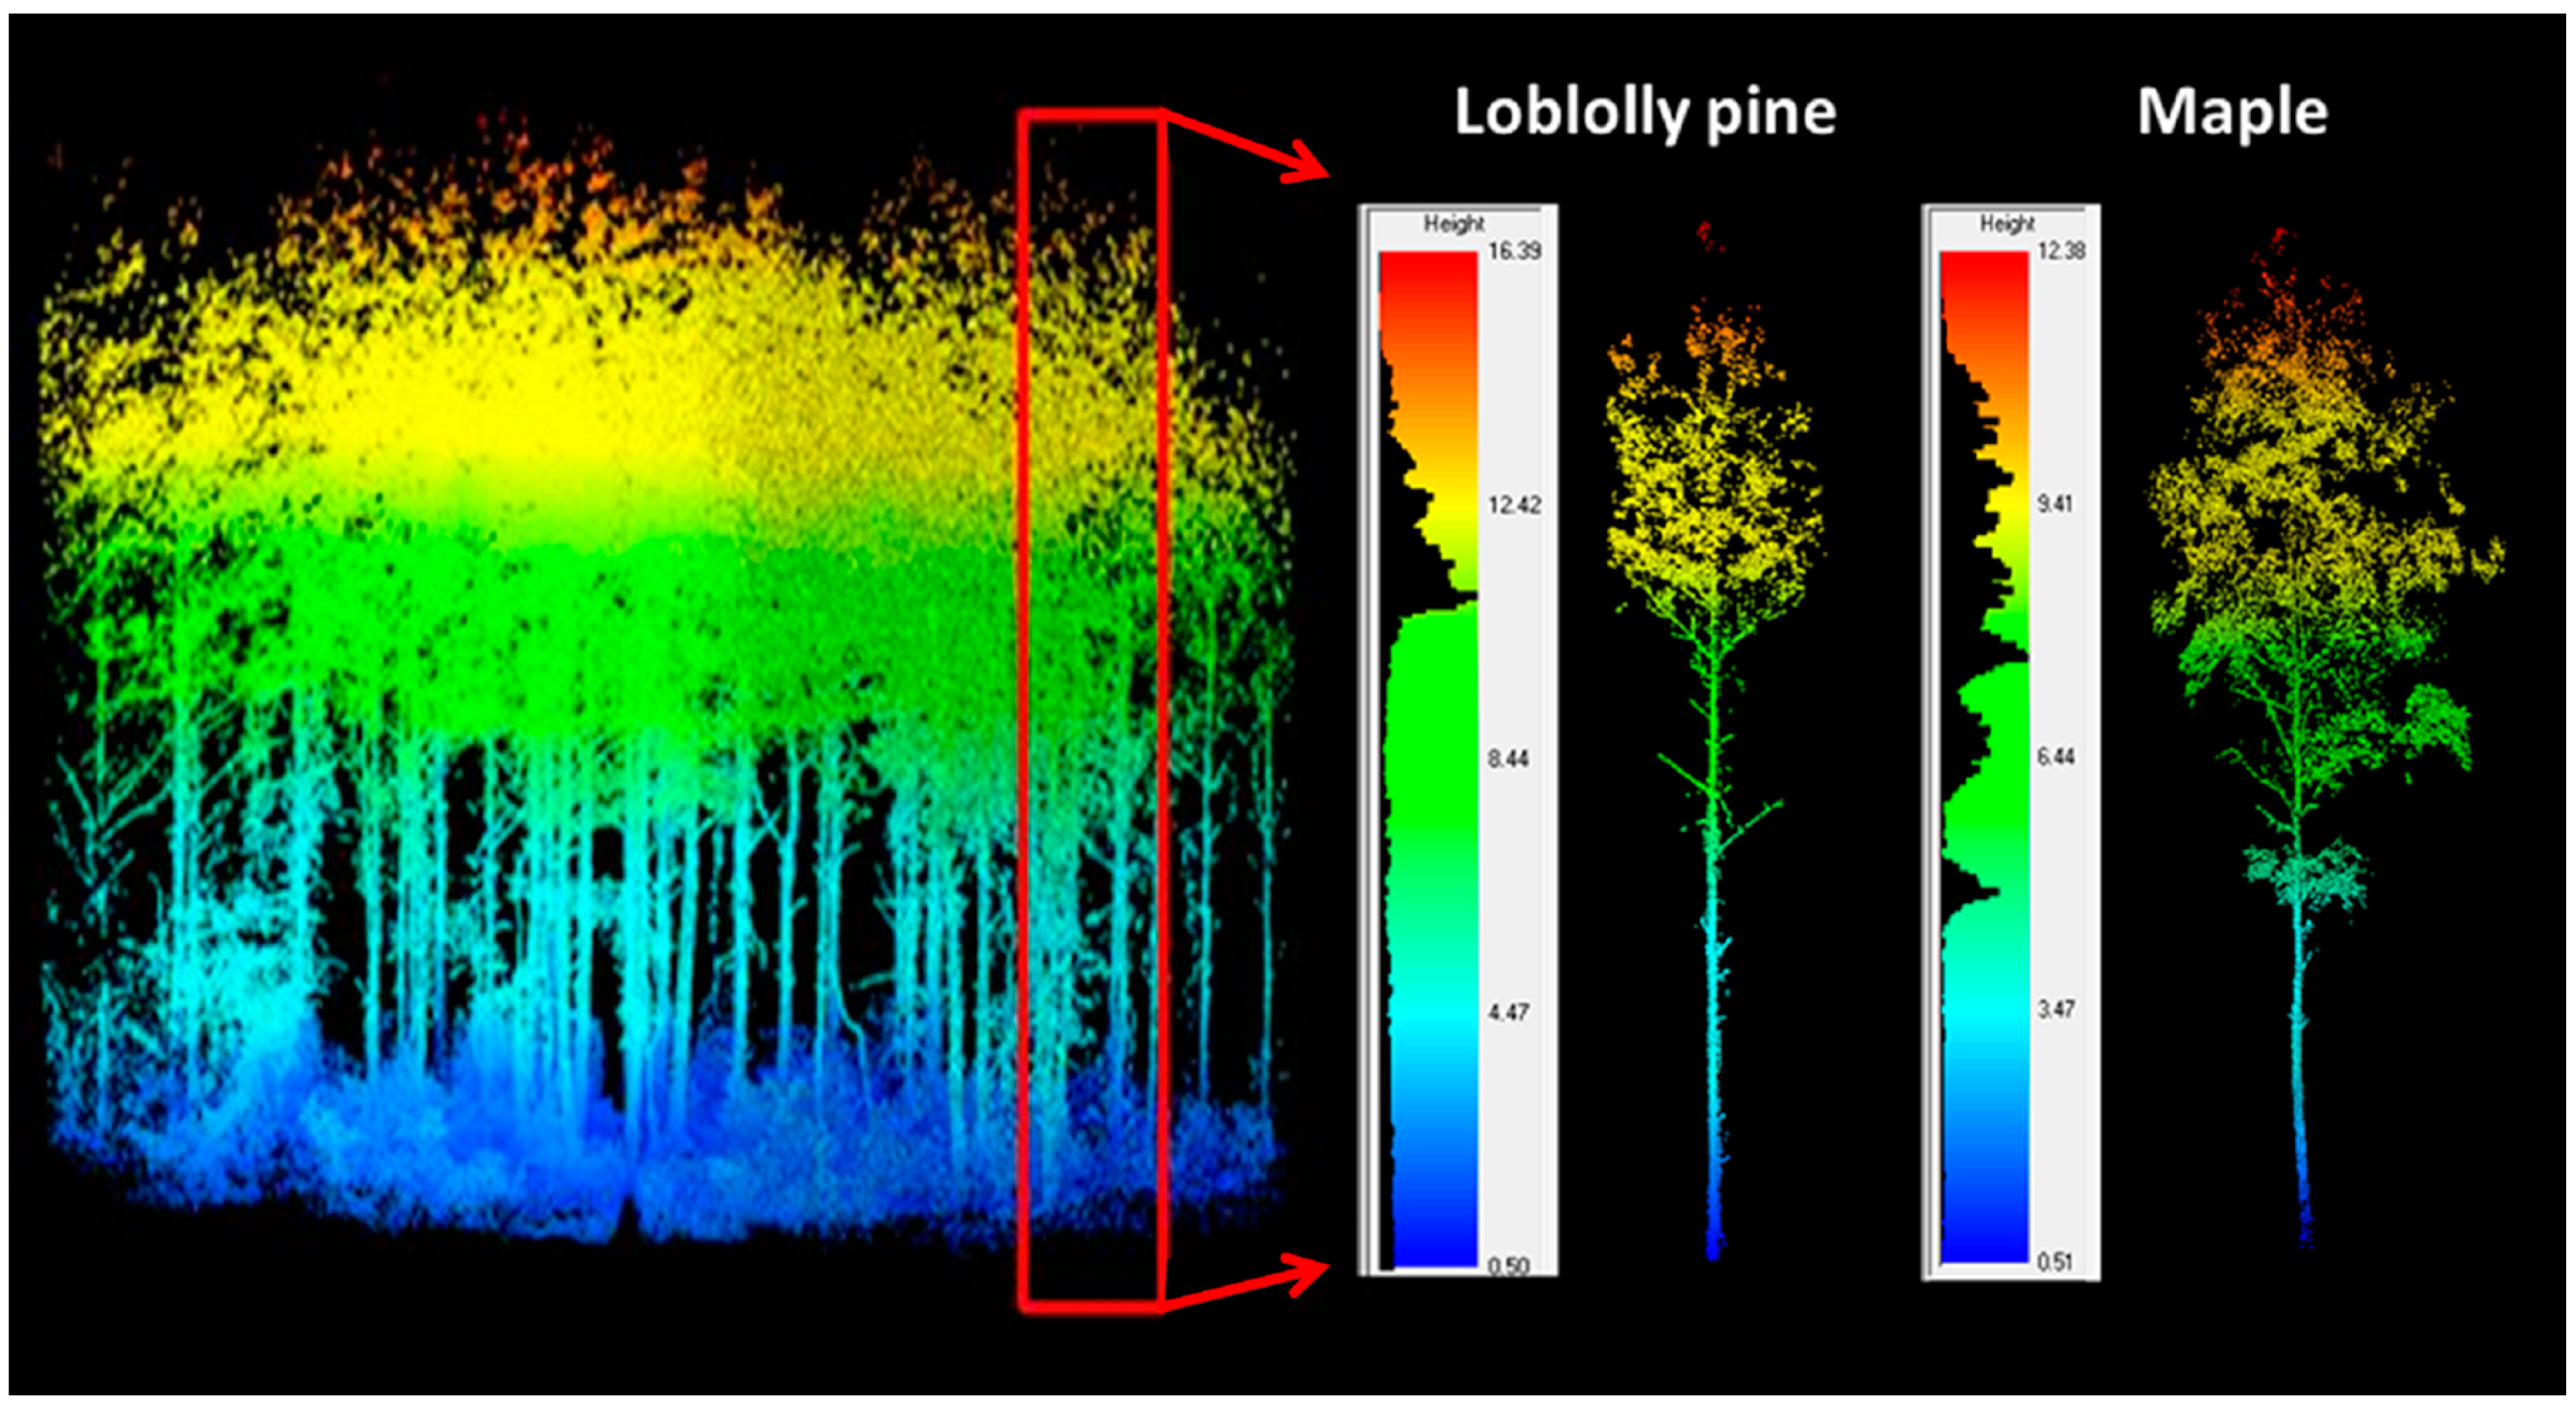
2.4.2. Extraction of Individual trees from TLS Point Cloud

The majority of studies delineated individual trees using a canopy height model derived from LiDAR point cloud, which might contain interpolation errors and decrease the accuracy in segmentation of trees [37]. We developed a method to extract individual trees at each plot directly from LiDAR point cloud to retrieve tree heights and crown widths. The first step was to extract point clouds for individual trees by isolating points using a cylinder with diameter equal to an expected crown width for each tree. In this study, a relationship between field measured crown widths and DBH was established from field surveys conducted in 2004 (Table 2).
Table 2. Regression results of field measured crown width (CW) and diameter at breast height (DBH).
Speciesn aEquationR2RMSE (m)
Loblolly pine200CW = 0.5973 + 0.1647 × DBH0.930.71
Sweet gum80CW = 1.2946 + 0.1950 × DBH0.770.67
Oak100CW = 0.7927 + 0.2635 × DBH0.811.26
a number of trees.
A high R-squared value of 0.9260 was obtained when field measured crown widths were regressed against DBH for 200 loblolly pine trees in Huntsville, East Texas. The coefficients to obtain expected crown widths were obtained separately for different tree species such as loblolly pines, sweet gum (Liquidambar styraciflua), and oaks (Quercus) (Table 2). The expected crown widths calculated from TLS derived DBH were used as the distance variable in the buffer tool in Arcmap, and buffers were created for each tree mapped using the previously mentioned map trees tool. The individual trees were extracted using vertical cut cylinders in QTM obtained using the crown width buffers (Figure 6). After extracting the individual trees from LiDAR point cloud, visual inspection was done to manually remove the points from adjacent crowns or stems if present [18].
Figure 6. Extraction of individual trees using crown widths predicted from terrestrial laser scanning (TLS) derived diameter at breast height (DBH).
Remotesensing 07 01877 g006

2.4.3. Retrieval of Tree Height and Crown Width

Since crown widths were not measured at site 1, individual tree heights were calculated as the highest point in cut cylinders of varying radii. Range rings or buffers were created in QTM with different radii such as 0.5 m (DBH ≤ 30 cm), 0.8 m (30 < DBH < 40 cm), and 1 m (DBH ≥ 40 cm) depending on the DBH of the trees. A different approach was implemented to compute tree heights at site 2. FUSION/LDV (LiDAR Data Viewer) software is a powerful open source LiDAR data analysis and visualization system developed by the USDA Forest Service, which also includes a collection of task-specific command line programs [38]. The extracted individual trees were used as input in the CloudMetrics algorithm. Tree heights were automatically computed by the algorithm in addition to several other statistical parameters.
Crown widths were obtained using FUSION and LDV. Measurement cylinders were set over each tree, and the diameter was adjusted to compute the crown width. For trees with nearly circular crowns, the minimum and maximum crown widths were the same. For trees with irregular crowns, the aspect ratio of the measurement marker was adjusted to closely match the shape of the crown. Then, the average of minimum and maximum crown widths, which correspond to the minor and major axes of the measurement disk, was calculated as the crown width of the tree.

3. Results and Discussion

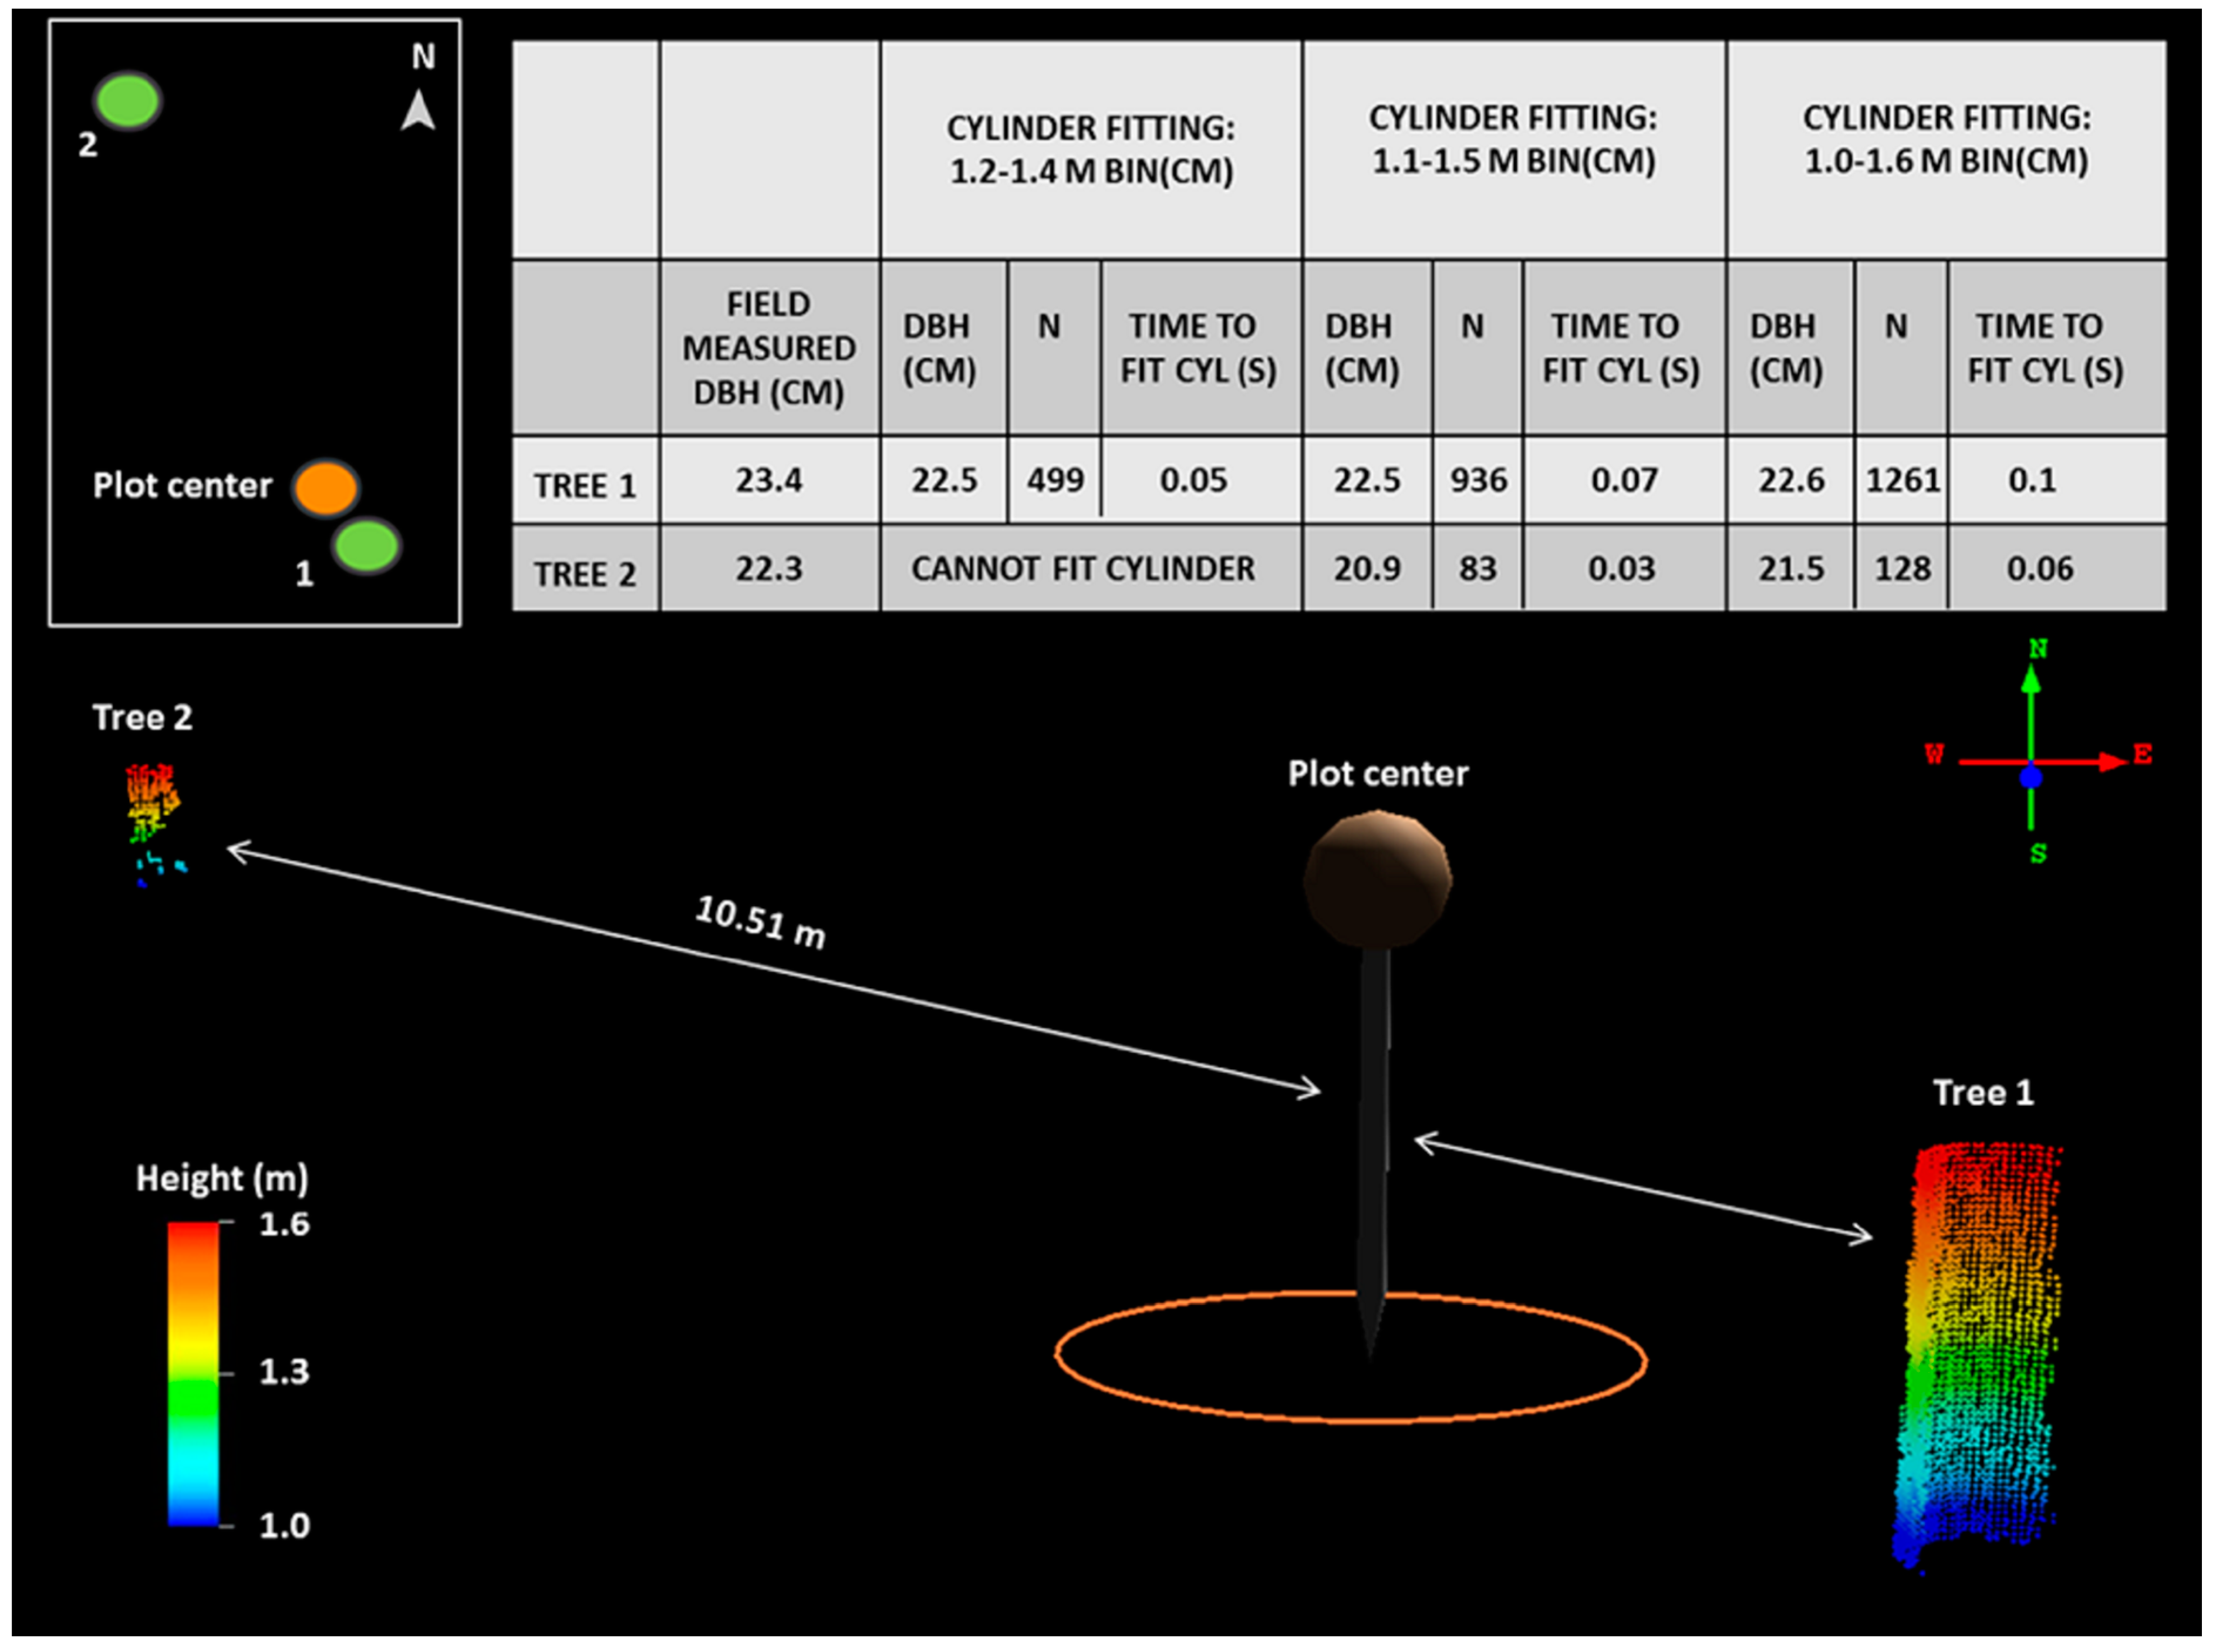
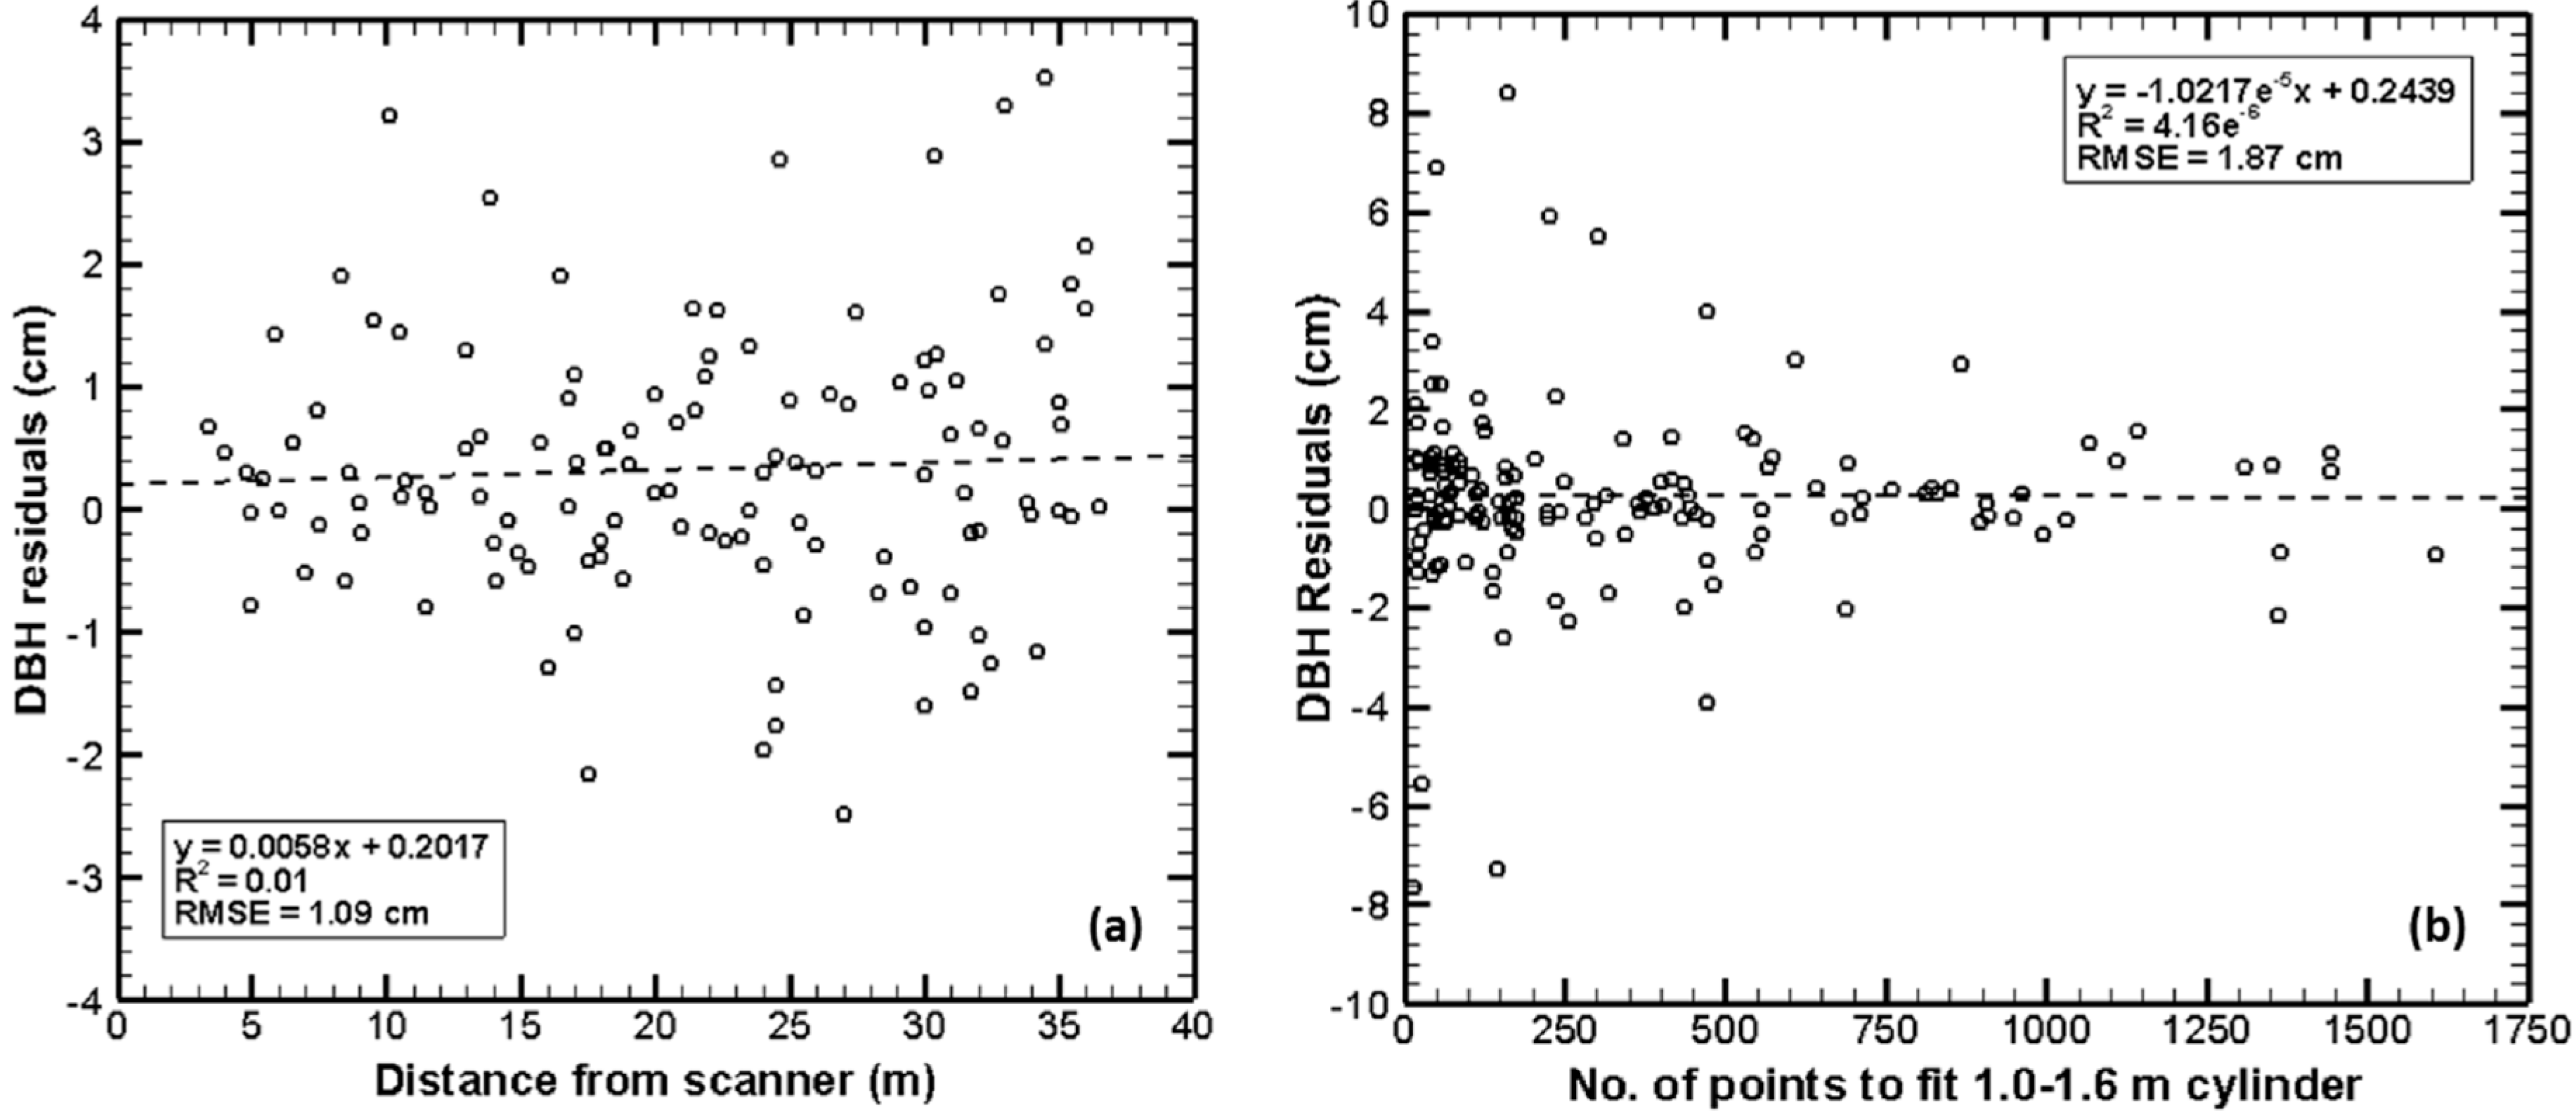
3.1. DBH Measurement by Cylinder Fitting

For TLS derived DBH at site 1, validation against field measured DBH indicated a high R-squared value of 0.95 for cylinder fitting using 1.2–1.4 m height bin. The R-squared values for DBH retrieval using TLS datasets for methods (b), (c), and (d) were 0.91, 0.92, and 0.94 respectively. Since two-direction scans were conducted at site 1, a 20 cm height bin was sufficient to derive DBH from the point cloud. The problem of sparse laser points due to shadowing was not experienced at this site.
The purpose of fitting cylinders with three different height bins at site 2 is presented in Figure 7. Two trees at distances 1.22 m (tree 1) and 10.51 m (tree 2) from the plot center were extracted from the TLS point cloud data. When three height bins were generated for both trees, it was seen that tree 1 had sufficient number of laser points in all the height bins to fit a cylinder, whereas tree 2 had very few laser points in the 1.2–1.4 m height bin due to shadowing from other trees. When the bin size for cylinder fitting was increased from 20 cm to 40 cm and 60 cm for tree 2, TLS derived DBH were 20.9 cm and 21.5 cm respectively, which were close to the field measured DBH (22.3 cm). Since previous studies have discussed that DBH cannot be reliably measured with sparse laser points [10,19,23], estimates of DBH must be retrieved using different height bins.
Table 3 shows the regression results of field measured DBH and TLS derived DBH using three height bins for site 2. Though the R-squared values for all three methods were high, the number of trees detected using 1.2–1.4 m height bin was low compared to the other two methods. Only 83% of the trees were detected and available for cylinder fitting to retrieve DBH. For a few trees, the number of points within the 1.2–1.4 m height bin was insufficient to fit a cylinder. This might be due to the shadowing from other stems or heavy understory. The RMSE value was also high compared to the other two height bins (Table 3), which indicated that cylinder fitting on 1.2–1.4 m height bin would not be the best method to retrieve DBH from single scans. Cylinder fitting on 1.1–1.5 m and 1.0–1.6 m height bins provided similar R-squared values and RMSE (RMSE values of 1.83 and 1.85 cm respectively and R-squared value of 0.97). Compared to cylinder fitting on 1.2–1.4 m height bin, the RMSE decreased by approximately 0.29 cm and the stem detection rate increased by approximately 17%. These results show that cylinder fitting on an increased height bin size (1.1–1.5 m and 1.0–1.6 m) provide promising results for the retrieval of DBH from single scan TLS datasets.
Figure 7. Cylinder fitting results on 1.2–1.4 m height bin for tree 1 and tree 2.
Remotesensing 07 01877 g007
Table 3. Results of field measured diameter at breast height (DBH) and terrestrial laser scanning (TLS) derived DBH by cylinder fitting using three different height bins for loblolly pines and hardwoods.
Height Bin (m)n aR2RMSE (cm)
1.2–1.41220.962.13
1.1–1.51450.971.83
1.0–1.61460.971.85
a number of trees fitted with cylinder.
The accuracy of TLS derived DBH was influenced by several other factors such as tree distance from the scanner, number of scans, and DBH extraction method. The result illustrated in Figure 8a concurred with the findings of [39], who reported that range does not influence the accuracy of DBH estimation; however, for lower scan resolutions and longer ranges, DBH estimation accuracies might decrease due to reduced point density. Figure 8b shows the DBH estimation errors as a function of the number of points to fit 1.0–1.6 m cylinder. Though a strong relationship was not seen, the residuals were large for a few stems that had lower number of points to fit the cylinder.
Figure 8. Diameter at breast height (DBH) residuals as a function of (a) distance from scanner (b) number of points to fit the cylinder.
Remotesensing 07 01877 g008
The minimum, maximum, and average number of points to fit the cylinders using 1.2–1.4 m, 1.1–1.5 m, and 1.0–1.6 m height bins at site 2 are summarized in Table 4. Since sufficient laser points were available for cylinder fitting using two-direction scans at site 1, the number of points used for cylinder fitting was not recorded.
Table 4. Descriptive statistics for cylinder fitting on single scan data for loblolly pines and hardwoods.
Cylinder Fitting Height Bin (m)Number of Points to Fit the Cylinder
MinMeanMax
1.2–1.47126544
1.1–1.5102451105
1.0–1.6163591608
Considering the number of scans and height bin size, a smaller height bin (1.2–1.4 m) was sufficient to estimate DBH from two-direction scans. However, for single scans, cylinder fitting using increased height bin size provided promising results. The use of merged scans for DBH measurements is advantageous due to multi-angular coverage [19,25] potentially increasing stem detection rates, but it is time consuming. Pueschel et al. [39] found that DBH determined from two-direction scans have lower RMSE’s ranging from 0.66 to 1.21 cm compared to single scan data with RMSE’s ranging from 1.39 to 2.43 cm. The results of this study indicated that RMSE for the best DBH extraction method was 0.74 cm for two-direction scans and 1.83 cm for single scan data. Further, cylinder fitting is not only a matter of the number of laser shots per stem, but also a matter of including laser points that belong to understory vegetation that is located very close to the stem. The longer the extent of the height bin, the higher the probability of including such errors of commission. However, for the forest conditions in our study area, we believe these errors of commission have less influence on the accuracy of dbh estimation compared to the number of laser points.

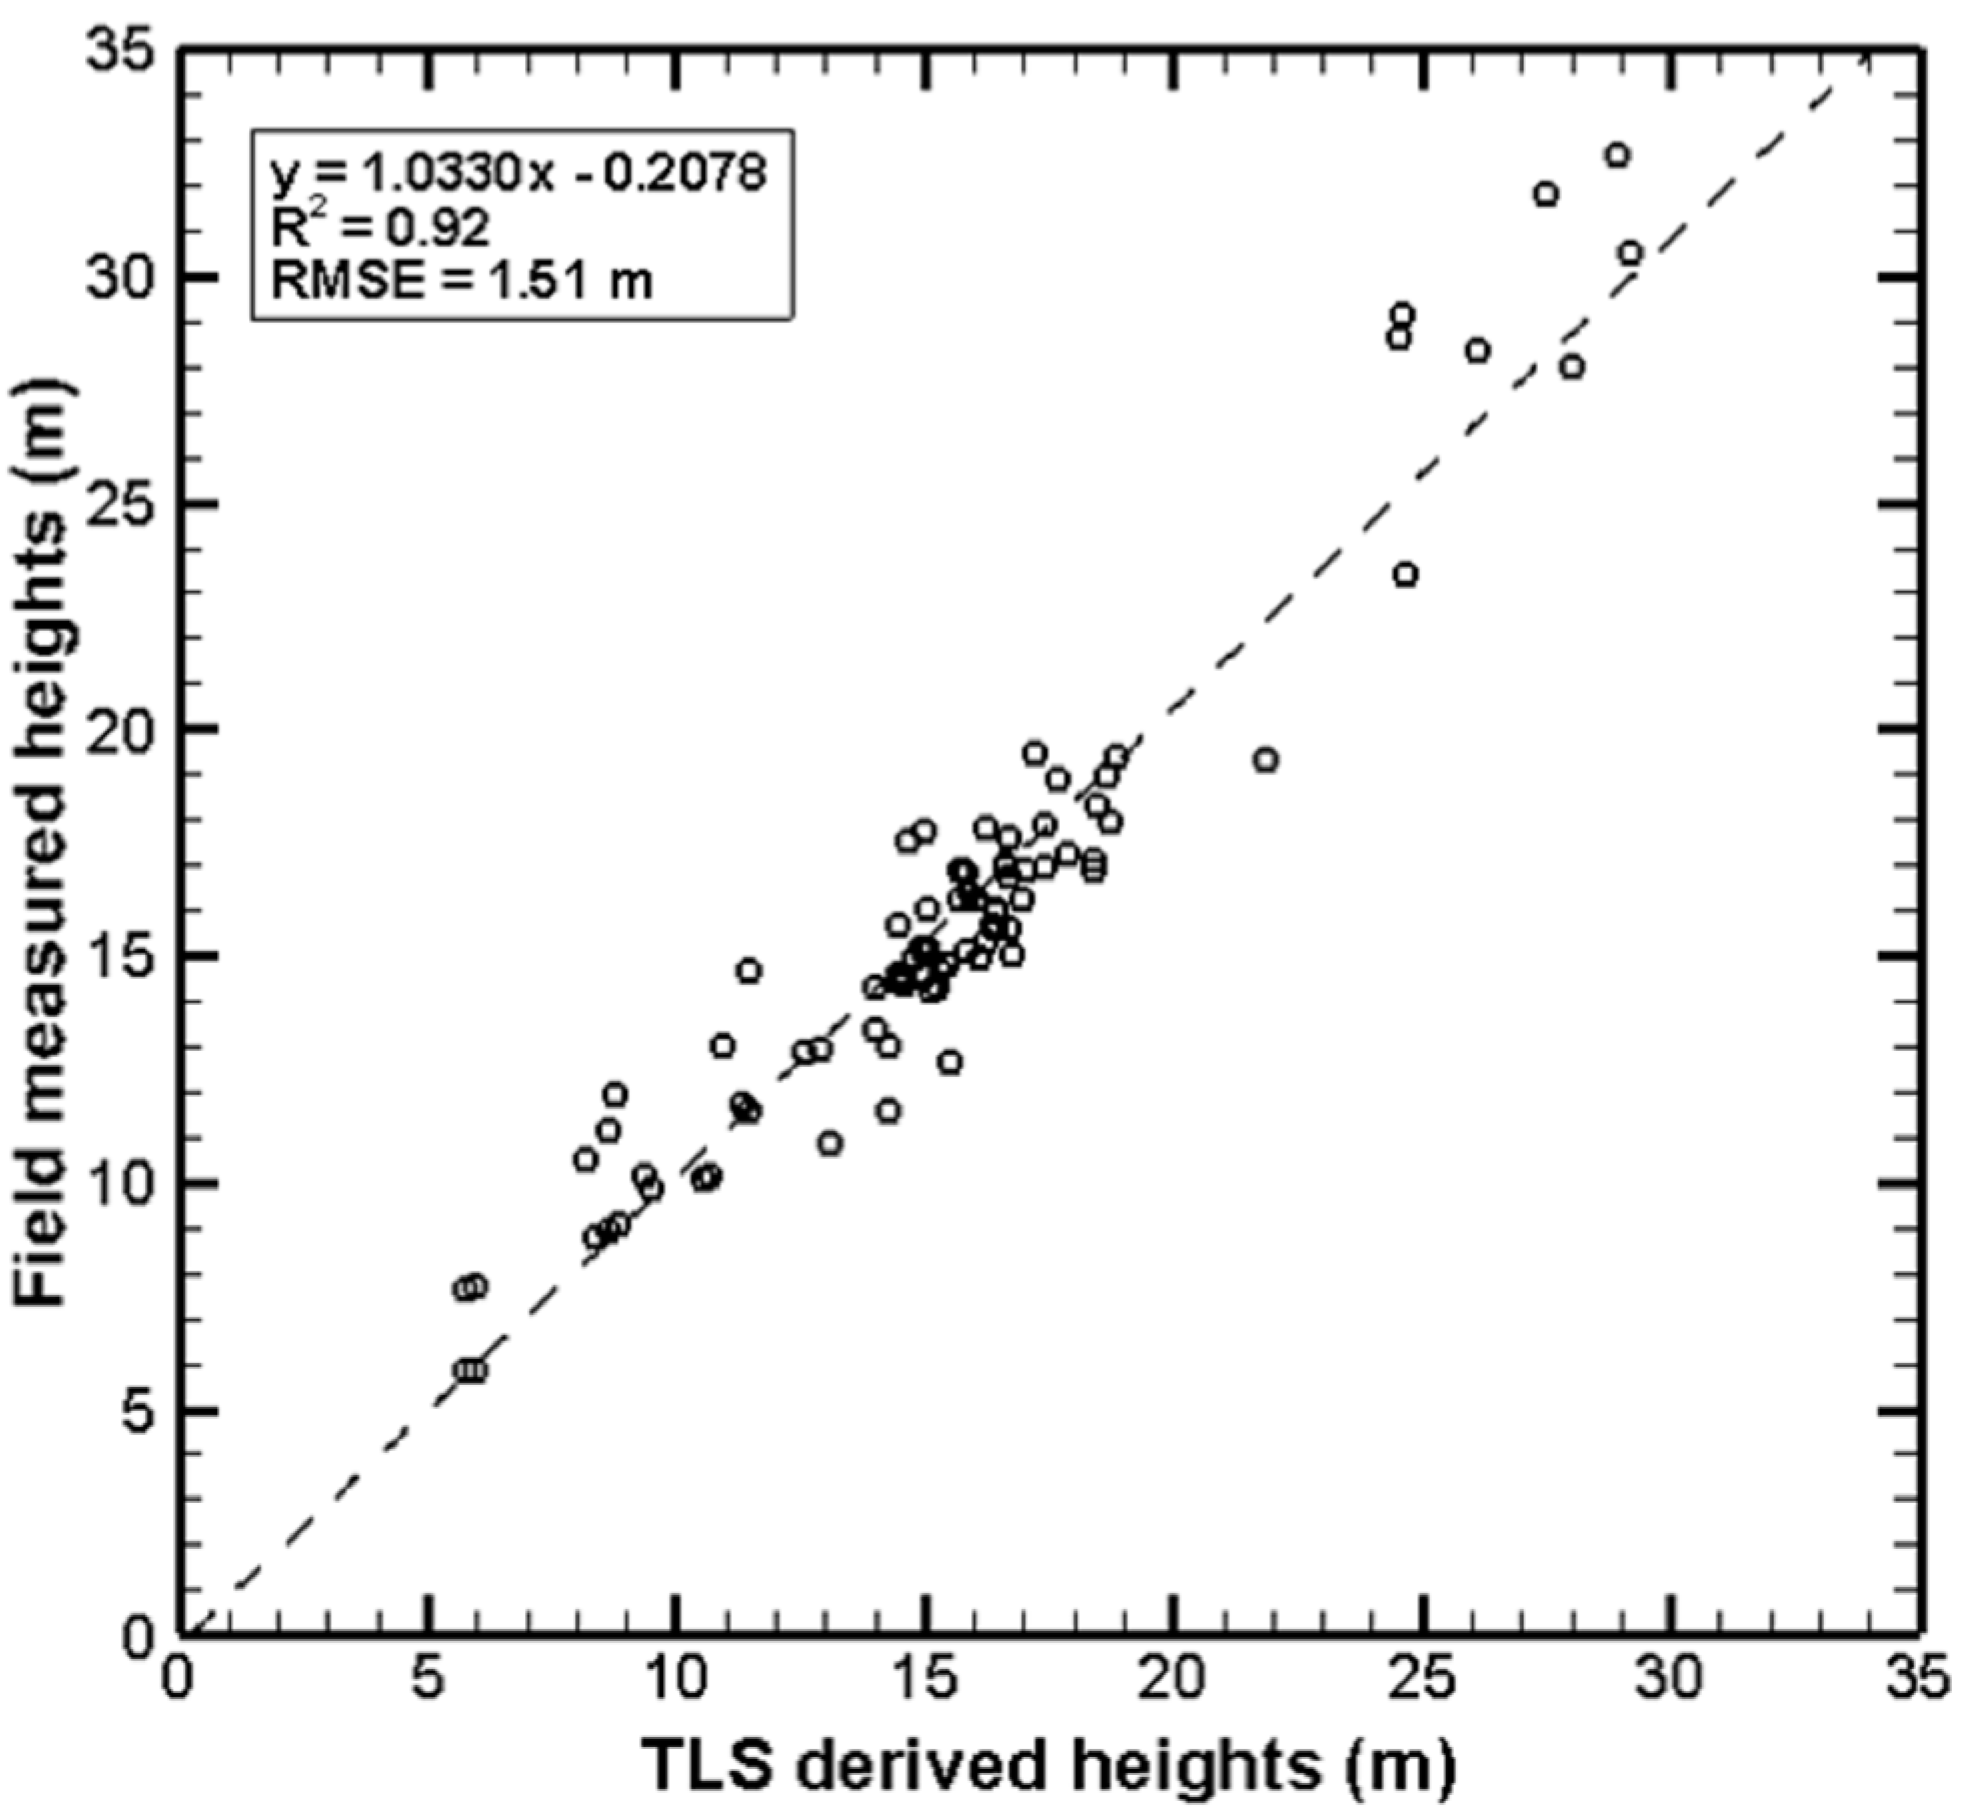
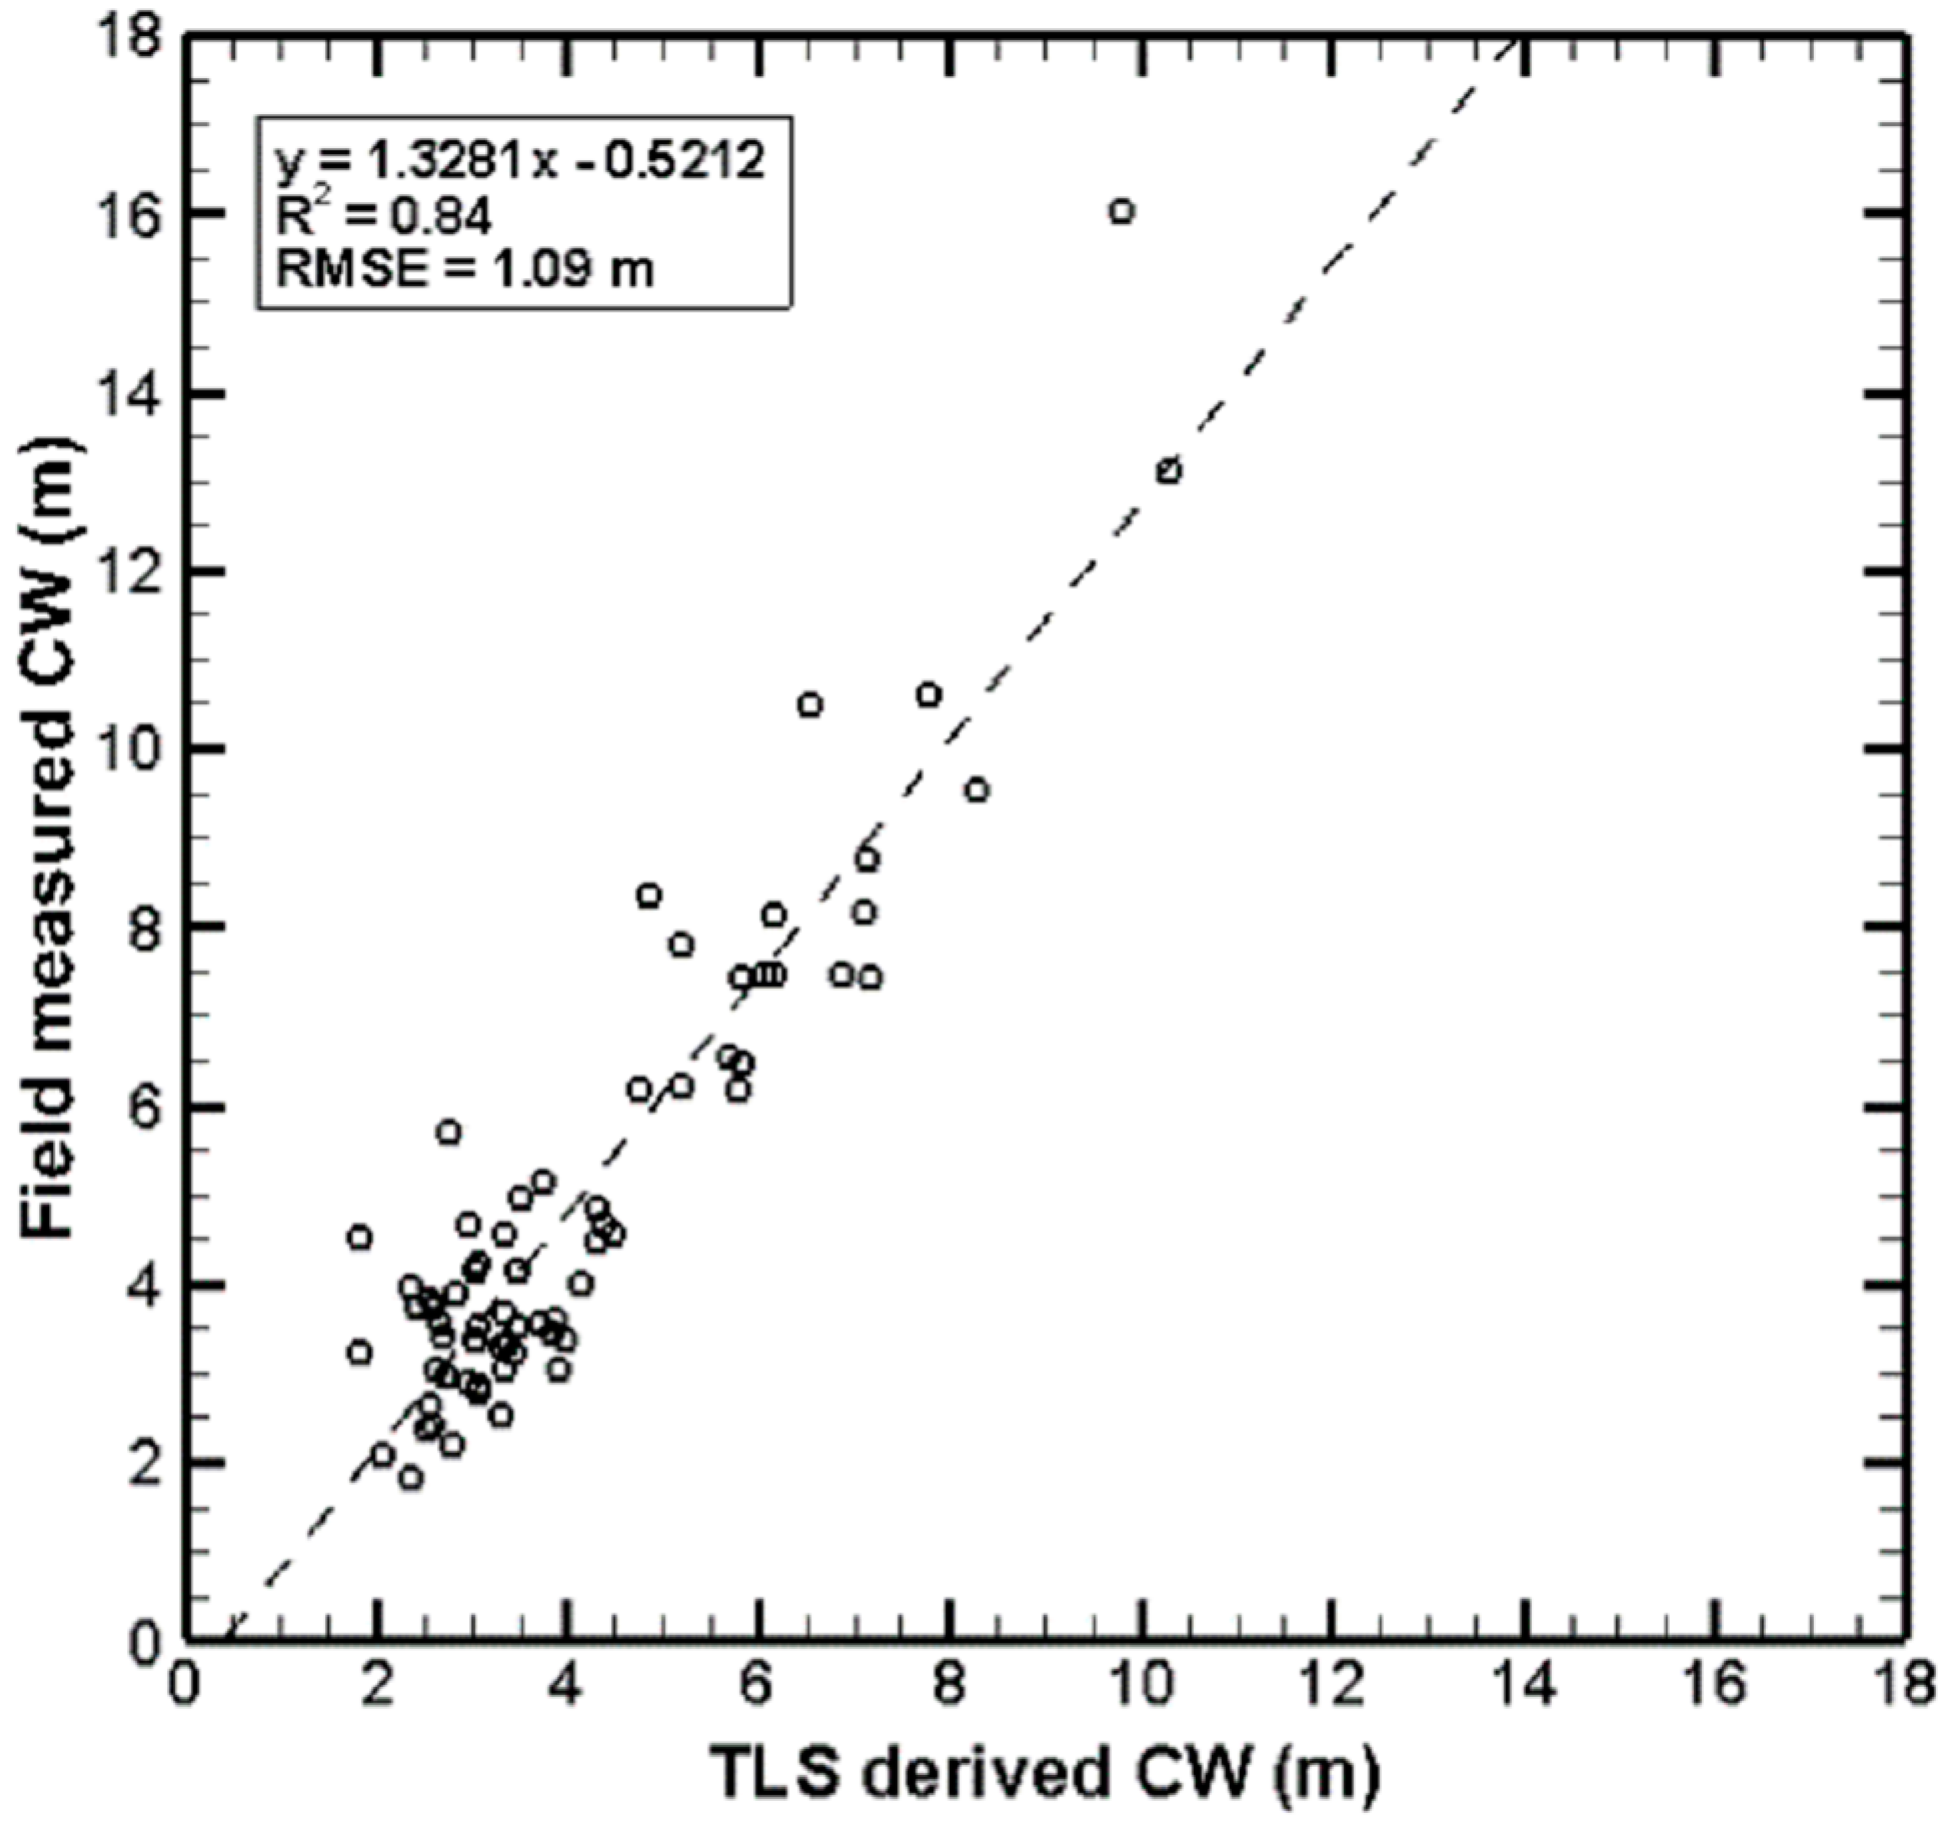
3.2. Retrieval of Tree Height and Crown Width

Van Leeuwen et al. [31] reviewed several studies and discussed the accuracy with which different forest inventory parameters can be retrieved using LiDAR. Generally, LiDAR derived heights underestimate field measured tree heights. As reported in the literature, R-squared values range from 0.75 to 0.98 for individual tree heights derived from airborne LiDAR. For TLS derived tree heights, RMSE values range from 1.4 to 4.4 m. In this study, for site 1, the R-squared value was 0.66 when TLS derived heights using vertical cut cylinders were regressed against field measured heights. The lower R-squared value could be largely attributed to the time lag between the field measured tree heights collected in August 2012 and acquisition of TLS data in March 2012. TLS derived heights underestimated field measured heights by an average of 0.6 m. Another possible reason for the unexplained height variance is that the method for tree height estimation at site 1 could result in underestimation of field measured heights for irregular crowns, because the highest point might not always be found at the center of the tree crown.
The method used to retrieve tree heights from TLS data in site 2 was more automated and provided promising results. The R-squared value was 0.92 and RMSE was 1.51 m when field measured heights were regressed against TLS derived heights for 85 trees (Figure 9). The results agreed with the findings of [18,40] that tree height measurements are less accurate in hardwood stands compared to softwood stands. It might also be expected that as the heights increase, tree height estimation errors will also increase since the laser pulses might not be able to penetrate to the treetops completely [20]. However, for site 2, heights had no influence on the tree height estimation, and it was observed that TLS derived heights overestimated field measured heights by an average of 0.30 m. This might be due to the misidentification of true treetops during field survey as some plots had dense overstory. TLS derived heights underestimated field measured heights in cases where shadowing was prevalent, which occluded the treetops.
Figure 9. Scatterplot of regression result for field and terrestrial laser scanning (TLS) derived tree heights.
Remotesensing 07 01877 g009
TLS derived crown widths for site 2 were validated using field measured crown widths for 67 trees (Figure 10). The R-squared value was 0.84 and RMSE was 1.08 m. This was significantly high compared to other studies, which derived crown widths from airborne LiDAR data [29,30,31]. TLS derived crown widths underestimated field measured crown widths by an average of 0.85 m, which was expected because field measurements provided overlapping crown widths, since the entire span of the crown was measured in the field, while TLS measurements provided only non-overlapping crown widths [30]. A positive correlation between the crown width residuals and crown widths was observed. As crown width increases, the interaction with neighboring trees also increases, which further increases the variance between field measured and TLS derived crown widths. TLS derived crown widths overestimated field measured crown widths in a few cases, where the complete extraction of an individual tree was not possible due to increased interference from adjacent crowns.
Figure 10. Scatterplot of regression result for field measured crown width and terrestrial laser scanning (TLS) derived crown width.
Remotesensing 07 01877 g010

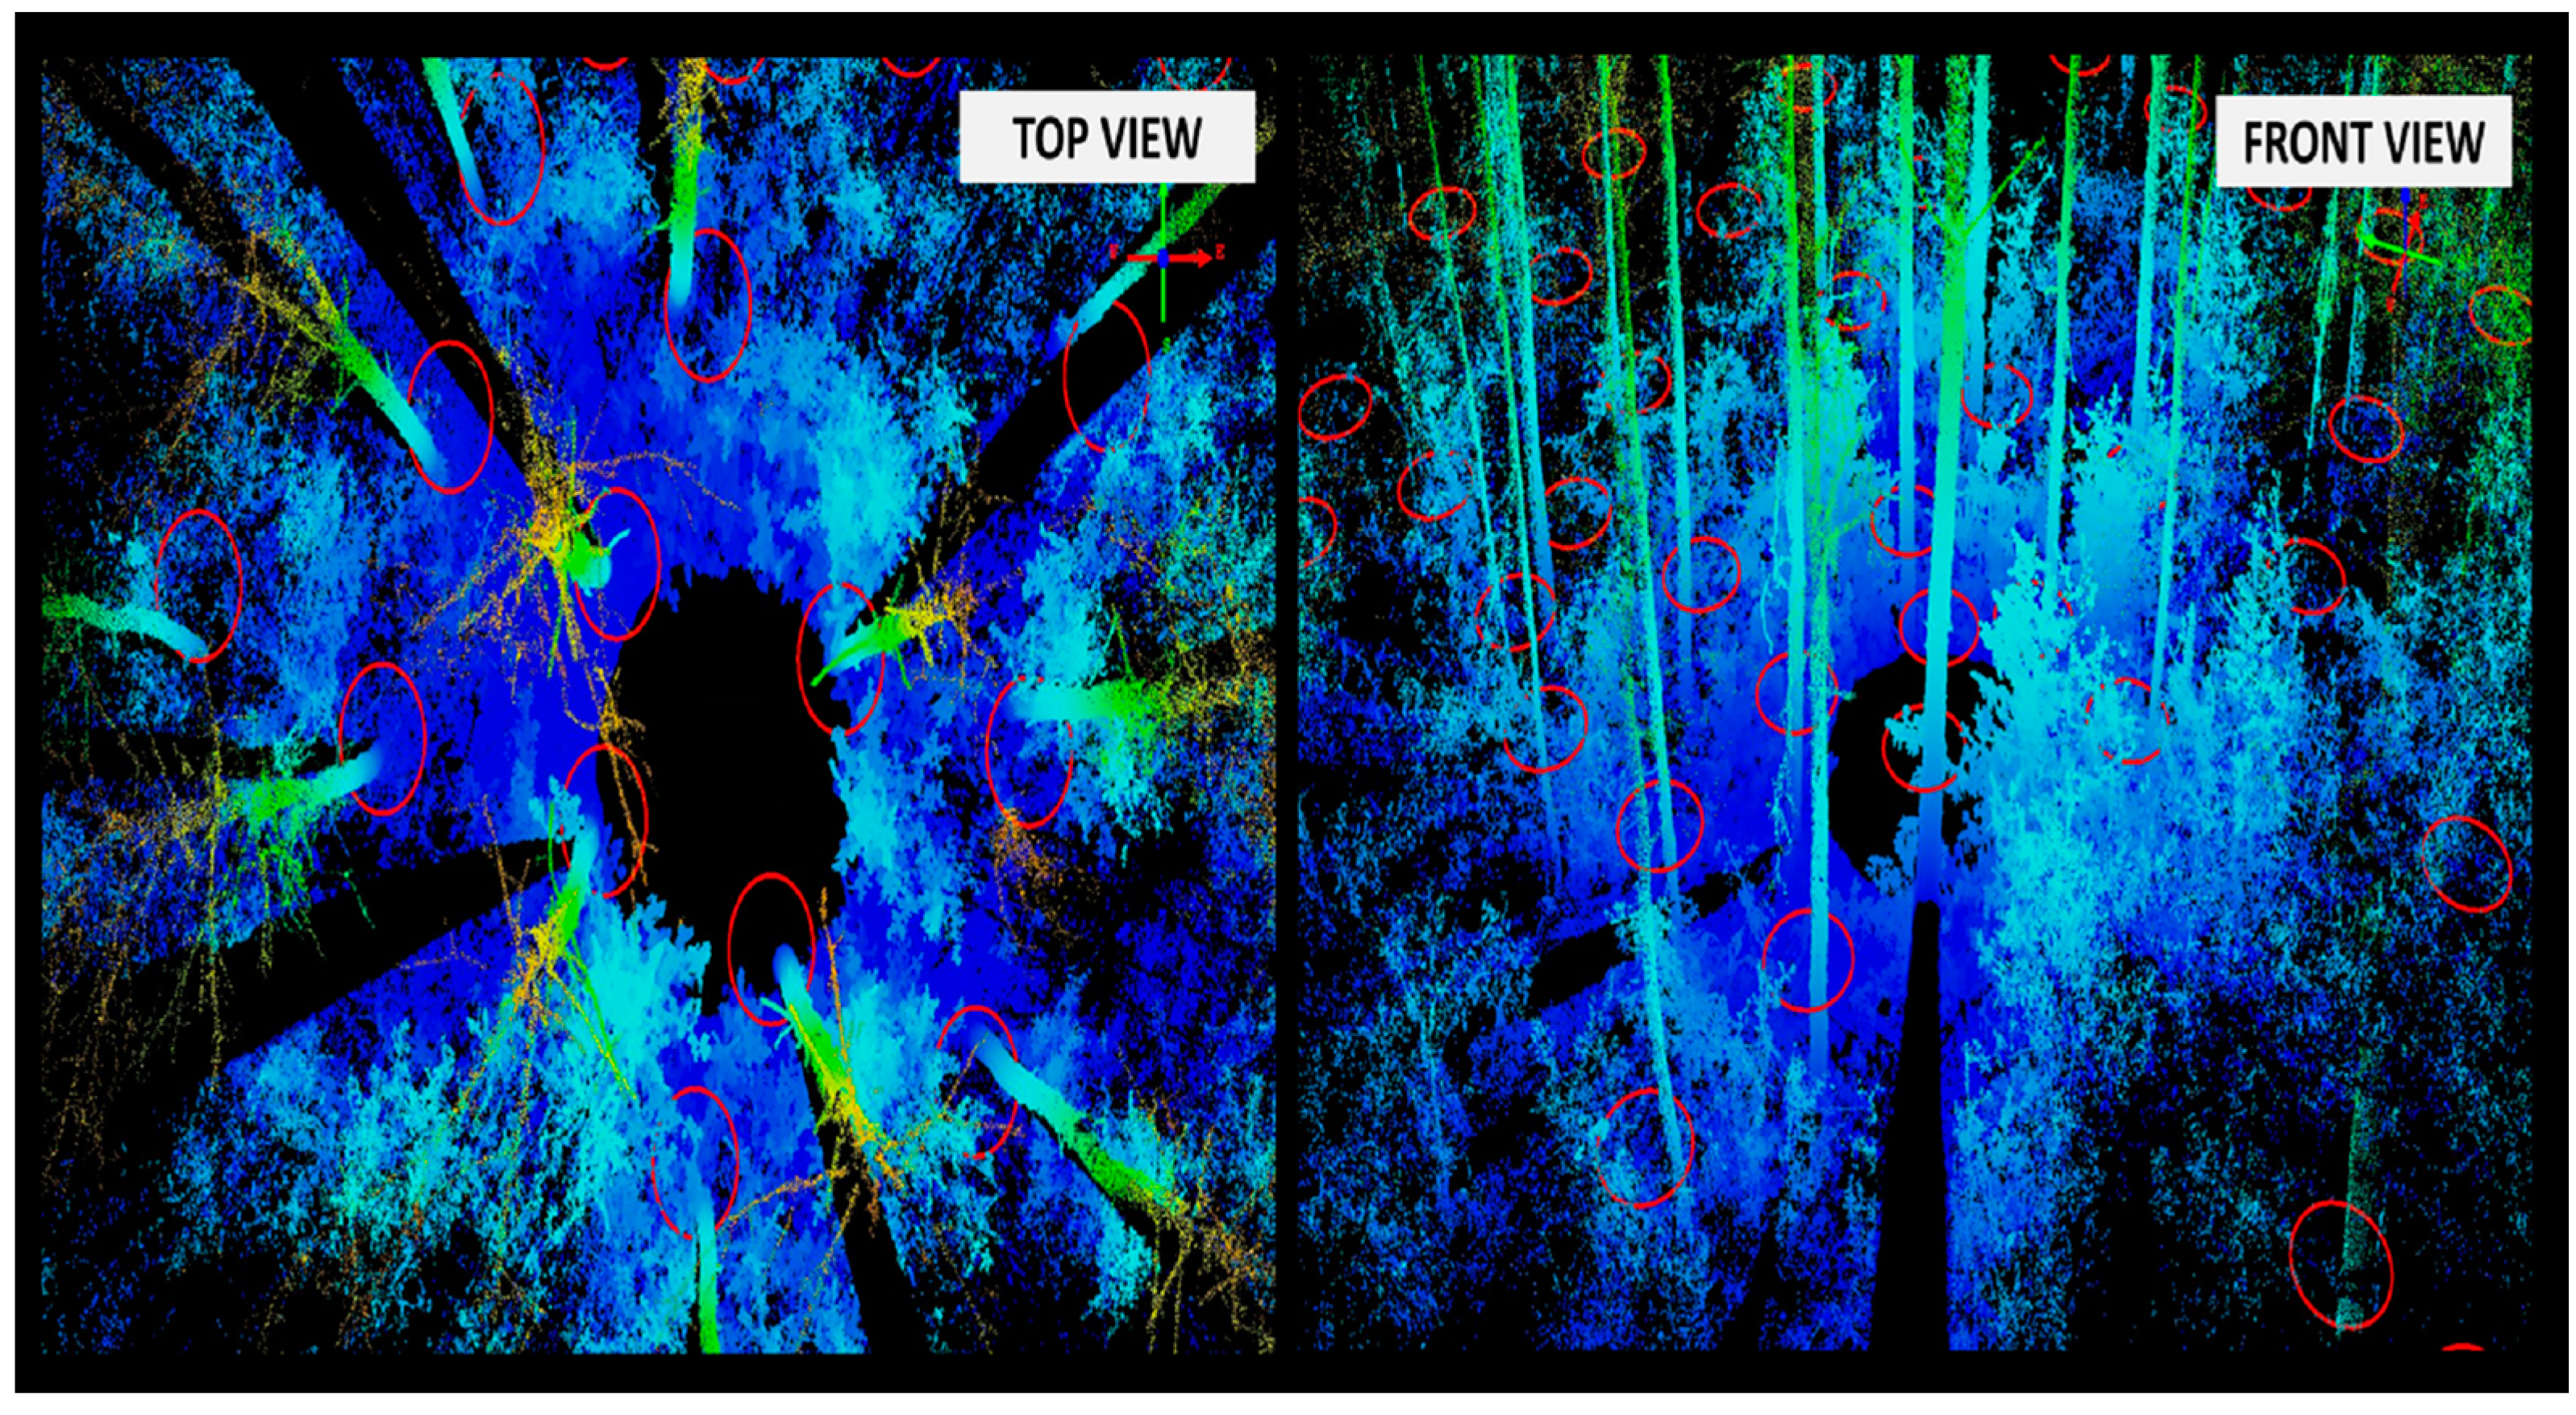
3.3. Influence of Tree Shadowing on the Accuracy of Deriving Tree Measurements

Histograms were generated for a post oak tree at site 1 (Figure 3). It was clearly seen that for the post oak tree at site 1, an increased number of laser hits was observed for leaf-on scans at lower heights and fewer laser hits were present on the upper part of the tree due to the occlusion caused by other trees, while the number of laser hits in the leaf-off scans were greater for the upper part of the tree due to less occlusion. Treetops could be missed due to shadowing while conducting leaf-on scans, leading to the underestimation of field measured tree heights.
Figure 11 depicts the influence of tree shadowing, which results in the reduction of laser pulse penetration in a plot subset at site 2. The highlighted tree 11 was shadowed by tree 12, which prevented the laser pulses from the scanner set at the plot center to fully reach the tree crown. Hence, TLS derived tree height underestimated field measured tree height by 4.47 m. The figure also shows another highlighted tree 8, which is at a distance of 10.42 m from the scanner and is also obstructed by tree 7. The heavy understory and tree 7 have minimized the penetration of laser pulses to tree 8. This led to the underestimation of field measured tree height by 4.28 m. As the tree density and branching increases, the quality of information obtained from TLS decreases. Two-direction scans can reduce the errors due to occlusion, but they are very time consuming [31]. Thus, it is very important to understand the laser pulse penetration through the canopy to reduce the uncertainties in the estimation of different forest structural parameters.
Figure 11. Reduction of the laser pulse penetration due to tree shadowing.
Remotesensing 07 01877 g011

4. Conclusions

The efficacy of TLS in retrieving different forest structural parameters accurately at an individual tree level using novel methods was clearly demonstrated in this study. Some of the new methods implemented in this study were cylinder fitting on three different height bins to retrieve DBH, tree mapping using an automatic tool developed in Python, extracting individual trees from TLS point clouds to retrieve tree height and crown width, and investigating the influence of the number of scans on DBH estimation accuracy. For site 1, due to two-direction scans and adequate laser point densities in the 1.2–1.4 m height bin, increased height bin size for cylinder fitting may not be required to retrieve DBH. For the circular plots at site 2, cylinder fitting with increased height bin size provided improved accuracies for DBH estimates from single scan TLS data. A high R-squared value of 0.97 and RMSE of 1.85 cm were obtained when DBH retrieved by cylinder fitting on 1.0–1.6 m height bin were validated against field measured DBH. The RMSE for TLS derived DBH decreased from 1.83 cm for single scan data to 0.74 cm for two-direction scan data. For site 1, individual tree level heights increased from 2010 to 2012. For site 2, as leaf-on scans were conducted for both the years, tree height increased from 2009 to 2012. The R-squared value was 0.84 when field measured crown widths were validated against TLS derived crown widths. Underestimation of field measured crown widths were observed in this study, because overlapping and non-overlapping crown widths were obtained from field measurements and TLS data respectively.
This study also discussed the influence of number of scans, distance from scanner, cylinder fitting height bin size on the estimation of various parameters. TLS derived measurements underestimated field measurements when the laser pulses had not penetrated completely to the tree crowns due to canopy shadowing. Though an increased detail amount is obtained from two-direction scans, it is time consuming in terms of data collection and processing [12,19,22]. Multiple scans should be conducted or correction factors should be applied to reduce the errors in estimation of forest structural parameters. However, the scanning times might be lesser compared to traditional surveys conducted by forest inventory field crews in some plots, especially for plots with heavy understory. We also observed that for a few trees, it was very difficult to measure the tree height using the laser range finder due to wind or interference from the adjacent tree crowns. In such cases, tree height calculation from multiple scan data will be less time consuming and more accurate than field measurements. The various metrics derived from TLS point cloud will be useful for inventory and time series analysis. Future work could investigate the potential of integrating spatially coincident airborne LiDAR data and TLS data to provide an enhanced characterization of the overstory and understory.

Acknowledgments

The authors gratefully acknowledge the support provided by NASA New Investigator Program (grant #NNX08AR12G), and the graduate student support provided by the Department of Ecosystem Science and Management and the College of Agriculture and Life Sciences at Texas A&M University. We also thank Kaiguang Zhao, Ohio State University, Muge Agca, Aksaray University in Turkey, and Jared Dee Stukey for their help with field data collection.

Author Contributions

Shruthi Srinivasan collected and analyzed data, generated and interpreted the results, prepared the manuscript, and coordinated revisions of the manuscript. Sorin Popescu secured funding for the project, assisted in data collection, assisted with the overall methodology of the study, assisted with interpretation of the results, and reviewed the manuscript. Marian Eriksson provided suggestions for the overall design of the study and reviewed the manuscript. Ryan Sheridan and Nian-Wei Ku assisted with data collection and data pre-processing.

Conflicts of Interest

The authors declare no conflict of interest.

References

  1. Næsset, E.; Gobakken, T.; Holmgren, J.; Hyyppä, H.; Hyyppä, J.; Maltamo, M.; Nilsson, M.; Olsson, H.; Persson, A.; Söderman, U. Laser scanning of forest resources: The Nordic experience. Scand. J. For. Res. 2004, 19, 482–489. [Google Scholar] [CrossRef]
  2. Kussner, R.; Mosandl, R. Comparison of direct and indirect estimation of leaf area index in mature Norway spruce stands of Eastern Germany. Can. J. For. Res. 2000, 30, 440–447. [Google Scholar] [CrossRef]
  3. Henning, J.G.; Radtke, P.J. Ground-based laser imaging for assessing three-dimensional forest canopy structure. Photogramm. Eng. Remote Sens. 2006, 72, 1349–1358. [Google Scholar] [CrossRef]
  4. Lefsky, M.A.; Cohen, W.B.; Parker, G.G.; Harding, D.J. LiDAR remote sensing for ecosystem Studies. BioScience 2002, 52, 19–30. [Google Scholar] [CrossRef]
  5. Lim, K.; Treitz, P.; Wulder, M.; St-Onge, B.; Flood, M. LiDAR remote sensing of forest structure. Prog. Phys. Geogr. 2003, 27, 88–106. [Google Scholar] [CrossRef]
  6. Chen, Q.; Gong, P.; Baldocchi, D.; Tian, Y.Q. Estimating basal area and stem volume for individual trees from LiDAR data. Photogramm. Eng. Remote Sens. 2007, 73, 1355–1365. [Google Scholar] [CrossRef]
  7. Popescu, S.C.; Zhao, K. A voxel-based LiDAR method for estimating crown base height for deciduous and pine trees. Remote Sens. Environ. 2008, 112, 767–781. [Google Scholar] [CrossRef]
  8. Falkowski, M.J.; Evans, J.S.; Martinuzzi, S.; Gessler, P.E.; Hudak, A.T. Characterizing forest succession with LiDAR data: An evaluation for the Inland Northwest, USA. Remote Sens. Environ. 2009, 113, 946–956. [Google Scholar]
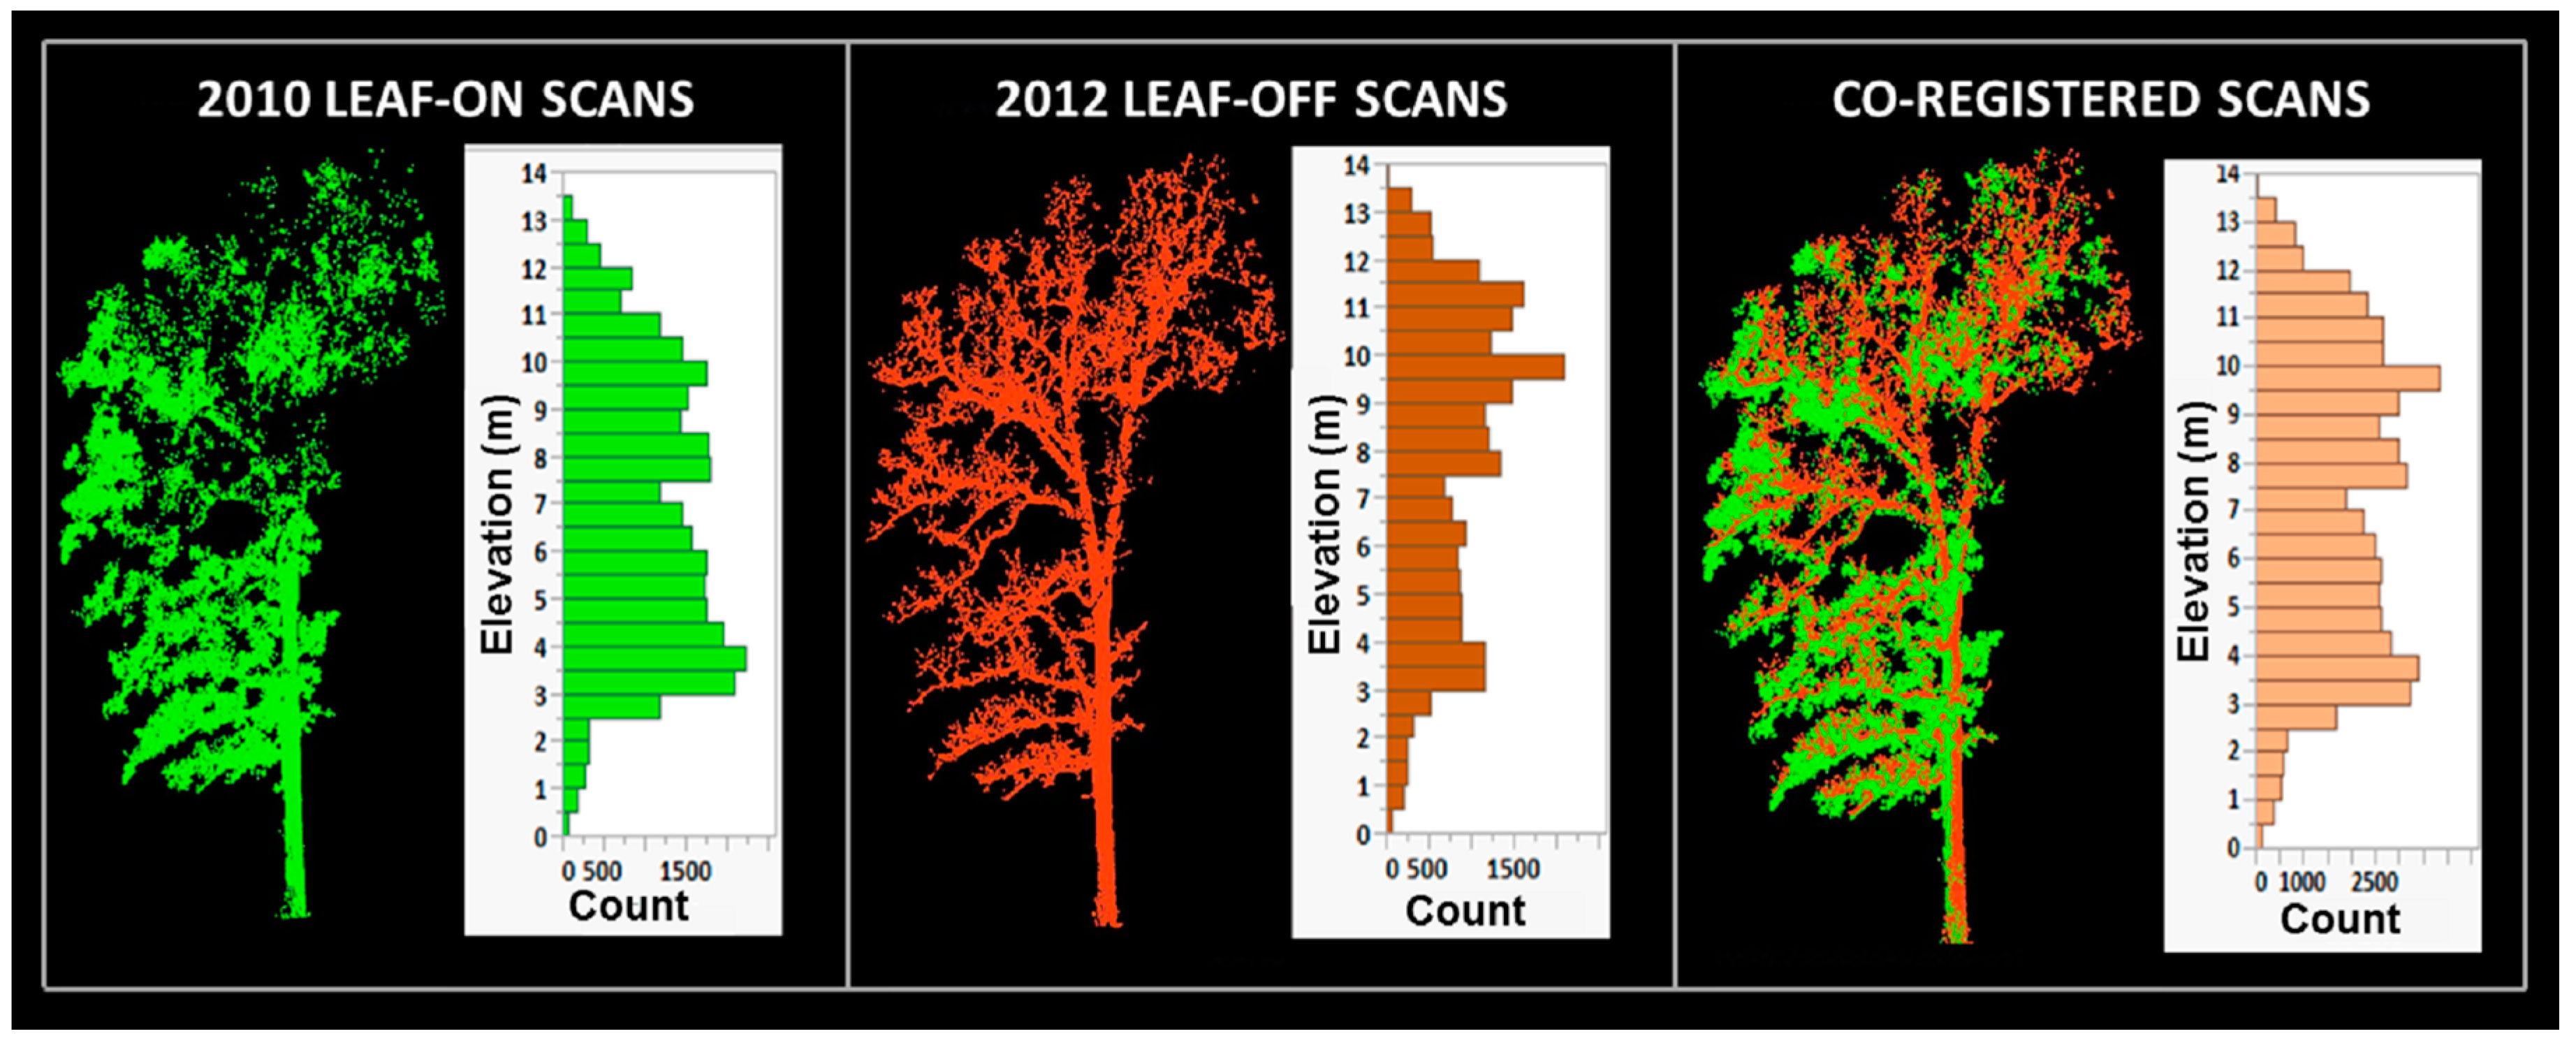
  9. Srinivasan, S.; Popescu, S.C.; Eriksson, M.; Sheridan, R.D.; Ku, N.W. Multi-temporal terrestrial laser scanning for modeling tree biomass change. For. Ecol. Manag. 2014, 318, 304–317. [Google Scholar] [CrossRef]
  10. Huang, S.; Hager, S.A.; Halligan, K.Q.; Fairweather, I.S.; Swanson, A.K.; Crabtree, R.L. A comparison of individual tree and forest plot height derived from LiDAR and InSAR. Photogramm. Eng. Remote Sens. 2009, 75, 159–167. [Google Scholar] [CrossRef]
  11. Zolkos, S.G.; Goetz, S.J.; Dubayah, R. A meta-analysis of terrestrial aboveground biomass estimation using LiDAR remote sensing. Remote Sens. Environ. 2013, 128, 289–29. [Google Scholar] [CrossRef]
  12. Dassot, M.; Constant, T.; Fournier, M. The use of terrestrial LiDAR technology in forest science: Application fields, benefits and challenges. Ann. For. Sci. 2011, 68, 959–974. [Google Scholar] [CrossRef]
  13. Loudermilk, E.L.; Hiers, J.K.; O’Brien, J.J.; Mitchell, R.J.; Singhania, A.; Fernandez, J.C.; Cropper, W.P., Jr.; Slatton, K.C. Ground-based LIDAR: A novel approach to quantify fine-scale fuelbed characteristics. Int. J. Wildland Fire 2009, 18, 676–685. [Google Scholar] [CrossRef]
  14. Moskal, L.M.; Erdody, T.; Kato, A.; Richardson, J.; Zheng, G.; Briggs, D. LiDAR applications in precision forestry. In Proceedings of Silvilaser2009, College Station, TX, USA, 14–16 October 2009.
  15. Moskal, L.M.; Zheng, G. Retrieving forest inventory variables with Terrestrial Laser Scanning (TLS) in urban heterogeneous forest. Remote Sens. 2012, 4, 1–20. [Google Scholar] [CrossRef]
  16. Kankare, V.; Holopainen, M.; Vastaranta, M.; Puttonen, E.; Yu, X.; Hyyppä, J.; Vaaja, M.; Hyyppä, H.; Alho, P. Individual tree biomass estimation using terrestrial laser scanning. ISPRS J. Photogramm. Remote Sens. 2013, 75, 64–75. [Google Scholar] [CrossRef]
  17. Lovell, J.L.; Jupp, D.L.B.; Culvenor, D.S.; Coops, N.C. Using airborne and ground-based ranging LiDAR to measure canopy structure in Australian forests. Can. J. Remote Sens. 2003, 29, 607–622. [Google Scholar] [CrossRef]
  18. Hopkinson, C.; Chasmer, L.; Young-Pow, C.; Treitz, P. Assessing forest metrics with a ground-based scanning LiDAR. Can. J. For. Res. 2004, 34, 573–583. [Google Scholar] [CrossRef]
  19. Bienert, A.; Scheller, S.; Keane, E.; Mullooly, G.; Mohan, F. Application of terrestrial laser scanners for the determination of forest inventory parameters. Int. Arch. Photogram. Remote Sens. Spat. Inf. Sci. 2006, 36. Part 5. [Google Scholar]
  20. Van der Zande, D.; Hoet, W.; Jonckheere, I.; van Aardt, J.; Coppin, P. Influence of measurement set-up of ground-based LiDAR for derivation of tree structure. Agric. For. Meteorol. 2006, 141, 147–160. [Google Scholar] [CrossRef]
  21. Watt, P.J.; Donoghue, D.N.M. Measuring forest structure with terrestrial laser scanning. Int. J. Remote Sens. 2005, 26, 1437–1446. [Google Scholar] [CrossRef]
  22. Aschoff, T.; Spiecker, H. Algorithms for the automatic detection of trees in laser scanner data. Int. Arch. Photogram. Remote Sens. Spat. Inf. Sci. 2004, 36, 66–70. [Google Scholar]
  23. Brolly, G.; Kiraly, G. Algorithms for stem mapping by means of terrestrial laser scanning. Acta Silv. Lignaria Hung. 2009, 5, 119–130. [Google Scholar]
  24. Tansey, K.; Selmes, N.; Anstee, A.; Tate, N.J.; Denniss, A. Estimating tree and stand variables in a Corsican Pine woodland from terrestrial laser scanner data. Int. J. Remote Sens. 2009, 30, 5195–5209. [Google Scholar] [CrossRef]
  25. Thies, M.; Spiecker, H. Evaluation and future prospects of terrestrial laser scanning for standardized forest inventories. Int. Arch. Photogram. Remote Sens. Spat. Inf. Sci. 2004, 36, 192–197. [Google Scholar]
  26. Wezyk, P.; Koziol, K.; Glista, M.; Pierzchalski, M. Terrestrial laser scanning versus traditional forest inventory. First results from the Polish forests. Int. Arch. Photogram. Rem. Sens. Spat. Inf. Sci. 2007, 36, 424–429. [Google Scholar]
  27. Dubayah, R.O.; Drake, J.B. LiDAR remote sensing for forestry. J. For. 2000, 98, 44–46. [Google Scholar]
  28. Chasmer, L.; Hopkinson, C.; Treitz, P. Investigating laser pulse penetration through a conifer canopy by integrating airborne and terrestrial LiDAR. Can. J. Remote Sens. 2006, 32, 116–125. [Google Scholar]
  29. Evans, D.L.; Roberts, S.D.; Parker, R.C. LiDAR A new tool for forest measurements? For. Chron. 2006, 82, 211–218. [Google Scholar] [CrossRef]
  30. Popescu, S.C.; Wynne, R.H.; Nelson, R.F. Measuring individual tree crown diameter with LiDAR and assessing its influence on estimating forest volume and biomass. Can. J. Remote Sens. 2003, 29, 564–577. [Google Scholar] [CrossRef]
  31. Van Leeuwen, M.; Nieuwenhuis, M. Retrieval of forest structural parameters using LiDAR remote sensing. Eur. J. For. Res. 2010, 129, 749–770. [Google Scholar] [CrossRef]
  32. Johnsen, K.H.; Wear, D.; Oren, R.; Teskey, R.O.; Sanchez, F.; Will, R.; Butnor, J.; Markewitz, D.; Richter, D.; Rials, T.; et al. Meeting global policy commitments: Carbon sequestration and southern pine forests. J. For. 2001, 99, 14–21. [Google Scholar]
  33. Popescu, S.C. Estimating biomass of individual pine trees using airborne LiDAR. Biomass Bioenerg 2007, 31, 646–655. [Google Scholar] [CrossRef]
  34. Kociuba, W.; Kubisz, W.; Zagórski, P. Use of Terrestrial Laser Scanning (TLS) for monitoring and modelling of geomorphic processes and phenomena at a small and medium spatial scale in Polar environment (Scott River—Spitsbergen). Geomorphology 2014, 212, 84–96. [Google Scholar] [CrossRef]
  35. Leica Cyclone (Version 7.1.3). Available online: http://hds.leica-geosystems.com/en/Leica-Cyclone_6515.htm (accessed on 26 January 2015).
  36. Applied Imagery, 2010. Quick Terrain Modeler (Version 7.1.4). Available online: http://www.appliedimagery.com (accessed on 26 January 2015).
  37. Li, W.; Guo, Q.; Jakubowski, M.K.; Kelly, M. A new method for segmenting individual trees from the LiDAR point cloud. Photogramm. Eng. Remote Sens. 2012, 78, 75–84. [Google Scholar] [CrossRef]
  38. McGaughey, R.J. FUSION/LDV: Software for LIDAR Data Analysis and Visualization; USDA Forest Service, Pacific Northwest Research Station: Seattle, WA, USA, 2014.
  39. Pueschel, P.; Newnham, G.; Rock, G.; Udelhoven, T.; Werner, W.; Hill, J. The influence of scan mode and circle fitting on tree stem detection, stem diameter and volume extraction from terrestrial laser scans. ISPRS J. Photogramm. Remote Sens. 2013, 77, 44–56. [Google Scholar] [CrossRef]
  40. Williams, M.S.; Bechtold, W.A.; LaBau, V.J. Five instruments for measuring tree height: An evaluation. South. J. Appl. For. 1994, 18, 76–82. [Google Scholar]

