1. Introduction
Demographic and economic changes in Africa over the last several decades have been of growing interest to social scientists. During this time, however, international and civil conflict, persisting poverty, geographical remoteness of some areas in Africa and political isolation of other areas there have contributed to a dearth of reliable, country-specific data for studying large parts of the continent. As a consequence, and compared to more developed regions of the world, reliable and detailed information on important social and economic variables in Africa has been limited. Beyond questions of the quality of data pertaining to large parts of Africa, available information on population and economic output for many African countries can at best be found only at the national or provincial level. Data for smaller and more detailed areas are almost non-existent. But even at the national level, measurement errors for these data are generally unknown, though assumed to be high. Obtaining a better and a more precise index for smaller areas, is an essential task for researchers.
Satellite-based nighttime lights measures may hold the potential to overcome this problem by providing a proxy measure for current population and economic statistics. Among the multiple light products produced by the Defense Meteorological Satellite Program (DMSP) Operational Linescan System (OLS), the stable light series has been tested in multiple studies as a proxy measure of various statistics [
1,
2,
3,
4,
5,
6]. More recently, relying on formal statistical methods, the data on stable lights have been used as a proxy to improve current economic statistics [
7,
8,
9,
10].
Since 2012, new lights information collected by the Visible Infrared Imaging Radiometer Suite (VIIRS) instrument—became available. VIIRS lights data, with a higher quality that captures more spatial details, can potentially provide more information for estimating population or economic indicators than other lights product produced by DMSP. The superior features of VIIRS and its benefit over other DMSP lights has been discussed in Elvidge
et al. [
11]. A more detailed introduction on the Suomi satellite which generates the VIIRS images can be found in Miller
et al. [
12]. In general, the higher quality of VIIRS lights compared with early DMSP-OLS lights has been attributed to the following aspects [
11]: (1) Because data are collected by sensors with differing specifications, the pixel ground footprint of the VIIRS image is 45 times smaller than the DMSP footprint. The pixel footprint of OLS data are 5 km × 5 km at nadir while expand at the edge of scan. In contrast, the pixel footprint of VIIRS data are 742 m × 742 m consistently at nadir and the edge of scan. Thus, processed VIIRS lights data are stored in higher spatial resolution at 15 arc-second instead of 30 arc-second of DMSP lights; (2) A VIIRS image has no light saturation problems as the result of using wider radiometric detection range and onboard calibration; (3) VIIRS instrument collects imaging data in 22 spectral bands, and its day-night band (DNB) has a lower detection threshold which can record dimmer lights than can a DMSP satellite. These improvements have the potential to remove some of the most serious issues arising in the earlier stable lights data set.
The most recent studies on VIIRS and regional economic indicators show that VIIRS has better predictive power for estimating economic data than other DMSP-OLS data [
13,
14]. These recent studies have particularly focused on China, which has high population density and a fast-growing economy.
However, utilizing VIIRS lights to study areas with a low population and less output per capita has not been investigated. Extension and testing of VIIRS to other world regions is needed, as previous studies investigating DMSP-OLS data has shown that its usefulness is country or region specific [
7,
8].
2. Results from Using DMPS-OLS Lights to Measure GDP
Major findings from past research shows that DMSP nighttime lights products, especially stable lights, can provide useful information for economic output measures [
7,
8,
9,
10]. Aiming at countries and subnational regions with low-quality data systems, Nordhaus and Chen’s research proposed and implemented a statistical method to test whether nighttime luminosity measures could be used to improve estimates of output at the regional and grid cell levels. When countries are classified based on data quality from A to E (similar to the grading system of the Penn World Table 6.3 [
15]), they found that luminosity variables derived from stable lights are likely to add value for countries with the poorest statistical systems, those that received D or an E grade, but had very limited value added for wealthy or middle-income countries (A, B, and C countries). These results were not only observed at the national level but also at the 1° by 1° grid cell level.
In their bootstrap analysis on estimation error, Nordhaus and Chen [
8] found further support for their initial findings when tested against updated data. That study determined that there is substantial promise in using lights data for estimating economic output per grid cell (the density estimate) for countries with low-quality data. (The other studies using economic methods focused on time-series properties.) Nordhaus and Chen [
8] showed that the cross-sectional errors in estimating the optimal weights for poor countries came primarily from uncertainty about the error in the standard output data and not from the measurement errors for lights or in the lights-output coefficient. In other words, if the errors in standard cross-section measures could be more precisely determined, there would be substantial information in the lights data that could be used to supplement current estimates of the level of output for both countries and grid cells.
However, one of the major limitations of using stable lights as a proxy uncovered in Nordhaus and Chen [
8] was that there were very few useful observations for the poorest regions because stable lights have a zero value there due to low resolution of DMSP-OLS sensors. Nordhaus and Chen [
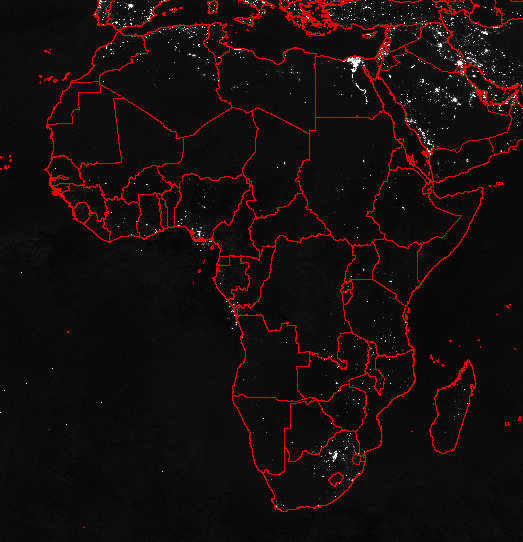
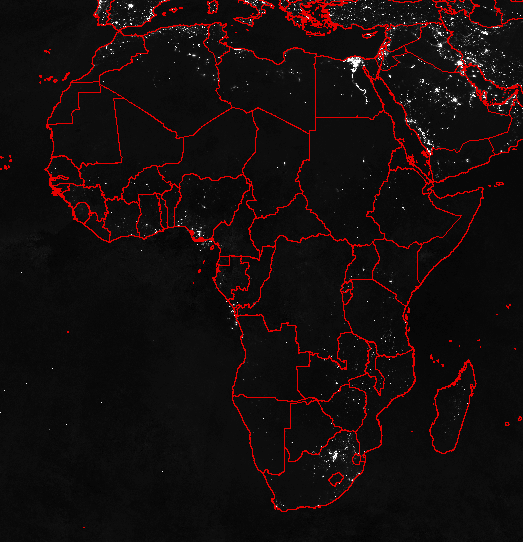
8] noted that for the entire globe, almost one-third of grid-cells with positive population and output were coded as zero for the light measurement. Although these grid-cells contain only a small fraction of output and population, they cover a large land area. Because a large number of stable lights grid cells have zero value, using DMSP stable lights particularly influences the estimates for Africa, as large areas in Africa have low population density and low productivity and the subsequent dimmer lights in such areas are most likely not detected by DMSP satellites.
Furthermore, because logarithm transformation is used in the formal statistical models, the large number of zero cells can result in the elimination of observations and reduction in sample size in the analysis. Thus, reliable estimates of low-output-density regions with previous stable lights measurements cannot be obtained. Paradoxically, those are the areas that we have the least reliable standard measures on, and thus the areas with the greatest need to substantially improve standard statistics with nighttime lights information.
3. Objectives of Present Study
The purpose of the present paper is to test whether new VIIRS lights can provide more information for population and output measures compared to stable lights. Because of the large number of zero stable light cells located in Africa, we focus on VIIRS light measures in Africa in the following analysis.
Stable light cell values are processed from stable lights images for year 2010 (F18). F18 refers to DMSP satellite number F18. [
16]. The stable lights image is in 30 arc-second grids with pixel values ranging from 0 to 63. The VIIRS lights cell value is calculated with the two months composite image of VIIRS DNB [
17]. This data was generated based on observations on 4–18 April 2012 and 11–23 October 2012. The Earth Observation Group currently provides monthly composites from April and October of 2012 and January 2013, as well as a two month composite that is used here. We chose the two month composite (April and October observations) because this composite is generated based on observations that are 6 months apart and therefore is closer to the annual average than the monthly data. The VIIRS data was not filtered as much as the stable lights. In particular, the background noise, such as snow covered mountains or dry lake beds, fires, gas flare or volcanoes have not been removed in VIIRS lights [
17]. The VIIRS lights are 15 arc-second grids, and the units are nano-Watts/(cm
2·sr) (In stable lights, the relative values 0 to 63 are visible band data, rather than absolute values in Watts/m
2.) [
18].The pixel value of the VIIRS is a non-integer, ranging from −1.4011 to 32641.72 (The VIIRS sensor has a noise floor, in which the digital values are very small. One of the objectives of calibration is to set the average value of the noise floor to zero. Therefore, there is a combination of positive and negative values in the noise floor. Very small fraction of cells with negative values show up in VIIRS data, and these negative values tend to be very small.). The value of pixels for both stable lights and VIIRS lights are summed to 1° by 1° arc grid cell with the Zonal function in the Arcmap program. The term “cell” below always refers to 1° by 1° grid cell, and cell values are summed product. Projected grid cell population measures for year 2005 are downloaded from the Gridded Population of the World (GPW) [
19], and grid cell production (GCP) of year 2005 are downloaded from the most recent dataset of the Yale G-Econ project [
20]. In this particular study, GCP is measured at purchasing power parity (PPP) in constant 2005 international dollars. Note that because the derivation of GCP considered cell population distribution, the GPW and GCP are not independent of each other. Detailed information on GCP calculation can be found in [
20].
For the statistical analysis below, we begin with a statistical model. Based on our earlier analysis, we assume that measured output (and population) and lights are unbiased estimates of “true” output (and population) with independent measurement error. We can rewrite the relationships as the following equations between two cell lights, cell population, and GCP values. The regressions are estimated in logarithmic form to deal with heteroskedasticity. A test of the error variance shows that it is strongly positively correlated with population.
where
y denotes log cell population or log GCP, and
x1and
x2 denote log cell stable lights and VIIRS lights respectively. The ε
i are error terms that contain the measurement errors of both lights and standard output and population measures. As shown in our earlier studies, while these cannot be directly estimated to provide the underlying relationships, they can be used to test the explanatory power of different lights measures. The question examined here is whether the VIIRS lights data are more closely associated with population and output than stable lights. This question is especially important for cells with extremely small output and population, that is, for areas with low economic and population density.
4. Tests and Results
There are 2747 1° by 1° arc grid cells in Africa. The value of cell stable lights ranges from 0 to 249718. 41% of these grid cells, or 1130 cells, have a stable lights value of zero. In comparison, aggregating VIIRS lights to the grid cell results in no zero value cells in Africa. The VIIRS lights cells range from 0.047 to 297024. Based on the GPW data, only 7 cells have a zero population, while 1262, or 45% of cells, have populations above 100,000 and 2149 cells, or 78% of cells, have populations above 10,000. The densest cell has a population of over 10,000,000. The same 7 zero-population cells also have zero GCP by construction. In addition, 141 cells have missing values in the GCP measure, which include 54 cells in Zimbabwe, 79 cells in Somalia and the other 8 cells being of small islands and territories, such as Saint Helena and Mayotte. Missing values in the G-Econ data primarily result from the absence of official national records from the Word Bank (see the documentation at gecon.yale.edu for further explanation on the process of generating the G-Econ data [
20]).
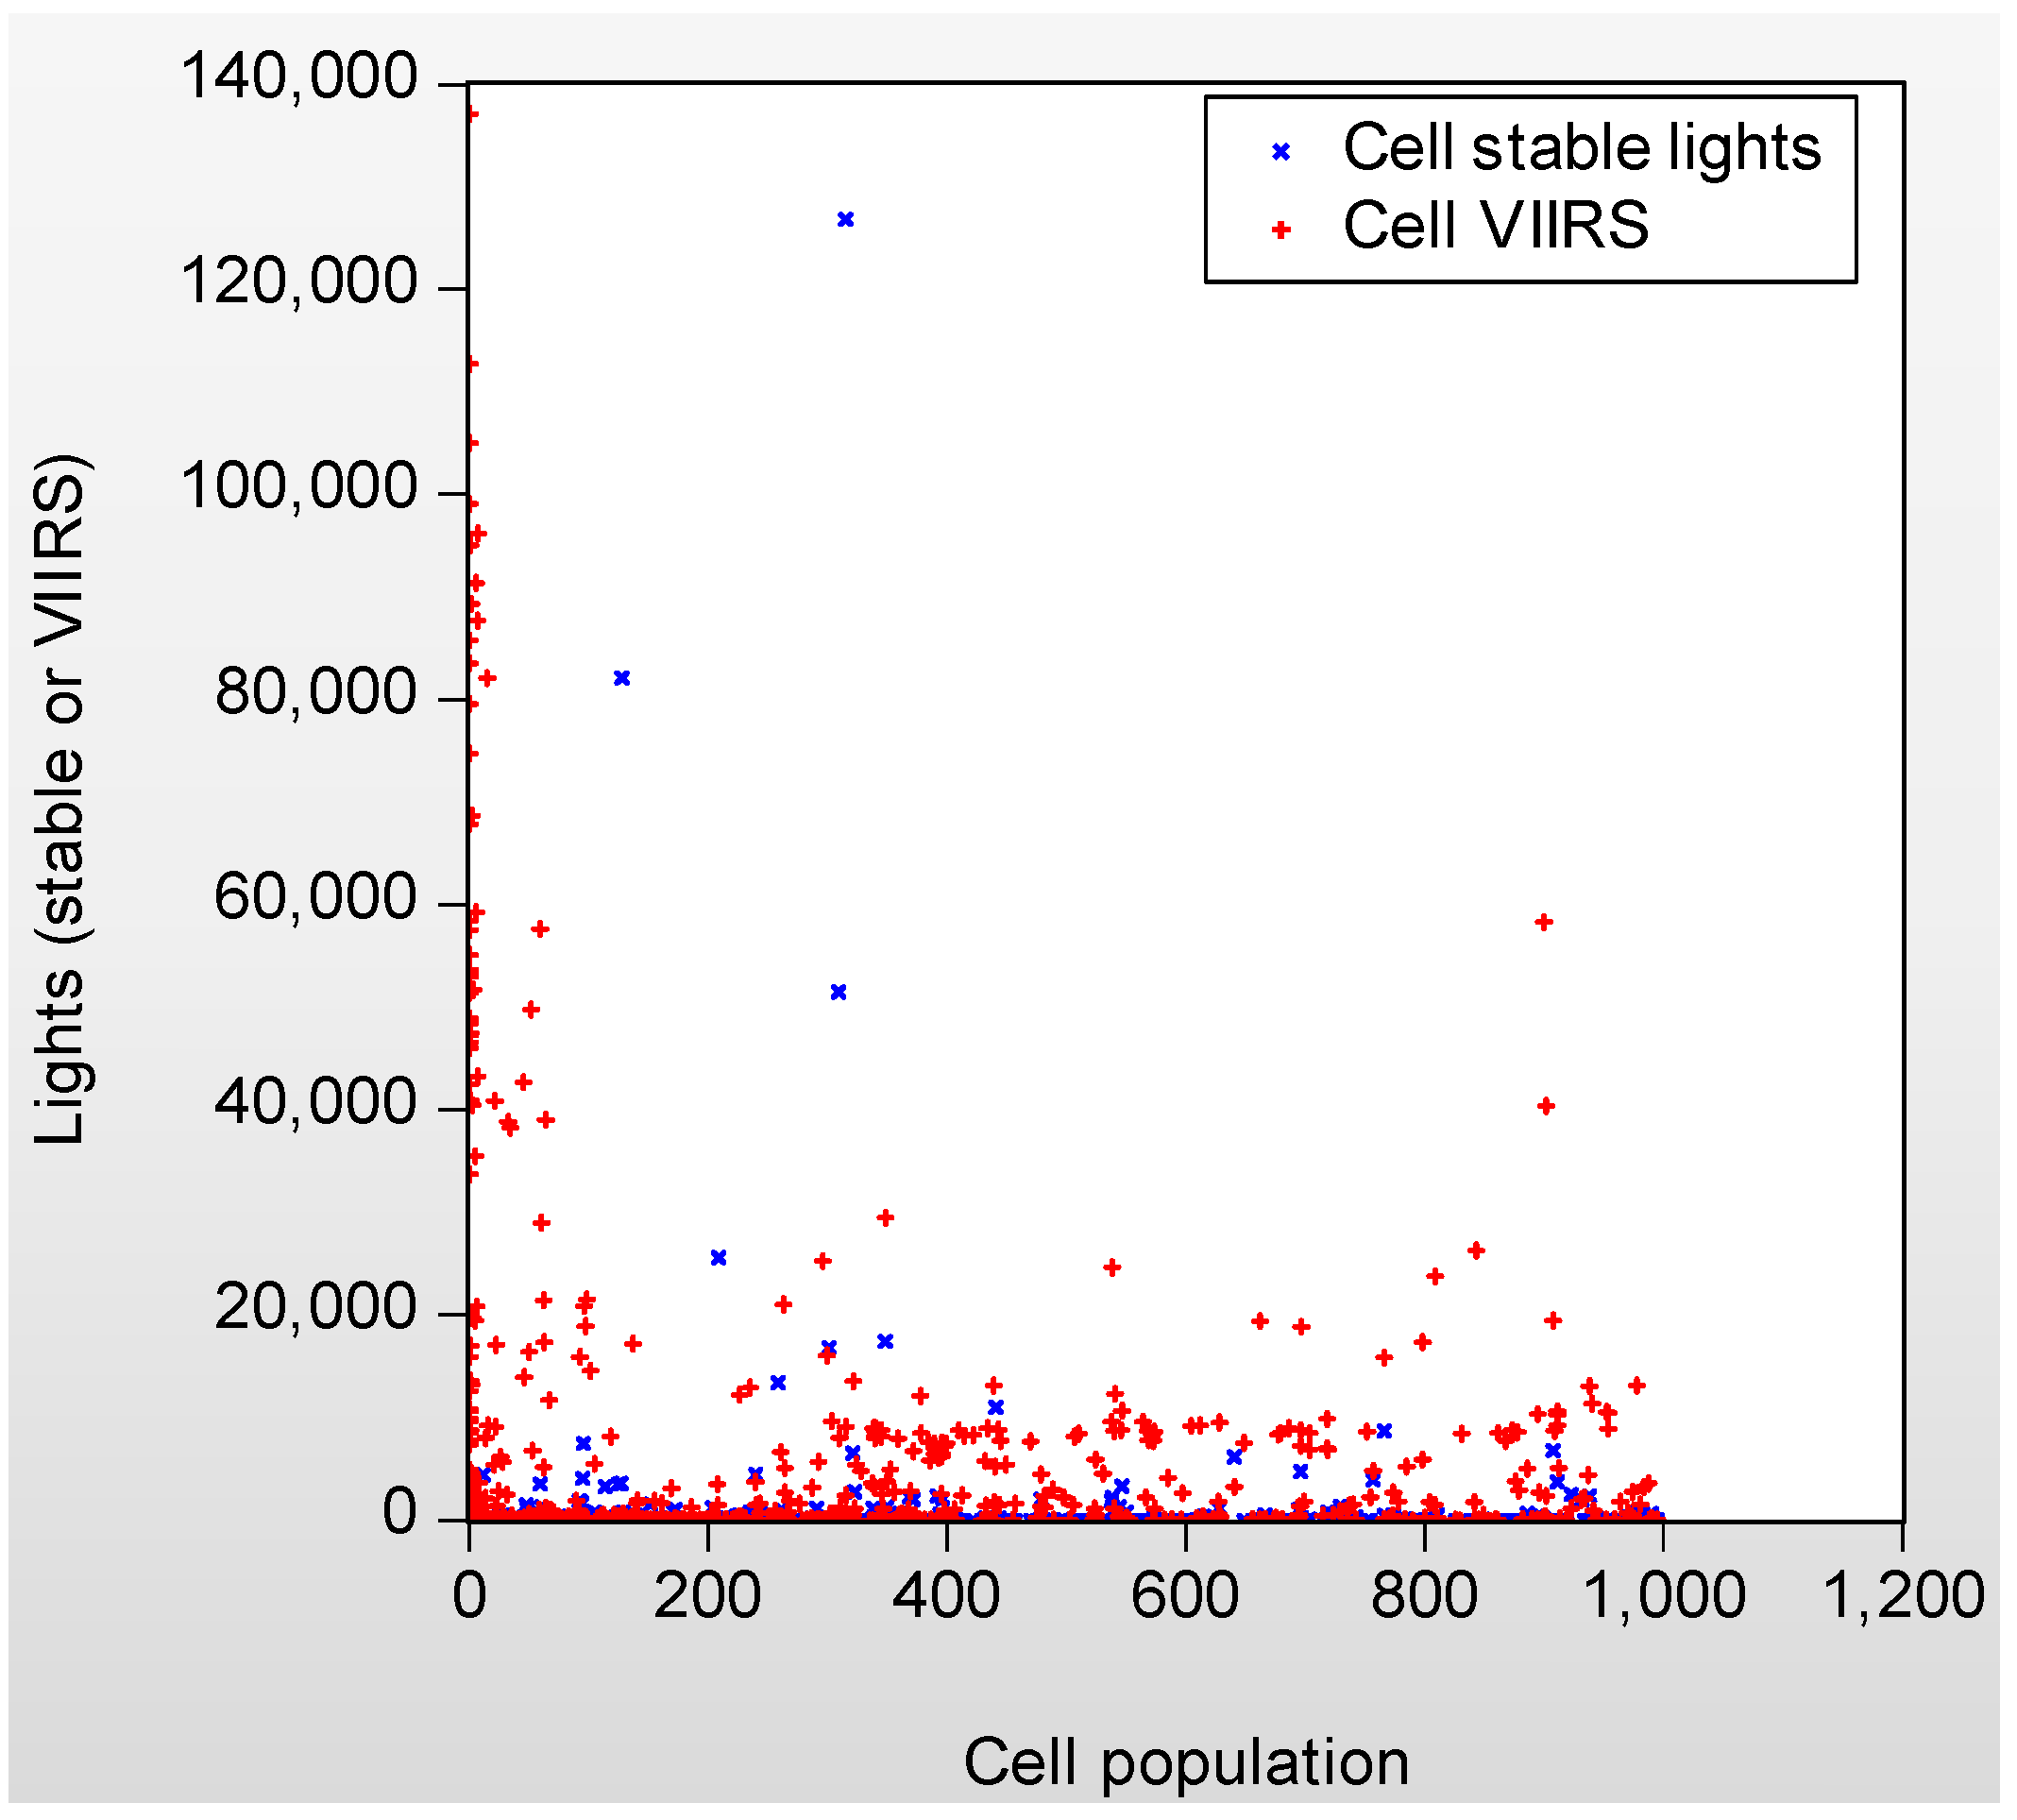
Figure 1 shows the scatter plot of cell stable lights and VIIRS lights against cell population. The figure is arithmetic to show the data at the lower end of population. There are substantially more non-zero VIIRS cells than non-zero stable lights cells for low-population regions. In African cells with low population (less than 10,000 people), all have observations on VIIRS, while 426 cells have zero values for stable lights. This suggests that VIIRS lights might provide more information for poorer areas compared to stable lights. However, the disproportionally large number of non-zero VIIRS lights is found for areas where cell populations are extremely small, or close to zero, which indicates that VIIRS lights might detect dim lights that are not related with human activities.
Figure 1.
Scatter plot of cell population, stable lights, and Visible Infrared Imaging Radiometer Suite (VIIRS) lights for cells with a population < 1000.
Figure 1.
Scatter plot of cell population, stable lights, and Visible Infrared Imaging Radiometer Suite (VIIRS) lights for cells with a population < 1000.
Below, we use correlation statistics and regression models on cell population and GCP to further explore and compare the usefulness of the two lights products. All cell values are expressed in logarithms in the following analysis. In order to keep consistent sample size in comparing two lights, for cell stable lights with zero values, the cell value is set to 1 before logarithm transformation.
Table1 reports the fraction of each sample with zero value in stable lights.
Table 2,
Table 3,
Table 4, and
Table 5 report pairwise correlation coefficients for cells with populations less than 100, 1000, 10,000, and 100,000 respectively. There is a distinct improvement in this sample from using VIIRS rather than stable lights. More precisely, results show that cell VIIRS lights have stronger correlation with cell population and GCP than cell stable lights for all samples. In addition, the correlation coefficients of VIIRS lights and two standard indexes across samples vary slightly, ranging between 0.48 to 0.60, while the coefficients of stable lights vary largely across samples, ranging between 0.10 and 0.48. For cells with low-density population, the correlations of stable lights and two standard indexes are much weaker, but with an increasing sample size that includes denser cells, the correlation of stable lights become stronger. However, even for the largest sample, or 50% of all of African cells, the correlation of stable lights and population is still much weaker (0.271) than the correlation of VIIRS lights and population (0.588).
Table 1.
Fraction of samples with zero values in stable lights.
Table 1.
Fraction of samples with zero values in stable lights.
| Cells with Population > 0 | Total Number of Cells | Number of Cells (Stable Lights = 0) | % of Cells (Stable Lights = 0) |
|---|
| All cells | 2740 | 1123 | 41.0% |
| Cells with population < 100 | 36 | 32 | 88.9% |
| Cells with population < 1000 | 160 | 138 | 86.3% |
| Cells with population < 10,000 | 591 | 426 | 72.1% |
| Cells with population < 100,000 | 1478 | 881 | 59.6% |
Table 2.
Pairwise correlations for cells with population less than 100. Sample sizes are below coefficients (** p < 0.01; *** p < 0.001).
Table 2.
Pairwise correlations for cells with population less than 100. Sample sizes are below coefficients (** p < 0.01; *** p < 0.001).
| Variable | VIIRS Lights | Stable Lights | Population |
|---|
| Stable lights | 0.2836 | | |
| | 43 | | |
| Population | 0.5385 *** | 0.2315 | |
| | 36 | 36 | |
| GCP | 0.4811 ** | 0.2732 | 0.7537 |
| | 34 | 34 | 34 |
Table 3.
Pairwise correlations for cells with population less than 1000 (* p < 0.05, *** p < 0.001).
Table 3.
Pairwise correlations for cells with population less than 1000 (* p < 0.05, *** p < 0.001).
| Variable | VIIRS Lights | Stable Lights | Population |
|---|
| Stable lights | 0.1723 * | | |
| | 167 | | |
| Population | 0.5576 *** | 0.0998 | |
| | 160 | 160 | |
| GCP | 0.529 *** | 0.2873 *** | 0.772 *** |
| | 146 | 146 | 146 |
Table 4.
Pairwise correlations for cells with population less than 10,000 (*** p < 0.001).
Table 4.
Pairwise correlations for cells with population less than 10,000 (*** p < 0.001).
| Variable | VIIRS Lights | Stable Lights | Population |
|---|
| Stable lights | 0.249 *** | | |
| | 598 | | |
| Population | 0.6044 *** | 0.2236 *** | |
| | 591 | 591 | |
| GCP | 0.5798 *** | 0.442 *** | 0.8111 |
| | 562 | 562 | 562 |
Table 5.
Pairwise correlations for cells with population less than 100,000 (*** p < 0.001).
Table 5.
Pairwise correlations for cells with population less than 100,000 (*** p < 0.001).
| Variable | VIIRS Lights | Stable Lights | Population |
|---|
| Stable lights | 0.2661 *** | | |
| | 1485 | | |
| Population | 0.5878 *** | 0.2714 *** | |
| | 1478 | 1478 | |
| GCP | 0.5817 *** | 0.4833 *** | 0.8338 *** |
| | 1388 | 1388 | 1388 |
Table 6,
Table 7,
Table 8,
Table 9 and
Table 10 report five groups of regression results for different cell samples. The dependent variable is either log cell population or log GCP, and independent variables include log cell stable lights, VIIRS lights, or both. For the sample of cell populations less than 100 (
Table 6), none of the stable lights coefficients are significant, while all VIIRS lights coefficients are significant. The explained variance in either cell population or GCP also increases substantially when VIIRS lights are included in the model. Similar results are found for the sample of cells with less than 1000 population (
Table 7), except that stable lights coefficients become significant in predicting GCP. It is clear that the large fraction of zero values in stable lights, especially in the sample of cells with populations of less than 100 and in samples with a populations less than 1000, contribute to the poor results in regression model. For the sample of cells with populations less than 10,000 or 100,000, stable lights coefficients are significant at the 0.05 level in all models, but the magnitude is much smaller than VIIRS lights coefficients, especially in the model that predicts population. Again, for these two larger samples, using VIIRS lights as a predictor can substantially increase explained variance in both population and GCP.
Table 6.
Operational Linescan System (OLS) regression for cells with population less than 100 (* p < 0.05; ** p < 0.01; *** p < 0.001).
Table 6.
Operational Linescan System (OLS) regression for cells with population less than 100 (* p < 0.05; ** p < 0.01; *** p < 0.001).
| Independent Variable | (1) | (2) | (3) | (4) | (5) | (6) |
|---|
| Population | Population | Population | GCP | GCP | GCP |
|---|
| Stable lights | 0.248 | | 0.0805 | 0.468 | | 0.245 |
| | −0.179 | | −0.164 | −0.291 | | −0.279 |
| VIIRS lights | | 0.329 *** | 0.315 ** | | 0.477 ** | 0.435 * |
| | | −0.0884 | −0.0938 | | −0.154 | −0.162 |
| Constant | 2.696 *** | 2.262 *** | 2.247 *** | 3.499 *** | 2.891 *** | 2.840 *** |
| | −0.269 | −0.266 | −0.271 | −0.452 | −0.475 | −0.48 |
| N | 36 | 36 | 36 | 34 | 34 | 34 |
| adj.
R-sq | 0.026 | 0.269 | 0.252 | 0.046 | 0.207 | 0.202 |
| root MSE | 1.5302 | 1.3254 | 1.3405 | 2.4843 | 2.264 | 2.2722 |
Table 7.
Operational Linescan System (OLS) regression for cells with population less than 1000 (** p < 0.01; *** p < 0.001).
Table 7.
Operational Linescan System (OLS) regression for cells with population less than 1000 (** p < 0.01; *** p < 0.001).
| Independent Variable | (1) | (2) | (3) | (4) | (5) | (6) |
|---|
| Population | Population | Population | GCP | GCP | GCP |
|---|
| Stable lights | 0.0963 | | 0.00861 | 0.344 *** | | 0.253 ** |
| | (0.0764) | | (0.0648) | (0.0955) | | (0.0833) |
| VIIRS lights | | 0.276 *** | 0.275 *** | | 0.320 *** | 0.301 *** |
| | | (0.0327) | (0.0333) | | (0.0428) | (0.0422) |
| Constant | 5.260 *** | 4.072 *** | 4.070 *** | 5.699 *** | 4.405 *** | 4.341 *** |
| | (0.136) | (0.182) | (0.184) | (0.171) | (0.246) | (0.241) |
| N | 160 | 160 | 160 | 146 | 146 | 146 |
| adj.
R-sq | 0.004 | 0.307 | 0.302 | 0.076 | 0.275 | 0.314 |
| root MSE | 1.6208 | 1.3521 | 1.3564 | 1.9392 | 1.718 | 1.6711 |
Table 8.
Operational Linescan System (OLS) regression for cells with population less than 10,000 (* p < 0.05; ** p < 0.01; *** p < 0.001).
Table 8.
Operational Linescan System (OLS) regression for cells with population less than 10,000 (* p < 0.05; ** p < 0.01; *** p < 0.001).
| Independent Variable | (1) | (2) | (3) | (4) | (5) | (6) |
|---|
| Population | Population | Population | GCP | GCP | GCP |
|---|
| Stable lights | 0.148 *** | | 0.0539 * | 0.353 *** | | 0.257 *** |
| | (0.0265) | | (0.0222) | (0.0303) | | (0.0261) |
| VIIRS lights | | 0.365 *** | 0.353 *** | | 0.433 *** | 0.376 *** |
| | | (0.0198) | (0.0204) | | (0.0257) | (0.0244) |
| Constant | 7.230 *** | 5.032 *** | 5.034 *** | 7.582 *** | 5.190 *** | 5.196 *** |
| | (0.0758) | (0.141) | (0.141) | (0.0875) | (0.186) | (0.172) |
| N | 591 | 591 | 591 | 562 | 562 | 562 |
| adj.
R-sq | 0.048 | 0.364 | 0.369 | 0.194 | 0.335 | 0.432 |
| root MSE | 1.5927 | 1.3018 | 1.2964 | 1.7856 | 1.6219 | 1.4987 |
Table 9.
Operational Linescan System (OLS) regression for cells with population less than 100,000 (* p < 0.05; ** p < 0.01; *** p < 0.001).
Table 9.
Operational Linescan System (OLS) regression for cells with population less than 100,000 (* p < 0.05; ** p < 0.01; *** p < 0.001).
| Independent Variable | (1) | (2) | (3) | (4) | (5) | (6) |
|---|
| Population | Population | Population | GCP | GCP | GCP |
|---|
| Stable lights | 0.173 *** | | 0.0801 *** | 0.326 *** | | 0.240 *** |
| | (0.0159) | | (0.0137) | (0.0158) | | (0.0138) |
| VIIRS lights | | 0.545 *** | 0.514 *** | | 0.582*** | 0.489 *** |
| | | (0.0195) | (0.0200) | | (0.0218) | (0.0205) |
| Constant | 8.904 *** | 5.196 *** | 5.244 *** | 8.950 *** | 5.291 *** | 5.440 *** |
| | (0.0598) | (0.152) | (0.151) | (0.0599) | (0.171) | (0.156) |
| N | 1478 | 1478 | 1478 | 1388 | 1388 | 1388 |
| adj.
R-sq | 0.073 | 0.345 | 0.359 | 0.233 | 0.338 | 0.456 |
| root MSE | 1.8266 | 1.5353 | 1.5183 | 1.7686 | 1.6433 | 1.4898 |
Table 10.
Operational Linescan System (OLS) regression for all cells (** p < 0.01; *** p < 0.001).
Table 10.
Operational Linescan System (OLS) regression for all cells (** p < 0.01; *** p < 0.001).
| Independent Variable | (1) | (2) | (3) | (4) | (5) | (6) |
|---|
| Population | Population | Population | GCP | GCP | GCP |
|---|
| Stable lights | 0.352 *** | | 0.242 *** | 0.432 *** | | 0.333 *** |
| | (0.0103) | | (0.00959) | (0.00934) | | (0.00860) |
| VIIRS lights | | 0.812 *** | 0.622 *** | | 0.833 *** | 0.568 *** |
| | | (0.0207) | (0.0201) | | (0.0215) | (0.0185) |
| Constant | 9.531 *** | 4.343 *** | 4.942 *** | 9.430 *** | 4.364 *** | 5.212 *** |
| | (0.0542) | (0.171) | (0.156) | (0.0493) | (0.178) | (0.143) |
| N | 2740 | 2740 | 2740 | 2599 | 2599 | 2599 |
| adj.
R-sq | 0.298 | 0.359 | 0.479 | 0.451 | 0.365 | 0.598 |
| root MSE | 1.9252 | 1.8402 | 1.6582 | 1.6984 | 1.8266 | 1.454 |
5. Conclusions
Our analysis indicates that VIIRS lights can potentially improve on stable lights to predict population and economic measures for the areas of Sub-Saharan Africa with the lowest population and economic density. This finding is particularly important as standard economic and demographic data in poor regions are limited or non-existent.
Second, the results also suggest that, compared to stable lights, the VIIRS lights can provide more information for a population index than for output measures. Correlation results between lights products and population and output indexes suggest that stable lights provide very limited information in estimating population for extreme low-density cells, but do provide substantial information in estimating cell population as well as in GCP for all cells.
Third, there could be large measurement errors in VIIRS lights itself as disproportionally more bright cells are found in areas with extremely low-density populations, as shown in the scatter plot. The results of correlation and regression analysis also suggest that, although VIIRS lights provide more information than stable lights, it is still not an ideal direct measure for either population or GCP. As shown in all regression models, only 30% to 40% variance in the log of population or output can be explained by VIIRS lights.
In sum, this study suggests VIIRS lights are a promising supplementary source for standard measures on population and economic output at a small scale, especially for low population and economic density areas in Africa. The current analysis also suggests that in comparison to stable lights, VIIRS provide more information to estimate population than output index. However, further analysis and formal statistical models are needed to evaluate the usefulness of VIIRS lights as compared to other lights products, in that measurement error in standard economic measures influence the estimated parameters in the model using lights as a proxy [
7,
8]. With more advanced methods, there is also a potential to generate a synthetic index by combining different lights products to produce a better proxy measure for other indexes.


