
Temporal-Spatial Evolution Analysis of Lake Size-Distribution in the Middle and Lower Yangtze River Basin Using Landsat Imagery Data


Abstract
:
1. Introduction
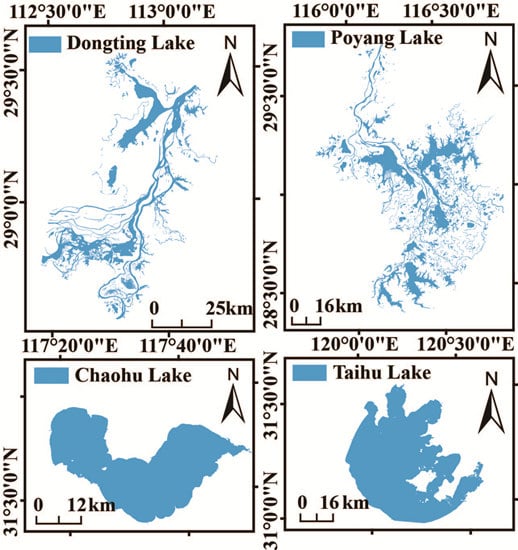
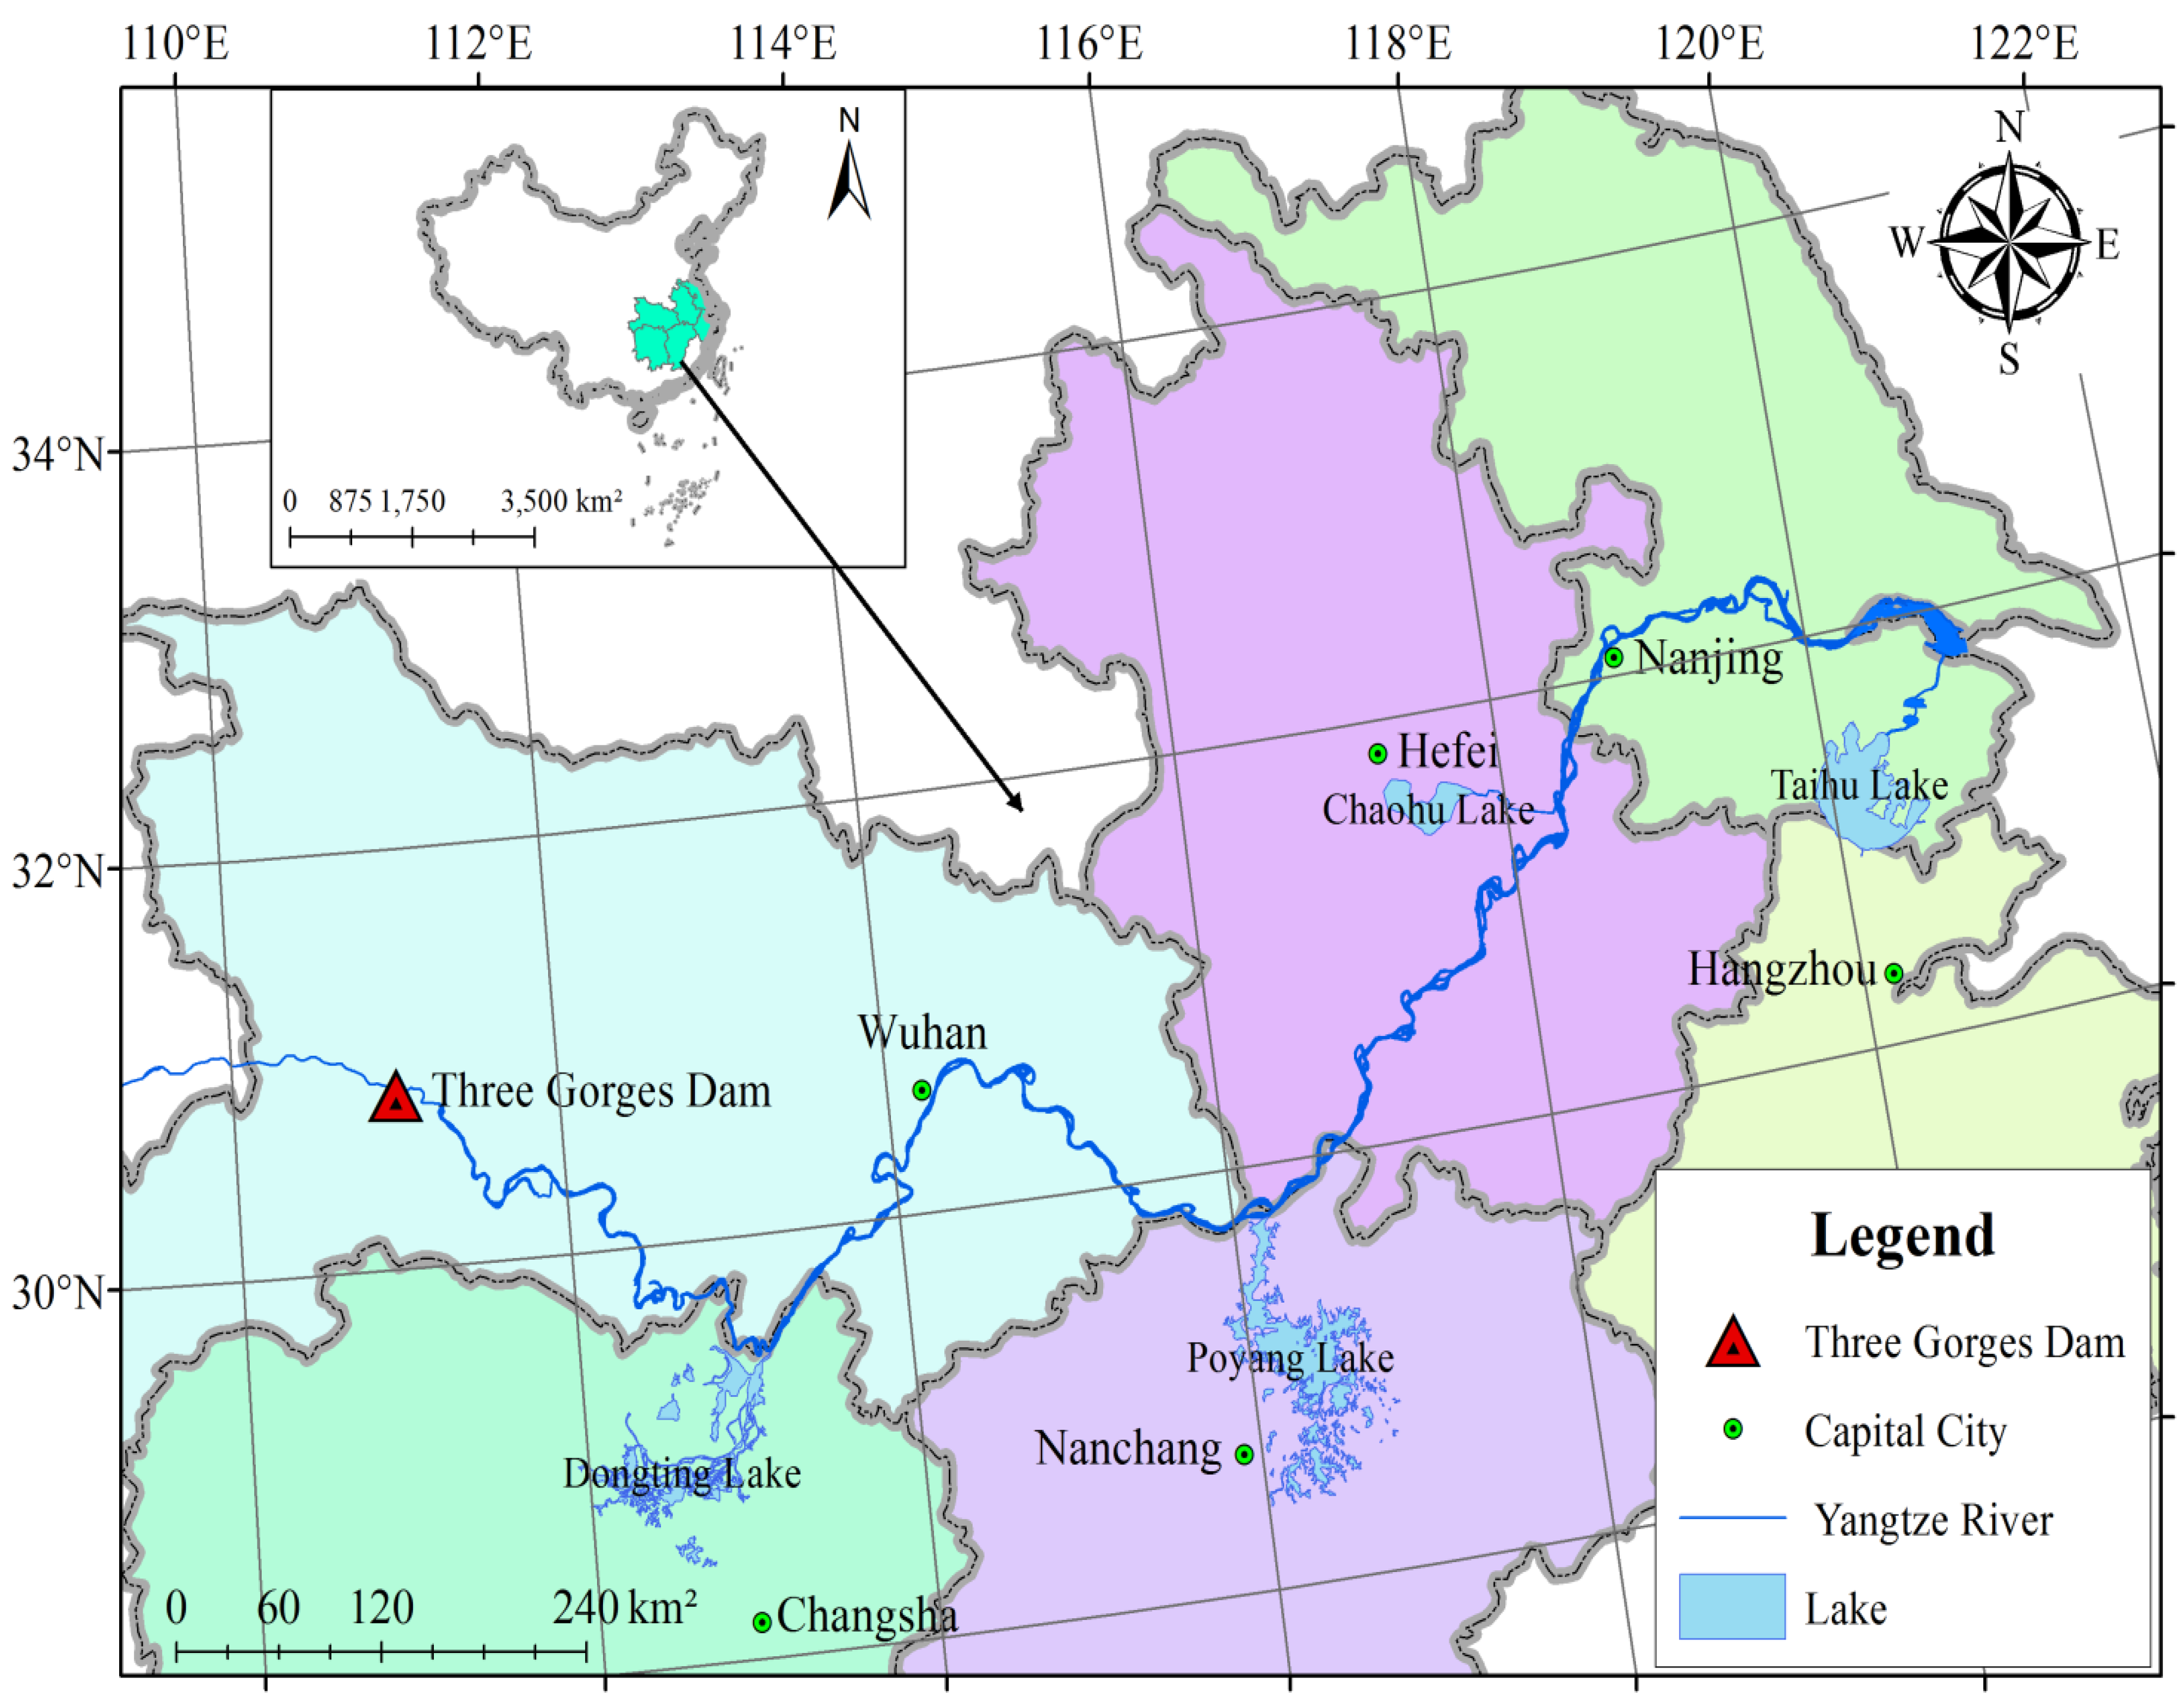
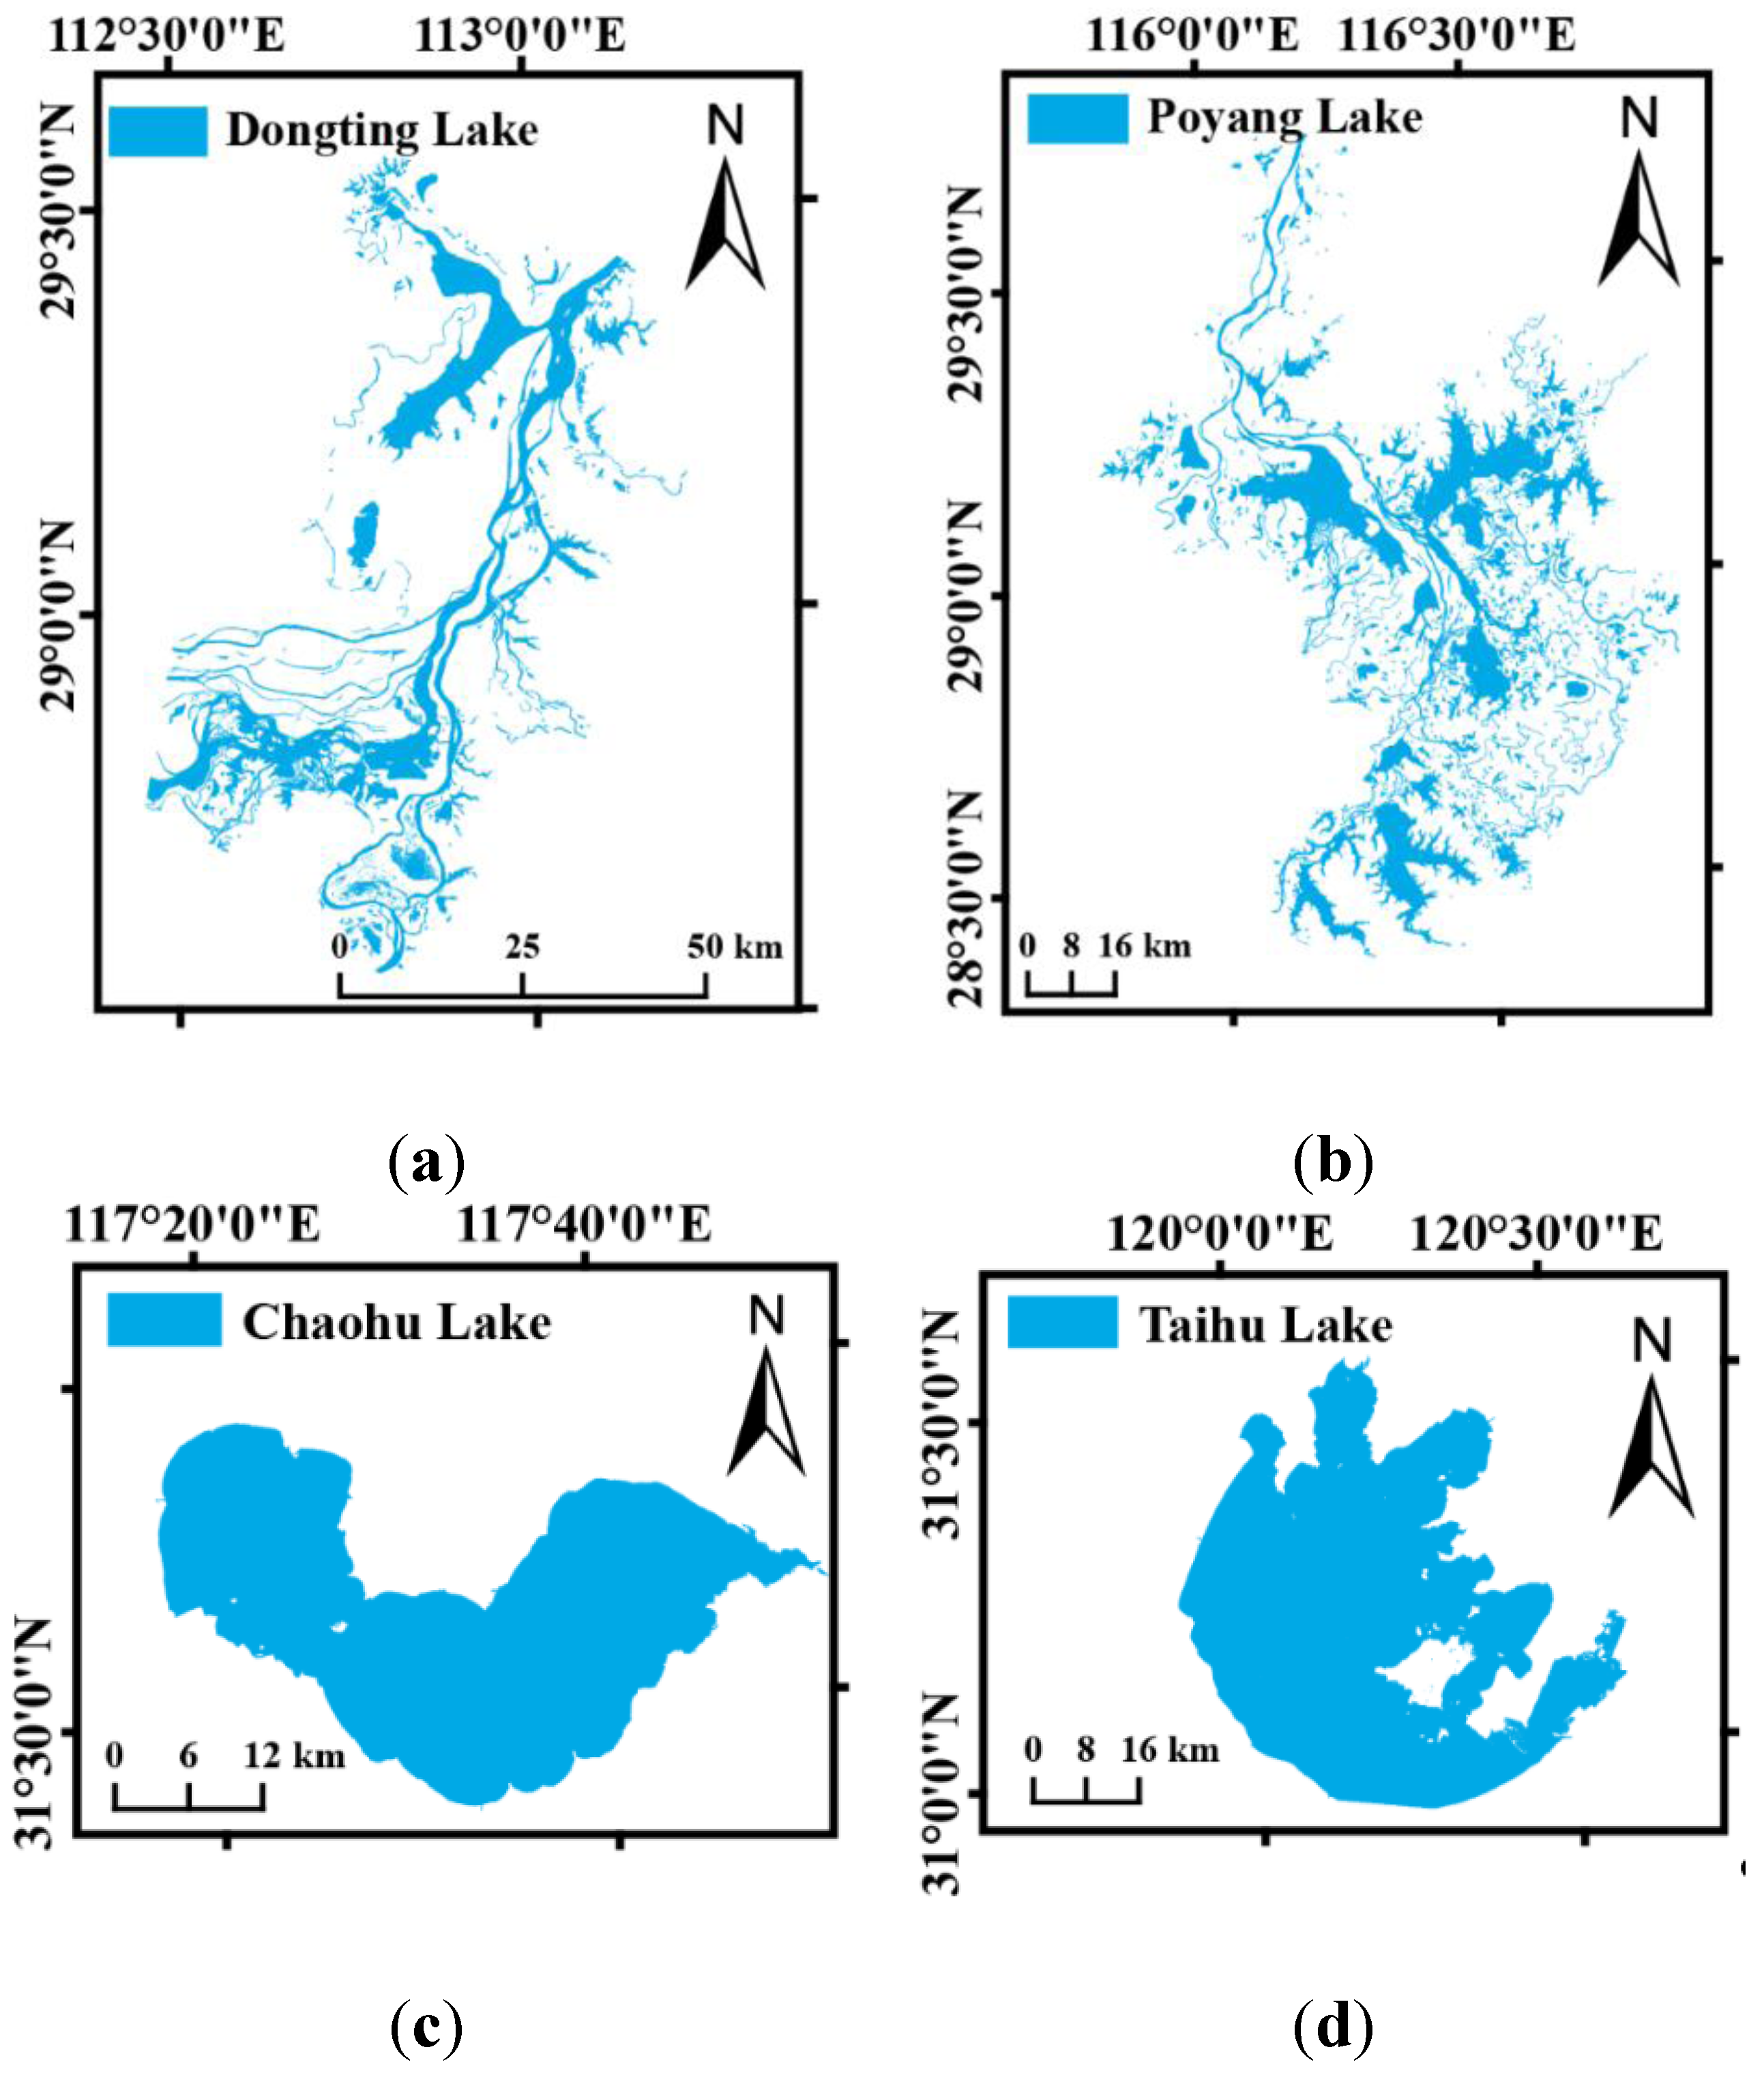
2. Study Area

3. Data Use and Methodology
3.1. Landsat Data

| Lakes | Number and Years of Landsat TM/ETM Data Used for Each of the Four Lakes | ||||||||||||
|---|---|---|---|---|---|---|---|---|---|---|---|---|---|
| 2002 | 2003 | 2004 | 2005 | 2006 | 2007 | 2008 | 2009 | 2010 | 2011 | 2012 | 2013 | Total | |
| Dongting Lake | 4 | 8 | 6 | 8 | 5 | 4 | 4 | 2 | 3 | 5 | 0 | 9 | 58 |
| Poyang Lake | 5 | 6 | 10 | 2 | 6 | 5 | 5 | 6 | 7 | 4 | 5 | 1 | 61 |
| Chaohu Lake | 8 | 9 | 11 | 6 | 9 | 8 | 5 | 8 | 13 | 7 | 5 | 5 | 94 |
| Taihu Lake | 10 | 6 | 10 | 8 | 2 | 4 | 5 | 6 | 8 | 5 | 5 | 5 | 74 |
| TM | ETM | ||||||||||||
| Total | 74 | 213 | 287 | ||||||||||
3.2. Methodology
3.2.1. Image Processing
3.2.2. Water Extraction Method

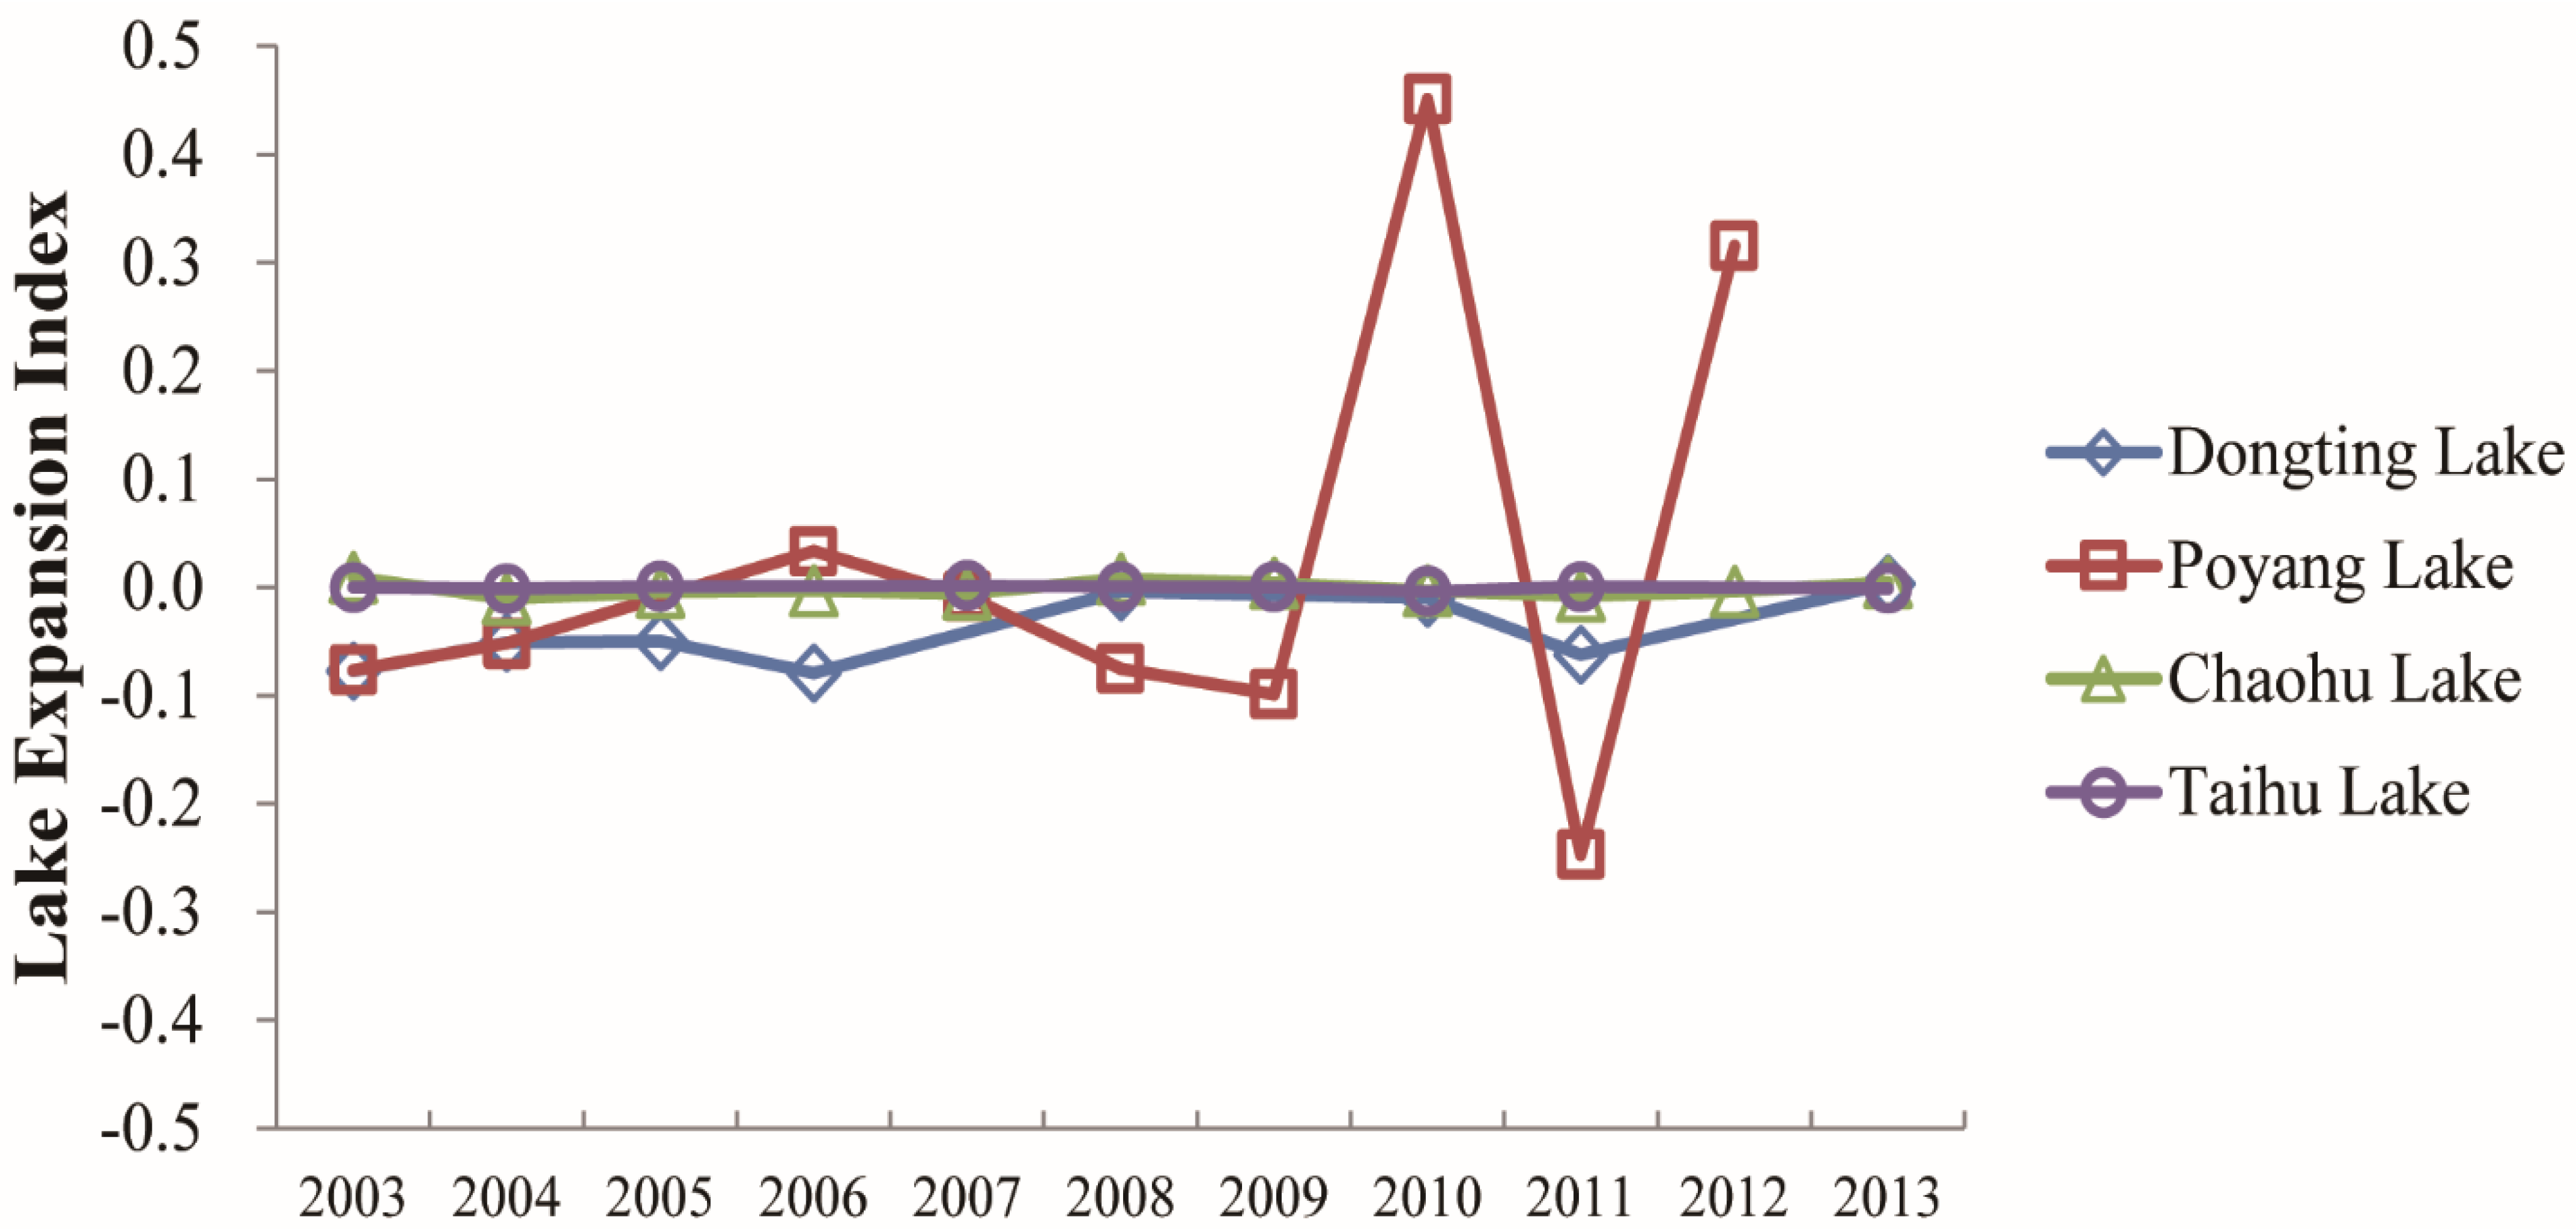
3.2.3. Lake Expansion Index (LEI)
3.2.4. Precipitation Analysis
3.2.5. Centroid Determination Analysis
4. Results
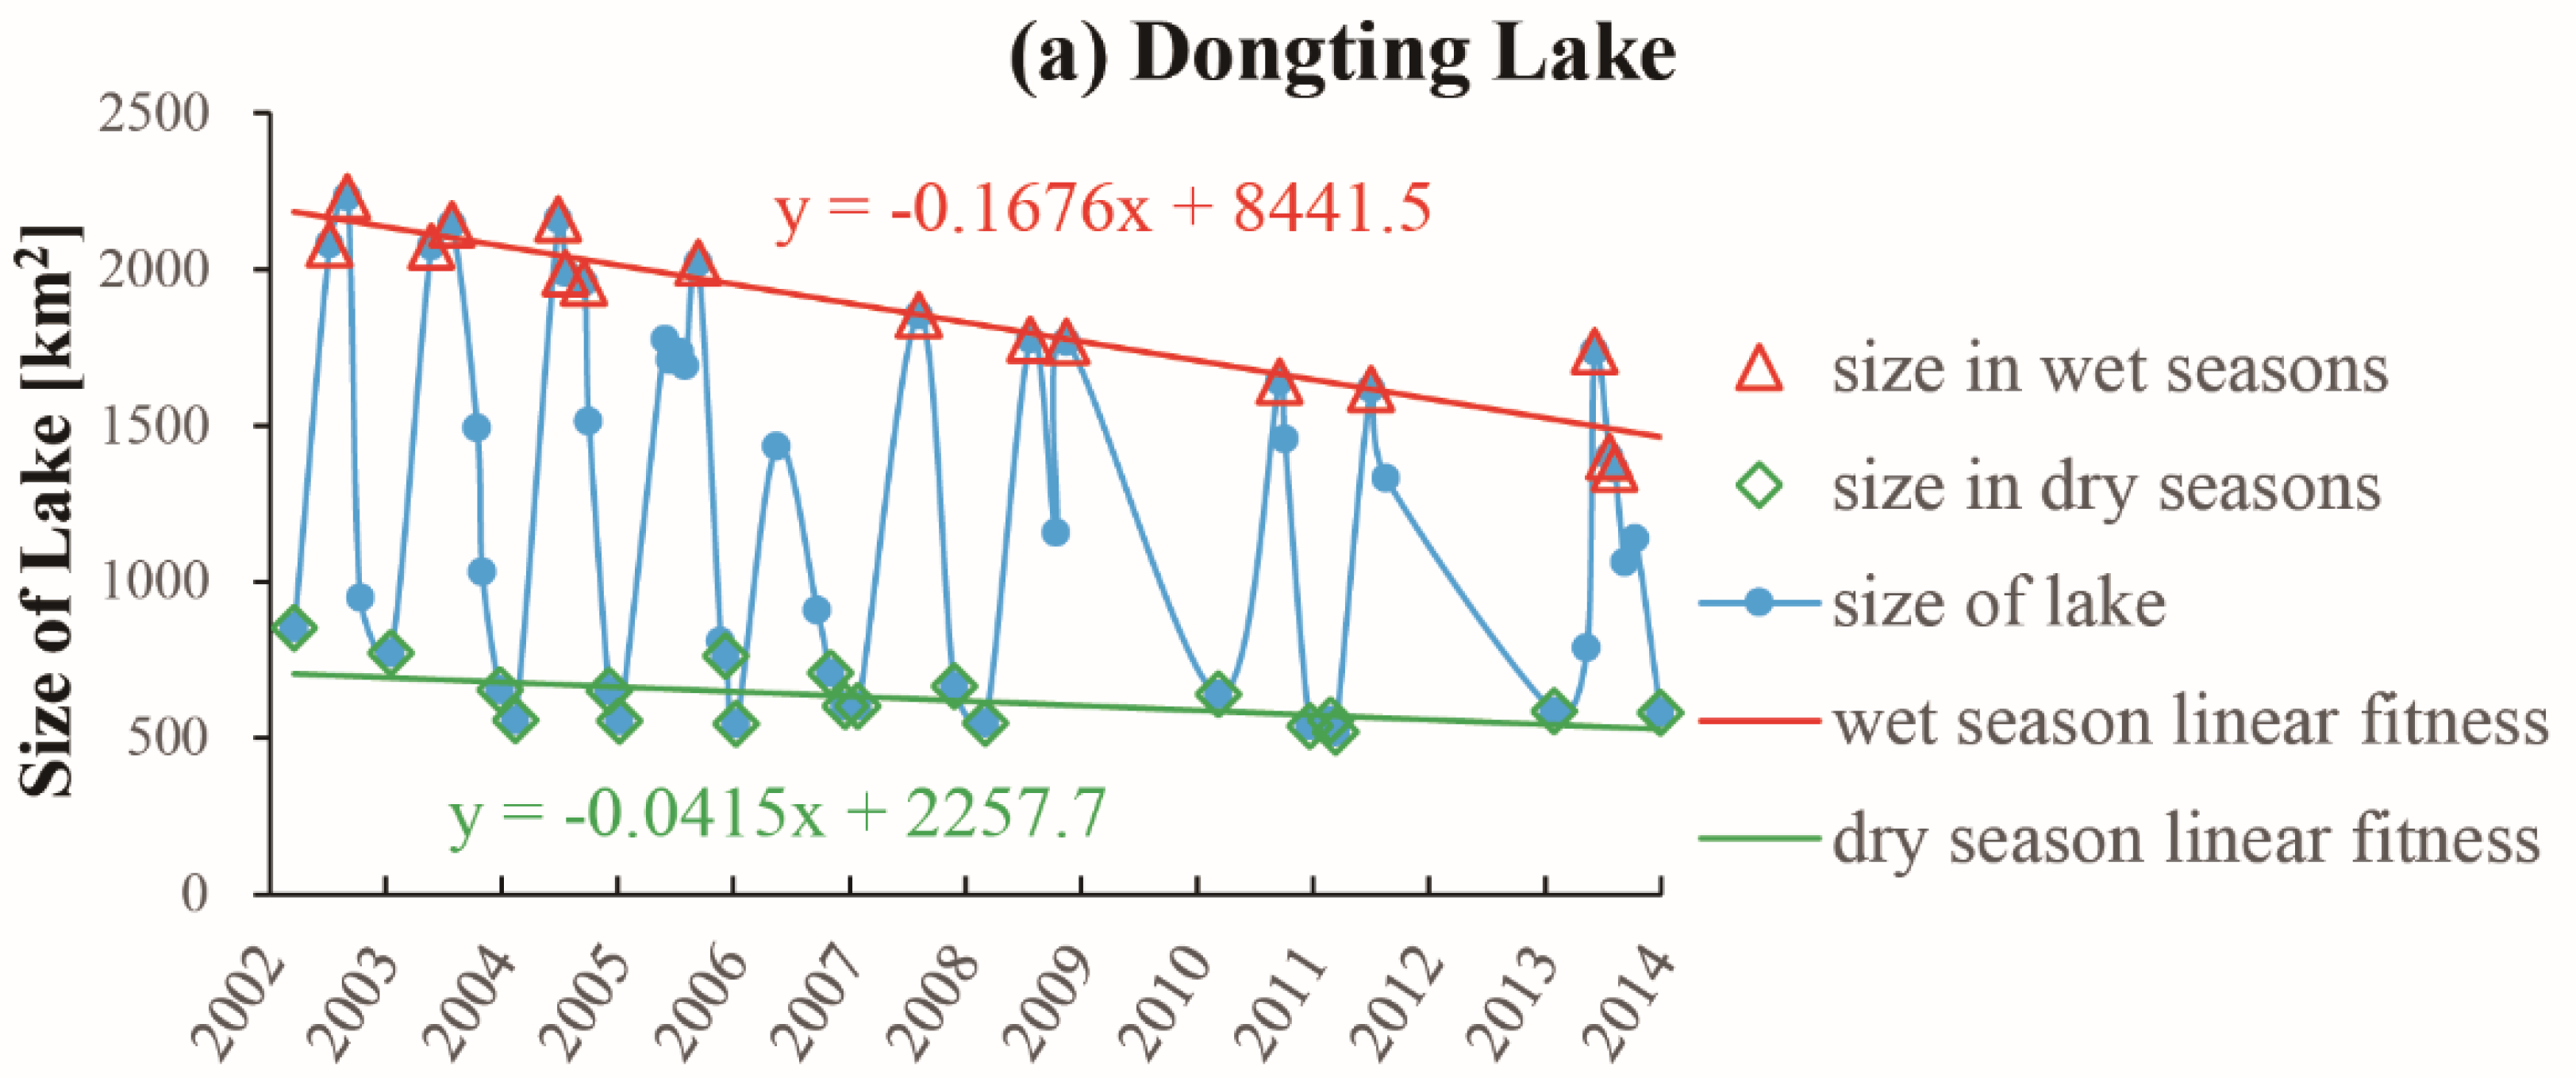
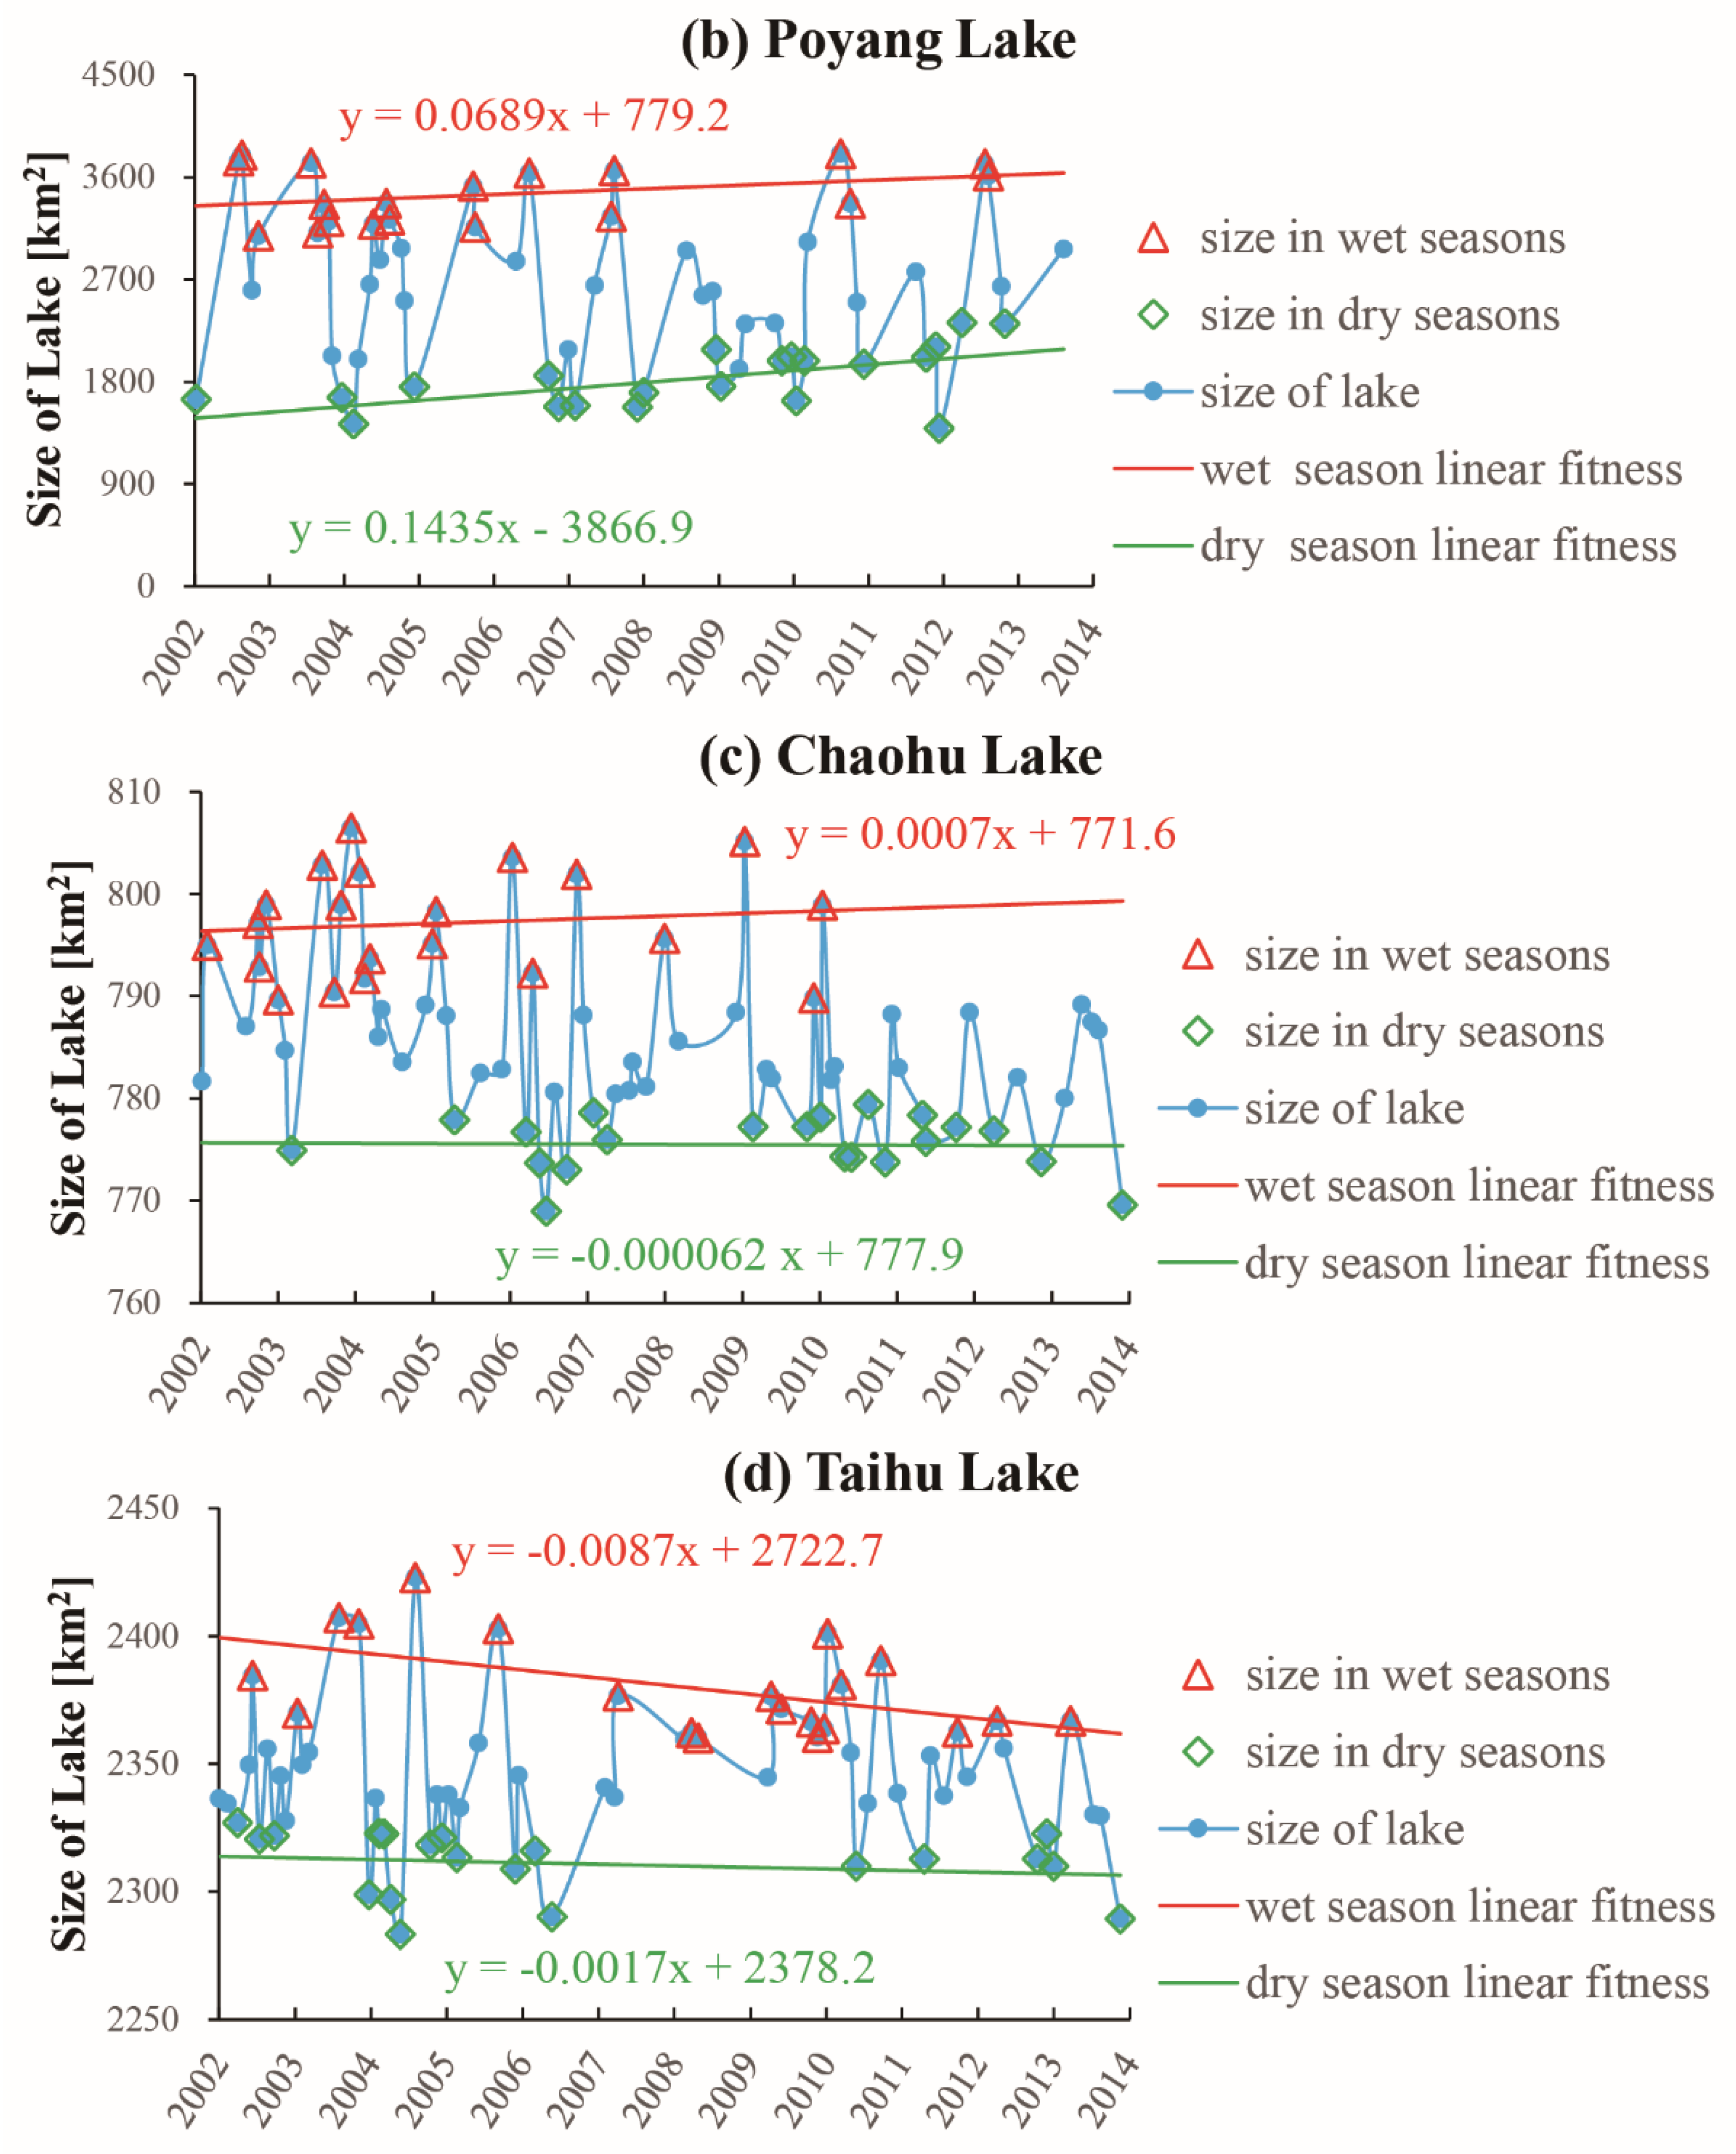
4.1. Estimated Area and Surface Changes
| Dongting Lake | Poyang Lake | Chaohu Lake | Taihu Lake | |
|---|---|---|---|---|
| Number | 52 | 61 | 73 | 67 |
| Summation (km2) | 63,697 | 157,725 | 57,345 | 157,075 |
| Minimum (km2) | 521 | 1390 | 769 | 2283 |
| Maximum (km2) | 2232 | 3808 | 806 | 2423 |
| Mean (km2) | 1225 | 2586 | 786 | 2344 |
| Range (km2) | 1711 | 2418 | 38 | 140 |
| SD | 567.50 | 721.66 | 9.09 | 30.11 |
| CV | 0.46 | 0.28 | 0.01 | 0.01 |
| Kurtosis | −1.45 | −1.23 | −0.50 | −0.04 |


| Dongting Lake | Poyang Lake | Chaohu Lake | Taihu Lake | |||||
|---|---|---|---|---|---|---|---|---|
| Date | 13 October 2002 | 20 August 2002 | 8 January 2002 | 9 October 2002 | ||||
| Class | Non-Water | Water | Non-Water | Water | Non-Water | Water | Non-Water | Water |
| Commission (%) | 1.09 | 1.26 | 0.8 | 0.79 | 0.06 | 0.6 | 2.08 | 1.76 |
| Omission (%) | 0.15 | 8.68 | 0.24 | 2.62 | 0.19 | 0.19 | 1.69 | 2.16 |
| Prod. Acc. (%) | 99.85 | 91.32 | 99.76 | 97.38 | 99.81 | 99.81 | 98.31 | 97.84 |
| User Acc. (%) | 98.91 | 98.74 | 99.2 | 99.21 | 99.94 | 99.4 | 97.92 | 98.24 |
| Overall Accuracy (%) | 98.89 | 99.2 | 99.81 | 98.08 | ||||
| Kappa Coefficient | 0.94 | 0.98 | 0.99 | 0.96 | ||||


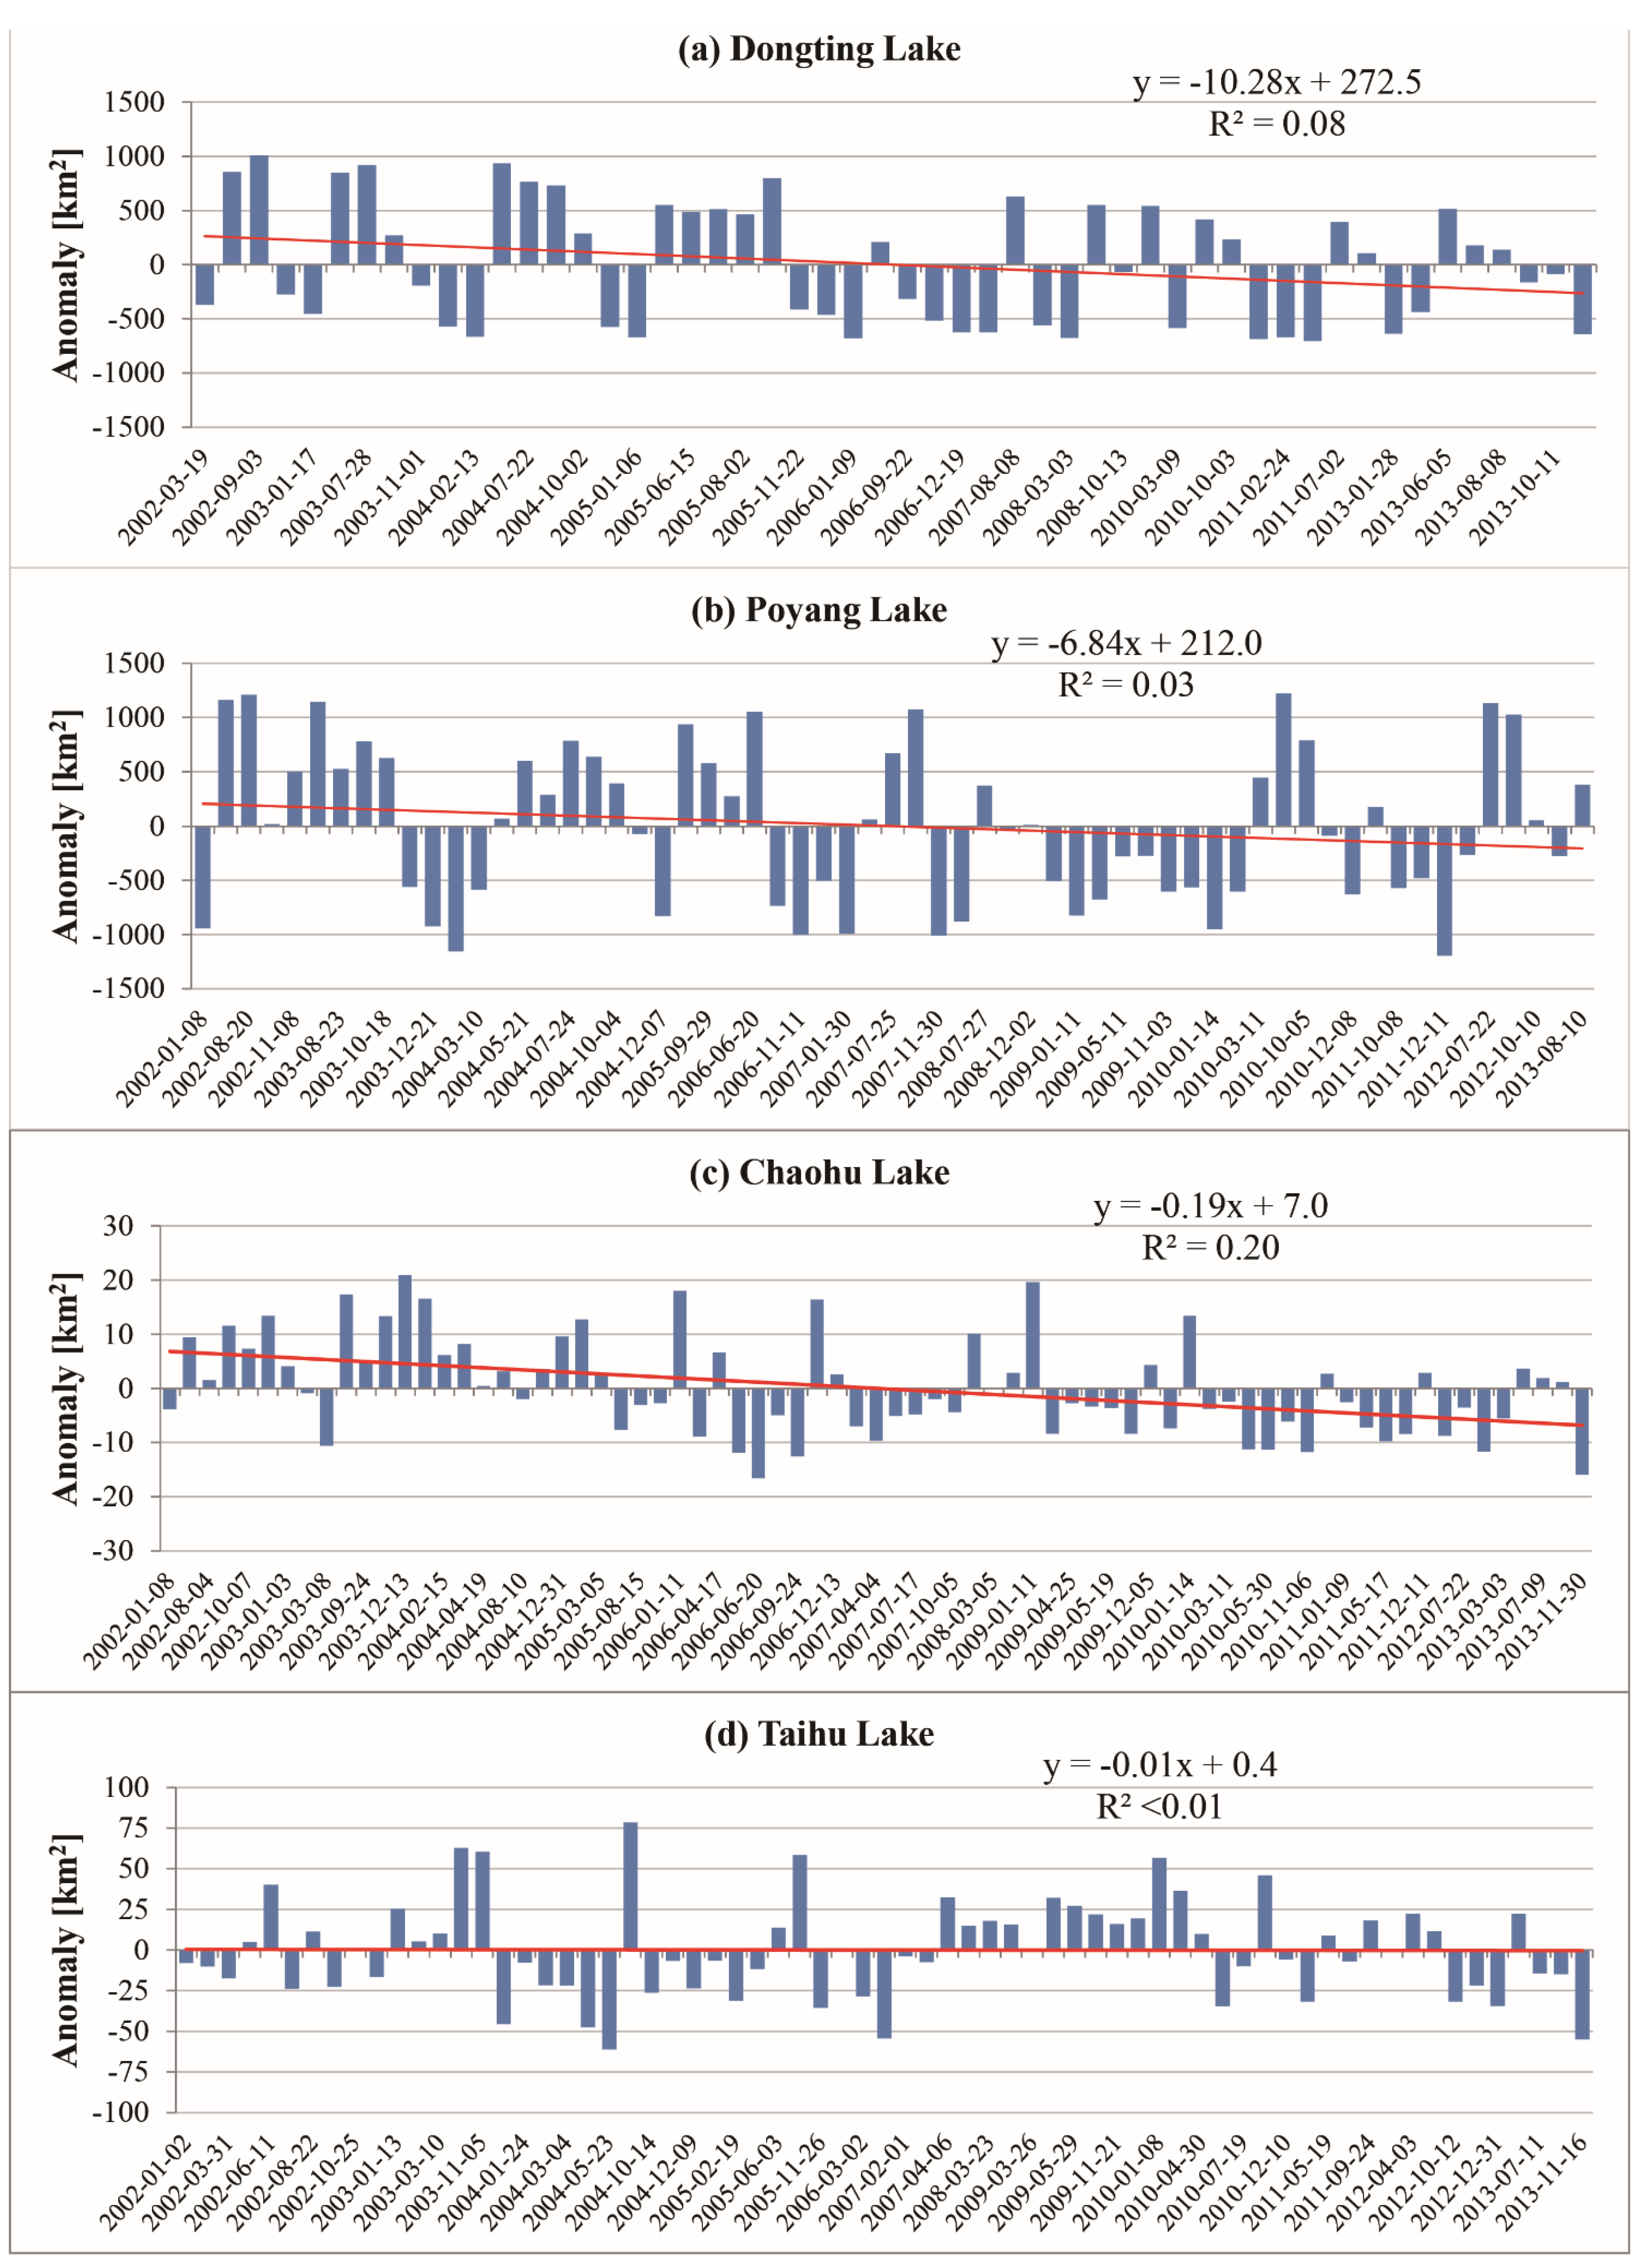
4.2. Relationship between Rainfall and Lake Area

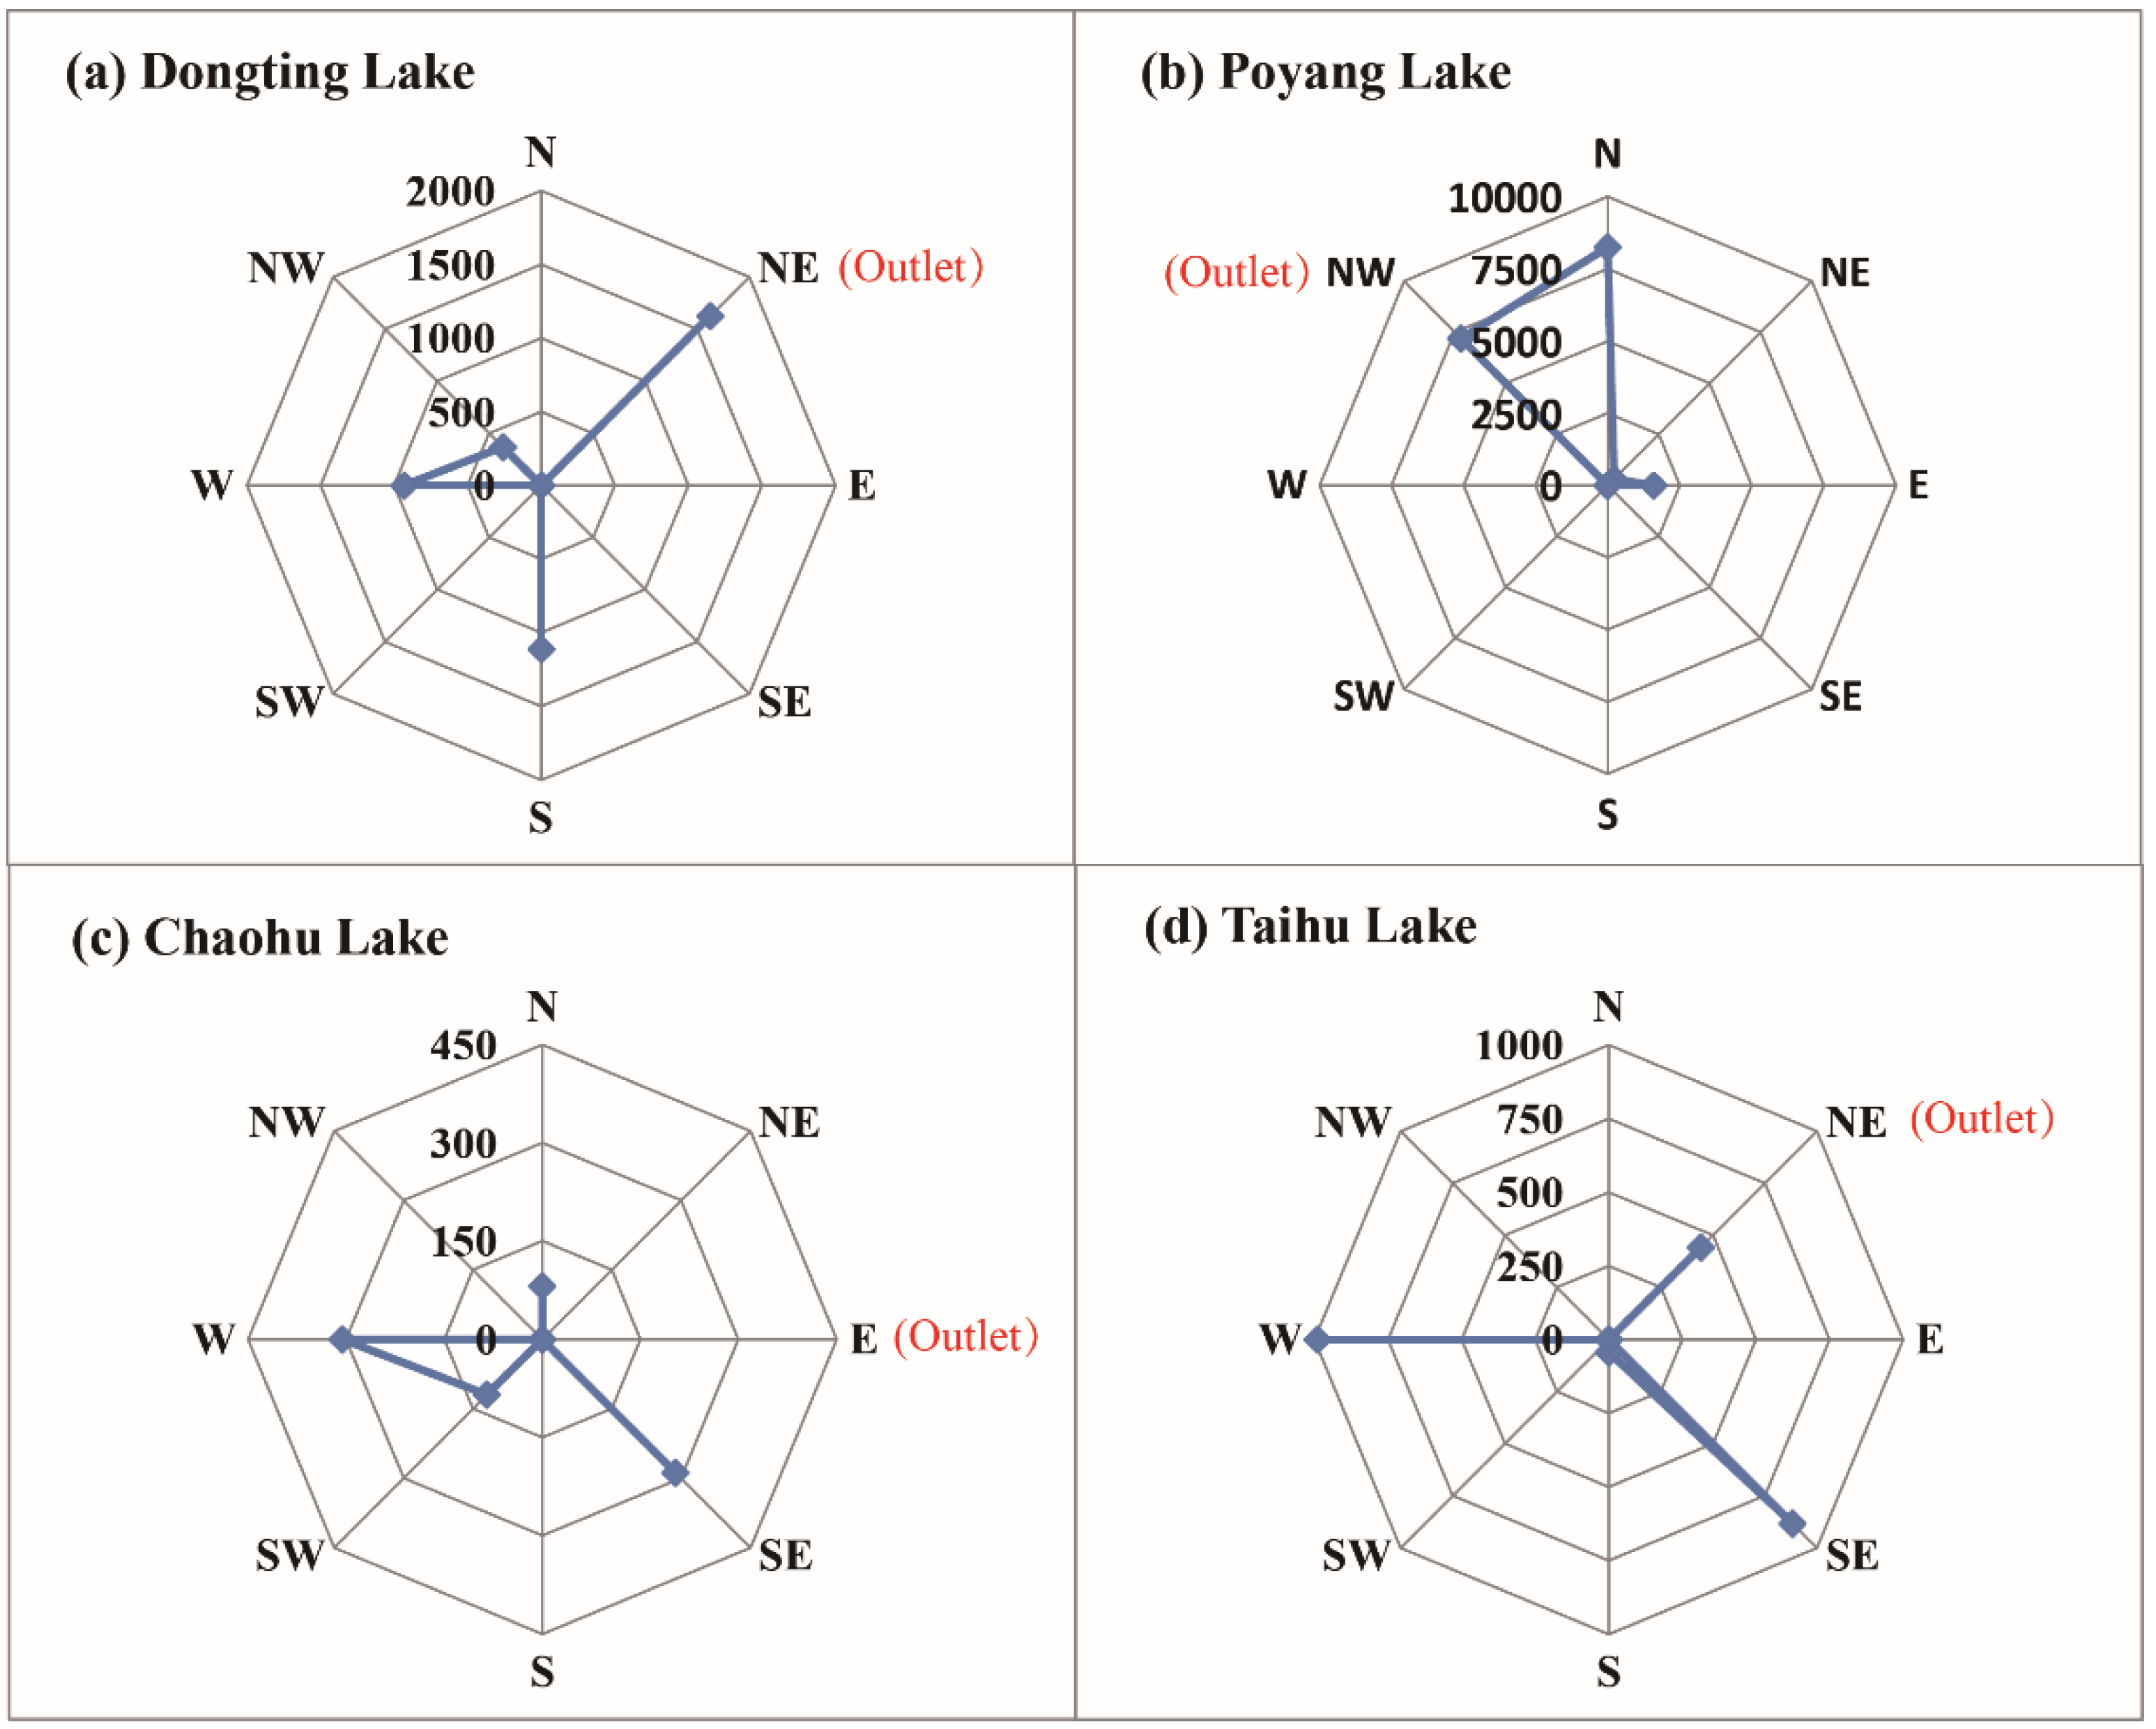
4.3. Lake Centroid Displacement

5. Discussion
5.1. Different Size-Distribution Variations for Four Lakes
5.2. Dam Influence or Dissipate Influence on Lakes

5.3. Lake Monitoring and Other Applications
6. Conclusions
Supplementary Files
Supplementary File 1Acknowledgments
Author Contributions
Conflicts of Interest
References
- Milesi, C.; Samanta, A.; Hashimoto, H.; Krishna Kumar, K.; Ganguly, S.; Thenkabail, P.S.; Srivastava, A.N.; Nemani, R.R.; Myneni, R.B. Decadal variations in NDVI and food production in India. Remote Sens. 2010, 2, 758–776. [Google Scholar] [CrossRef]
- Thenkabail, P.S.; Dheeravath, V.; Biradar, C.M.; Gangalakunta, O.R.P.; Noojipady, P.; Gurappa, C.; Velpuri, M.; Gumma, M.; Li, Y. Irrigated area maps and statistics of India using remote sensing and national statistics. Remote Sens. 2009, 1, 50–67. [Google Scholar] [CrossRef]
- Akdim, N.; Alfieri, S.M.; Habib, A.; Choukri, A.; Cheruiyot, E.; Labbassi, K.; Menenti, M. Monitoring of irrigation schemes by remote sensing: Phenology versus retrieval of biophysical variables. Remote Sens. 2014, 6, 5815–5851. [Google Scholar] [CrossRef]
- Alderman, K.; Turner, L.R.; Tong, S. Floods and human health: A systematic review. Environ. Int. 2012, 47, 37–47. [Google Scholar] [CrossRef] [PubMed] [Green Version]
- Bond, N.R.; Lake, P.; Arthington, A.H. The impacts of drought on freshwater ecosystems: An Australian perspective. Hydrobiologia 2008, 600, 3–16. [Google Scholar] [CrossRef]
- Charron, D.F.; Thomas, M.K.; Waltner-Toews, D.; Aramini, J.J.; Edge, T.; Kent, R.A.; Maarouf, A.R.; Wilson, J. Vulnerability of waterborne diseases to climate change in Canada: A review. J. Toxicol. Environ. Health Part A 2004, 67, 1667–1677. [Google Scholar] [CrossRef] [PubMed]
- Davranche, A.; Lefebvre, G.; Poulin, B. Wetland monitoring using classification trees and SPOT-5 seasonal time series. Remote Sens. Environ. 2010, 114, 552–562. [Google Scholar] [CrossRef] [Green Version]
- Li, K.; Wu, S.; Dai, E.; Xu, Z. Flood loss analysis and quantitative risk assessment in China. Nat. Hazards 2012, 63, 737–760. [Google Scholar] [CrossRef]
- Muala, E.; Mohamed, Y.A.; Duan, Z.; van der Zaag, P. Estimation of reservoir discharges from Lake Nasser and Roseires Reservoir in the Nile Basin using satellite altimetry and imagery data. Remote Sens. 2014, 6, 7522–7545. [Google Scholar] [CrossRef]
- Muster, S.; Heim, B.; Abnizova, A.; Boike, J. Water body distributions across scales: A remote sensing based comparison of three arctic tundra wetlands. Remote Sens. 2013, 5, 1498–1523. [Google Scholar] [CrossRef] [Green Version]
- Wei, W.; Pengfeng, X.; Xuezhi, F.; Hui, L.; Ronghua, M.; Hongtao, D. Remote sensing analysis for changes of lakes in the southeast of Qiangtang area, Qinghai-Tibet plateau in recent 30 years. J. Lake Sci. 2010, 22, 874–881. (In Chinese) [Google Scholar]
- Jiang, H.; Feng, M.; Zhu, Y.; Lu, N.; Huang, J.; Xiao, T. An automated method for extracting rivers and lakes from Landsat imagery. Remote Sens. 2014, 6, 5067–5089. [Google Scholar] [CrossRef]
- Klein, I.; Dietz, A.; Gessner, U.; Dech, S.; Kuenzer, C. Results of the global waterpack: A novel product to assess inland water body dynamics on a daily basis. Remote Sens. Lett. 2015, 6, 78–87. [Google Scholar] [CrossRef]
- Klein, I.; Dietz, A.J.; Gessner, U.; Galayeva, A.; Myrzakhmetov, A.; Kuenzer, C. Evaluation of seasonal water body extents in central Asia over the past 27 years derived from medium-resolution remote sensing data. Int. J. Appl. Earth Obs. Geoinform. 2014, 26, 335–349. [Google Scholar] [CrossRef]
- Meng, L.; Guo, S.; Li, S. Summary on extraction of water body from remote sensing image and flood monitoring. Water Resour. Informatiz. 2012, 3, 18–25. [Google Scholar]
- Mizuochi, H.; Hiyama, T.; Ohta, T.; Nasahara, K.N. Evaluation of the surface water distribution in north-central Namibia based on MODIS and AMSR series. Remote Sens. 2014, 6, 7660–7682. [Google Scholar] [CrossRef] [Green Version]
- Rokni, K.; Ahmad, A.; Selamat, A.; Hazini, S. Water feature extraction and change detection using multitemporal Landsat imagery. Remote Sens. 2014, 6, 4173–4189. [Google Scholar] [CrossRef]
- Feng, L.; Hu, C.; Chen, X.; Cai, X.; Tian, L.; Gan, W. Assessment of inundation changes of Poyang Lake using MODIS observations between 2000 and 2010. Remote Sens. Environ. 2012, 121, 80–92. [Google Scholar] [CrossRef]
- Pekel, J.F.; Vancutsem, C.; Bastin, L.; Clerici, M.; Vanbogaert, E.; Bartholomé, E.; Defourny, P. A near real-time water surface detection method based on HSV transformation of MODIS multi-spectral time series data. Remote Sens. Environ. 2014, 140, 704–716. [Google Scholar] [CrossRef]
- Lu, S.; Ouyang, N.; Wu, B.; Wei, Y.; Tesemma, Z. Lake water volume calculation with time series remote-sensing images. Int. J. Remote Sens. 2013, 34, 7962–7973. [Google Scholar] [CrossRef]
- Haas, E.M.; Bartholomé, E.; Combal, B. Time series analysis of optical remote sensing data for the mapping of temporary surface water bodies in Sub-Saharan western Africa. J. Hydrol. 2009, 370, 52–63. [Google Scholar] [CrossRef]
- Jain, S.K.; Saraf, A.K.; Goswami, A.; Ahmad, T. Flood inundation mapping using NOAA AVHRR data. Water Resour. Manag. 2006, 20, 949–959. [Google Scholar] [CrossRef]
- Feyisa, G.L.; Meilby, H.; Fensholt, R.; Proud, S.R. Automated water extraction index: A new technique for surface water mapping using Landsat imagery. Remote Sens. Environ. 2014, 140, 23–35. [Google Scholar] [CrossRef]
- Gao, Y.; Su, F.; Sun, X.; Xue, Z.; He, Y. A study on spatial and temporal variations of coastal wetland in Pearl River estuary. In Proceedings of the 2010 IEEE International Geoscience and Remote Sensing Symposium (IGARSS’20), Honolulu, HI, USA, 25–30 July 2010; IEEE: New York, NY; USA, 2010; pp. 429–432. [Google Scholar]
- Junhong, B.; Hua, O.; Baoshan, C.; Qinggai, W.; Hui, C. Changes in landscape pattern of alpine wetlands on the Zoige Plateau in the past four decades. Acta Ecol. Sin. 2008, 28, 2245–2252. [Google Scholar] [CrossRef]
- Global Visualization Viewer. Available online: http://glovis.Usgs.Gov/ (accessed on 30 October 2014).
- Chander, G.; Markham, B.L.; Barsi, J.A. Revised Landsat-5 thematic mapper radiometric calibration. IEEE Geosci. Remote Sens. Lett. 2007, 4, 490–494. [Google Scholar] [CrossRef]
- Huang, C.; Wylie, B.; Yang, L.; Homer, C.; Zylstra, G. Derivation of a tasselled cap transformation based on Landsat 7 AT-satellite reflectance. Int. J. Remote Sens. 2002, 23, 1741–1748. [Google Scholar] [CrossRef]
- Calibrating Images Tutorial. Available online: http://www.Exelisvis.Com/docs/radiometriccalibration.Html (accessed on 30 October 2014).
- Atmospheric Correction. Available online: http://www.Exelisvis.Com/docs/atmosphericcorrection.Html#flaash (accessed on 30 October 2014).
- Chen, Y.; Huang, C.; Ticehurst, C.; Merrin, L.; Thew, P. An evaluation of MODIS daily and 8-day composite products for floodplain and wetland inundation mapping. Wetlands 2013, 33, 823–835. [Google Scholar] [CrossRef]
- Guerschman, J.P.; Warren, G.; Byrne, G.; Lymburner, L.; Mueller, N.; van Dijk, A.I. MODIS-Based Standing Water Detection for Flood and Large Reservoir Mapping: Algorithm Development and Applications for the Australian Continent; CSIRO: Canberra, ACT, Australian, 2011. [Google Scholar]
- McFeeters, S. The use of the normalized difference water index (Ndwi) in the delineation of open water features. Int. J. Remote Sens. 1996, 17, 1425–1432. [Google Scholar] [CrossRef]
- Xu, H. Modification of normalised difference water index (Ndwi) to enhance open water features in remotely sensed imagery. Int. J. Remote Sens. 2006, 27, 3025–3033. [Google Scholar] [CrossRef]
- Karlsson, J.M.; Lyon, S.W.; Destouni, G. Temporal behavior of lake size-distribution in a thawing permafrost landscape in northwestern Siberia. Remote Sens. 2014, 6, 621–636. [Google Scholar] [CrossRef]
- China Meteorological Data Sharing Service System. Available online: http://www.Cma.Gov.Cn/2011qxfw/2011qsjgx/ (accessed on 30 October 2014).
- Wen, X.; Hu, D.; Cao, B.; Shen, S.; Tang, X. Dynamics change of Honghu Lake’s water surface area and its driving force analysis based on remote sensing technique and topmodel model. In Proceedings of the IOP Conference Series: Earth and Environmental Science, Bendigo, VIC, Australia, 24–27 March 2014; IOP Publishing: Bristol, UK, 2014; p. 012130. [Google Scholar]
- Zhang, F.; Tiyip, T.; Feng, Z.; Kung, H.T.; Johnson, V.; Ding, J.; Tashpolat, N.; Sawut, M.; Gui, D. Spatio-temporal patterns of land use/cover changes over the past 20 years in the middle reaches of the Tarim River, Xinjiang, China. Land Degrad. Dev. 2013, 26. [Google Scholar] [CrossRef]
- Zhang, J.; Huang, F. Monitoring forest and its ecosystem services value changes in Tonghua City using Landsat TM images. In Proceedings of the 2011 4th International Congress on Image and Signal Processing (CISP), Shanghai, China, 15–17 October 2011; IEEE: New York, NY; USA, 2011; pp. 1641–1645. [Google Scholar]
- Conway, D. Extreme rainfall events and lake level changes in East Africa: Recent events and historical precedents. In The East African Great Lakes: Limnology, Palaeolimnology and Biodiversity; Springer Netherlands: New York, NY, USA, 2004; pp. 63–92. [Google Scholar]
- Ye, X.; Zhang, Q.; Liu, J.; Li, X.; Xu, C.-Y. Distinguishing the relative impacts of climate change and human activities on variation of streamflow in the Poyang Lake catchment, China. J. Hydrol. 2013, 494, 83–95. [Google Scholar] [CrossRef]
- Elsawwaf, M.; Feyen, J.; Batelaan, O.; Bakr, M. Groundwater-surface water interaction in Lake Nasser, southern Egypt. Hydrol. Process. 2014, 28, 414–430. [Google Scholar] [CrossRef]
- Li, X.-Y.; Xu, H.-Y.; Sun, Y.-L.; Zhang, D.-S.; Yang, Z.-P. Lake-level change and water balance analysis at Lake Qinghai, west china during recent decades. Water Resour. Manag. 2007, 21, 1505–1516. [Google Scholar] [CrossRef]
- Meng, X.; Zhang, Y.; Yu, X.; Zhan, J.; Chai, Y.; Critto, A.; Li, Y.; Li, J. Analysis of the temporal and spatial distribution of lake and reservoir water quality in China and changes in its relationship with GDP from 2005 to 2010. Sustainability 2015, 7, 2000–2027. [Google Scholar] [CrossRef]
- Yuan, Y.; Zeng, G.; Liang, J.; Huang, L.; Hua, S.; Li, F.; Zhu, Y.; Wu, H.; Liu, J.; He, X. Variation of water level in Dongting Lake over a 50-year period: Implications for the impacts of anthropogenic and climatic factors. J. Hydrol. 2015, 525, 450–456. [Google Scholar] [CrossRef]
- Liu, W.; Zhang, Q.; Liu, G. Influences of watershed landscape composition and configuration on lake-water quality in the Yangtze River basin of China. Hydrol. Process. 2012, 26, 570–578. [Google Scholar] [CrossRef]
- Long-sheng, C. Environment significance and pollution status of heavy metals in lake sediments of the middle and lower reaches of Yangtze River. J. Anhui Agric. Sci. 2013, 16, 093. [Google Scholar]
© 2015 by the authors; licensee MDPI, Basel, Switzerland. This article is an open access article distributed under the terms and conditions of the Creative Commons Attribution license (http://creativecommons.org/licenses/by/4.0/).
Share and Cite
Li, L.; Xia, H.; Li, Z.; Zhang, Z. Temporal-Spatial Evolution Analysis of Lake Size-Distribution in the Middle and Lower Yangtze River Basin Using Landsat Imagery Data. Remote Sens. 2015, 7, 10364-10384. https://0-doi-org.brum.beds.ac.uk/10.3390/rs70810364
Li L, Xia H, Li Z, Zhang Z. Temporal-Spatial Evolution Analysis of Lake Size-Distribution in the Middle and Lower Yangtze River Basin Using Landsat Imagery Data. Remote Sensing. 2015; 7(8):10364-10384. https://0-doi-org.brum.beds.ac.uk/10.3390/rs70810364
Chicago/Turabian StyleLi, Lin, Hui Xia, Zheng Li, and Zhijun Zhang. 2015. "Temporal-Spatial Evolution Analysis of Lake Size-Distribution in the Middle and Lower Yangtze River Basin Using Landsat Imagery Data" Remote Sensing 7, no. 8: 10364-10384. https://0-doi-org.brum.beds.ac.uk/10.3390/rs70810364