Article

Polarimetric Scattering Properties of Landslides in Forested Areas and the Dependence on the Local Incidence Angle

by
Takashi Shibayama
1,*,
Yoshio Yamaguchi
2 and
Hiroyoshi Yamada
2
1
Graduate School of Science and Technology, Niigata University, 8050 Ikarashi 2-no-cho, Nishi-ku, Niigata 950-2108, Japan
2
Faculty of Engineering, Niigata University, 8050 Ikarashi 2-no-cho, Nishi-ku, Niigata 950-2108, Japan
*
Author to whom correspondence should be addressed.
Remote Sens. 2015, 7(11), 15424-15442; https://0-doi-org.brum.beds.ac.uk/10.3390/rs71115424
Submission received: 27 August 2015 / Revised: 2 November 2015 / Accepted: 10 November 2015 / Published: 18 November 2015
(This article belongs to the Special Issue Remote Sensing in Geology)

Abstract

:
This paper addresses the local incidence angle dependence of several polarimetric indices corresponding to landslides in forested areas. Landslide is deeply related to the loss of human lives and their property. Various kinds of remote sensing techniques, including aerial photography, high-resolution optical satellite imagery, LiDAR and SAR interferometry (InSAR), have been available for landslide investigations. SAR polarimetry is potentially an effective measure to investigate landslides because fully-polarimetric SAR (PolSAR) data contain more information compared to conventional single- or dual-polarization SAR data. However, research on landslide recognition utilizing polarimetric SAR (PolSAR) is quite limited. Polarimetric properties of landslides have not been examined quantitatively so far. Accordingly, we examined the polarimetric scattering properties of landslides by an assessment of how the decomposed scattering power components and the polarimetric correlation coefficient change with the local incidence angle. In the assessment, PolSAR data acquired from different directions with both spaceborne and airborne SARs were utilized. It was found that the surface scattering power and the polarimetric correlation coefficient of landslides significantly decrease with the local incidence angle, while these indices of surrounding forest do not. This fact leads to establishing a method of effective detection of landslide area by polarimetric information.

Graphical Abstract

1. Introduction

This paper addresses the availability of indices derived from fully-polarimetric SAR (PolSAR) data, especially the surface and volume scattering power components derived by model-based scattering power decomposition and the correlation coefficient in the linear polarization basis for landslide investigation. We examined the polarimetric scattering properties of landslides by an assessment of how the decomposed scattering power components and the correlation coefficient change with the local incidence angle. It is worth studying the characteristics of polarimetric scattering from landslides for automated identification of landslides from PolSAR data.
SAR is an active sensor that transmits and receives microwaves. It has an all-weather and day and night imaging capability because the microwave can penetrate clouds and a certain level of rain. Taking these advantages of SAR, it has been used in a wide field of research, including oceanography, agriculture, geology, and so forth. In recent years, the number of polarimetric SAR systems onboard aircraft and satellites has increased, and SAR polarimetry has received increasing research attention. Fully-polarimetric SAR data consist of more information on the electromagnetic scattering characteristics of the terrain targets compared to conventional single- or dual-polarization SAR data. Therefore, it is expected to contribute to the investigations or research on geoscientific phenomena. Among geoscientific phenomena, landslides are deeply related to the loss of human lives and their property, and so, this is an important natural phenomenon to be studied.
Recently, remote sensing techniques for landslide investigations have been reviewed in detail [1]. Various kinds of remote sensing techniques, including aerial photography, high-resolution optical satellite imagery, LiDAR and SAR interferometry (InSAR), are available for landslide investigations. SAR polarimetry is also one of the effective measures to investigate landslides. For example, Watanabe et al. [2] and Yonezawa et al. [3] applied polarimetric scattering power decomposition methods to examine landslides triggered by a large earthquake in northern Japan. The scattering power decomposition method decomposes the total power received by the SAR antenna into three or four components that correspond to scattering processes on the ground. They found that the surface scattering power Ps is dominant among other scattering powers (the double-bounce scattering Pd, the volume scattering Pv and the helix scattering Pc) on the landslide surfaces and on other bare soil surfaces, such as agricultural fields. Watanabe et al. [2] also proposed a decision tree scheme that separates rough surfaces, including landslides from other surfaces in a PolSAR image. In warm and humid regions, such as Japan, the slope adjacent to a landslide or the pre-slide slope is generally covered by vegetation. It is known that the volume scattering power Pv is dominant on vegetated surface. A landslide can be distinguished as the area where Ps surpasses Pv or Ps increased more than Pv [4,5]. Note, however, that the observation geometry has not been taken into consideration in these papers. Additionally, the correlation coefficient between HH (horizontal transmitted and horizontal received) and VV (vertical transmitted and vertical received) polarizations and other polarimetric indices were focused on for landslide detection in Shimada et al. [6]. They revealed that the magnitude of the HH-VV correlation coefficient showed high values at landslides and smooth surfaces. This is because the HH-VV correlation coefficient is a polarimetric index that relates to the surface and the double-bounce scattering processes. As mentioned above, it is known that the surface scattering process is observed on landslide surfaces or on bare soil surfaces. The HH-VV correlation coefficient has been examined for the estimation of surface roughness in [7]. It is reported that the magnitude of the HH-VV correlation coefficient of bare surfaces mainly ranges between 0.6 and 0.9 regardless of the roughness state.
As described above, polarimetric indices are expected to serve for landslide recognition, because the scattering properties of landslides are different from those of the surrounding forested area; however, quantitative evaluation on the indices especially for landslide investigation has not been carried out. Moreover, there is no or little research that focuses on the SAR observation geometry (three-dimensional relationship between the illumination direction of the radar and the aspect of the landslide slope) to investigate the behavior of the polarimetric indices. If the behavior of the polarimetric indices depending on the observation geometry is revealed, this leads to establishing an effective method to detect landslides by PolSAR data. The SAR observation geometry can be represented by the local incidence angle. Consequently, we will show how the values of polarimetric indices change with respect to the local incidence angle utilizing PolSAR data for the same landslide area acquired from different directions.
In Section 2, polarimetric analysis methods and the data utilized are explained. The polarimetric properties of landslides are described based on the results of the scattering power decomposition and the correlation coefficient between HH and VV polarizations in Section 3. Further discussions and conclusions are given in Section 4 and Section 5.

2. Methodology and the Data Utilized

The basic principles of the scattering power decomposition method and the derivation of the correlation coefficient between HH and VV polarizations as potential measures for landslide investigation are reviewed in this section. After that, the specifications of PolSAR data suitable for the aim of this study are given.

2.1. Methodology

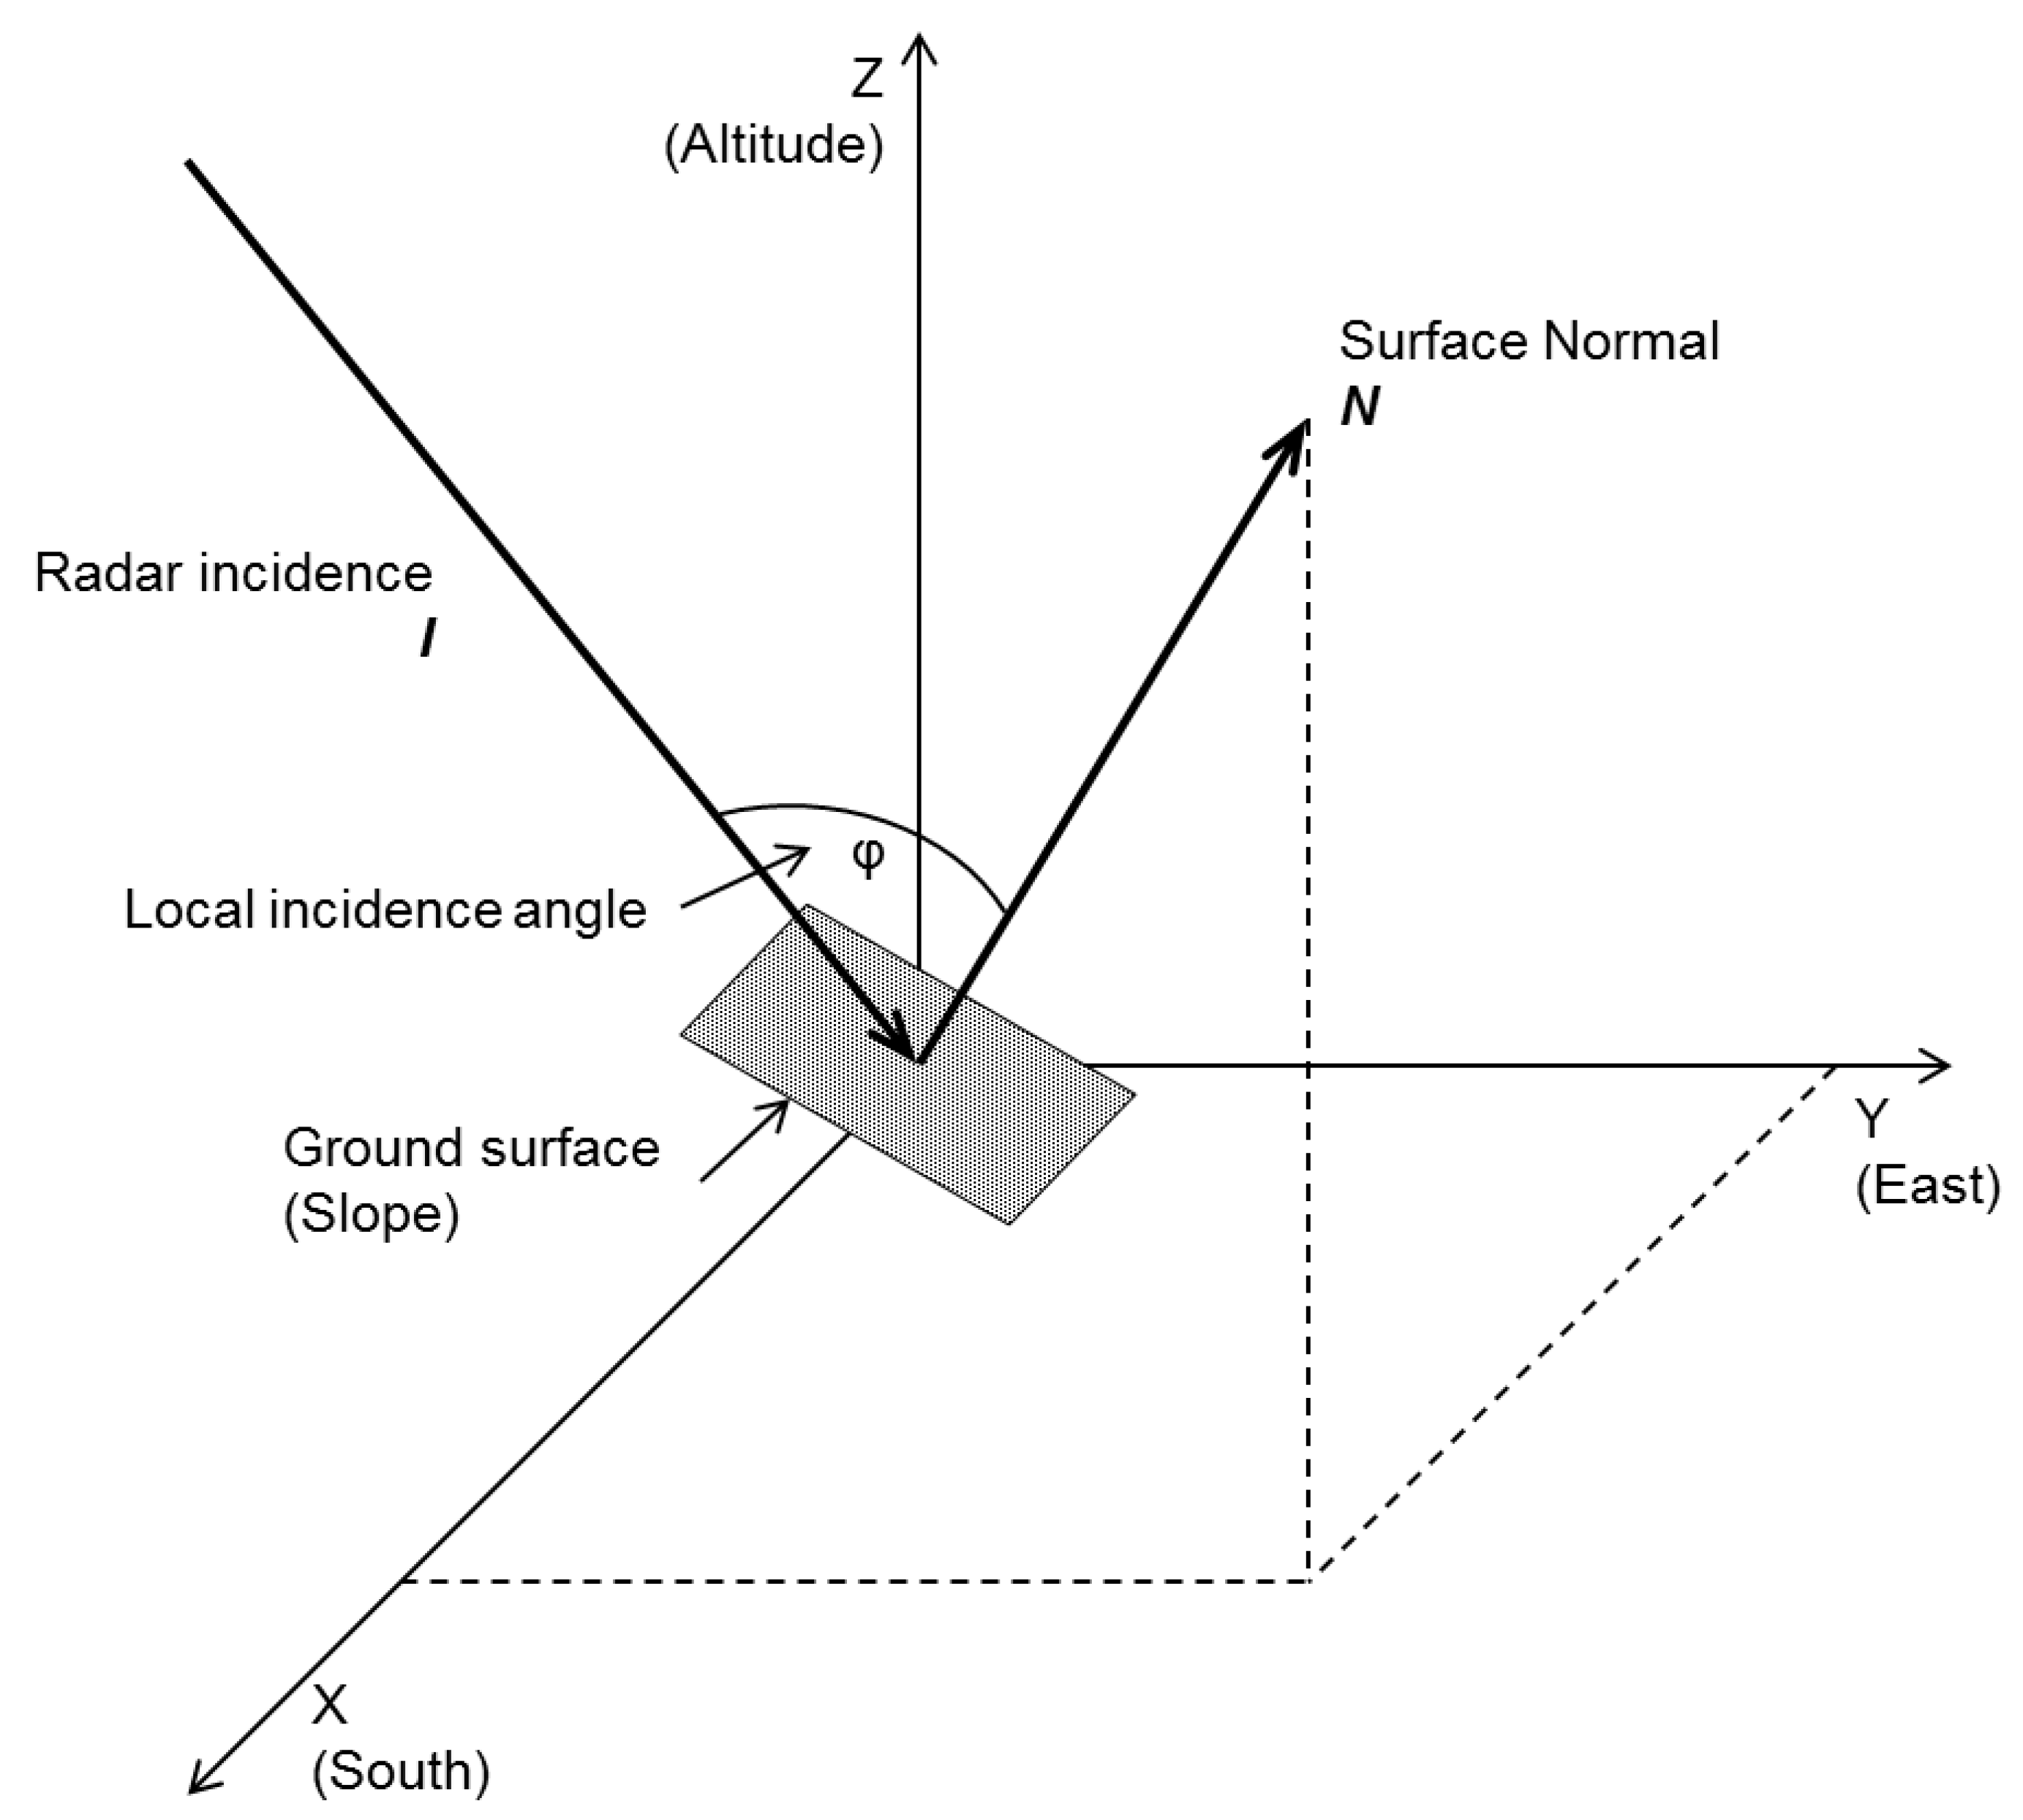
2.1.1. Basic Concept of Surface Scattering and the Importance of Orientation Angle Compensation

A typical polarimetric SAR measures the complex scattering matrix [S] in a linear (H, horizontal; V, vertical) polarization basis. The Sinclair scattering matrix [S] for each pixel in a PolSAR image is expressed as:
[ S ] = [ S H H S H V S V H S V V ]
By the definition of the scattering matrix [8,9,10,11], the notation of the subscript “HV” is used as follows: the first subscript “H” denotes receiving polarization, whereas the second one “V” is used for transmitting polarization. The other three polarizations are similarly defined.
It is known that the surface scattering mechanism is mainly caused by rough surfaces, such as bare soil, agricultural fields, sea surfaces, etc. [12]. The co-polarization (co-pol.) components (SHH and SVV) of the scattering matrix [S] are almost in phase [13]. This behavior is characterized by (2). The superscript * denotes complex conjugation.
Re ( S H H S V V * ) > 0
This polarimetric feature for the surface scattering mechanism has been utilized in the four-component scattering power decomposition method [14], which follows. As will be pointed out later, the SHHSVV* term is directly related to the HH-VV correlation coefficient.
It is also known that the compensation of the orientation angle is necessary to retrieve geophysical parameters from PolSAR data [15,16]. Polarization orientation angle is the angle of rotation about the line of sight of the radar. The polarization orientation shift is induced by a surface with a non-zero azimuth slope, such as the sloped surfaces in rugged terrain areas. This shift produces higher HV (cross-polarization) intensity, and it may lead to incorrect results that could be misinterpreted. The orientation angle compensation should be done before analyzing PolSAR data to acquire geophysical parameters properly for various applications.

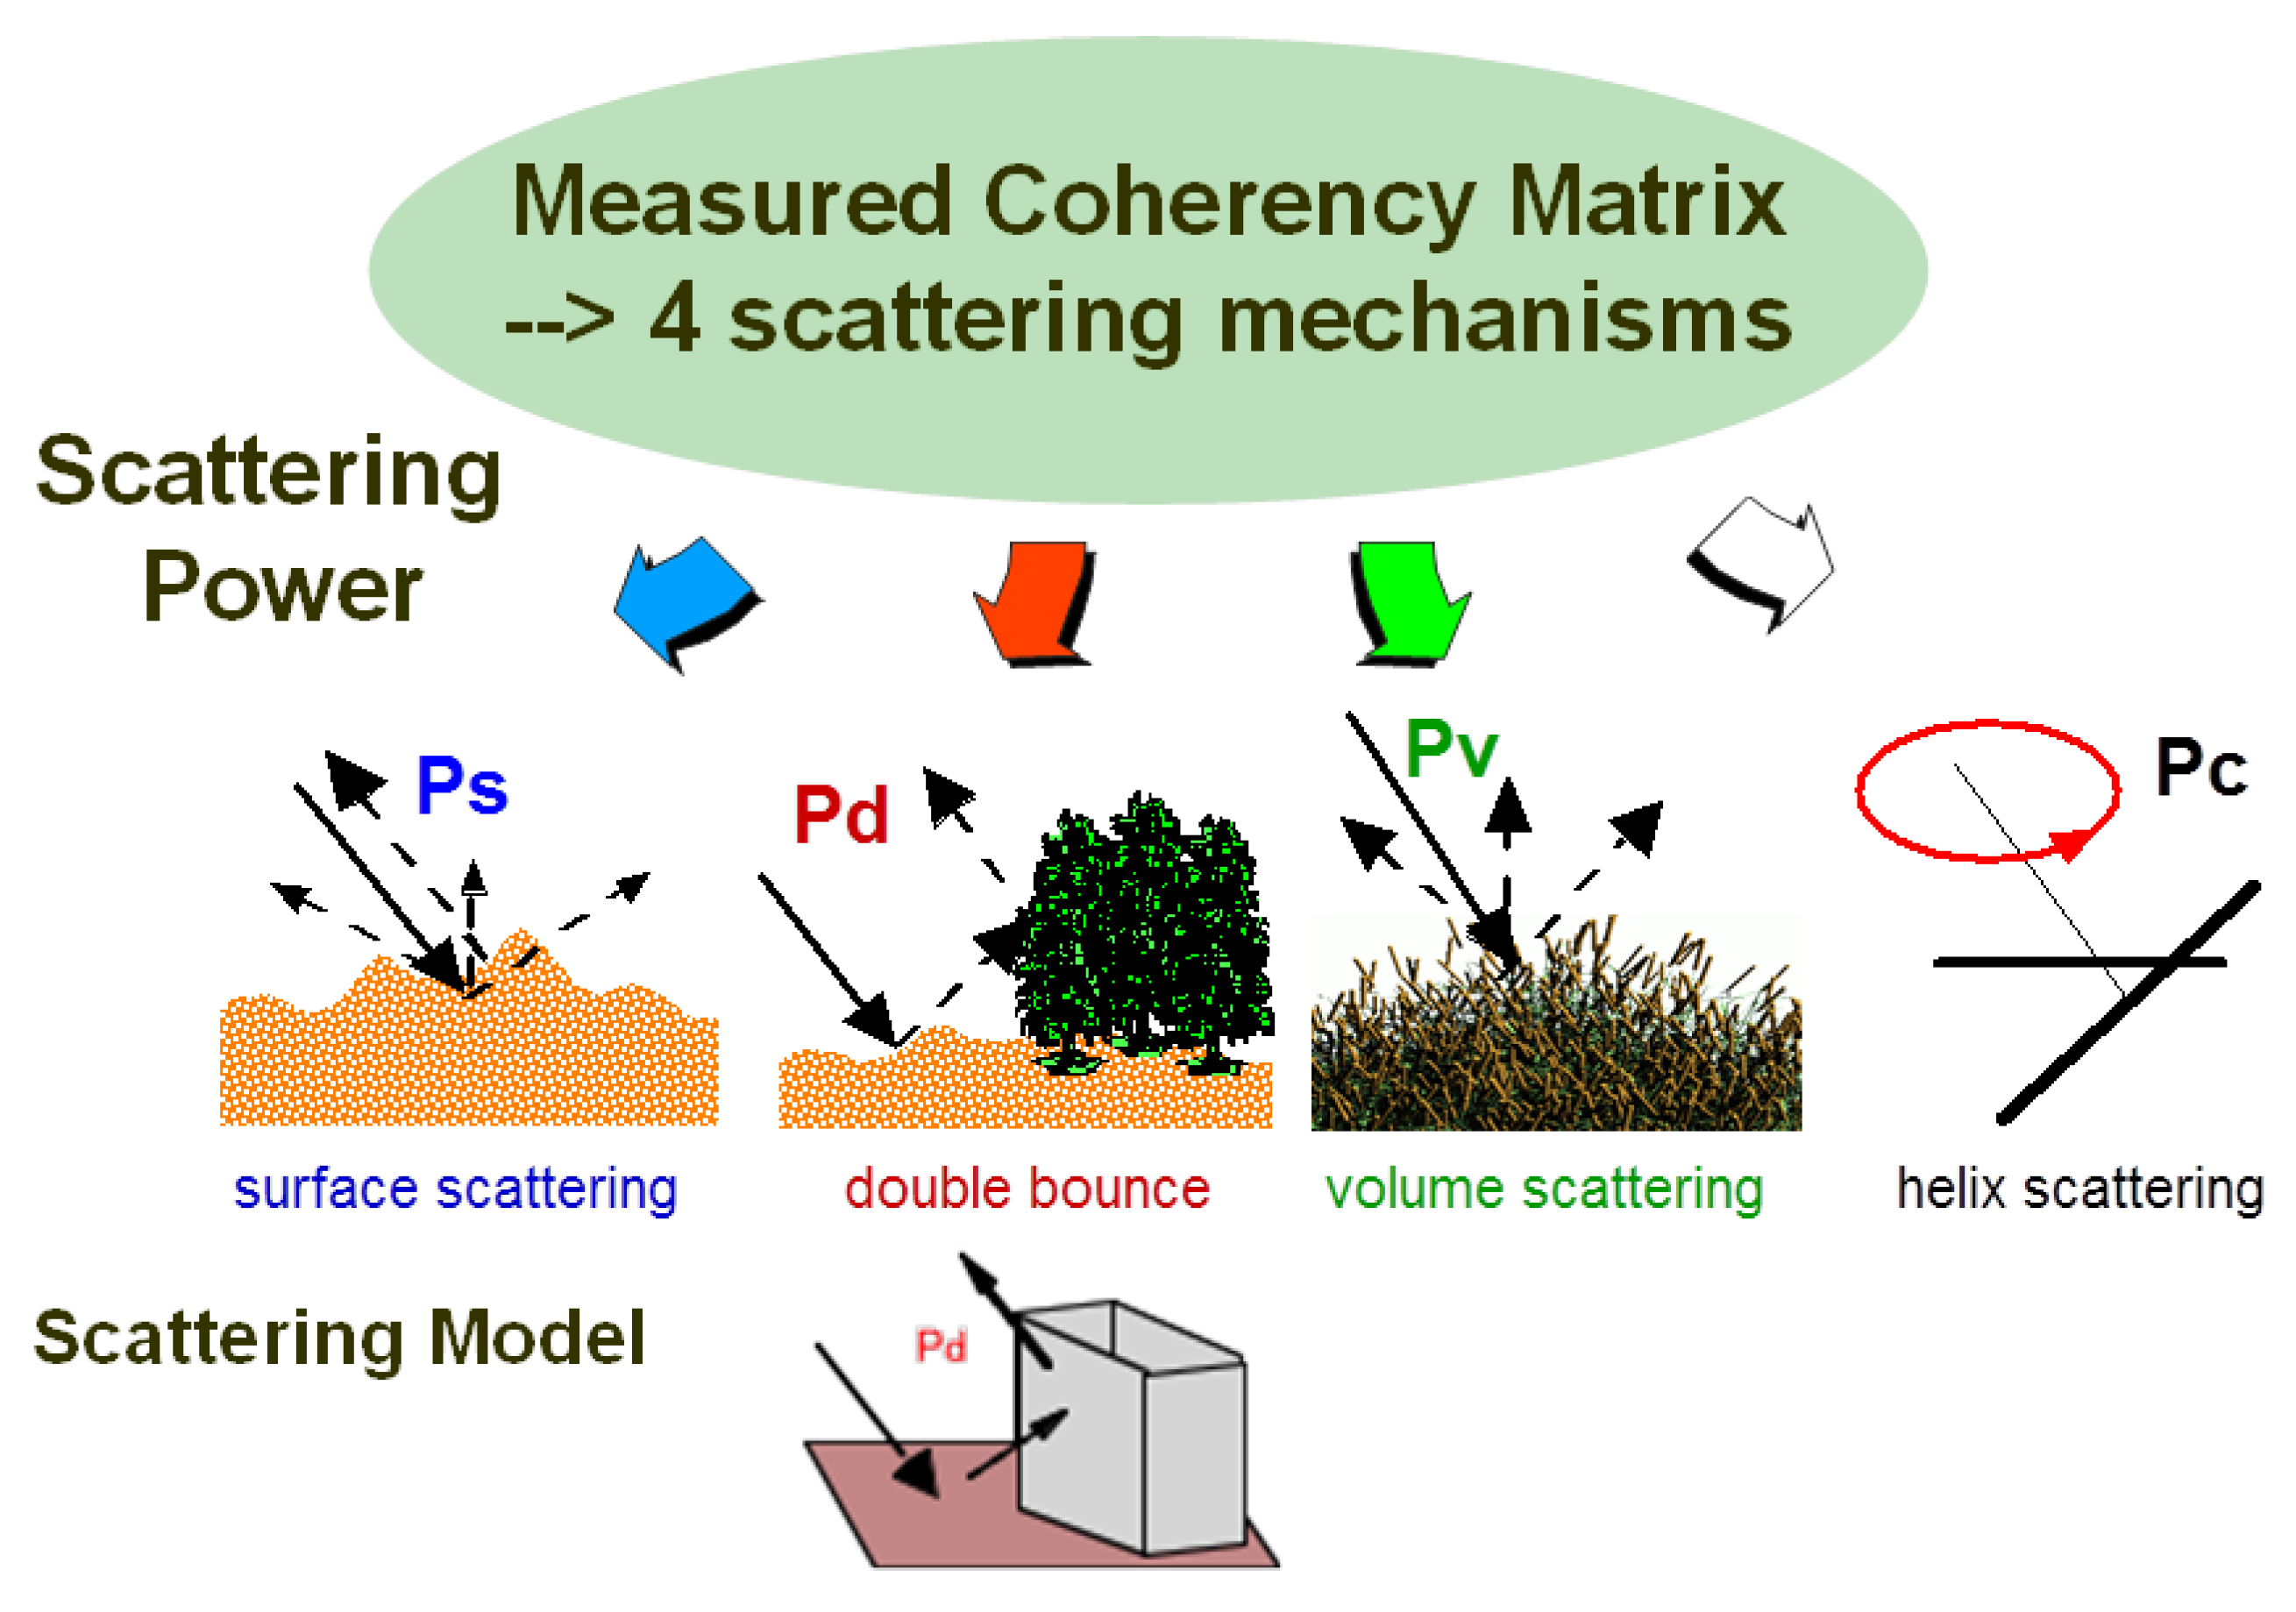
2.1.2. Model-Based Scattering Power Decomposition

Model-based scattering power decomposition methods have been widely utilized to analyze PolSAR data because of their clear physical explanation, convenient implementation and easy visual interpretation. The original three-component decomposition has been proposed by Freeman and Durden [17]. Yamaguchi et al. [14] extended the method by adding the forth component, the helix scattering. Figure 1 shows the conceptual diagram of the four-component scattering power decomposition.
Figure 1. Schematic diagram of the four-component scattering power decomposition with the coherency matrix. Measured scattering matrix [S] is transformed to coherency matrix [T] and is decomposed into the surface scattering power Ps, the double-bounce scattering power Pd, the volume scattering power Pv and the helix scattering power Pc.
Remotesensing 07 15424 g001
Later, the orientation angle compensation has also been taken into account in the power decomposition. The Yamaguchi decomposition with orientation angle compensation (Y4R) [18] makes use of the rotated coherency matrix. It is necessary to rotate the measured coherency matrix by an angle that minimizes the T33 component of the coherency matrix to overcome the reflection symmetry assumption problems. This procedure is equivalent to the orientation angle compensation. Accordingly, Y4R can be done with the following procedures. First, the coherency matrix [T] corresponding to each imaging pixel can be given by definition:
[ T ] = k p k p = [ T 11 T 12 T 13 T 21 T 22 T 23 T 31 T 32 T 33 ]
where † denotes complex conjugation and transposition, denotes the ensemble average and the Pauli vector kp is defined as:
k p = 1 2 [ S H H + S V V S H H S V V 2 S H V ]
Then, the coherency matrix after rotation by an angle can be obtained by:
[ T ( θ ) ] = [ R p ( θ ) ] [ T ] [ R p ( θ ) ]
[ R p ( θ ) ] = [ 1 0 0 0 c o s 2 θ s i n 2 θ 0 s i n 2 θ c o s 2 θ ]
where the angle θ is derived by:
2 θ = 1 2 t a n 1 ( 2 R e ( T 23 ) T 22 T 33 )
Finally, the rotated coherency matrix can be expanded into four submatrices corresponding to the surface scattering, the double-bounce scattering, the volume scattering and the helix scattering mechanisms:
[ T ( θ ) ] = f s [ T ( θ ) ] s u r f a c e + f d [ T ( θ ) ] d o u b l e b o u n c e + f v [ T ( θ ) ] v o l u m e + f c [ T ( θ ) ] h e l i x = P s + P d + P v + P c
where fs, fd, fv and fc are the expansion coefficients and Ps, Pd, Pv and Pc are the decomposition powers for the surface, the double-bounce, the volume and the helix scattering, respectively.
Figure 2 shows the four-component scattering power decomposition result in the study area. The area is located in Nara, central Japan. Typhoon Talas brought about much damage across Japan in September 2011. The precipitation for 72 hours in the study area registered more than 1000 mm. The heavy rainfall triggered more than 70 deep-seated landslides in the study area [19]. It is found from Figure 2 that the dominant scattering process in those landslides is the surface scattering, while the non-landslide (vegetated) area shows “green” corresponding to the dominance of the volume scattering. A typical deep-seated landslide in the study area is shown in Figure 3. The area of the landslide is 437,500 m2 [19].
Figure 2. Four-component scattering power decomposition image of a portion in the study area. The PolSAR data for this decomposition image was acquired on 26 August 2014 with PALSAR-2 onboard the ALOS-2 satellite. Deep-seated landslides are colored red, which corresponds to surface scattering. The yellow arrow on the top of the image depicts the line of sight of the optical image of a landslide (Figure 3).
Remotesensing 07 15424 g002
Figure 3. An optical image of a landslide within the images of Figure 2 and Figure 4. The acquisition date of this optical image is 4 May 2014, which is close to that of the PolSAR data in Figure 2 and Figure 4. It is found that there is no vegetation in the landslide area, while slopes in the vicinity are covered with trees.
Remotesensing 07 15424 g003

2.1.3. Correlation Coefficient in the Linear Polarization Basis
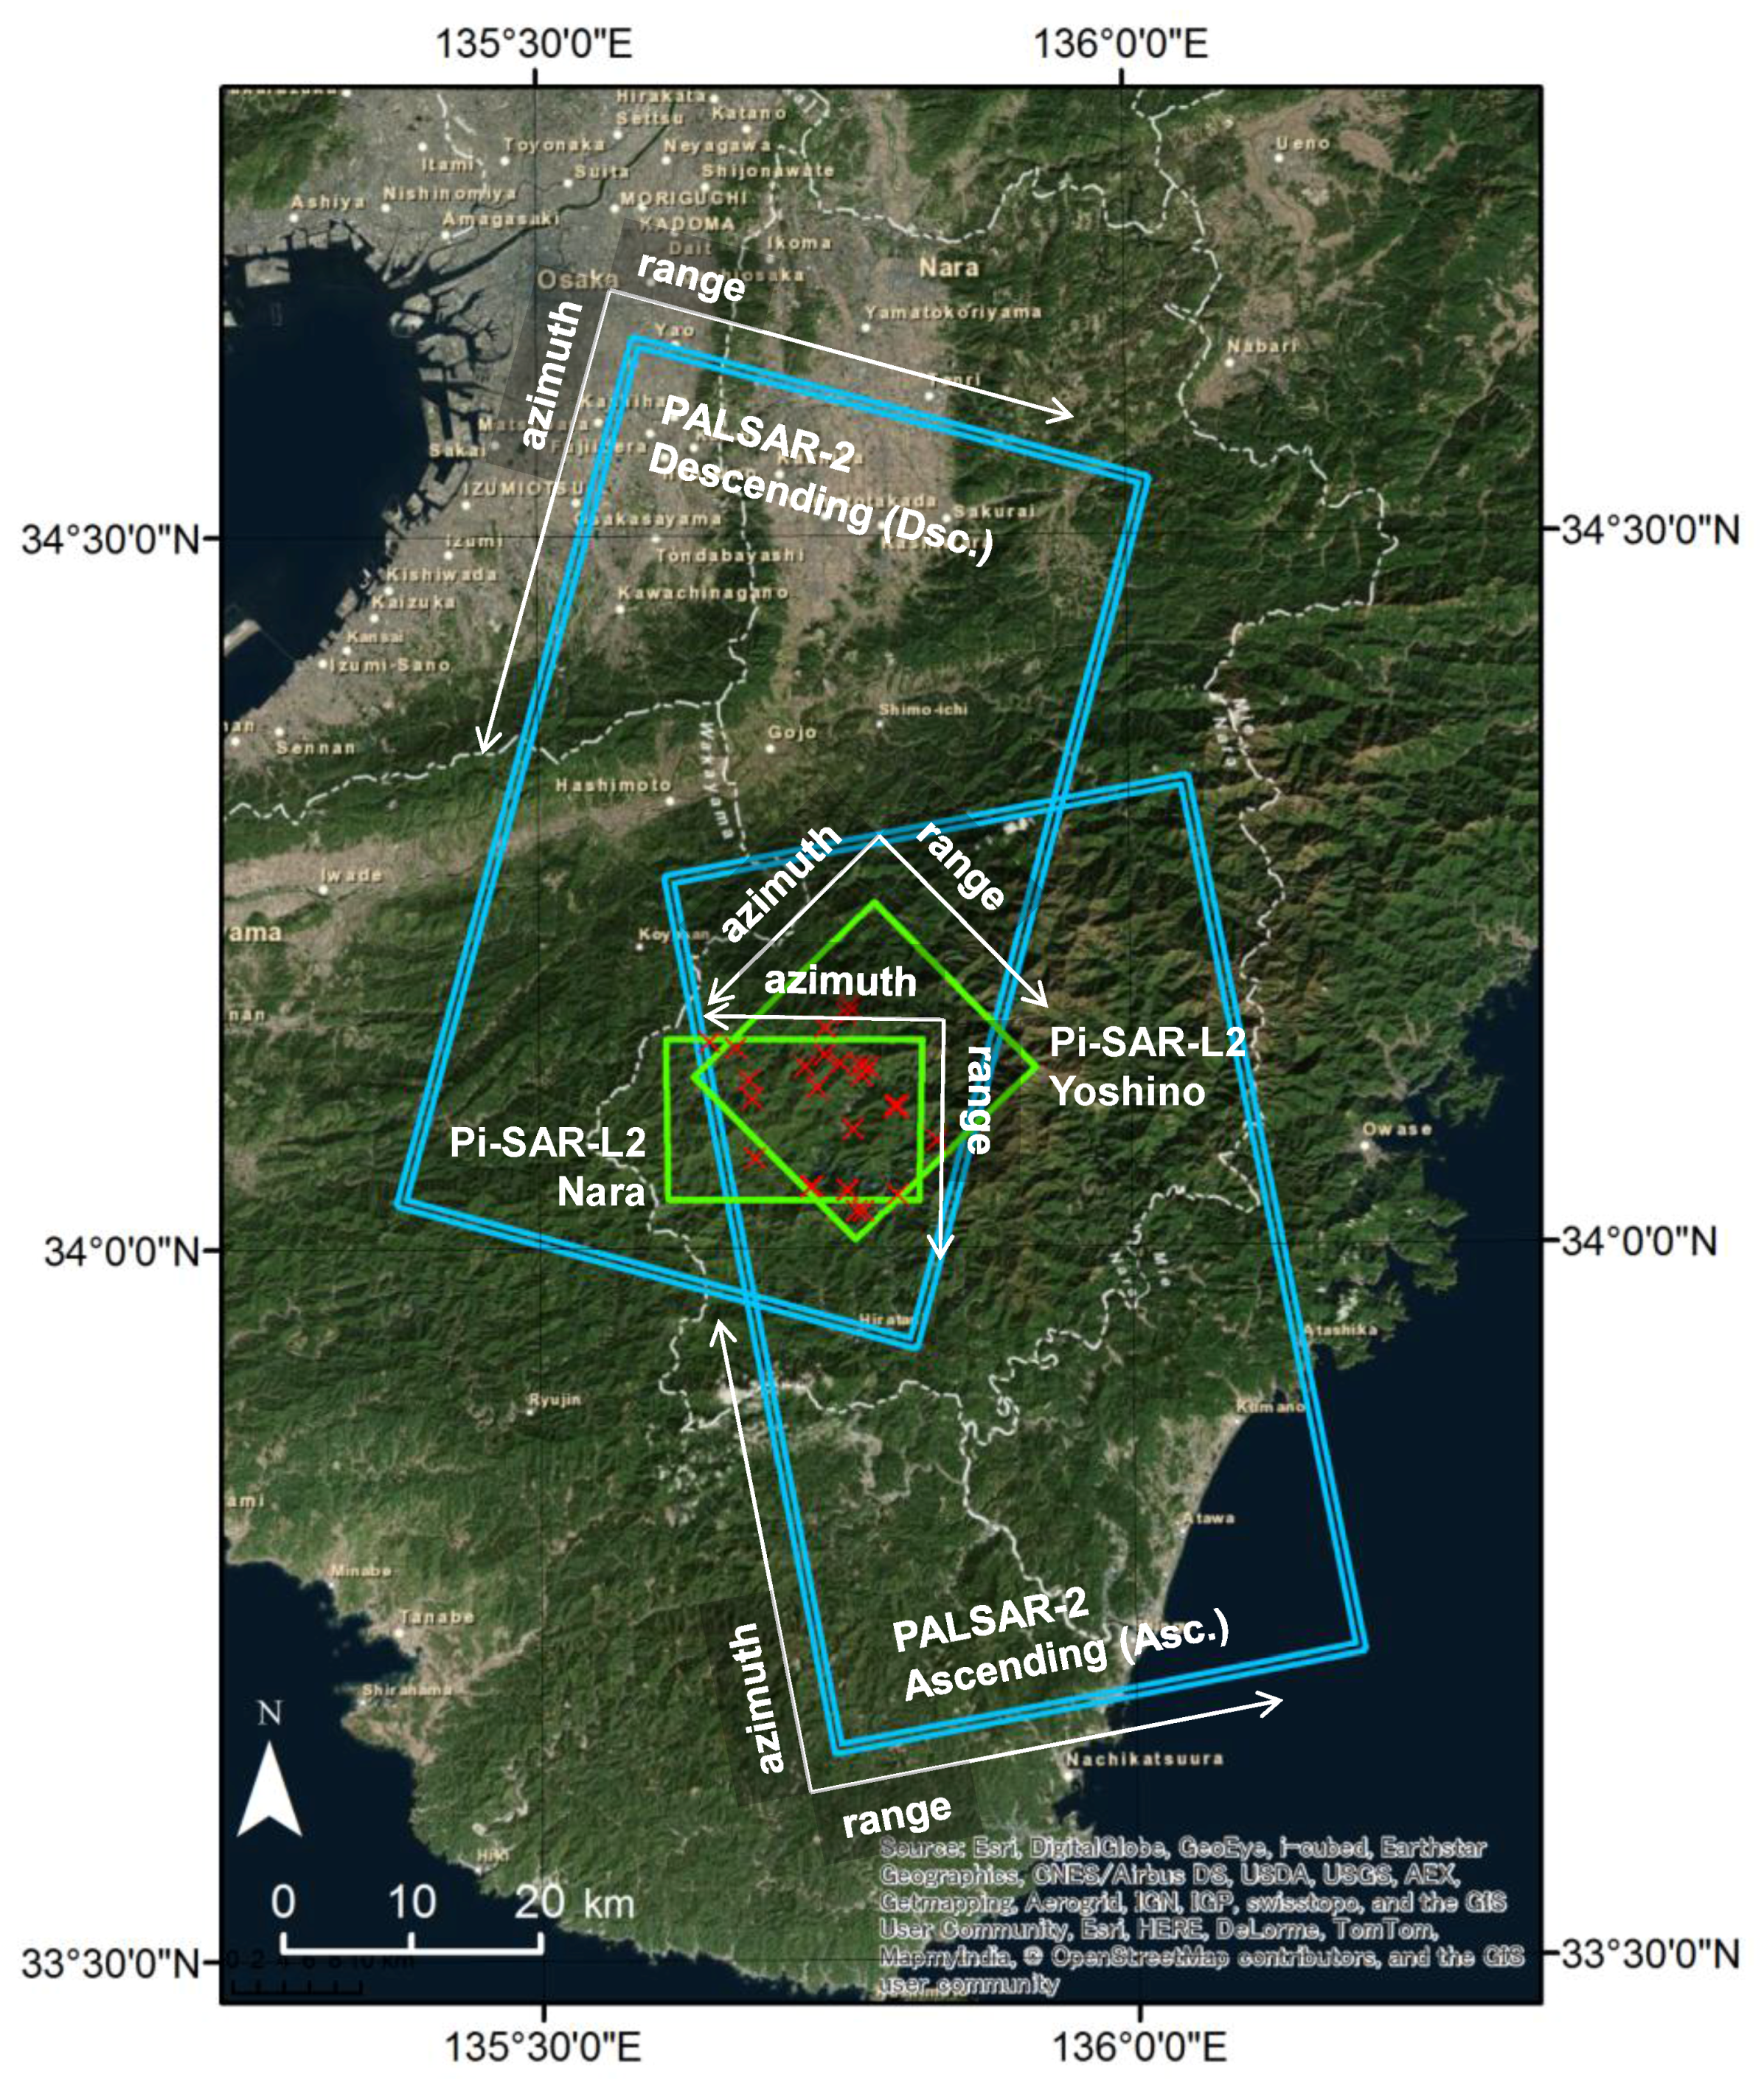
In the signal processing, the correlation coefficient for complex signals s1(x) and s2(x), also known as complex coherence, can be defined as follows:
0 | a b s 1 ( x ) s 2 * ( x ) d x | a b | s 1 ( x ) | 2 d x a b | s 2 ( x ) | 2 d x 1
Then, for PolSAR data analysis, the polarimetric correlation coefficient γHH-VV can be obtained by replacing s1(x) and s2(x) in (9) with two polarizations, such as SHH and SVV, and is defined as:
γ H H V V = S H H S V V * S H H S H H * S V V S V V *
As mentioned previously, the numerator of the γHH-VV, SHHSVV* term works as a discriminant for the surface scattering mechanism. Accordingly, we employ the positive values for the real part of the complex correlation coefficient, which corresponds to the surface scattering. For retrieving the geophysical parameters properly, the orientation angle compensation is also applied to the calculation of the HH-VV correlation coefficient. Consequently, the polarimetric correlation coefficient used in this study can be expressed as:
R e ( γ ( θ ) H H V V ) = R e ( S ( θ ) H H S ( θ ) V V * S ( θ ) H H S ( θ ) H H * S ( θ ) V V S ( θ ) V V * )
where S(θ)XX denotes the SXX term in the scattering matrix (1) rotated by the angle θ derived by (7). Figure 4 shows the HH-VV correlation coefficient with the orientation angle compensation (Re(γ(θ)HH-VV)) image in the study area. It is observed from Figure 4 that landslides are dominated by relatively high values (close to 1) of Re(γ(θ) HH-VV), while other areas, except for river beds and sparsely-vegetated areas, show low correlation values.
Figure 4. The gray-scaled image of the HH-VV correlation coefficient with orientation angle compensation. The image coverage and utilized PolSAR data are the as same as Figure 2. Most of the whitish portions indicate landslides or river bed. The yellow arrow on the top of the image depicts the line of sight of the optical image of a landslide (Figure 3).
Remotesensing 07 15424 g004
Table 1. Description of the PolSAR data. The angles of the azimuth (or flight) and range (or illumination) direction are defined as the angles from the north in the clock-wise direction. Pi, Polarimetric and Interferometric.
Scene IDAcquisition DateAzimuth Direction (°)Range Direction (°)Pixel Spacing Azimuth, Range (m)
PALSAR-2 Descending (Dsc.)ALOS201390289026 August 20141951053, 5
PALSAR-2 Ascending (Asc.)ALOS201412067027 August 201435479
Pi-SAR-L2 NaraL20050118 June 20122701800.5, 1.7
Pi-SAR-L2 YoshinoL2040068 August 2014225135
Figure 5. Red crosses indicate deep-seated landslides, which were triggered by torrential rain caused by Typhoon Talas in September 2011 in the study area. Blue and green rectangles show the coverage of PALSAR and Pi-SAR-L2 images, respectively. The flight (azimuth) and the illumination (range) direction for each PolSAR observation are indicated by arrows with labels.
Remotesensing 07 15424 g005

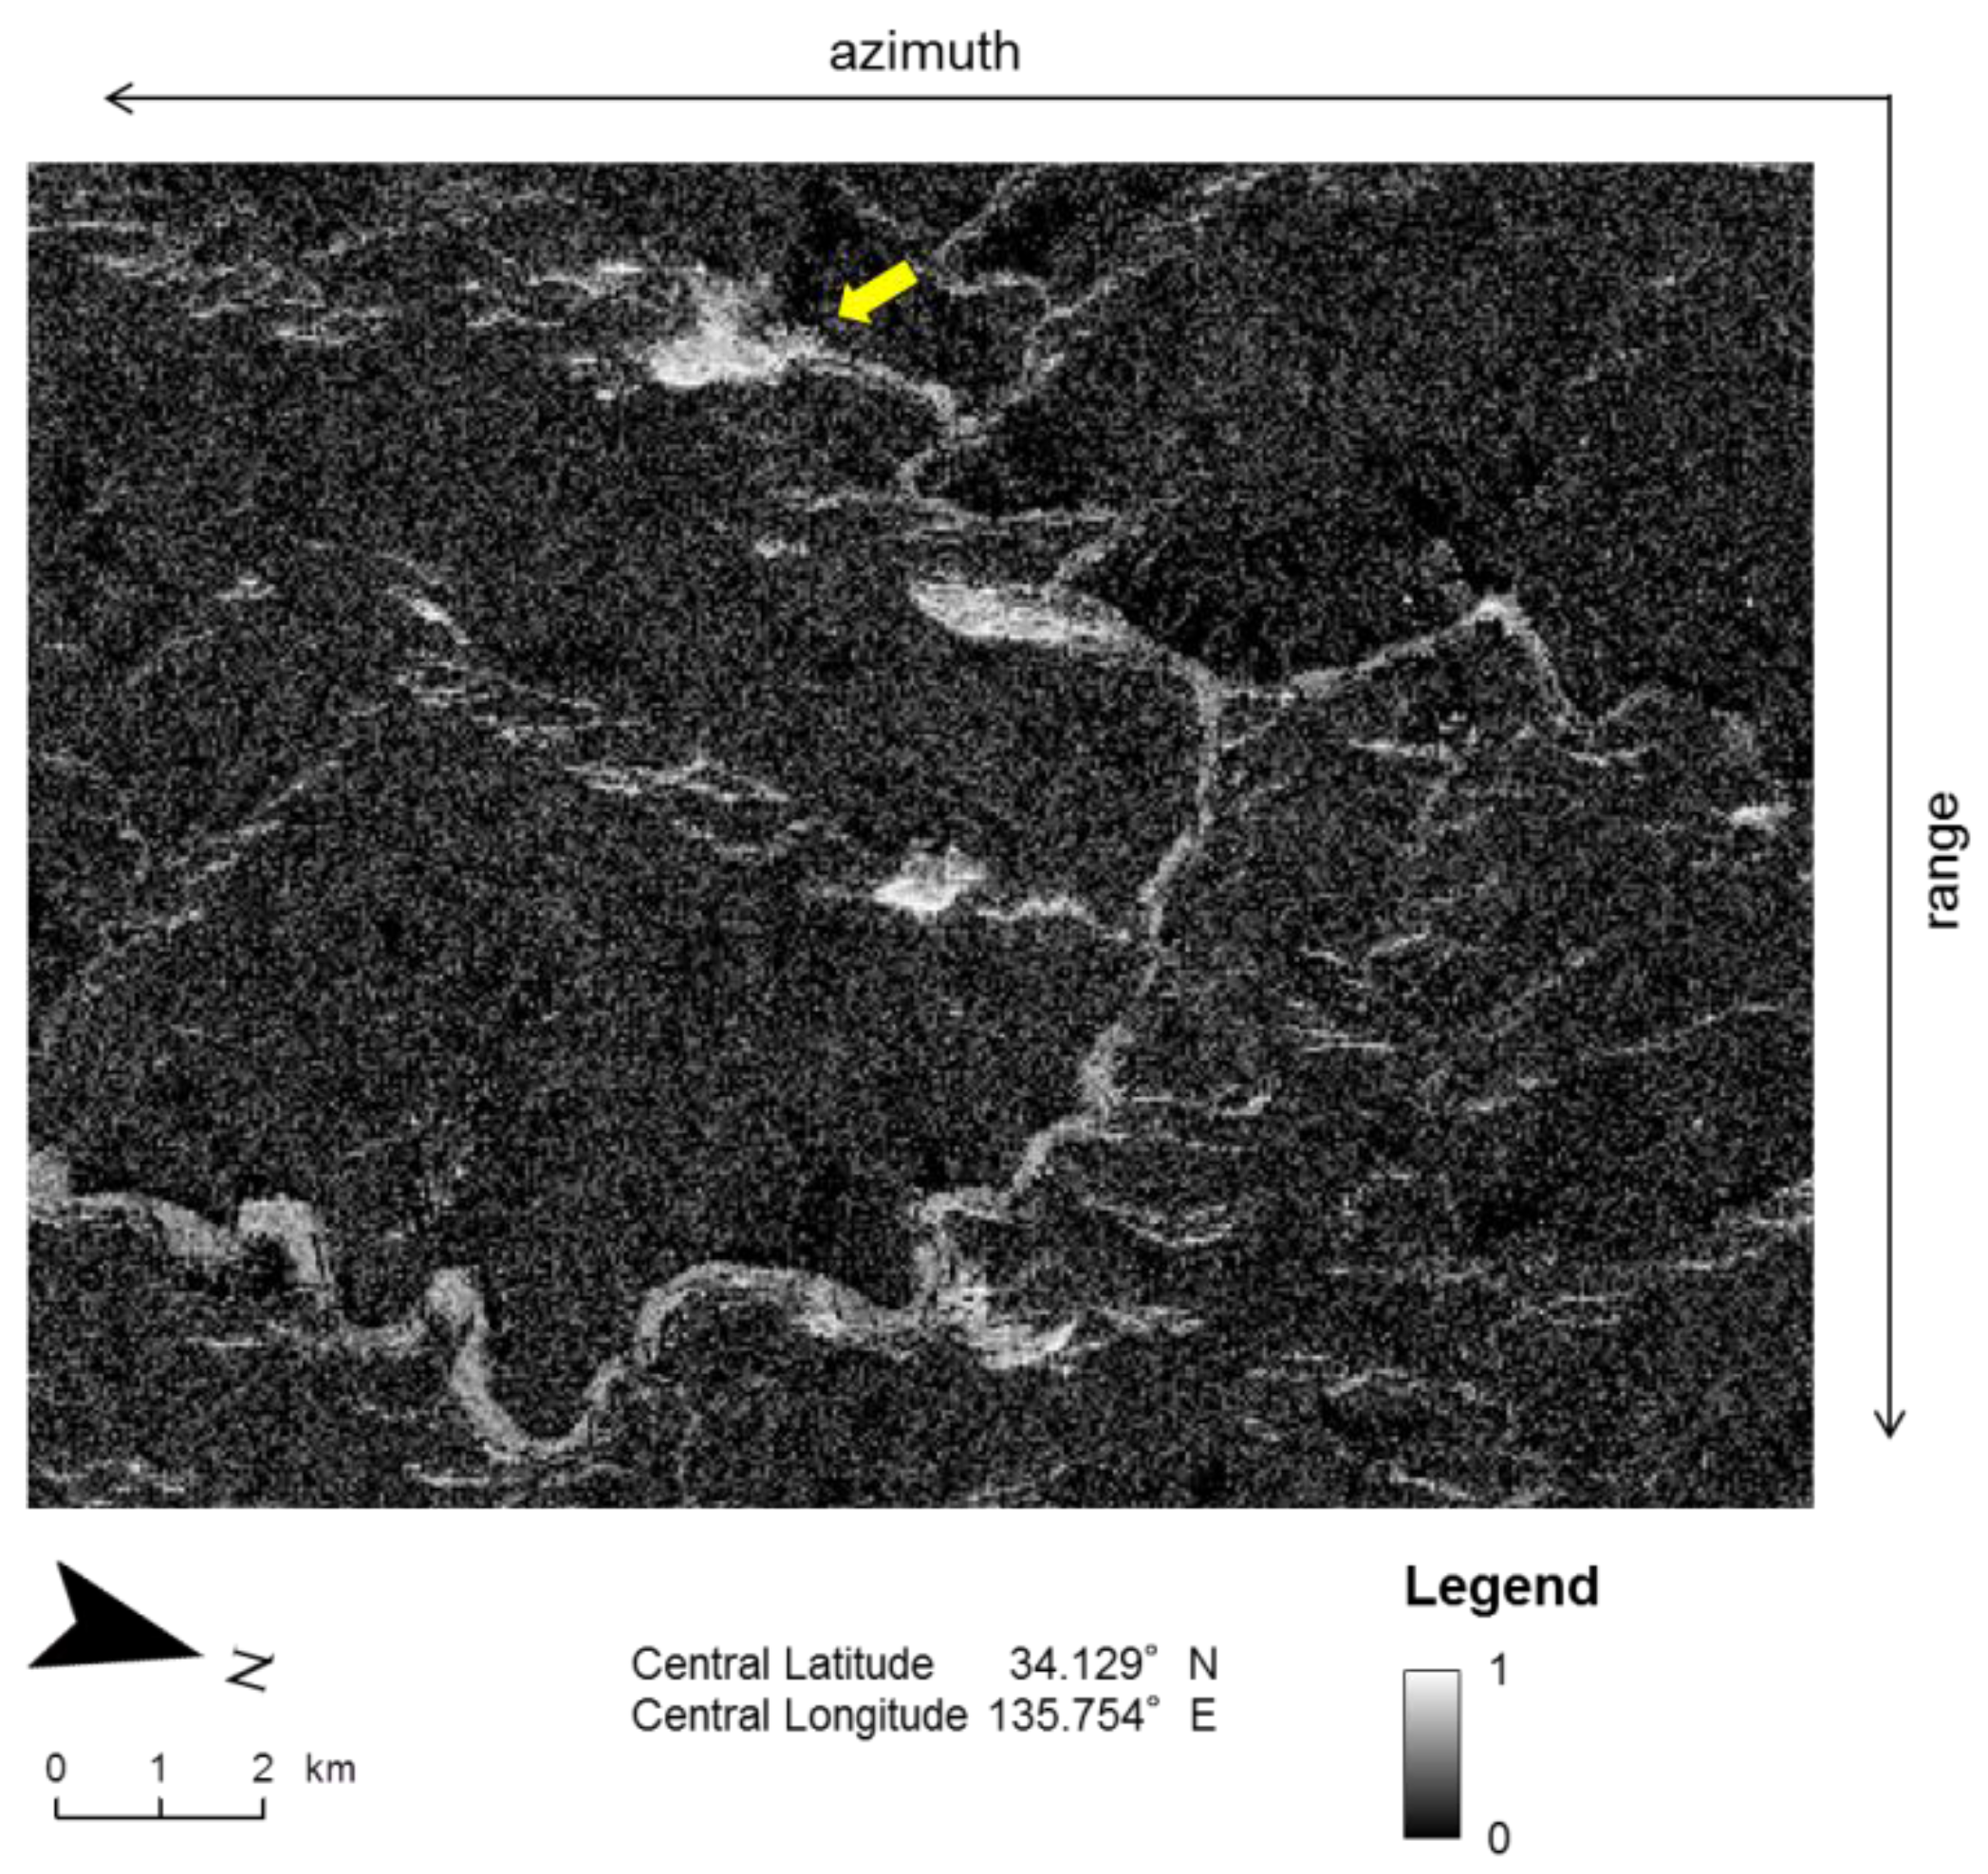
2.2. Description of Polarimetric SAR Data and the Study Area

The aim of this paper is to show the polarimetric scattering behavior involved with the observation geometry of PolSAR data acquisition. To apply the analysis methods described in Section 2.1, several PolSAR data for the study area acquired with Phased Array L-band Synthetic Aperture Radar-2 (PALSAR-2) [20] from different directions are selected. Further, Polarimetric and Interferometric Airborne Synthetic Aperture Radar with L-band Type-2 (Pi-SAR-L2) [21] data are added to examine the effect of the spatial resolution. The resolution (pixel spacing) is 3 (in range) to 6 (in azimuth)-times finer than that of PALSAR-2 in this case, as shown in Table 1. The window size for ensemble averaging the PALSAR-2 image processing is chosen as 5 pixels in the range direction and 7 pixels in the azimuth direction, which corresponds to approximately 500 m2/pixel on the ground. For Pi-SAR-L2 data, the window size is 3 (range) by 11 (azimuth) pixels, and that exhibits 30 m2/pixel on the ground. All of the PolSAR image processing was done by programs written in the MATLAB language.
The coverage of four PolSAR imageries listed in Table 1 is shown using rectangles on the landslide distribution map in Figure 5.

3. Polarimetric Scattering Properties of Landslides

Polarimetric scattering properties of landslides are described by the decomposition powers and the co-pol. correlation coefficient. We firstly focus on the surface scattering and the volume scattering among four scattering mechanisms, because those two scattering mechanisms characterize the landslide surface and vegetation, respectively.

3.1. Results for PALSAR-2 Data Analysis

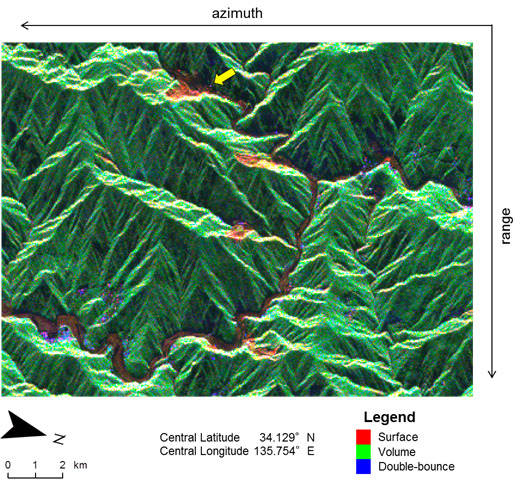
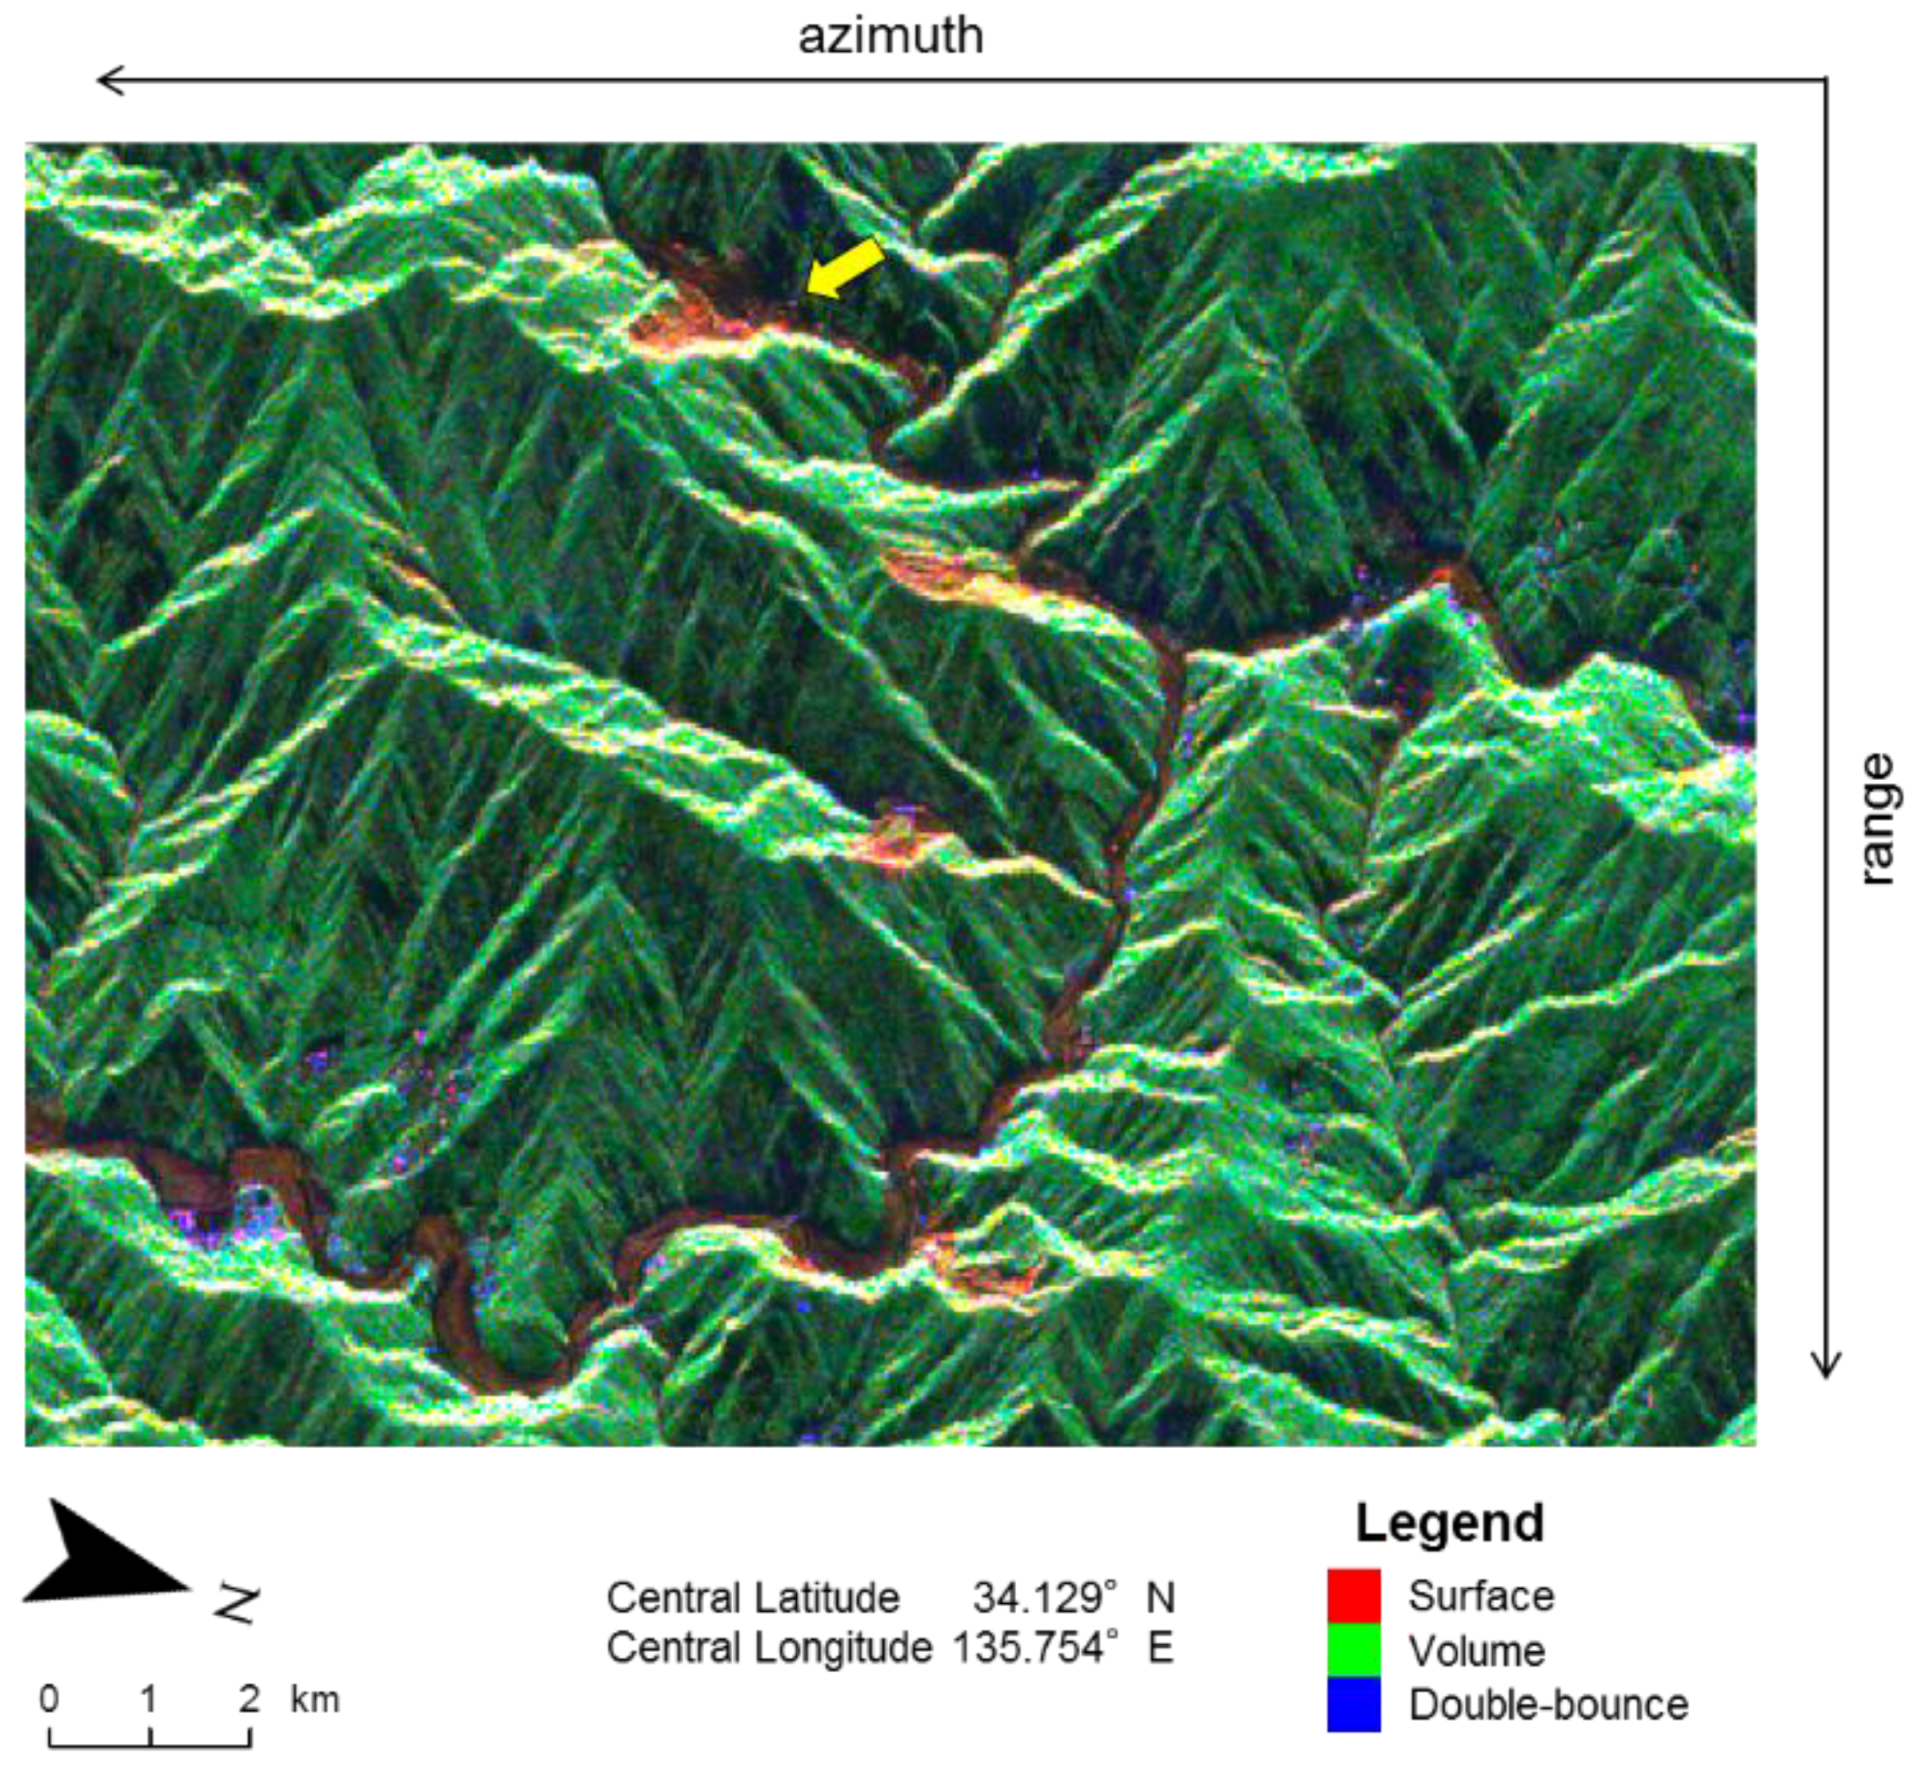
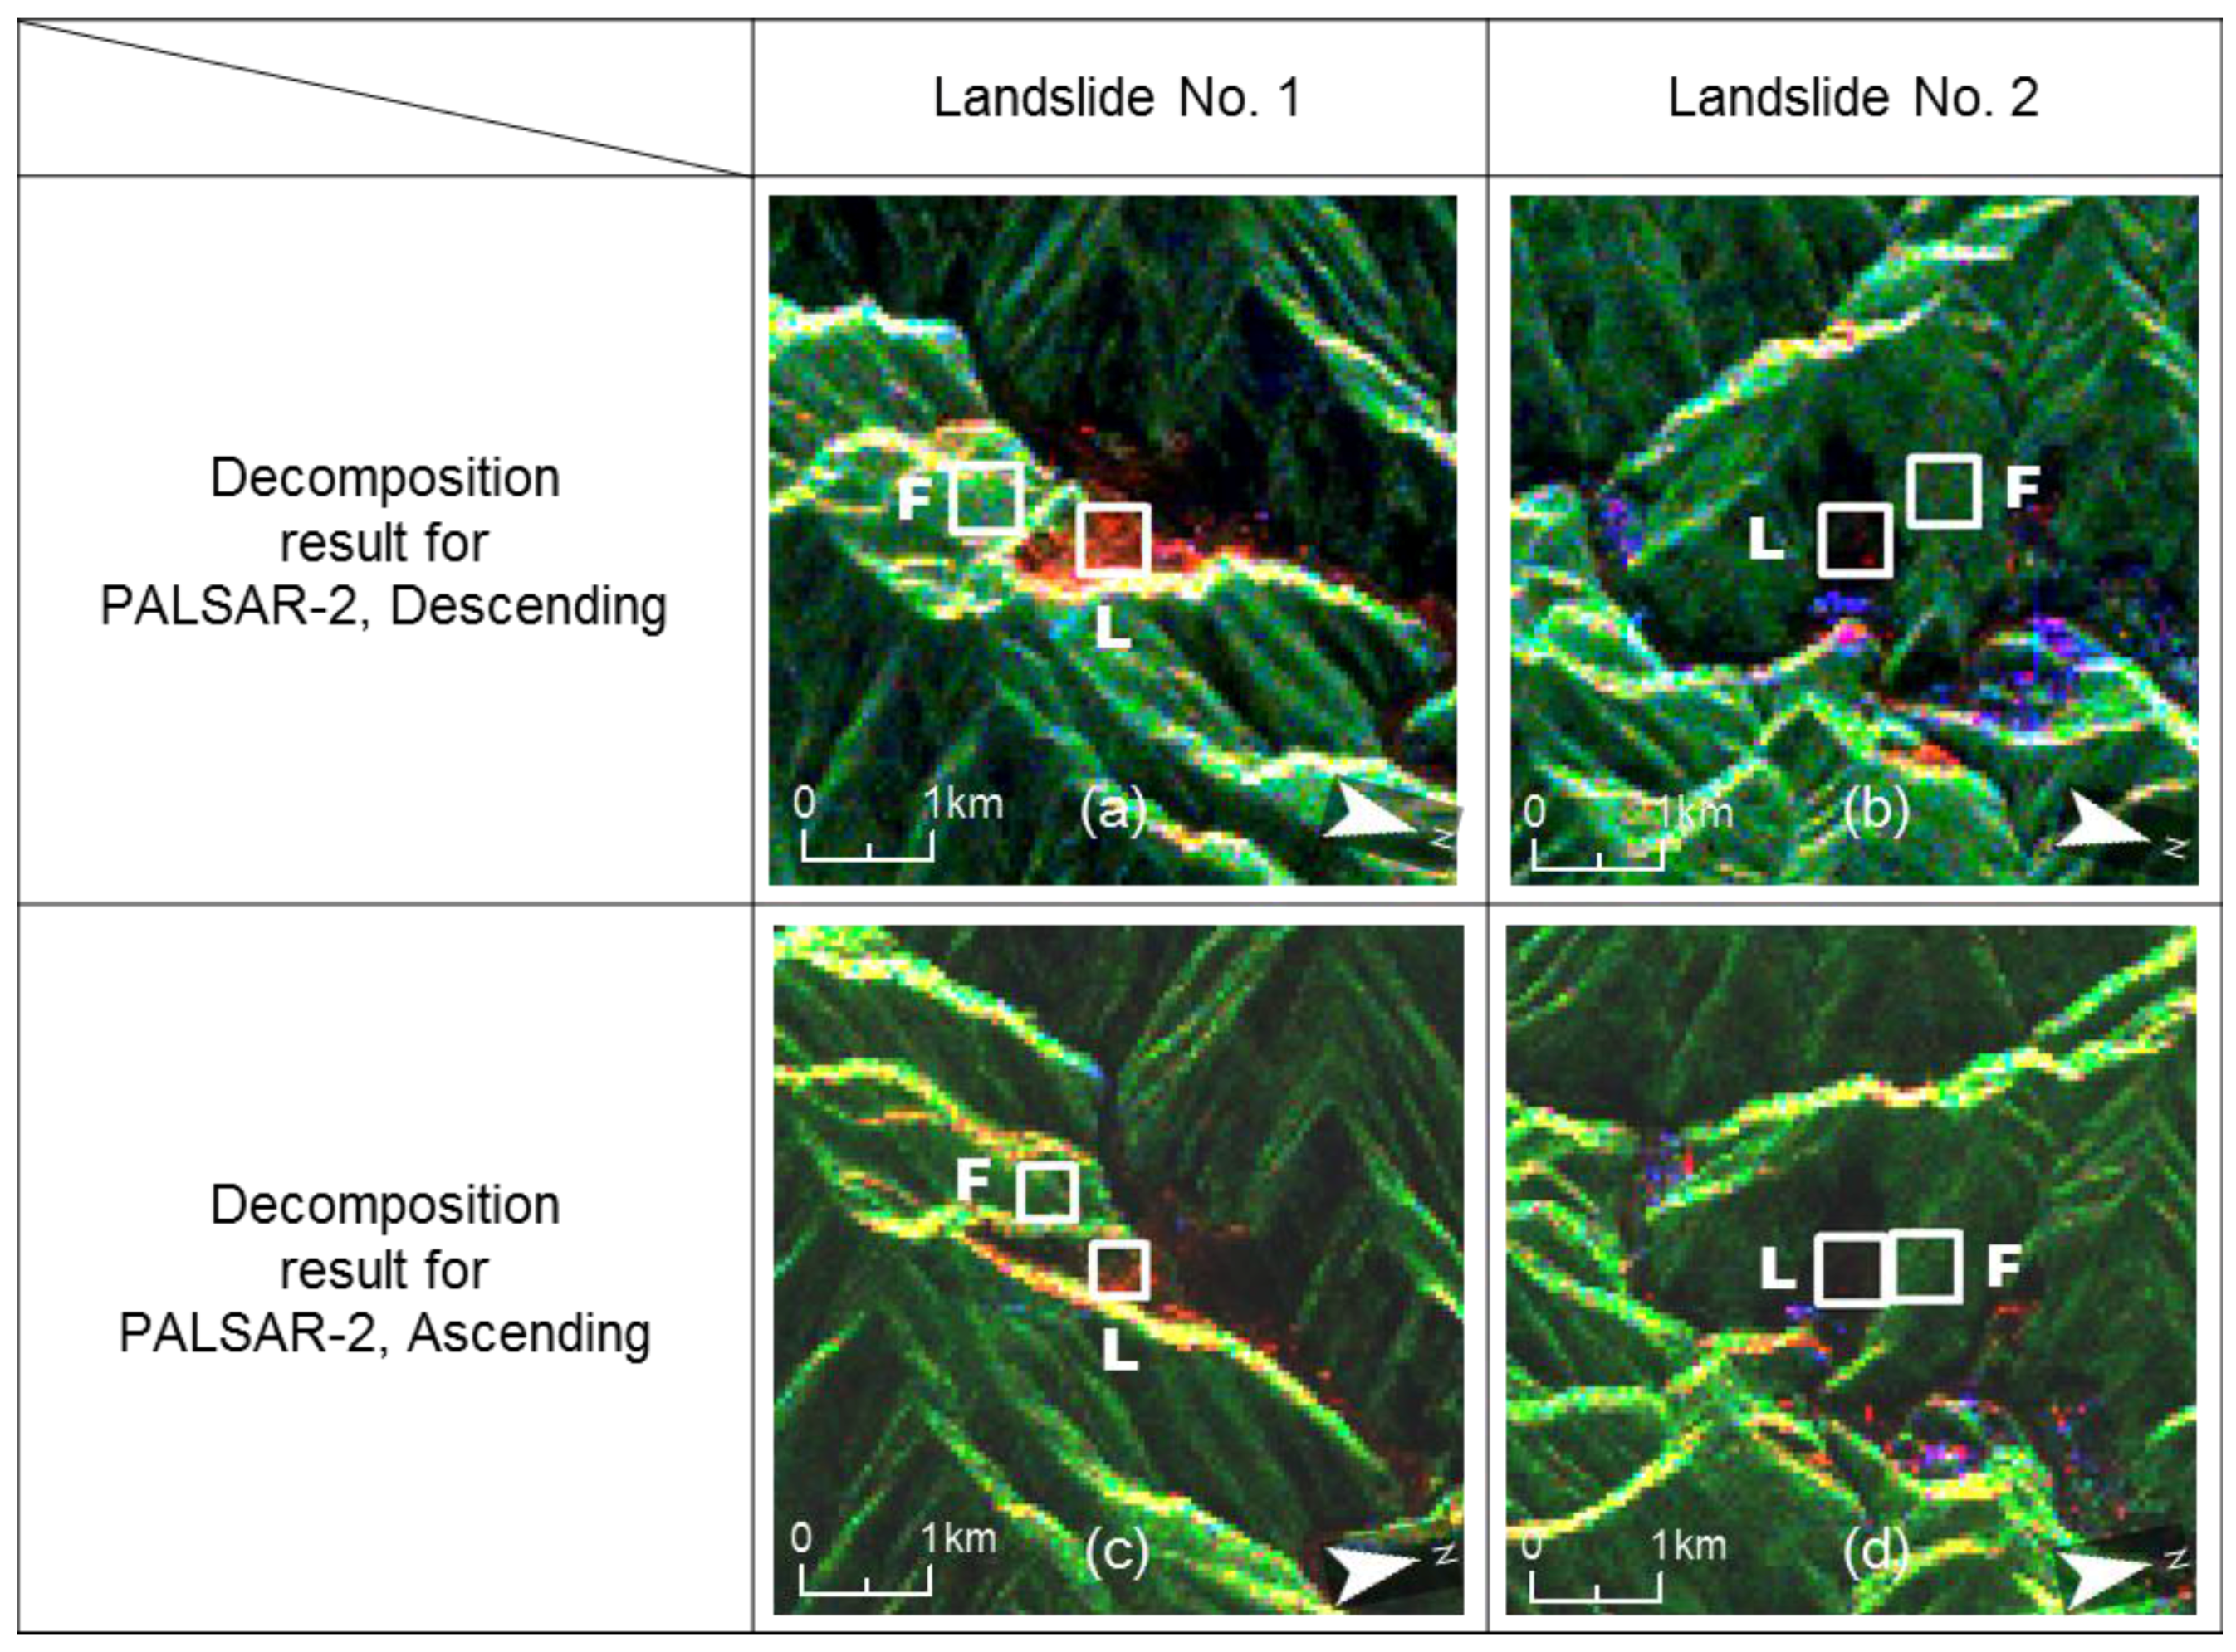
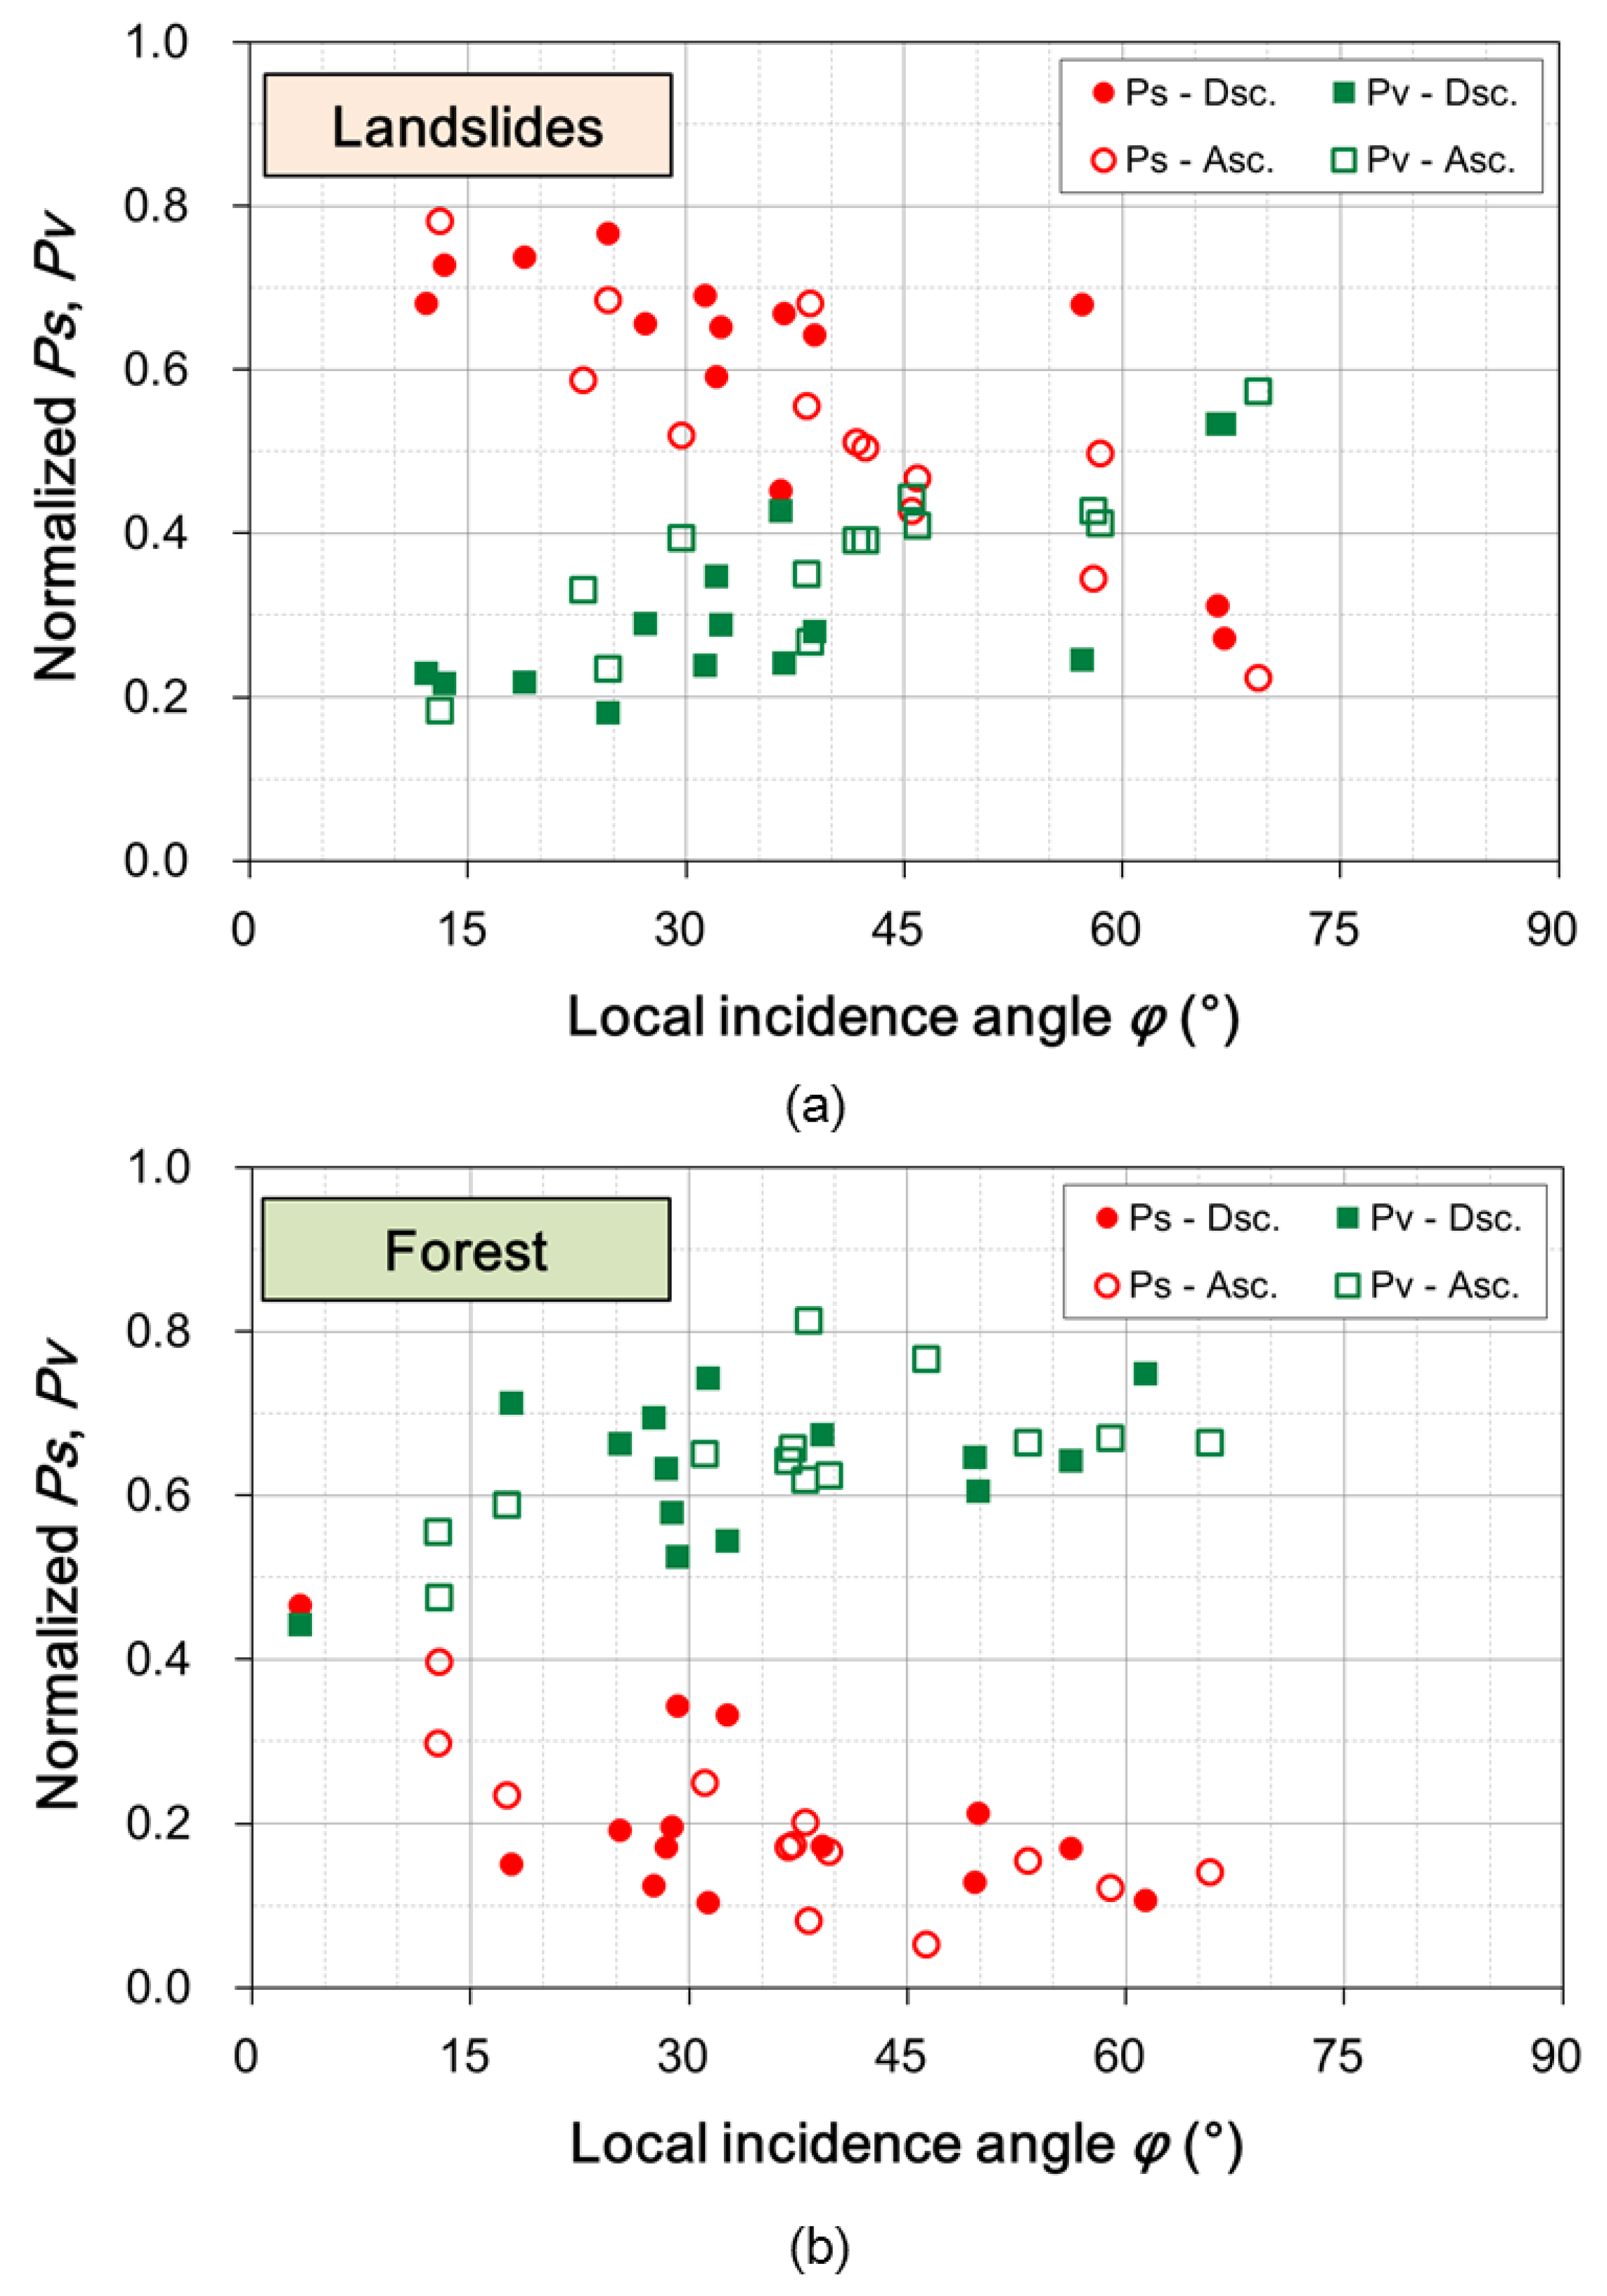
3.1.1. Scattering Power Decomposition

The scattering power decomposition results of two landslides for PALSAR-2 data in descending and ascending orbit observations are shown in Figure 6. First, we see that landslide No. 1 in Figure 6a is dominated by “red” pixels that correspond to the surface scattering, while landslide No. 2 (Figure 6b,d) is mainly occupied by dark-colored pixels. This means that the scattering power from landslide No. 2 is significantly weak because the landslide is located on the slope facing away from the radar. Thus, the landslide does not always display the surface scattering clearly. Next, it is observed from Figure 6a,c that landslide No. 1 in the ascending image (Figure 6c) shows relatively weak surface scattering power compared to the same landslide No. 1 in the descending image (Figure 6a). It is assumed that the condition of the landslide did not vary significantly because the acquisition interval of the descending and ascending data is only one day. Therefore, this apparent difference implies that the decomposition scattering powers can change due to the observation angles. For the sake of comparison of the scattering powers, we introduce the normalized scattering power px defined as follows:
p x = P x P s + P d + P v + P c = P x T o t a l   P o w e r
where subscript x is substituted for s for the surface scattering power and is substituted for v for the volume scattering power, respectively. The values of the mean and the standard deviation of the normalized surface scattering power ps and the normalized volume scattering power pv contribution to the total power sampled in white rectangles in Figure 6 are summarized in Table 2 and Table 3, respectively. It is found from Table 2 that the mean values of ps in landslides ranged from 0.3 to 0.7, although the mean values of ps in forest were much smaller than those in landslides. It is also found that pv values in forest were almost stable in spite of the change of observation geometries, although the pv values in landslides ranged from 0.24 to 0.47. These facts can be summarized as follows; the ps and the pv in landslides can change in connection with the change of the observation geometries, while those in forest do not.
Figure 6. Scattering power decomposition results for PALSAR-2 data in (a,b) descending and (c,d) ascending orbit observations. Landslide No. 1 (a,c) is on the slope facing toward the radar as contrasted to landslide No. 2 (b,d), which is on the slope facing away from the radar. The values of Ps for landslides (L) and those of neighboring forest (F) were sampled in the white rectangles on the images.
Remotesensing 07 15424 g006
Table 2. Statistics of the normalized surface scattering power ps in landslides and those of neighboring forest.
PolSAR DataLandslide No. 1Landslide No. 2Forest Adjacent to Landslide No. 1Forest Adjacent to Landslide No. 2
Mean (SD)Mean (SD)Mean (SD)Mean (SD)
PALSAR-2, Descending0.70(0.16)0.32(0.18)0.18(0.17)0.12(0.13)
PALSAR-2, Ascending0.51(0.23)0.35(0.19)0.20(0.13)0.11(0.11)
Table 3. Statistics of the normalized volume scattering power pv in landslides and those of neighboring forest.
PolSAR DataLandslide No. 1Landslide No. 2Forest Adjacent to Landslide No. 1Forest Adjacent to Landslide No. 2
Mean (SD)Mean (SD)Mean (SD)Mean (SD)
PALSAR-2, Descending0.24(0.14)0.47(0.18)0.66(0.19)0.70(0.17)
PALSAR-2, Ascending0.39(0.19)0.46(0.20)0.63(0.15)0.71(0.15)

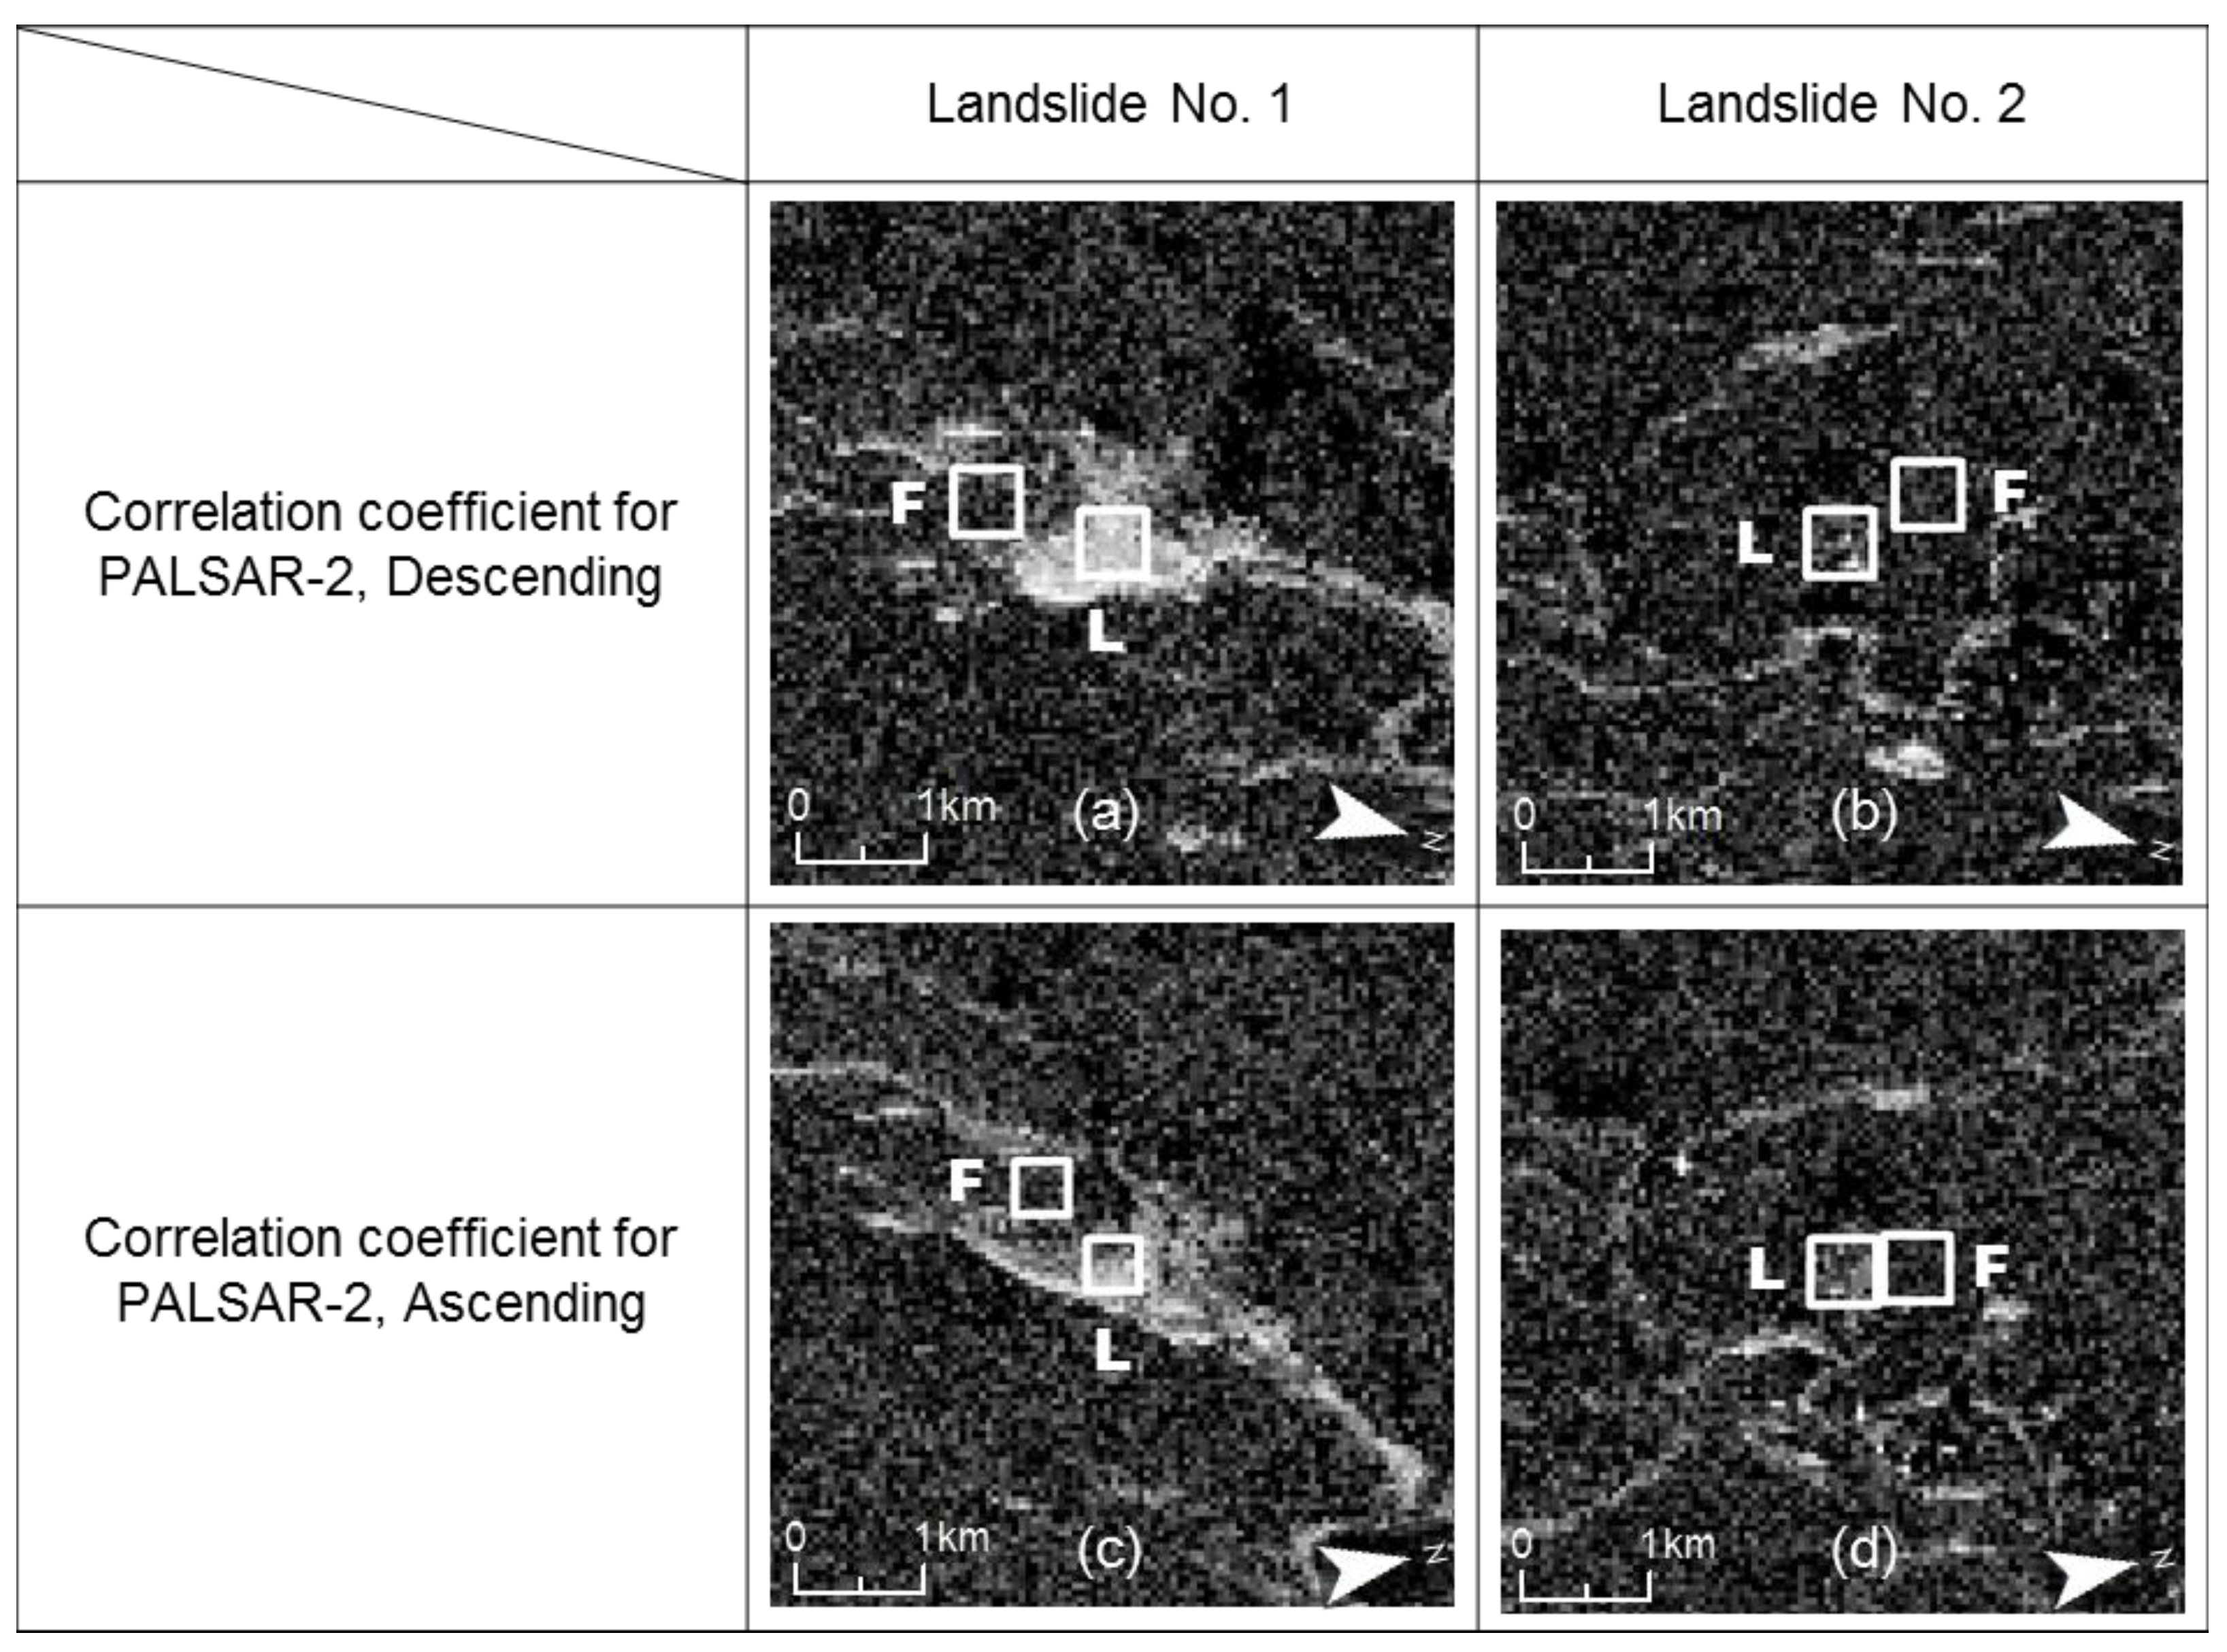
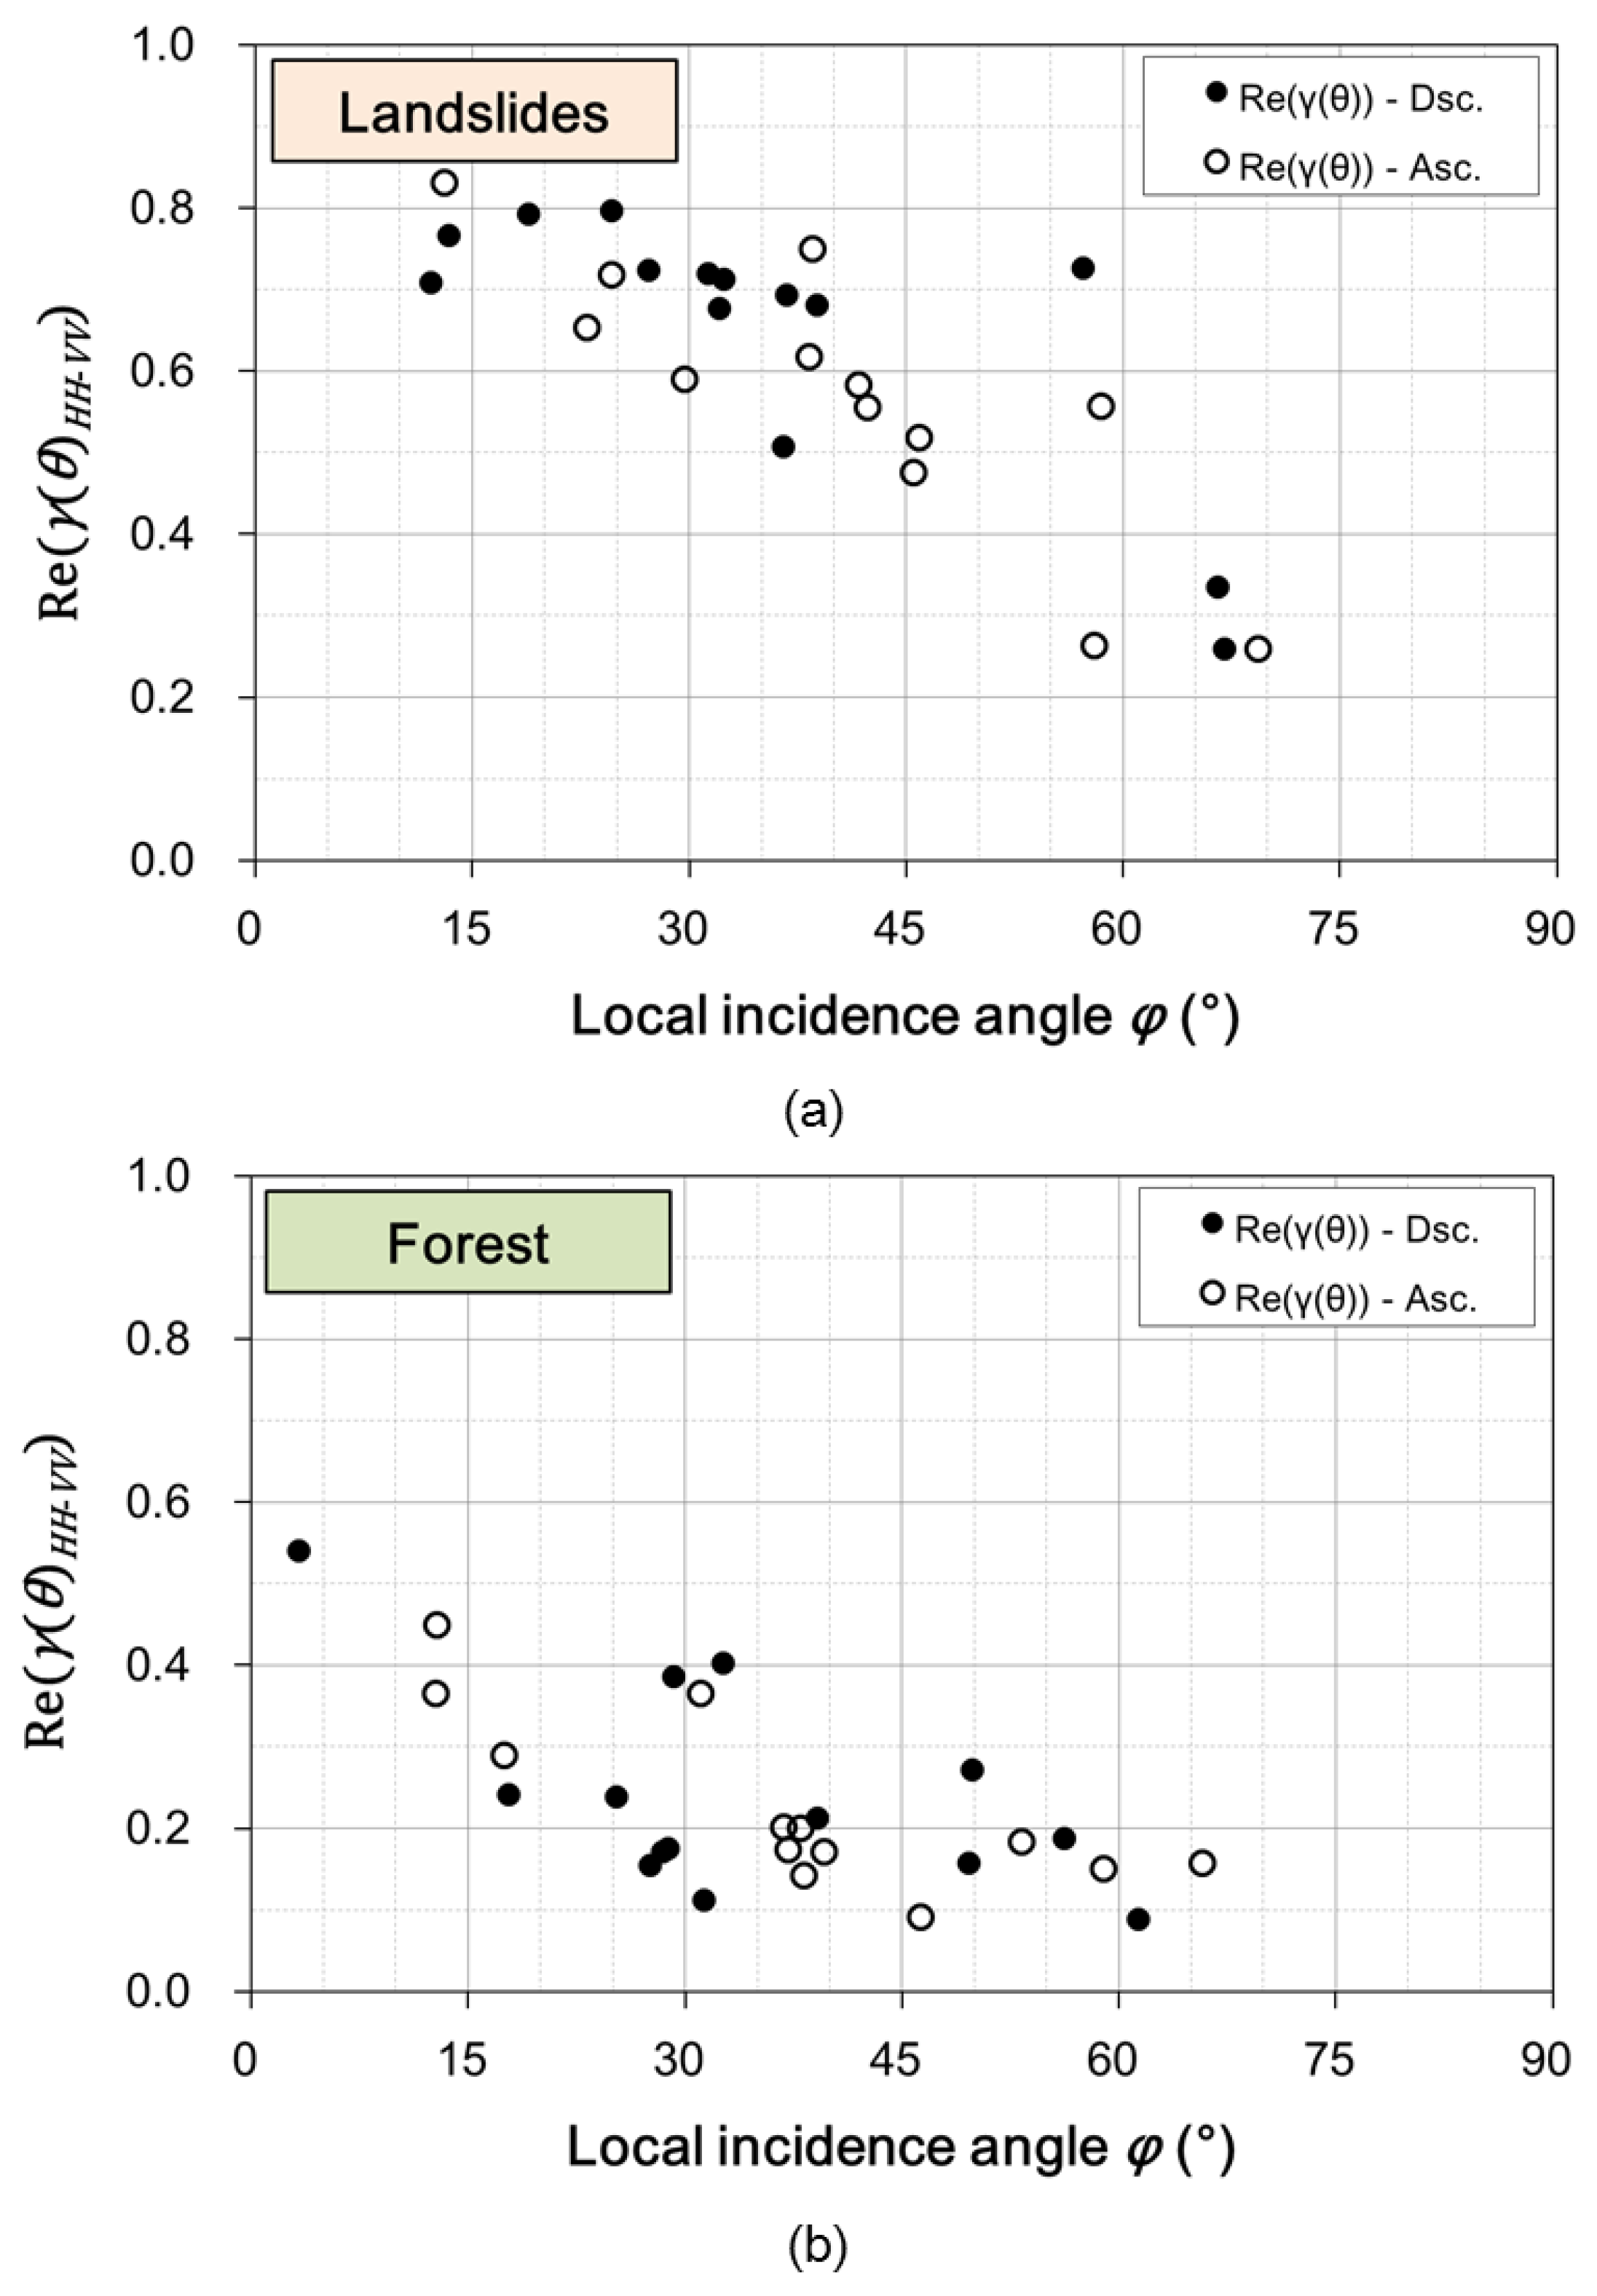
3.1.2. Correlation Coefficient of HH and VV Polarizations

The HH-VV correlation coefficient images of two landslides for PALSAR-2 data are expressed in Figure 6, and the statistics are also summarized in Table 4. From Figure 7 and Table 3, we can see that Re(γ(θ)HH-VV) behaved in a similar manner to the ps, as has been previously described. The values of Re(γ(θ)HH-VV) in landslides depend on the observation geometries, while those in forest are stable.
Table 4. Statistics of Re(γ(θ)HH-VV) in landslides and those of neighboring forest.
PolSAR DataLandslide No. 1Landslide No. 2Forest Adjacent to Landslide No. 1Forest Adjacent to Landslide No. 2
Mean (SD)Mean (SD)Mean (SD)Mean (SD)
PALSAR-2, Descending0.74 (0.14)0.28 (0.21)0.24 (0.18)0.16 (0.14)
PALSAR-2, Ascending0.55 (0.25)0.31 (0.21)0.25 (0.14)0.15 (0.14)
Figure 7. The HH-VV correlation coefficient Re(γ(θ)HH-VV) images for PALSAR-2 data in (a,b) descending and (c,d) ascending orbit observations. The correlation coefficient values for landslides (L) and those of neighboring forest (F) were sampled in the white rectangles on the images.
Remotesensing 07 15424 g007

3.1.3. Dependence on Local Incidence Angle

It is inferred by the comparison between the polarimetric analysis results for descending and ascending images of PALSAR-2 that ps, pv and Re(γ(θ)HH-VV) in landslides vary in connection with the directions of observations or sloping surfaces. In a further step, we introduce the local incidence angle displayed in Figure 8. The local incidence angle is the angle between the radar line-of-sight (LOS) I and the normal vector to the slope surface N. The vector I can be obtained by the azimuth and range directions and the off-nadir angle of the radar; and the vector N can be calculated from a digital elevation model (DEM). The DEM utilized in this study is the spatial information infrastructure data distributed by the Geospatial Information Authority of Japan (GSI) [22], and the spatial resolution is approximately 10 meters. The local incidence angle φ can be derived from:
cos φ = N · I | N | | I |
Figure 8. Schematic diagram of the radar observation geometry to relate the local incidence angle φ to the ground surface. The angle φ can be derived by the inner product of radar incidence direction N and ground surface normal I vectors.
Remotesensing 07 15424 g008
Figure 9 shows scatter plot graphs of the ps and the pv with respect to the local incidence angle for 22 landslides and forested areas in the vicinity in the study area. The values of the ps and the pv were retrieved from the power decomposition results of both descending (Dsc.) and ascending (Asc.) PALSAR data. It is observed that the ps decreases with the local incidence angle. For example, the ps values at the incidence angle of around 15° are 0.7, but the values become 0.6 at the angle of around 30°. Furthermore, where the incidence angle is over 60°, the values of the ps decrease to 0.3. In contrast, the pv shows the opposite trend to the ps. For forested areas, both the ps and the pv have shown almost a flat behavior. The values of the ps are lower than 0.2, while the values of the pv are higher than 0.6 ( p s 0.2   and   p v 0.6 ), except for a smaller incidence angle.
The relationship between the HH-VV correlation coefficient and the local incidence angle is shown in Figure 10. The HH-VV correlation coefficient Re(γ(θ)HH-VV) shows almost the same tendency as seen in the ps case. This is not surprising, since Re(γ(θ)HH-VV) in this study is an index that correlates to the surface scattering process.
Figure 9. Normalized powers of the surface and the volume scattering components’ (ps and pv) contribution to the total power with respect to the local incidence angle in (a) landslides and (b) forested areas for PALSAR-2 data acquired with ALOS-2 from its descending and ascending orbits.
Remotesensing 07 15424 g009
Figure 10. The HH-VV correlation coefficient with respect to the local incidence angle in (a) landslides and (b) forested areas for PALSAR-2 data acquired with ALOS-2 from its descending and ascending orbits.
Remotesensing 07 15424 g010

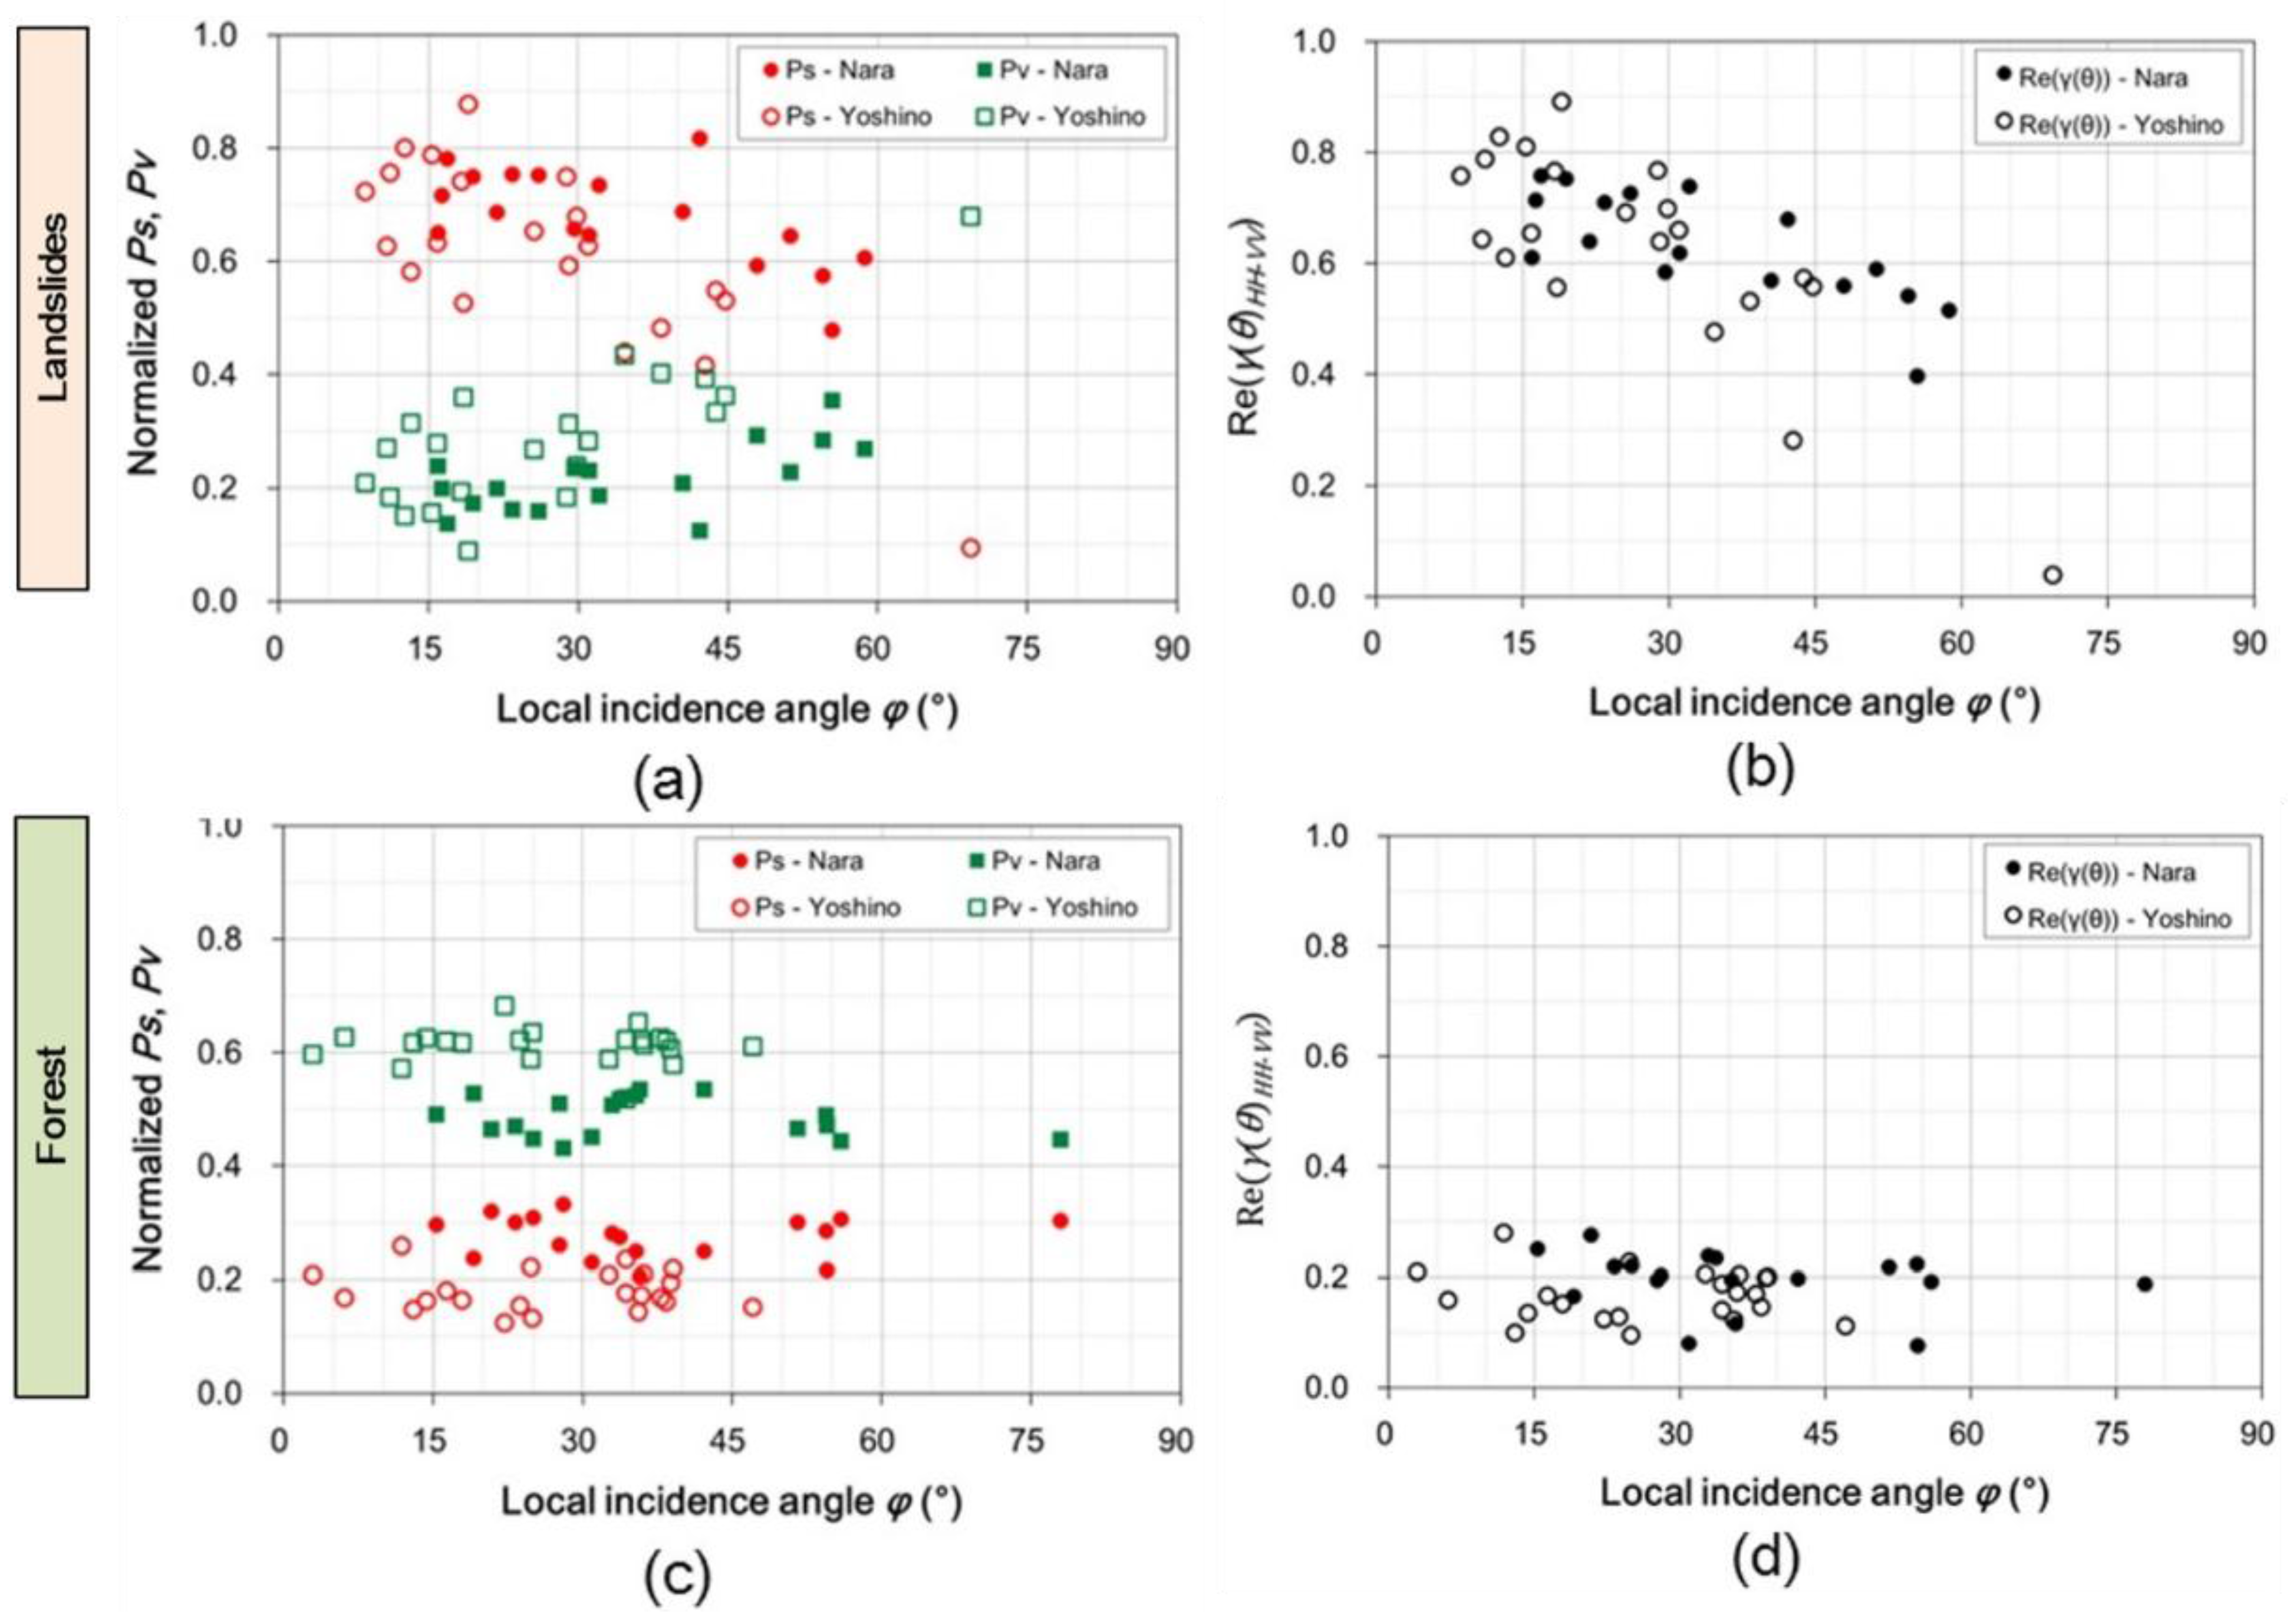
3.2. Results for Pi-SAR-L2 Data Analysis

For verification of the above results obtained from PALSAR-2 data analysis, the relationship between polarimetric indices (ps, pv and Re(γ(θ)HH-VV)) were also examined with the PolSAR data acquired by the airborne SAR system, Pi-SAR-L2. The spatial resolution of Pi-SAR-L2 is finer than that of PALSAR-2, as shown in Table 2. The results are shown in Figure 11.
It is observed that the ps and the Re(γ(θ)HH-VV) decrease from 0.8, while the pv values gradually increase with the local incidence angle for landslides. In contrast, all of the indices for forested areas are basically stable regardless of the incidence angle. It is also confirmed from Figure 11c,d that the Re(γ(θ)HH-VV) and the ps are around 0.2 ( R e ( γ ( θ ) H H V V ) 0.2   and   p s 0.2 ), and the values of the pv mainly range between 0.4 and 0.7 ( 0.4 ≤ pv ≤ 0.7) for the forested areas. As a result, the polarimetric indices derived from Pi-SAR-L2 data behave quite similar to those from PALSAR-2 data. It is confirmed by this fact that ps, pv and Re(γ(θ)HH-VV) derived from L-band PolSAR data can change with the incidence angle in landslide areas, whereas those indices do not in forested areas regardless of the spatial resolution.
Figure 11. (a) Normalized powers of the surface and the volume scattering components’ (ps and pv) contribution to the total power and (b) the correlation coefficient of HH and VV polarizations (Re(γ(θ)HH-VV)) with respect to the local incidence angle in landslides; (c) the ps and the pv contributions; and (d) the HH-VV correlation coefficient in forested areas for the Pi-SAR-L2 datasets named “Nara” and “Yoshino”.
Remotesensing 07 15424 g011

4. Discussions

An ultimate goal of our research is to develop an accurate algorithm for landslide detection with PolSAR data. As a preliminary step toward the goal, we conducted an investigation on the behavior of polarimetric indices of landslides and forest utilizing PolSAR data acquired from different observation geometries.

4.1. Polarimetric Scattering Properties of Landslides

Based on the polarimetric analysis results described in this paper, the power of the surface scattering Ps is basically larger than that of the volume scattering Pv for landslides on the slopes with smaller incidence angles (up to 30°). The HH-VV correlation coefficient Re(γ(θ)HH-VV) for landslides shows a relatively high value (( R e ( γ ( θ ) H H V V ) 0.6   ). Consequently, landslides can be distinguished from forest by applying these polarimetric properties properly to PolSAR data as far as the landslide occurred on the slope facing toward the radar. While on the other hand, where incidence angle increase from 30° to 45°, this means that the slope is turning away from the radar, and then, the difference between Ps and Pv gradually decreases, while the correlation coefficient also decreases. The effect of observation geometry on polarimetric indices has been suggested by existing research [23,24]; it was quantified based on the analyses of PolSAR data acquired from different observation directions and platforms in this study.

4.2. Multiple Threshold Settings for Better Landslide Detection

The ranges of the normalized scattering power ps in landslides and the thresholds for landslide detection with the polarimetric scattering power decomposition method have been discussed in the literature [2,3,4,5]. The range of the ps and the threshold values are summarized in Table 5 ([2,3,4,5]) with our results for the sake of comparison. In Cases 1, 2a and 4 and in this paper, the four-component scattering power decomposition was applied, and the three-component power decomposition was employed in other cases, so that the values of each case are incomparable in the strict sense. However, for most of the cases, the value of the ps widely range from 20% to 50%, and this fact indicates the difficulty in defining a single threshold of the ps to be applied to the whole PolSAR image. Hence, we propose to apply multiple thresholds based on the local incidence angle for a more accurate landslide detection result.
Table 5. The ranges of the ps value in landslides and the proposed thresholds for landslide detection.
Study CaseRangeThreshold
Case 1 [4]N/Aps > 0.6
Case 2a [2]0.349 to 0.463ps > 0.1, with pv < 0.65 and pd < 0.1
Case 2b [2]0.381 to 0.485N/A
Case 3 [3]0.165 to 0.246N/A
Case 4 [5]N/A (0.4 to 0.7)N/A
Present case0.09 to 0.88(1) at LIA < 30° ps > 0.6 and ps > pv
(2) at 30° < LIA < 60° ps > 0.4 and ps > pv
(3) at 60° < LIA Not detectable (ps < pv)
LIA: Local incidence angle.
It should be pointed out that where the incidence angle become 60° or larger, Pv exceeds Ps, and the correlation coefficient becomes around 0.2. Since the correlation coefficient of forest is also around 0.2 and that is independent of the incidence angle, it is difficult to distinguish landslides from forest by the relationship between Ps and Pv or the value of Re(γ(θ)HH-VV). Therefore, in order to detect a landslide that occurred on the slope facing away from the radar, it should be effective to observe from different directions with polarimetric SAR or to combine other remote sensing techniques (aerial photographs, optical satellite imagery, LiDAR, etc.) with SAR observations. The proposed methodology is applicable to detect landslides in a densely-vegetated environment.

5. Conclusions

In this paper, polarimetric scattering properties of landslides in forested areas have been analyzed by the scattering power decomposition method and the polarimetric correlation coefficient utilizing both space-borne and airborne L-band fully-polarimetric SAR (PolSAR) data. It is confirmed that the surface scattering power Ps and the volume scattering Pv are effectual indices for landslide recognition from PolSAR data. The availability of the real part of the HH-VV polarization correlation coefficient with orientation angle compensation Re(γ(θ)HH-VV) was also examined.
The dependence on the local incidence angle for the normalized scattering powers ps and pv and the HH-VV correlation coefficient Re(γ(θ)HH-VV) has been also analyzed. We found that in landslide areas, polarimetric indices ps, pv and Re(γ(θ)HH-VV) change drastically with the local incidence angle, whereas in forested areas, those indices are stable regardless of the local incidence angle change. Hence, it is important to set up multiple thresholds based on the local incidence angle to improve the accuracy of landslide detection in forested mountainous areas.
The polarimetric characteristics of landslides confirmed in this study will serve to improve the accuracy of landslide detection utilizing PolSAR data of practical use, and this will lead to establishing a method of the effective detection of a landslide area. Since the scattering powers of model-based scattering power decomposition and the HH-VV correlation coefficient can be obtained by simple calculations, these analysis methods are useful even if in emergency situations.

Acknowledgments

The authors would like to thank the Japan Aerospace Exploration Agency (JAXA) for providing ALOS-2/PALSAR-2 and Pi-SAR-L2 fully-polarimetric SAR datasets under the agreement of the JAXA Research Announcement. The digital elevation model was derived from the spatial information infrastructure data distributed by Geospatial Information Authority of Japan (GSI).

Author Contributions

Takashi Shibayama processed PolSAR data and interpreted the results, and wrote the original manuscript; Yoshio Yamaguchi supervised the research and wrote the manuscript; Hiroyoshi Yamada reviewed and edited the manuscript. All authors have read and approved the final manuscript.

Conflicts of Interest

The authors declare no conflict of interest.

References

  1. Scaioni, M.; Longoni, L.; Melillo, V.; Papini, M. Remote sensing for landslide investigations: An overview of recent achievements and perspectives. Remote Sens. 2014, 6, 1–53. [Google Scholar] [CrossRef]
  2. Watanabe, M.; Yonezawa, C.; Iisaka, J.; Sato, M. ALOS/PALSAR full polarimetric observations of the Iwate-Miyagi Nairiku earthquake of 2008. Int. J. Remote Sens. 2012, 33, 1234–1245. [Google Scholar] [CrossRef]
  3. Yonezawa, C.; Watanabe, M.; Saito, G. Polarimetric decomposition analysis of ALOS-PALSAR observation data before and after a landslide event. Remote Sens. 2012, 4, 2314–2328. [Google Scholar] [CrossRef]
  4. Yamaguchi, Y.; Yajima, Y.; Yamada, H.; Uratsuka, S.; Umehara, T.; Moriyama, T. X- and L-band Pi-SAR observations to Chuetsu Earthquake region, Japan. In Proceedings of 6th European Conference on Synthetic Aperture Radar (EUSAR), Dresden, Germany, 16–18 May 2006.
  5. Shibayama, T.; Yamaguchi, Y. A landslide detection based on the change of scattering power components between multi-temporal POLSAR data. In Proceedings of 2014 IEEE International Conference on Geoscience and Remote Sensing Symposium, Quebec, QC, Canada, 13–18 July 2014.
  6. Shimada, M.; Watanabe, M.; Kawano, N.; Ohki, M.; Motooka, T. Detecting mountainous landslides by SAR polarimetry: A comparative study using Pi-SAR-L2 and X-band SARs. Trans. JSASS Aerosp. Tech. Japan 2014, 12, 9–15. [Google Scholar] [CrossRef]
  7. Mattia, F.; Toan, T. L.; Souyris, J.-C.; De Carolis, G.; Floury, N.; Posa, F.; Pasquariello, G. The effect of surface roughness on multifrequency polarimetric SAR data. IEEE Trans. Geosci. Remote Sens. 1997, 35, 954–966. [Google Scholar] [CrossRef]
  8. Mott, H. Remote Sensing with Polarimetric. Radar; Wiley-IEEE Press: New York, NY, USA, 2007; p. 62. [Google Scholar]
  9. Yamaguchi, Y. Radar Polarimetry from Basics to Applications; IEICE Japan: Tokyo, Japan, 2007; p. 56. [Google Scholar]
  10. Lee, J.-S.; Pottier, E. Polarimetric Radar Imaging from Basics to Applications; CRC Press: Boca Raton, FL, USA, 2009; p. 60. [Google Scholar]
  11. van Zyl, J.J.; Kim, Y.-J. Synthetic Aperture Radar Polarimetry; Wiley: New York, NY, USA, 2011; p. 28. [Google Scholar]
  12. Yamaguchi, Y. Disaster monitoring by fully polarimetric SAR data acquired with ALOS-PALSAR. Proc. IEEE 2012, 100, 2851–2860. [Google Scholar] [CrossRef]
  13. van Zyl, J.J. Unsupervised classification of scattering behavior using radar polarimetry data. IEEE Trans. Geosci. Remote Sens. 1989, 27, 36–44. [Google Scholar] [CrossRef]
  14. Yamaguchi, Y.; Moriyama, T.; Ishido, M.; Yamada, H. Four-component scattering model for polarimetric SAR image decomposition. IEEE Trans. Geosci. Remote Sens. 2005, 43, 1699–1706. [Google Scholar] [CrossRef]
  15. Lee, J.-S.; Schuler, D.L.; Ainsworth, T.L. Polarimetric SAR data compensation for terrain azimuth slope variation. IEEE Trans. Geosci. Remote Sens. 2000, 38, 2153–2163. [Google Scholar] [CrossRef]
  16. Lee, J.-S.; Schuler, D.L.; Ainsworth, T.L.; Kroggager, E.; Kasilingam, D.; Boerner, W.-M. On the estimation of radar polarization orientation shifts induced by terrain slope. IEEE Trans. Geosci. Remote Sens. 2002, 40, 30–40. [Google Scholar] [CrossRef]
  17. Freeman, A.; Durden, S.L. A three-component scattering model for polarimetric SAR data. IEEE Trans. Geosci. Remote Sens. 1998, 36, 963–973. [Google Scholar] [CrossRef]
  18. Yamaguchi, Y.; Sato, A.; Boerner, W.-M.; Sato, R.; Yamada, H. Four-component scattering power decomposition with rotation of coherency matrix. IEEE Trans. Geosci. Remote Sens. 2011, 49, 2251–2258. [Google Scholar] [CrossRef]
  19. Chigira, M.; Tsou, C.-Y.; Matsushi, Y.; Hiraishi, N.; Matsuzawa, M. Topographic precursors and geological structures of deep-seated catastrophic landslides caused by Typhoon Talas. Geomorphology 2013, 201, 479–493. [Google Scholar] [CrossRef]
  20. Suzuki, S.; Kankaku, Y.; Shimada, M. ALOS-2 acquisition strategy. In Proceedings of 2013 IEEE International Conference on Geoscience and Remote Sensing Symposium, Melbourne, Australia, 21–26 July 2013.
  21. Shimada, M.; Kawano, N.; Watanabe, M.; Motooka, T.; Ohki, M. Calibration and validation of the Pi-SAR-L2. In Proceedings of 2013 Asia-Pacific Conference on Synthetic Aperture Radar, Tsukuba, Japan, 23–27 September 2013.
  22. Geospatial Information Authority of Japan. Available online: http://www.gsi.go.jp/kiban/index.html (accessed on 28 October 2015).
  23. Park, S.-E. The effect of topography on target decomposition of polarimetric SAR data. Remote Sens. 2015, 7, 4997–5011. [Google Scholar] [CrossRef]
  24. Park, S.-E.; Moon, W.M.; Pottier, E. Assessment of scattering mechanism of polarimetric SAR signal from mountainous forest areas. IEEE Trans. Geosci. Remote Sens. 2012, 50, 4711–4719. [Google Scholar] [CrossRef]

