
Evaluation of Satellite and Reanalysis Soil Moisture Products over Southwest China Using Ground-Based Measurements


Abstract
:
1. Introduction

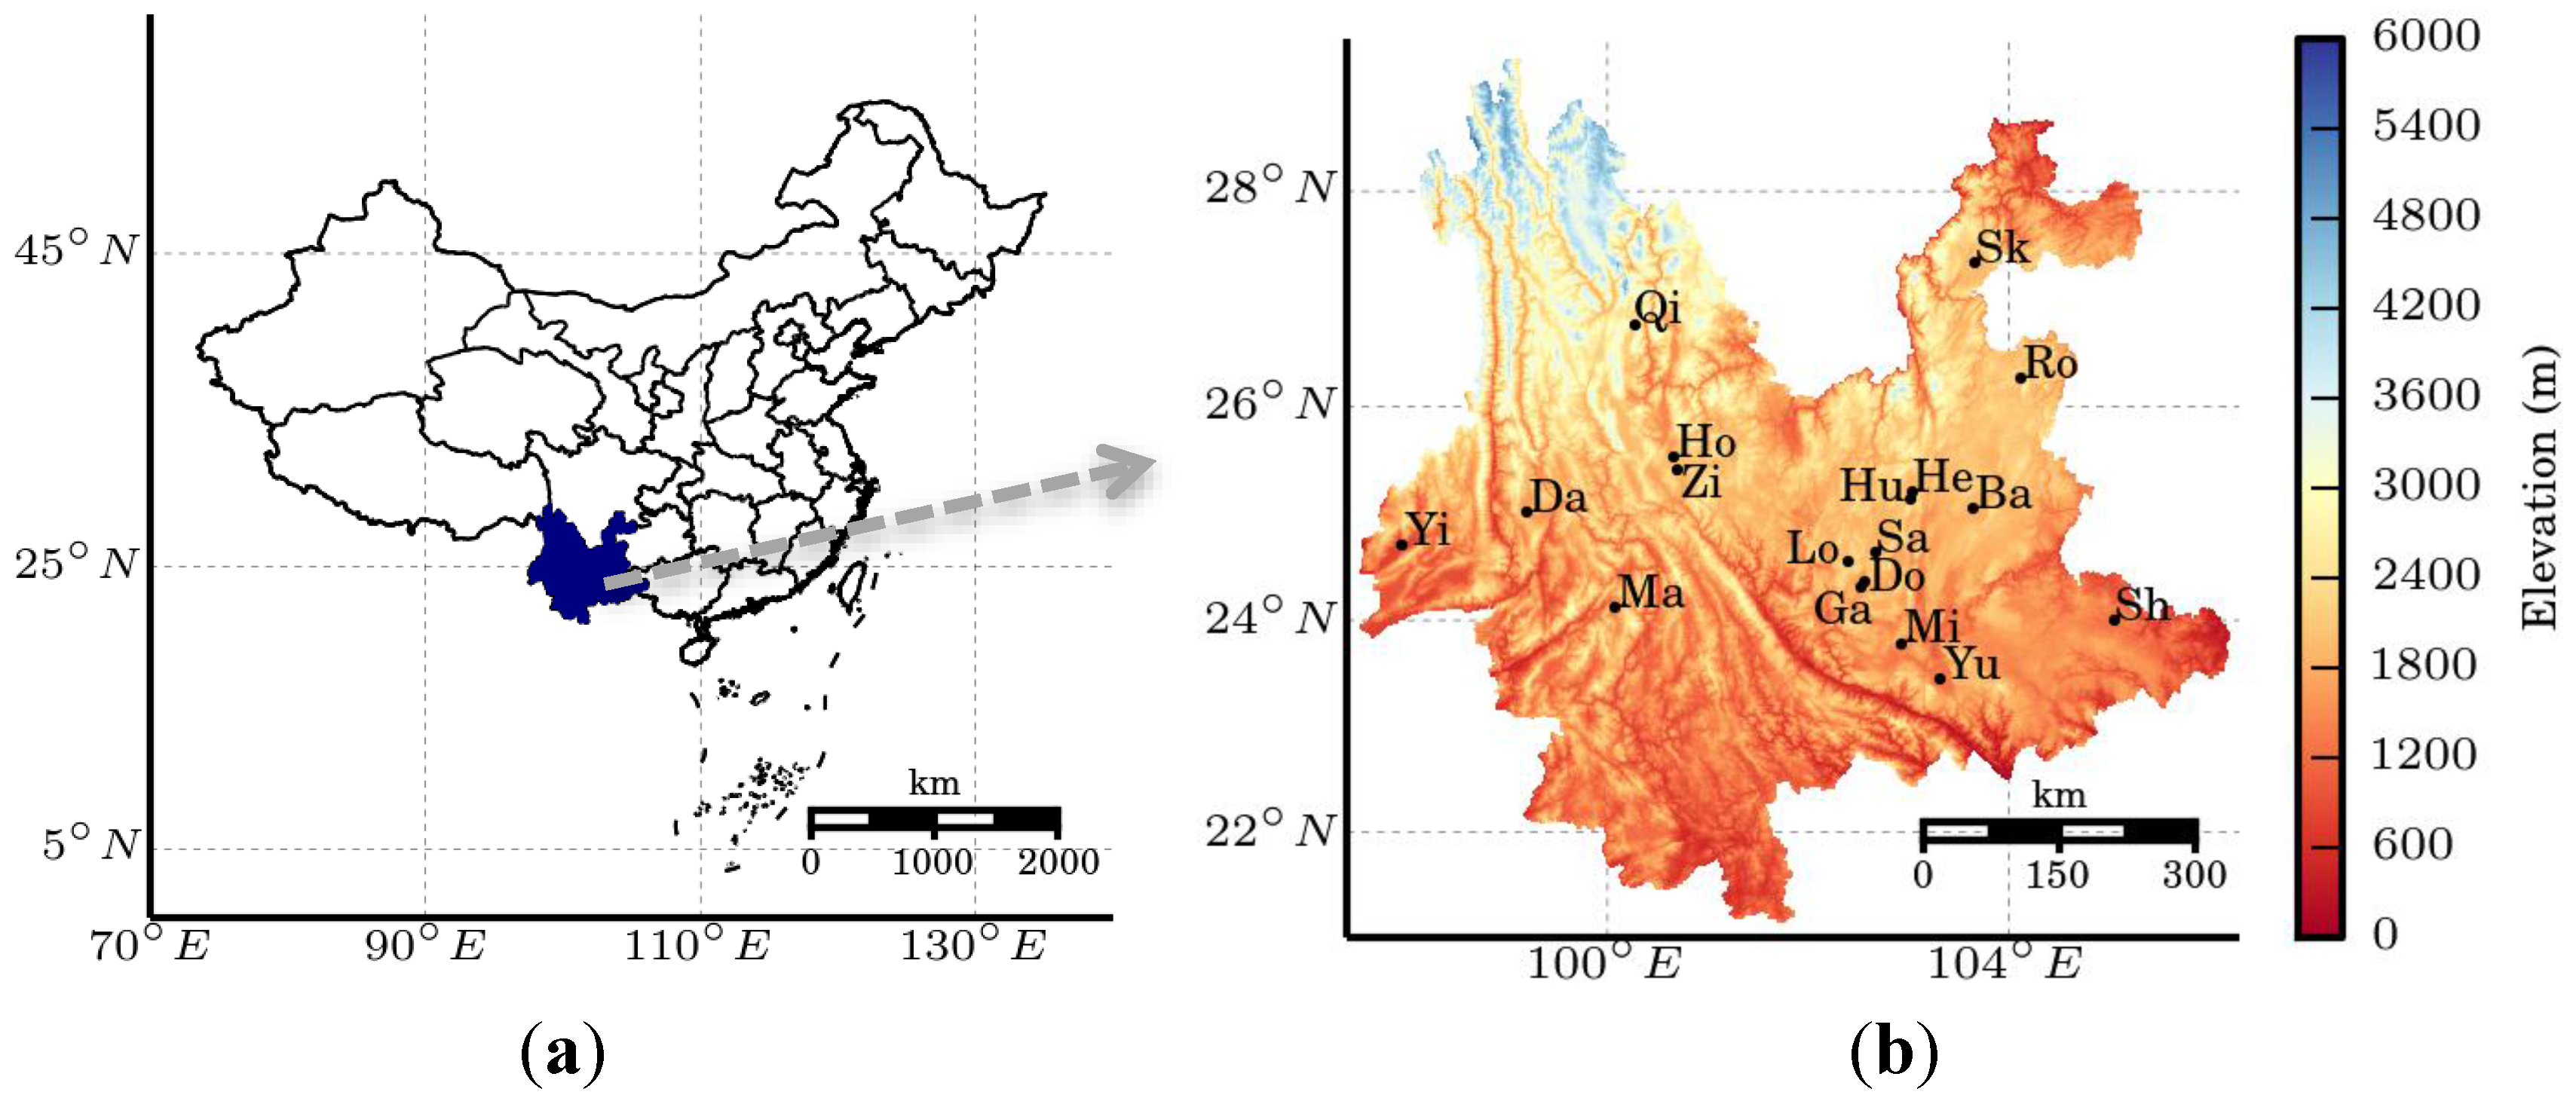
2. Study Area
3. Materials and Methods
3.1. Satellite-Based and Reanalysis Products
3.1.1. AMSR-E
3.1.2. ASCAT
3.1.3. ESA CCI
3.1.4. SMOS
3.1.5. ERA-Interim
3.1.6. TRMM Precipitation Data
3.2. In Situ Soil Moisture Measurements

| Station Name | Short Name | Land Use | Latitude (°) | Longitude (°) | Elevation (m) |
|---|---|---|---|---|---|
| Daciping | Da | Cropland | 25.02 | 99.20 | 1685 |
| Zijin | Zi | Bare soil | 25.42 | 100.70 | 1958 |
| Hongqi | Ho | Grassland | 25.53 | 100.67 | 2044 |
| Yingjiang | Yi | Bare soil | 24.70 | 97.95 | 847 |
| Yuguopu | Yu | Cropland | 23.45 | 103.32 | 1283 |
| Mianyangchong | Mi | Forest | 23.78 | 102.93 | 1433 |
| Sanduo | Sa | Grassland | 24.64 | 102.67 | 1967 |
| Longwangtang | Lo | Forest | 24.55 | 102.40 | 2099 |
| Heyou | He | Cropland | 25.20 | 103.03 | 1968 |
| Huangjiapo | Hu | Grassland | 25.13 | 103.02 | 2140 |
| Qiaotou | Qi | Cropland | 26.77 | 100.27 | 2293 |
| Mayidui | Ma | Cropland | 24.12 | 100.07 | 1344 |
| Bamaochong | Ba | Grassland | 25.05 | 103.63 | 1857 |
| Rongfeng | Ro | Bare soil | 26.26 | 104.11 | 1973 |
| Shaba | Sh | Forest | 24.00 | 105.05 | 1415 |
| Dongfeng | Do | Bare soil | 24.37 | 102.57 | 1653 |
| Gaocang | Ga | Cropland | 24.32 | 102.52 | 1650 |
| Sankeshu | Sk | Cropland | 27.33 | 103.67 | 1909 |
3.3. Evaluation Strategies
4. Results and Discussion
4.1. Direct Comparison of Soil Moisture
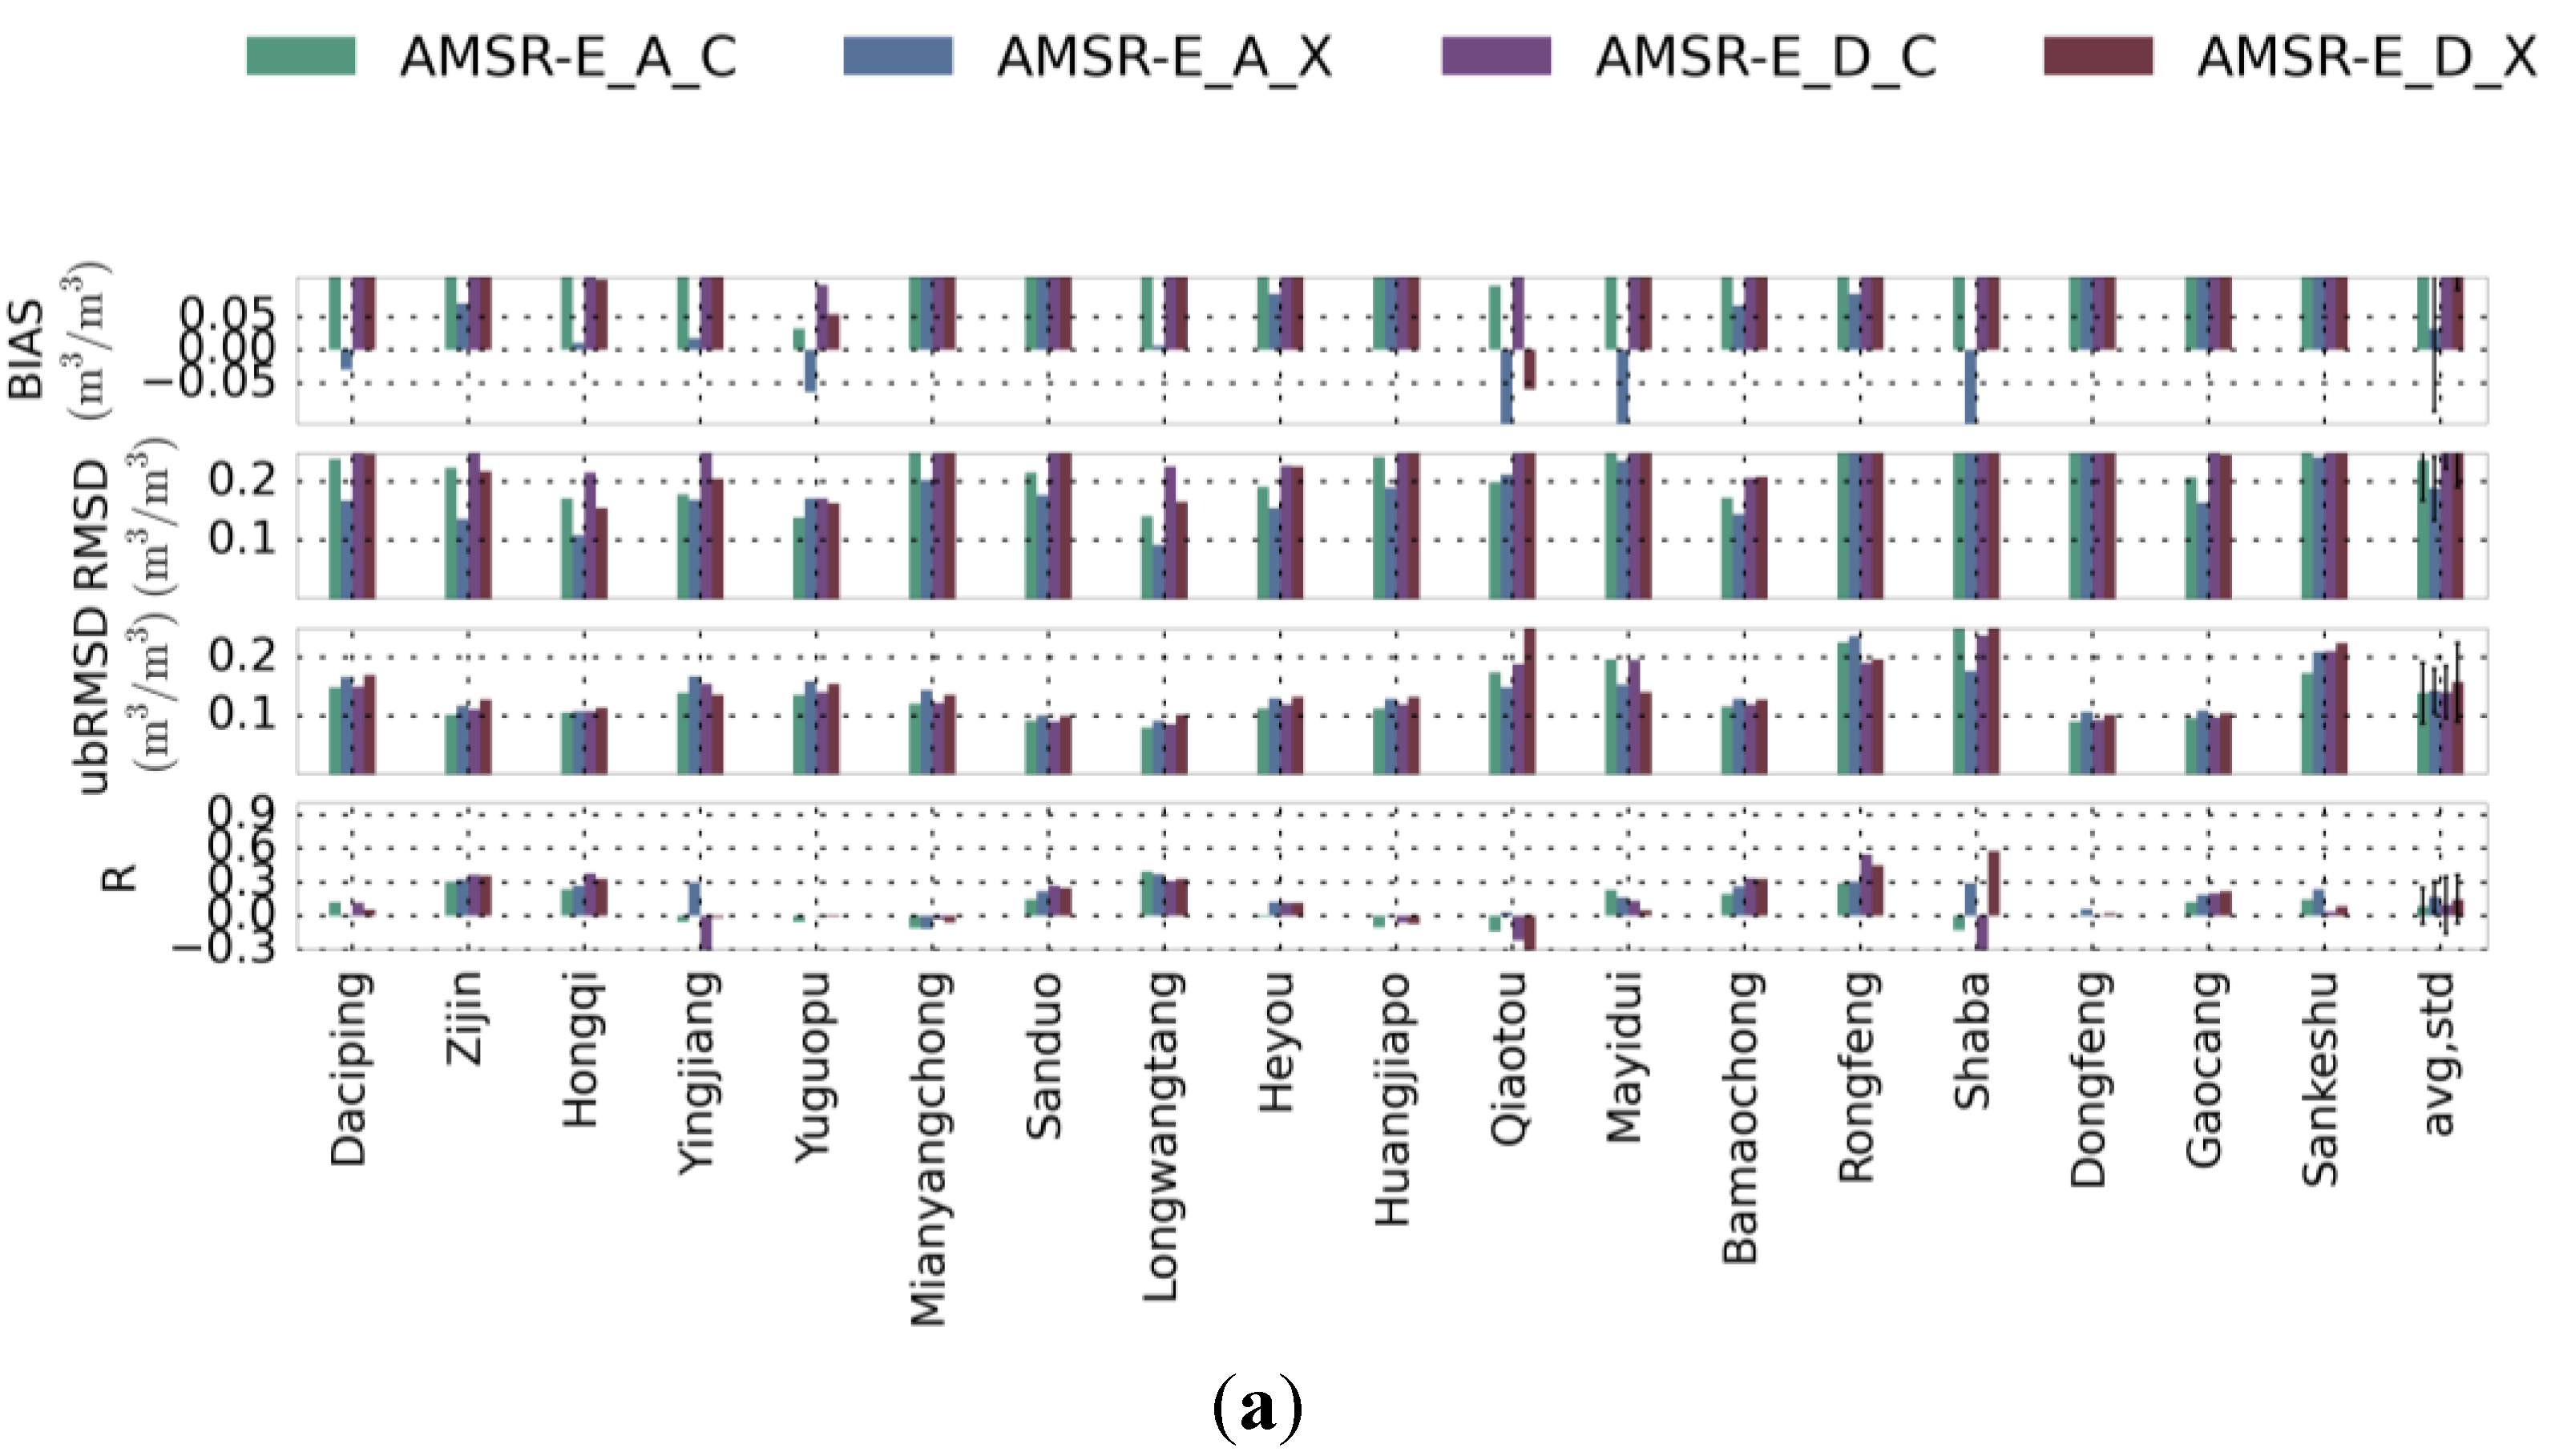
4.1.1. Pre-Selection of Best Performed AMRS-E, ASCAT, and SMOS
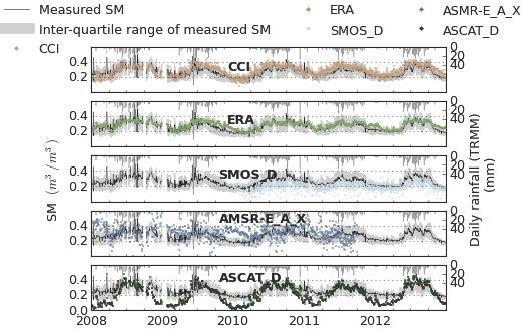
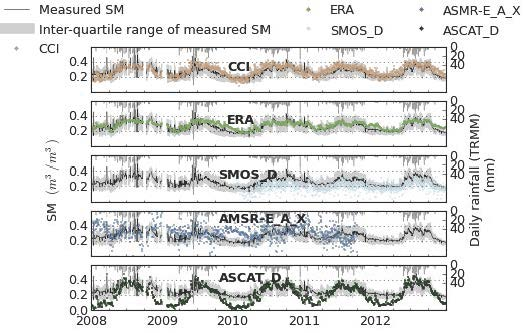
4.1.2. Temporal Evolution of Soil Moisture and Precipitation

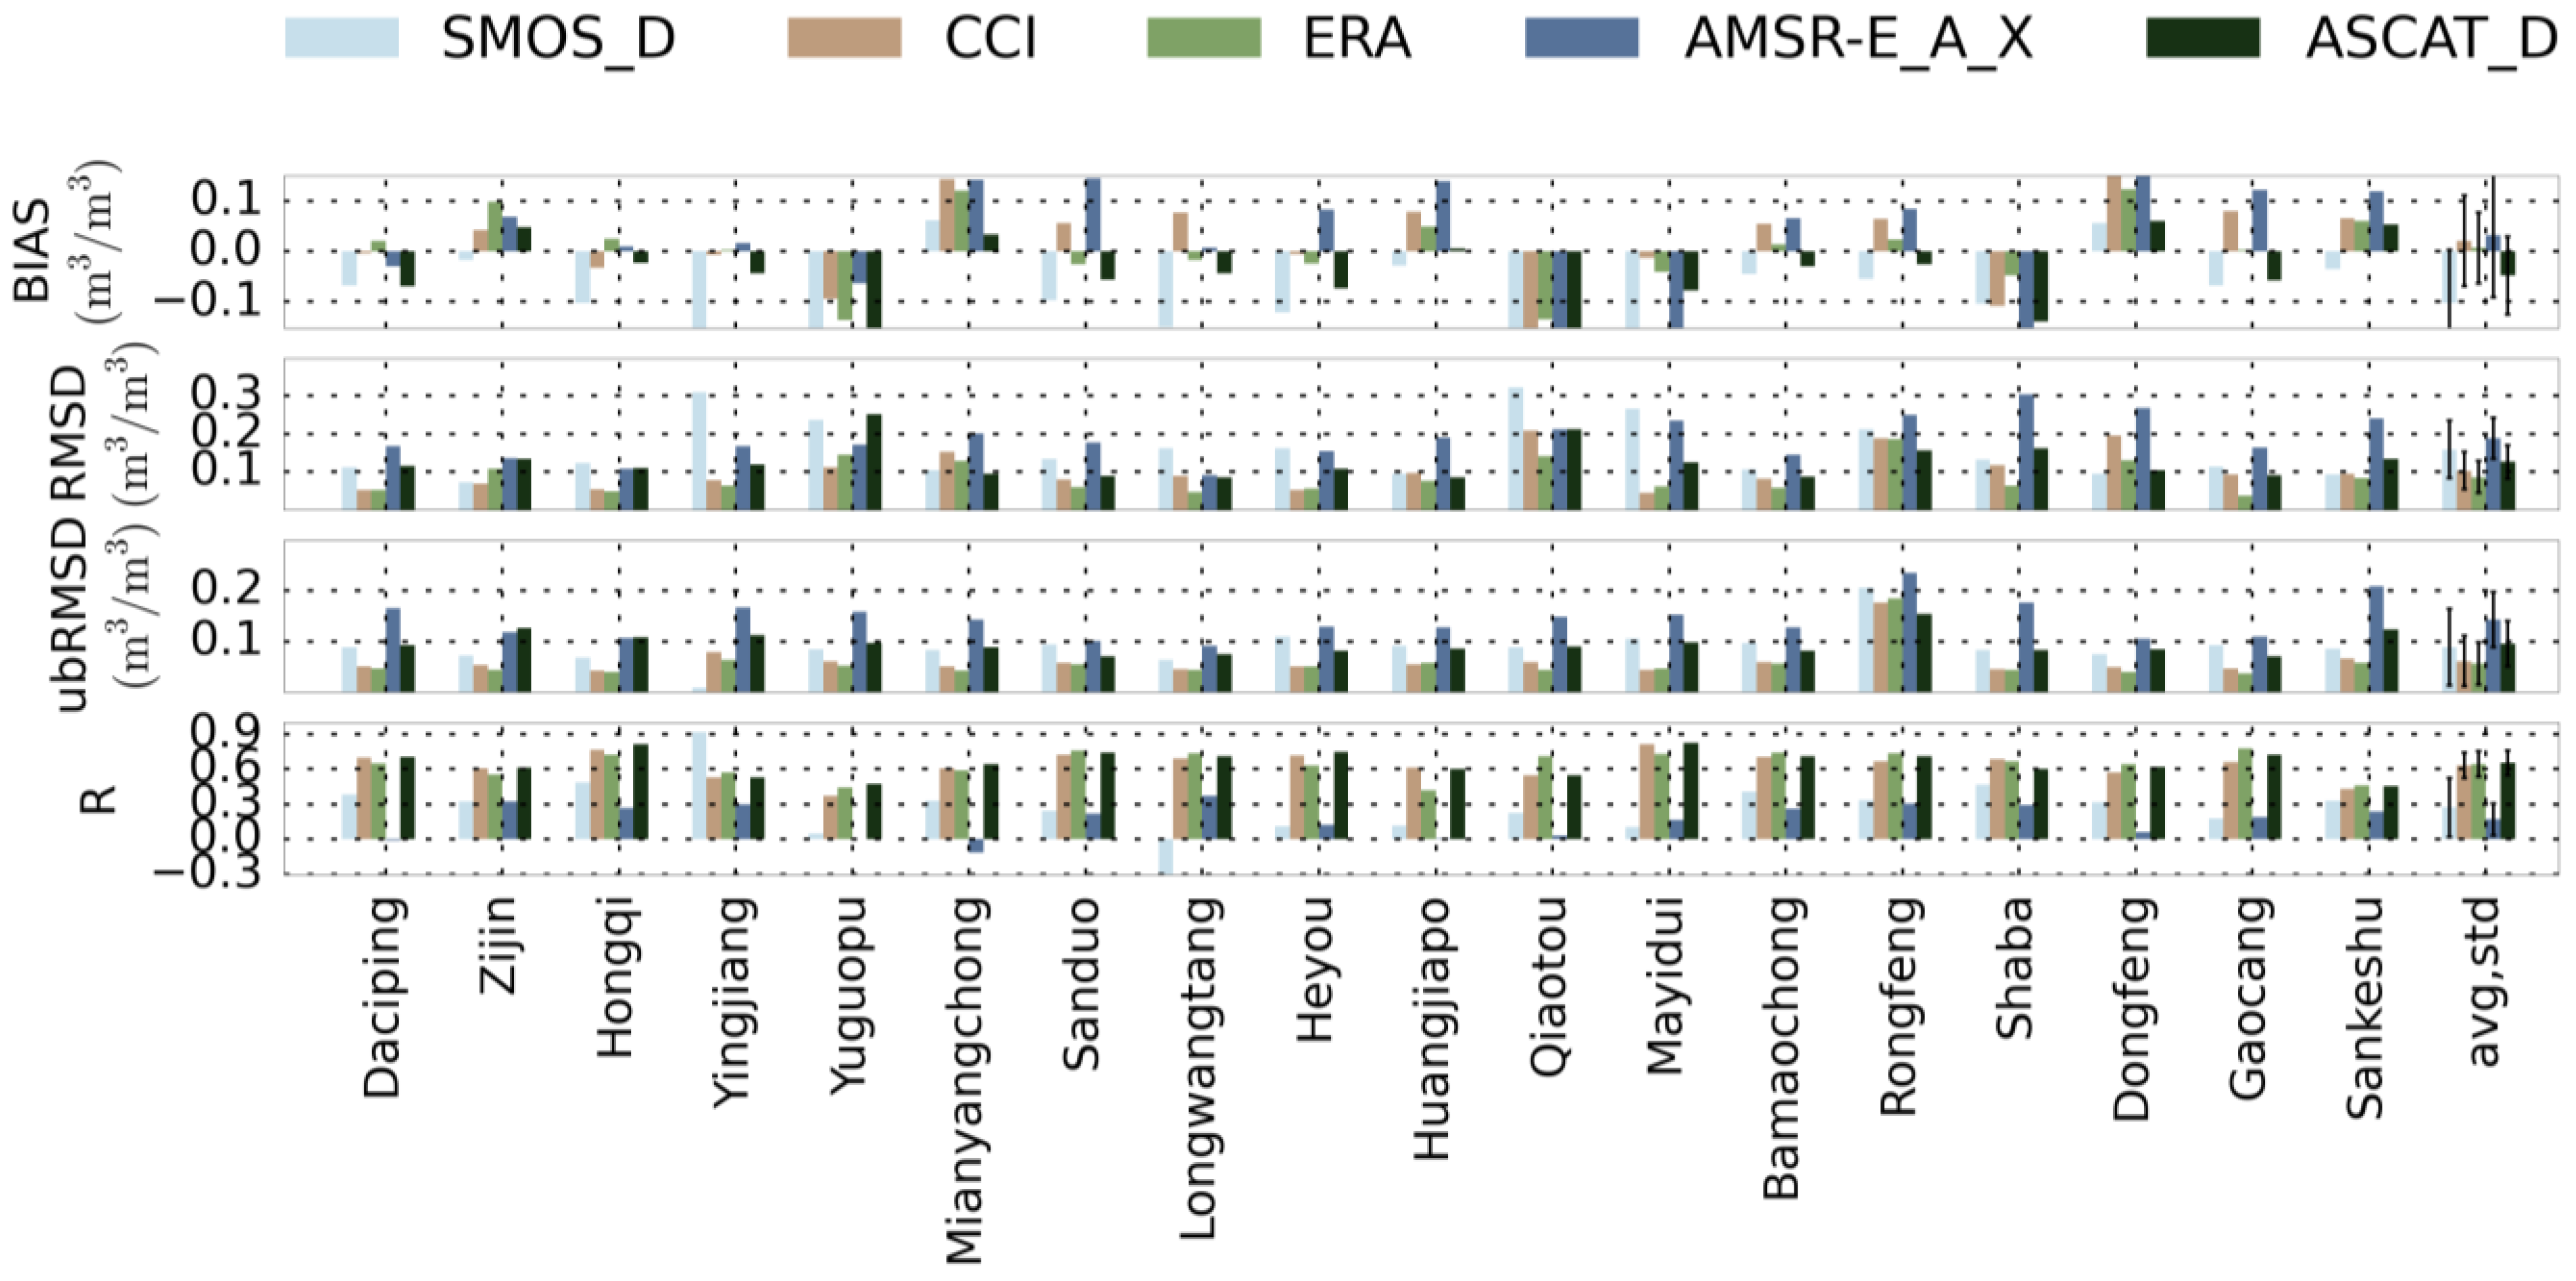
4.1.3. Validation of the Soil Moisture against in Situ Measurements

| Products | R | BIAS (m3/m3) | RMSD (m3/m3) | ubRMSD (m3/m3) | Sample Days |
|---|---|---|---|---|---|
| CCI | 0.723 | 0.019 | 0.050 | 0.046 | 1621 |
| ERA | 0.782 | 0.014 | 0.037 | 0.035 | 1692 |
| AMSR-E_A_X | 0.086 | 0.067 | 0.152 | 0.136 | 965 |
| ASCAT_D | 0.778 | −0.053 | 0.096 | 0.080 | 1686 |
| SMOS_D | 0.443 | −0.074 | 0.096 | 0.062 | 657 |
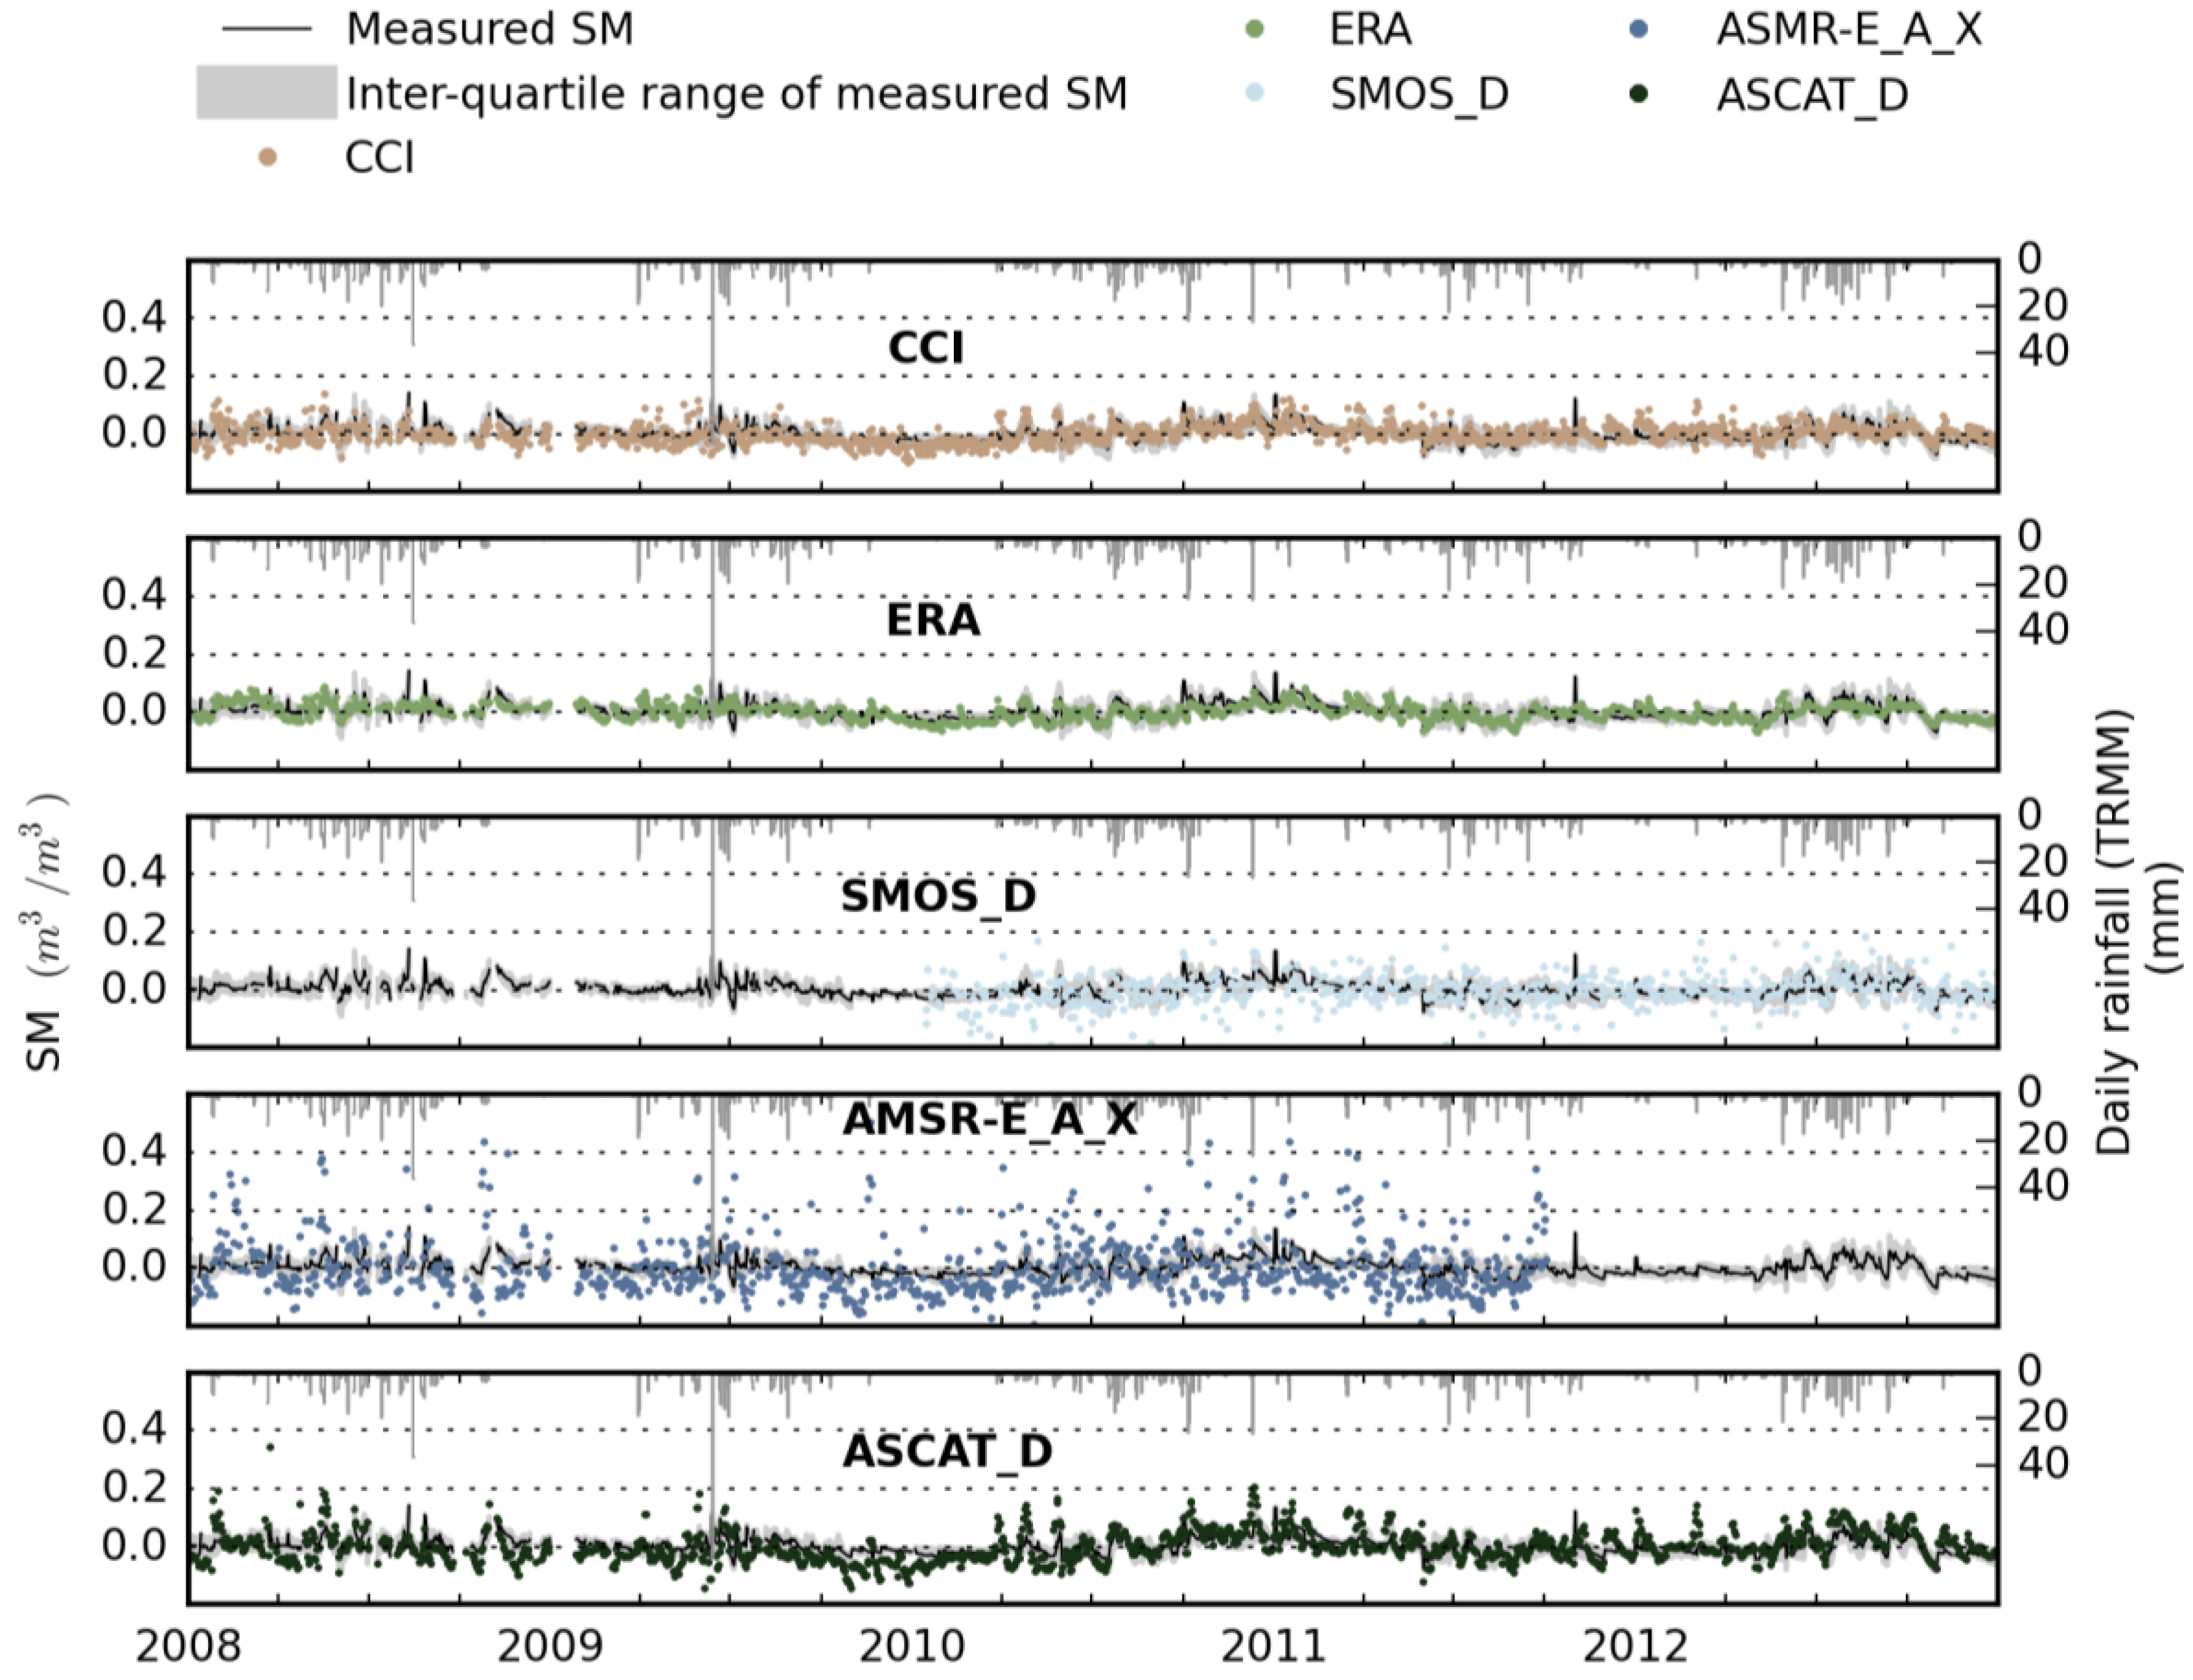
4.2. Comparison of Soil Moisture Anomalies
4.2.1. Temporal Evolution of Soil Moisture and Precipitation

4.2.2. Validation of the Soil Moisture Anomalies

| Products | R | BIAS (m3/m3) | RMSD (m3/m3) | ubRMSD (m3/m3) | Sample Days |
|---|---|---|---|---|---|
| CCI | 0.480 | −0.002 | 0.030 | 0.030 | 1621 |
| ERA | 0.634 | −0.003 | 0.023 | 0.023 | 1692 |
| AMSR-E_A_X | 0.222 | −0.007 | 0.101 | 0.101 | 962 |
| ASCAT_D | 0.564 | −0.004 | 0.044 | 0.044 | 1686 |
| SMOS_D | 0.303 | −0.004 | 0.054 | 0.054 | 656 |
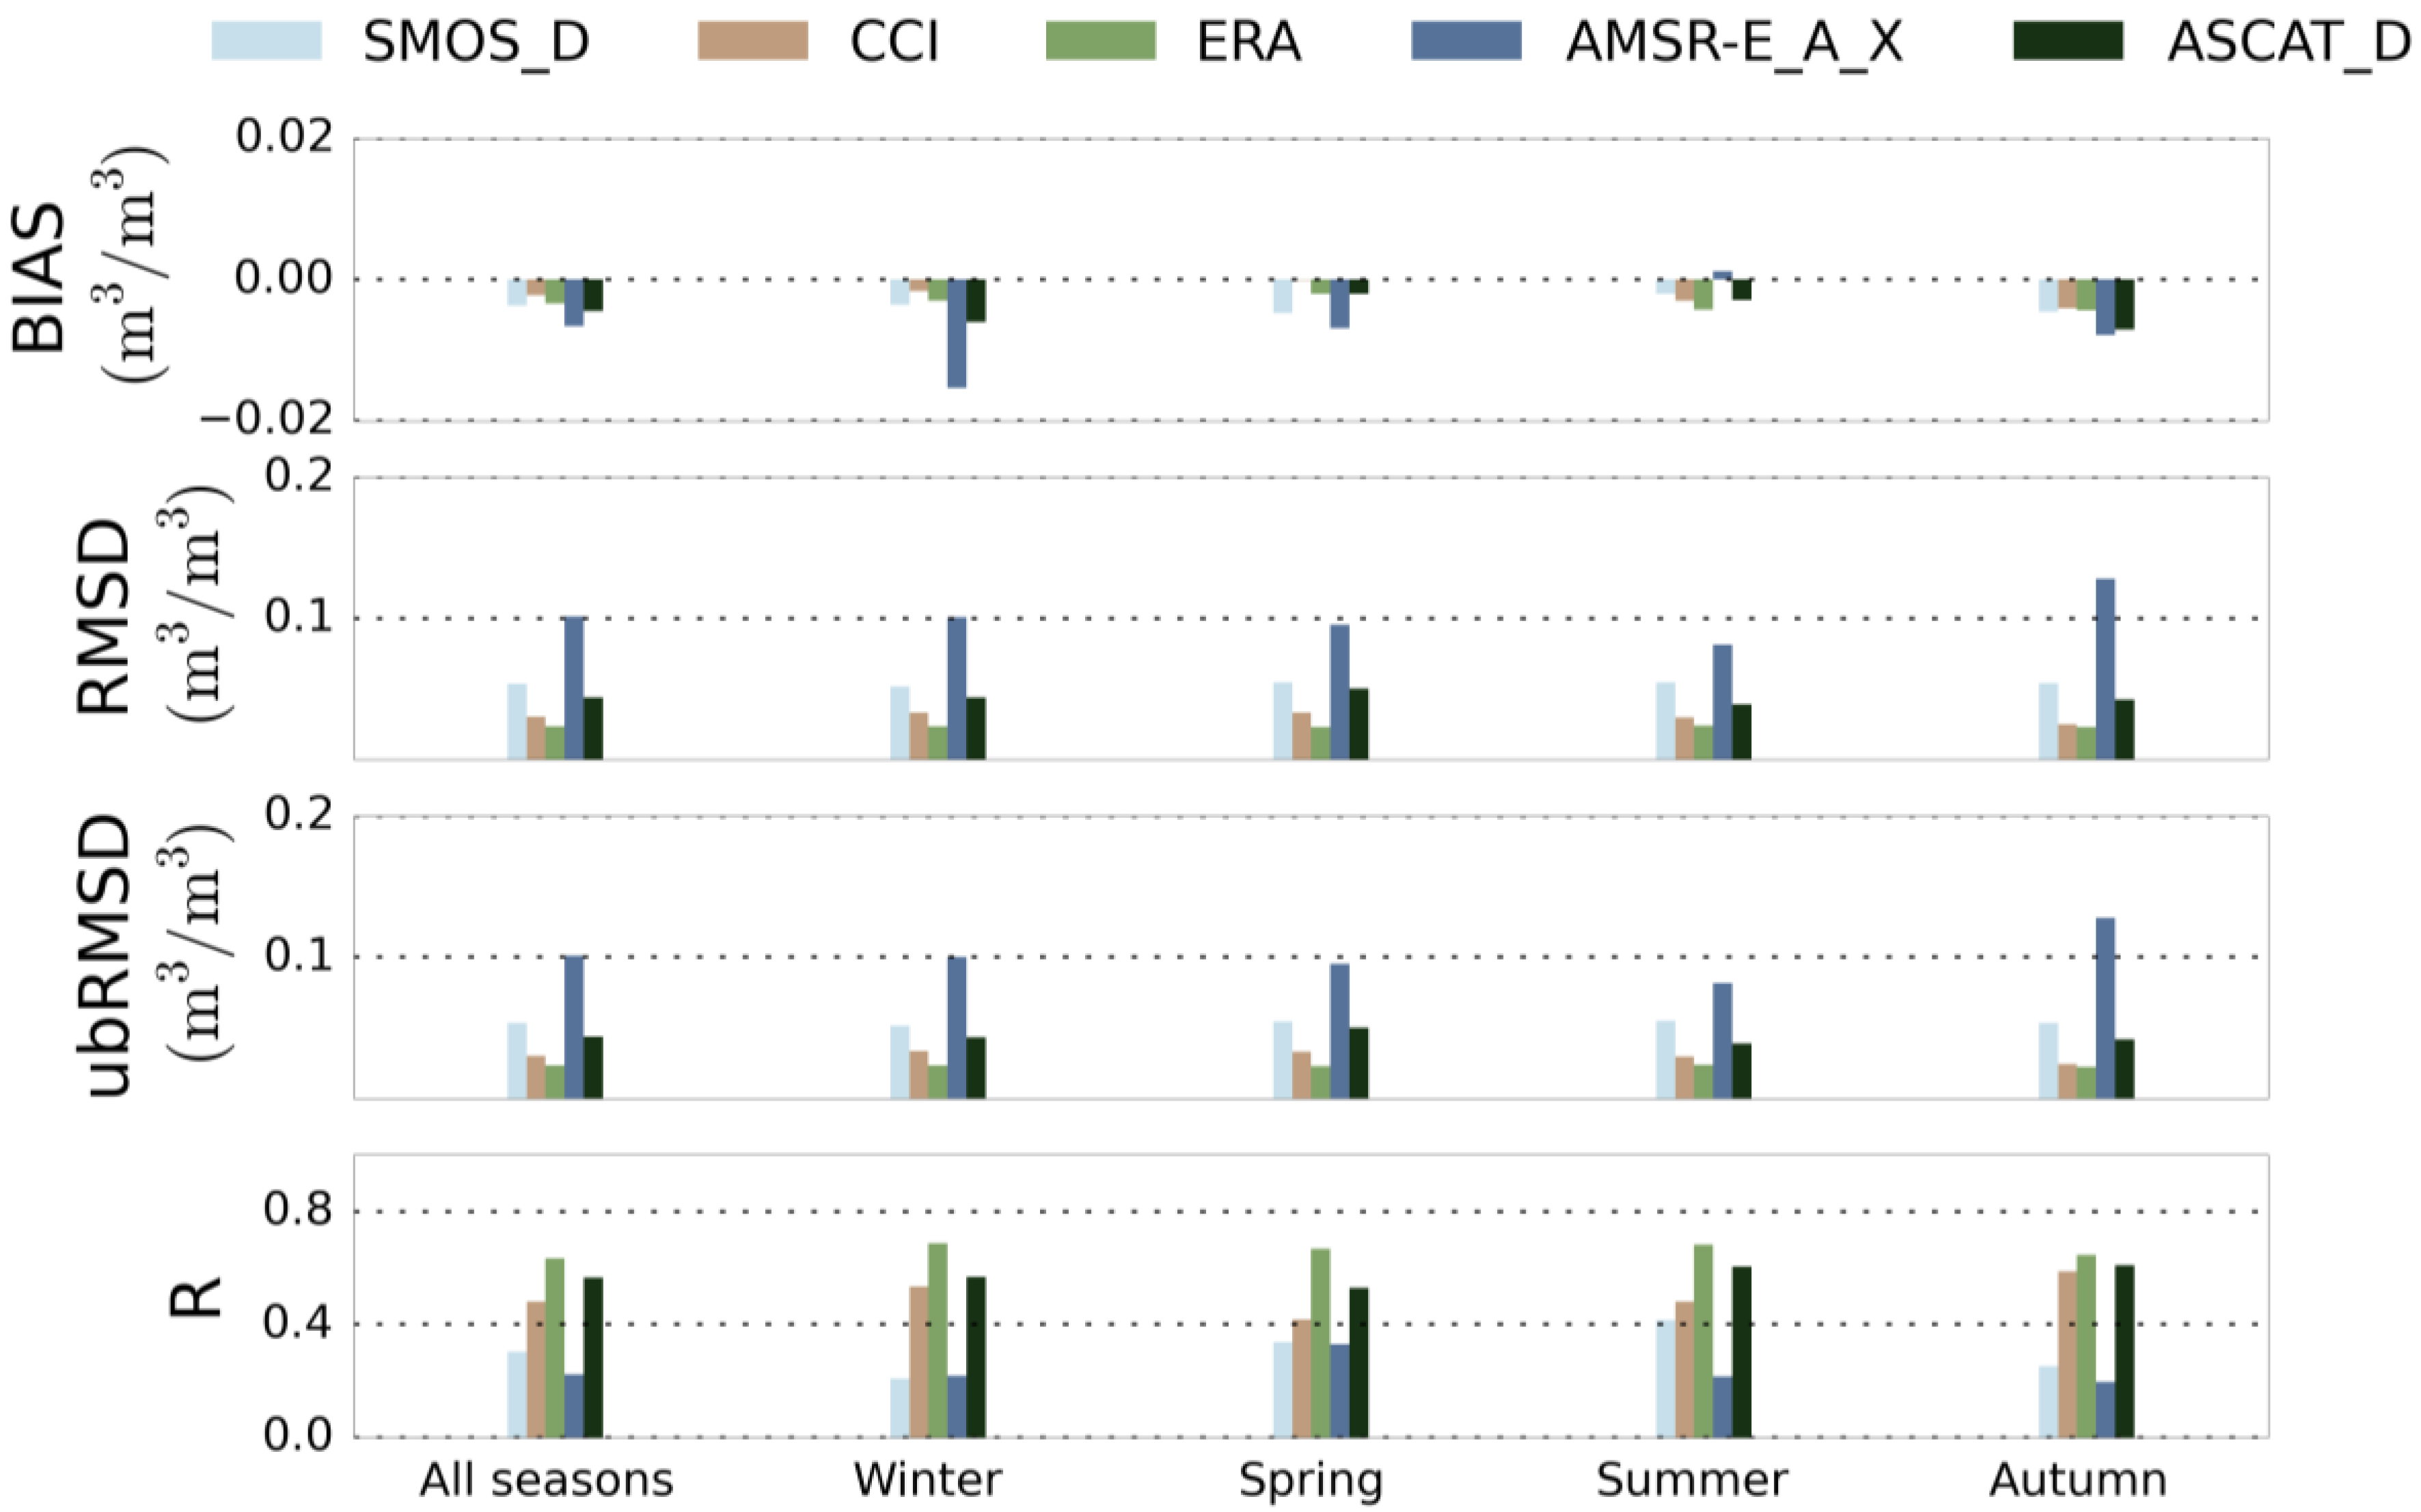
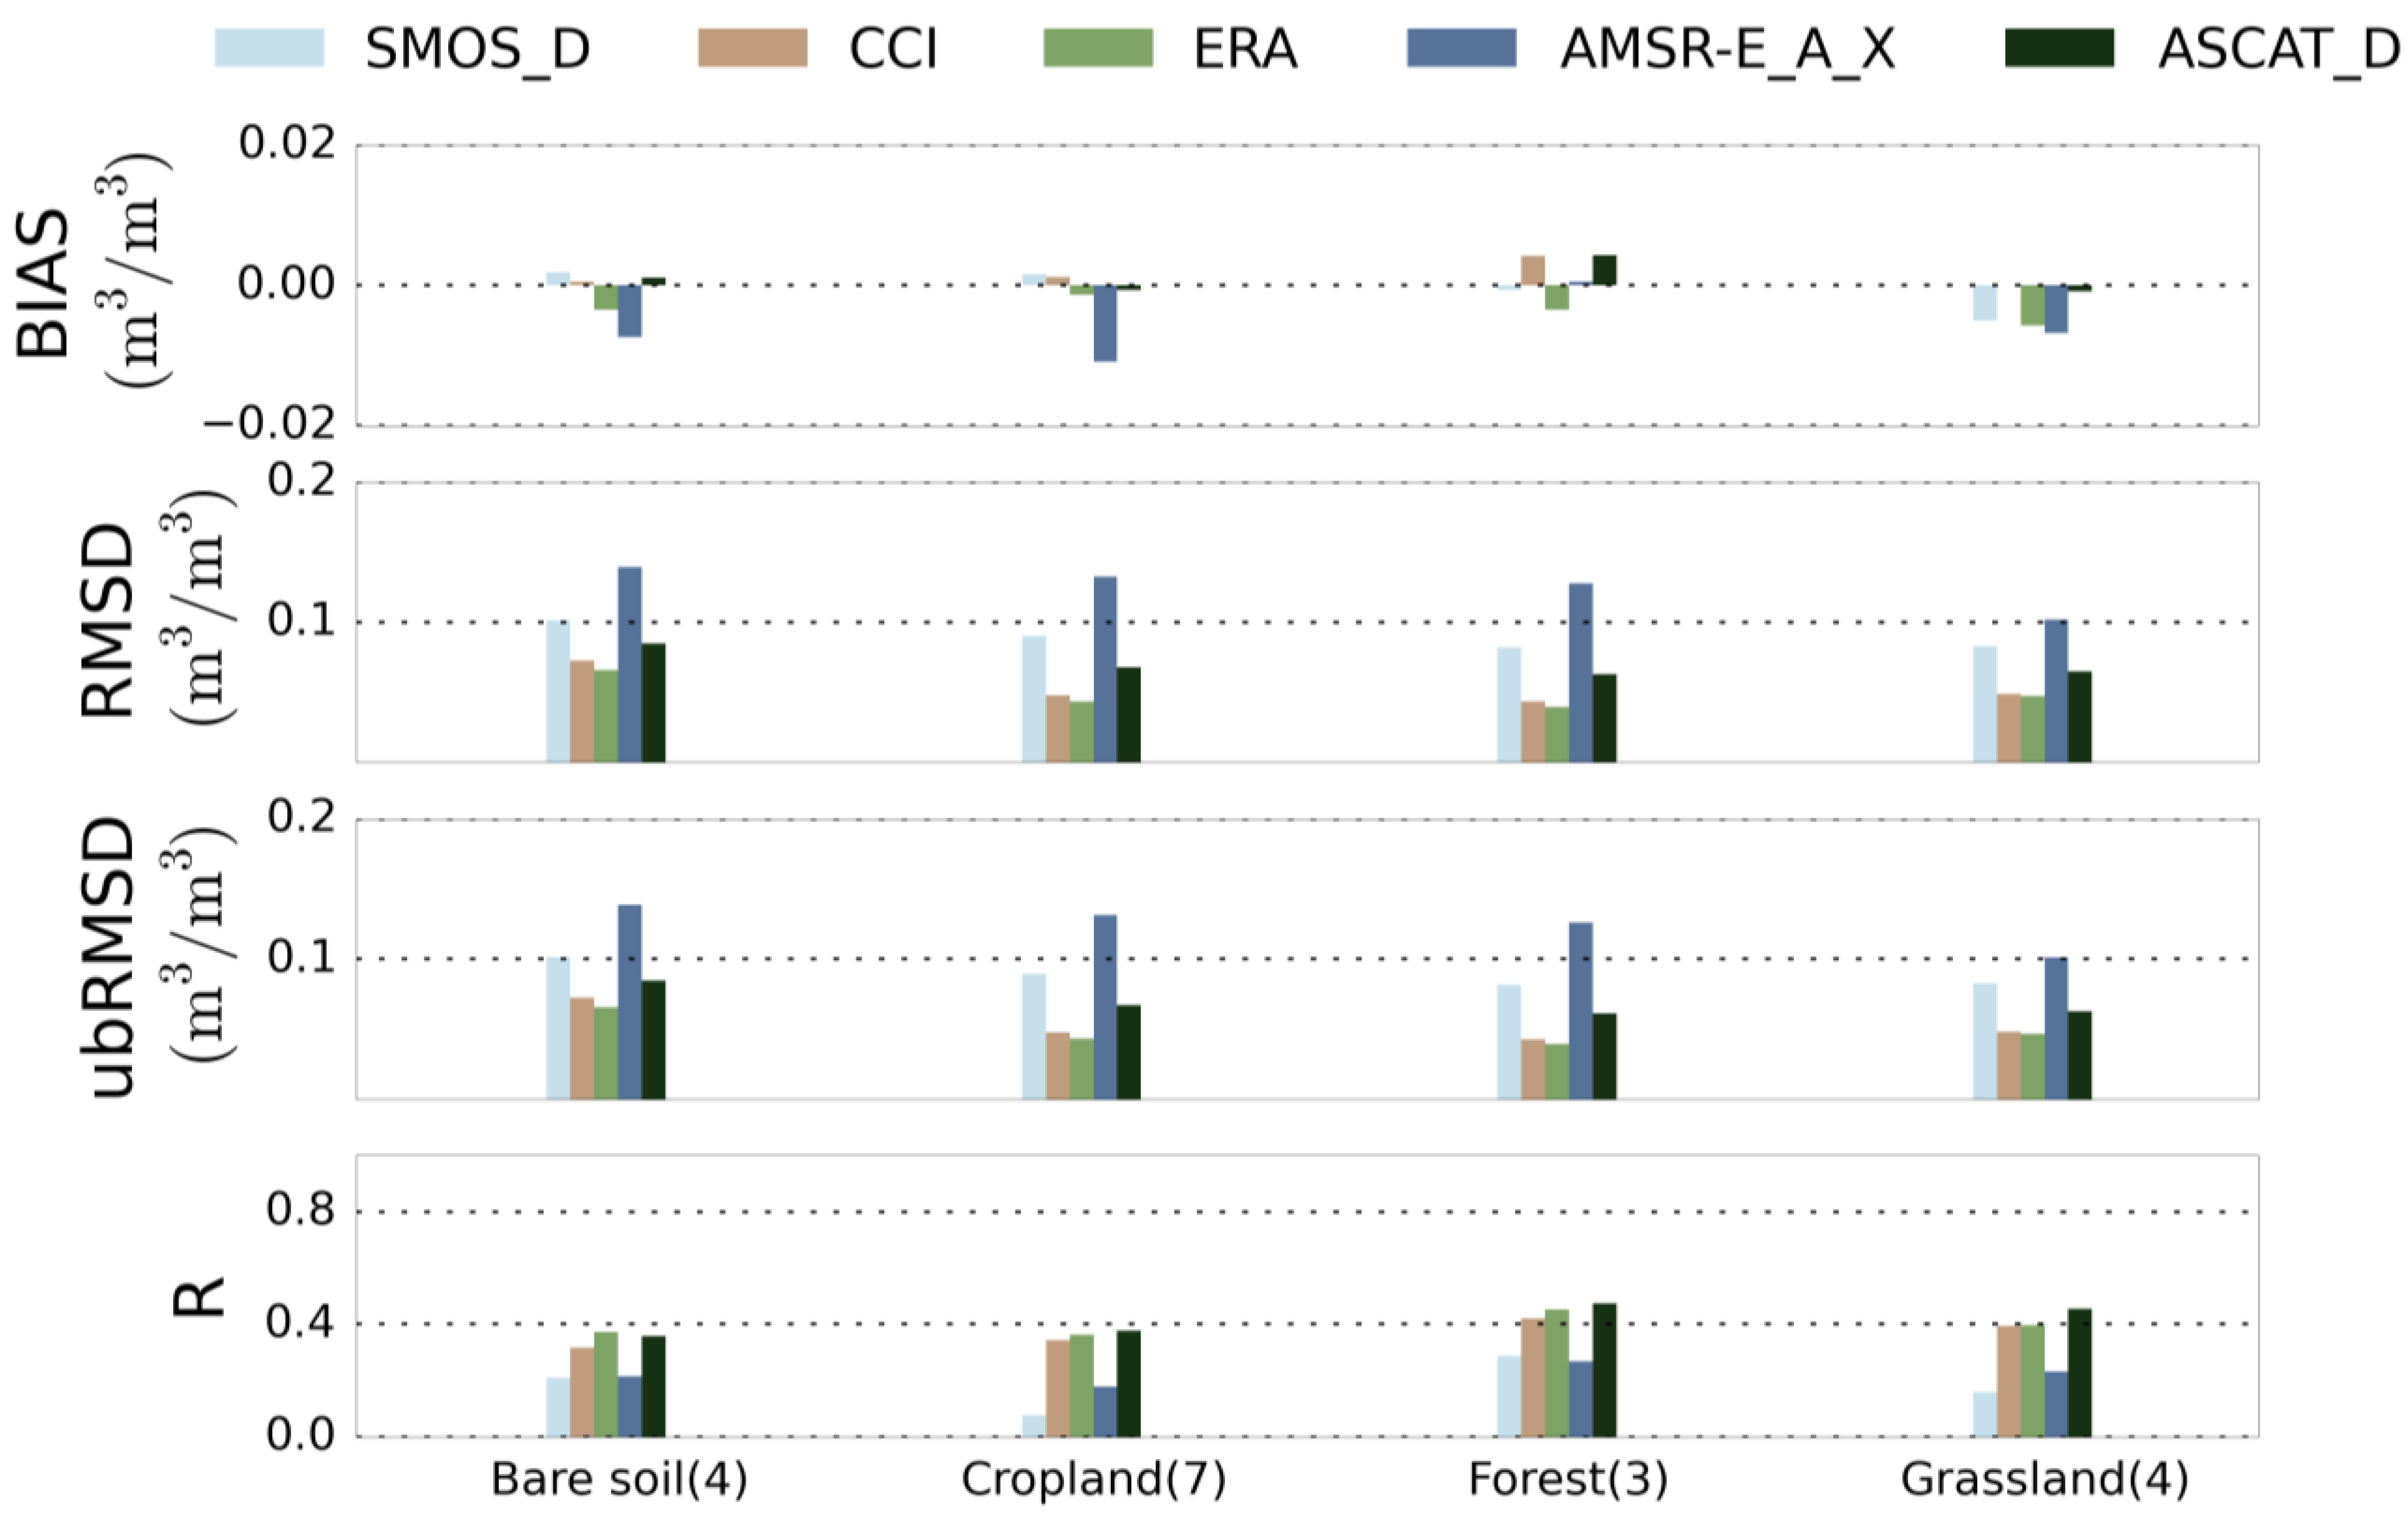
4.2.3. Seasonal and Land Cover Analysis


4.3. Discussion
5. Conclusions
Acknowledgments
Author Contributions
Conflicts of Interest
Appendix


References
- GCOS. Available online: https://www.wmo.int/pages/prog/gcos/Publications/gcos-154.pdf (accessed on 23 November).
- Porporato, A.; Daly, E.; Rodriguez-Iturbe, I. Soil water balance and ecosystem response to climate change. Am. Naturalist 2004, 164, 625–632. [Google Scholar] [CrossRef] [PubMed]
- Vereecken, H.; Huisman, J.; Pachepsky, Y.; Montzka, C.; van der Kruk, J.; Bogena, H.; Weihermüller, L.; Herbst, M.; Martinez, G.; Vanderborght, J. On the spatio-temporal dynamics of soil moisture at the field scale. J. Hydrol. 2014, 516, 76–96. [Google Scholar] [CrossRef]
- Seneviratne, S.I.; Corti, T.; Davin, E.L.; Hirschi, M.; Jaeger, E.B.; Lehner, I.; Orlowsky, B.; Teuling, A.J. Investigating soil moisture–climate interactions in a changing climate: A review. Earth-Sci. Rev. 2010, 99, 125–161. [Google Scholar] [CrossRef]
- Loew, A.; Holmes, T.; de Jeu, R. The european heat wave 2003: Early indicators from multisensoral microwave remote sensing? J. Geophys. Res.: Atmos. (1984–2012) 2009, 114. [Google Scholar] [CrossRef]
- Wagner, W.; Naeimi, V.; Scipal, K.; de Jeu, R.; Martínez-Fernández, J. Soil moisture from operational meteorological satellites. Hydrogeol. J. 2007, 15, 121–131. [Google Scholar] [CrossRef]
- Loew, A.; Ludwig, R.; Mauser, W. Derivation of surface soil moisture from envisat asar wide swath and image mode data in agricultural areas. IEEE Trans. Geosci. Remote Sens. 2006, 44, 889–899. [Google Scholar] [CrossRef]
- Njoku, E.G.; Entekhabi, D. Passive microwave remote sensing of soil moisture. J. Hydrol. 1996, 184, 101–129. [Google Scholar] [CrossRef]
- Owe, M.; de Jeu, R.; Holmes, T. Multisensor historical climatology of satellite-derived global land surface moisture. J. Geophys. Res. Earth Surf. 2008, 113, F01002. [Google Scholar] [CrossRef]
- Naeimi, V.; Scipal, K.; Bartalis, Z.; Hasenauer, S.; Wagner, W. An improved soil moisture retrieval algorithm for ERS and METOP scatterometer observations. IEEE Trans. Geosci. Remote Sens. 2009, 47, 1999–2013. [Google Scholar] [CrossRef]
- Wagner, W.; Lemoine, G.; Rott, H. A method for estimating soil moisture from ERS scatterometer and soil data. Remote Sens. Environ. 1999, 70, 191–207. [Google Scholar] [CrossRef]
- Kerr, Y.H.; Waldteufel, P.; Wigneron, J.P.; Martinuzzi, J.; Font, J.; Berger, M. Soil moisture retrieval from space: The soil moisture and ocean salinity (SMOS) mission. IEEE Trans. Geosci. Remote Sens. 2001, 39, 1729–1735. [Google Scholar] [CrossRef]
- Liu, Y.Y.; Parinussa, R.M.; Dorigo, W.A.; de Jeu, R.A.M.; Wagner, W.; van Dijk, A.I.J.M.; McCabe, M.F.; Evans, J.P. Developing an improved soil moisture dataset by blending passive and active microwave satellite-based retrievals. Hydrol. Earth Syst.Sci. 2011, 15, 425–436. [Google Scholar] [CrossRef] [Green Version]
- Wagner, W.; Dorigo, W.; de Jeu, R.; Fernandez, D.; Benveniste, J.; Haas, E.; Ertl, M. Fusion of active and passive microwave observations to create an essential climate variable data record on soil moisture. ISPRS Ann. Photogramm. Remote Sens. Spat. Inf. Sci. 2012, I-7, 315–321. [Google Scholar] [CrossRef]
- Dorigo, W.A.; Gruber, A.; de Jeu, R.A.M.; Wagner, W.; Stacke, T.; Loew, A.; Albergel, C.; Brocca, L.; Chung, D.; Parinussa, R.M.; et al. Evaluation of the ESA CCI soil moisture product using ground-based observations. Remote Sens. Environ. 2015, 162, 380–395. [Google Scholar] [CrossRef]
- Albergel, C.; Rüdiger, C.; Carrer, D.; Calvet, J.-C.; Fritz, N.; Naeimi, V.; Bartalis, Z.; Hasenauer, S. An evaluation of ascat surface soil moisture products with in situ observations in southwestern france. Hydrol. Earth Syst. Sci. 2009, 13, 115–124. [Google Scholar] [CrossRef]
- Brocca, L.; Hasenauer, S.; Lacava, T.; Melone, F.; Moramarco, T.; Wagner, W.; Dorigo, W.; Matgen, P.; Martínez-Fernández, J.; Llorens, P.; et al. Soil moisture estimation through ASCAT and AMSR-E sensors: An intercomparison and validation study across europe. Remote Sens. Environ. 2011, 115, 3390–3408. [Google Scholar] [CrossRef]
- Sánchez, N.; Martínez-Fernández, J.; Scaini, A.; Pérez-Gutiérrez, C. Validation of the SMOS l2 soil moisture data in the remedhus network (Spain). IEEE Trans. Geosci. Remote Sens. 2012, 50, 1602–1611. [Google Scholar] [CrossRef]
- Fascetti, F.; Pierdicca, N.; Pulvirenti, L.; Crapolicchio, R.; Muñoz-Sabater, J. A comparison of ASCAT and SMOS soil moisture retrievals over europe and northern africa from 2010 to 2013. Int. J. Appl. Earth Obs. Geoinf. 2015, in press. [Google Scholar] [CrossRef]
- Draper, C.S.; Walker, J.P.; Steinle, P.J.; de Jeu, R.A.; Holmes, T.R. An evaluation of AMSR–E derived soil moisture over australia. Remote Sens. Environ. 2009, 113, 703–710. [Google Scholar] [CrossRef]
- Su, C.-H.; Ryu, D.; Young, R.I.; Western, A.W.; Wagner, W. Inter-comparison of microwave satellite soil moisture retrievals over the murrumbidgee basin, southeast Australia. Remote Sens. Environ. 2013, 134, 1–11. [Google Scholar] [CrossRef]
- Gruhier, C.; Rosnay, P.D.; Hasenauer, S.; Holmes, T.; Jeu, R.D.; Kerr, Y.; Mougin, E.; Njoku, E.; Timouk, F.; Wagner, W. Soil moisture active and passive microwave products: Intercomparison and evaluation over a Sahelian site. Hydrol. Earth Syst. Sci. 2010, 14, 141–156. [Google Scholar] [CrossRef]
- Louvet, S.; Pellarin, T.; al Bitar, A.; Cappelaere, B.; Galle, S.; Grippa, M.; Gruhier, C.; Kerr, Y.; Lebel, T.; Mialon, A.; et al. SMOS soil moisture product evaluation over West-Africa from local to regional scale. Remote Sens. Environ. 2015, 156, 383–394. [Google Scholar] [CrossRef]
- Al Bitar, A.; Leroux, D.; Kerr, Y.H.; Merlin, O.; Richaume, P.; Sahoo, A.; Wood, E.F. Evaluation of SMOS soil moisture products over continental US using the SCAN/SNOTEL network. IEEE Trans. Geosci. Remote Sens. 2012, 50, 1572–1586. [Google Scholar] [CrossRef] [Green Version]
- Collow, T.W.; Robock, A.; Basara, J.B.; Illston, B.G. Evaluation of SMOS retrievals of soil moisture over the central United States with currently available in situ observations. J. Geophys. Res. Atmos. 2012, 117. [Google Scholar] [CrossRef]
- Al-Yaari, A.; Wigneron, J.P.; Ducharne, A.; Kerr, Y.; de Rosnay, P.; de Jeu, R.; Govind, A.; Al Bitar, A.; Albergel, C.; Muñoz-Sabater, J.; et al. Global-scale evaluation of two satellite-based passive microwave soil moisture datasets (SMOS and AMSR-E) with respect to land data assimilation system estimates. Remote Sens. Environ. 2014, 149, 181–195. [Google Scholar] [CrossRef] [Green Version]
- Albergel, C.; Dorigo, W.; Reichle, R.H.; Balsamo, G.; de Rosnay, P.; Muñoz-Sabater, J.; Isaksen, L.; de Jeu, R.; Wagner, W. Skill and global trend analysis of soil moisture from reanalyses and microwave remote sensing. J. Hydrometeorol. 2013, 14, 1259–1277. [Google Scholar] [CrossRef]
- Long, D.; Shen, Y.; Sun, A.; Hong, Y.; Longuevergne, L.; Yang, Y.; Li, B.; Chen, L. Drought and flood monitoring for a large karst plateau in southwest China using extended grace data. Remote Sens. Environ. 2014, 155, 145–160. [Google Scholar] [CrossRef]
- Xu, K.; Yang, D.; Xu, X.; Lei, H. Copula based drought frequency analysis considering the spatio-temporal variability in southwest China. J. Hydrol. 2015, 527, 630–640. [Google Scholar] [CrossRef]
- Qiu, J. China drought highlights future climate threats. Nature 2010, 465, 142–143. [Google Scholar] [CrossRef] [PubMed]
- Fan, Z.-X.; Bräuning, A.; Thomas, A.; Li, J.-B.; Cao, K.-F. Spatial and temporal temperature trends on the Yunnan plateau (southwest China) during 1961–2004. Int. J. Climatol. 2011, 31, 2078–2090. [Google Scholar] [CrossRef]
- Li, Y.-G.; He, D.; Hu, J.-M.; Cao, J. Variability of extreme precipitation over Yunnan province, China 1960–2012. Int. J. Climatol. 2015, 35, 245–258. [Google Scholar] [CrossRef]
- Abbas, S.; Nichol, J.; Qamer, F.; Xu, J. Characterization of drought development through remote sensing: A case study in central Yunnan, china. Remote Sens. 2014, 6, 4998–5018. [Google Scholar] [CrossRef]
- Yang, J.; Gong, D.; Wang, W.; Hu, M.; Mao, R. Extreme drought event of 2009/2010 over southwestern China. Meteorol. Atmos. Phys. 2012, 115, 173–184. [Google Scholar] [CrossRef]
- Zhang, L.; Xiao, J.; Li, J.; Wang, K.; Lei, L.; Guo, H. The 2010 spring drought reduced primary productivity in southwestern China. Environ. Res. Lett. 2012, 7, 045706. [Google Scholar] [CrossRef]
- Njoku, E.G.; Jackson, T.J.; Lakshmi, V.; Chan, T.K.; Nghiem, S.V. Soil moisture retrieval from AMSR-E. IEEE Trans. Geosci. Remote Sens. 2003, 41, 215–229. [Google Scholar] [CrossRef]
- Rebel, K.T.; de Jeu, R.A.M.; Ciais, P.; Viovy, N. A global analysis of soil moisture derived from satellite observations and a land surface model. Hydrol. Earth Syst. Sci. 2012, 16, 833–847. [Google Scholar] [CrossRef]
- Lei, F.; Crow, W.; Shen, H.; Parinussa, R.; Holmes, T. The impact of local acquisition time on the accuracy of microwave surface soil moisture retrievals over the contiguous United States. Remote Sens. 2015, 7, 13448–13465. [Google Scholar] [CrossRef]
- Figa-Saldaña, J.; Wilson, J.J.; Attema, E.; Gelsthorpe, R.; Drinkwater, M.; Stoffelen, A. The advanced scatterometer (ASCAT) on the meteorological operational (METOP) platform: A follow on for European wind scatterometers. Can. J. Remote Sens. 2002, 28, 404–412. [Google Scholar] [CrossRef]
- Wagner, W.; Bloeschl, G.; Pampaloni, P.; Calvet, J.-C.; Bizzarri, B.; Wigneron, J.-P.; Kerr, Y. Operational readiness of microwave remote sensing of soil moisture for hydrologic applications. Nord. Hydrol. 2007, 38, 1–20. [Google Scholar] [CrossRef]
- Reynolds, C.A.; Jackson, T.J.; Rawls, W.J. Estimating soil water-holding capacities by linking the food and agriculture organization soil map of the world with global pedon databases and continuous pedotransfer functions. Water Resour. Res. 2000, 36, 3653–3662. [Google Scholar] [CrossRef]
- Hollmann, R.; Merchant, C.J.; Saunders, R.; Downy, C.; Buchwitz, M.; Cazenave, A.; Chuvieco, E.; Defourny, P.; de Leeuw, G.; Forsberg, R.; et al. The ESA climate change initiative: Satellite data records for essential climate variables. Bull. Am. Meteorol. Soc. 2013, 94, 1541–1552. [Google Scholar] [CrossRef]
- Liu, Y.Y.; Dorigo, W.A.; Parinussa, R.M.; de Jeu, R.A.M.; Wagner, W.; McCabe, M.F.; Evans, J.P.; van Dijk, A.I.J.M. Trend-preserving blending of passive and active microwave soil moisture retrievals. Remote Sens. Environ. 2012, 123, 280–297. [Google Scholar] [CrossRef]
- Kerr, Y.H.; Waldteufel, P.; Wigneron, J.-P.; Delwart, S.; Cabot, F.O.; Boutin, J.; Escorihuela, M.-J.; Font, J.; Reul, N.; Gruhier, C. The SMOS mission: New tool for monitoring key elements ofthe global water cycle. IEEE Proc. 2010, 98, 666–687. [Google Scholar] [CrossRef] [Green Version]
- Wigneron, J.-P.; Kerr, Y.; Waldteufel, P.; Saleh, K.; Escorihuela, M.-J.; Richaume, P.; Ferrazzoli, P.; de Rosnay, P.; Gurney, R.; Calvet, J.-C. L-band microwave emission of the biosphere (L-MEB) model: Description and calibration against experimental data sets over crop fields. Remote Sens. Environ. 2007, 107, 639–655. [Google Scholar] [CrossRef]
- Kerr, Y.H.; Waldteufel, P.; Richaume, P.; Wigneron, J.P.; Ferrazzoli, P.; Mahmoodi, A.; Al Bitar, A.; Cabot, F.; Gruhier, C.; Juglea, S.E. The SMOS soil moisture retrieval algorithm. IEEE Trans. Geosci. Remote Sens. 2012, 50, 1384–1403. [Google Scholar] [CrossRef]
- Al-Yaari, A.; Wigneron, J.P.; Ducharne, A.; Kerr, Y.H.; Wagner, W.; de Lannoy, G.; Reichle, R.; Al Bitar, A.; Dorigo, W.; Richaume, P.; et al. Global-scale comparison of passive (SMOS) and active (ASCAT) satellite based microwave soil moisture retrievals with soil moisture simulations (Merra-Land). Remote Sens. Environ. 2014, 152, 614–626. [Google Scholar] [CrossRef] [Green Version]
- Dee, D.P.; Uppala, S.M.; Simmons, A.J.; Berrisford, P.; Poli, P.; Kobayashi, S.; Andrae, U.; Balmaseda, M.A.; Balsamo, G.; Bauer, P.; et al. The Era-interim reanalysis: Configuration and performance of the data assimilation system. Q. J. R. Meteorol. Soc. 2011, 137, 553–597. [Google Scholar] [CrossRef]
- Kummerow, C.; Simpson, J.; Thiele, O.; Barnes, W.; Chang, A.T.C.; Stocker, E.; Adler, R.F.; Hou, A.; Kakar, R.; Wentz, F.; et al. The status of the tropical rainfall measuring mission (TRMM) after two years in orbit. J. Appl. Meteorol. 2000, 39, 1965–1982. [Google Scholar] [CrossRef]
- Iguchi, T.; Kozu, T.; Meneghini, R.; Awaka, J.; Okamoto, K.I. Rain-profiling algorithm for the TRMM precipitation radar. J. Appl. Meteorol. 2000, 39, 2038–2052. [Google Scholar] [CrossRef]
- Willmott, C.J. Some comments on the evaluation of model performance. Bull. Am. Meteorol. Soc. 1982, 63, 1309–1313. [Google Scholar] [CrossRef]
- Entekhabi, D.; Reichle, R.H.; Koster, R.D.; Crow, W.T. Performance metrics for soil moisture retrievals and application requirements. J. Hydrometeorol. 2010, 11, 832–840. [Google Scholar] [CrossRef]
- Scipal, K.; Drusch, M.; Wagner, W. Assimilation of a ERS scatterometer derived soil moisture index in the ECMWF numerical weather prediction system. Adv. Water Resour. 2008, 31, 1101–1112. [Google Scholar] [CrossRef]
- Jackson, T.J.; Cosh, M.H.; Bindlish, R.; Starks, P.J.; Bosch, D.D.; Seyfried, M.; Goodrich, D.C.; Moran, M.S.; Jinyang, D. Validation of advanced microwave scanning radiometer soil moisture products. IEEE Trans. Geosci. Remote Sens. 2010, 48, 4256–4272. [Google Scholar] [CrossRef]
- Saleh, K.; Wigneron, J.-P.; de Rosnay, P.; Calvet, J.-C.; Escorihuela, M.J.; Kerr, Y.; Waldteufel, P. Impact of rain interception by vegetation and mulch on the L-band emission of natural grass. Remote Sens. Environ. 2006, 101, 127–139. [Google Scholar] [CrossRef]
- Rowlandson, T.L.; Hornbuckle, B.K.; Bramer, L.M.; Patton, J.C.; Logsdon, S.D. Comparisons of evening and morning SMOS passes over the Midwest United States. IEEE Trans. Geosci. Remote Sens. 2012, 50, 1544–1555. [Google Scholar] [CrossRef]
- Griesfeller, A.; Lahoz, W.A.; Jeu, R.A.M.D.; Dorigo, W.; Haugen, L.E.; Svendby, T.M.; Wagner, W. Evaluation of satellite soil moisture products over Norway using ground-based observations. Int. J. Appl. Earth Obs. Geoinf. 2015, in press. [Google Scholar] [CrossRef]
- Cho, E.; Choi, M.; Wagner, W. An assessment of remotely sensed surface and root zone soil moisture through active and passive sensors in northeast Asia. Remote Sens. Environ. 2015, 160, 166–179. [Google Scholar] [CrossRef]
- Zeng, J.; Li, Z.; Chen, Q.; Bi, H.; Qiu, J.; Zou, P. Evaluation of remotely sensed and reanalysis soil moisture products over the Tibetan plateau using in situ observations. Remote Sens. Environ. 2015, 163, 91–110. [Google Scholar] [CrossRef]
- Su, Z.; Rosnay, P.; Wen, J.; Wang, L.; Zeng, Y. Evaluation of ecmwf’s soil moisture analyses using observations on the Tibetan plateau. J. Geophys. Res. Atmos. 2013, 118, 5304–5318. [Google Scholar] [CrossRef]
- Pratola, C.; Barrett, B.; Gruber, A.; Kiely, G.; Dwyer, E. Evaluation of a global soil moisture product from finer spatial resolution sar data and ground measurements at Irish sites. Remote Sens. 2014, 6, 8190–8219. [Google Scholar] [CrossRef]
- Peng, J.; Niesel, J.; Loew, A. Evaluation of soil moisture downscaling using a simple thermal based proxy—The remedhus network (Spain) example. Hydrol. Earth Syst. Sci. Discuss. 2015, 12, 8505–8551. [Google Scholar] [CrossRef]
- Oliva, R.; Daganzo, E.; Kerr, Y.H.; Mecklenburg, S.; Nieto, S.; Richaume, P.; Gruhier, C. SMOS radio frequency interference scenario: Status and actions taken to improve the RFI environment in the 1400–1427-MHZ passive band. IEEE Trans. Geosci. Remote Sens. 2012, 50, 1427–1439. [Google Scholar] [CrossRef] [Green Version]
- Piles, M.; Camps, A.; Vall-llossera, M.; Corbella, I.; Panciera, R.; Rudiger, C.; Kerr, Y.H.; Walker, J. Downscaling SMOS-derived soil moisture using modis visible/infrared data. IEEE Trans. Geosci. Remote Sens. 2011, 49, 3156–3166. [Google Scholar] [CrossRef]
- Peng, J.; Loew, A.; Zhang, S.; Wang, J.; Niesel, J. Spatial downscaling of satellite soil moisture data using a vegetation temperature condition index. IEEE Trans. Geosci. Remote Sens. 2016, 54, 558–566. [Google Scholar] [CrossRef]
© 2015 by the authors; licensee MDPI, Basel, Switzerland. This article is an open access article distributed under the terms and conditions of the Creative Commons Attribution license (http://creativecommons.org/licenses/by/4.0/).
Share and Cite
Peng, J.; Niesel, J.; Loew, A.; Zhang, S.; Wang, J. Evaluation of Satellite and Reanalysis Soil Moisture Products over Southwest China Using Ground-Based Measurements. Remote Sens. 2015, 7, 15729-15747. https://0-doi-org.brum.beds.ac.uk/10.3390/rs71115729
Peng J, Niesel J, Loew A, Zhang S, Wang J. Evaluation of Satellite and Reanalysis Soil Moisture Products over Southwest China Using Ground-Based Measurements. Remote Sensing. 2015; 7(11):15729-15747. https://0-doi-org.brum.beds.ac.uk/10.3390/rs71115729
Chicago/Turabian StylePeng, Jian, Jonathan Niesel, Alexander Loew, Shiqiang Zhang, and Jie Wang. 2015. "Evaluation of Satellite and Reanalysis Soil Moisture Products over Southwest China Using Ground-Based Measurements" Remote Sensing 7, no. 11: 15729-15747. https://0-doi-org.brum.beds.ac.uk/10.3390/rs71115729