4.1. Global and Local Hausdorff Metrics as Geometric Accuracy Indices
The Hausdorff distance or Hausdorff metric is used in a wide range of fields, such as point cloud [
32] and meshes [
33] comparison, object recognition [
34], and image comparison and matching [
35]. This metric proves to be a robust strategy for the similarity evaluation of two compact and non-empty sub-sets within a metric space. It is formulated as follows Equations (3) and (4):
where ||.||
2 stands for the Euclidean norm;
min the minimum value (distance);
max the maximum distance;
X and
Y are the two compact sub-sets defined by the numerical and photogrammetric nodes; and
x and
y the considered points inside these sub-sets.
It is worth mentioning that, considering the previously defined concept of Hausdorff distance, the value of the norm does not have a symmetrical nature; it is therefore different in each direction (
dH(X,Y) ≠
dH(Y,X)). For that reason, the symmetrical Hausdorff distance
dSH Equation (5) is used as metric comparison to avoid potential errors of geometrical similarity. This way a more robust solution is provided for geometry comparison.
where
dSHi is the symmetrical Hausdorff distance; of sub-set
i, between models (numerical and photogrammetric); and
x and
y are two points that respectively belong to sub-sets
X and
Y.
On the other hand, understanding the global structural behavior of the analyzed construction inevitably requires several numerical analyses in order to adapt the simulated behavior to the real one. It is necessary to take into account the consideration that new conditions or new values of variables may worsen or improve the global and/or local result of the structure. It is therefore possible to define, out of the previously shown comparison metric Equation (3), two novel geometrical indices of robustness that represent improvements or worsening in the new numerical simulations in comparison to a reference model, considering the different variations of the variables or conditions: Global Hausdorff metric Equation (6); and Local Hausdorff metric Equation (7).
where
GHms represent the Global Hausdorff metric index and
LHms the Local Hausdorff metric index,
dSH(i) the symmetrical Hausdorff distance to cluster
i considered for the model;
dSHb(i) the symmetrical Hausdorff distance for cluster
i of the base model (the model that results from the geometrical discrepancies between the initial model and the photogrammetric one); and
dSHref(i) the symmetrical Hausdorff distance from cluster
i to the reference one (which may be the base model).
On one hand, GHms is able to provide a global value, expressed in percentage, for the improvement/worsening of the numerical simulation model in comparison to the model that was considered as base model. On the other hand, LHms provides a comparison of the variations between the numerical model and the reference model at a local level (values lower than one indicates a local improvement and values higher than one, a worsening).
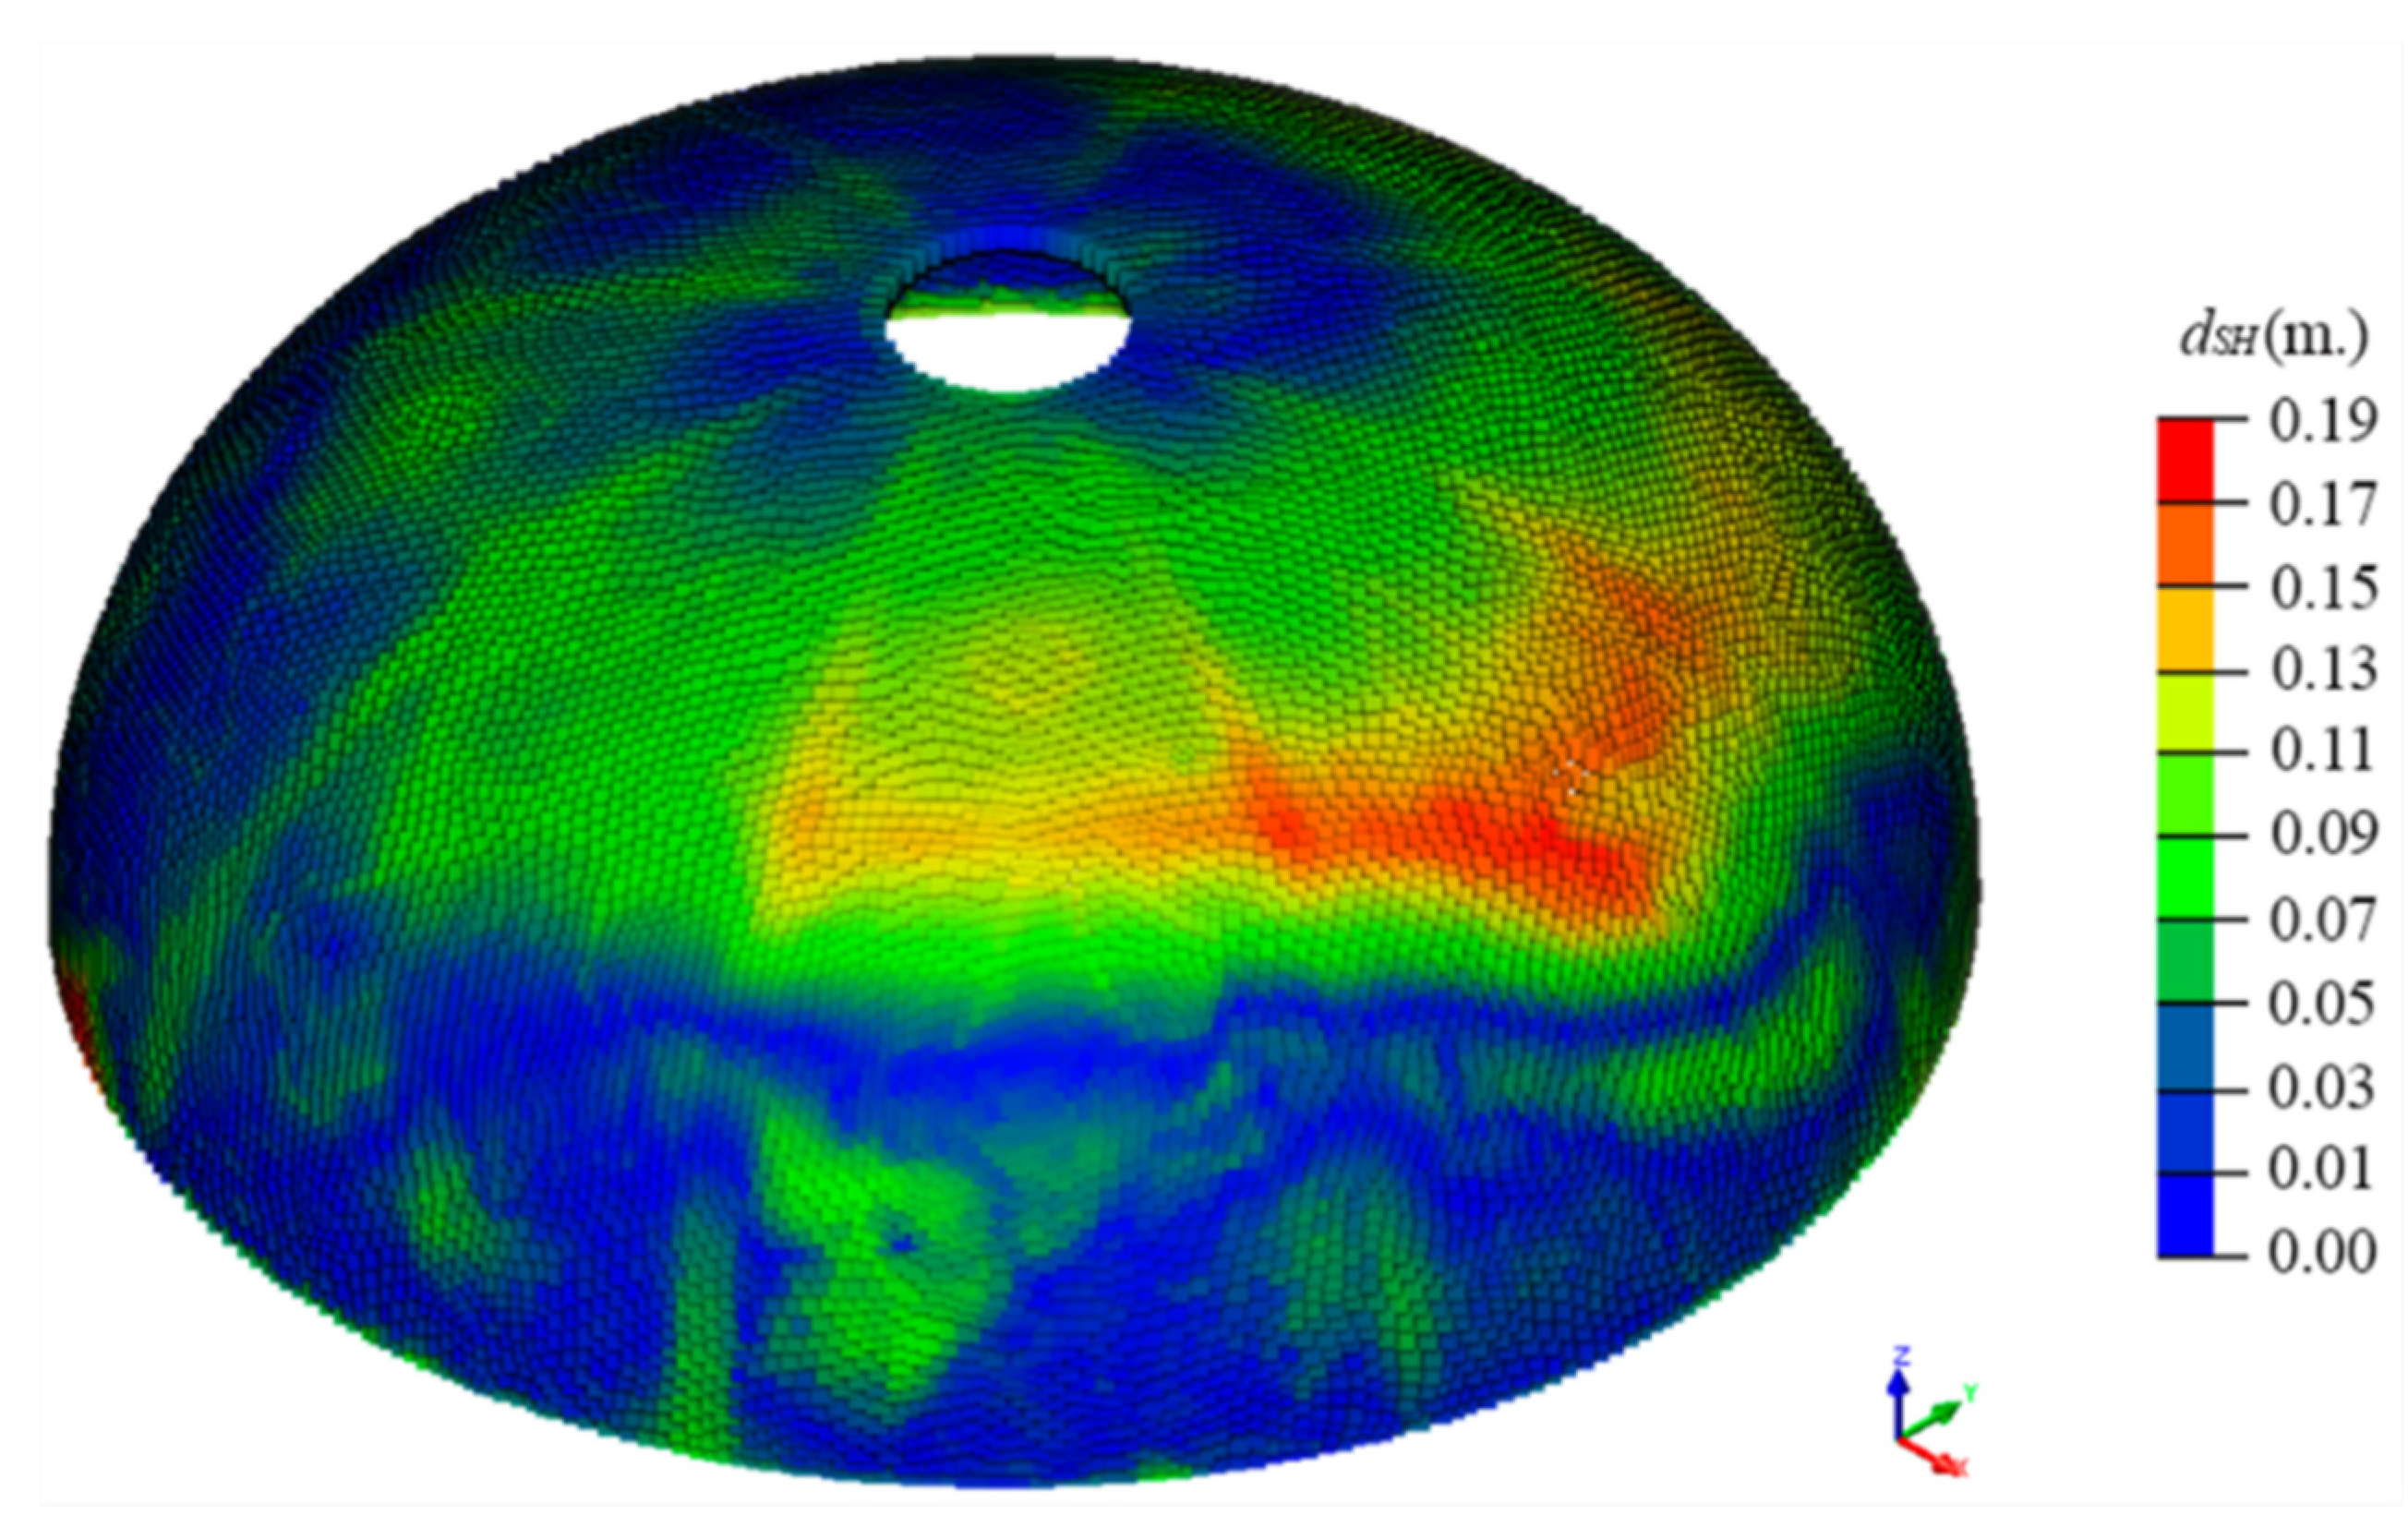
For this case study, the reference model was considered to be the base model, obtained by the application of Equation (3) between the photogrammetric model and the non-deformed numerical model (
Figure 9).
Figure 9.
Graphical distribution of the different considered symmetrical Hausdorff distance (dSH) (expressed in m) for the base model.
Figure 9.
Graphical distribution of the different considered symmetrical Hausdorff distance (dSH) (expressed in m) for the base model.
Finally, and considering
GHms and
LHms as the robustness indexes, a manual calibration was carried out, according to the established lower and upper bounds (
Table 6) (
Figure 10). According to [
36], which provides a range of mechanical properties for historical masonry constructions, the upper and lower bounds were established with a safety factor of 1.35, since nowadays only visual inspection and geometrical survey are available (without an extensive experimental campaign).
Table 6.
Parameters and variables considered during the manual calibration stage.
Table 6.
Parameters and variables considered during the manual calibration stage.
| Variable | Initial Value | Upper Bound | Lower Bound | Update Value |
|---|
| ft,j (MPa) | Masonry tensile strength | 0.16 | 0.20 | 0.05 | 0.13 |
| Ei (GPa) | Infill Young Modulus | 0.80 | 1.00 | 0.05 | 0.50 |
| Em (GPa) | Masonry Young Modulus | 1.22 | 0.89 | 1.33 | 0.90 |
| β (-) | Shear retention factor | 0.20 | 0.01 | 0.20 | 0.15 |
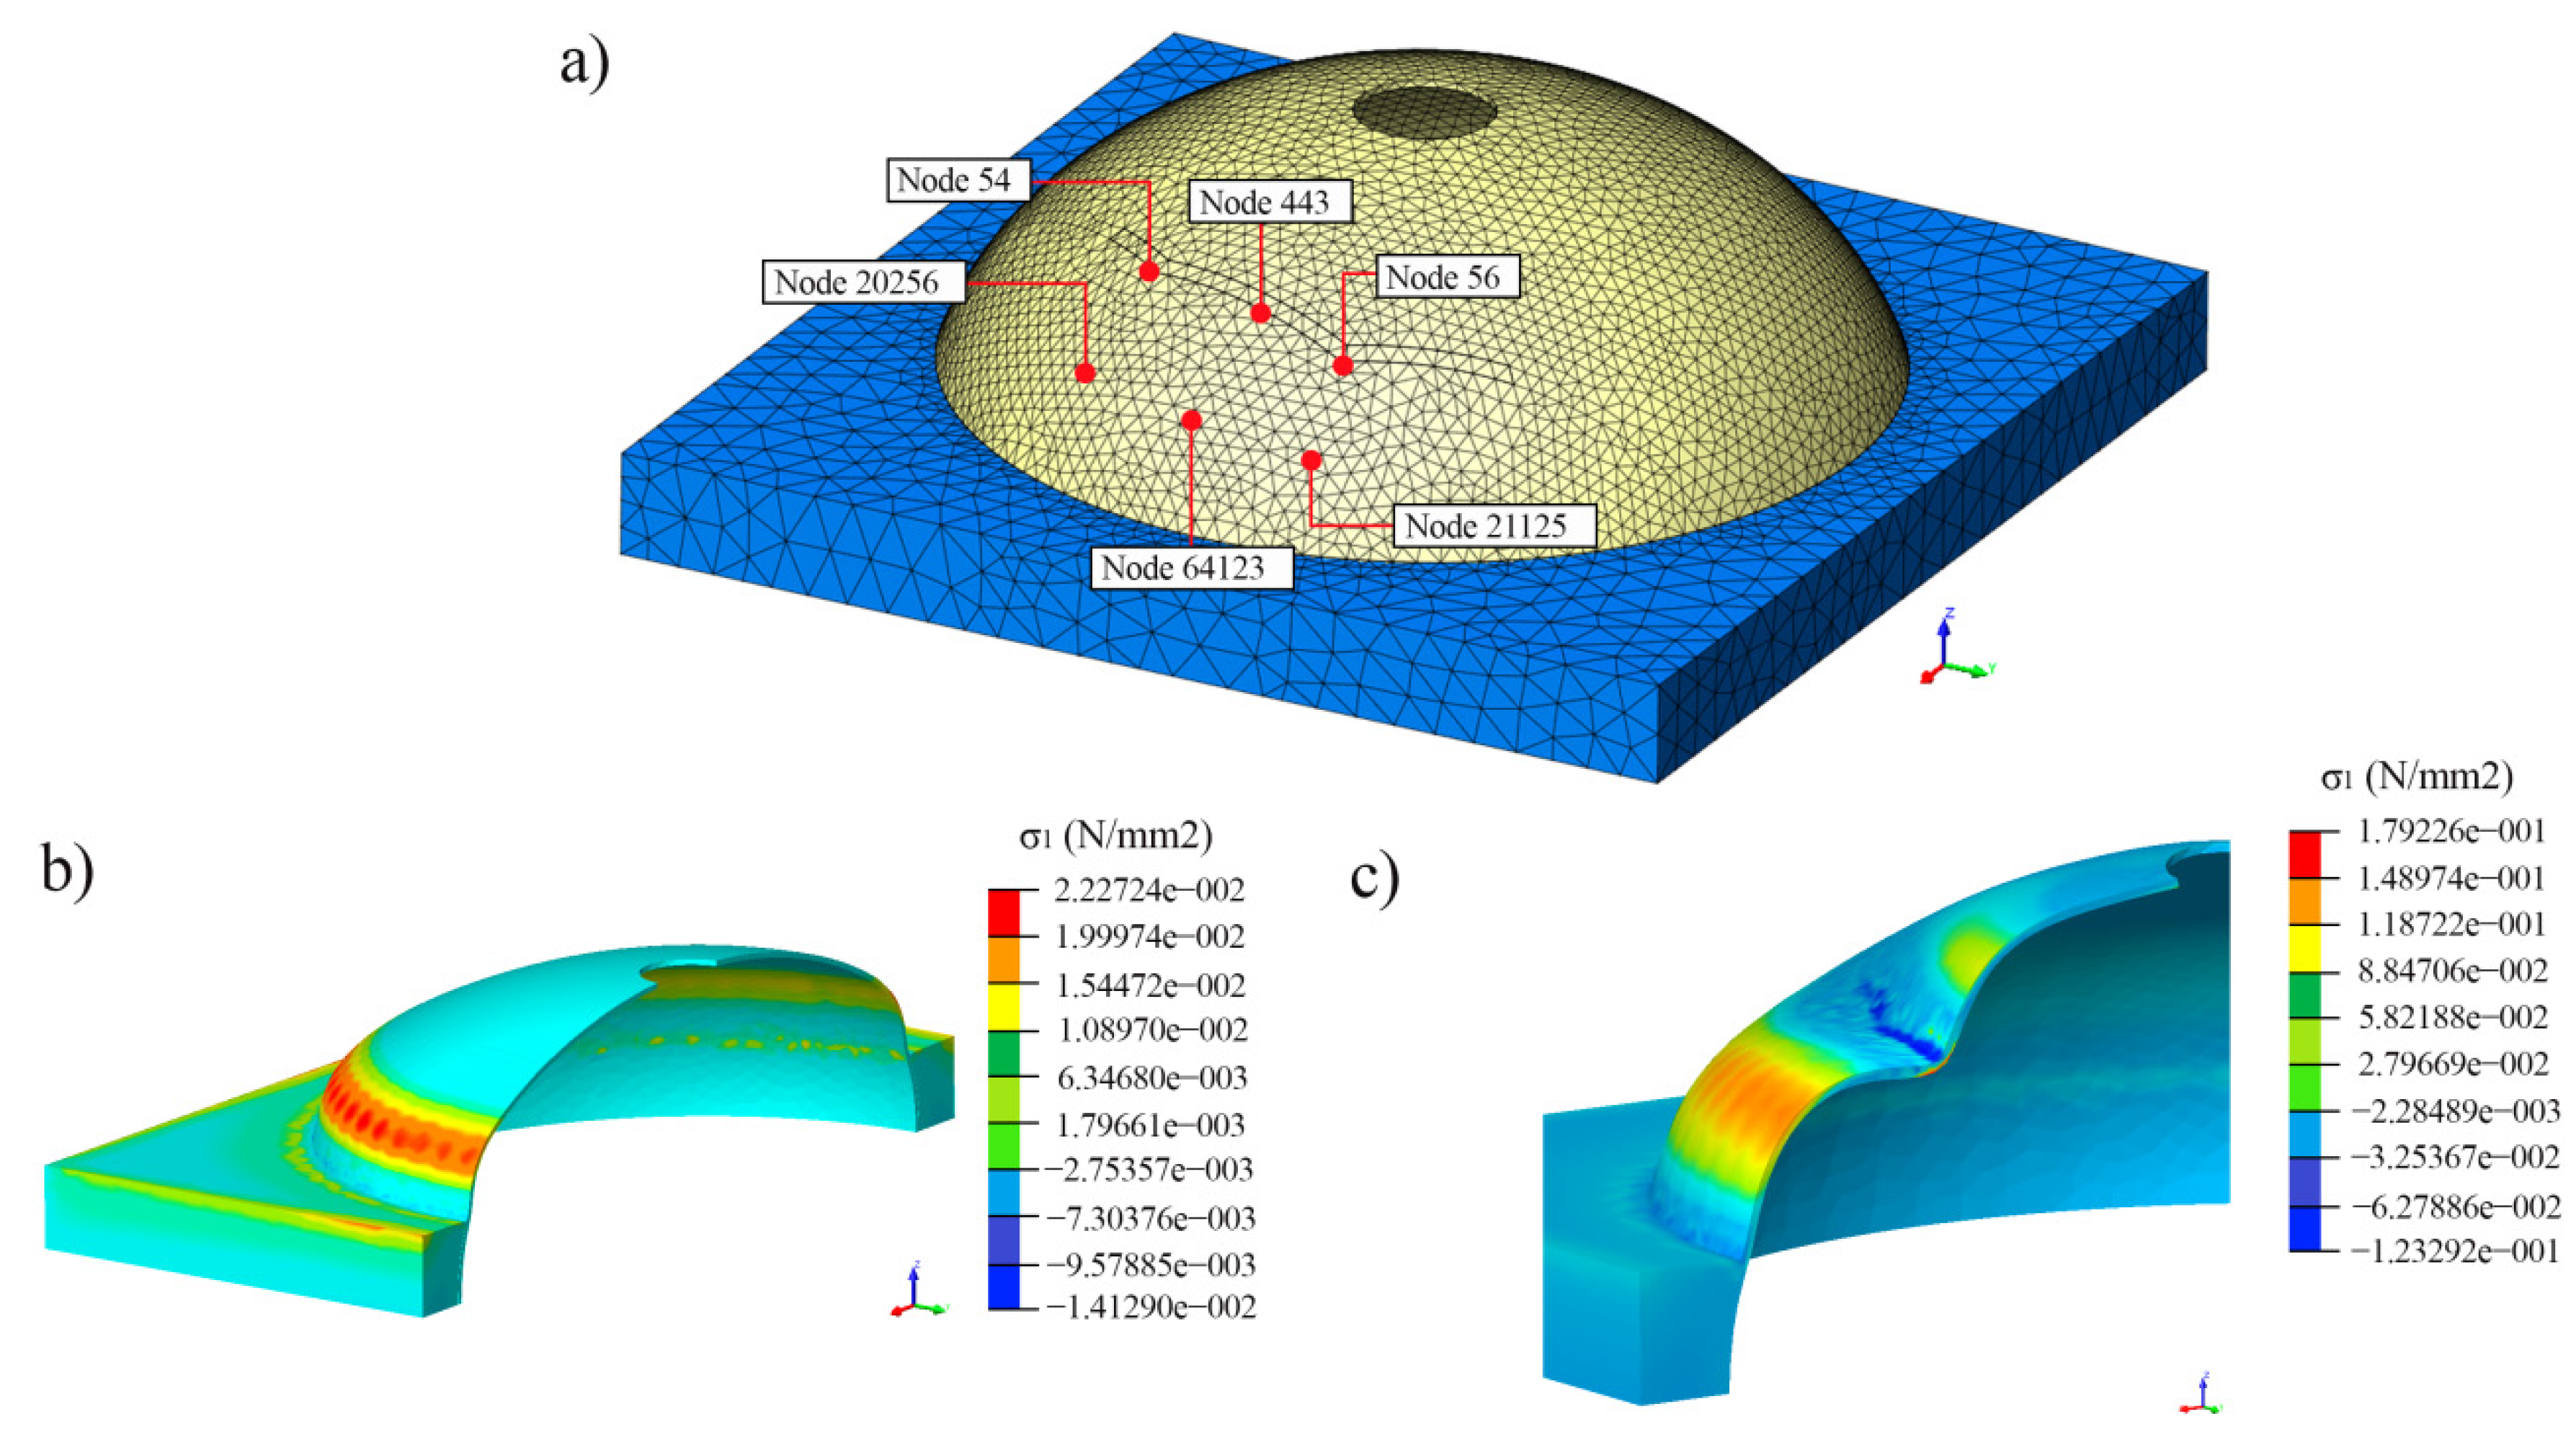
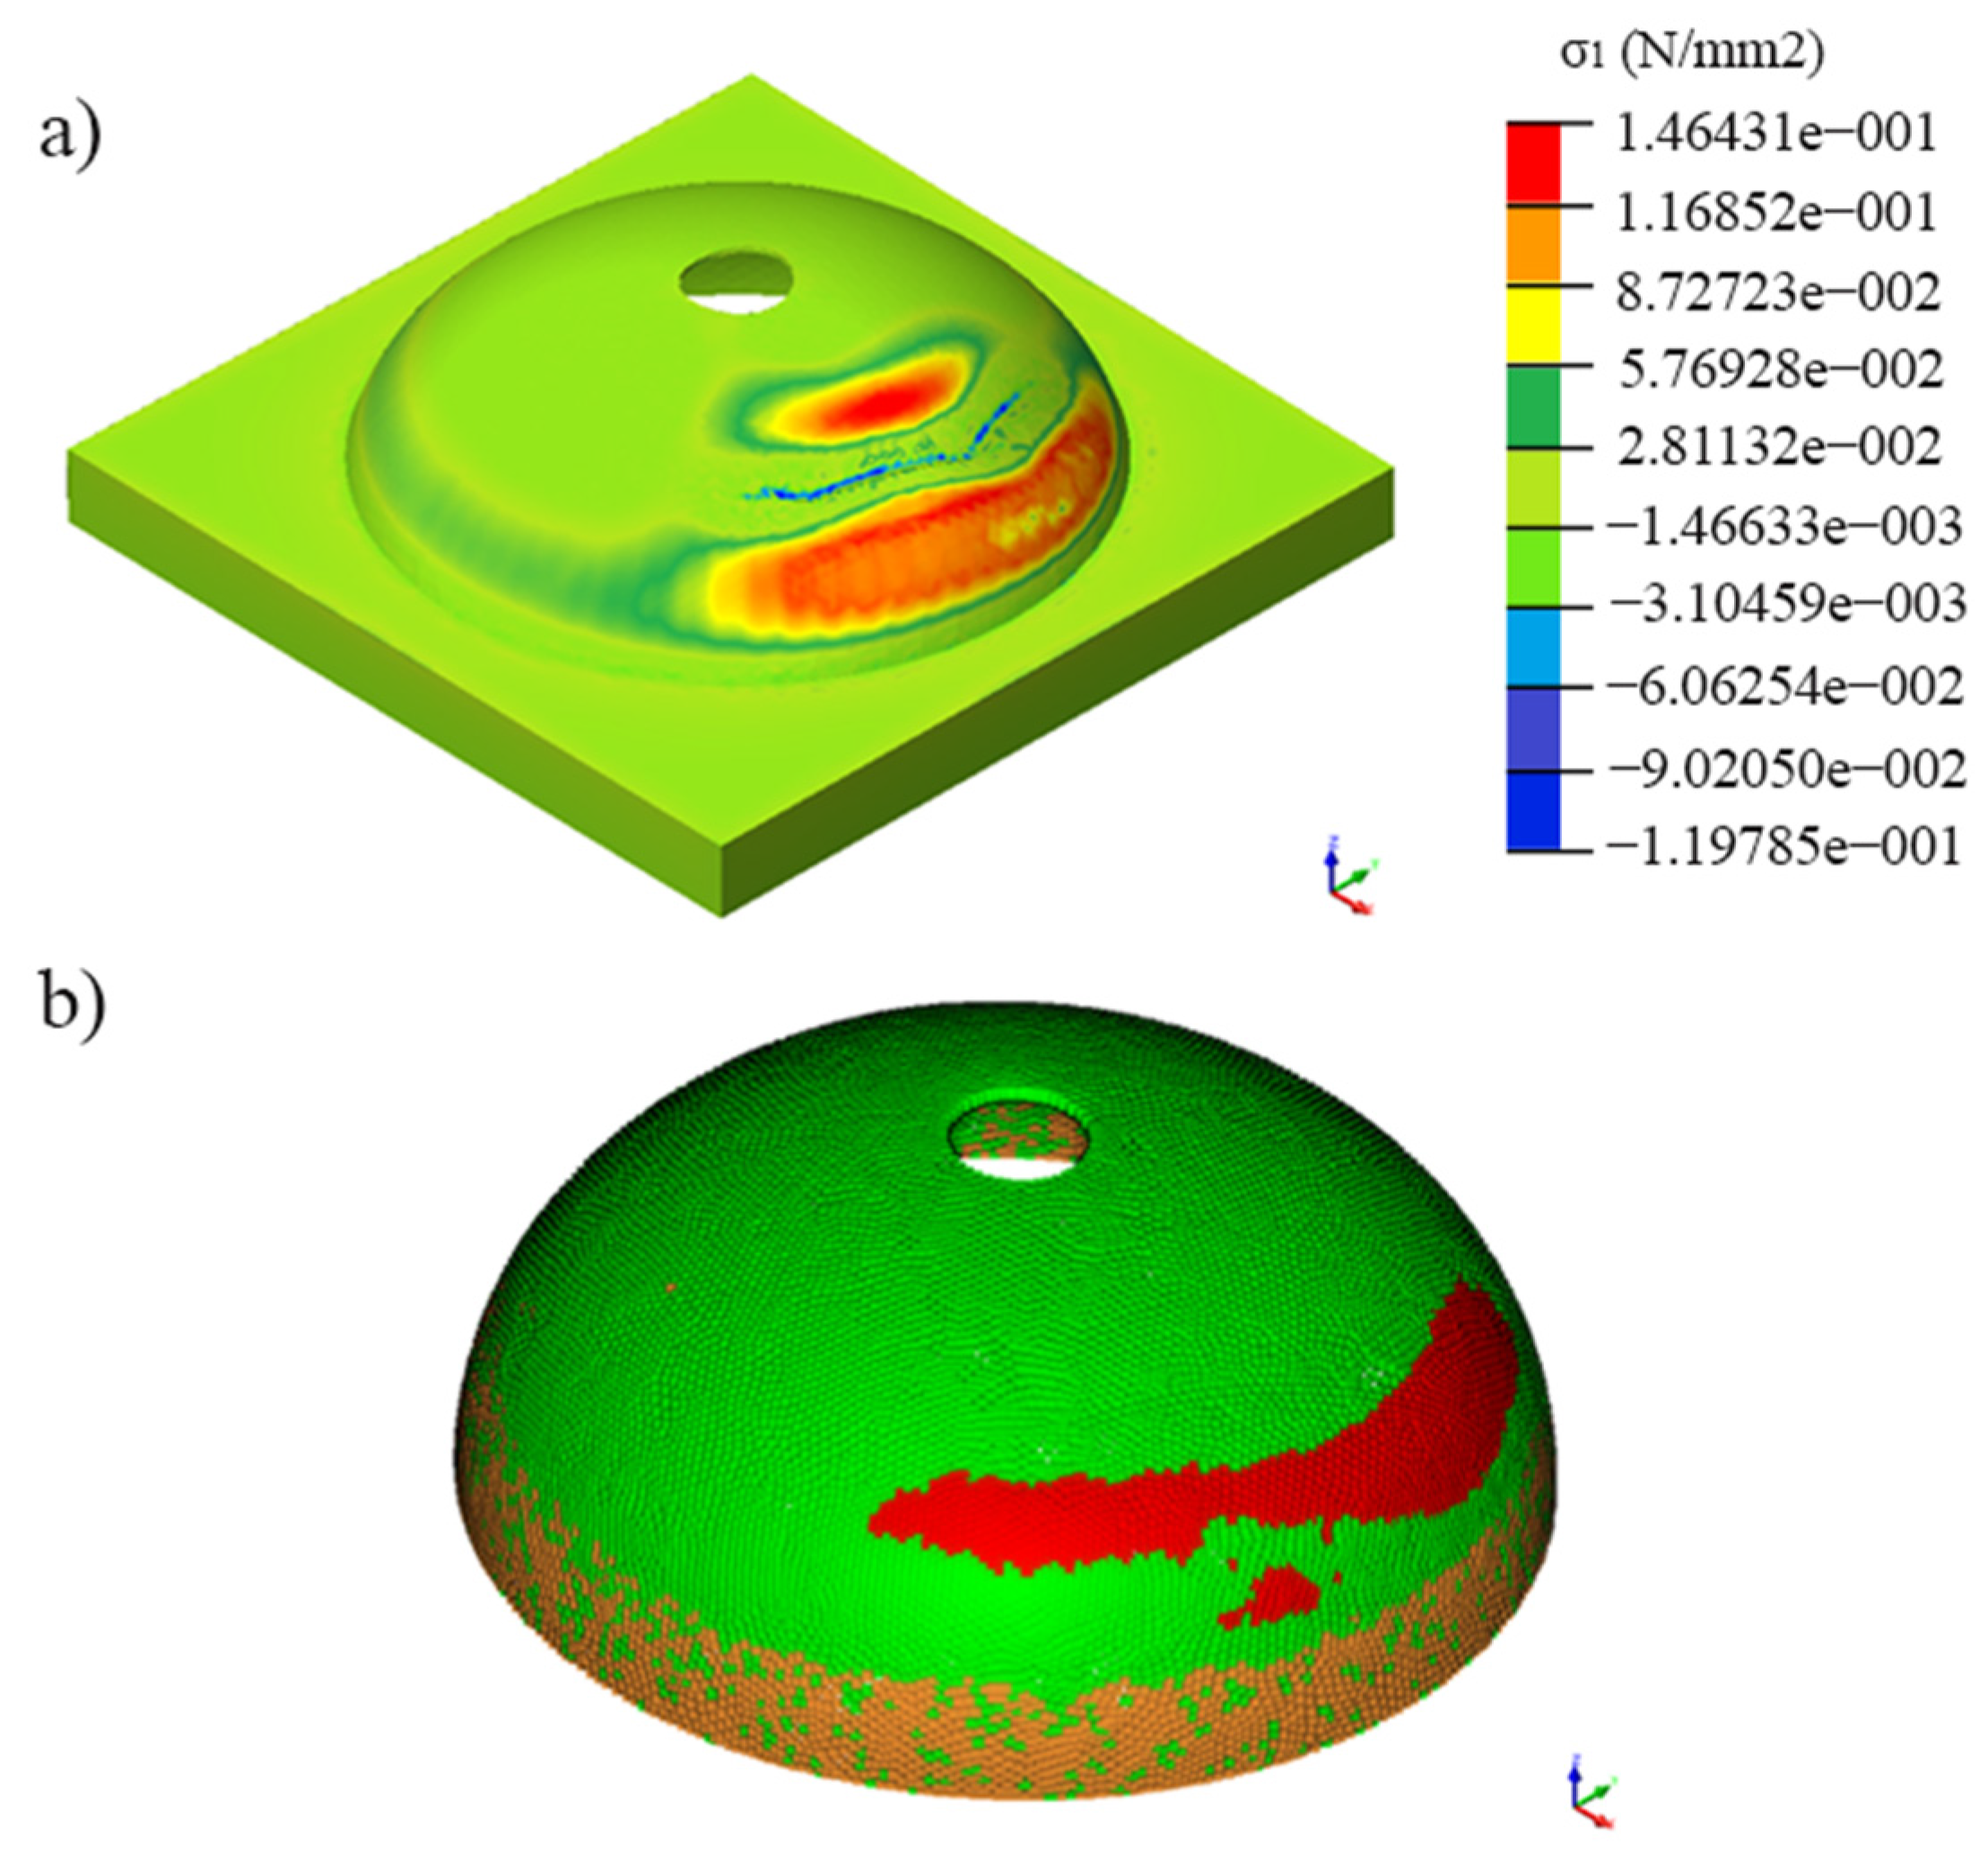
Figure 10.
(a) First principal stress distribution, expressed in N/mm2 of the updated model; (b) Geometrical accuracy, in terms of Local Hausdorff metric (LHms) of the updated model; in green, values where the geometrical model improves the results, in orange values where no improvements are carried out and in red, areas where the updated numerical model displays worse behavior.
Noteworthy is the presence of a red area (
Figure 10). The said phenomenon is associated with the presence of an offset in the spatial distribution of the plastic hinge in comparison to the photogrammetric one. Considering the results provided by the
GHms and
LHms indices (
Figure 10b) (
Table 7), a mild improvement in the geometrical similarity between the photogrammetric and numerical model (
Figure 9b) is observable compared with the initial conditions (
Figure 10a) and previous studies carried out on the dome [
16] (presence of an infill, independent oculus, and manual calibration of the mechanical properties).
On one hand, the obtained numerical results, with a value of GHms of 7.40%, are insufficient to study the current stability of the dome based on an initial state model. The discrepancies, derived from the large number of currently unknown variables, call for the use of additional sensors as well as additional experimental campaigns (in laboratory and in field tests).
On the other hand, the causes of the current damage and deformation correspond to the initial one: a local failure of the timber structure (south wing) could be the cause of pathological agents acting on the wood (moisture and biological agents).
In order to understand the current stability of the construction it is required to evaluate it with the actual deformation and damage (cracks). Motivated by this, and given the geometrical and radiometric properties provided by the SfM systems, a geometric strategy is defined below.
Table 7.
Comparison between expected and predicted displacement of the considered control nodes.
Table 7.
Comparison between expected and predicted displacement of the considered control nodes.
| Control Node | Displacement Obtained (mm) | Displacement Expected (mm) |
|---|
| 54 | 16.56 | 148.00 |
| 20256 | 22.80 | 46.00 |
| 56 | 26.10 | 198.00 |
| 21125 | 31.52 | 52.00 |
| 443 | 46.19 | 196.00 |
| 64123 | 38.92 | 25.00 |
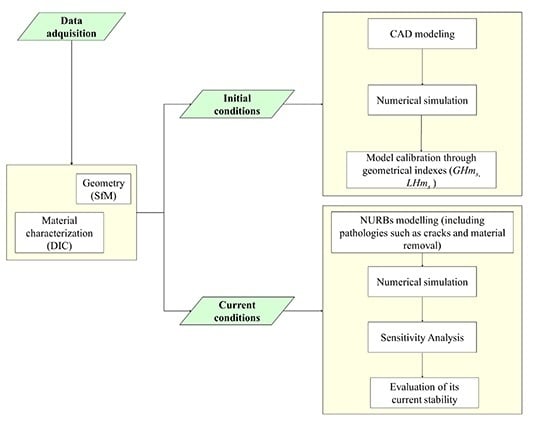
4.2. Analysis of the Current Stability of the Construction Based on a SfM and NURBs Approach
It should be stressed that the structural evaluation of historical constructions not only implies the assessment of the damage’s causes, but also requires a thorough understanding of the current stability (considering the actual deformation and damage), in order to take efficient restoration actions on the construction and to predict its integrity in case of different events (e.g., earthquakes). With the aim of improving the knowledge of the current stability, with respect to previous studies (
Section 3.3 and [
16]), a new approach is needed.
Although the point clouds obtained by the previously defined SfM approach, rich in geometric (density and accuracy) and radiometric (photorealistic texture) features, accurately represent the actual state of the construction, it is required to have additional strategies capable of exporting these properties into a numerical environment. The resulting mesh (triangulation of the SfM point cloud) has significant shortcomings to be considered as a suitable CAD/CAM model. Among its deficiencies, the following stand out [
37]: (i) High density/resolution, which implies a large number of triangles and (ii) inadequate shapes.
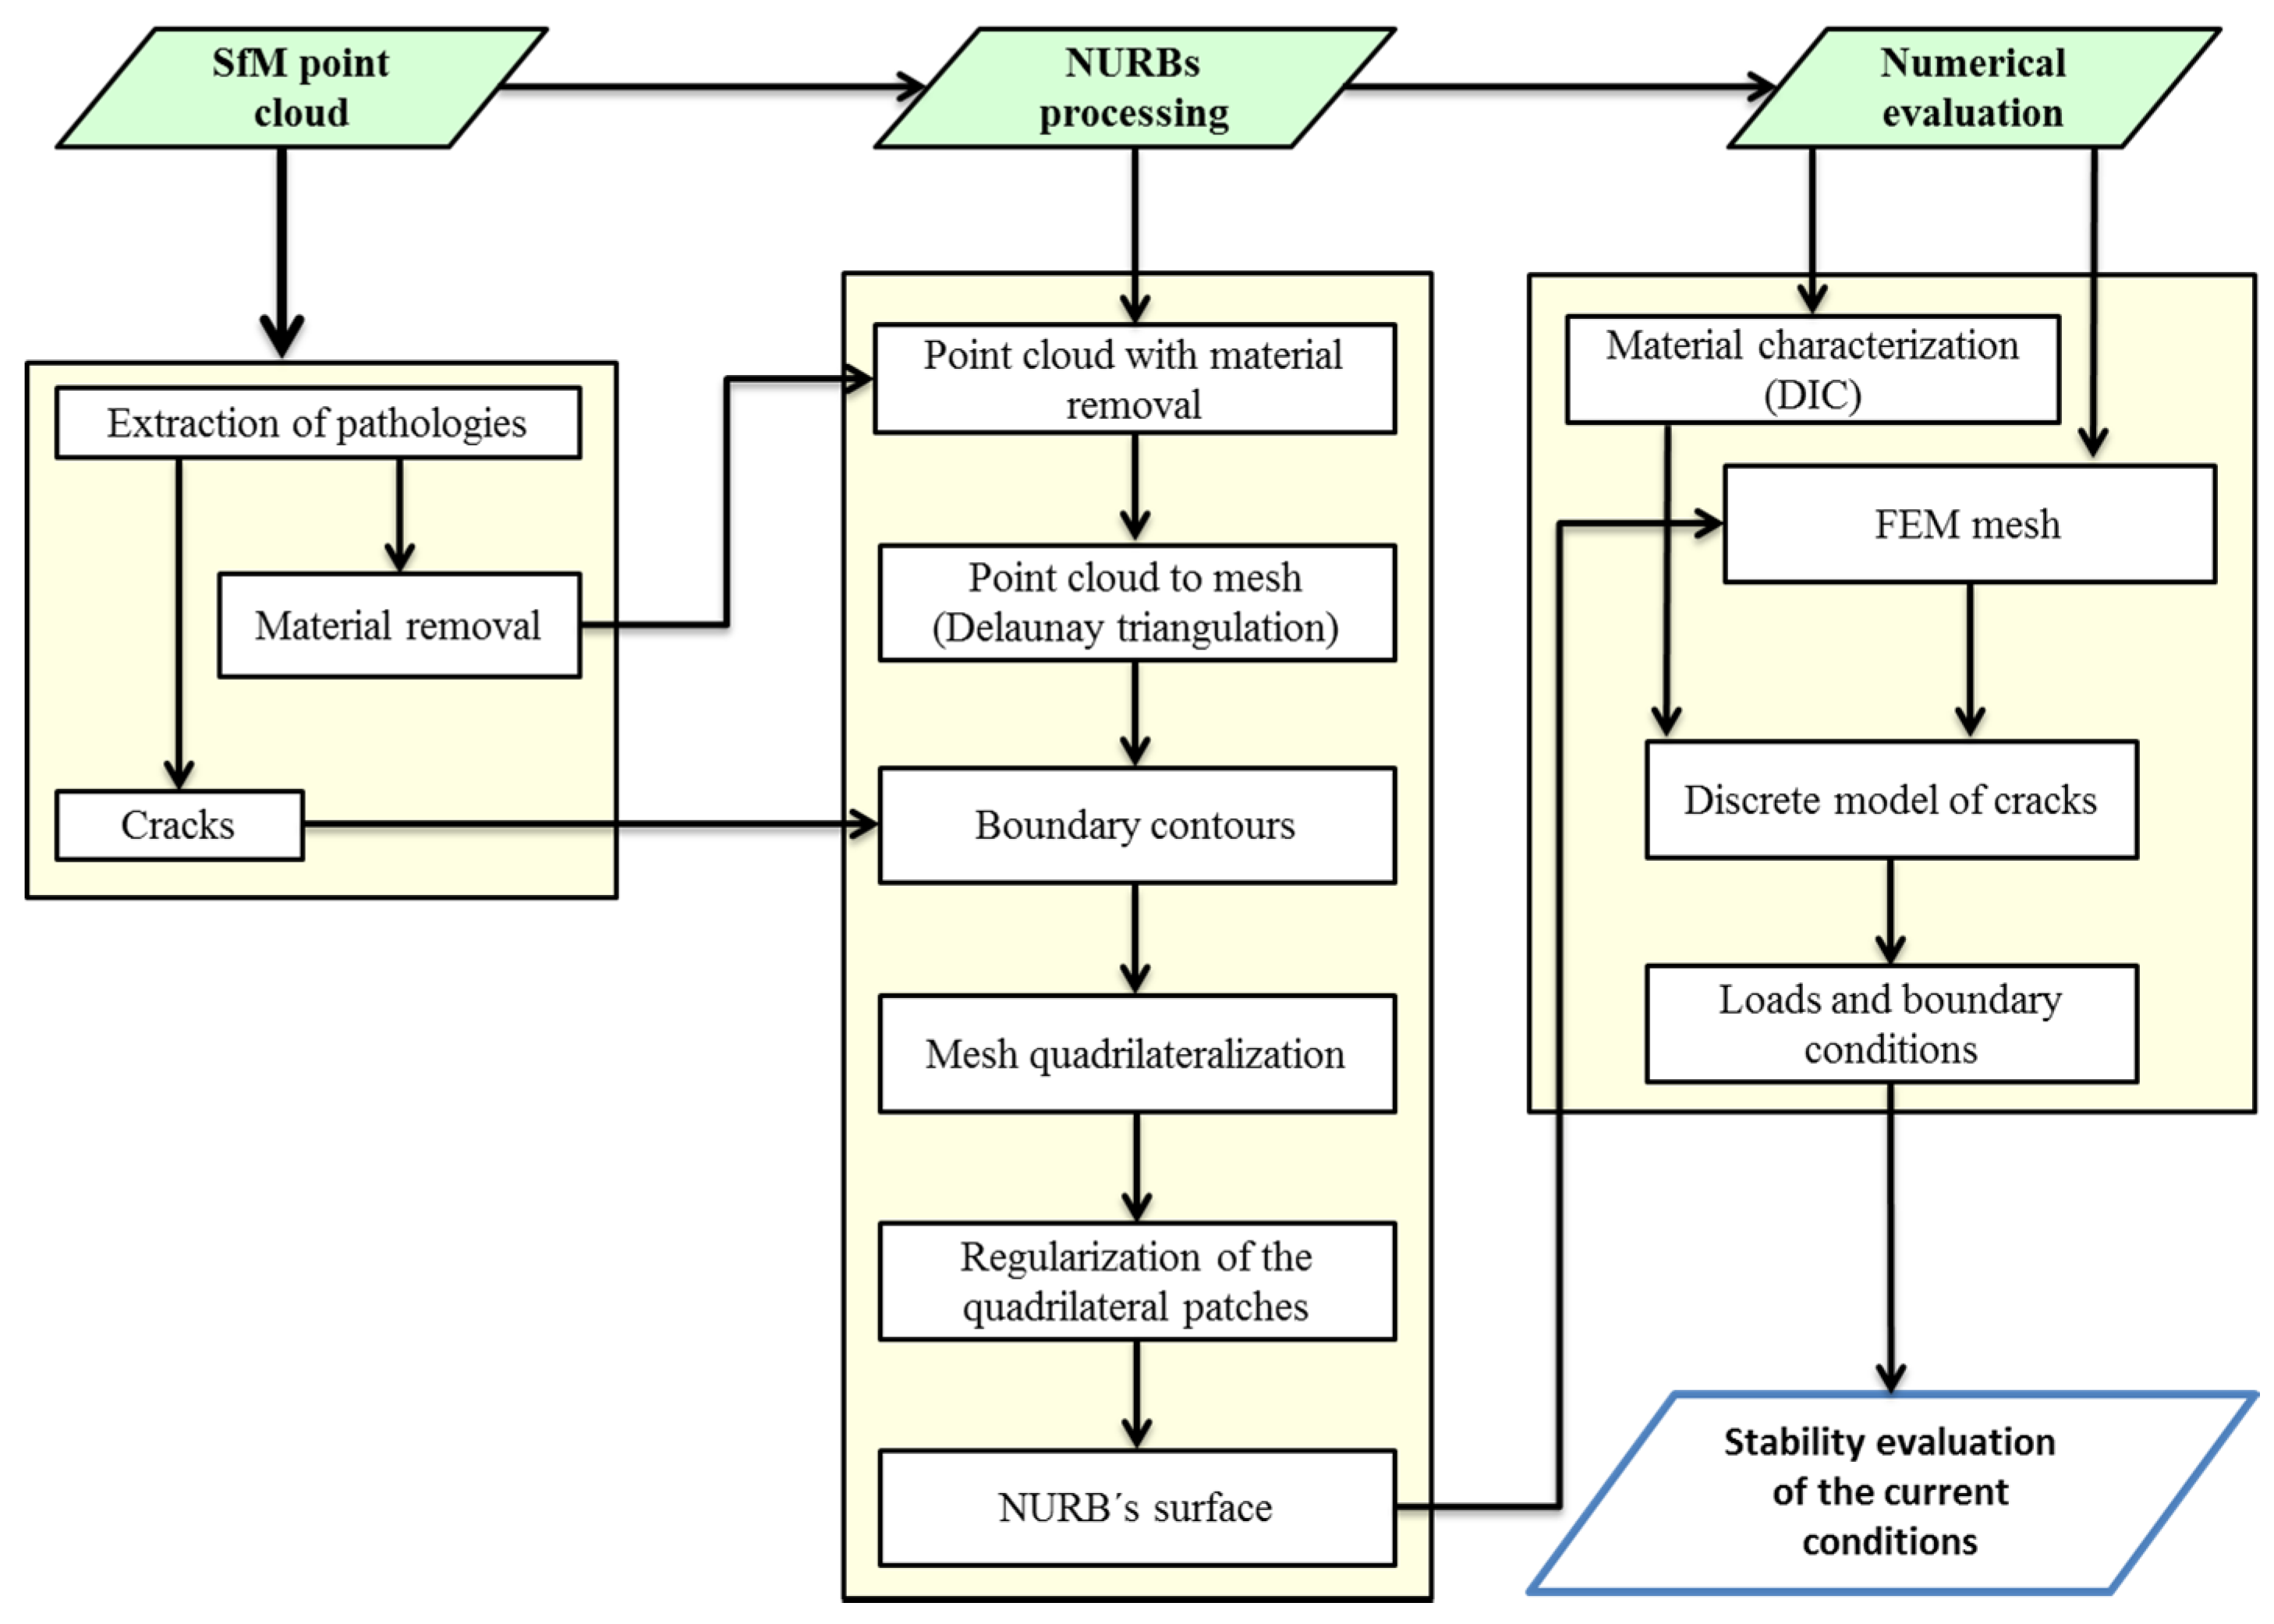
Under the said framework, a methodology able to exploit these features based on the Non-Uniform Rational B-Splines (NURBs) and enhanced by the integration of structural pathologies (such as cracks and lack of material) is proposed. It follows the workflow shown below (
Figure 11).
Figure 11.
Proposed workflow for the study of the current stability of the construction.
Figure 11.
Proposed workflow for the study of the current stability of the construction.
Considering the point cloud as the starting point, this product is firstly meshed by a standard Delaunay triangulation. Usually, these meshes present a non-manifold structure, which implies a low quality product with non-natural triangles which hinder the NURBs’ generation. In order to minimize this drawback we use a topological reconstruction, which generates a maniflod mesh, based on the approach defined by [
38].
Once the mesh has been correctly defined, a region clustering (boundary contours) was carried out, comprising two critical stages. In a first stage the boundary vertex (limits of the construction, lack of material and the absence of an oculus piece) of the mesh are extracted. Later, in a second stage, the cracks are integrated into these boundary contours, through a projection of the observed crack path on the SfM point cloud, as established [
9].
After that, a correct representation of these regions by means of NURBS patches is required. For this purpose and in order to build a regular base on which to correctly estimate the parameters of the different regions, a quadrilaterization of the mesh is carried out. This procedure is based on the combination of Morse theory and Spectral mesh analysis according to [
37]. This methodology guarantees a complete quadrilateral description of the mesh, with a C
1 (tangential continuity) between neighboring patches, ensuring a continuity along the edges.
Since the construction’s surface needs to be fitted using different NURBs regions (quadrilaterial patches), a regularization process of these regions is necessary. This procedure comprises several steps [
37]: (i) selection of one random border in the considered path and its opposite; (ii) border’s regularization using B-Splines with a lambda density; and (iii) matching between points by means of the Fast Marching Method.
Finally, the points obtained by the regularization procedure are used as control points to fit each quadrilateral path to a NURBs’ surface. It is worth mentioning, that, in construction elements such as arches, vaults or domes, the acquisition of its extrados (as a point cloud) is not possible in most of the cases, due to the presence of several setbacks (e.g., presence of infill, poor lighting conditions or lack of accessibility). Therefore, this previously shown strategy restricted the analysis of such constructions with the membrane theory (Mindlin-Reissner or Kirchhoff-Love theories). These theories limit the geometry of the numerical model’s different elements to a minimum recommended size of ten times the construction’s thickness. It implies as well the waste of the geometrical potentialities offered by the previously shown methodology.
Based on what is remarked above, a complementary strategy is proposed; able to estimate the construction’s extrados based on its intrados geometry. This methodology is made up of the following stages: (i) decorative elements removal; (ii) normal estimation of the points by means of eigenvalue analysis of the covariance matrix [
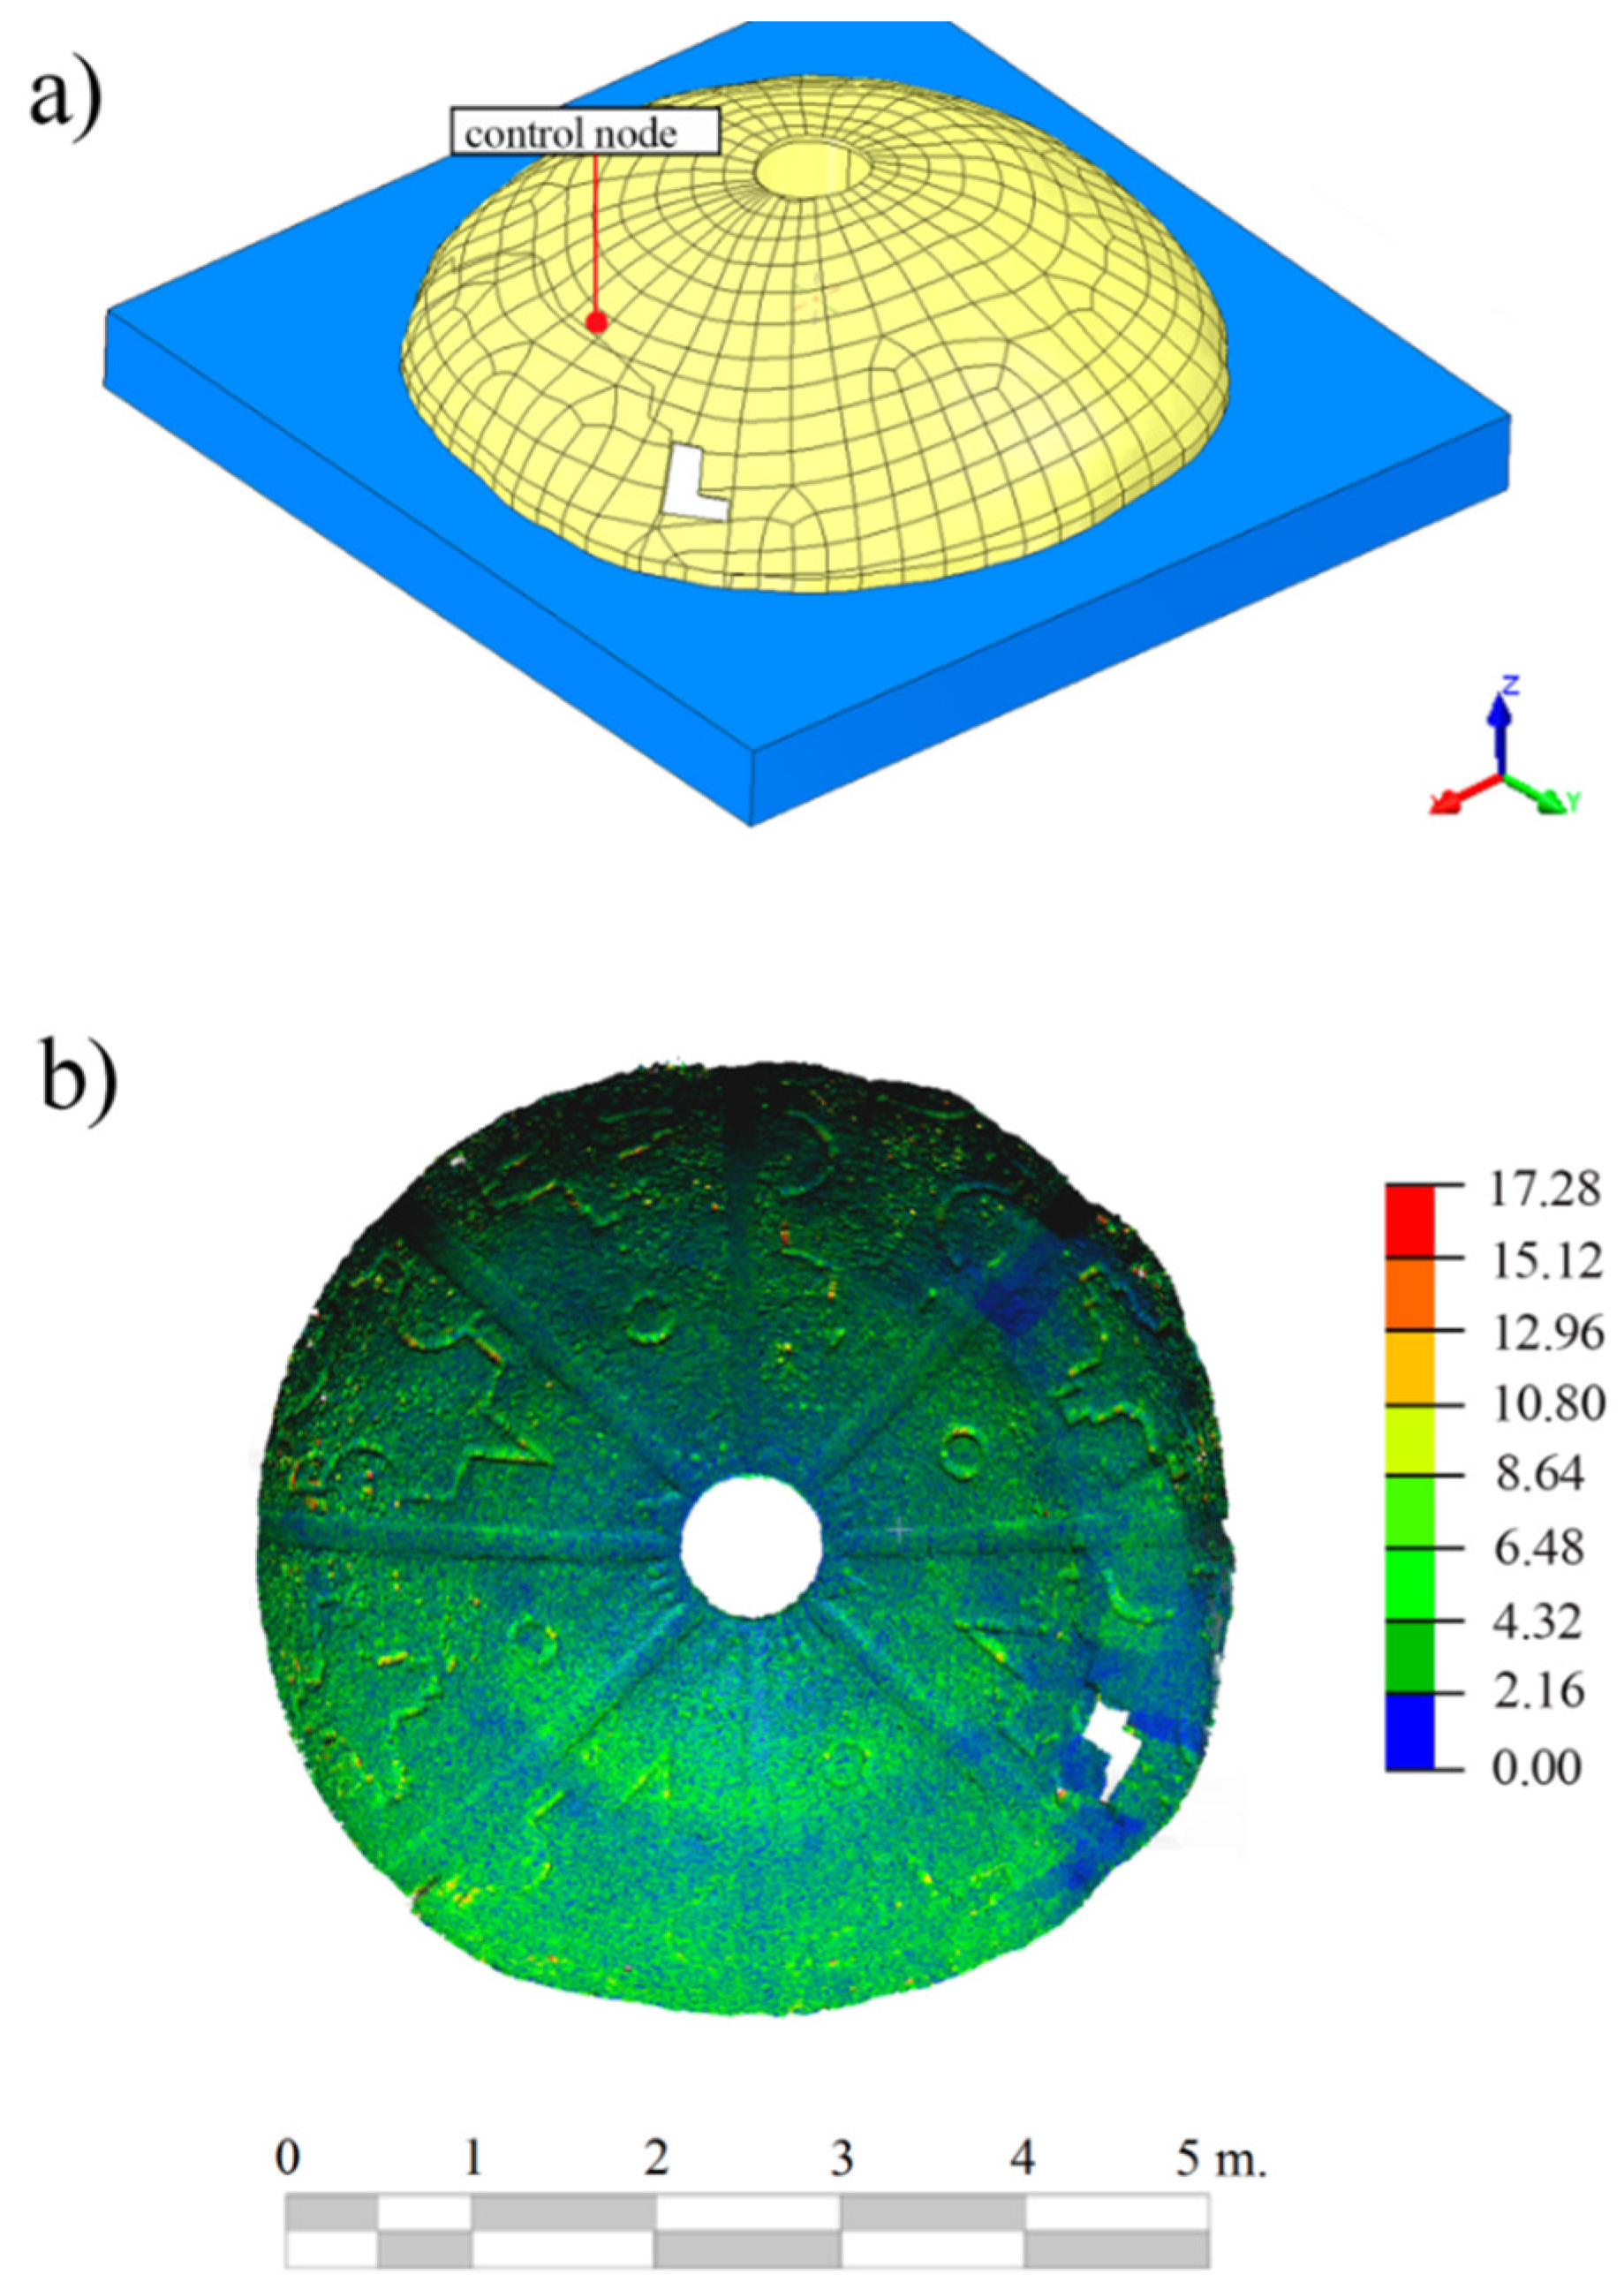
39]; (iii) translation of each point along the normal direction (with a value equivalent to the construction’s thickness); (iv) point cloud meshing based on the Poisson approach and (v) projection of the cracks along its orthogonal direction. As a result, an accurate geometrical model of the construction is obtained with which to evaluate its actual stability (
Figure 12).
Regarding the numerical aspect, and for the present case study, an incremental static non-linear FEM was carried out [
40]. The material properties and the modelling strategy remain the same as those estimated for the initial model (considering the most appropriate ones) in
Section 3.3, including a discrete model of the cracks.
For the present case study, this cracking is modelled considering the residual transversal stiffness (shear strength) through Equation (8). Concerning the normal stiffness, only a contribution in compression was considered, dismissing any contribution to the tensile regime according to Equation (9) (
Table 8).
where
Kt,c and
Kn,c represent the tangential and normal stiffness respectively;
Gb and
Gm the shear modulus of brick and mortar, respectively;
Eb and
Em the Young modulus of brick and mortar, respectively;
hm the mortar thickness; and
βcrack the shear retention factor.
Figure 12.
(a) Isometric view of the considered mesh model; (b) Discrepancies, expressed in mm, between the Non-Uniform Rational B-Splines (NURBs) and the photogrammetric models.
Figure 12.
(a) Isometric view of the considered mesh model; (b) Discrepancies, expressed in mm, between the Non-Uniform Rational B-Splines (NURBs) and the photogrammetric models.
Table 8.
Mechanical properties considered for the interaction between macroblocks (cracks).
Table 8.
Mechanical properties considered for the interaction between macroblocks (cracks).
| Mechanical Properties of the Cracks |
|---|
| hm (mm) | Mortar thickness | 15.00 |
| Gb (N/mm2) | Brick’s shear modulus | 1.27 |
| Gm (N/mm2) | Mortar’s shear modulus | 0.47 |
| βcrack | Shear retention factor | βc,m |
| Kt,c (N/mm3) | Tangential stiffness | 121.88 |
| Kn,c (N/mm3) | Normal stiffness (compression) | 49.74 |
Finally a mesh for the numerical simulation is provided, with a total of 45,350 elements, clustered in: 45,196 high order solid elements and 154 high order interface elements.
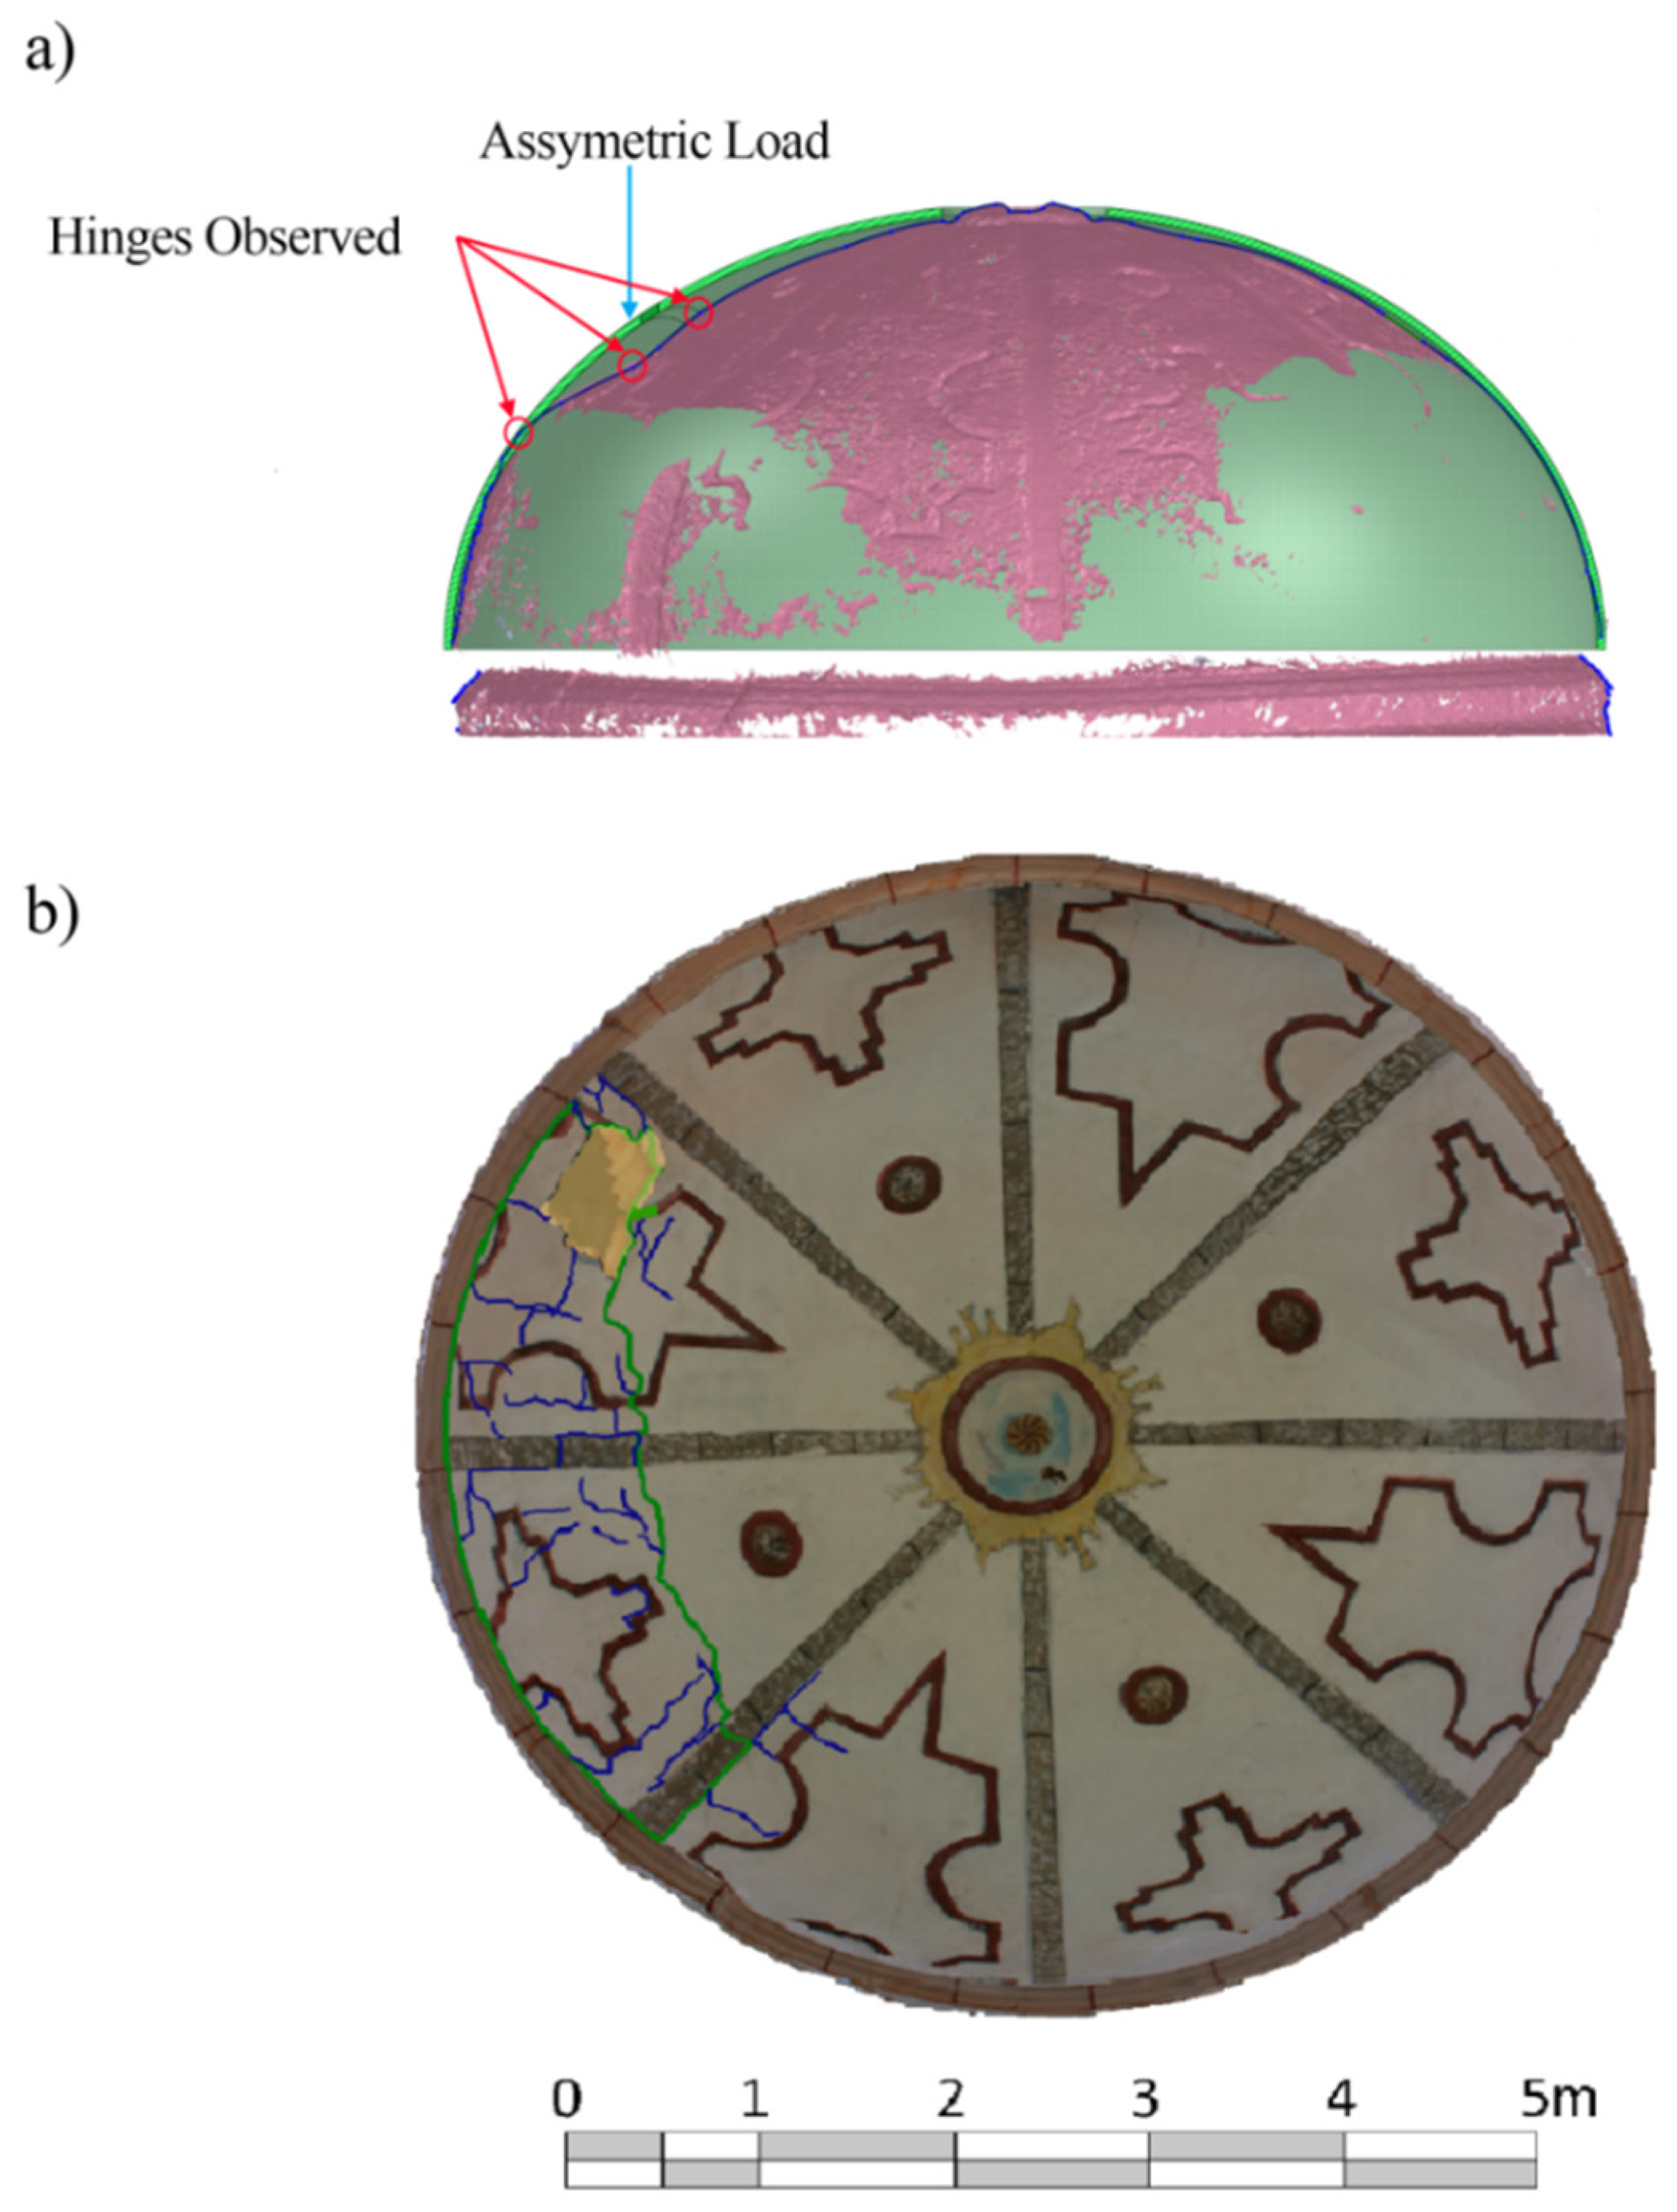
For the stability analysis, all the loads acting on the dome (self-weight, infill pressure and asymmetric load) were considered. Afterwards, the estimated safety factor was established as the ratio between the current load and the collapse load obtained in the numerical simulation (
Figure 13).
According to the study carried out in the
Section 4.1 and the inspection of the SfM point cloud, the collapse mechanisms are mainly due to the formation of plastic hinges in the tensile regime.
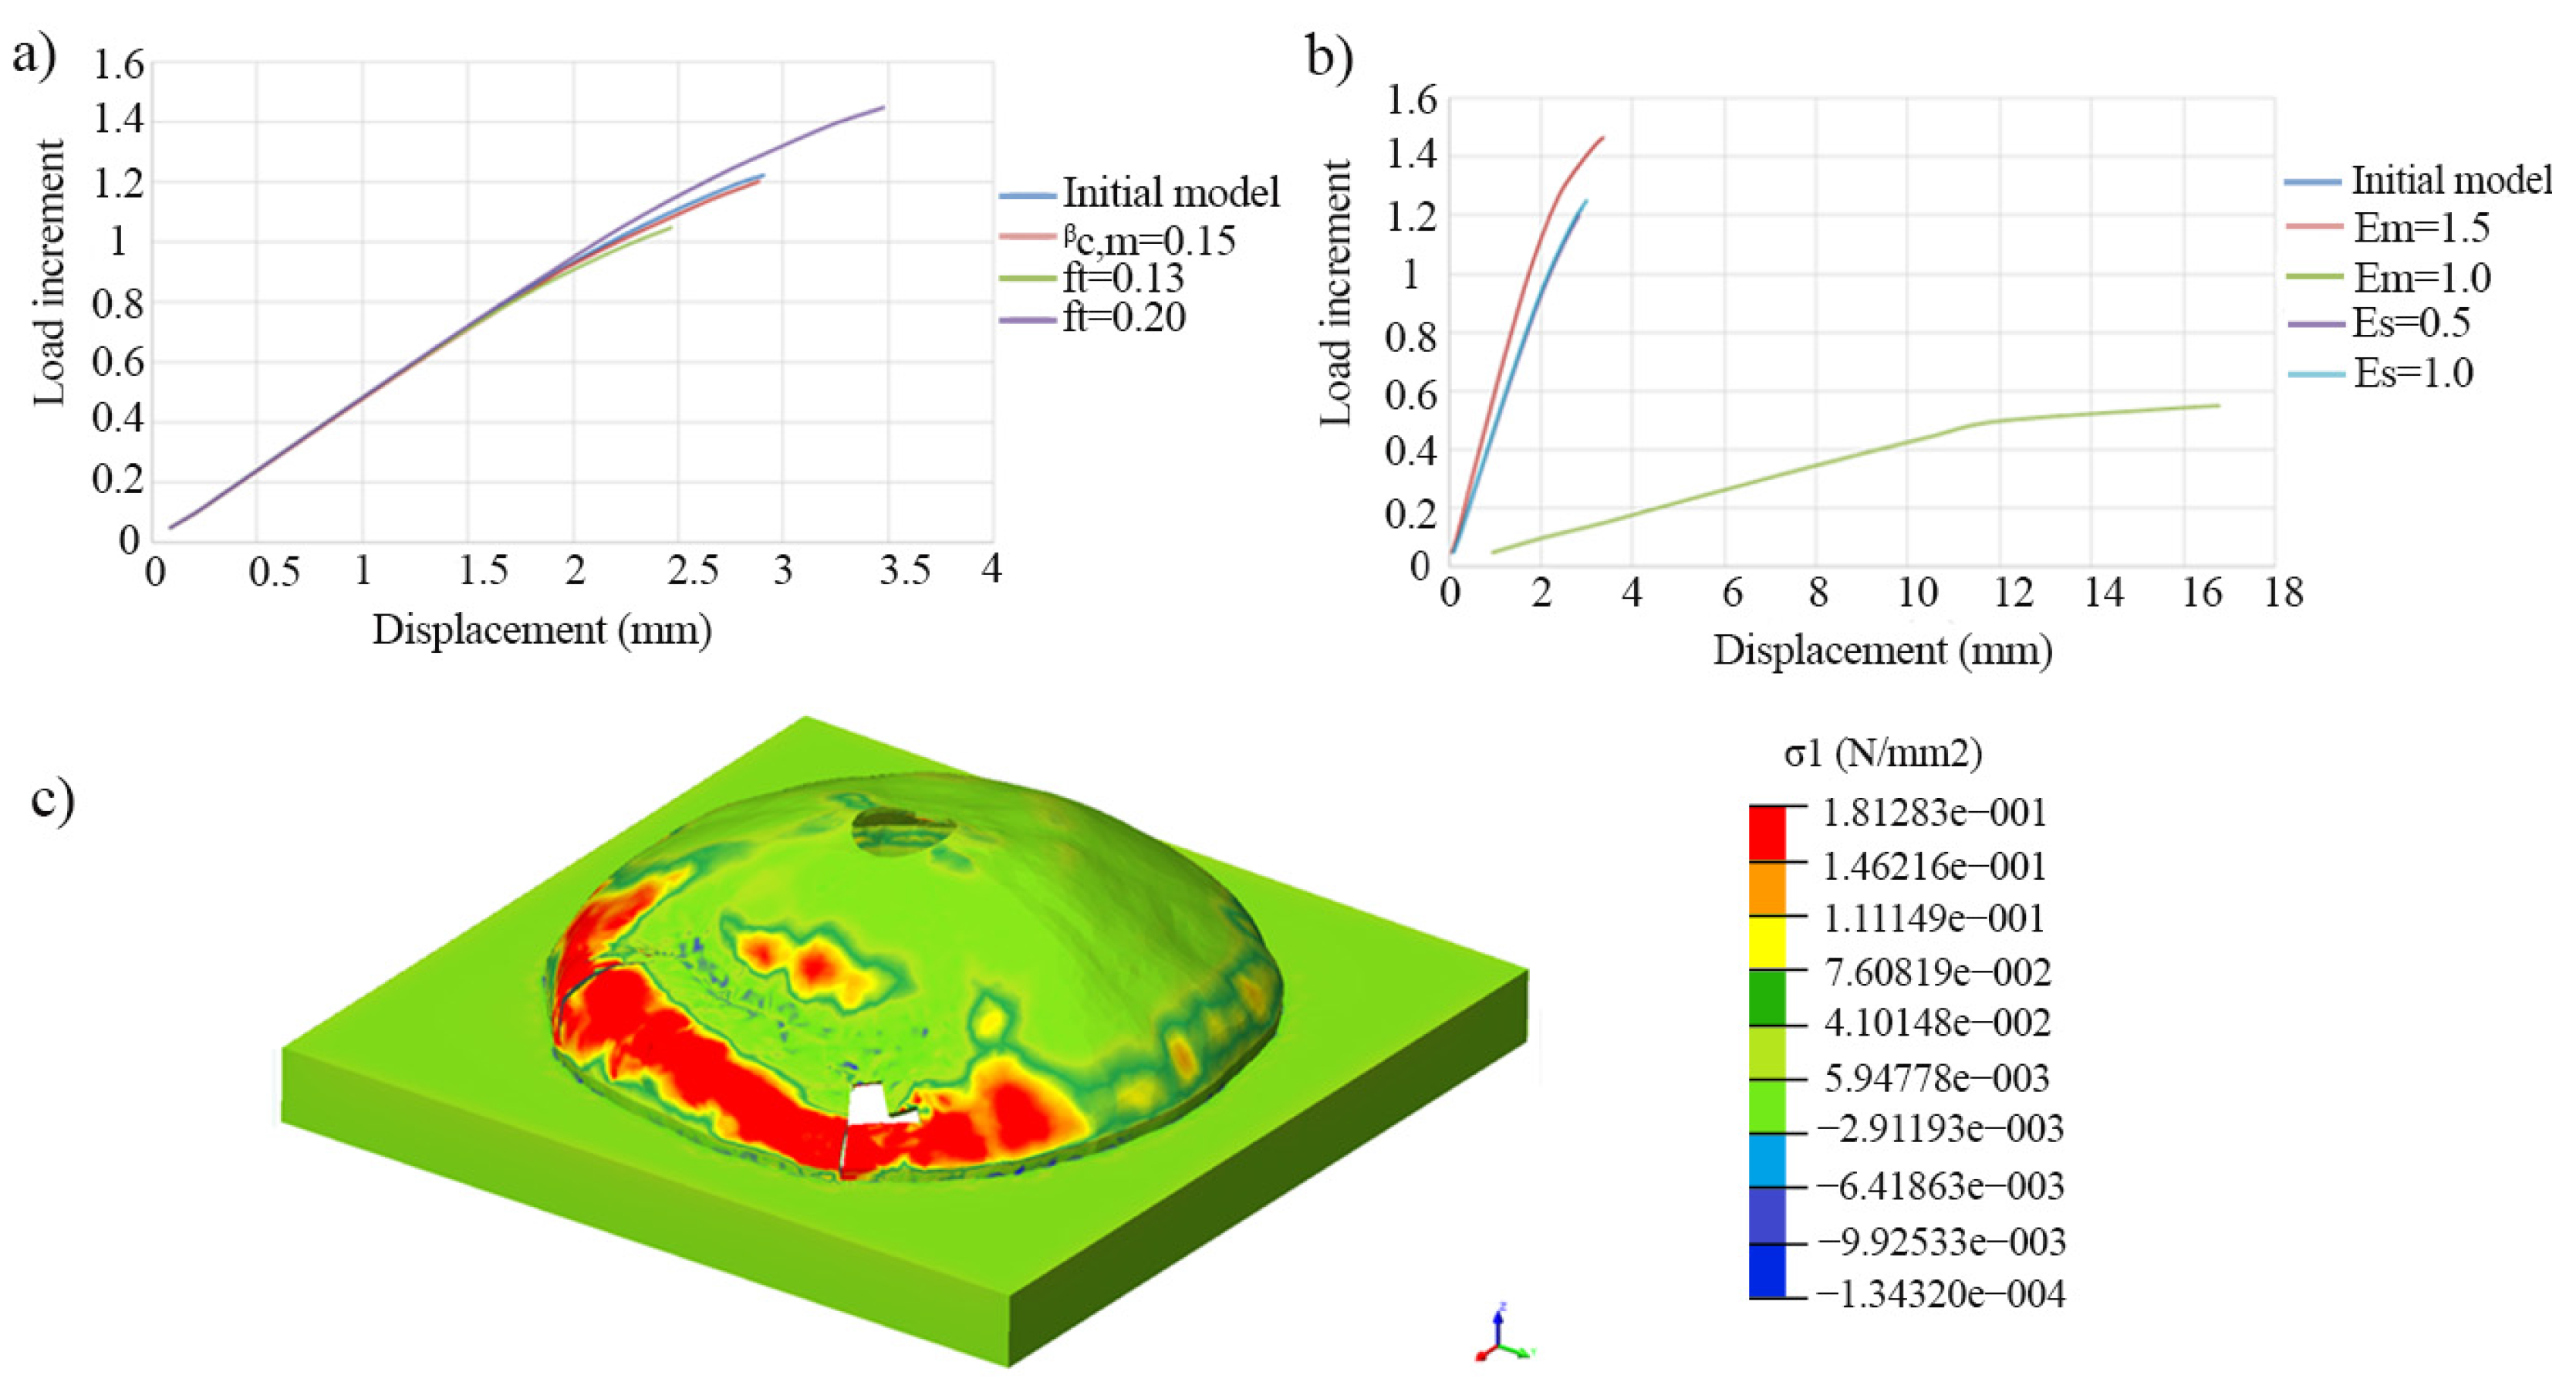
The complexity of the model and the uncertainties associated with the variables (e.g., soil properties) require the study of the influence of different mechanical variables in the global stability of the construction, through parametrics analysis.
For these analyses, only the most important mechanical properties (to the tensile regime) were considered, namely: (i) Young modulus; (ii) tensile strength; and (iii) shear retention factor.
It can be observed, that the stability of the dome is mainly conditioned by the mechanical properties of the masonry, rather than the mechanical properties of the infill. Therefore, a safety factor (considering the initial mechanical properties) of 1.23 was established (
Figure 13c).
However, it is worth mentioning that only the most important cracks were taken into account. By following a discrete strategy, minor and diffuse cracks were not considered. For this reason further investigation, integrating complementary approaches is necessary in order to obtain a better estimation of the actual stability.
Figure 13.
(a) Parametric analysis of different tensile strengths and shear retention factors; (b) Parametric analysis of different masonry and infill’s Young modulus; (c) Maximum principal stress (σ1), expressed in N/mm2, at collapse of the initial considered model.
Figure 13.
(a) Parametric analysis of different tensile strengths and shear retention factors; (b) Parametric analysis of different masonry and infill’s Young modulus; (c) Maximum principal stress (σ1), expressed in N/mm2, at collapse of the initial considered model.


