
Using Remotely-Sensed Land Cover and Distribution Modeling to Estimate Tree Species Migration in the Pacific Northwest Region of North America

 ,
,
Abstract
:
1. Introduction
2. Methods
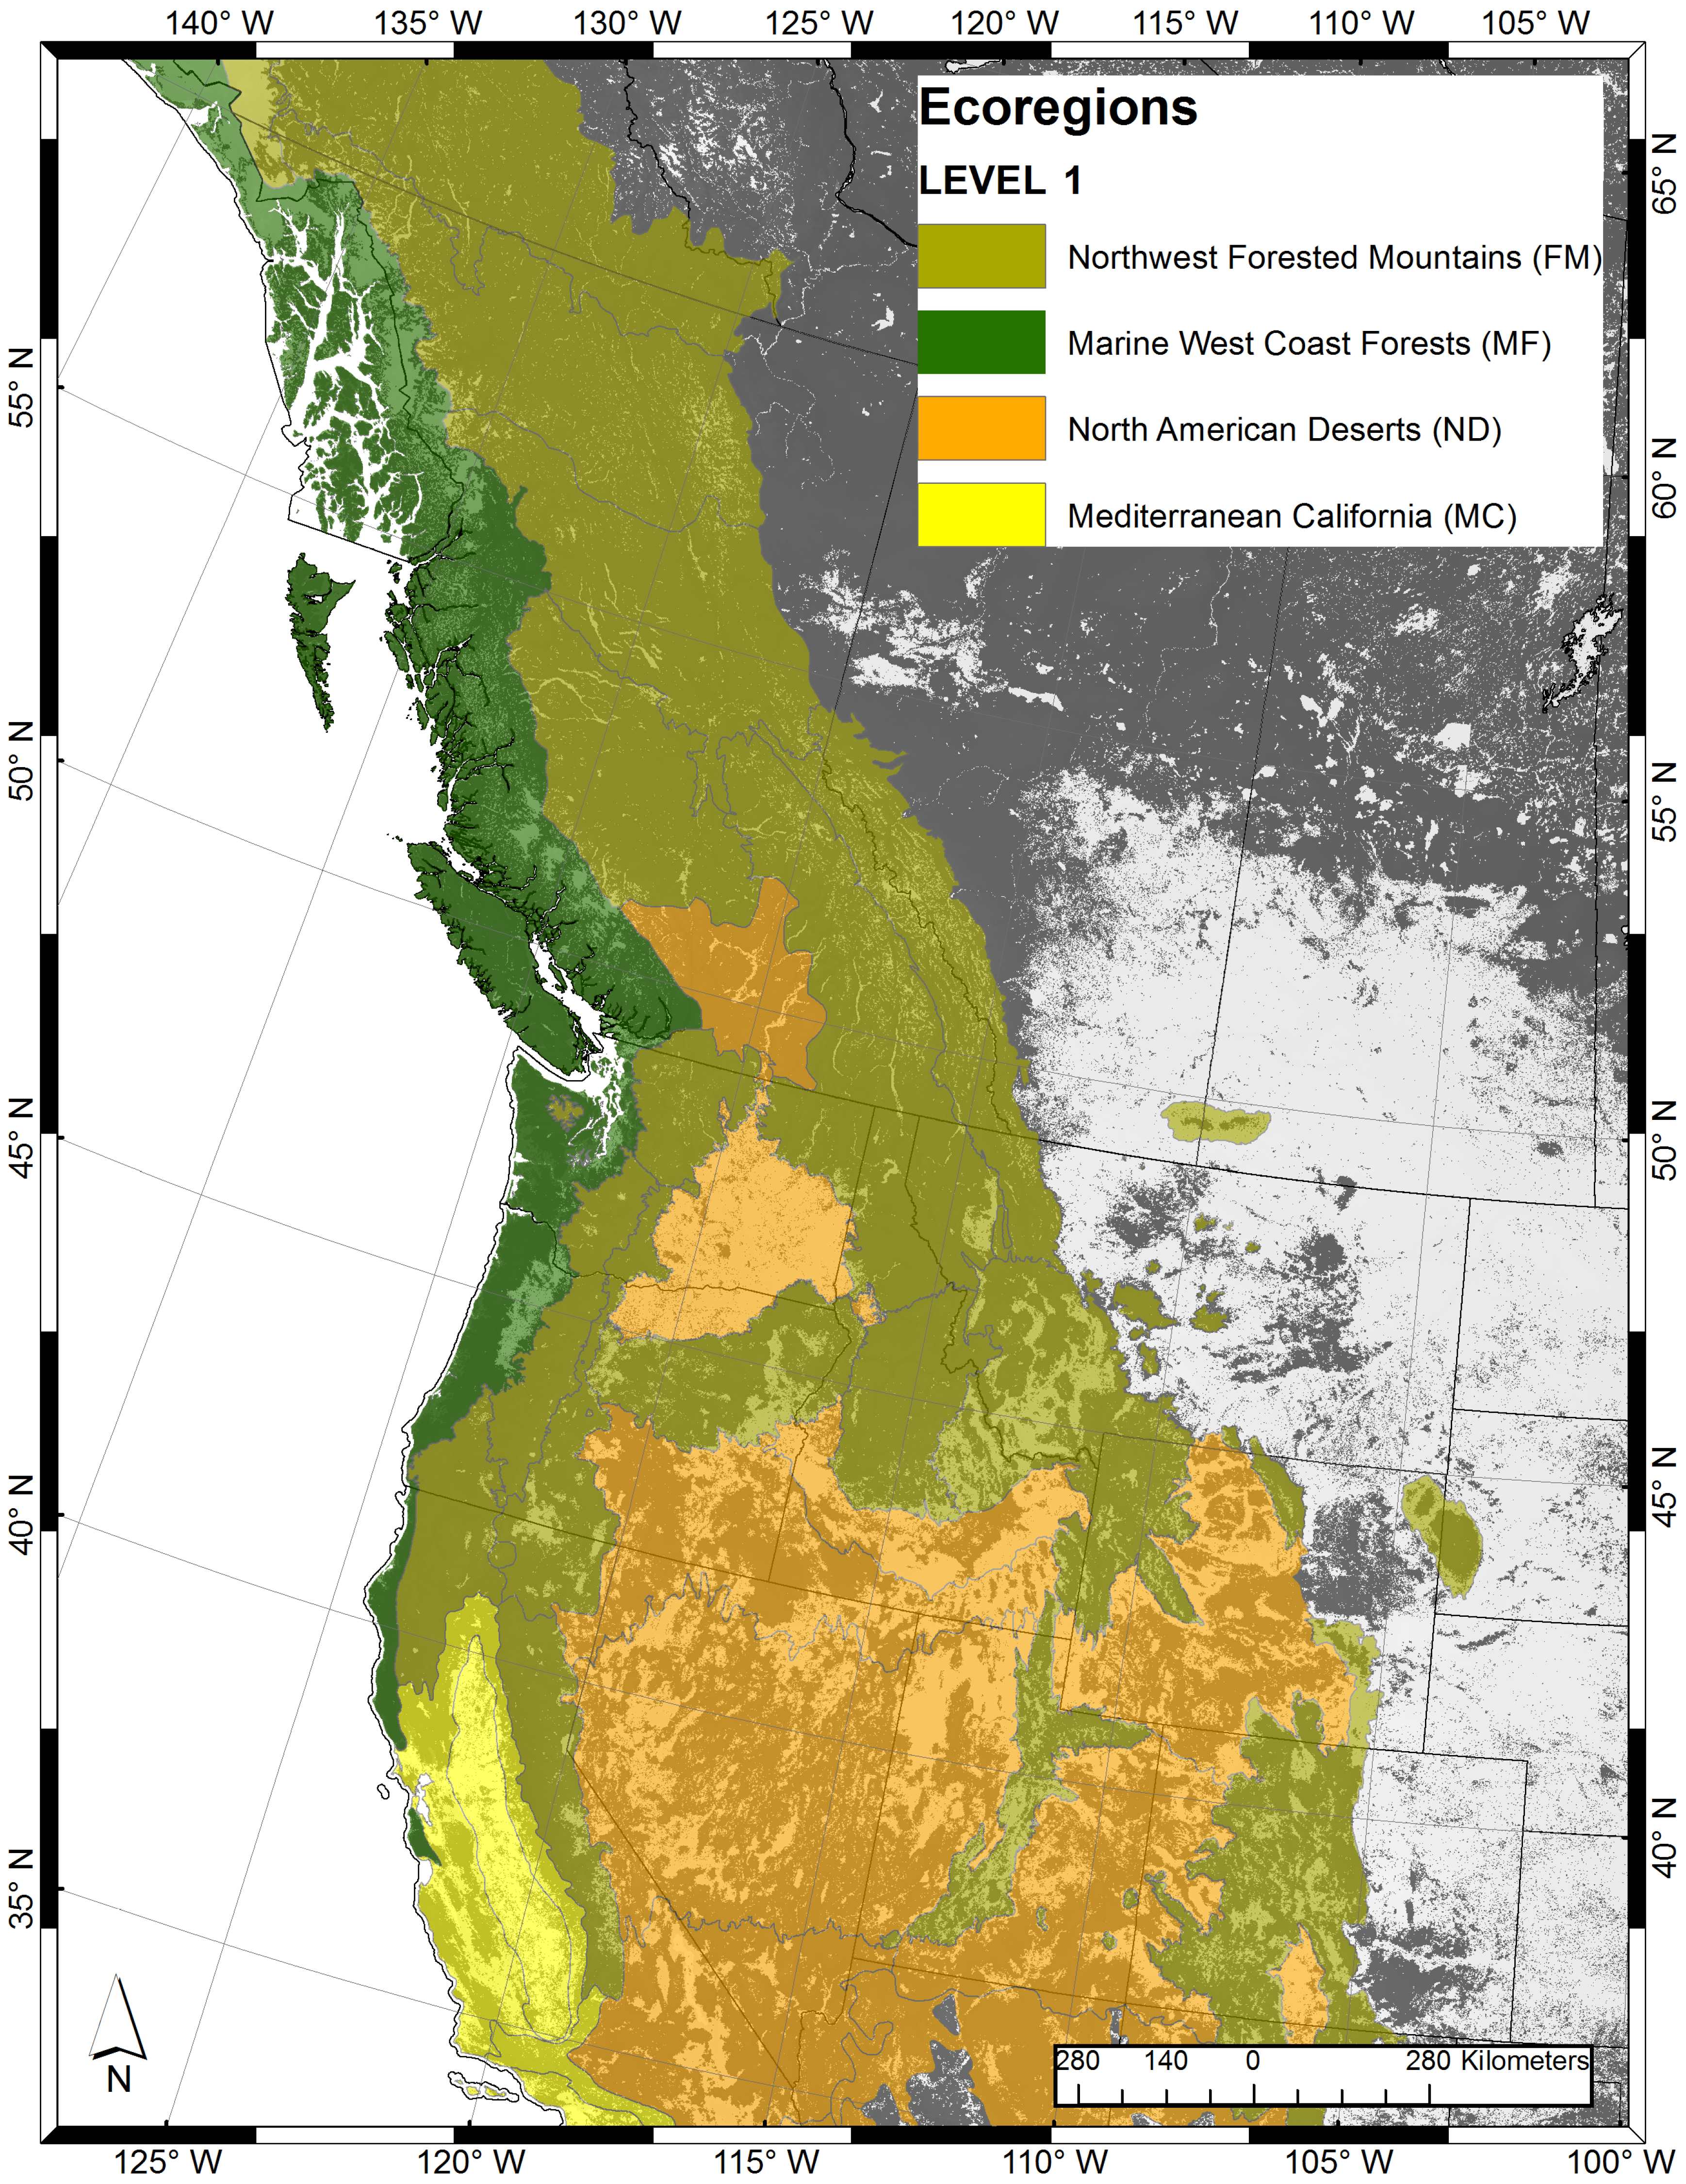
2.1. Study Area

2.2. Modeling Approach

| Species | Common Name | Code | % P | % A | Presence Accuracy (%) | Absence Accuracy (%) | Overall Average (%) | Kappa |
|---|---|---|---|---|---|---|---|---|
| Pseudotsuga menziesii | Douglas-fir | DF | 29.2 | 70.8 | 76 | 70 | 73 | 0.584 |
| Thuja plicata | western redcedar | WRC | 13.6 | 86.4 | 80 | 77 | 78 | 0.711 |
| Tsuga heterophylla | western hemlock | WH | 9.3 | 90.8 | 81 | 78 | 80 | 0.740 |
| Tsuga mertensiana | mountain hemlock | MH | 2.1 | 97.9 | 78 | 78 | 78 | 0.711 |
| Pinus contorta | lodgepole pine | LPP | 20.8 | 79.2 | 68 | 72 | 70 | 0.495 |
| Pinus ponderosa | ponderosa pine | PP | 10.5 | 89.5 | 84 | 82 | 83 | 0.785 |
| Picea sitchensis | Sitka spruce | SS | 1.6 | 98.4 | 90 | 88 | 89 | 0.884 |
| Pinus albicaulis | whitebark pine | WP | 2.8 | 97.2 | 84 | 82 | 83 | 0.797 |
| Chamaecyparis nootkatensis | Alaska yellow cedar | YC | 3.9 | 96.1 | 89 | 91 | 90 | 0.879 |
| Abies procera | noble fir | NF | 0.4 | 99.6 | 92 | 93 | 93 | 0.921 |
| Picea engelmannii | Engelmann spruce | ES | 6.0 | 94 | 78 | 68 | 73 | 0.574 |
| Larix occidentalis | western larch | WL | 2.9 | 97.1 | 81 | 81 | 81 | 0.754 |
| Abies lasiocarpa | subalpine fir | SAF | 10.4 | 89.6 | 76 | 75 | 76 | 0.654 |
| Abies amabilis | Pacific silver fir | PSF | 3.4 | 96.6 | 85 | 83 | 84 | 0.821 |
| Abies grandis | grand fir | GF | 2.6 | 97.4 | 80 | 83 | 82 | 0.805 |
2.3. Climate Data
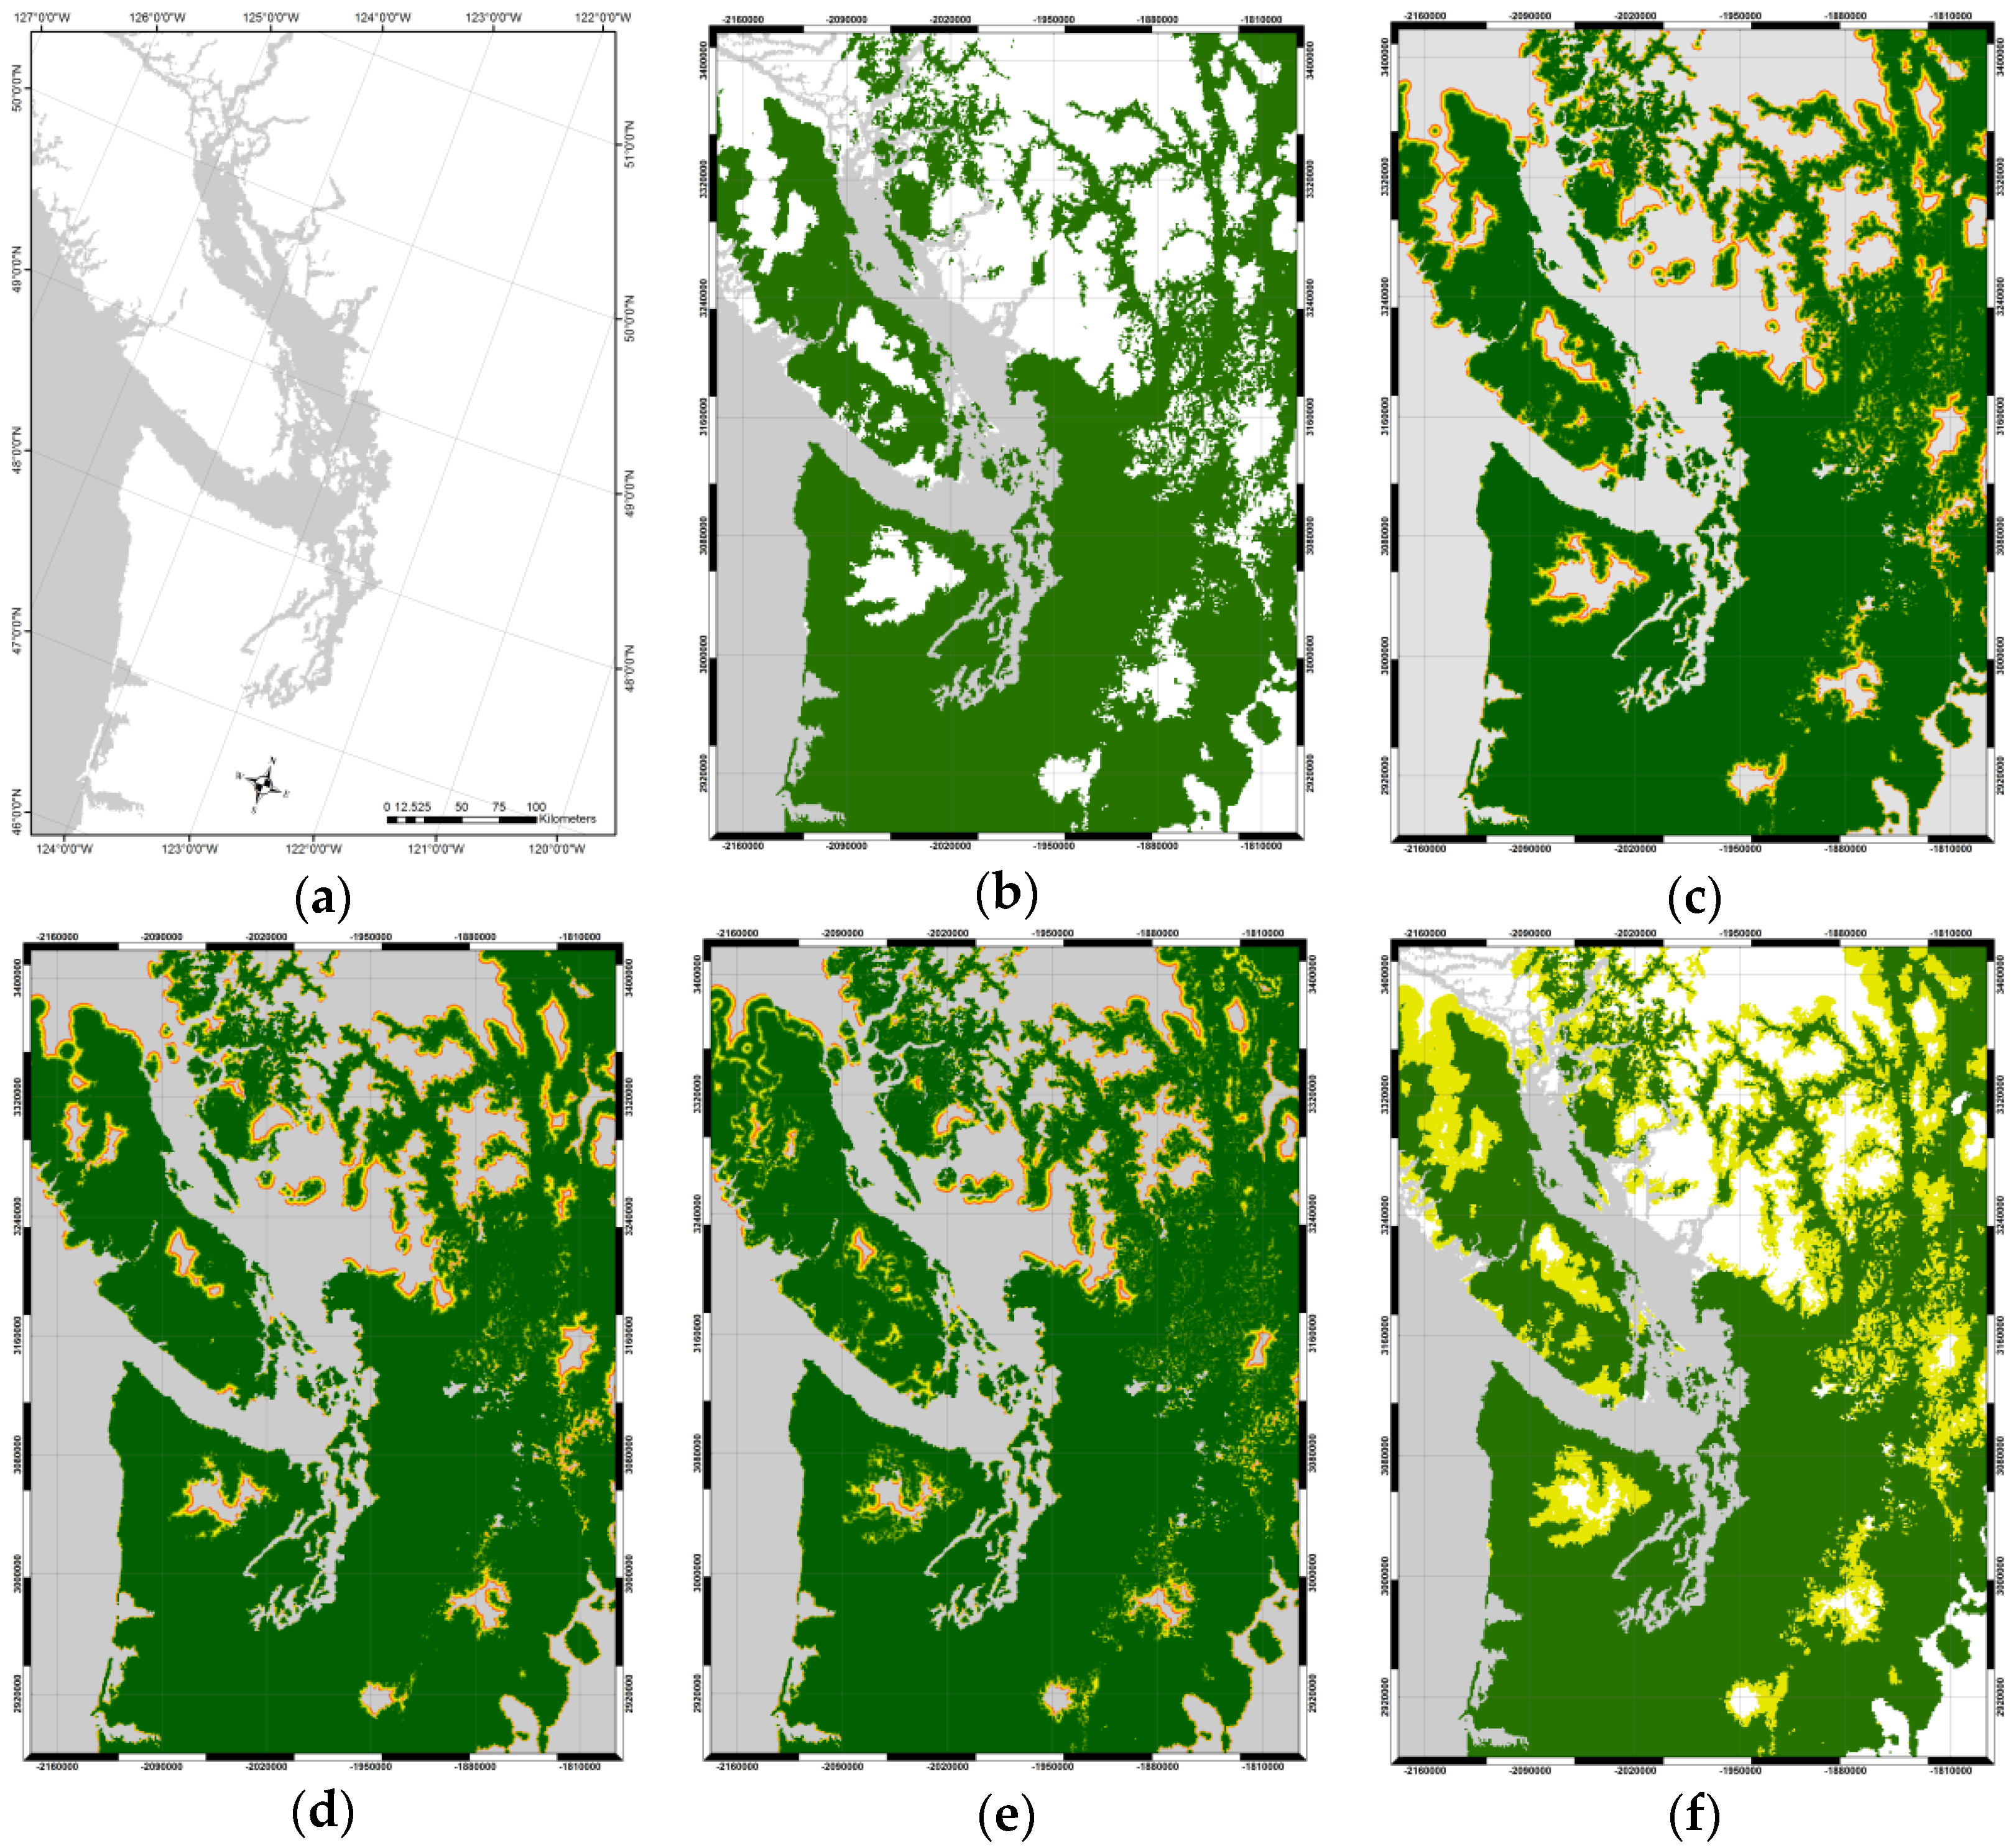
2.4. Constraints Imposed by Landscape Fragmentation
2.5. Effect of Land Cover on Migration


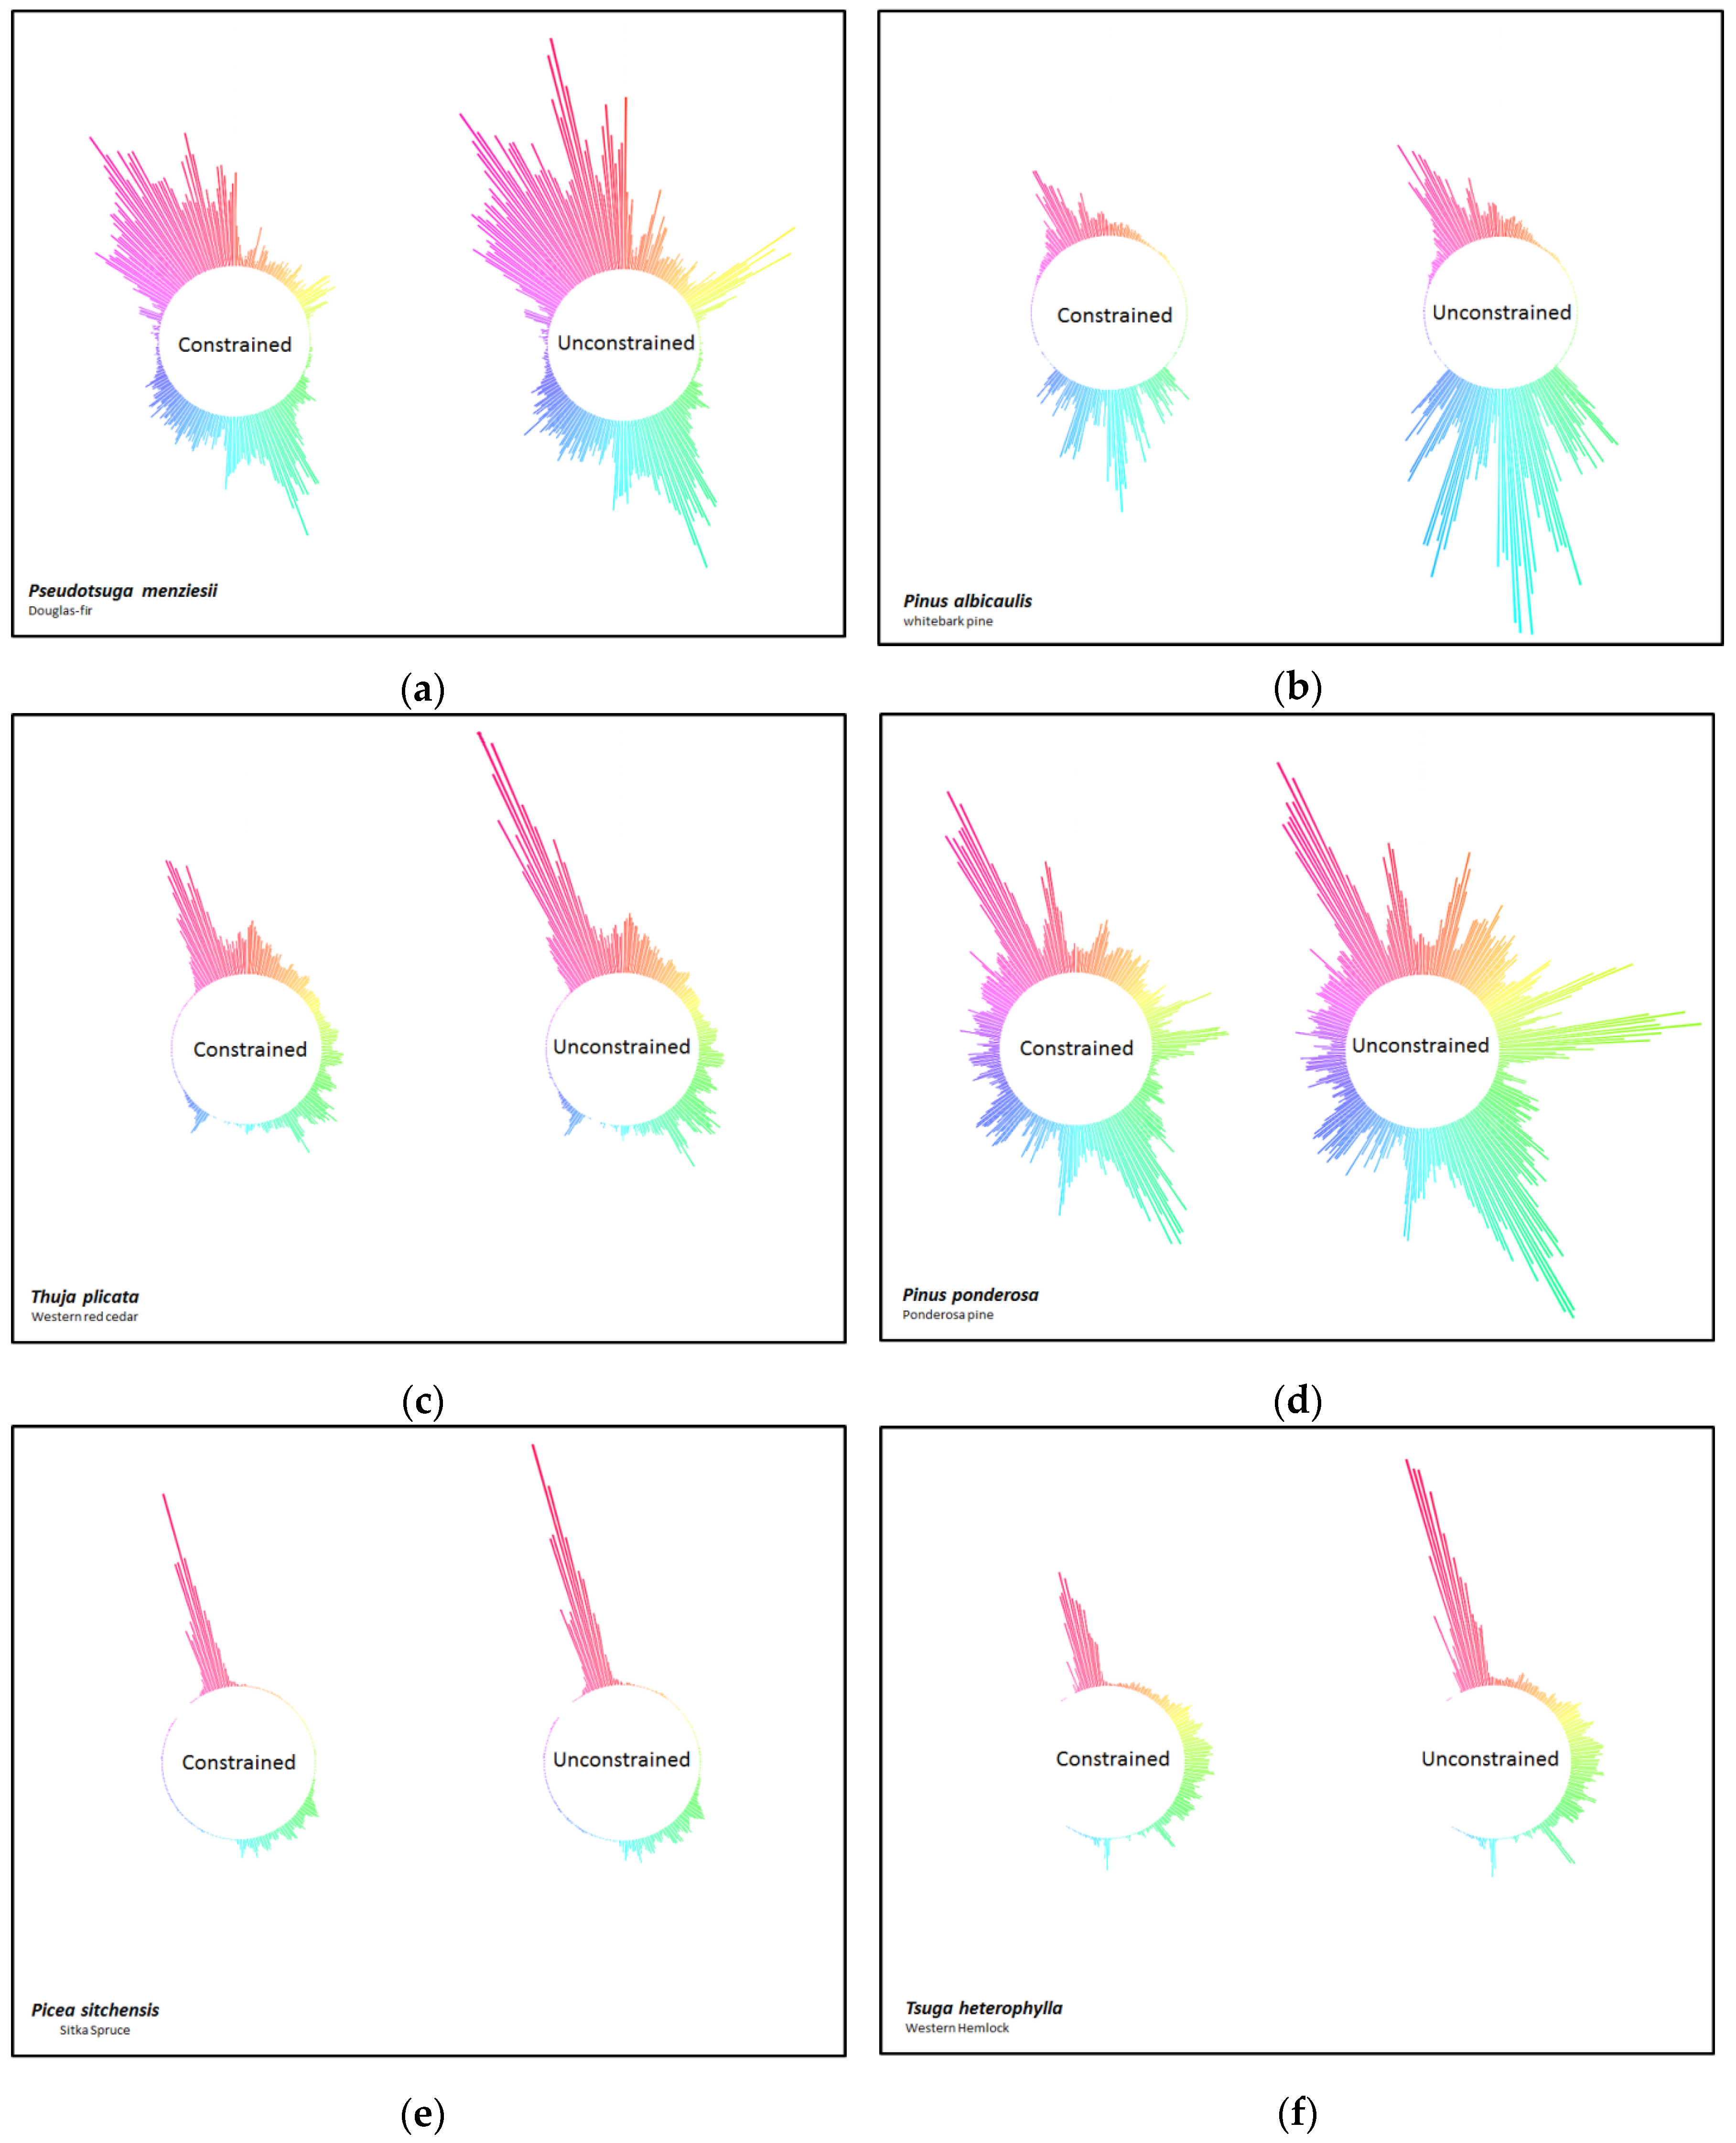
3. Results


4. Discussion
5. Conclusions
Acknowledgments
Author Contributions
Conflicts of Interest
References
- Matais, L.; Jump, A.S. Impacts of predicted climate change on recruitment at the geographical limits of Scots pine. J. Exp. Bot. 2013, 65, 299–310. [Google Scholar]
- Aitken, S.N.; Yeaman, S.; Holliday, J.A.; Wang, T.; Curtis-McLane, S. Adaptation, mirgation or extirpation: Climate change outcomes for tree populations. Evol. Appl. 2008, 1, 95–111. [Google Scholar] [CrossRef] [PubMed]
- Honnay, O.; Veryheyen, K.; Butaye, J.; Jacquemyn, H.; Bossuyt, B.; Hermy, M. Possible effects of habitat fragmentation and climate change on the range of forest plant species. Ecol. Lett. 2012, 5, 525–530. [Google Scholar] [CrossRef]
- Hughes, L. Biological consequences of global warming: Is the signal already apparent? Trends Ecol. Evol. 2000, 15, 56–61. [Google Scholar] [CrossRef]
- Ritchie, J.C.; MacDonald, G.M. The patterns of post-glacial spread of white spruce. J. Biogeogr. 1986, 13, 537–540. [Google Scholar] [CrossRef]
- Davis, M.B. Lags in vegetation response to greenhouse warming. Clim. Change 1989, 15, 75–82. [Google Scholar] [CrossRef]
- Beckage, B.; Osborne, B.; Gavin, D.G.; Pucko, C.; Siccama, T.; Perkins, T. A Rapid upward shift of a forest ecotone during 40 years of warming in the Green Mountains of Vermont. PNAS 2008, 105, 4197–4202. [Google Scholar] [CrossRef] [PubMed]
- Kubisch, A.; Fronhofer, E.A. Dispersal, evolution and range dynamics—A synthesis. Oikos 2014, 123, 3–4. [Google Scholar] [CrossRef]
- Saltré, F.; Duputié, A.; Gaucherel, C.; Chuine, I. How climate, migration ability and habitat fragmentation affect the projected future distribution of European beech. Glob. Change Biol. 2015, 21, 897–910. [Google Scholar] [CrossRef] [PubMed]
- Engler, R.; Guisan, A. MigClim: Predicting plant distribution and dispersal in a changing climate. Divers. Distrib. 2009, 15, 590–601. [Google Scholar] [CrossRef]
- Thuiller, W.; Albert, C.; Araujo, M.B.; Berry, P.M.; Cabeza, M. Predicting global change impacts on plant species’ distributions: Future challenges. Perspect. Plant Ecol. Evol. Syst. 2008, 9, 137–152. [Google Scholar] [CrossRef]
- Opdam, P.; Wascher, D. Climate change meets habitat fragmentation: Linking landscape and biogeographical scale levels in research and conservation. Biol. Conserv. 2004, 117, 285–297. [Google Scholar] [CrossRef]
- Kramer, K.; Ronce, O.; Robledo-Arnuncio, J.J. Long-distance gene flow and adaption of forest trees to rapid climate change. Ecol. Lett. 2012, 15, 378–392. [Google Scholar] [CrossRef] [PubMed]
- Thuiller, W.; Araujo, M.; Lavorel, S. Do we need land cover data to model species distributions in Europe? J. Biogeogr. 2004, 31, 353–361. [Google Scholar] [CrossRef]
- Iverson, L.R.; Schwartz, M.W.; Prasad, A.M. How fast and far might tree species migrate in the eastern United States due to climate change? Glob. Ecol. Biogeogr. 2004, 13, 209–219. [Google Scholar] [CrossRef]
- Coops, N.C.; Waring, R.H.; Beier, C.; Roy-Jauvin, R.; Wang, T. Modeling coniferous tree species distributions throughout the Pacific Northwest of North America with a generic process-based growth model. Appl. Veg. Sci. 2011, 14, 402–414. [Google Scholar] [CrossRef]
- Runyon, J.; Waring, R.H.; Goward, S.N.; Welles, J.W. Environmental limits on net primary production and light-use efficiency across the Oregon transect. Ecol. Appl. 1994, 4, 226–237. [Google Scholar] [CrossRef]
- Law, B.E.; Turner, D.; Campbell, J.; Sun, O.J.; van Tuyl, S.; Ritts, W.D.; Cohen, W.B. Disturbance and climate effects on carbon stocks and fluxes across western Oregon USA. Glob. Change Biol. 2004, 10, 1429–1444. [Google Scholar] [CrossRef]
- Franklin, J.F.; Dyrness, C.T. Natural vegetation of Oregon and Washington. In Pacific Northwest Forest and Range Experiment Station; General Technical Report; United States Forest Service: Portland, OR, USA, 1973. [Google Scholar]
- Landsberg, J.J.; Waring, R.H. A generalised model of forest productivity using simplified concepts of radiation-use efficiency, carbon balance and partitioning. For. Ecol. Manag. 1997, 95, 209–228. [Google Scholar] [CrossRef]
- Coops, N.C.; Waring, R.H.; Schroeder, T.A. Combining a generic process- productivity model and a statistical classification method to predict presence and absence of tree species in the Pacific Northwest, USA. Ecol. Model. 2009, 220, 1787–1796. [Google Scholar] [CrossRef]
- Uebersax, J.S. Diversity of decision-making models and the measurement of interrater agreement. Psychol. Bull. 1987, 101, 140–146. [Google Scholar] [CrossRef]
- Rehfeldt, G.E.; Crookston, N.L.; Warwell, M.V.; Evans, J.S. Empirical analysis of plant-climate relationships for the western United States. Int. J. Plant Sci. 2006, 167, 1123–1150. [Google Scholar] [CrossRef]
- Hamann, A.; Wang, T. Potential effects of climate change on ecosystem and tree species distribution in British Columbia. Ecology 2006, 87, 2773–2786. [Google Scholar] [CrossRef]
- Mote, P.W.; Parson, E.A.; Hamlet, A.F.; Ideker, K.N.; Keeton, W.S.; Lettenmaier, D.P.; Mantua, N.J.; Miles, E.L.; Peterson, D.W.; Peterson, D.L.; et al. Preparing for climate change: The water, salmon and forests of the Pacific Northwest. Clim. Chang. 2003, 61, 45–88. [Google Scholar] [CrossRef]
- Spittlehouse, D.L. Climate Change, Impacts, and Adaptation Scenarios: Climate Change and Forest and Range Management in British Columbia; Technical Report; B.C. Ministry of Forests & Range, Research Branch: Victoria, BC, Canada, 2008; p. 38. [Google Scholar]
- Nakićenović, N.; Swart, R. Special Report on Emissions Scenarios; A Special Report of Working Group III of the Intergovernmental Panel on Climate Change; Cambridge University Press: Cambridge, UK, 2000; p. 599. [Google Scholar]
- IPCC. Summary for policymakers. In Climate Change 2007: The Physical Science Basis. Contribution of Working Group I to the Fourth Assessment Report of the Intergovernmental Panel on Climate Change; Solomon, S.D., Qin, M., Manning, Z., Chen, M., Marquis, K.B., Averytm, M., Tignor, H., Miller, L., Eds.; Cambridge University Press: Cambridge, UK; New York, NY, USA; p. 996.
- McFarlane, N.A.; Scinocca, J.F.; Lazare, M.; Harvey, R.; Verseghy, D.; Li, J. The CCCma Third Generation Atmospheric General Circulation Model; Internal Report; Canadian Centre for Climate Modelling and Analysis: Victoria, BC, Canada, 2005; p. 25. [Google Scholar]
- Scinocca, J.F.; McFarlane, N.A.; Lazare, M.; Li, J.; Plummer, D. The CCCma third generation AGCM and its extension into the middle atmosphere. Atmos Chem. Phys. 2008, 8, 7883–7930. [Google Scholar] [CrossRef]
- Schumaker, N.H. Using landscape indices to predict habitat connectivity. Ecology 1996, 77, 1210–1225. [Google Scholar] [CrossRef]
- Vos, C.C.; Baveco, H.; Grashof-Bokdam, C.J. Corridors and species dispersal. In Applying Landscape Ecology in Biological Conservation; Springer: New York, NY, USA, 2002; pp. 84–104. [Google Scholar]
- Friedl, M.A.; McIver, D.K.; Hodges, J.C.F.; Zhang, X.Y.; Muchoney, D.; Strahler, A.H.; Woodcock, C.E.; Gopal, S.; Schneider, A.; Cooper, A.; et al. Global land cover mapping from MODIS: Algorithms and early results. Remote Sens. Environ. 2002, 83, 287–302. [Google Scholar] [CrossRef]
- Boulangeat, I.; Georges, D.; Dentant, C.; Bonet, R.; van Es, J.; Abdulhak, S.; Zimmermann, N.E.; Thuiller, W. Anticipating the spatio-temporal response of plant diversity and vegetation structure to climate and land use change in a protected area. Ecography 2014, 37, 1230–1239. [Google Scholar] [CrossRef] [PubMed]
- Meier, E.S.; Lischke, H.; Schmatz, D.R.; Zimmermann, N.E. Climate, competition, and connectivity affect future migration and ranges of European trees. Glob. Ecol. Biogeogr. 2012, 21, 164–178. [Google Scholar] [CrossRef]
© 2016 by the authors; licensee MDPI, Basel, Switzerland. This article is an open access article distributed under the terms and conditions of the Creative Commons by Attribution (CC-BY) license (http://creativecommons.org/licenses/by/4.0/).
Share and Cite
Coops, N.C.; Waring, R.H.; Plowright, A.; Lee, J.; Dilts, T.E. Using Remotely-Sensed Land Cover and Distribution Modeling to Estimate Tree Species Migration in the Pacific Northwest Region of North America. Remote Sens. 2016, 8, 65. https://0-doi-org.brum.beds.ac.uk/10.3390/rs8010065
Coops NC, Waring RH, Plowright A, Lee J, Dilts TE. Using Remotely-Sensed Land Cover and Distribution Modeling to Estimate Tree Species Migration in the Pacific Northwest Region of North America. Remote Sensing. 2016; 8(1):65. https://0-doi-org.brum.beds.ac.uk/10.3390/rs8010065
Chicago/Turabian StyleCoops, Nicholas C., Richard H. Waring, Andrew Plowright, Joanna Lee, and Thomas E. Dilts. 2016. "Using Remotely-Sensed Land Cover and Distribution Modeling to Estimate Tree Species Migration in the Pacific Northwest Region of North America" Remote Sensing 8, no. 1: 65. https://0-doi-org.brum.beds.ac.uk/10.3390/rs8010065