
TerraSAR-X Data for High-Precision Land Subsidence Monitoring: A Case Study in the Historical Centre of Hanoi, Vietnam


Abstract
:
1. Introduction
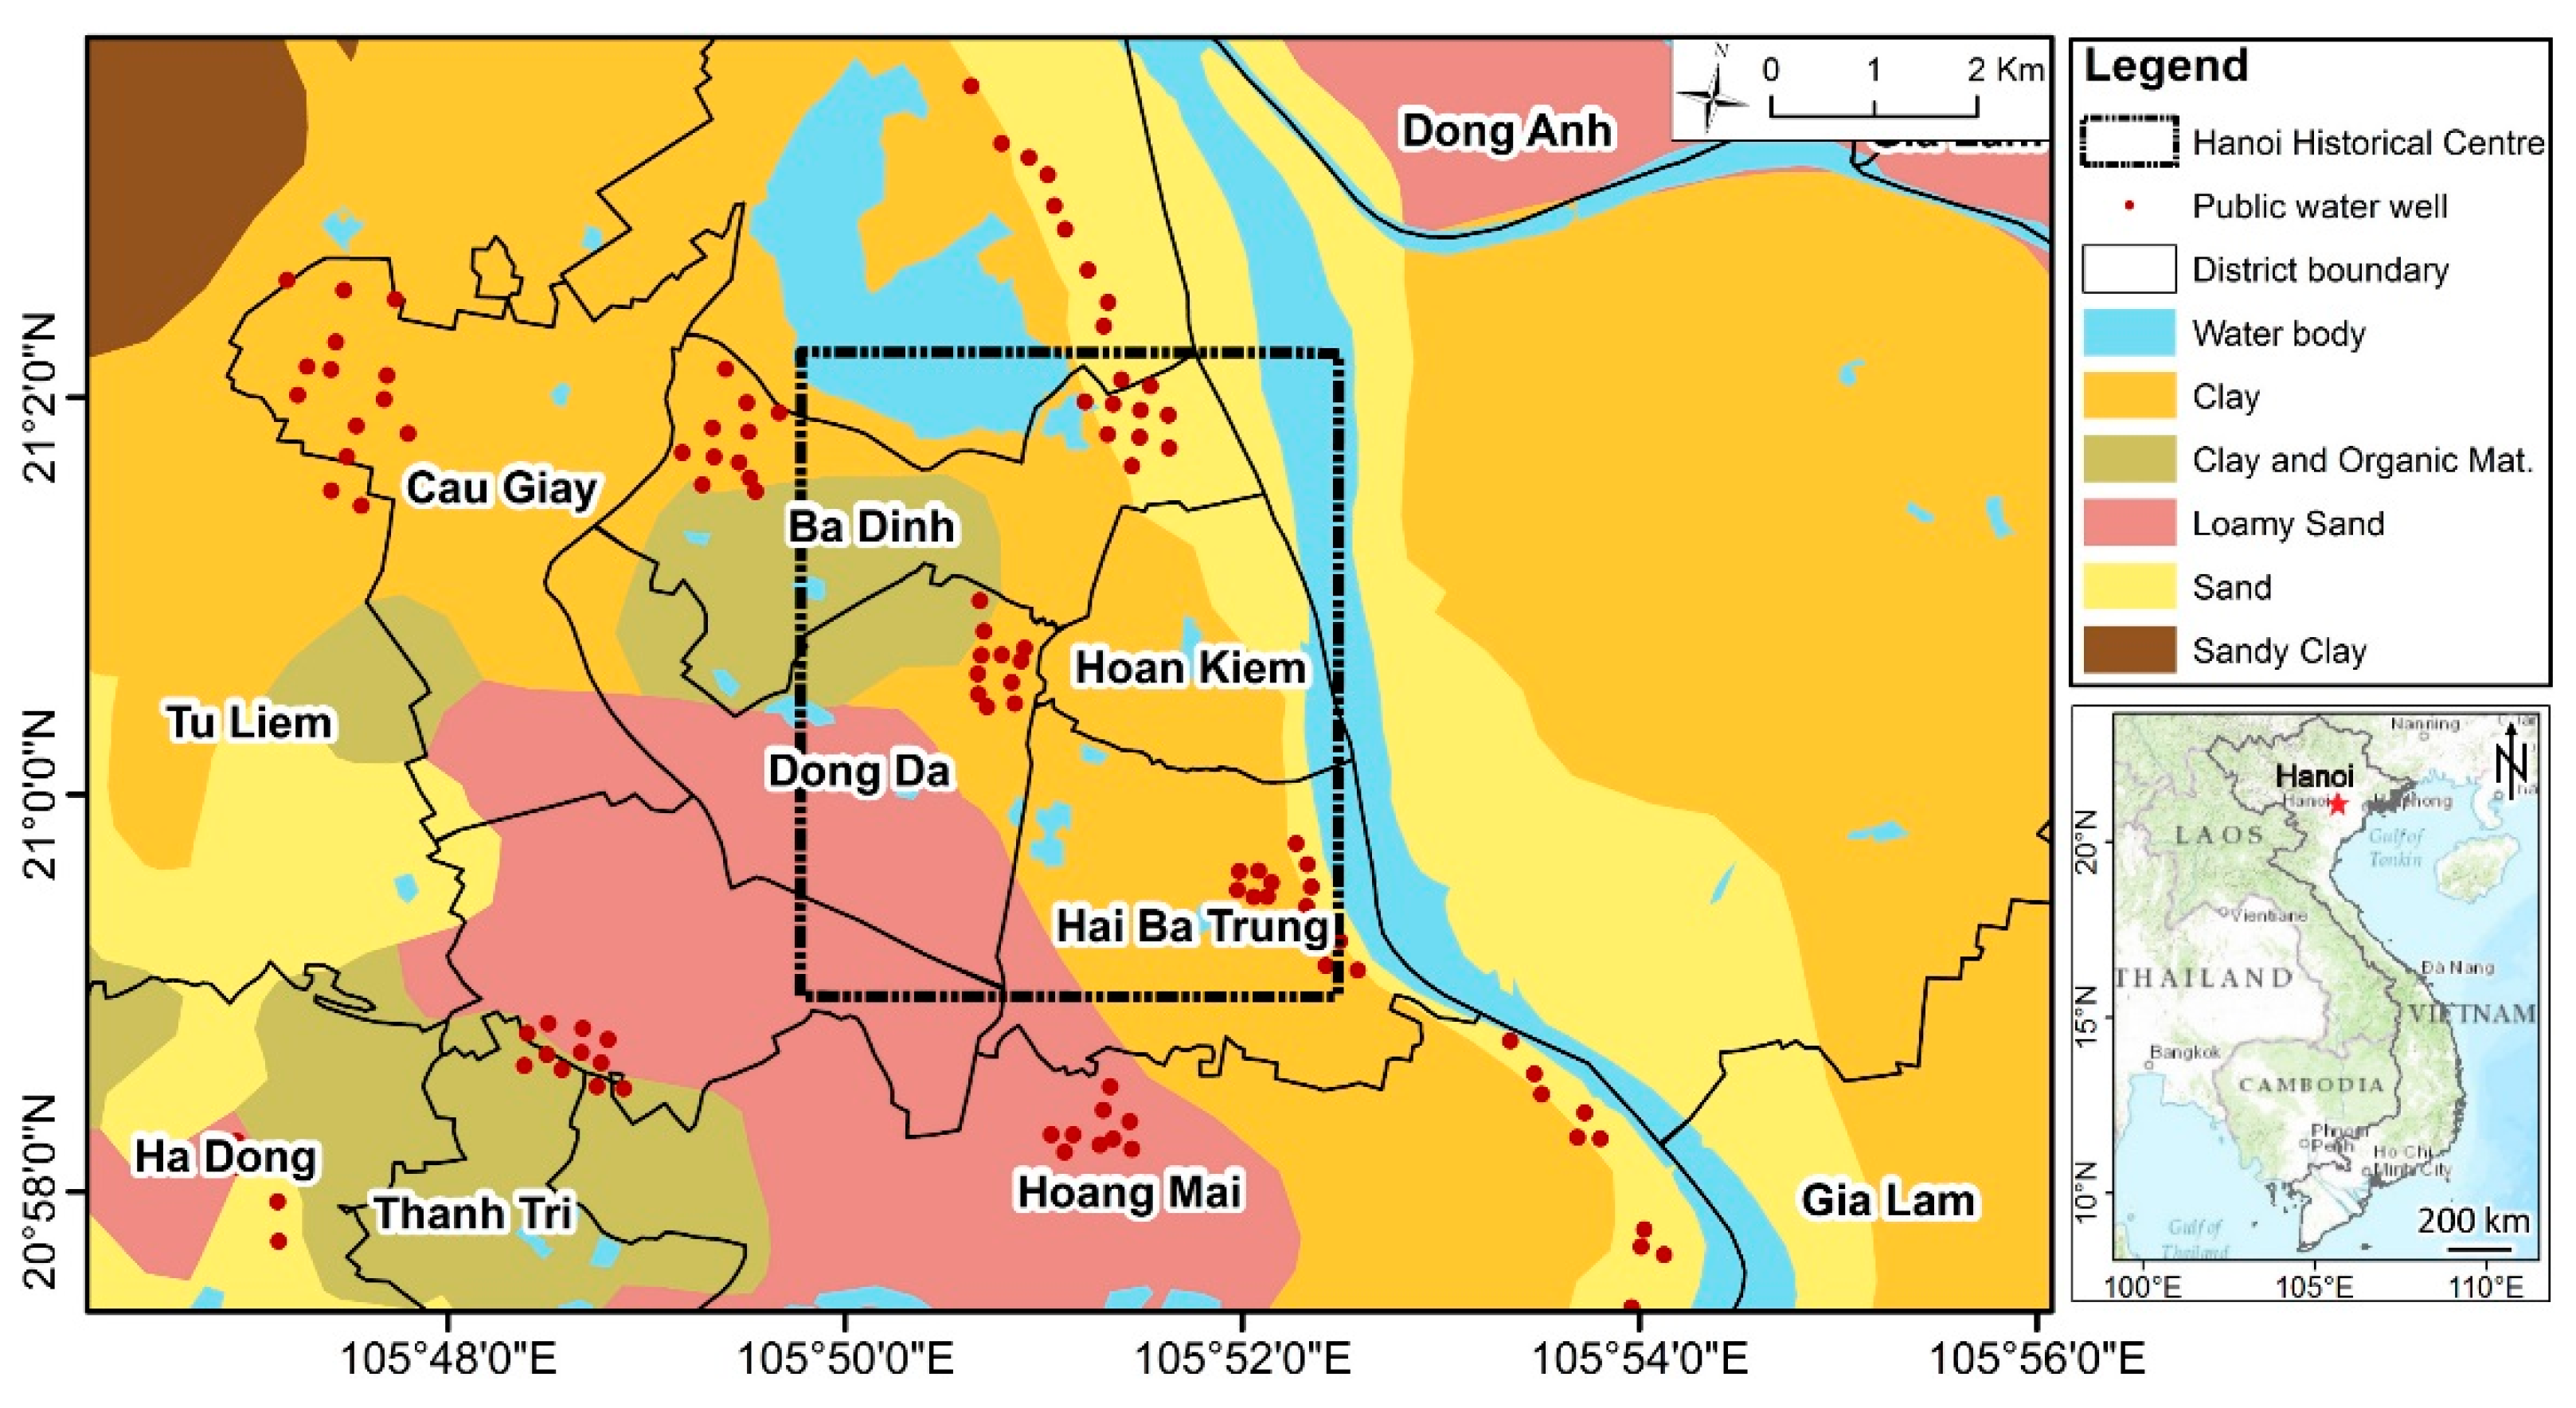
2. Study Area
3. Data Availability
4. Interferometric Synthetic Aperture Radar (InSAR) Time Series Analysis
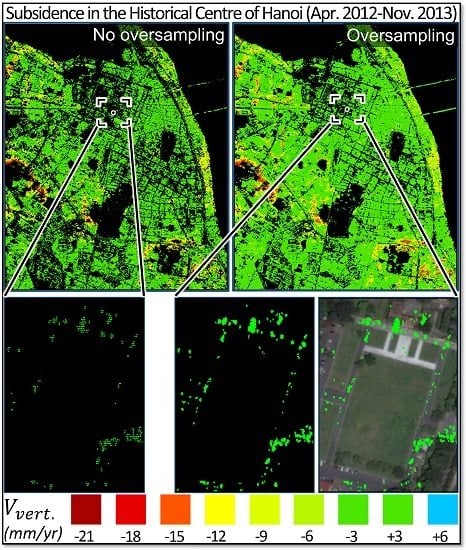
4.1. Oversampling Implementation
4.2. Interferometric Processing
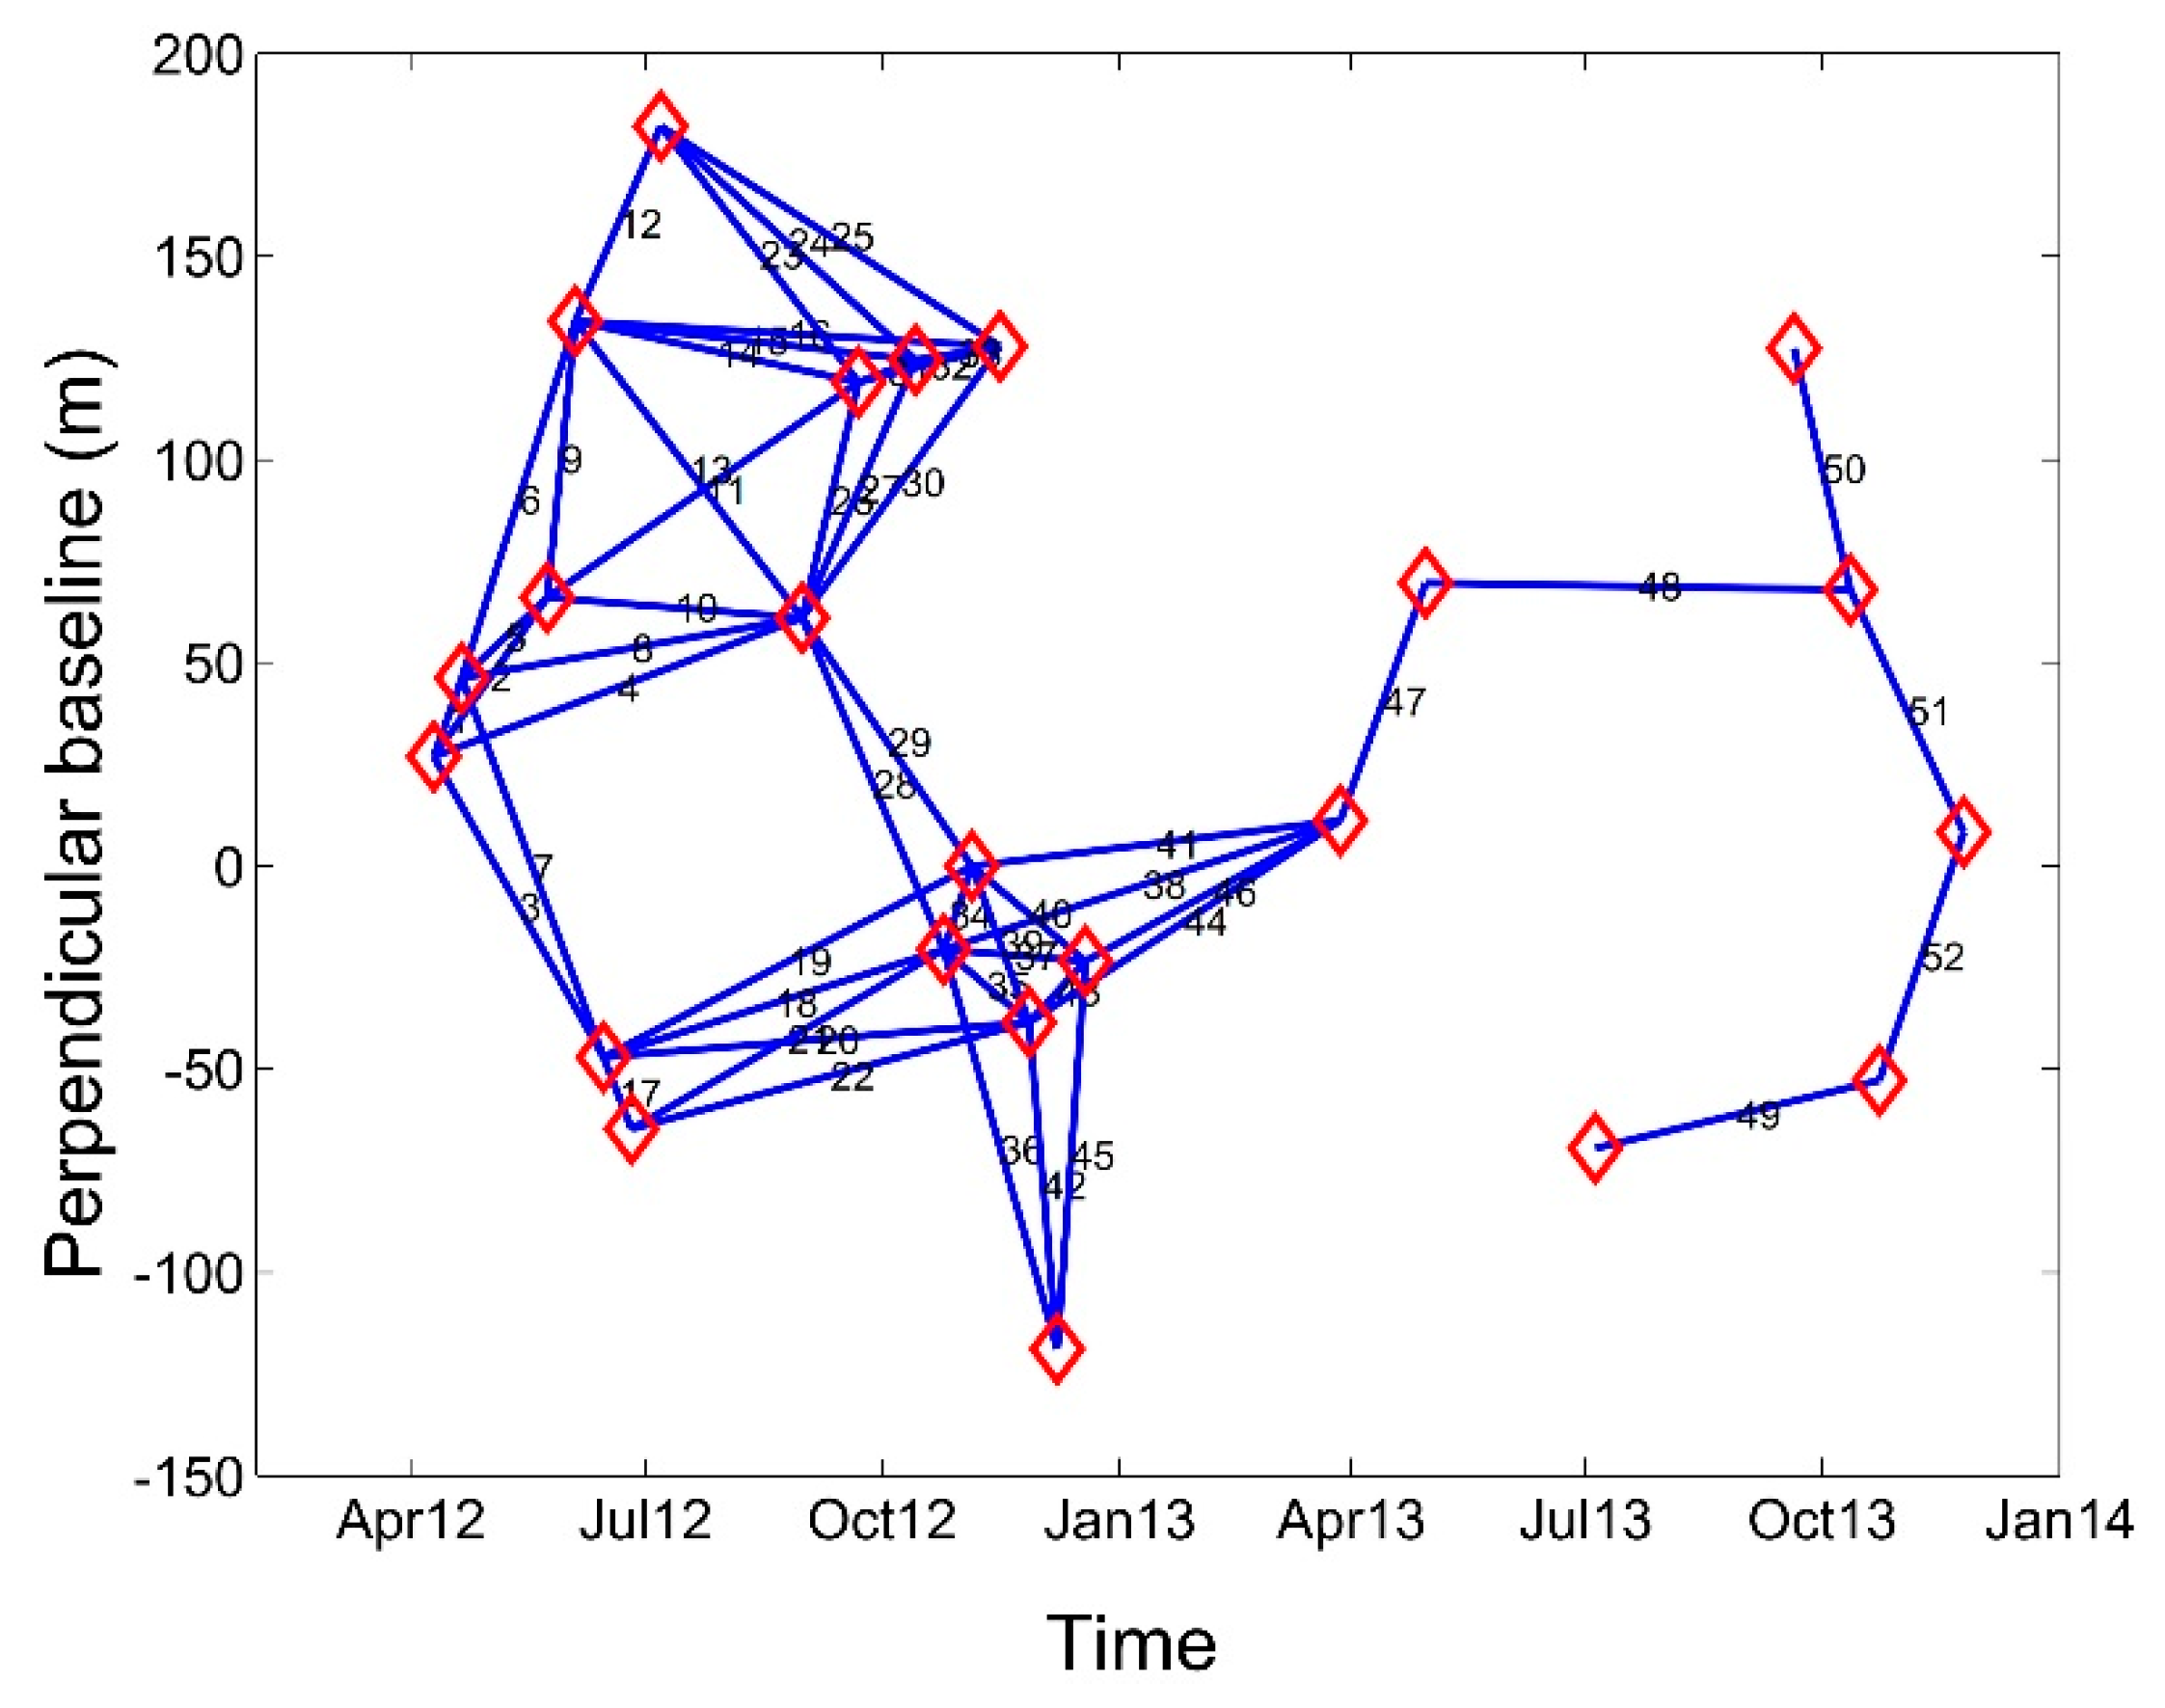
4.3. Small Baseline (SB) Time-Series Processing
5. Results and Discussion
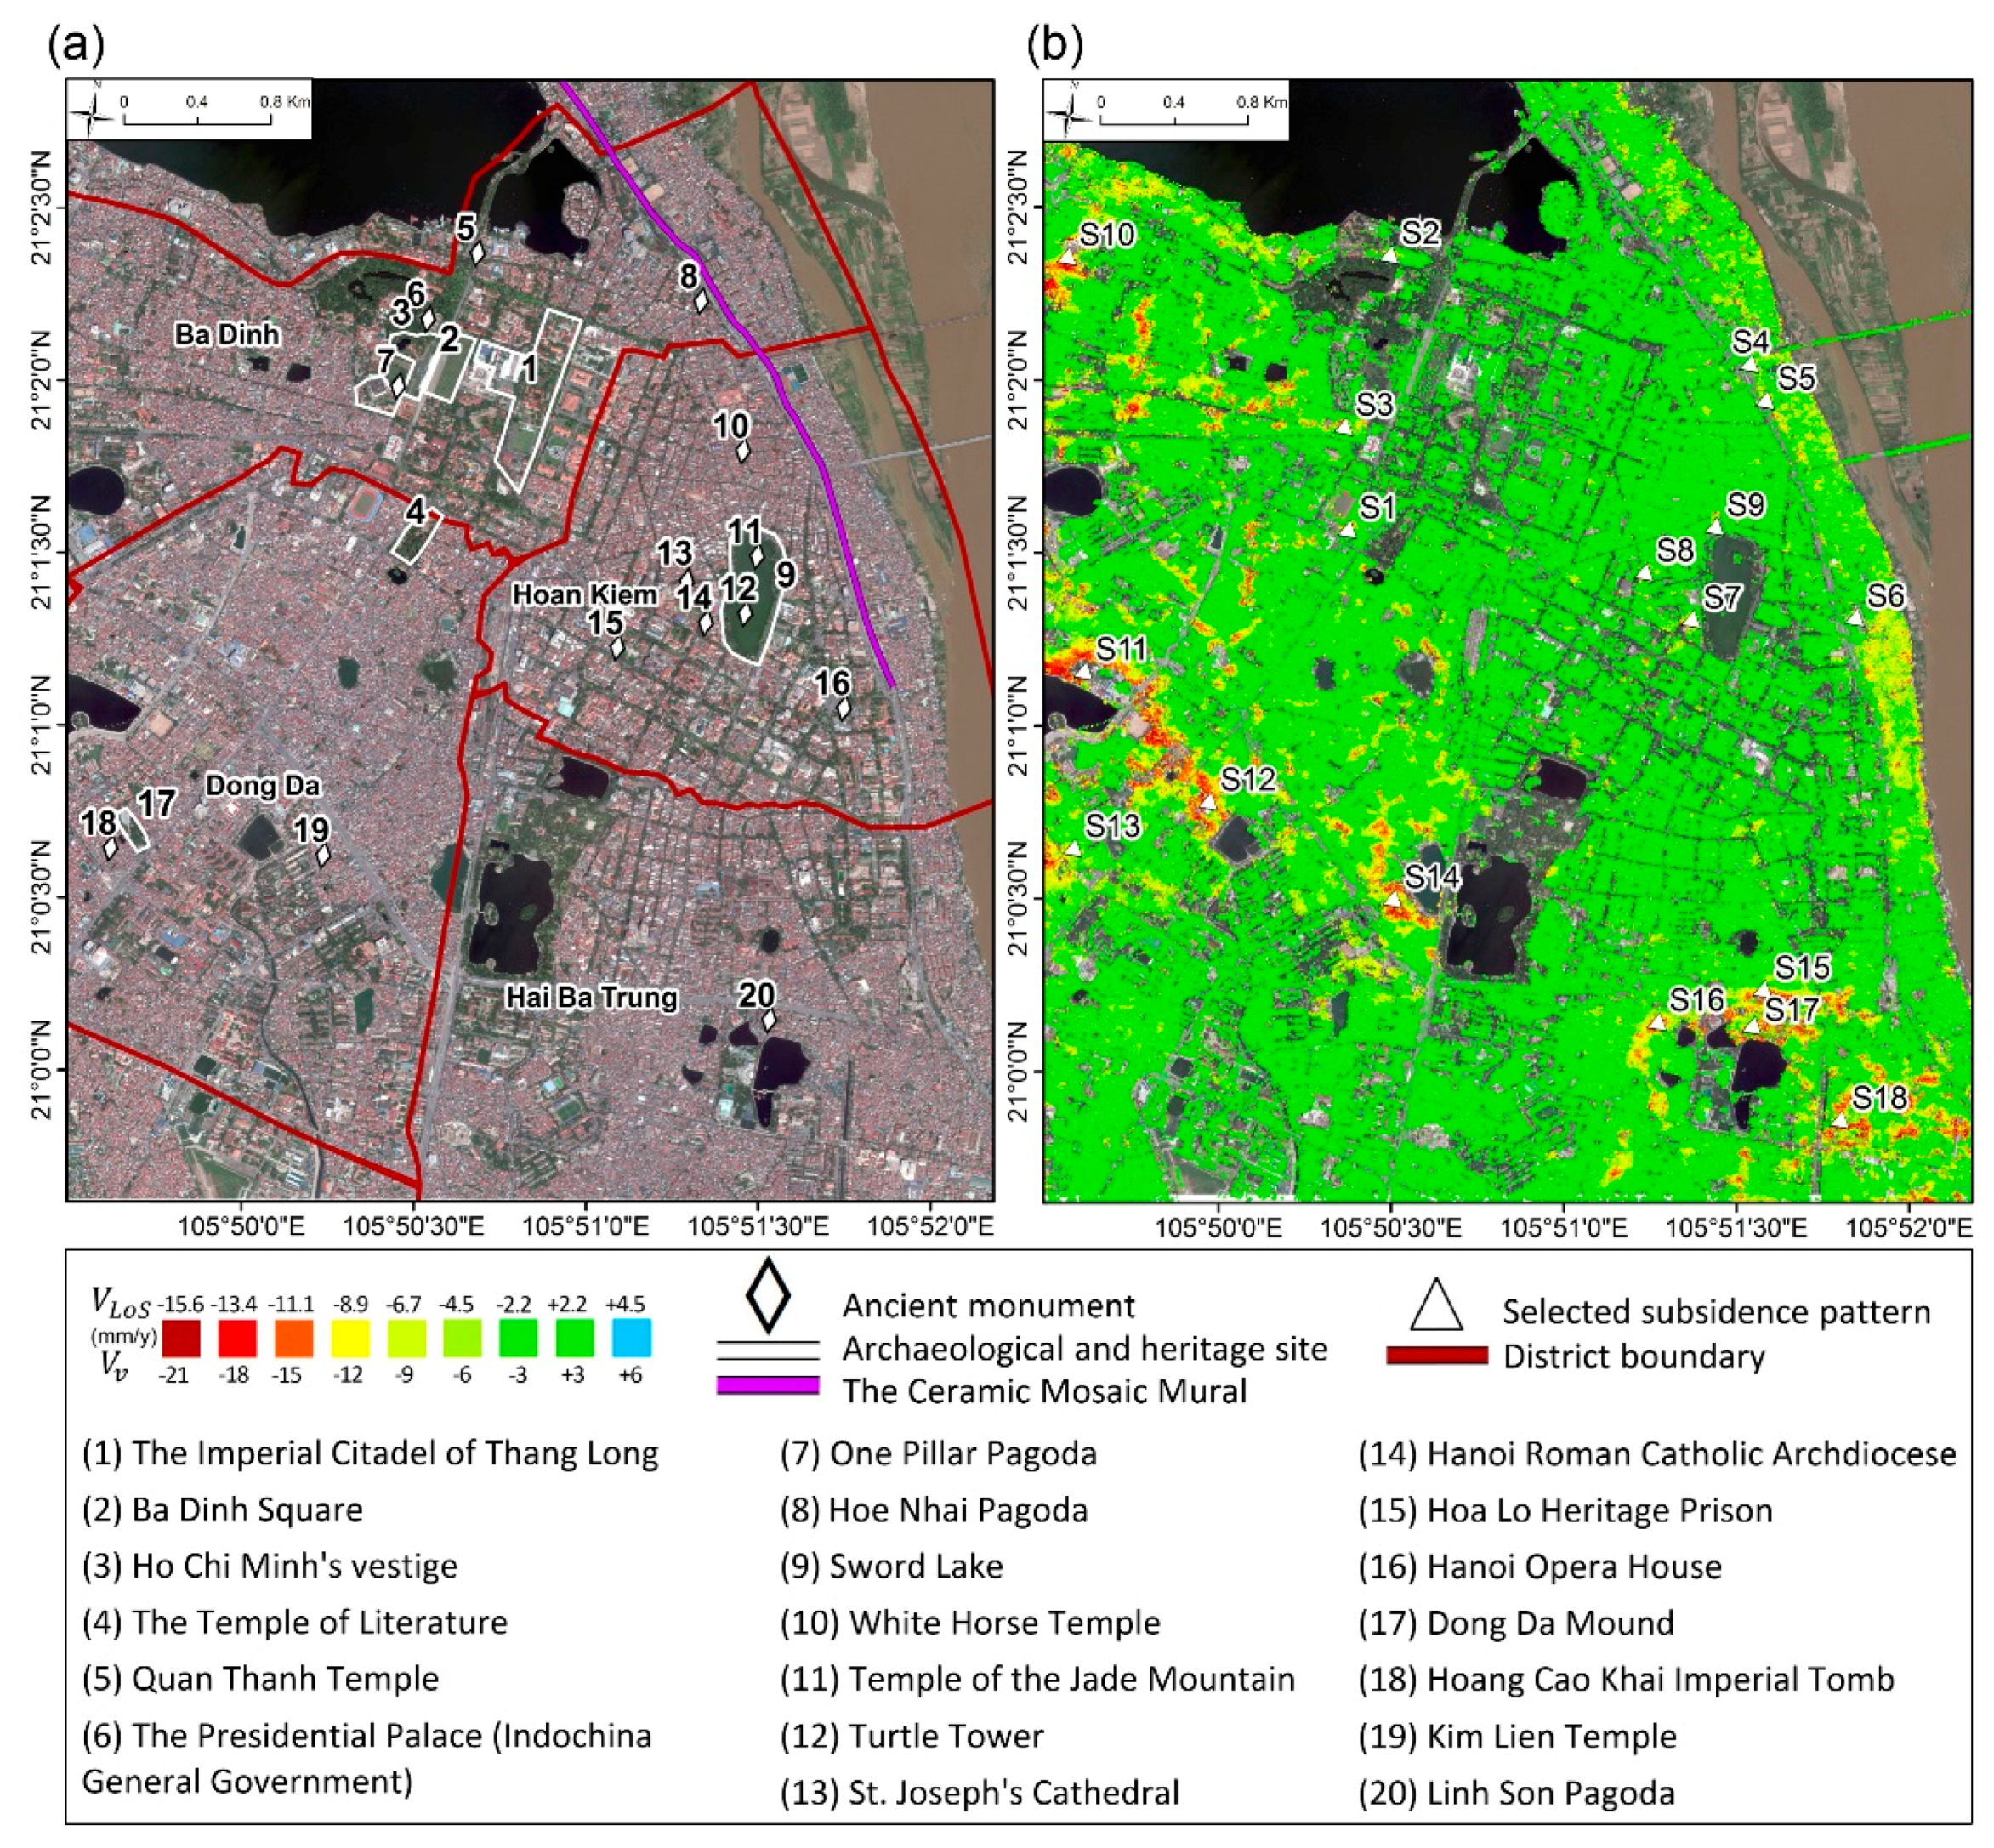
5.1. Land Subsidence Assessments of Hanoi Historical Centre
5.1.1. The Citadel
5.1.2. Monuments on the Red River Bank
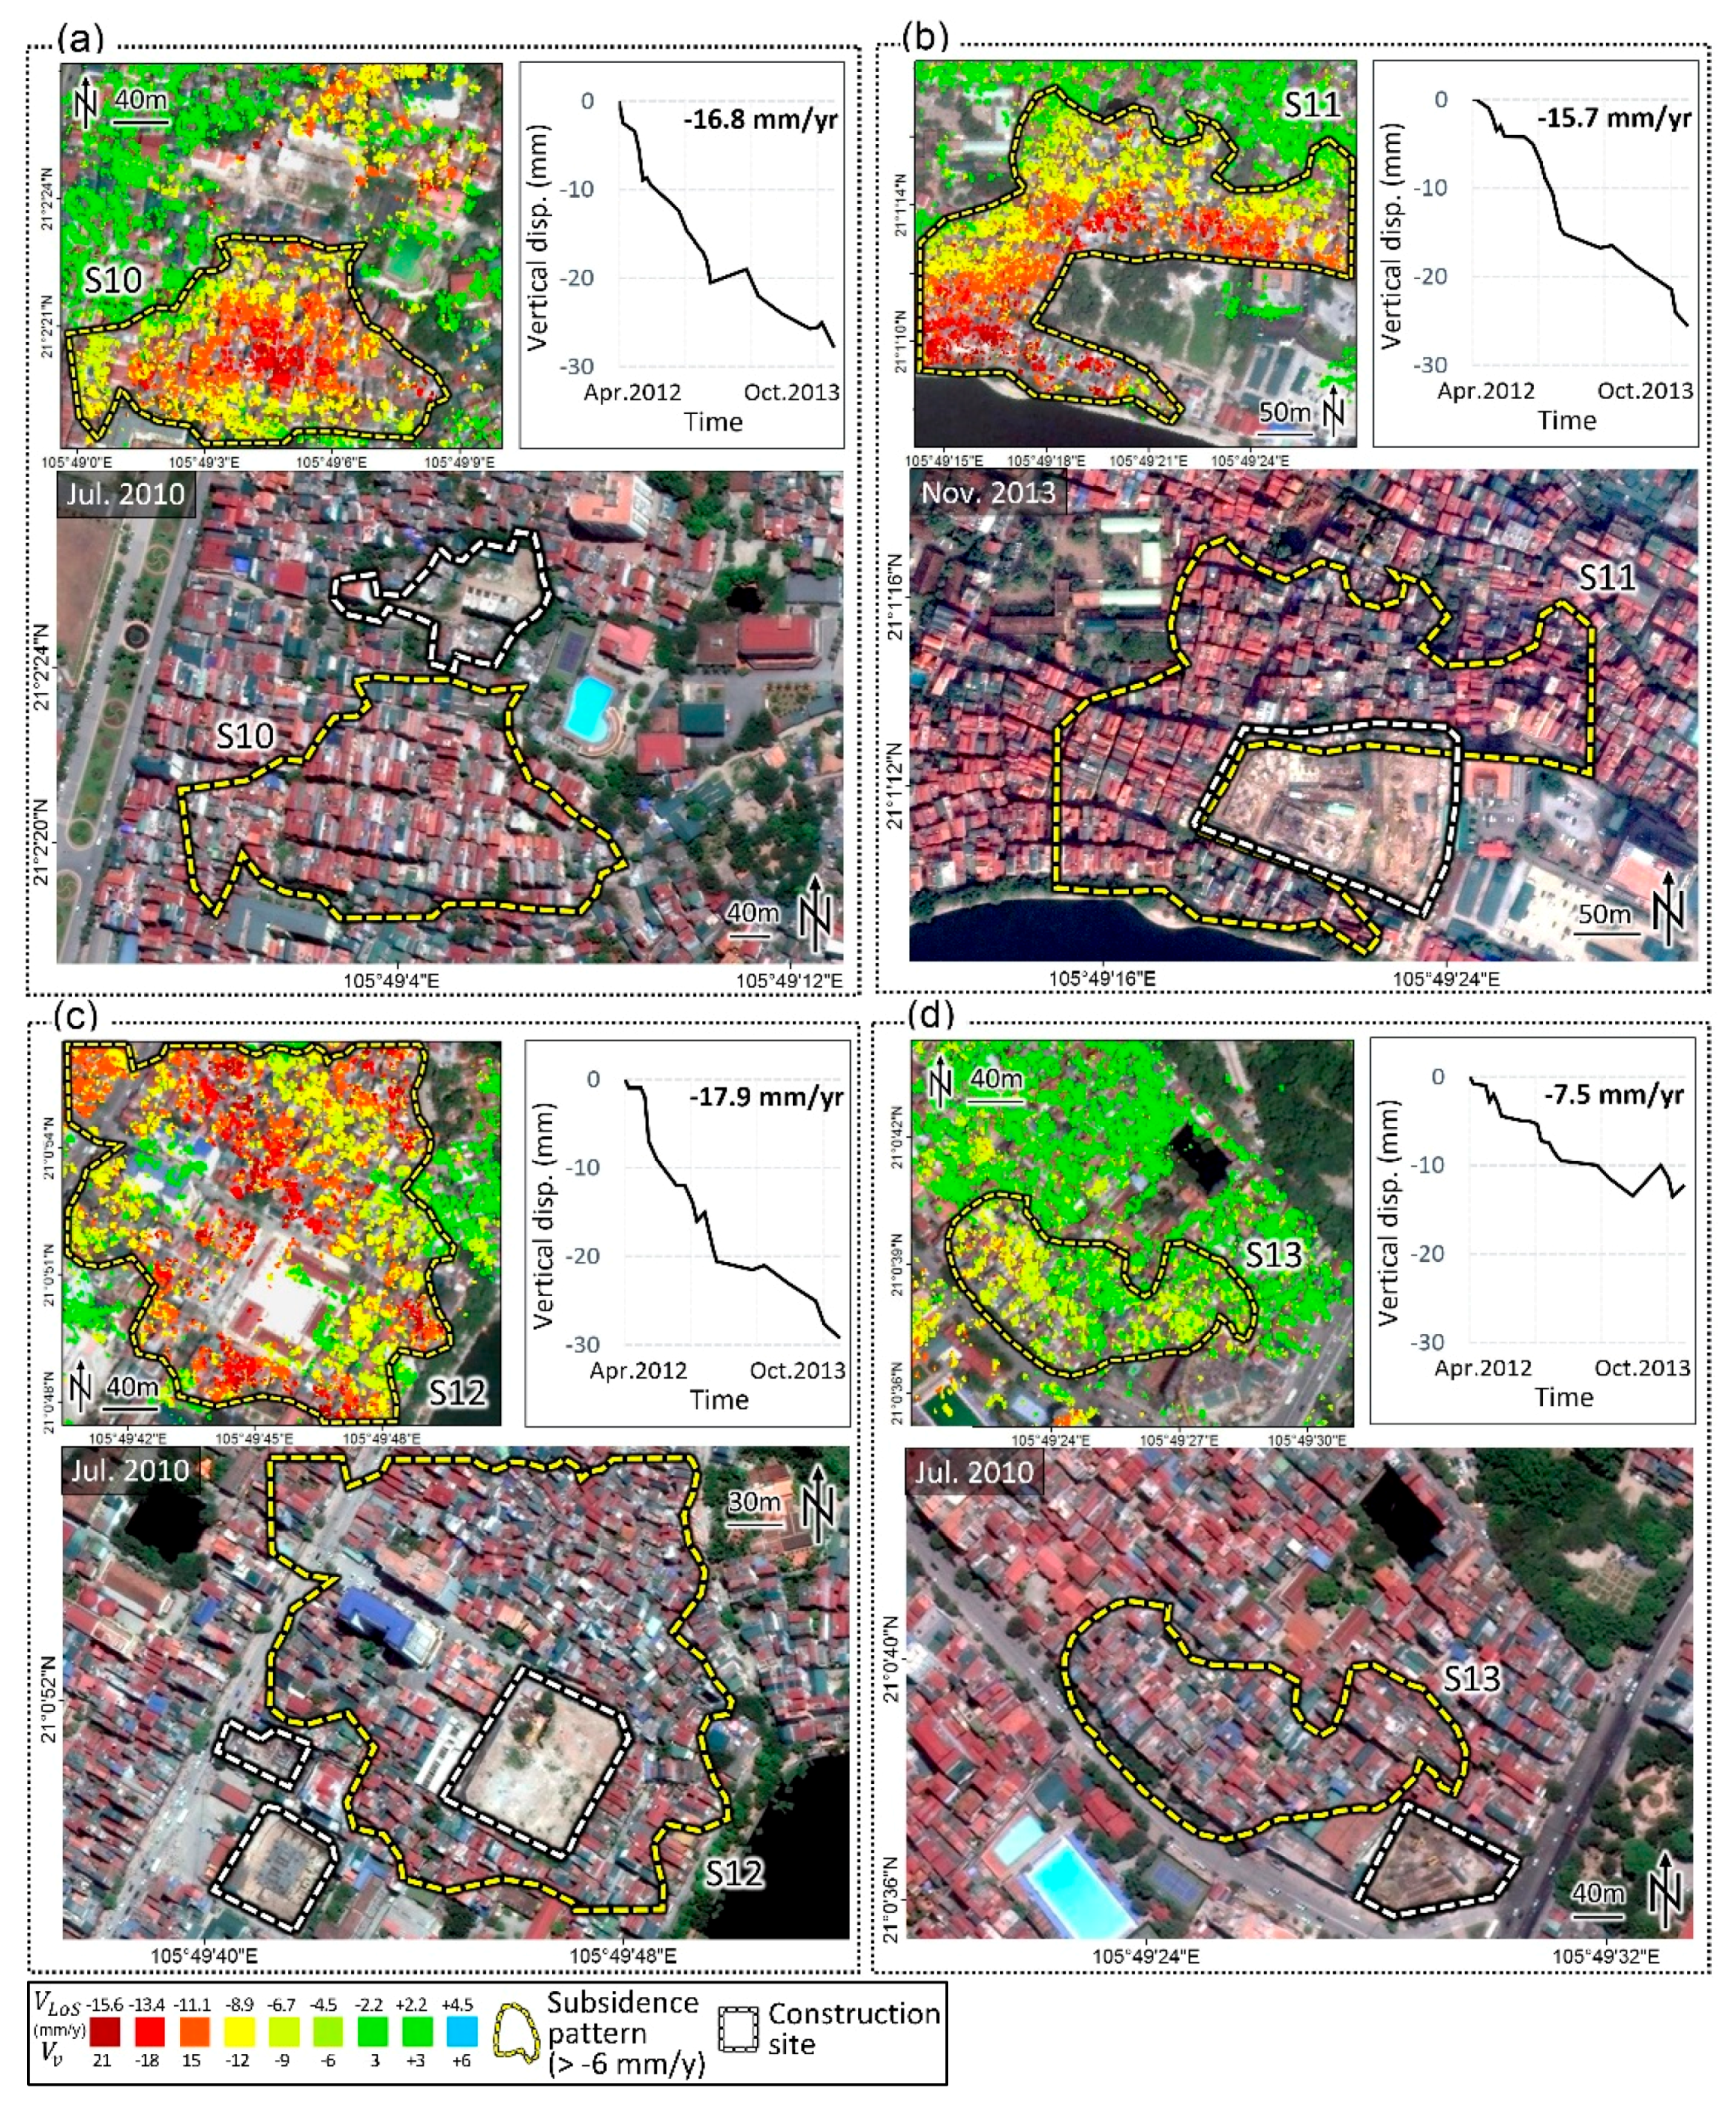
5.1.3. The Old Quarter and French Quarter
5.1.4. Prevailing Subsidence Patterns
5.2. Oversampling Influence on SB InSAR Processing
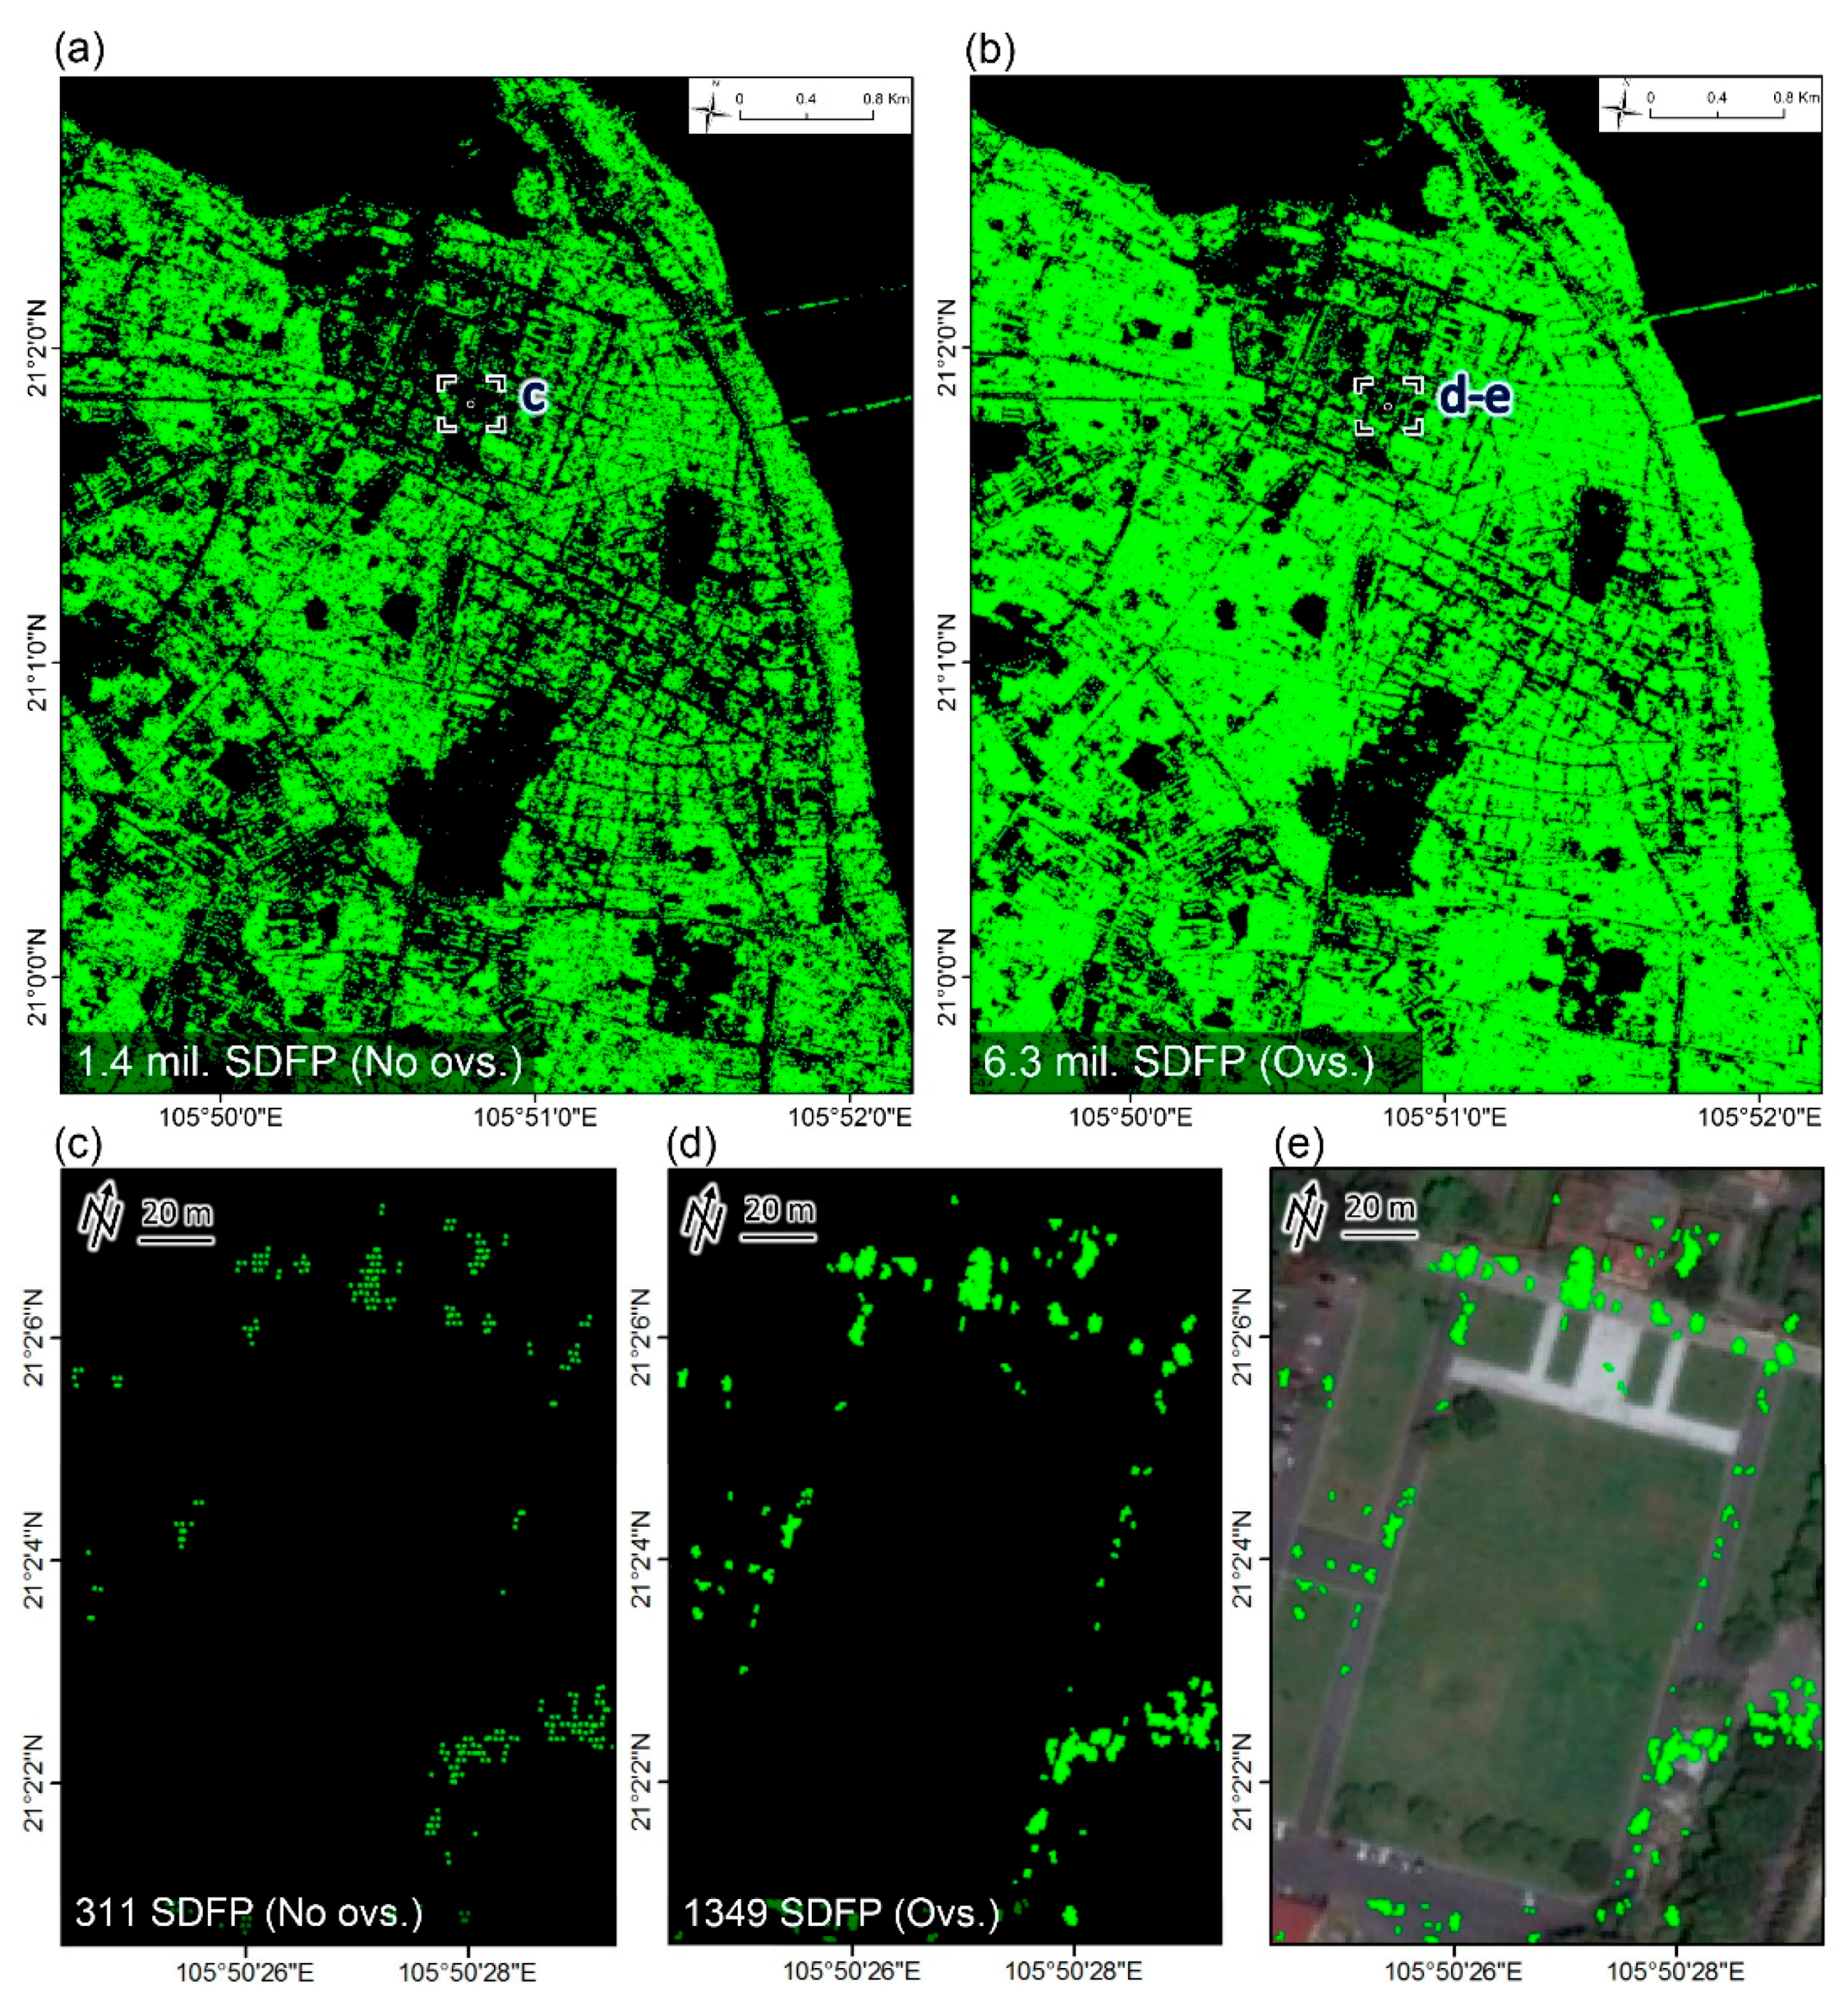
5.2.1. Spatial and Coherence Distribution of Slowly Decorrelating Filtered Phase (SDFP) Pixels
5.2.2. SDFP Density
6. Conclusions
Acknowledgments
Author Contributions
Conflicts of Interest
Appendix

| Site No. | Site Name | No. of SDFP | Average LoS Rate (mm/year) | Maximum LoS Rate (mm/year) | Average Vertical Rate (mm/year) | Maximum Vertical Rate (mm/year) |
|---|---|---|---|---|---|---|
| n/a | The Ceramic Mosaic Mural | 21,801 | −4.8 | −11.5 | −6 | −14.4 |
| 1 | The Imperial Citadel of Thang Long | 21,976 | −1.0 | −3.7 | −1.2 | −4.7 |
| 2 | Ba Dinh Square | 4066 | −0.9 | −2.3 | −1.1 | −2.9 |
| 3 | Ho Chi Minh's vestige | 9125 | −1.3 | −2.3 | −1.6 | −2.9 |
| 4 | The Temple of Literature | 2344 | −2.1 | −4.4 | −2.6 | −5.5 |
| 5 | Quan Thanh Temple | 68 | −1.0 | −2.0 | −1.3 | −2.5 |
| 6 | The Presidential Palace (Indochina General Government) | 968 | −1.8 | −3.7 | −2.3 | −4.7 |
| 7 | One Pillar Pagoda | 17 | −1.8 | −3.4 | −2.3 | −4.3 |
| 8 | Hoe Nhai Pagoda | 41 | −4.1 | −6.0 | −4.8 | −7.5 |
| 9 | Sword Lake | 9141 | −3.3 | −6.5 | −4.2 | −8.2 |
| 10 | White Horse Temple | 142 | −4.2 | −6.8 | −5.3 | −8.5 |
| 11 | Temple of the Jade Mountain | 239 | −1.8 | −3.9 | −2.2 | −4.9 |
| 12 | Turtle Tower | 31 | −2.1 | −3.0 | −2.7 | −3.8 |
| 13 | St. Joseph’s Cathedral | 851 | −3.4 | −7.9 | −4.3 | −9.9 |
| 14 | Hanoi Roman Catholic Archdiocese | 273 | −8.0 | −12.3 | −10 | −15.5 |
| 15 | Hoa Lo Heritage Prison | 90 | −1.3 | −2.7 | −1.6 | −3.4 |
| 16 | Hanoi Opera House | 1793 | −3.0 | −4.5 | −3.8 | −5.7 |
| 17 | Dong Da Mound | 4531 | −4.5 | −7.0 | −5.7 | −8.8 |
| 18 | Hoang Cao Khai Imperial Tomb | 653 | −5.2 | −7.8 | −6.5 | −9.8 |
| 19 | Kim Lien Temple | 77 | −2.0 | −3.7 | −2.5 | −4.7 |
| 20 | Linh Son Pagoda | 129 | −11.5 | −14.7 | −14.5 | −18.5 |
| Label | Subsidence Location (Represented in Figure as Listed) | Average LoS Rate (mm/year) | Average Vertical Rate (mm/year) | Distance to Nearest Construction Site (m) (2010–2013) | Surface Properties | Interpreted Causes of Subsidence |
|---|---|---|---|---|---|---|
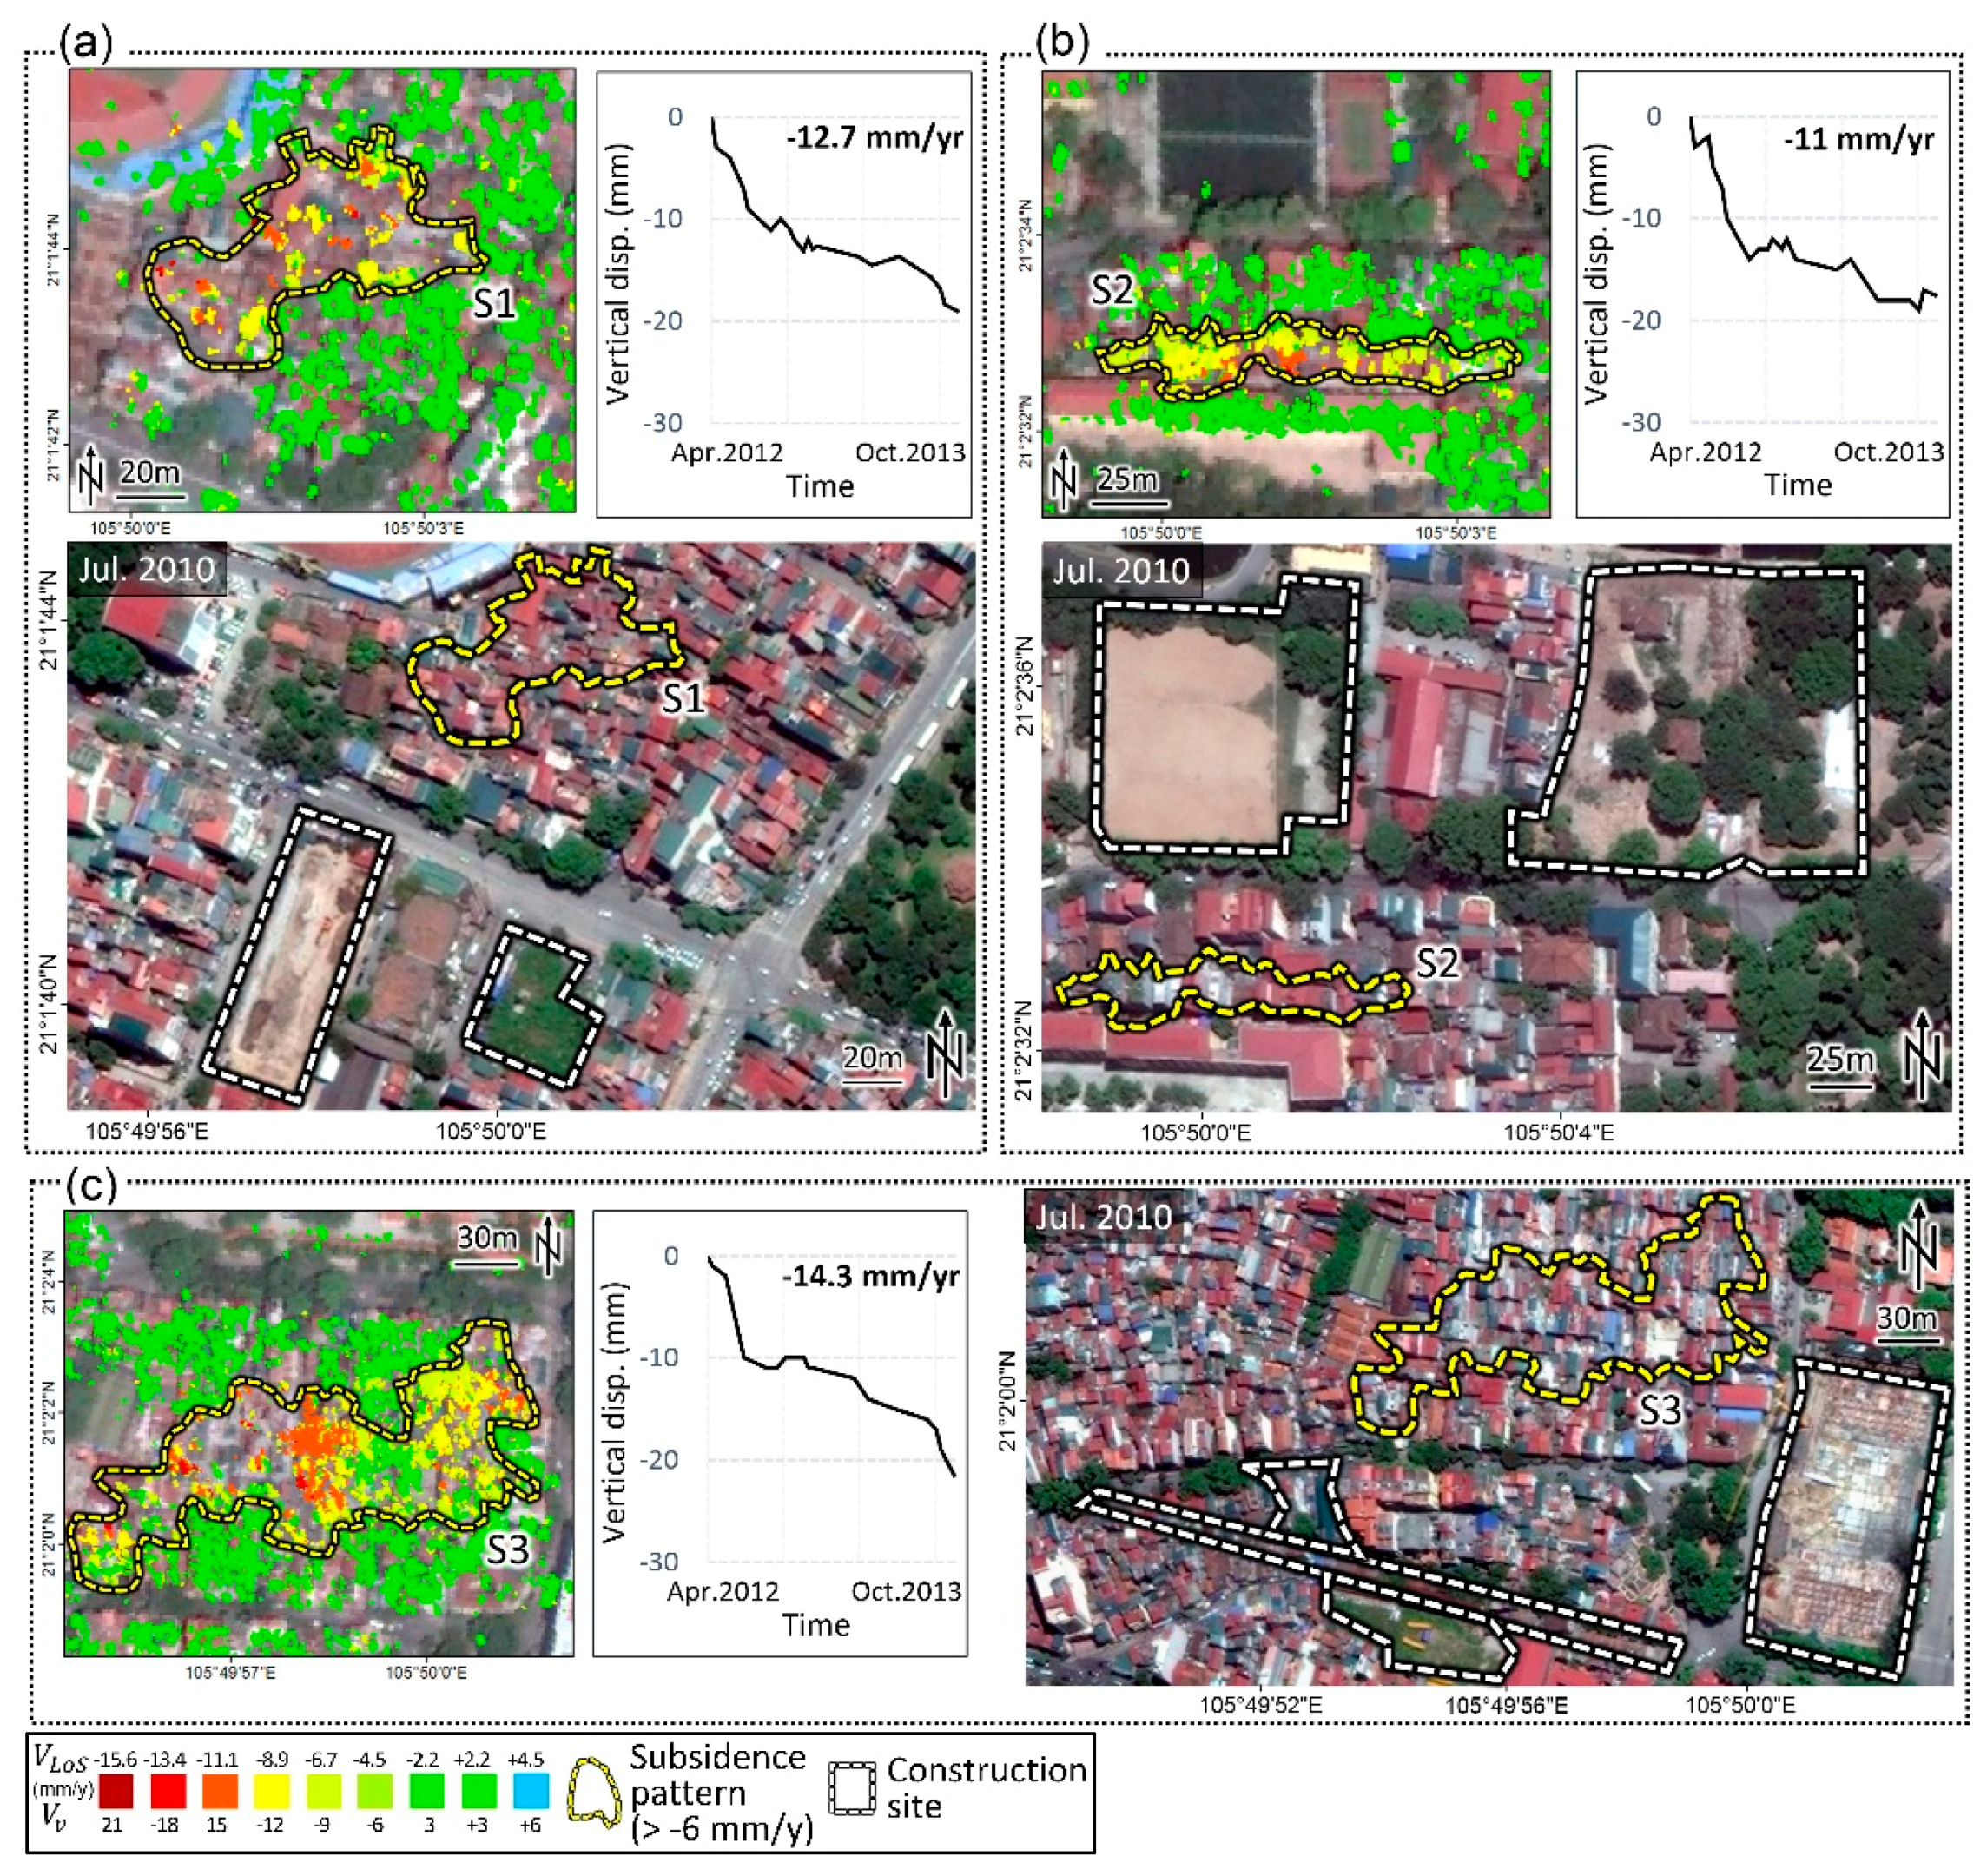
| S1 | Hang Chao (Figure 6a) | −10.1 | −12.7 | 95 | Clay and organic matter | Construction water extraction |
| S2 | Thuy Khue (Figure 6b) | −8.8 | −11 | 36 | Clay | Construction water extraction |
| S3 | Le Hong Phong (Figure 6c) | −11.4 | −14.3 | 104 | Clay and organic matte | Construction water extraction |
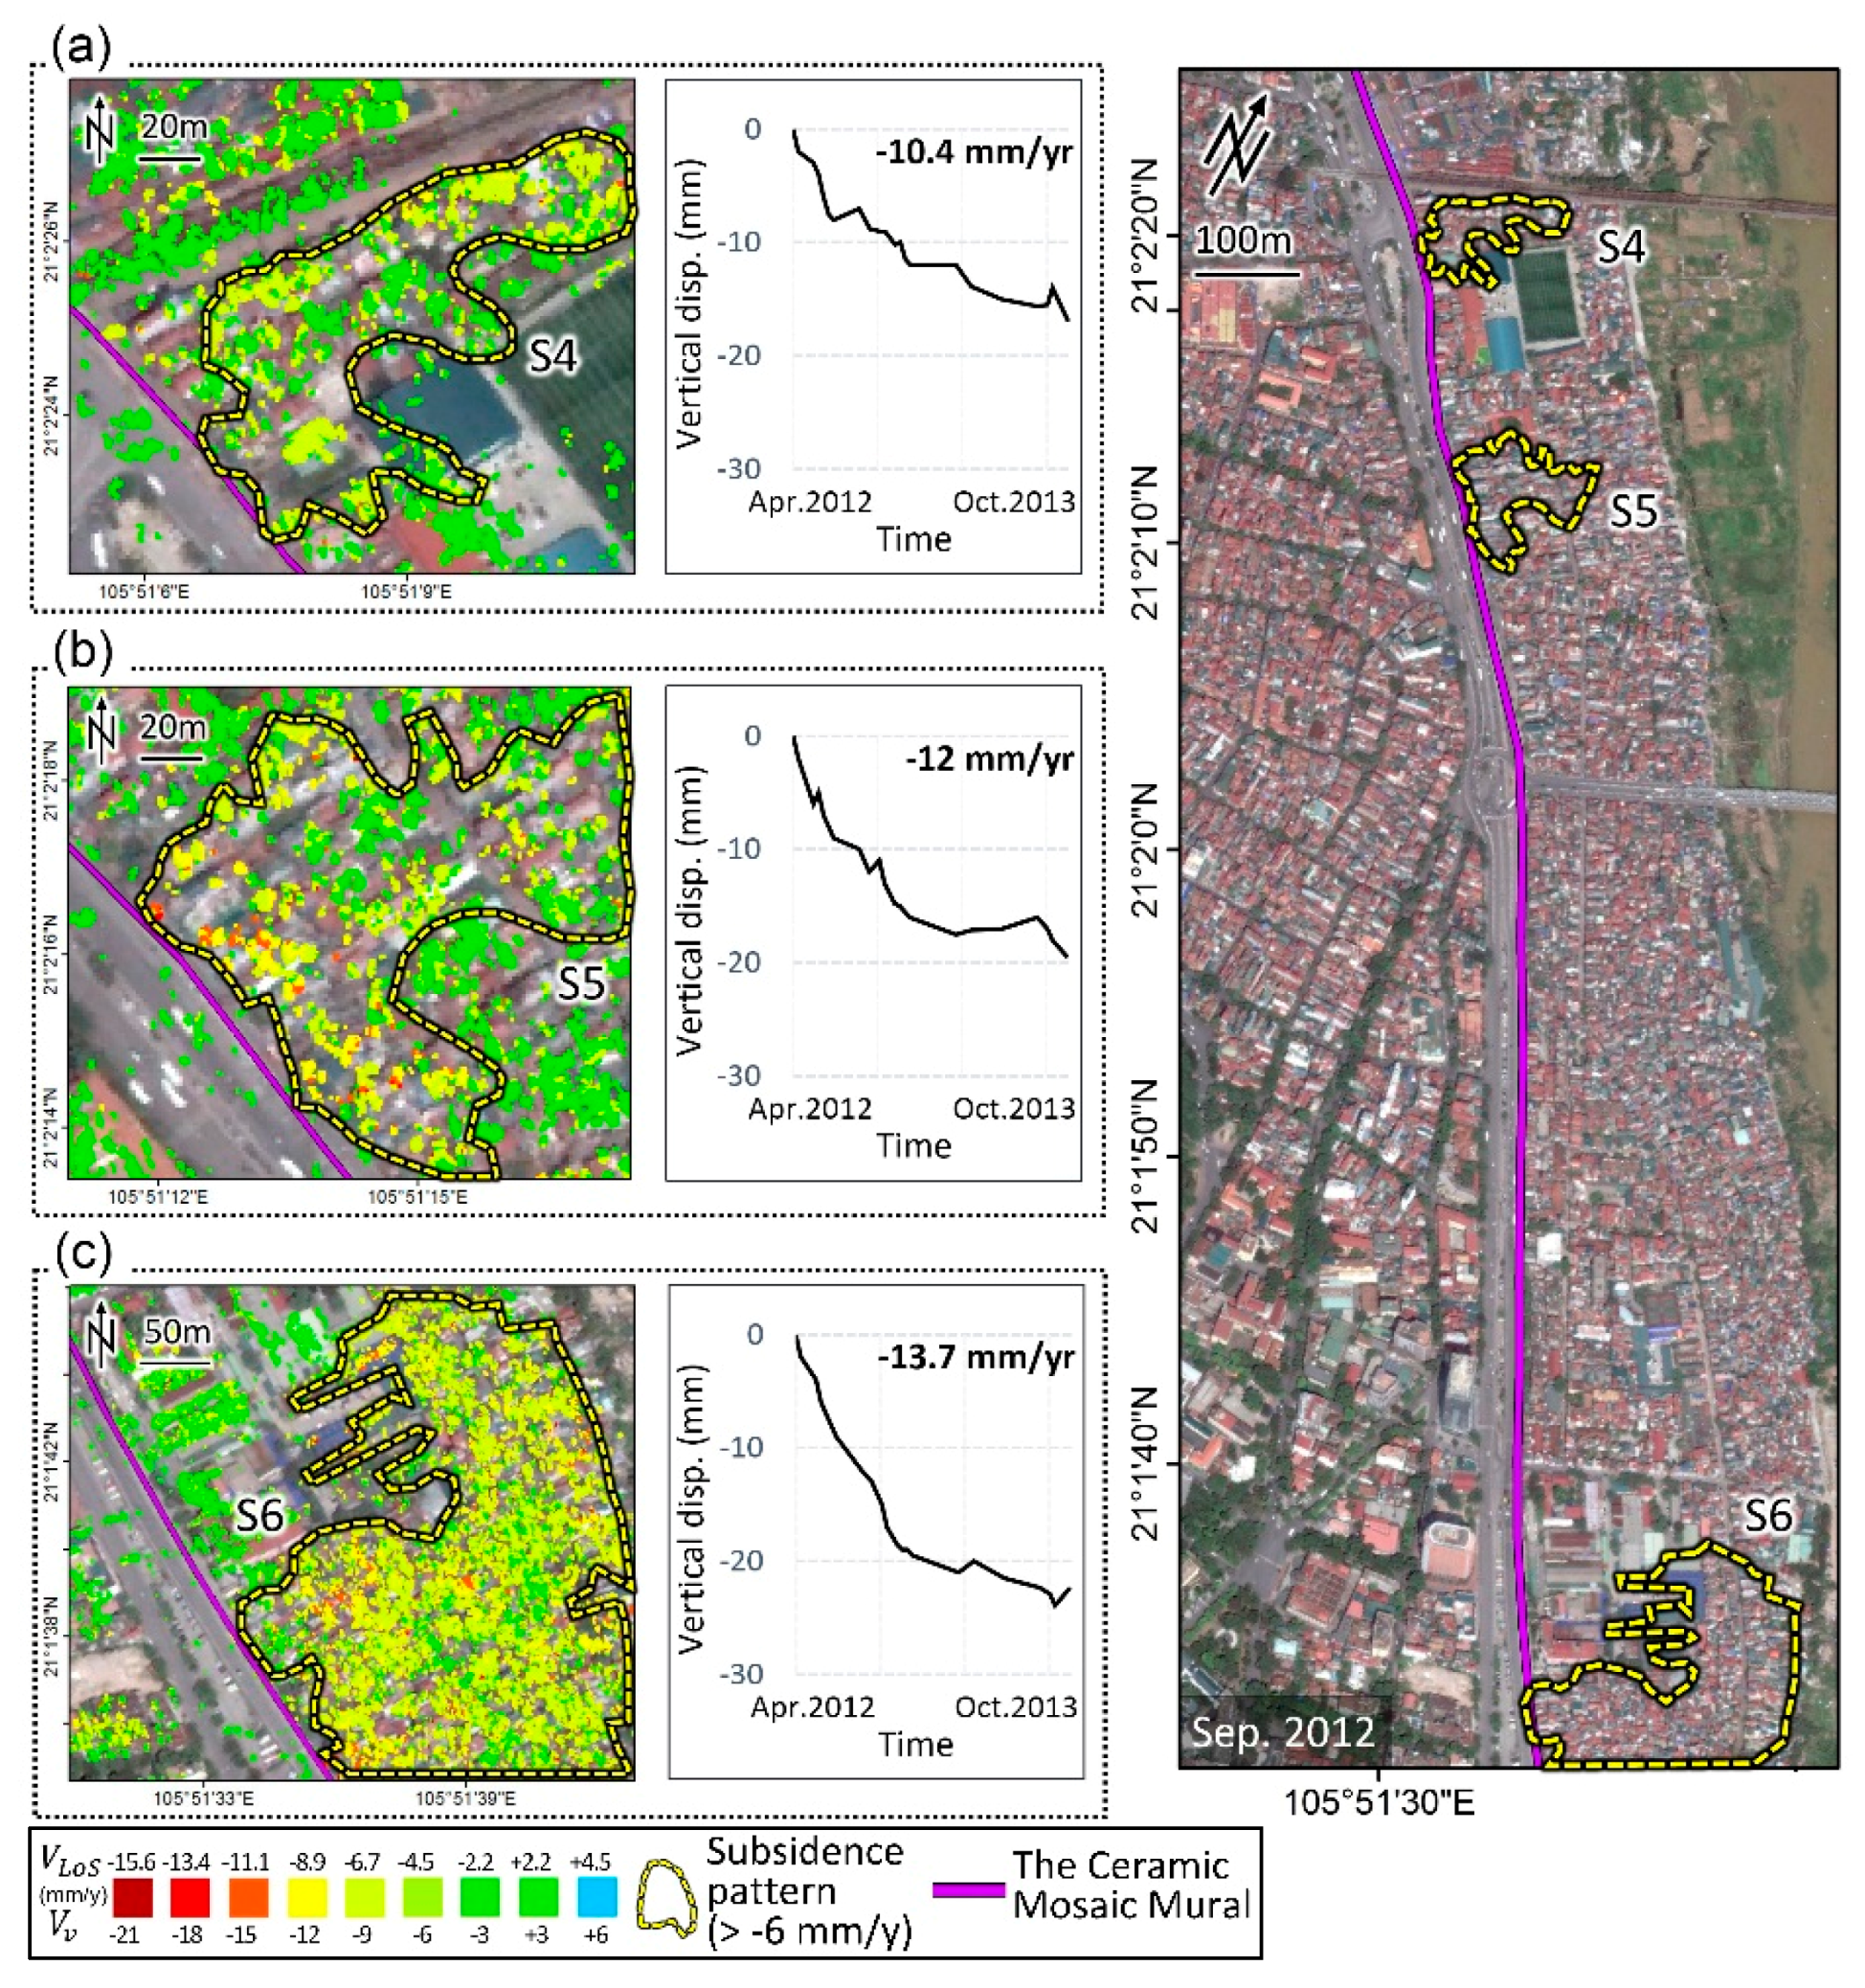
| S4 | Phuc Tan 1 (Figure 7a) | −8.3 | −10.4 | n/a | Sand | Surface geology |
| S5 | Phuc Tan 2 (Figure 7b) | −9.5 | −12 | n/a | Sand | Surface geology |
| S6 | Hong Ha (Figure 7c) | −10.9 | −13.7 | n/a | Sand | Surface geology |
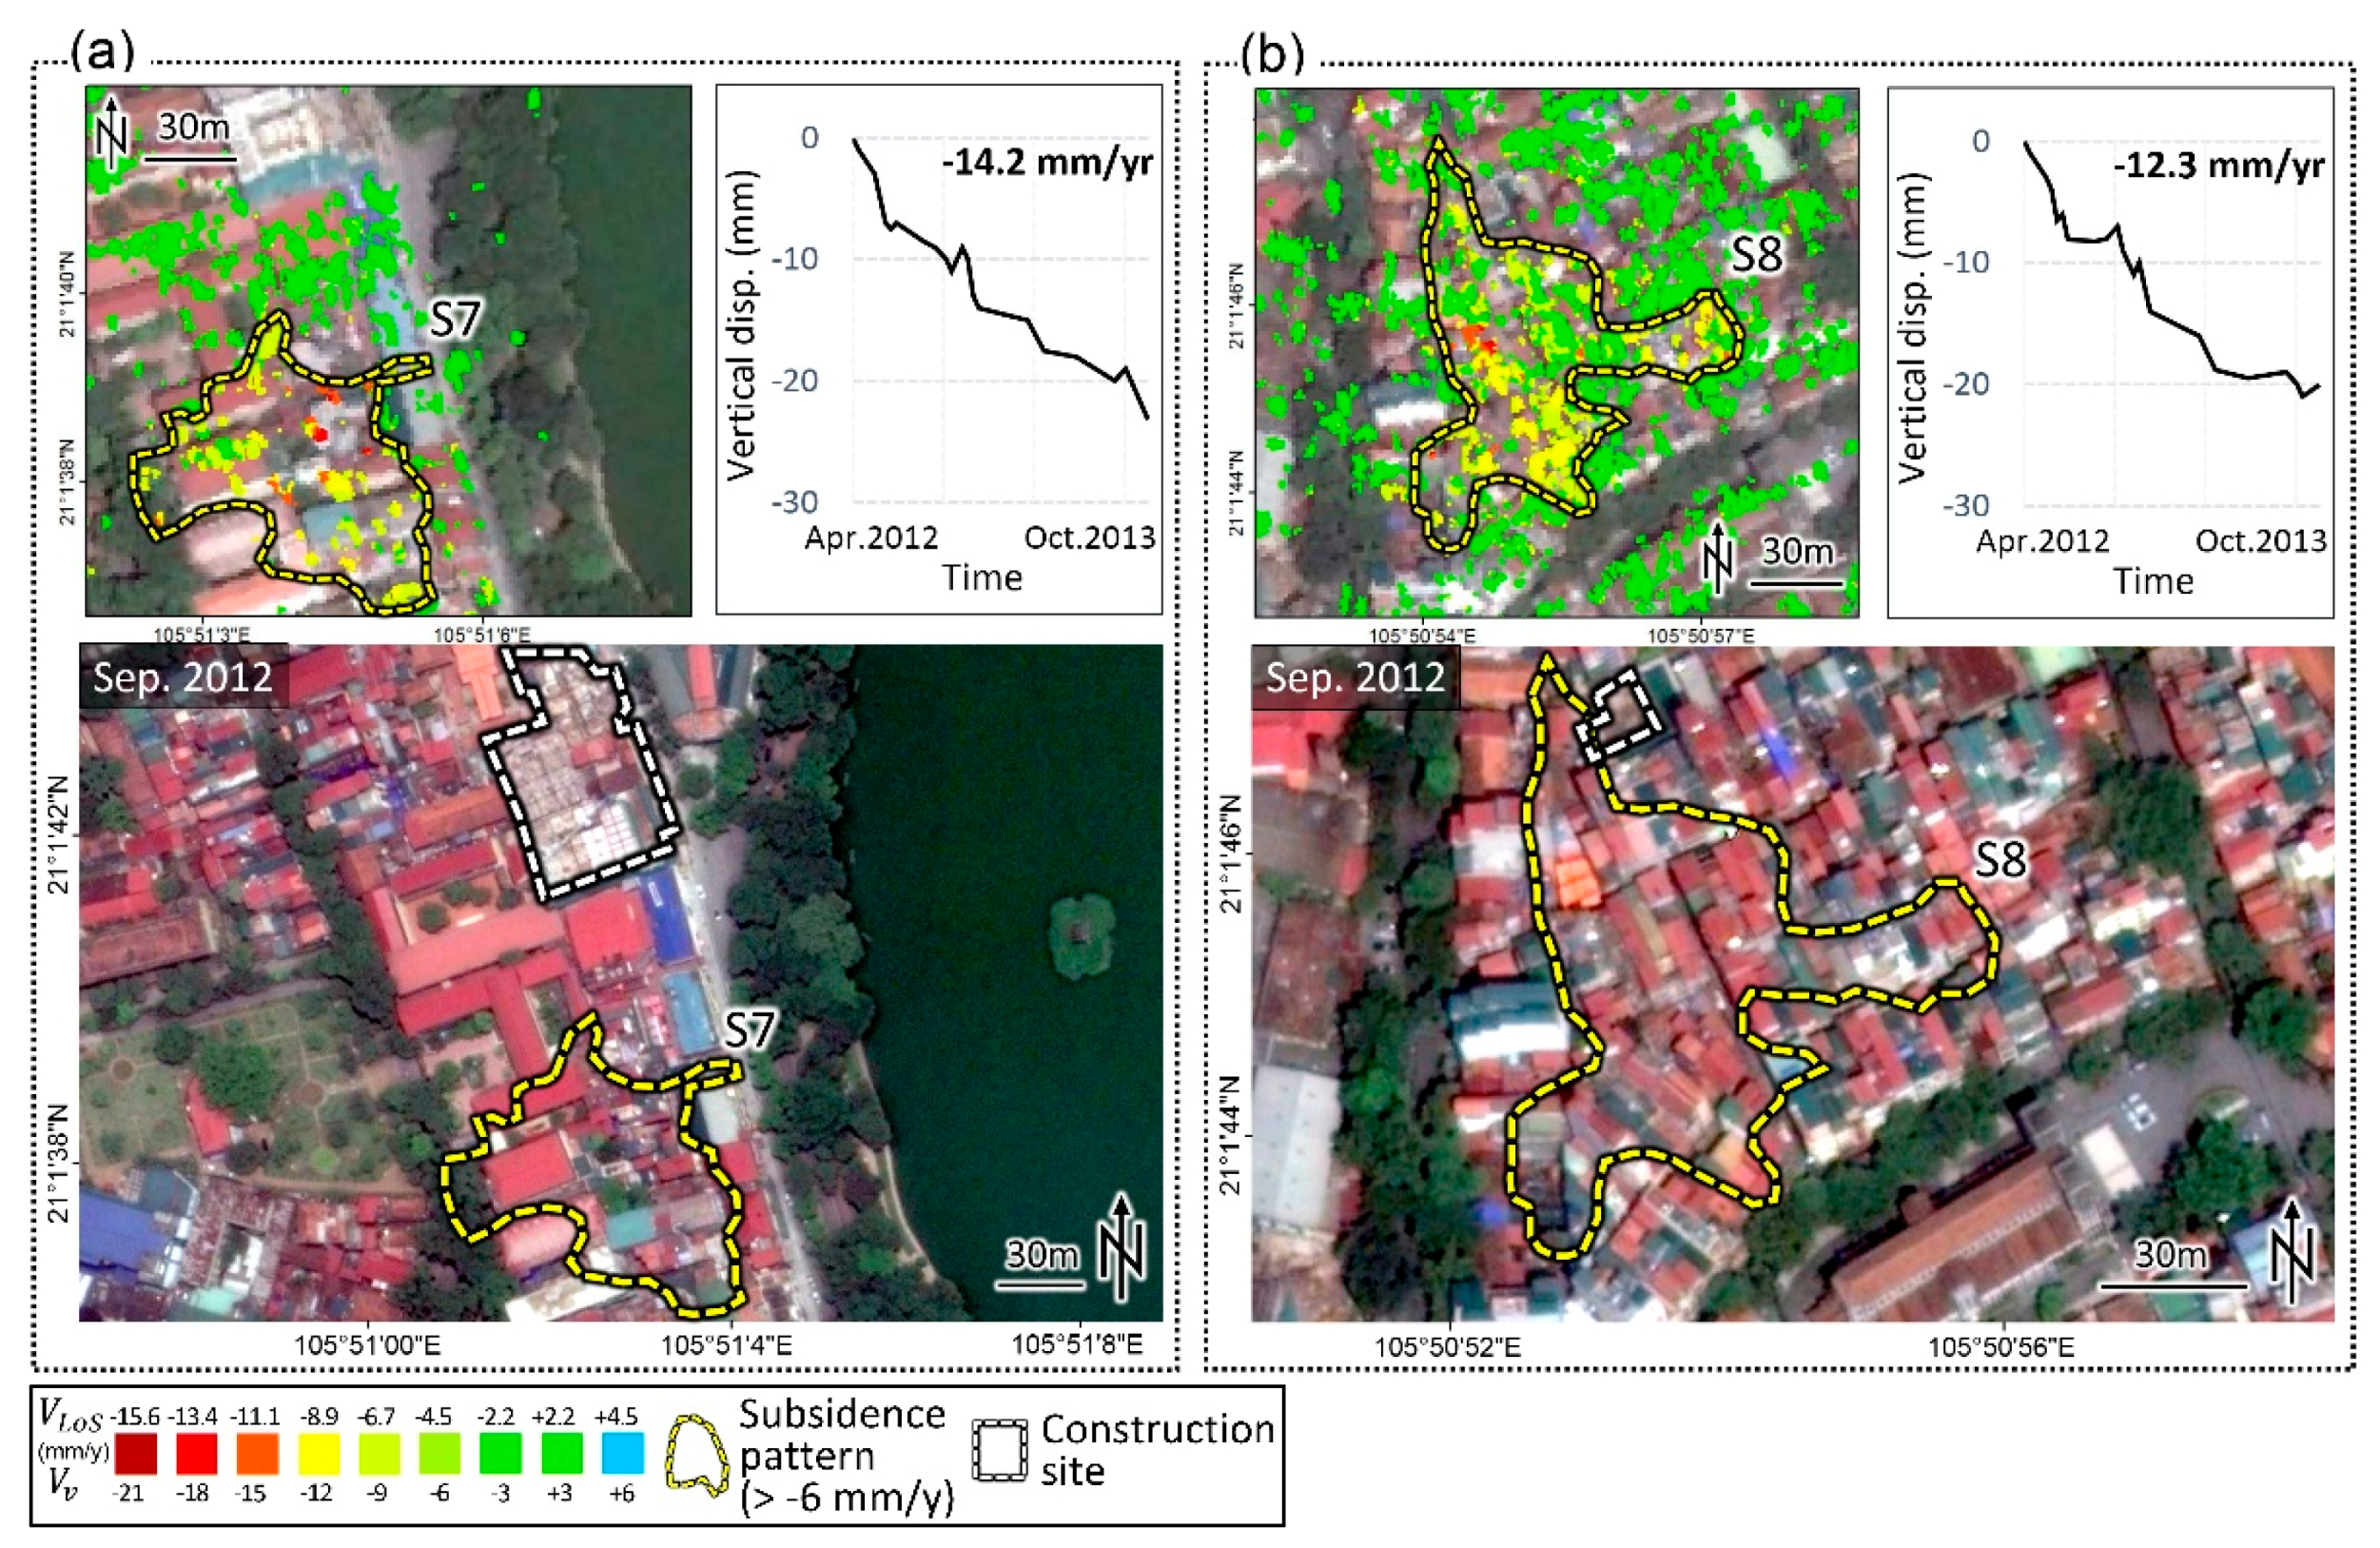
| S7 | Hang Trong (Figure 8a) | −11.3 | −14.2 | 68 | Clay | Construction water extraction |
| S8 | Tho Xuong (Figure 8b) | −9.8 | −12.3 | 65 | Clay | Construction water extraction |
| S9 | Hang Gai | −8.9 | −11.2 | n/a | Clay | n/a |
| S10 | Lieu Giai (Figure 9a) | −13.4 | −16.8 | 17 | Clay and organic matter | Construction activities/Construction water extraction |
| S11 | Dong Da (Figure 9b) | −12.5 | −15.7 | 1 | Clay and organic matter | Construction activities |
| S12 | Kim Hoa (Figure 9c) | −14.4 | −18.1 | 123 | Loamy sand/clay | Surface geology/Domestic water extraction |
| S13 | Thai Ha (Figure 9d) | −6 | −7.5 | 21 | Loamy sand | Surface geology/Construction water extraction |
| S14 | Nguyen Luong Bang | −14.2 | −17.9 | 6 | Loamy sand | Surface geology/Construction water extraction |
| S15 | Tran Khat Chan 1 | −14.1 | −17.7 | 96 | Clay | Construction/Domestic water extraction |
| S16 | Bach Mai | −9.7 | −12.2 | n/a | Clay | Domestic water extraction |
| S17 | Tran Khat Chan 2 | −11.8 | −14.8 | n/a | Clay | Domestic water extraction |
| S18 | Kim Nguu | −13.7 | −17.2 | n/a | Clay | Domestic water extraction |
References
- Nguyen, Q.T.; Helm, D.C. Land subsidence due to ground water withdrawal in Hanoi, Vietnam. In Proceedings of the Fifth International Symposium on Land Subsidence, The Hague, The Netherlands, 16–20 October 1995.
- Thu, T.M.; Fredlund, D.G. Modelling subsidence in the Hanoi city area, Vietnam. Can. Geotech. J. 2000, 37, 621–637. [Google Scholar]
- Phi, T.H.; Strokova, L.A. Prediction maps of land subsidence caused by groundwater exploitation in Hanoi, Vietnam. Resour-Effict. Technol. 2015, 1, 80–89. [Google Scholar] [CrossRef]
- Raucoules, D.; Carnec, C. DEM derivation and subsidence detection on Hanoi from ERS SAR Interferometry. In Proceedings of the FRINGE '99 Workshop: Advancing ERS SAR Interferometry from Applications towards Operations, Liège, Belgium, 10–12 November 1999; ESA SP-478. 2000. [Google Scholar]
- Tran, V.A.; Masumoto, S.; Raghavan, V.; Shiono, K. Spatial distribution of subsidence in Hanoi detected by JERS-1 SAR interferometry. Geoinformatics 2007, 18, 3–13. [Google Scholar]
- Dang, V.K.; Doubre, C.; Weber, C.; Gourmelen, N.; Masson, F. Recent land subsidence caused by the rapid urban development in the Hanoi region (Vietnam) using ALOS InSAR data. Nat. Hazards Earth Syst. Sci. 2014, 14, 657–674. [Google Scholar] [CrossRef]
- Le, S.T.; Chang, C.P. Surface deformation assessments in Hanoi, Vietnam using ALOS PALSAR interferometry. In Proceedings of the 36th Asian Conference on Remote Sensing (ACRS 2015), Manila, Philippines, 19–23 October 2015.
- Luo, Q.; Perissin, D.; Lin, H.; Zhang, Y.; Wang, W. Subsidence monitoring of Tianjin suburbs by TerraSAR-X Persistent Scatterers interferometry. IEEE J-STARS. 2014, 7, 1642–1650. [Google Scholar] [CrossRef]
- Report on Area, Population and Population Density in 2011 by Province. Available online: http://www.gso.gov.vn/default.aspx?tabid=387&idmid=3&ItemID=12875 (accessed on 15 January 2016).
- Mathers, S.; Zalasiewicz, J. Holocene sedimentary architecture of the Red River Delta, Vietnam. J. Coastal Res. 1999, 15, 314–325. [Google Scholar]
- Nguyen, D.D. Geological map of Hanoi city; Northern Division of Planning and Investigation for Water Resources: Hanoi, Vietnam, 1996. [Google Scholar]
- Prati, C.; Ferretti, A.; Perissin, D. Recent advances on surface ground deformation measurement by means of repeated space-borne SAR observations. J. Geodyn. 2010, 49, 161–170. [Google Scholar] [CrossRef]
- Farr, T.G.; Rosen, P.A.; Caro, E.; Crippen, R.; Duren, R.; Hensley, S.; Kobrick, M.; Paller, M.; Rodriguez, E.; Roth, L.; et al. The Shuttle Radar Topography Mission. Rev. Geophys. 2007, 45. [Google Scholar] [CrossRef]
- Reuter, H.I.; Nelson, A.; Jarvis, A. An evaluation of void-filling interpolation methods for SRTM data. Int. J. Geogr. Inf. Sci. 2007, 21, 983–1008. [Google Scholar] [CrossRef]
- Lanari, R.; Lundgren, P.; Manzo, M.; Casu, F. Satellite radar interferometry time series analysis of surface deformation for Los Angeles, California. Geophys. Res. Lett. 2004, 31. [Google Scholar] [CrossRef]
- Berardino, P.; Fornaro, G.; Lanari, R.; Sansosti, E. A new algorithm for surface deformation monitoring based on small baseline differential SAR interferograms. IEEE T. Geosci. Remote 2002, 40, 2375–2383. [Google Scholar] [CrossRef]
- Hooper, A. A multi-temporal InSAR method incorporating both persistent scatterer and small baseline approaches. Geophys. Res. Lett. 2008, 35. [Google Scholar] [CrossRef]
- Ketelaar, V.B.H. Satellite Radar Interferometry: Subsidence Monitoring Techniques; Springer: Berlin, Germany, 2009. [Google Scholar]
- Sousa, J.J.; Hooper, A.J.; Hanssen, R.F.; Bastos, L.C.; Ruiz, A.M. Persistent Scatterer InSAR: A comparison of methodologies based on a model of temporal deformation vs. spatial correlation selection criteria. Remote. Sens. Environ. 2011, 115, 2652–2663. [Google Scholar] [CrossRef]
- Arıkan, M.; Hooper, A.; Hanssen, R. Radar time series analysis over West Anatolia. In Proceedings of the FRINGE 2009, Frascati, Italy, 30 November–4 December 2009; ESA SP-677. 2010. Available online: http://earth.eo.esa.int/workshops/fringe09/proceedings/papers/p1_25arik.pdf (accessed on 15 January 2016). [Google Scholar]
- Hanssen, R.F. Radar Interferometry: Data Interpretation and Error Analysis; Kluwer Academic Publishers: Dordrecht, The Netherlands, 2001. [Google Scholar]
- Hooper, A. Persistent Scatterer Radar Interferometry for Crustal Deformation Studies and Modeling of Volcanic Deformation. Ph.D. Thesis, Stanford University, Stanford, CA, USA, May 2006. [Google Scholar]
- Chang, C.P.; Wang, C.T.; Chang, T.Y.; Chen, K.S.; Liang, L.S.; Pathier, E.; Angelier, J. Application of SAR interferometry to a large thrust deformation: the 1999 Mw = 7.6 Chichi earthquake in central Taiwan. Geophys. J. Int. 2004, 159, 9–16. [Google Scholar] [CrossRef]
- Massonnet, D.; Feigl, K.L. Radar interferometry and its application to changes in the Earth’s surface. Rev. Geophys. 1998, 36, 441. [Google Scholar] [CrossRef]
- Bürgmann, R.; Rosen, P.A.; Fielding, E.J. Synthetic Aperture Radar interferometry to measure Earth’s surface topography and its deformation. Annu. Rev. Earth Pl. Sci. 2000, 28, 169–209. [Google Scholar] [CrossRef]
- Goldstein, R.M.; Werner, C.L. Radar interferogram filtering for geophysical applications. Geophys. Res. Lett. 1998, 25, 4035–4038. [Google Scholar] [CrossRef]
- Kampes, B.; Hanssen, R.F.; Perski, Z. Radar interferometry with public domain tools. In Proceedings of the FRINGE 2003 Workshop, Frascati, Italy, 1–5 December 2003; ESA SP-550. 2004. Available online: http://doris.tudelft.nl/Literature/kampes03b.pdf (accessed on 15 January 2016). [Google Scholar]
- Ferretti, A.; Prati, C.; Rocca, F. Permanent scatterers in SAR interferometry. IEEE Trans. Geosci. Remote 2001, 39, 8–20. [Google Scholar] [CrossRef]
- Hooper, A.; Segall, P.; Zebker, H. Persistent scatterer interferometric synthetic aperture radar for crustal deformation analysis, with application to Volcán Alcedo, Galápagos. J. Geophys Res. 2007, 112. [Google Scholar] [CrossRef]
- Hooper, A.; Zebker, H.; Segall, P.; Kampes, B. A new method for measuring deformation on volcanoes and other natural terrains using InSAR persistent scatterers. Geophys. Res. Lett. 2004, 31. [Google Scholar] [CrossRef]
- Hooper, A.; Zebker, H.A. Phase unwrapping in three dimensions with application to InSAR time series. J. Opt. Soc. Am. A 2007, 24, 2737–2747. [Google Scholar] [CrossRef]
- Peltzer, G.; Rosen, P.; Rogez, F.; Hudnut, K. Poroelastic rebound along the Landers 1992 earthquake surface rupture. J. Geophys Res. 1998, 103, 30131. [Google Scholar] [CrossRef]
- Sladen, J.A.; D‘Hollander, R.D.; Krahn, J. The liquefaction of sands, a collapse surface approach. Can. Geotech. J. 1985, 22, 564–578. [Google Scholar] [CrossRef]
- Jefferies, M.; Been, K. Soil liquefaction: A Critical State Approach, 2nd ed.; Crc Press: New York, NY, USA, 2015. [Google Scholar]
- Martin, G.R.; Finn, W.D.L.; Seed, H.B. Fundamentals of Liquefaction Under Cyclic Loading; Department of Civil Engineering, University of British Columbia: Vancouver, BC, Canada, 1974. [Google Scholar]
- Logan, W. Heritage planning in post-Doi Moi Hanoi: The national and international contributions. J. Am. Plann. Assoc. 1995, 61, 328–343. [Google Scholar] [CrossRef]
- Cigna, F.; Lasaponara, R.; Masini, N.; Milillo, P.; Tapete, D. Persistent Scatterer Interferometry processing of COSMO-SkyMed StripMap HIMAGE time series to depict deformation of the Historic Centre of Rome, Italy. Remote Sens. 2014, 6, 12593–12618. [Google Scholar] [CrossRef] [Green Version]


| Land Cover Class | No. SDFP (No ovs.) | No. SDFP (Ovs.) | Land Cover Class Coverage (km2) | SDFP Density without ovs. (SDFP/km2) | SDFP Density with Ovs. (SDFP/km2) |
|---|---|---|---|---|---|
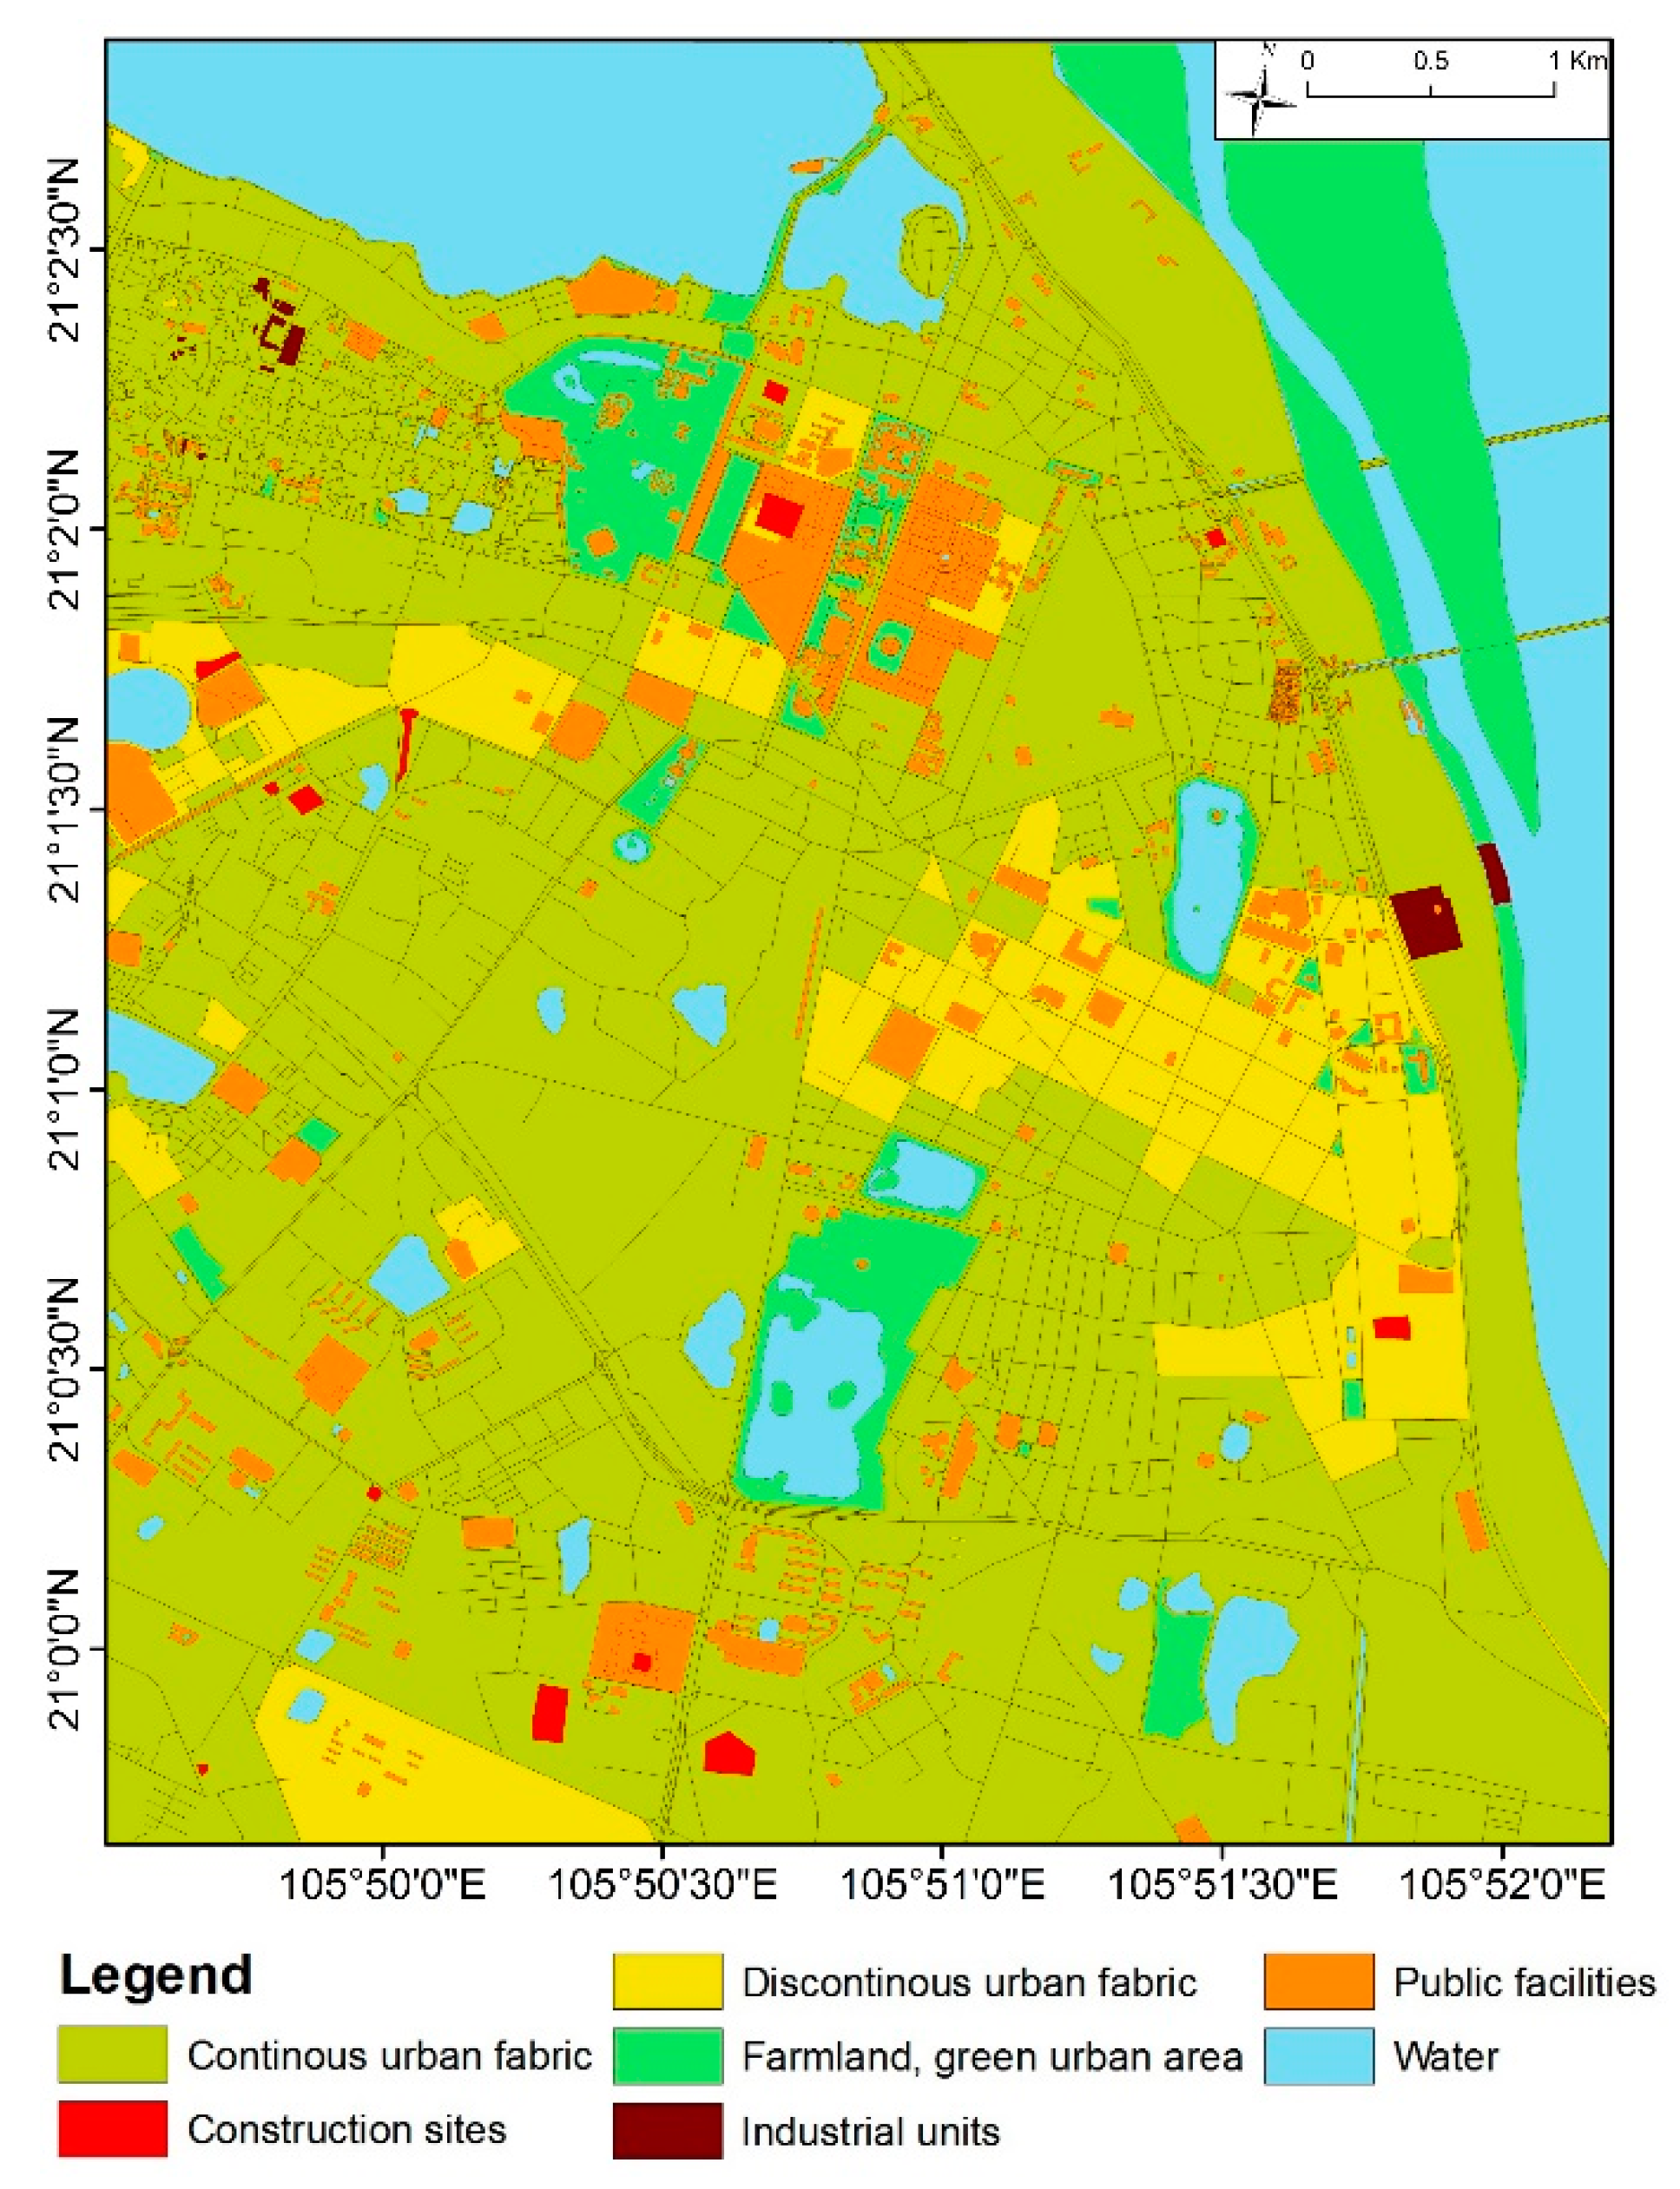
| Continuous urban fabric | 747,578 | 3,313,949 | 17.19 | 43,480 | 192,743 |
| Discontinuous urban fabric | 73,116 | 325,172 | 2.82 | 25,947 | 115,396 |
| Construction sites | 150 | 672 | 0.09 | 1659 | 7434 |
| Green urban areas | 5089 | 18,077 | 2.38 | 2135 | 7584 |
| Industrial units | 1613 | 6775 | 0.07 | 23,874 | 100,279 |
| Public facilities | 18,014 | 78,361 | 1.82 | 9880 | 42,979 |
| Water bodies | 479 | 2119 | 4.60 | 104 | 460 |
© 2016 by the authors; licensee MDPI, Basel, Switzerland. This article is an open access article distributed under the terms and conditions of the Creative Commons Attribution (CC-BY) license (http://creativecommons.org/licenses/by/4.0/).
Share and Cite
Le, T.S.; Chang, C.-P.; Nguyen, X.T.; Yhokha, A. TerraSAR-X Data for High-Precision Land Subsidence Monitoring: A Case Study in the Historical Centre of Hanoi, Vietnam. Remote Sens. 2016, 8, 338. https://0-doi-org.brum.beds.ac.uk/10.3390/rs8040338
Le TS, Chang C-P, Nguyen XT, Yhokha A. TerraSAR-X Data for High-Precision Land Subsidence Monitoring: A Case Study in the Historical Centre of Hanoi, Vietnam. Remote Sensing. 2016; 8(4):338. https://0-doi-org.brum.beds.ac.uk/10.3390/rs8040338
Chicago/Turabian StyleLe, Tuan S., Chung-Pai Chang, Xuan T. Nguyen, and Akano Yhokha. 2016. "TerraSAR-X Data for High-Precision Land Subsidence Monitoring: A Case Study in the Historical Centre of Hanoi, Vietnam" Remote Sensing 8, no. 4: 338. https://0-doi-org.brum.beds.ac.uk/10.3390/rs8040338