Article

Time Series MODIS and in Situ Data Analysis for Mongolia Drought

by
Munkhzul Dorjsuren
1,2,3,
Yuei-An Liou
1,2,4,* and
Chi-Han Cheng
4,5
1
Graduate Institute of Space Science, National Central University, Jhongli District, Taoyuan City 320, Taiwan
2
Center for Space and Remote Sensing Research, National Central University, Jhongli District, Taoyuan City 320, Taiwan
3
Information and Research Institute of Meteorology, Hydrology and Environment, Ulaanbaatar 15160, Mongolia
4
Taiwan Group on Earth Observation, Zhubei City 30274, Hsinchu County, Taiwan
5
Applied Hydrometeorological Research Institute, Nanjing University of Information Science & Technology, Nanjing 210044, China
*
Author to whom correspondence should be addressed.
Submission received: 25 March 2016 / Revised: 9 May 2016 / Accepted: 2 June 2016 / Published: 16 June 2016
(This article belongs to the Special Issue Earth Observations for a Better Future Earth)

Abstract

:
Drought is a period of abnormally dry weather with a serious shortage of water supply. Drought indices can be an advantageous indicator to assess drought for taking further response actions. However, drought indices based on ground meteorological measurements could not completely reveal the land use effects over a regional scale. On the other hand, the satellite-derived products provide consistent, spatial and temporal comparisons of global signatures for the regional-scale drought events. This research is to investigate the drought signatures over Mongolia by using satellite remote sensing imagery. The evapotranspiration (ET), potential evapotranspiration (PET) and two-band Enhanced Vegetation Index (EVI2) were extracted from MODIS data. Based on the standardized ratio of ET to PET (ET/PET) and EVI2, the Modified Drought Severity Index (MDSI) anomaly during the growing season from May–August for the years 2000–2013 was acquired. Fourteen-year summer monthly data for air temperature, precipitation and soil moisture content of in situ measurements from sixteen meteorological stations for four various land use areas were analyzed. We also calculated the percentage deviation of climatological variables at the sixteen stations to compare to the MDSI anomaly. Both comparisons of satellite-derived and observed anomalies and variations were analyzed by using the existing common statistical methods. The results demonstrated that the air temperature anomaly (T anomaly) and the precipitation anomaly (P anomaly) were negatively (correlation coefficient r = −0.66) and positively (r = 0.81) correlated with the MDSI anomaly, respectively. The MDSI anomaly distributions revealed that the wettest area occupied 57% of the study area in 2003, while the driest (drought) area occurred over 54% of the total area in 2007. The results also showed very similar variations between the MDSI and T anomalies. The highest (wettest) MDSI anomaly indicated the lowest T anomaly, such as in the year 2003, while the lowest (driest) MDSI anomaly had the highest T anomaly in 2007. By comparing the MDSI anomaly and soil moisture content at a 10-cm depth during the study period, it is found that their correlation coefficient is 0.74.

Graphical Abstract

1. Introduction

Mongolia has a severe climate with high seasonal variations and a low annual average in rainfall [1]. Based on climatic characteristics, the meteorological drought impacts on agricultural products are precipitation shortages, differences between actual and potential evapotranspiration (PET) and other physiologic factors of the soil and biomass. Hence, poor biomass production would cause huge economic losses for the livestock industry due to the drought impacts in summer [2]. For example, tens of millions of livestock were lost after the drought and harsh winter in the last decade, and thus, the lives of hundreds of thousands of people were forced to change. Monitoring and even forecasting of drought becomes crucial to Mongolia. Drought indices that consist of a large amount of data, such as precipitation, snowpack, streamflow and other water supply indicators, can be applied to monitor drought severities in a comprehensive framework [3].
It is known that the major limitation of the ground in situ data is the observational data that cannot be effectively used to monitor and evaluate the drought events over a large area. By contrast, remote sensing techniques provide a better solution for monitoring drought conditions over a large scale at early stages because of its wide coverage, high spatial resolution, easy access and relatively lower expense [4]. In the field of remote sensing, reflectance and thermal datasets of satellite images are used for developing drought indices. One of the most reliable sources of remote sensing data is the Moderate Resolution Imaging Spectroradiometer (MODIS) sensor on board the Terra and Aqua satellites that provides information on vegetation and surface energy conditions [5]. Furthermore, the National Oceanic Atmospheric Administration (NOAA) Advanced Very High Resolution Radiometer (AVHRR)-derived Normalized Difference Vegetation Index (NDVI) and other related indices (e.g., NDVI anomaly, integrated and standardized NDVI, Vegetation Condition Index, etc.) have been successfully used to identify and monitor areas at the regional and local scales [6,7,8,9,10,11,12,13].
Satellite vegetation indices (VIs), especially NDVI and Enhanced Vegetation Index (EVI), have been commonly used for monitoring global vegetation photosynthetic activities [14,15,16] and estimating gross primary production [17]. For instance, VIs from MODIS sensors have great improvements in spatial, spectral and radiometric measurements of surface vegetation conditions [18], and NDVI could be used to detect the changes of surface vegetation conditions [19,20,21,22], to monitor the maize green leaf area index [23], to estimate evapotranspiration [24,25], to conduct flood mapping and disaster loss assessment [26,27] and to perform environmental vulnerability assessment [28]. In addition, many studies showed that NDVI is a useful index for studying vegetation and ecosystems in semi-arid environments where vegetation cover is less than 30% [29,30]. To improve upon NDVI, the EVI is optimized to enhance the vegetation signal and to reduce the soil background influences [31,32]. Furthermore, Kim et al., 2010 [33], investigated the multi-sensor spectral bandpass dependencies of EVI, EVI2 and NDVI using Hyperion satellite images acquired over a range of vegetation conditions.
Yao et al. [34] developed the Evaporative Drought Index (EDI), which is based on evapotranspiration (ET) and PET of MODIS data, to estimate the deviation of the ratio between ET and PET (ET/PET) from unity. The EDI utilizes reanalysis of meteorological data and remotely-sensed data, and the MODIS data MOD16 ET/PET products were used to quantify water fluxes between terrestrial ecosystems and the atmosphere [35,36,37,38].
Mu et al. [39] derived the Drought Severity Index (DSI) to integrate operational MOD16 ET/PET and MOD13 NDVI products to calculate a remotely-sensed global drought index and then evaluated drought events at regional scale. The advantage of DSI is in that it could combine a wide range of historic climate data to quantify how ecosystems respond to drought events.
Using both satellite-derived and observed data, we examined drought occurrence over Mongolia. In our method, we used the two-band Enhanced Vegetation Index (EVI2) to replace the NDVI that was traditionally used. A new drought index, the Modified Drought Severity Index (MDSI) anomaly, which was derived from MOD16 ET/PET and MOD13 EVI2 based on the MODIS dataset and compared to ground-based observation data, is thus proposed. EVI2 is adopted to represent the vegetation status because EVI2 exhibits a nearly identical behavior for well-preprocessed MODIS data, like EVI [16], and EVI has a higher sensitivity to moderate-to-high vegetation biomass [31]. The observation data were obtained from the sixteen meteorological stations over Mongolia. The time series of both satellite-derived and observed data were acquired for the period from May–August of 2000–2013. In order to compare the evaluation of the drought occurrence of the study area, the land use area was divided into four various land use areas, namely the forest steppe, steppe, high mountains and desert steppe.

2. Study Area and Data Used

2.1. Study Area

The land use of Mongolia is classified into five subtypes: the high mountainous region (4.5%), forest steppe (23%), steppe (28%), desert steppe (28%) and desert (16%) [40]. The northern part of Mongolia is covered by forested mountain ranges with a dry sub-humid climate, whereas the southern part encompasses the Gobi desert with lower elevation and a drier climate [41], as illustrated in Figure 1.
In Mongolia, precipitation is significantly different in different regions, and temperature increases from north to south. The southern parts of Mongolia have higher average temperatures, which range from 20–25 °C. By contrast, the northern parts have lower temperatures of 15–20 °C. The annual total precipitation is around 400 mm in the mountainous areas, 250–300 mm in the forest steppe regions, 150–250 mm in the steppe regions and less than 100 mm in the desert area. Most of rainfall, 85%–90%, would happen in the summer season. It is the main source of soil moisture, but the amount of rainfall is insufficient for the growing season period [42,43].
Clearly, Mongolia’s climatic feature is a function of latitude characterized by the natural vegetation cover in the geographical zones. These zones are divided into natural vegetation belts, which are located at different altitudes (from mountains to plain steppe) and latitudes (from the north to south). The natural vegetation has a very short growing season (April–September), and pasture would start to grow from the middle of May to the middle of August [44].

2.2. Data Used

2.2.1. MODIS Products

We selected a fourteen-year period to observe the dynamic range of the drought index during the terrestrial growing season with different climatological conditions. Accordingly, a monthly composite of the 1-km spatial resolution MOD16A3 [45] and MOD13A3 [46] products from MODIS for free from the University of Montana’s Numerical Terradynamic Simulation group [45] and the National Aeronautics and Space Administration (NASA) Earth Observing System (EOS) [47] were downloaded. Both MOD16A3 and MOD13A3 products were acquired from May–August of 2000–2013 with 224 images in total.
MOD16A3 produces a monthly composite of MODIS Terrestrial ET and PET products. The ratio of ET to PET is commonly used as an indicator of terrestrial water availability, and associated wetness or drought was modified by Mu et al. [39] and can be described as:
R a t i o = E T P E T
The MOD13A3 product is generated using the 16-day composite period MODIS Terra vegetation index (VI) output. It uses the time-weighted average of the reflectance fields in the 16-day composited VI product that falls within a particular month and the ones that overlap in the beginning and end of each calendar month as determined by Huete et al. [48]. EVI can really reflect the vegetation conditions, which can reduce the effect on vegetation information by the soil background through adopting the principle of the soil adjusted vegetation index as presented by Wang et al. [49]. The modification of EVI, EVI2 [16], is calculated from the red and near-infrared (NIR) bands as follows:
E V I 2 = 2.5 ρ N I R ρ r e d ρ N I R + 2.4 × ρ r e d + 1
where ρred and ρNIR are the surface reflectance of the red and NIR bands, respectively; 2.5 is a gain factor, and 1 is a canopy background adjustment as described by Huete et al. [48,50]; 2.4 is the coefficient of red reflectance in the denominator as determined by Jiang et al. [16].
Both ET/PET and EVI2 of the MODIS images were merged and projected using the HDF-EOS to GeoTIFF Conversion Tool (HEG). This tool allows the projection from the MODIS Sinusoidal (SIN) grid to the Universal Transverse Mercator (UTM) Zone 48 N projection in our analysis.

2.2.2. In Situ Measurement Data

In situ measurement data based on air temperature, precipitation and soil moisture observations were obtained at the sixteen meteorological observations stations from 2000–2013 for the growing season. The vegetation growing season data were acquired between May and August. Air temperature (°C) and precipitation (mm) data were used to acquire their corresponding monthly mean, which is based on daily observation data. Soil moisture content (by gravimetric method) was obtained at a 10-cm depth at a monthly interval (27th and 28th day of each month) for four consecutive months (May–August). These in situ observation data were provided by the Information and Research Institute of Meteorology, Hydrology and Environment (IRIMHE) of Mongolia (http://www.icc.mn/) [51]. There are no missing air temperature and precipitation data in the time period of investigation. Note that, in the years 2001 and 2002, 3–5-times of the soil moisture data were missing.
The sixteen stations are widely distributed across the different climatic regions of Mongolia, consisting of various land use areas, forest steppe, steppe, high mountains and desert steppe, as illustrated in Figure 1. The geographical locations, elevations and various land use area classifications of the sixteen stations are represented in Table 1.
Air temperature, precipitation and soil moisture content data were averaged over the monthly intervals from May–August to match the MODIS monthly composite period. For interpolation, continuous grids of the MDSI anomaly value with the same geographical location and resolution (0.1° × 0.1°) as the in situ measurement data were created.

3. Methodology

In this study, we used ET/PET and EVI2 derived from MODIS and climatological variables measured from ground stations to investigate the spatiotemporal drought occurrences of satellite-derived and observed anomalies during the growing season of 2000–2013. The overall description of the study consists of three main parts: (1) the spatial variations of the MDSI anomaly; (2) the temporal variations of the climatological variables’ anomaly; and (3) the relationship between the MDSI anomaly with meteorological variables and soil moisture content.

3.1. Anomaly of MDSI Description

A new monthly composite MDSI anomaly for ET/PET and EVI2 variables was calculated on a pixel by pixel basis. We investigated the spatial variations of the monthly MDSI anomaly (Equation (6)) for the entire dataset (ZRatio, ZEVI2) used to evaluate changes in the variation during study years. The MDSI anomaly for a variable is calculated as follows. The standardized ratio (ZRatio) is calculated from Equation (1):
Z R a t i o = R a t i o R a t i o ¯ σ R a t i o
The standardized EVI2 (ZEVI2) is calculated from Equation (2):
Z E V I 2 = E V I 2 E V I 2 ¯ σ E V I 2
The ZRatio and ZEVI2 terms are then summed as:
Z = Z R a t i o + Z E V I 2
A new remotely-sensed MDSI anomaly is finally calculated as the standardized Z terms:
M D S I a n o m a l y = Z Z ¯ σ Z
where Z represents the variable value for the sum of the ZRatio and ZEVI2 terms. Z ¯ and σ Z are the long-term mean (2000–2013) and standard deviation for the ZRatio and ZEVI2 terms, respectively.
Thus, the MDSI anomaly is a dimensionless index theoretically ranging from unlimitedly positive values to unlimitedly negative values for wet to dry period deviations, respectively, from prevailing conditions.

3.2. Anomaly of Climatological Variables Description

To understand the temporal variations of climatological variables for the region of interest, we generated a time series of meteorological data of air temperature and precipitation averaged over the sixteen stations’ scale. As described by Dhar et al. [52], monthly anomalies for the entire air temperature and precipitation datasets were used to evaluate changes in the variation during the study period. The percentage deviations of variables from their long-term mean (1981–2010) and the air temperature anomaly (T anomaly) and the precipitation anomaly (P anomaly) are given by the following equations:
T a n o m a l y = ( T m T m ¯ T m ¯ ) × 100
P a n o m a l y = ( P m P m ¯ P m ¯ ) × 100
where Tanomaly and Panomaly are the percentage deviations from the long-term mean of air temperature and precipitation, respectively. Tm and Pm are the monthly air temperature and precipitation values, respectively. T m ¯ , and P m ¯ are the long-term means of the monthly air temperature and precipitation, respectively.
Monthly anomalies based on the percentage deviation (T anomaly, P anomaly) were then used to categorize the drought condition. The category of the drought condition would have a T anomaly value of 0.0 or above, while the P anomaly would be −0.0 or less. We then merged four consecutive (May–August) monthly data for the growing season of the study years to obtain the mean values of MDSI, T and P anomalies and soil moisture content.

3.3. Relationship between MDSI Anomaly and Climatological Variables

Proposed approaches were followed to explore the relation between the MDSI anomaly and climatological variables. For the category of drought condition, remotely-sensed and ground observation data were utilized. We obtained the monthly MDSI anomaly from MODIS data and compared to the monthly air temperature and precipitation, as well as their anomalies of the percentage deviation and soil moisture content from ground observation data. In addition, to quantify the comparison results, the Pearson’s correlation coefficients (r) for the MDSI anomaly vs. the T anomaly, the MDSI anomaly vs. the P anomaly and the MDSI anomaly vs. the soil moisture content were computed for the sixteen stations. The formula of the coefficient of Pearson (r) is given in Equation (9) as:
r = i = 1 n ( X i X ¯ ) ( Y i Y ¯ ) i n ( X i X ¯ ) 2 i n ( Y i Y ¯ ) 2
where X i and Y i are the individual derivations and measurements of variables X and Y, respectively. X ¯ and Y ¯ are the means of X and Y, respectively. The linear Pearson’s correlation (r) was investigated at the monthly timescale (May–August) for satellite-derived and observed anomalies, as well as soil moisture content values for the period of 2000–2013, and statistical significance level (p) was chosen at the 90%–99% in this research.

4. Results and Discussion

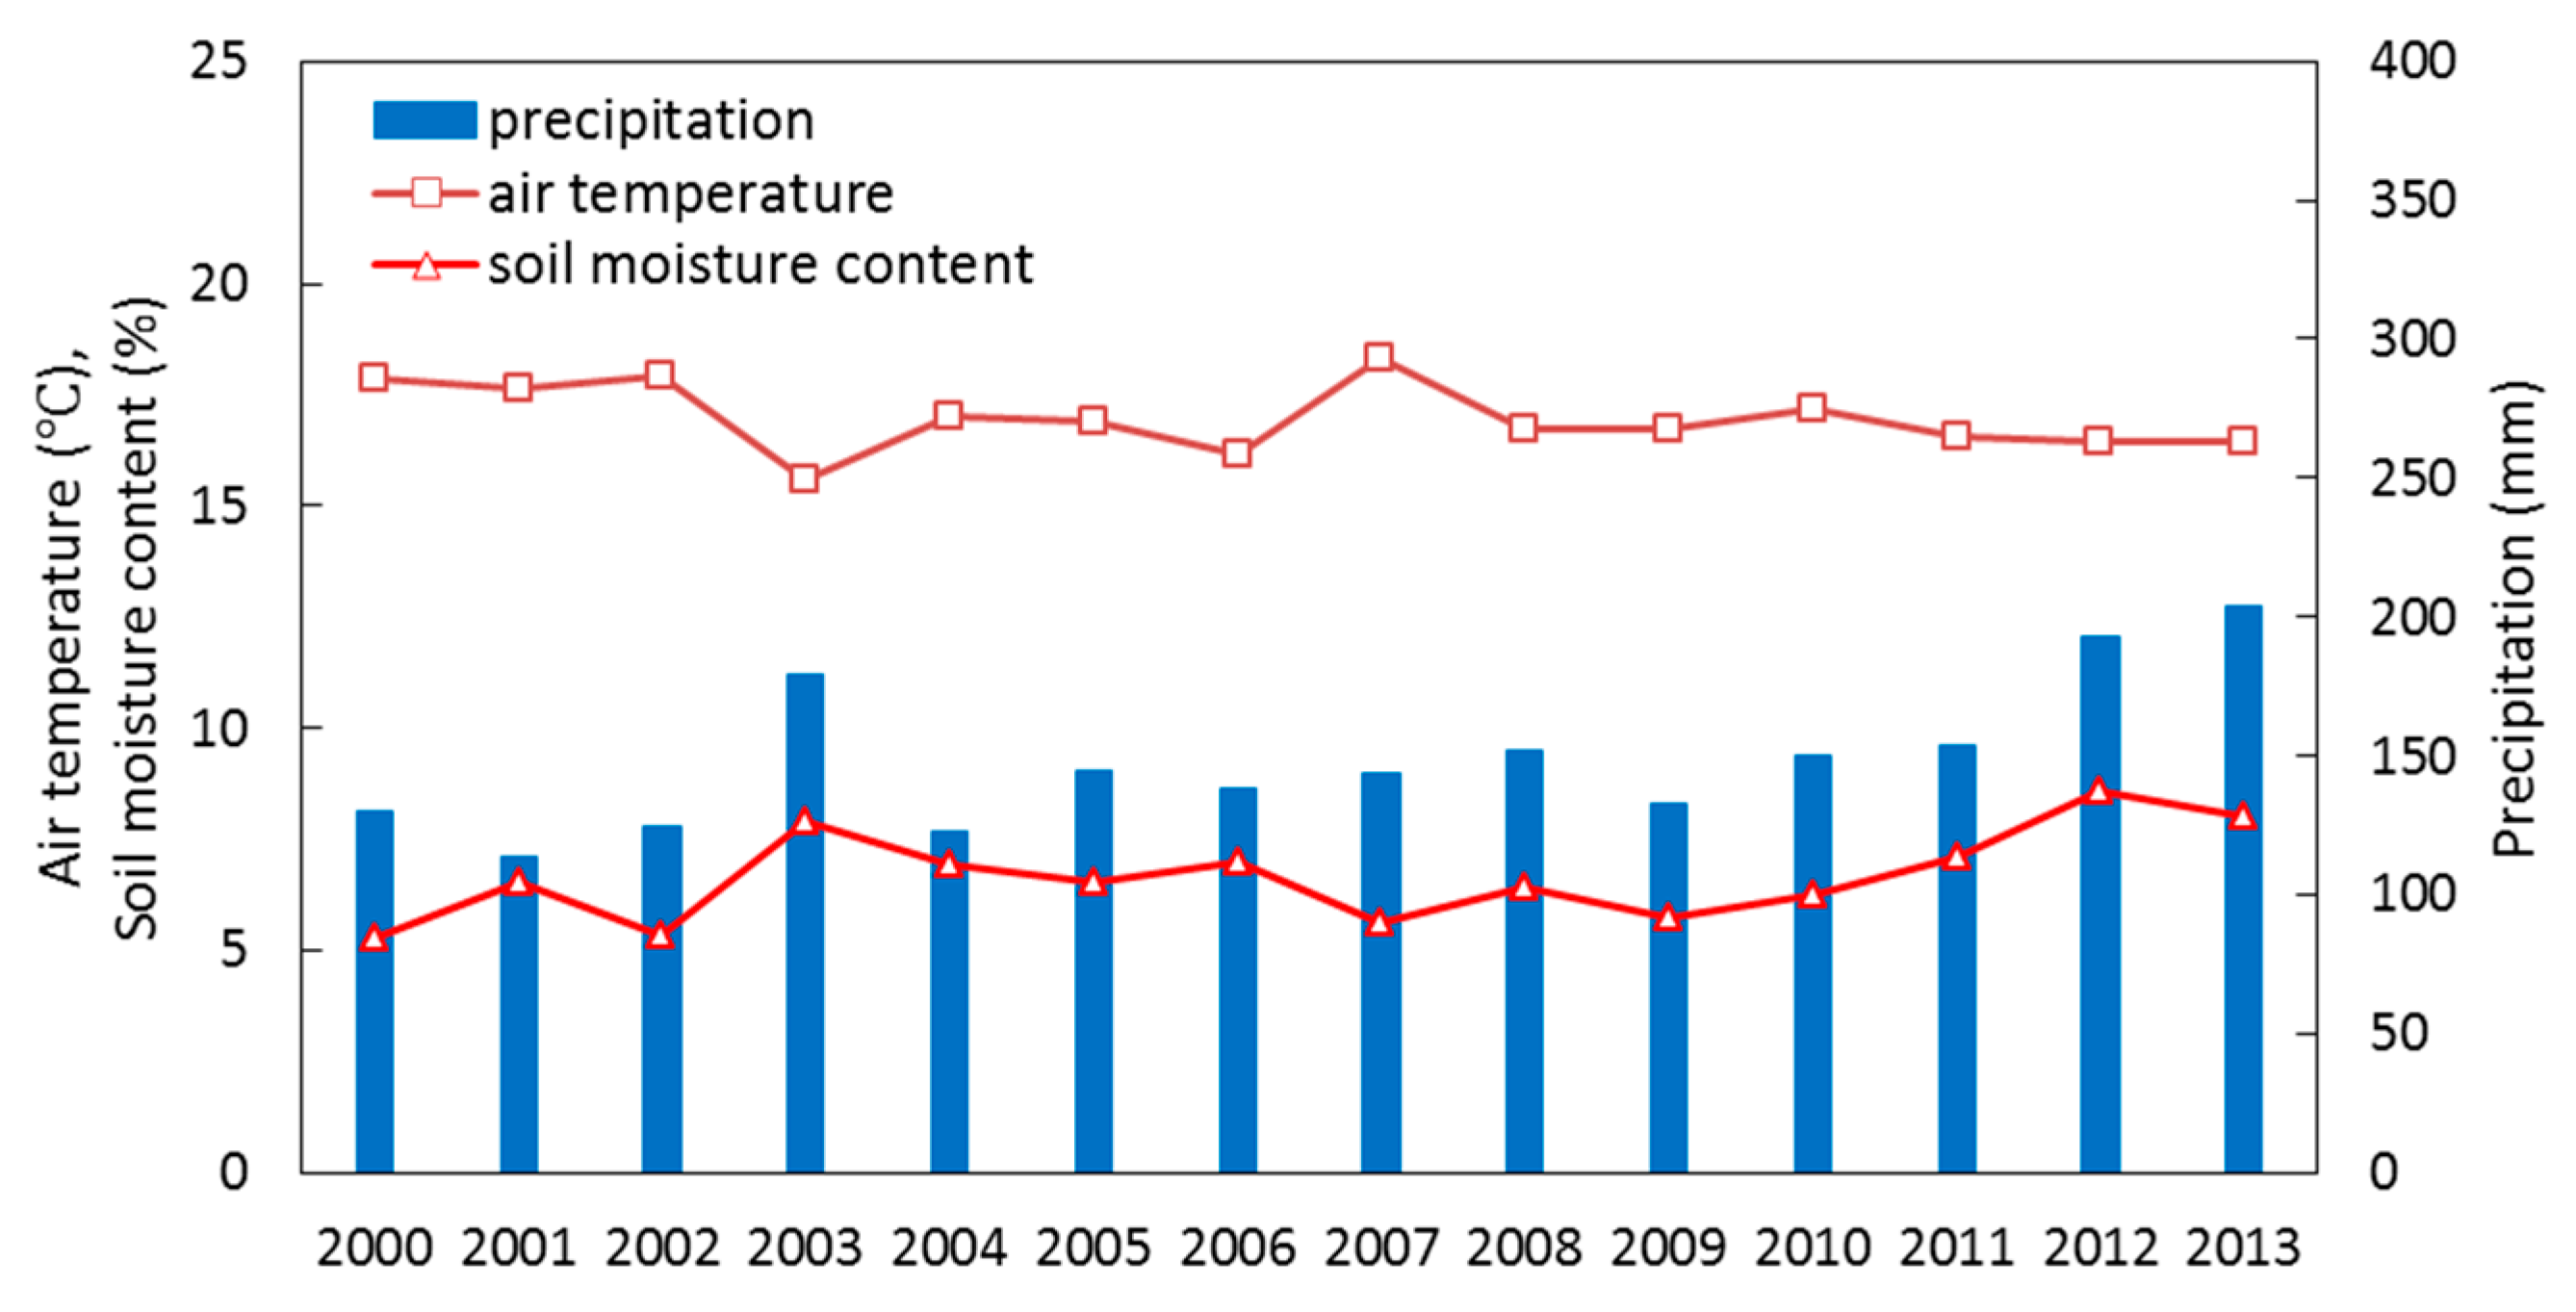
4.1. Climatological Variables among Stations

Table 2 presents the temporal variations of climatological variables, including air temperature, precipitation and soil moisture content during the growing season for the study area. The results showed that the average air temperature of sixteen stations in Mongolia was approximately 17.0 °C; the mean precipitation was about 149 mm; and the average soil moisture content was 6.7% during the study period (2000–2013). In four various land uses, temperatures were increased from the high mountains to desert steppe, but precipitation was decreased from the forest steppe to desert steppe. The results demonstrated that the forest steppe had lower temperature, but higher precipitation and soil moisture content, while the desert steppe had the opposite trends. Furthermore, the high mountains region had the lowest temperature and soil moisture content values due to its unique terrain features and dependence on rainfall.
Figure 2 shows the time series plots of the climatic variables during the growing season. The average air temperature was between 15.6 °C (year 2003) and 18.3 °C (2007); mean total precipitation ranged from 114 mm (2001)–204 mm (2013); and soil moisture content was from 5.3% (2000, 2002)–8.6% (2012) during the study period. Furthermore, the figure shows, based on meteorological long-term data, that the wettest years were 2003 and 2011–2013, while the driest years were 2001, 2007 and 2009; the rest of the years were normal years. Generally speaking, dry weather implies lower rainfall and higher temperature, so that drought occurred in the years 2001 and 2007. By contrast, wet weather accompanies higher precipitation and lower temperature, such as the years 2003, 2012 and 2013. One interesting question is raised though: why is the year 2004 categorized as a normal year? It is observed that the precipitation of 2004 was relatively low, but the soil moisture content and MDSI anomaly of 2004 was not low. This fact may indicate “the memory effect”; the high precipitation in 2003 possibly contributed to the higher soil moisture in 2004. Such a memory effect may prevail relatively easily since the ground is frozen in winter and preserves the soil moisture well till the next year.
Table 3 presents the correlation matrix among different climate parameters, and the results showed that the sixteen stations had strong and significant correlations. The inter-station correlation matrix (r) between climatological variables showed that the correlation coefficient of Pearson (r) (Equation (9)) ranged from negative 0.77 to positive 0.78 with significance p < 0.001. Basically, the air temperature tends to be in hot and dry conditions, while the precipitation tends to occur in cool and wet periods. This indicates that the air temperature and precipitation were inversely correlated with each other. Therefore, surface soil moisture was related to the amount of precipitation. In addition, the temporal variations of the T and P anomalies’ results will be shown in Section 4.3. Note that the negative correlation between T and soil moisture may indicate stronger plant-available water stress as temperature rises [53].

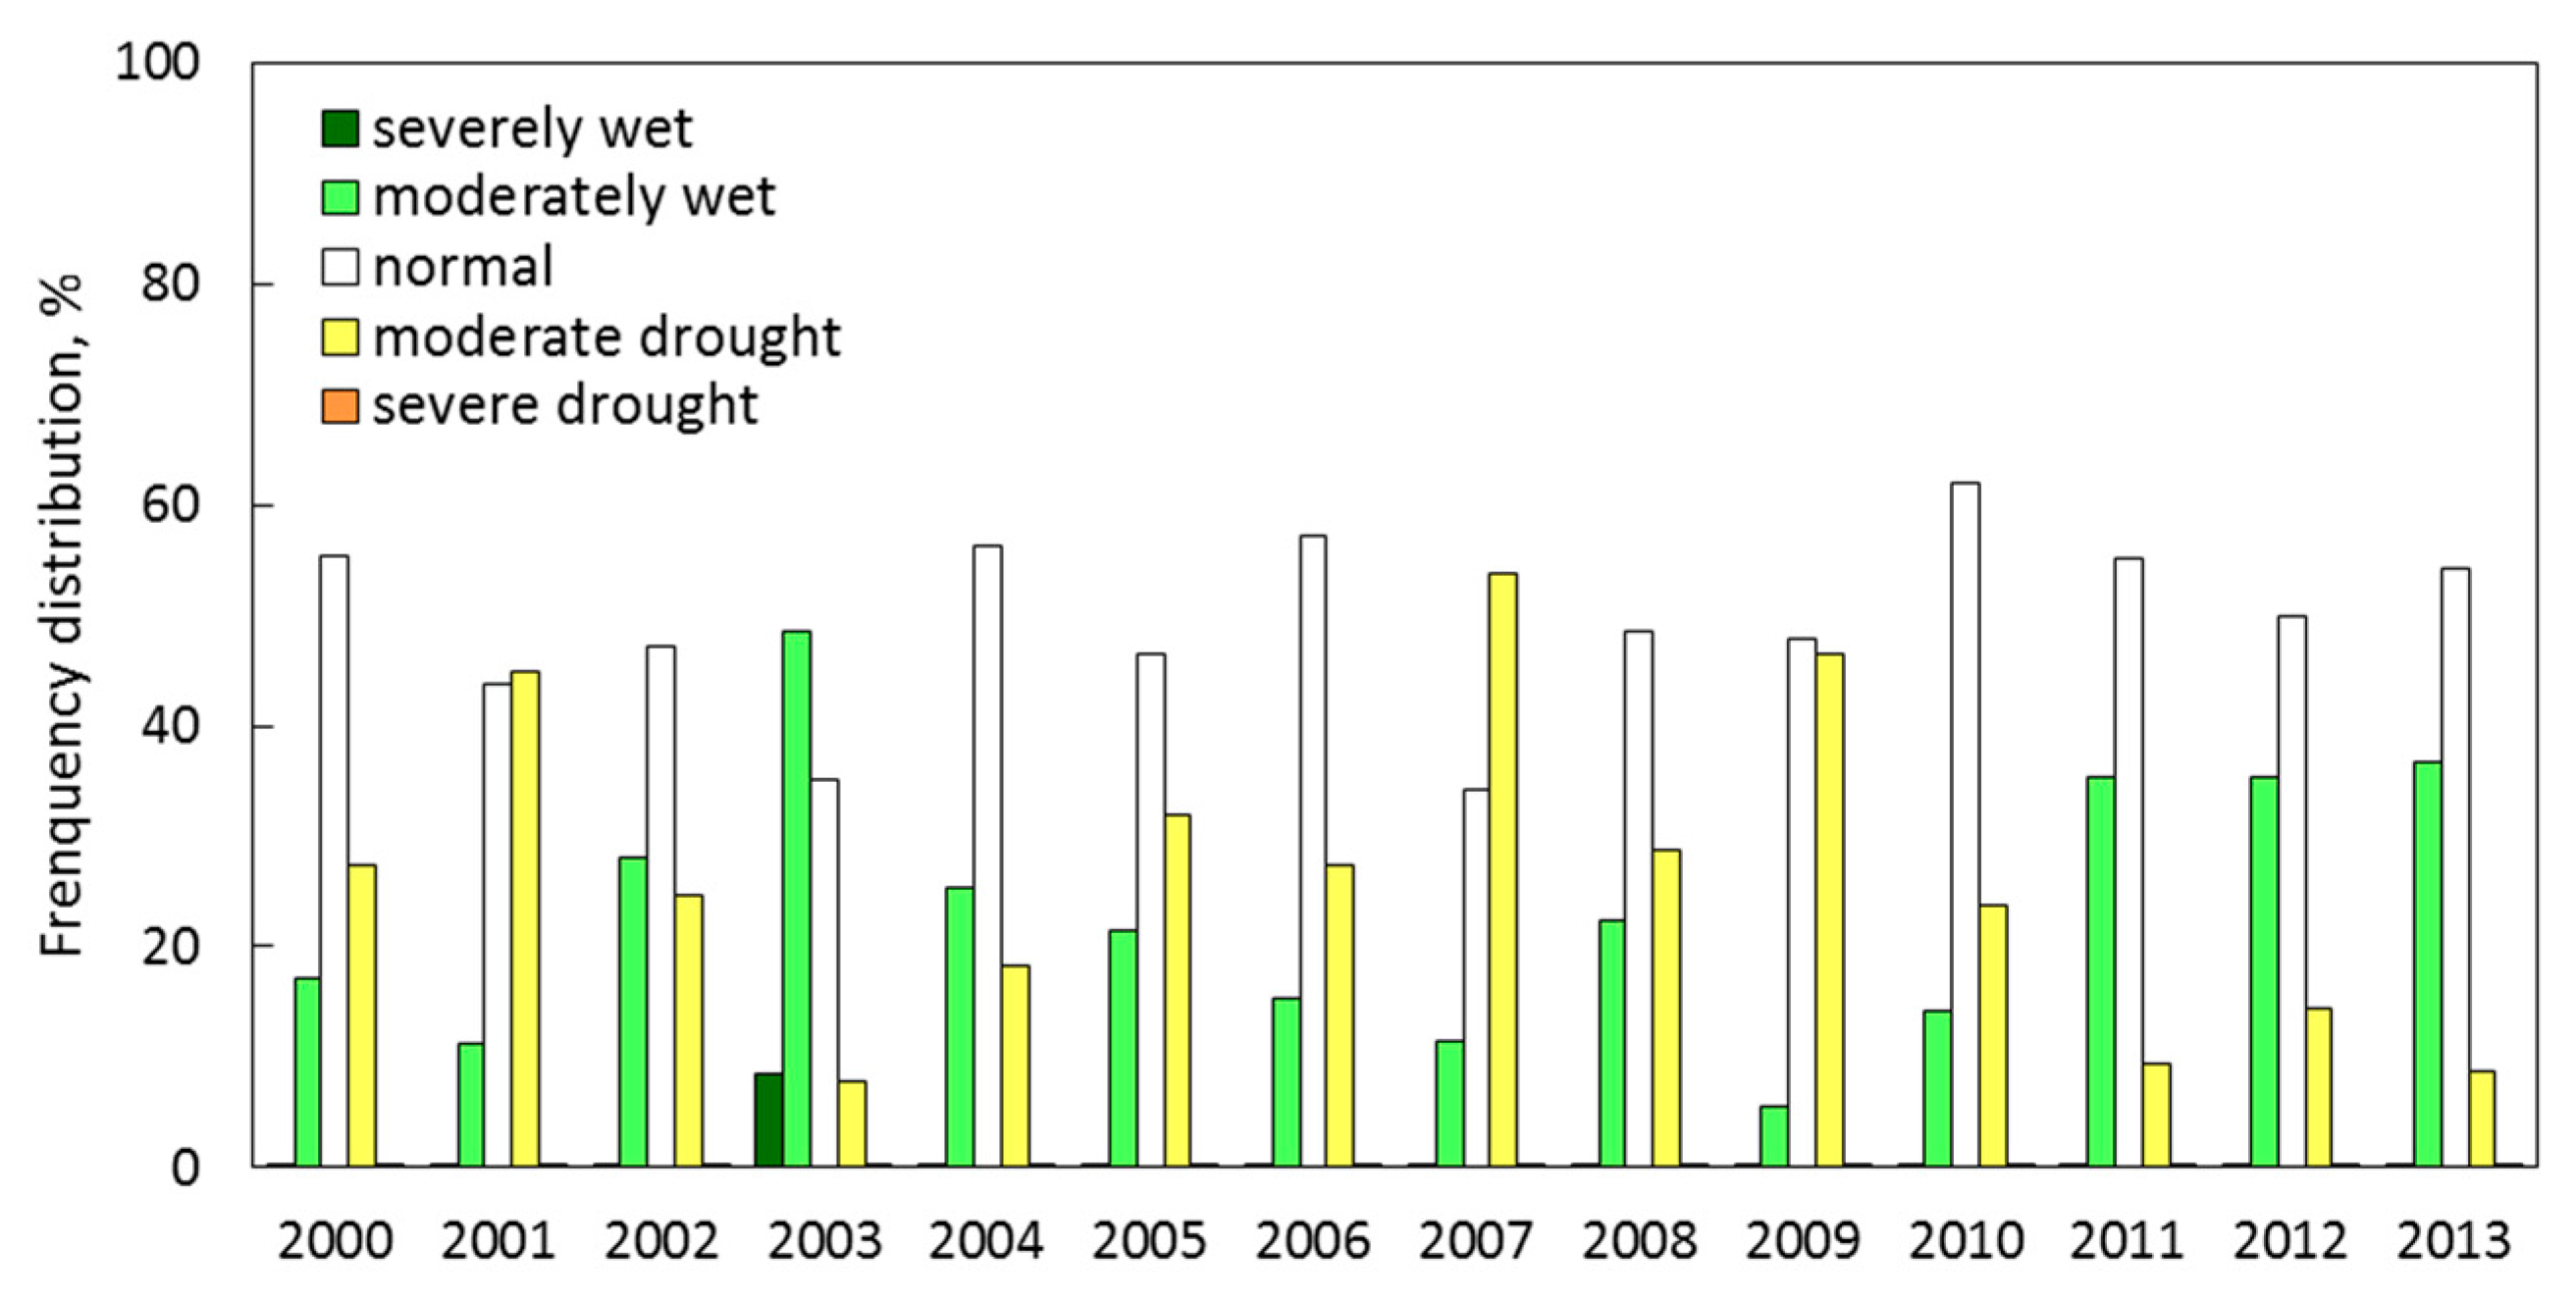
4.2. Anomaly of MDSI Variations

The averaged MDSI anomaly was calculated as the monthly standardized ET/PET and EVI2 throughout the growing season, four consecutive months from May–August, for the years 2000–2013. The growing season of the MDSI anomaly was estimated for both wet and dry periods in the study area. The MDSI anomaly indicates the categories of wet and dry conditions with negative values referring to drier conditions as compared to normal conditions and positive values implying wetter conditions. To classify drought intensity, the MDSI anomalies for ET/PET and EVI2 were standardized and compared. In this study, we used the MDSI classification ranges corresponding to the Palmer Drought Severity Index (PDSI) [54] drought severity categories, where the W1-2 (W, wet) and D1-2 (D, dry) categories indicate progressively wetter and drier conditions, respectively. Thus, the MDSI anomaly value ranges between unlimitedly positive values (>2) and unlimitedly negative values (<−2). Then, the MDSI anomaly value would be around −0.5 or less for a drought condition and 0.5 or greater for a wet condition. For normal conditions, it would be between 0.49 and −0.49 [39,54], as shown in Table 4.
Figure 3 illustrates the growing season variations of the MDSI anomaly in the study area. The results represent the variations of the MDSI anomalies, following the total rainfall amount averaged over Mongolia, for the growing season from 2000–2013, as shown in Figure 2. The negative MDSI anomaly values that appeared in the south part of Mongolia in 2001 (Figure 3b), the southeast part in 2005 and 2006 (Figure 3f,g), the central area in 2007 (Figure 3h) and the southwest region in 2009 (Figure 3j) were less than −0.5. In addition, the summers in 2003 and 2011–2013 (Figure 3d,l–n) had more favorable hydrologic conditions than the other years (Figure 3a,c,e,i,k) with fairly positive MDSI anomaly values of 0.5 or greater.
The values of the MDSI anomaly were attributed to five categories (Table 4), namely severely wet (>2), moderately wet (0.5 to 1.99), normal (0.49 to −0.49), moderate drought (−0.5 to −1.99) and severe drought (<−2), in this study. As illustrated in Figure 4, the frequency distribution of the MDSI anomaly showed a wet period in the years 2003 and 2011–2013 with 85%–92% of the total area identified as normal and moderately wet, while 8%–15% of it was moderate drought conditions. In contrast, dry periods appeared in the years 2001, 2007 and 2009, and 45%–54% of the total area was identified as moderate drought, but 46%–55% of it was observed as normal and moderately wet conditions. In the other years, 18%–32% of the total area occurred as moderate drought, while more areas (68%–82%) were identified as normal and moderately wet. Furthermore, a maximum of 9% occupied high intensity wetness (severely wet >2) in the year 2003. In the other years, wetness regions do not exceed 0.4% of the total area. Furthermore, the high intensity dryness of MDSI anomaly (severe drought <−2) does not exceed 0.2% of the total area during the study period. Finally, the performance of the MDSI anomaly distributions revealed that the wettest area occupied 57% of the total area in 2003, while the driest area occurred in 54% of the total area in 2007.

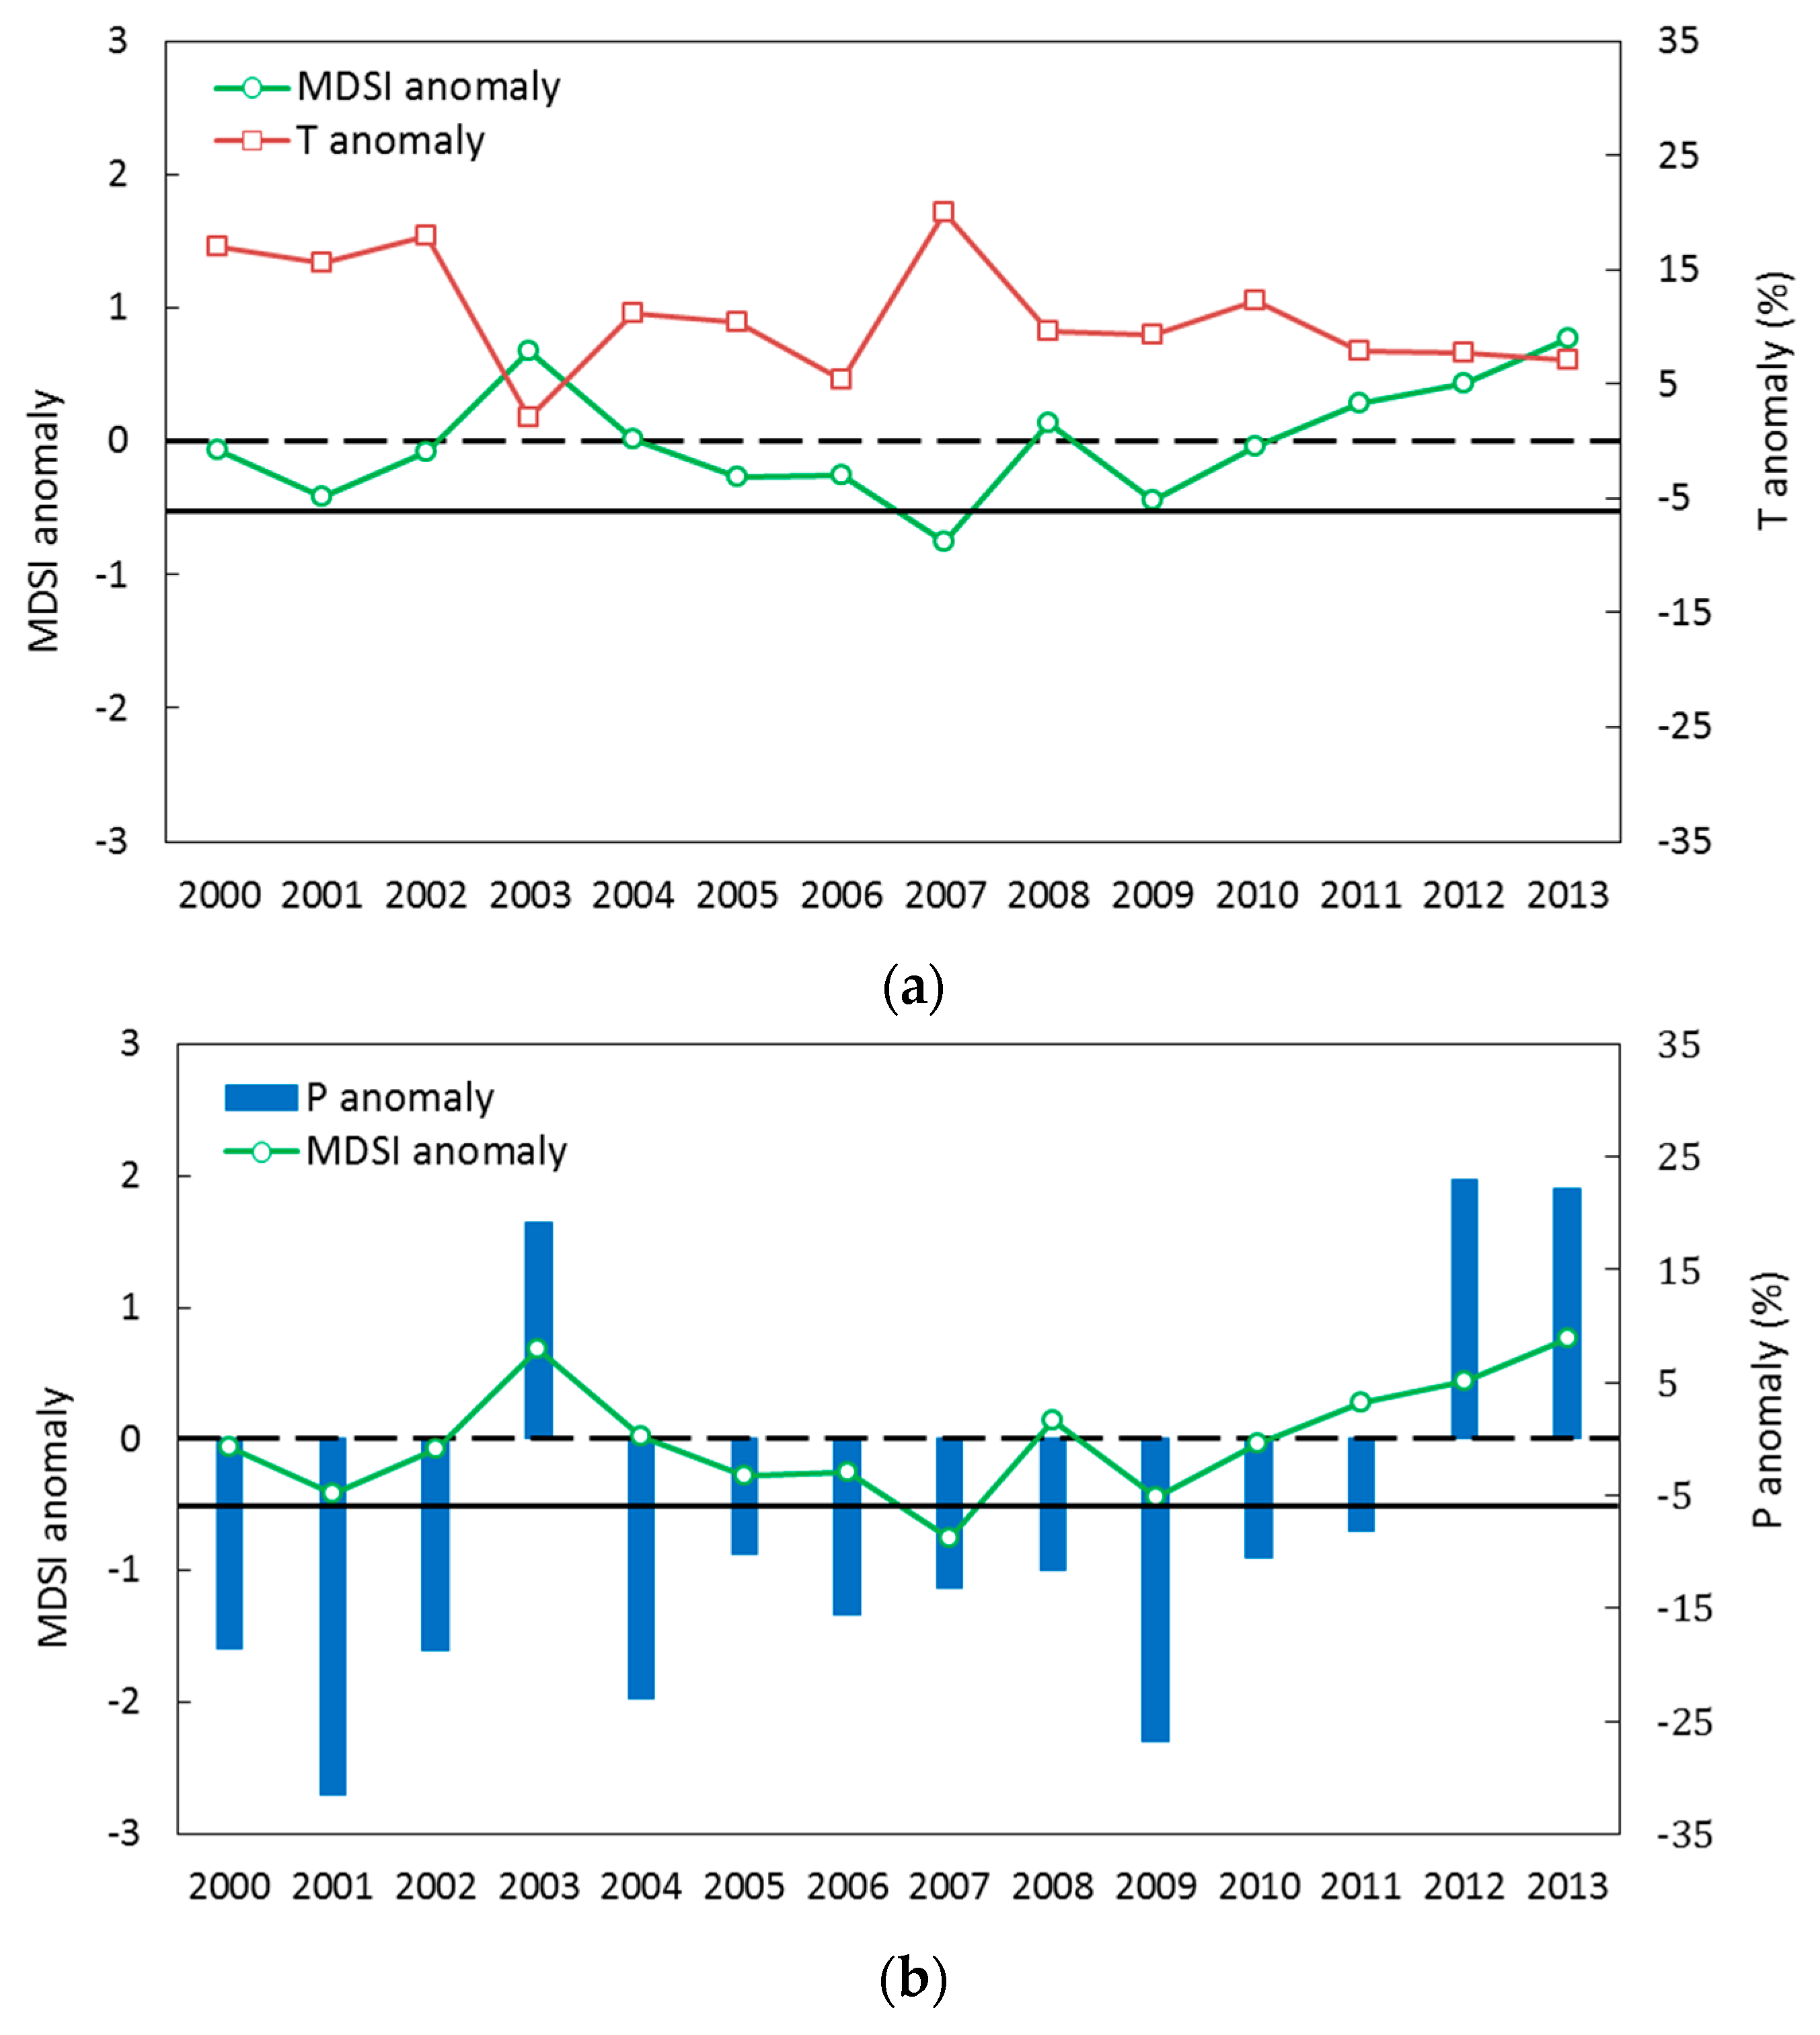
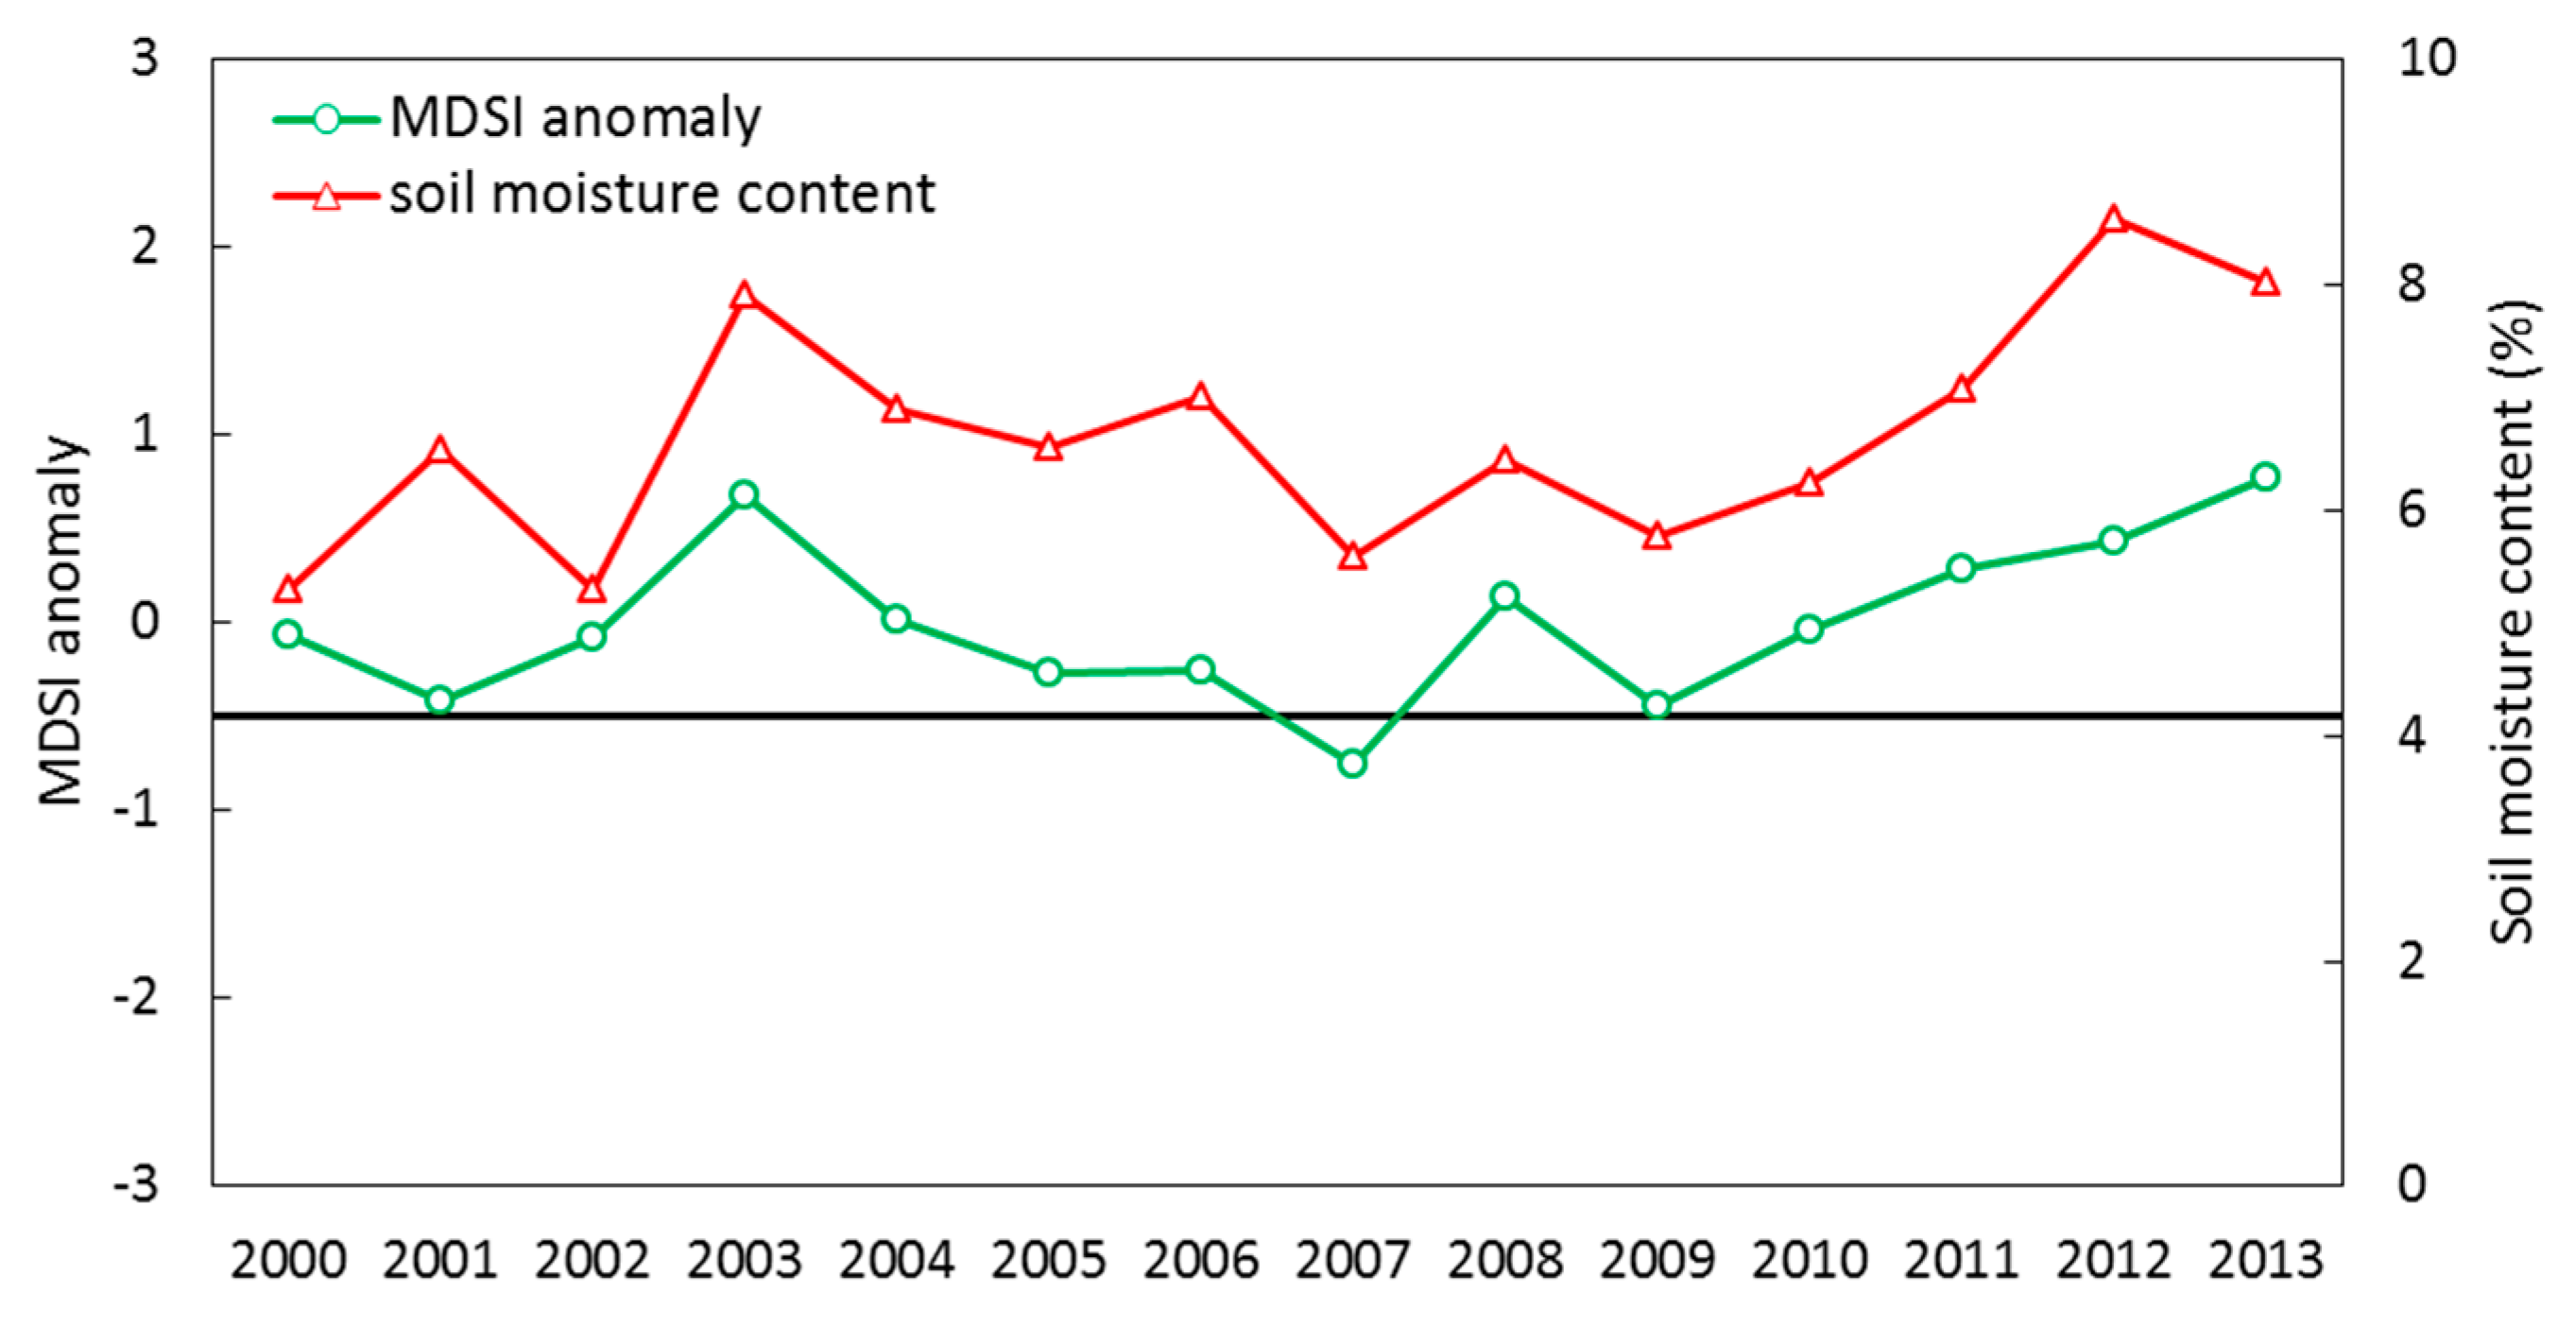
4.3. Anomaly of MDSI and Climatological Variable Variations

The climatological variables’ anomaly was used to identify wet and dry conditions based on Equations (7) and (8) of the percentage deviations and compared to the MDSI anomaly, as shown in Figure 5. Figure 5a showed that the T anomaly was negatively correlated with the MDSI anomaly (r = −0.66 with p < 0.01) during the growing season of 2000–2013. Besides, by comparing MDSI with T anomalies, the highest MDSI anomaly value (+0.8) indicated the lowest T anomaly (2%), as observed in the year 2003, while the lowest MDSI anomaly value (−0.8) had the highest T anomaly (20%), as seen in the year 2007. These results are also consistent with the temporal variations, as shown in Figure 4. Figure 5b illustrates that there are variations in the MDSI with P anomalies in different regions. Both the distributions and ranges of MDSI with P anomalies varied with year. A comparison between them indicates that they are positively correlated with a coefficient of 0.81 and significance p < 0.001.
There are sixteen stations distributed over four various land use areas with different soil moisture conditions during the study period. As an example, the soil moisture content at 10 cm was selected to compare to the MDSI anomaly on a station basis, as shown in Figure 6. The temporal variations showed a better relationship between the MDSI anomaly and soil moisture content, except for 2001 and 2002. It can be found that the MDSI anomaly had a strong significant correlation (r = 0.74 with p < 0.01) with surface soil moisture. It is feasible to monitor the drought status by using the MDSI anomaly, which is calculated from the ratio of ET to PET and the EVI2 feature space. In addition, the temporal and spatial MDSI anomaly clearly shows that the soil moisture content of the drier seasons is linked to rainfall, as well as the characteristics and topography of various land use areas.

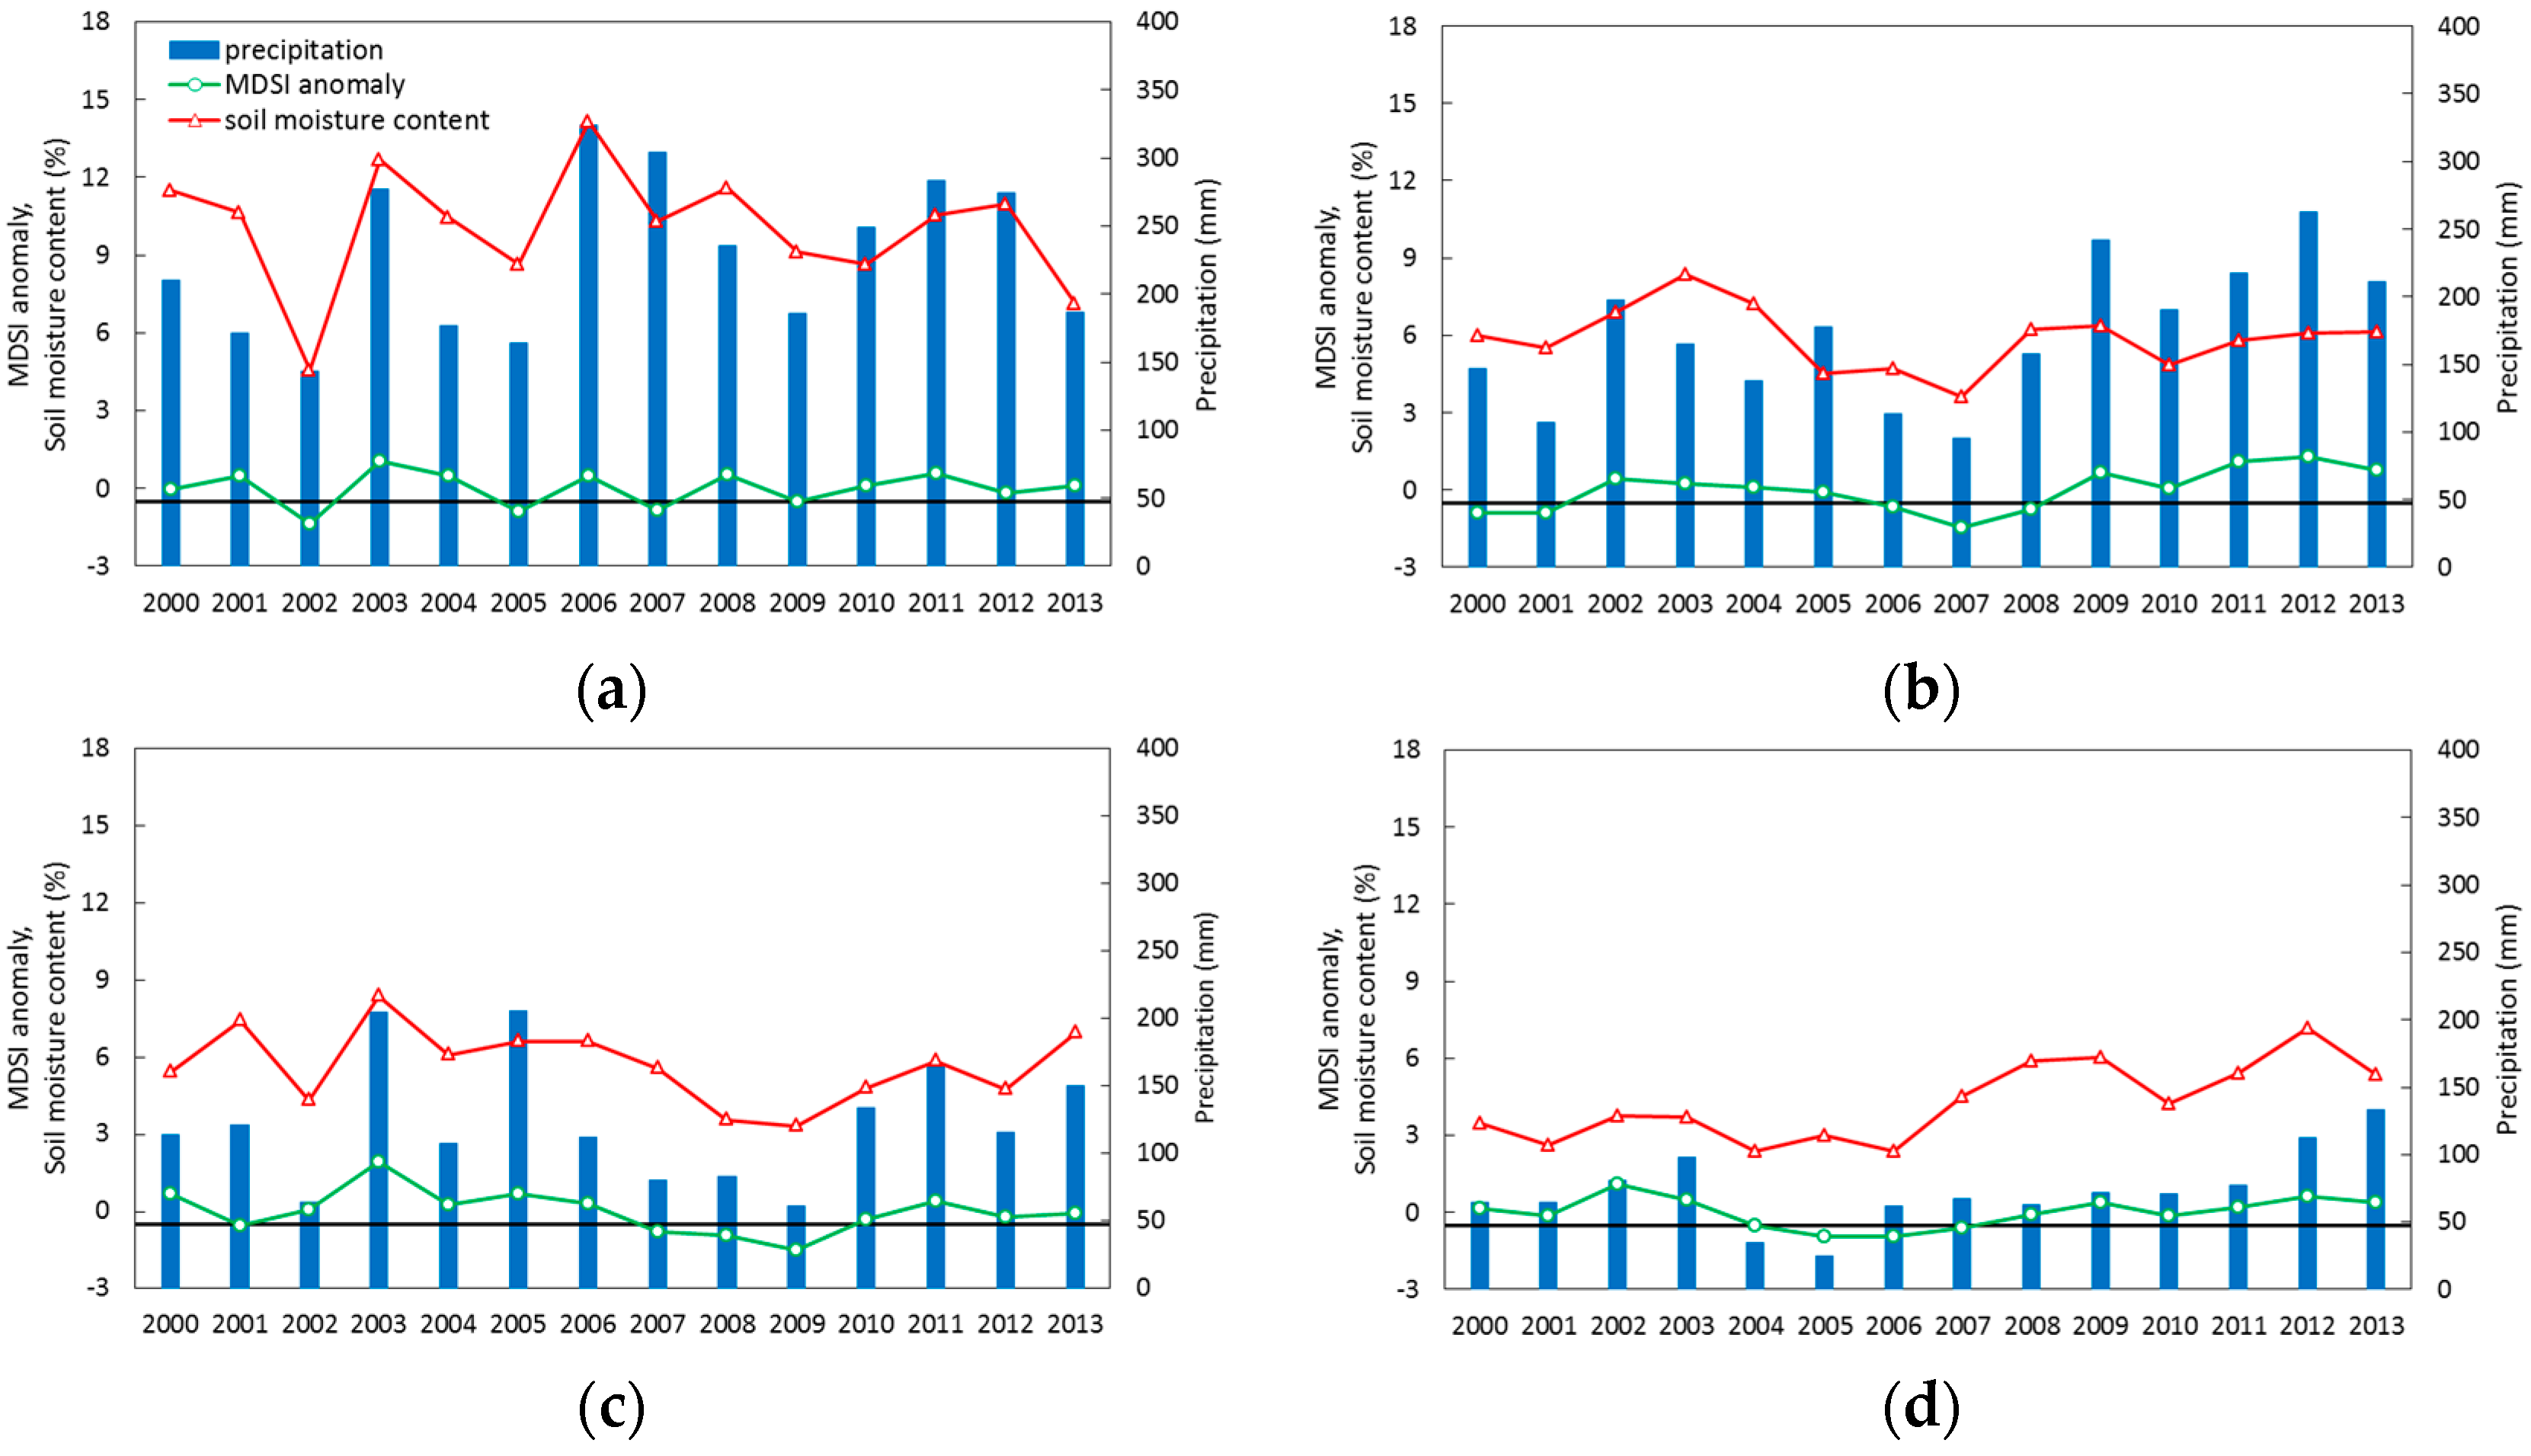
4.4. Anomalies among Different Land Use Areas

Table 5 presents the correlations of the MDSI anomalies with different climatological variables and soil moisture values over all of Mongolia for the study period. It indicates that the values of Pearson’s correlation coefficient (r) were −0.66 between the MDSI and T anomalies and 0.81 between the MDSI and P anomalies with significance p < 0.001 over all of Mongolia. In four various land use areas, the correlation coefficients varied from −0.67 to −0.52 between the MDSI and T anomalies, and 0.67–0.83 between the MDSI and P anomalies. However, T and P with MDSI anomalies had a low value of −0.45 (p > 0.05) and 0.34 (p > 0.10) in the desert steppe and forest steppe, respectively.
Soil moisture content can reflect precipitation, evaporation, infiltration and runoff. In turn, it acts as a strong control on the partitioning of water between the atmosphere and the surface. As shown in Table 5, the MDSI anomaly and soil moisture content appears to have a high correlation of 0.74 as p < 0.01 over Mongolia. As for individual land use area, the correlations of MDSI anomaly with soil moisture content were rather high 0.63 for forest steppe, 0.64 for high mountains and 0.72 for desert steppe with significance p < 0.01, except with a low value of 0.39 (p > 0.10) for the steppe.
Figure 7 illustrates the temporal variations of the MDSI anomaly for four various land use areas and related to the climate conditions at the station scale. It represents that the MDSI anomaly exhibited high and low temporal variations in response to wet and dry conditions with climatic parameters. In Figure 7a, the forest steppe had the highest rainfall compared to the other land use areas. Soil moisture content reached roughly 11%–14%, while the amount of precipitation was about 274–324 mm in 2003, 2006, 2011 and 2012. In addition, the MDSI anomaly attains its maximum at about two (>1.0) in the years 2003 and 2011. The corresponding minimum MDSI anomaly was at −1.4, while the minimum soil moisture content was about 4.6% in 2002. By contrast, the steppe (Figure 7b) had a lower rainfall amount during the growing season. Both precipitation and soil moisture variables demonstrated a very similar trend with year in response to the MDSI anomaly. As an example, the minimum MDSI anomaly falls below −1.5, while the minimum soil moisture content was about 3.6% in the year 2007. The high mountains and the desert steppe (Figure 7c,d) had the lowest rainfall and stable variations as compared to the three parameters. In the high mountains, maximum rainfall ranged approximately 205–206 mm, while maximum the MDSI anomaly was between +0.7 and +1.9, and soil moisture content was about 7%–8% in 2003 and 2005. Particularly, the lowest rainfall (62 mm), the MDSI anomaly (−1.5) and soil moisture content (3.3%) occurred in 2009. However, in the desert steppe, the lowest amplitude of the MDSI anomaly (−0.9) and rainfall (25 mm and 62 mm) trends look very similar, such as in 2005 and 2006. The lowest rainfall reached around 25 mm in 2005, while the lowest soil moisture content was about 2.4% during 2004 and 2006. In addition, it is observed that, in 2002, the precipitations of the forest step and high mountain shown in Figure 7a,c were the lowest, while the precipitation of steppe in Figure 7b was not low and even higher than those in 2000, 2001, 2003 and 2004. This outstanding contrast possibly indicates that the regional dependence of precipitation prevails over the large-scale or climatic impacts.

5. Conclusions

The MDSI anomaly was developed for Mongolia based on the standardized ET/PET and EVI2 index extracted from the MODIS dataset during the growing season from May–August of 2000–2013. Furthermore, the fourteen-year summer monthly data for temperature, precipitation and soil moisture content of in situ measurements from sixteen meteorological stations were analyzed for four various land use areas (forest steppe, steppe, high mountains and desert steppe). The percentage deviations of climatological variables on the sixteen stations of four various land use areas were computed and compared to the MDSI anomaly during the study years.
The analysis of the MDSI anomalies revealed different temporal occurrences of dry (2001, 2007, 2009) and wet (2003, 2011–2013) periods that dominated 35%–57% of the total area; while a maximum of 57% exhibited being the wettest in the year 2003, and 54% occurred as the driest in year 2007. Note that the year 2004 with higher precipitation and lower temperature was categorized as a normal year possibly because of “the memory effect” of higher soil moisture preserved in the ground in the year 2003. The exploration of the relationship between the MDSI anomaly performance with climatological anomalies indicated that the T anomaly had a negative correlation of −0.66 (p < 0.01), whereas the P anomaly had a more strongly positive correlation of 0.81 (p < 0.001). Overall, the results showed that MDSI and T anomalies were negatively correlated, while MDSI and P anomalies were positively correlated, during the study period. As the MDSI anomaly distributions demonstrated, the highest (wettest) MDSI anomaly and lowest T anomaly values were seen in 2003, while the lowest (driest) MDSI anomaly and the highest T anomaly were observed in 2007. Besides, the correlations for the MDSI anomaly with T and P anomalies were analyzed among the four land use areas. MDSI and T anomalies indicated negative correlations, which were generally decreasing from forest steppe to desert steppe (r = −0.67 to r = −0.45). By contrast, MDSI and P anomalies had positive correlations (r = 0.67 to r = 0.83) with significance from p < 0.01–0.001 except for the forest steppe.
Rainfall would increase with the surface soil moisture content, which in turn would result in a high MDSI anomaly. Furthermore, the MDSI anomaly and soil moisture content correlations ranged 0.63–0.74 with significance p < 0.01 for various land use areas, except with a low value of 0.39 (p > 0.10) in the steppe during the study period. In addition, the responses of the MDSI anomaly to in situ measurements of precipitation and soil moisture strongly depend on the natural vegetation in each land use area. Comparisons across land use areas indicated that various features of natural plants are utilized in response to growing season hydrologic condition variations. Therefore, these results further proved that the MDSI anomaly can be used as an indicator through its correlation with soil moisture content to evaluate drought event.
The MDSI anomaly analysis and interpretations conducted here show a vital importance for both satellite-derived and observed anomalies. A comparison between the performance and limitations of MDSI and climatological variables’ anomalies over Mongolia was presented. It demonstrated that the proposed algorithm can be applied for drought evaluation in the harsh climate regions. While demonstrating the usefulness of the MDSI for drought investigation, its performance against the existing drought indices, such as the Drought Severity Index [39], the Effective Drought Index [55] and the Bowen ratio [56], is worthy of further investigation. In additional, the use of the proposed index in the prediction of drought events, such as the four-dimensional water index [57], is practical and critical for improving the welfare of human beings.

Acknowledgments

This research was partially supported by National Central University, Taiwan, through the NCU International Student Scholarship and research grant MOST 104-2111-M-008-004 of the Ministry of Science and Technology, R.O.C. The authors would like to thank the Information and Research Institute of Meteorology, Hydrology and Environment (IRIMHE) of Mongolia for providing the meteorological and soil moisture data used in this research.

Author Contributions

All of the authors contributed to the concept design and development of the research, as well as the improvement of the manuscript. Munkhzul Dorjsuren collected the data, performed the simulation and prepared the first draft of the manuscript. Chi-Han Cheng provided advice to edit the manuscript. Yuei-An Liou edited and finalized the manuscript.

Conflicts of Interest

The authors declare no conflict of interest.

References

  1. Dagvadorj, D.; Natsagdorj, L.; Dorjpurev, J.; Namkhainyam, B. Mongolia Assessment Report on Climate Change 2009; Ministry of Environment, Nature and Tourism, Mongolia: Ulaanbaatar, Mongolia, 2009. [Google Scholar]
  2. Morinaga, Y.; Bayarbaatar, L.; Erdenetsetseg, D.; Shinoda, M. Zoo-meteorological study of cow weight change in a forest steppe region of Mongolia. In Proceedings of the Sixth International Workshop on Climate Change in Arid and Semi-Arid Region of Asia, Ulaanbaatar, Mongolia, 25–26 August 2004; pp. 100–108.
  3. Narasimhan, B.; Srinivasan, R. Development and evaluation of soil moisture deficit index (SMDI) and evapotranspiration deficit index (ETDI) for agricultural drought monitoring. Agric. For. Meteor. 2005, 133, 69–88. [Google Scholar] [CrossRef]
  4. Yang, X.; Wu, J.J.; Yan, F.; Zhang, J. Assessment of regional soil moisture status based on characteristics of surface temperature/vegetation index space. Acta Ecol. Sin. 2009, 29, 1205–1216. [Google Scholar]
  5. Justice, C.O.; Townshend, J.R.G.; Vermote, E.F.; Masuoka, E.; Wolfe, R.E.; Saleous, N.; Roy, D.P.; Morisette, J.T. An overview of MODIS Land data processing and product status. Remote Sens. Environ. 2002, 83, 3–15. [Google Scholar] [CrossRef]
  6. Tucker, C.J.; Choudhury, B.J. Satellite remote sensing of drought conditions. Remote Sens. Environ. 1987, 23, 243–251. [Google Scholar] [CrossRef]
  7. Tucker, C.J. Comparing SMMR and AVHRR data for drought monitoring. Int. J. Remote Sens. 1989, 10, 1663–1672. [Google Scholar] [CrossRef]
  8. Nicholson, S.E.; Tucker, C.J.; Ba, M.B. Desertification, drought and surface vegetation: An example from the west African Sahel. Bull. Am. Meteorol. Soc. 1998, 79, 815–829. [Google Scholar] [CrossRef]
  9. Gonzalez-Alonso, F.; Cuevas, J.M.; Casanova, J.L.; Calle, A.; Illera, P. Drought monitoring in Spain using satellite remote sensing. In Sensors and Environmental Applications of Remote Sensing; Askne, J., Ed.; Taylor & Francis: Abingdon, UK, 1995; pp. 87–90. [Google Scholar]
  10. Gonzalez-Alonso, F.; Calle, A.; Casanova, J.L.; Vazquez, A.; Cuevas, J.M. Operational monitoring of drought in Spain using NOAA-AVHRR satellite images. In Proceedings of the 28th International Symposium on Remote Sensing of Environment, Cape Town, South Africa, 27–31 March 2000.
  11. Liu, W.T.; Negron-Juarez, R.I. ENSO drought onset prediction in northeast Brazil using NDVI. Int. J. Remote Sens. 2001, 22, 3483–3501. [Google Scholar] [CrossRef]
  12. Peters, A.J.; Walter-Shea, E.A.; Ji, L.; Vina, A.; Hayes, M.; Svoboda, M.D. Drought monitoring with NDVI-based standardized vegetation index. Photogramm. Eng. Remote Sens. 2002, 68, 71–75. [Google Scholar]
  13. Ji, L.; Peters, A. Assessing vegetation response to drought in the northern Great Plains using vegetation and drought indices. Remote Sens. Environ. 2003, 87, 85–98. [Google Scholar] [CrossRef]
  14. Tucker, C.J. Red and photographic infrared linear combinations for monitoring vegetation. Remote Sens. Environ. 1979, 8, 127–150. [Google Scholar] [CrossRef]
  15. Gao, X.; Huete, A.R.; Ni, W.; Miura, T. Optical-biophysical relationships of vegetation spectra without background contamination. Remote Sens. Environ. 2000, 74, 609–620. [Google Scholar] [CrossRef]
  16. Jiang, Z.; Huete, A.R.; Didan, K.; Miura, T. Development of a two-band enhanced vegetation index without a blue band. Remote Sens. Environ. 2008, 112, 3833–3845. [Google Scholar] [CrossRef]
  17. Wu, C.; Munger, J.W.; Niu, Z.; Kuang, D. Comparison of multiple models for estimating gross primary production using MODIS and eddy covariance data in Harvard Forest. Remote Sens. Environ. 2010, 114, 2925–2939. [Google Scholar] [CrossRef]
  18. Tucker, C.J.; Pinzon, J.E.; Brown, M.E.; Slayback, D.; Pak, E.W.; Mahoney, R.; Vermote, E.; Saleous, N. An extended AVHRR 8-km NDVI data set compatible with MODIS and SPOT vegetation NDVI data. Int. J. Remote Sens. 2005, 26, 4485–4498. [Google Scholar] [CrossRef]
  19. Sellers, P.J. Canopy reflectance, photosynthesis and transpiration. Int. J. Remote Sens. 1985, 6, 1335–1372. [Google Scholar] [CrossRef]
  20. Tucker, C.J.; Townsend, J.R.G.; Goff, T.E. African land cover classification using satellite data. J. Sci. 1985, 227, 369–375. [Google Scholar] [CrossRef] [PubMed]
  21. Goward, N.S. Satellite bioclimatology. J. Clim. 1989, 2, 710–720. [Google Scholar] [CrossRef]
  22. Zhang, X.; Friedl, M.A.; Schaaf, C.B.; Strahler, A.H.; Hodges, J.C.F.; Gao, F.; Reed, B.C.; Huete, A.R. Monitoring vegetation phenology using MODIS. Remote Sens. Environ. 2003, 84, 471–475. [Google Scholar] [CrossRef]
  23. Guindin-Garcia, N.; Gitelson, A.A.; Arkebauer, T.J.; Shanahan, J.; Weiss, A. An evaluation of MODIS 8- and 16-day composite products for monitoring maize green leaf area index. Agric. For. Meteorol. 2012, 161, 15–25. [Google Scholar] [CrossRef]
  24. Chang, T.-Y.; Liou, Y.-A.; Lin, C.-Y.; Liu, C.-S.; Wang, Y.-C. Evaluation of surface heat fluxes in Chiayi plain of Taiwan by remotely sensed data. Int. J. Remote Sens. 2010, 31, 3885–3898. [Google Scholar] [CrossRef]
  25. Liou, Y.-A.; Kar, S.K. Evapotranspiration estimation with remote sensing and various surface energy balance algorithms—A review. Energies 2014, 7, 2821–2849. [Google Scholar] [CrossRef]
  26. Dao, P.D.; Liou, Y.-A. Object-based Flood Mapping and Affected Rice Field Estimation with Landsat 8 OLI and MODIS Data. Remote Sens. 2015, 7, 5077–5097. [Google Scholar] [CrossRef]
  27. Liou, Y.-A.; Sha, H.-C.; Chen, T.-M.; Wang, T.-S.; Li, Y.-T.; Lai, Y.-C.; Chiang, M.-H.; Lu, L.-T. Assessment of disaster losses in rice field and yield after tsunami induced by the 2011 Great East Japan earthquake. J. Mar. Sci. Technol. 2012, 20, 618–623. [Google Scholar]
  28. Nguyen, K.A.; Liou, Y.-A.; Li, M.-H.; Tran, A.T. Zoning eco-environmental vulnerability for environmental management and protection. Ecol. Indic. 2016, 69, 100–117. [Google Scholar] [CrossRef]
  29. Huete, A.R.; Tucker, C.J. Investigation of soil influences on AVHRR red and near-infrared vegetation index imagery. Int. J. Remote Sens. 1991, 12, 1223–1242. [Google Scholar] [CrossRef]
  30. Karnieli, A.; Shachak, M.; Tsoar, H.; Zaady, E.; Kaufman, Y.; Danin, A.; Porter, W. The effect of microphytes on the spectral reflectance of vegetation in semi-arid regions. Remote Sens. Environ. 1996, 57, 88–96. [Google Scholar] [CrossRef]
  31. Huete, A.R.; Liu, H.Q.; Batchily, K.; van Leeuwen, W.J.D. A comparison of vegetation indices over a global set of TM images for EOS-MODIS. Remote Sens. Environ. 1997, 59, 440–451. [Google Scholar] [CrossRef]
  32. Huete, A.R.; Didan, K.; Miura, T.; Rodriguez, E.P.; Gao, X.; Ferreira, L.G. Overview of the radiometric and biophysical performance of the MODIS vegetation indices. Remote Sens. Environ. 2002, 83, 195–213. [Google Scholar] [CrossRef]
  33. Kim, Y.; Huete, A.R.; Miura, T.; Jiang, Z. Spectral compatibility of vegetation indices across sensors: Band decomposition analysis with Hyperion data. J. Appl. Remote Sens. 2010, 4, 043520. [Google Scholar] [CrossRef]
  34. Yao, Y.; Liang, S.; Qin, Q.; Wang, K. Monitoring drought over the conterminous United States using MODIS and NCEP Reanalysis-2 data. J. Appl. Meteor. Climatol. 2010, 49, 1665–1680. [Google Scholar] [CrossRef]
  35. Mu, Q.; Heinsch, F.A.; Zhao, M.; Running, S.W. Development of a global evapotranspiration algorithm based on MODIS and global meteorology data. Remote Sens. Environ. 2007, 111, 519–536. [Google Scholar] [CrossRef]
  36. Mu, Q.; Jones, L.A.; Kimball, J.S.; McDonald, K.C.; Running, S.W. Satellite assessment of land surface evapotranspiration for the pan-Arctic domain. Water Resour. Res. 2009, 45, W09420. [Google Scholar] [CrossRef]
  37. Mu, Q.; Zhao, M.; Running, S.W. Evolution of hydrological and carbon cycles under a changing climate. Part III: Global change impacts on landscape scale evapotranspiration. Hydrol. Processes. 2011, 25, 4093–4102. [Google Scholar] [CrossRef]
  38. Mu, Q.; Zhao, M.; Running, S.W. Improvements to a MODIS global terrestrial evapotranspiration algorithm. Remote Sens. Environ. 2011, 115, 1781–1800. [Google Scholar] [CrossRef]
  39. Mu, Q.; Zhao, M.; Kimball, J.S.; McDowell, N.G.; Running, S.W. A remotely sensed global terrestrial drought severity index. Bull. Am. Meteorol. Soc. 2013, 94, 83–98. [Google Scholar] [CrossRef]
  40. Bolortsetseg, B.; Bayasgalan, Sh.; Dorj, B.; Natsagdorj, L.; Tuvaansuren, G. Impact on agriculture. In Climate Change and Its Impacts in Mongolia; Batima, P., Dagvadorj, D., Eds.; JEMR Publishing: Ulaanbaatar, Mongolia, 2000; pp. 96–198. [Google Scholar]
  41. Batima, P.; Dagvadorj, D. Climate Change and Its Impacts in Mongolia; NAMHEM JEMR Publishing: Ulaanbaatar, Mongolia, 2000. [Google Scholar]
  42. Shiirevdamba, T. Biological Diversity in Mongolia: First National Report; Ministry for Nature and the Environment of Mongolia; Admon Printing House: Ulaanbaatar, Mongolia, 1998; p. 106. [Google Scholar]
  43. Natsagdorj, L. Climate Change: Pasture and Animal Husbandry; Batima, P., Ed.; Institute of Meteorology and Hydrology of Mongolia: Ulaanbaatar, Mongolia, 2003. [Google Scholar]
  44. Batima, P.; Bat, B.; Tserendash, S.; Myagmarjab, B. Adapting to drought, zud and climate change in Mongolia’s rangelands. In Climate Change and Adaptation; Neil, L., Ian, B., Adejuwon, J., Barros, V., Lasco, R., Eds.; Earthscan: London, UK, 2008. [Google Scholar]
  45. Mu, Q.; Zhao, M.; Running, S.W. MODIS Global Terrestrial Evapotranspiration (ET) Product (NASA MOD16A2/A3); Algorithm Theoretical Basis Document, Collection 5; NASA HQ, Numerical Terradynamic Simulation Group, University of Montana: Missoula, MT, USA, 2013. [Google Scholar]
  46. Solano, R.; Didan, K.; Jacobson, A.; Huete, A. MODIS Vegetation Index User’s Guide (MOD13 Series); Version 2.00, May 2010 (Collection 5); Vegetation Index and Phenology Lab, The University of Arizona: Tucson, AZ, USA, 2010. [Google Scholar]
  47. LPDAAC. NASA Land Data Products and Services. Available online: https://lpdaac.usgs.gov/ (accessed on 23 March 2016).
  48. Huete, A.R.; Justice, C.O.; van Leeuwen, W. MODIS Vegetation Index (MOD 13) Algorithm Theoretical Basis Document. Available online: http://modis.gsfc.nasa.gov/data/atbd/atbd_mod13.pdf (accessed on 24 June 2010).
  49. Wang, Z.; Liu, C.; Huete, A.R. From AVHRR-NDVI to MODIS EVI: Advances in vegetation index research. Acta Ecol. Sin. 2003, 23, 979–987. [Google Scholar]
  50. Huete, A.R.; Justice, C.O.; Liu, H. Development of vegetation and soil indices for MODIS-EOS. Remote Sens. Environ. 1994, 49, 224–234. [Google Scholar] [CrossRef]
  51. Information and Research Institute of Meteorology, Hydrology and Environment (IRIMHE), Mongolia 2016. Available online: http://www.icc.mn/ (accessed on 25 March2016).
  52. Dhar, O.N.; Rakhecha, P.R.; Kolkarni, A.K. Rainfall study of severe drought years of India. Proc. Int. Symp. Hydrol. Aspect Drought. 1979, 1, 28–36. [Google Scholar]
  53. Loik, M.E.; Breshears, D.D.; Lauenroth, W.K.; Belnap, J. A multi-scale perspective of water pulses in dryland ecosystems: Climatology and ecohydrology of the western USA. Oecologia 2004, 141, 269–281. [Google Scholar] [CrossRef] [PubMed]
  54. Palmer, W.C. Meteorological Drought. U.S. Weather Bureau Research Paper. Available online: https://www.ncdc.noaa.gov/temp-and-precip/drought/docs/palmer.pdf (accessed on 25 March2016).
  55. Kim, D.; Byun, H.R.; Choi, K.S. Evaluation, modification, and application of the Effective Drought Index to 200-year drought climatology of Seoul, Korea. J. Hydrol. 2009, 378, 1–12. [Google Scholar] [CrossRef]
  56. Cheng, C.-H.; Nnadi, F.; Liou, Y.-A. A regional land use drought index for Florida. Remote Sens. 2015, 7, 17149–17167. [Google Scholar] [CrossRef]
  57. Byun, H.R.; Lee, S.J.; Morid, S.; Choi, K.S.; Lee, S.M.; Kim, D.W. A study on the periodicities of droughts in Korea. Asia Pac. J. Atmos. Sci. 2008, 44, 417–441. [Google Scholar]
Figure 1. Land use/cover map of Mongolia (41°35′N–52°09′N and 87°44′E–119°56′E).
Remotesensing 08 00509 g001
Figure 2. Time series of the climate data for air temperature (°C: red open squares), precipitation (mm: blue bars) and soil moisture content (%: light red open triangles) averages over the sixteen stations during the growing season of 2000–2013.
Remotesensing 08 00509 g002
Figure 3. (an) MDSI anomaly distributions during the growing season for the years 2000–2013: The MDSI anomaly was computed as the standardized Z terms represented in Equation (6).
Remotesensing 08 00509 g003
Figure 4. Frequency distribution of the MDSI anomaly with five categories of the total area during the growing season of 2000–2013: (i) severely wet: >2 (green bars); (ii) moderately wet: 0.5 to 1.99 (light green bars); (iii) normal: 0.49 to −0.49 (white bars); (iv) moderate drought: −0.5 to −1.99 (light yellow bars); and (v) severe drought: <−2 (orange bars).
Remotesensing 08 00509 g004
Figure 5. Time series for the MDSI anomaly with different climatological variables over the sixteen stations during 2000–2013: (a) anomalies of MDSI (green open circles) and T (red opened squares); and (b) anomalies of MDSI (green open circles) and P (blue bars). The horizontal lines show that the MDSI anomaly value is −0.5 or less for drought conditions, whereas horizontal dashed lines show the percentage deviation values of T (0.0 or above) and P (0.0 or less) for drought condition.
Remotesensing 08 00509 g005
Figure 6. Time series for the MDSI anomaly (green open circles) with soil moisture content (%: light red open triangles) over the sixteen stations in 2000–2013: the horizontal line shows that the MDSI anomaly value is −0.5 or less for drought condition.
Remotesensing 08 00509 g006
Figure 7. (ad) Temporal variations of the MDSI anomaly among different land use areas for 2000–2013: (a) forest steppe; (b) steppe; (c) high mountains; and (d) desert steppe. The MDSI anomaly symbols correspond to the average of four consecutive months’ (the growing season) value calculated in the pixel region at each station. The vertical axes depict the standardized MDSI anomaly (green open circles) of the pixel region. Precipitation (mm: blue bars) is accumulated during the growing season, while soil moisture content (%: light red open triangles) is acquired during the growing season periods to match the MDSI anomaly value in the same periods. The horizontal line shows that the MDSI anomaly value −0.5 or less for drought condition.
Remotesensing 08 00509 g007
Table 1. Meteorological observation stations with information about the geographical location, elevation and various land use areas of Mongolia.
Station NameLat. (°N)Long. (°E)Elev. (m)Various Land Use Areas
Ulgii48.9789.971714High mountains
Khovd48.0291.651405High mountains
Altai46.4096.252147High mountains
Tsetserleg47.45101.471695Forest steppe
Tarialan49.61101.991230Forest steppe
Bulgan48.80103.551210Forest steppe
Baruunkharaa48.91106.08814Forest steppe
Undurkhaan47.32110.671028Steppe
Choibalsan48.07114.60759Steppe
Bayankhongor46.13100.681860High mountains
Arvaikheer46.27102.781831Steppe
Baruun-Urt46.68113.28986Steppe
Mandalgobi45.77106.281398Desert steppe
Sainshand44.90110.12915Desert steppe
Dalanzadgad43.58104.421469Desert steppe
Saikhan44.08103.551302Desert steppe
The sixteen stations are listed in order from north to south and west to east.
Table 2. Average and standard deviations (SD) of air temperature (°C), precipitation (mm) and soil moisture content (%) over the sixteen stations divided into four various land use areas (forest steppe, steppe, high mountains and desert steppe) for the 2000–2013 growing seasons.
Land Use AreasNumbers of StationAir Temperature (°C)Precipitation (mm)Soil Moisture Content (%)
AverageSDAverageSDAverageSD
Over Mongolia1617.00.7149266.71.0
Forest Steppe415.40.92343810.82.2
Steppe417.30.9163486.81.5
High Mountains415.30.8110364.21.0
Desert Steppe419.90.788284.81.3
Table 3. Correlation (r) matrix among the air temperature, precipitation and soil moisture content over the sixteen stations during the growing season of 2000–2013. Correlation was between two climatic parameters with a significance level of p < 0.001.
Climate ParametersAir Temperature Precipitation Soil Moisture Content
Air temperature 1
Precipitation −0.661
Soil moisture content−0.770.781
Table 4. Categories of wet (W), dry (D) and normal (WD) conditions of the MDSI anomaly.
CategoryDescriptionMDSICategoryDescriptionMDSI
W2severely wet2.00 or greaterD1moderate drought−0.50 to −1.99
W1moderately wet0.50 to 1.99D2severe drought−2.00 or less
WDnormal0.49 to −0.49
Table 5. Correlations among the MDSI anomaly with different climatological variables over all of Mongolia during the growing season of 2000–2013.
Land Use AreasNumbers of StationMDSI vs. T AnomaliesMDSI vs. P AnomaliesMDSI Anomalies vs. Soil Moisture Content
Over Mongolia16−0.66 **0.81 ***0.74 **
Forest Steppe4−0.67 **0.340.63 **
Steppe4−0.65 *0.83 ***0.39
High Mountains4−0.52 *0.67 **0.64 **
Desert Steppe4−0.450.70 **0.72 **
Significance levels of the correlation coefficient (r): *** (p < 0.001), ** (p < 0.01), * (p < 0.05).

