Article

Towards an Improved Environmental Understanding of Land Surface Dynamics in Ukraine Based on Multi-Source Remote Sensing Time-Series Datasets from 1982 to 2013

1
Center for Remote Sensing of Land Surfaces (ZFL), University of Bonn, Walter-Flex-Str. 3, 53113 Bonn, Germany
2
Center for Development Research (ZEF), University of Bonn, Walter-Flex-Str. 3, 53113 Bonn, Germany
3
Space Research Institute of National Academy of Sciences of Ukraine and State Space Agency of Ukraine, Glushkov Ave, 40, Building 4/1, 03680 Kyiv, Ukraine
4
Remote Sensing Research Group (RSRG), Department of Geography, University of Bonn, Meckenheimer Allee 166, 53115 Bonn, Germany
*
Author to whom correspondence should be addressed.
Submission received: 1 May 2016 / Revised: 13 July 2016 / Accepted: 19 July 2016 / Published: 26 July 2016
(This article belongs to the Special Issue Monitoring of Land Changes)

Abstract

:
Ukraine has experienced immense environmental and institutional changes during the last three decades. We have conducted this study to analyze important land surface dynamics and to assess processes underlying the changes. This research was conducted in two consecutive steps. To analyze monotonic changes we first applied a Mann–Kendall trend analysis of the Normalized Difference Vegetation Index (NDVI3g) time series. Gradual and abrupt changes were studied by fitting a seasonal trend model and detecting the breakpoints. Secondly, essential environmental factors were used to quantify their possible relationships with land surface changes. These factors included soil moisture as well as gridded air temperature and precipitation data. This was done using partial rank correlation analysis based on annually aggregated time-series. Our results demonstrate that positive NDVI trends characterize approximately one-third of Ukraine’s land surface, located in the northern and western areas of the country. Negative trends occurred less frequently, covering less than 2% of the area and are distributed irregularly across the country. Monotonic trends were rarely found; shifting trends were identified with a greater frequency. Trend shifts were seen to occur with an increased frequency following the period of the 2000s. We determined that land surface dynamics and climate variability are functionally interdependent; however, the relative influence of the drivers varies in different locations. Among the factors analyzed, the air temperature variable explains the largest portion of NDVI variability. High air temperature/NDVI correlation coefficients (r = 0.36 − 0.77) are observed over the entire country. The soil moisture content is of significant influence in the eastern portion of Ukraine (r = 0.68); precipitation (r = 0.65) was most influential in the central regions of the country. These results increase our understanding of ecosystem responses to climatic changes and anthropogenic activities.

Graphical Abstract

1. Introduction

Ukraine has experienced immense environmental and institutional changes during the last three decades due to both human-induced and environmental processes such as socio-economic transformation, ongoing urbanization, increased climate variability and frequency of hazardous events [1,2]. The drastic social, institutional and economic alterations at the end of 1991 as a result of the Soviet Union collapse induced significant changes in distribution and extent of land cover, land use intensity, economic productivity in the agricultural sector and shifts in the land surface phenology [2,3]. These socio-economic changes had radical results and one of the consequences was the widespread farmland abandonment especially in the northern and western regions [1,4,5,6,7]. Besides the ongoing socio-economic transformations, several studies discussed the changes in climate conditions. In the past 30–50 years, droughts have become more frequent and intense, covering up to half of the area of Ukraine every 10–12 years, and up to 20% every 2–3 years [8]. All these described alterations had an impact on the ecosystem that can be reflected on the land surface. To understand the effect of these phenomena, long-term monitoring of land surface changes is required.
There is a limited number of studies on long-term land surface change analysis for all of Ukraine, as previous studies focused on specific applications of land cover change (e.g., forest loss, farmland abandonment) in particular areas of the country (Carpathian ecoregion, the river basin of the Dnieper river) [1,2,9]. Moreover, little attention has been paid to the understanding of the main drivers of these changes as most of the studies focused on the factors influencing land abandonment [1,10].
Satellite image time series observations of land surface reflectance and vegetation indices, such as Normalized Difference Vegetation Index (NDVI) calculated from them, are often used for land surface change analysis as NDVI uses the spectral differences between red and near infrared reflectance and as a result exposes the properties of ecosystem [11]. NDVI-based trend analysis can assist the investigation of changes of land surface over a period of time and help to understand the mechanisms behind the observed changes. This is because NDVI is not only related to a variety of vegetation properties (structural properties of plants, vegetation productivity) [12,13], but it can also indirectly represent the ecosystem conditions [14]. For instance, several studies used NDVI as a proxy of land cover change [15] and land dynamics [16], land degradation [17], farmland abandonment [18], and phenological changes [19]. Based on these complex characteristics of NDVI, we assume that it can be used to assess land surface dynamics over time. In the context of this study, we define land surface dynamics as the sudden or gradual transformation or modification of earth surface including vegetation, soil, water and its ecosystem functioning in the unit of time (e.g., day, month, year) including fast (e.g., land use change) and slow processes (e.g., land degradation), which can indicate the response to both anthropogenic and environmental factors [12,13,20].
The detection of significantly increasing or decreasing trends is often not enough to assess the environmental impact or to be able to attribute the change to factors behind it. Abrupt changes or non-linearities may occur within the long-term time series, as the trends in complex systems usually are not monotonously increasing or decreasing [20,21,22]. Furthermore, the interpretation of these abrupt changes without using additional datasets or expert knowledge is often challenging [23].
In this regard, the overall aim of this research was not only to analyze the land surface dynamics over all of Ukraine for the time period from 1982 to 2013 but also to assess underlying processes and drivers of the changes. The specific objectives were: (1) to assess long-term land surface variability; (2) to integrate data from different sensors and investigate the suitability of different methodologies; and (3) to estimate the effects of the essential environmental variables namely soil moisture, air temperature and precipitation on land surfaces. Our study is, therefore, the first study that analyzed spatiotemporal changes of land surface over all of Ukraine for the long time period of 30 years to provide integrated and spatially continuous knowledge of the changes and its triggers using remote sensing approaches.

2. Materials and Methods
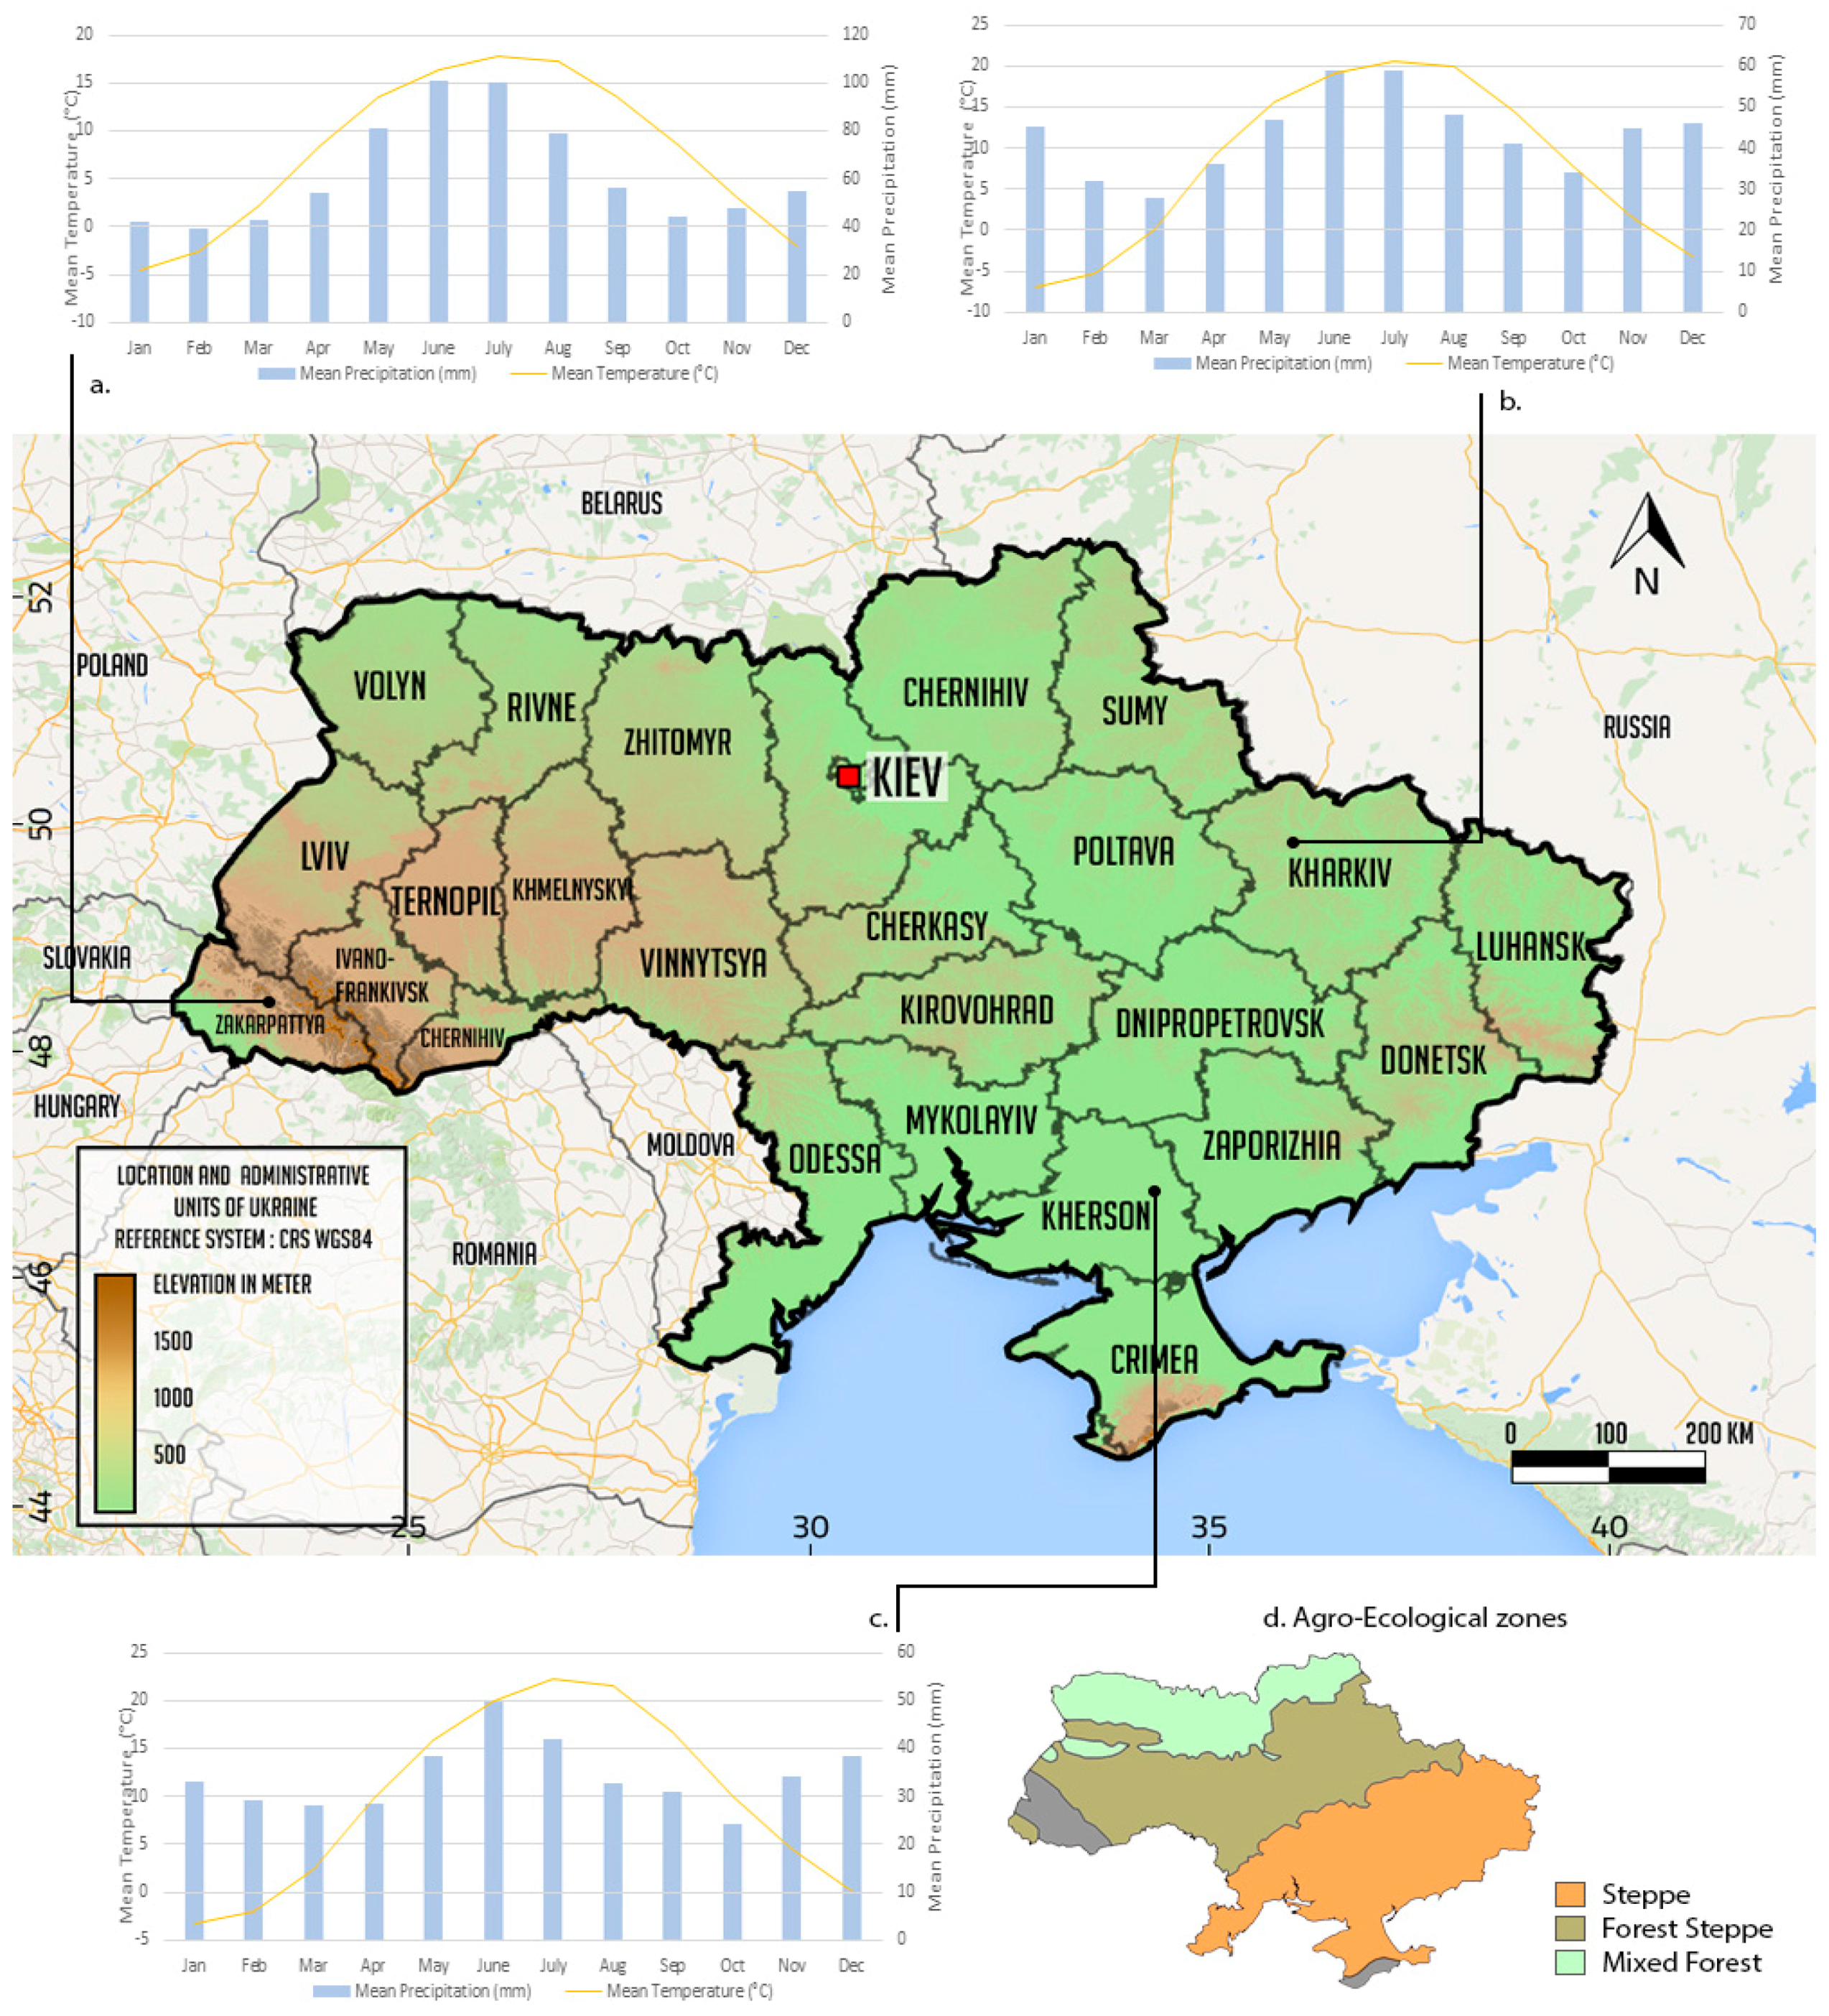
2.1. Study Area

Ukraine is located in Eastern Europe in the southeastern part of the East European plain, between 44°20′N and 52°20′N latitudes and 22°5′E and 41°15′E longitude (Figure 1). It covers 603,550 km2 and consists of 24 administrative units (oblast) [24]. Most of Ukraine is composed of vast plains stretching north from the Black and Azov Seas. There are also two mountainous areas in the west and south of the country, the Carpathians and Crimean mountains, respectively. The climate in the East European Plain, the medium Ukrainian Carpathians, and the Crimean Mountains is mostly temperate continental, with hot summers (t > 18 °C) and cold winters (t < −5 °C); the southern coast of the Crimea has a subtropical Mediterranean climate [25]. The area of Ukraine is divided into three main agro-ecological zones: steppe (southern and eastern regions, 40% of the area), semi-steppe (central regions) and mixed forest (north and north-west) [7,26] (Figure 1d).
Despite the prevailing moderate continental climate, the study area is characterized by fairly significant differences in the humidity, temperature and length of the growing season [27]. Hot and relatively dry summers, together with relatively severe winters, create good conditions for the formation of chernozems (black soils) that are highly fertile for most agricultural crops [28]. The average winter temperature ranges from −8 °C to −12 °C. In the southern regions, the mean winter temperature is 0 °C. The mean summer temperature ranges from 18 °C to 25 °C, although it can reach above 35 °C.
The area of Ukraine is characterized by significant regional differences in rainfall and its distribution throughout the year with a summer maximum. The largest amplitude of the volume is characteristic to the south. Most of the precipitation falls in the Ukrainian Carpathians (more than 1500 mm per year). The precipitation ranges from 650 mm (in the west) to 400 mm (in the southeast). In dry years, precipitation is significantly reduced: in the coastal areas of the Azov and Black Seas up to 100 mm, in the steppe up to 150–200 mm, and in forest-steppe up to 250–350 mm. In winter, permanent snow cover occurs almost everywhere in the country. One of the key features of the climate of Ukraine are the droughts which in recent years have increased frequency and affect large areas [8,27,29].

2.2. Data

2.2.1. Normalized Difference Vegetation Index

As a primary data source for the regional study the Global Inventory Monitoring and Modeling System (GIMMS) NDVI3g dataset was chosen as it is the only currently available dataset that spans since 1982 and includes a dense time series needed for the analysis of land surface dynamics. The GIMMS NDVI3g dataset is an improved 8 km NDVI dataset produced by the National Oceanic and Atmospheric Administration (NOAA) Advanced Very High Resolution Radiometer (AVHRR) instruments that extend from July 1981 to December 2013 [12,30].
The third generation GIMMS NDVI is a 15-day Maximum Value Composite that was acquired from seven different NOAA satellites (7, 9, 11, 14, 16, 17, 18), which have been processed using an adaptive Empirical Mode Decomposition. NDVI3g is appropriate for long-term studies of land surface trends in vegetation, seasonality and coupling between climate variability and vegetation over the last three decades [31,32].
The NDVI3g has different quality flags [17]. Based on these flags, prior to analysis, all values with reduced quality were excluded. We used pixels with minimum 75% valid data excluding interpolated observations, possible snow covered pixels. In addition, the images for the year of 1981 were also excluded to have full-year observations. The maximum value compositing approach was applied in the NDVI3g dataset.

2.2.2. Environmental Variables

Several studies discussed the effects of climate variability on land surface change [33,34,35]. The monthly mean temperature (TMP) and precipitation total (PRE) datasets were obtained from the Climate Research Unit (CRU). The datasets cover the period 1901 to 2014 with a spatial resolution of 0.5° [36].
Recent studies also show the impacts of soil moisture on vegetation at various temporal scales [34,37,38]. They discuss the co-variation of NDVI and soil moisture, stating coherent trend changes [39]. Furthermore, other authors showed that a soil moisture NDVI pixel-wise residual trend indicates land degradation [17]. Soil moisture influences hydrological and agricultural processes, runoff generation, drought development and other processes. A soil moisture dataset [38,40] was chosen for the study, which was a merged product of active and passive microwave soil moisture products [40]. The dataset covering the period 1978–2013 provides daily surface soil moisture with a spatial resolution of 0.25° and depicts the soil moisture in around 2 cm layer depth [40]. Therefore, we chose the following environmental variables precipitation, temperature and soil moisture for the analysis.
In addition, we used a land cover map [41] of 1990 as a reference (the main institutional changes happened after 1990) to characterize the possible associations of the environmental variables and NDVI in main vegetation formations: cropland, grassland, and forest, which have different seasonal characteristics and response to the disturbances [41].

2.3. Methods

Prior to processing, the raster time series datasets were reprojected to World Geodetic System (WGS) 84 coordinate reference system and resampled to a common 8 km grid, using a bilinear interpolation algorithm. The datasets were further smoothed with Savitzky-Golay filter as the datasets were not extremely noisy, and we intended preserving the local variations [42]. We extracted the temporal window (1982–2013) of the environmental time series to match the same period with NDVI dataset. The water bodies and build up areas were masked out. All the analyses were conducted using R statistical software [43].

2.3.1. Trend Analysis

After the pre-processing of the image time series (1982–2013), we explored the trends of annually aggregated NDVI series. There are several methods described in the literature for time series analysis of satellite imagery [12,13,20]. The simplest and most common method is the ordinary least-squares (OLS) regression, where the main assumption is that the land surface is changing linearly and gradually over time [44]. The drawbacks of this method have been depicted by several authors [23,43]. In particular linear regression assumes normality and independence of data (neglecting the temporal autocorrelation). To overcome this, we used the Mann–Kendall nonparametric trend test, which does not depend on the distribution of data and can be used with data with serial dependence. Tüshaus et al. [45] demonstrated the performance of trend analysis with the aforementioned method for the land surface dynamics monitoring. This non-parametric test evaluates the occurrence of a monotonic single direction trend in the time series [45]. Furthermore, non-stationarity (time dependency) was excluded due to a significant Augmented Dickey-Fuller test and inspection of the autocorrelation graphs and the related tests of annually aggregated time series.
However, the land surface dynamics are not always a gradual process and often the changes are abrupt due to factors such as extreme weather conditions or changes in land management. In general, the changes that can be monitored using remotely sensed data can be classified as follows: (1) a seasonal or cyclic change; (2) a gradual change over time consistent in direction (monotonic); and (3) an abrupt shift at a specific point in time [20,44].
To study sudden and gradual changes in land surface, the Break For Additive Season and Trend (BFAST) algorithm was used, [43] which decomposes the series into trend, seasonal and reminder components to evaluate gradual and seasonal dynamics occurring within indices derived from satellite image time series such as NDVI [46,47,48]. The season-trend model [47] (i.e., linear trend and harmonic component) was fitted to pre-processed monthly NDVI time series, and the stability of the model was assessed using a test that determines the significance of structural trend breaks. As we were focusing on trajectories of the changes, rather than the number of the breakpoints, we chose the model with either 0 or 1 breakpoints. These breakpoints were assumed to catch the most influential trend shifts in the time series, which represent drastic changes in ecosystem functioning [47,48]. We classified the trends based on the modified methodology described by de Jong et al. [47]. The authors used the term greening/browning for categorizing the changes based on the signal before and after the breakpoint. Instead of the above-mentioned terms, we used the concept of increase or decrease of the NDVI trends.

2.3.2. Correlation Analysis

We used correlation analysis to investigate the effects of essential environmental variables, namely soil moisture, air temperature and precipitation on variability of NDVI. Correlation analysis is one of the commonly used methods for assessing the associations between vegetation indices and independent variables. In the case of simple correlation, the linear relationship between two variables is determined. The disadvantage of such an approach is that the effect of other variables is ignored. For example, when the correlation between soil moisture and NDVI is studied, the impact of other factors, such as precipitation and temperature, on NDVI is disregarded. To reflect the internal relation between two variables, a partial correlation coefficient should be calculated. Partial correlation coefficients reveal the relation between two variables when controlling the impact of other variables. As a result, when two variables are both linked to the third, only the relation between the former two variables is estimated while the impact of the third variable is removed [49,50]. Partial Spearman correlation is nonparametric in the form of relationship, and it is robust against outliers and invariant against monotone transformation.

3. Results and Discussion

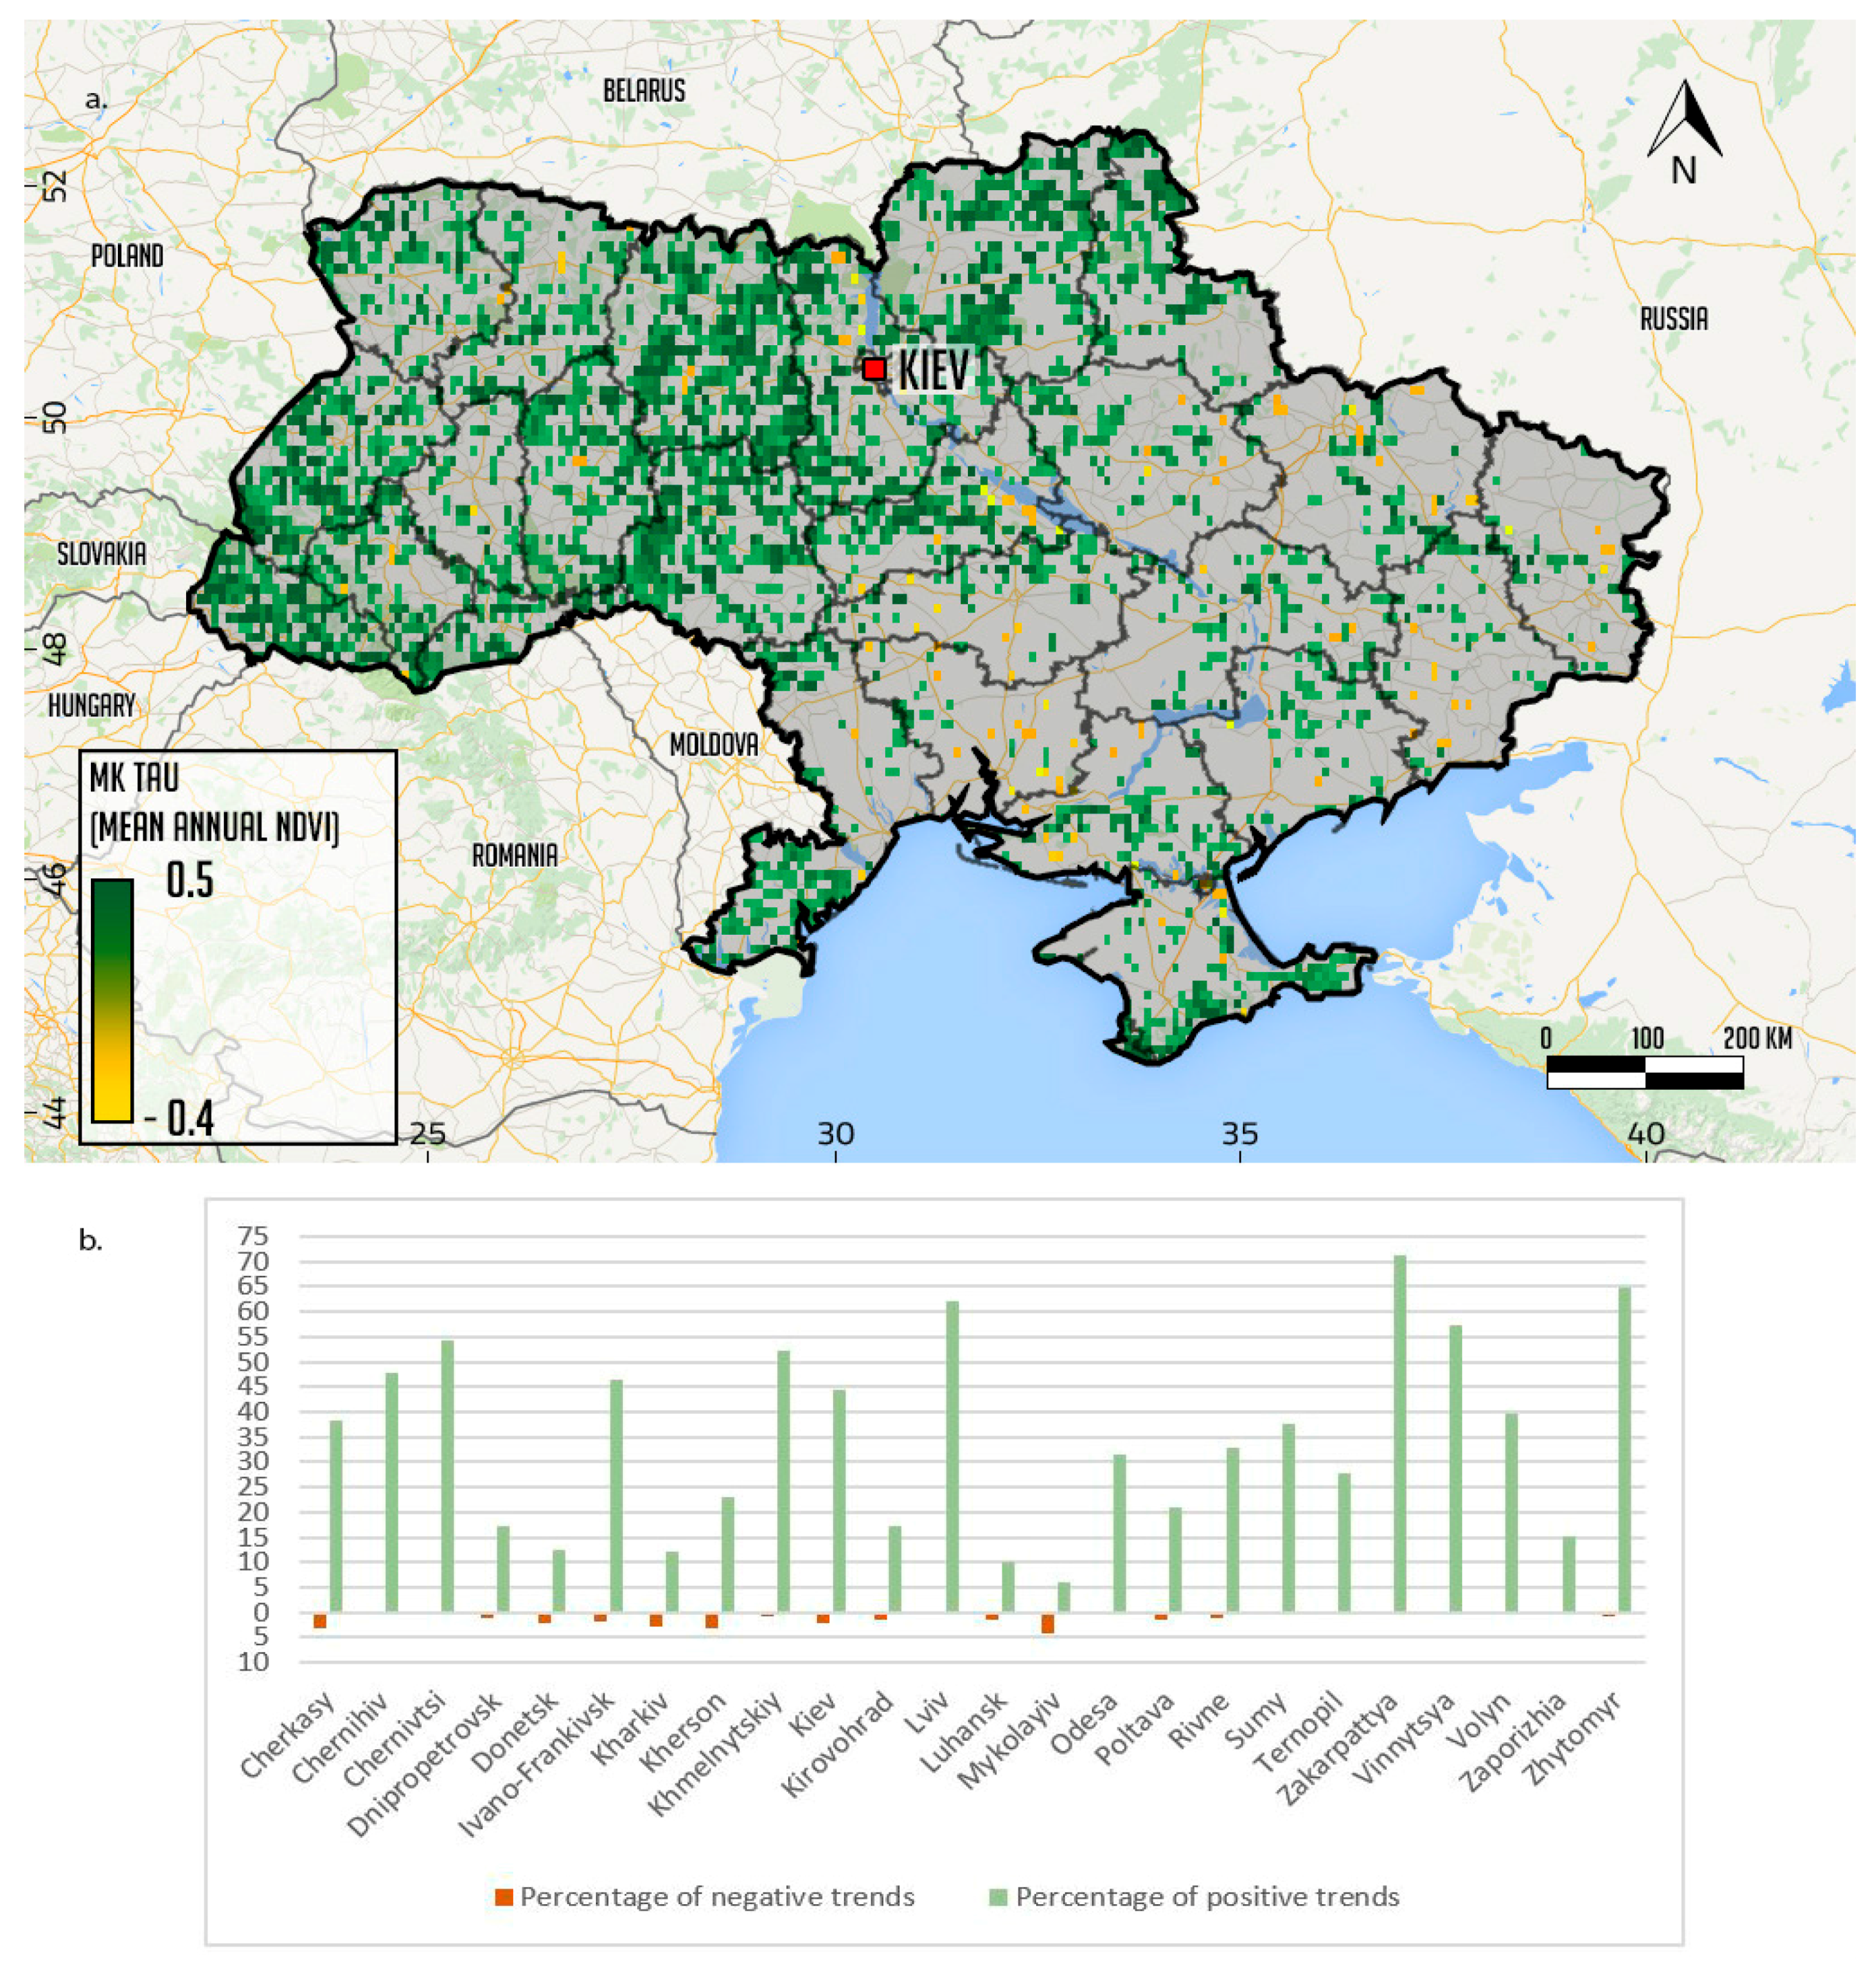
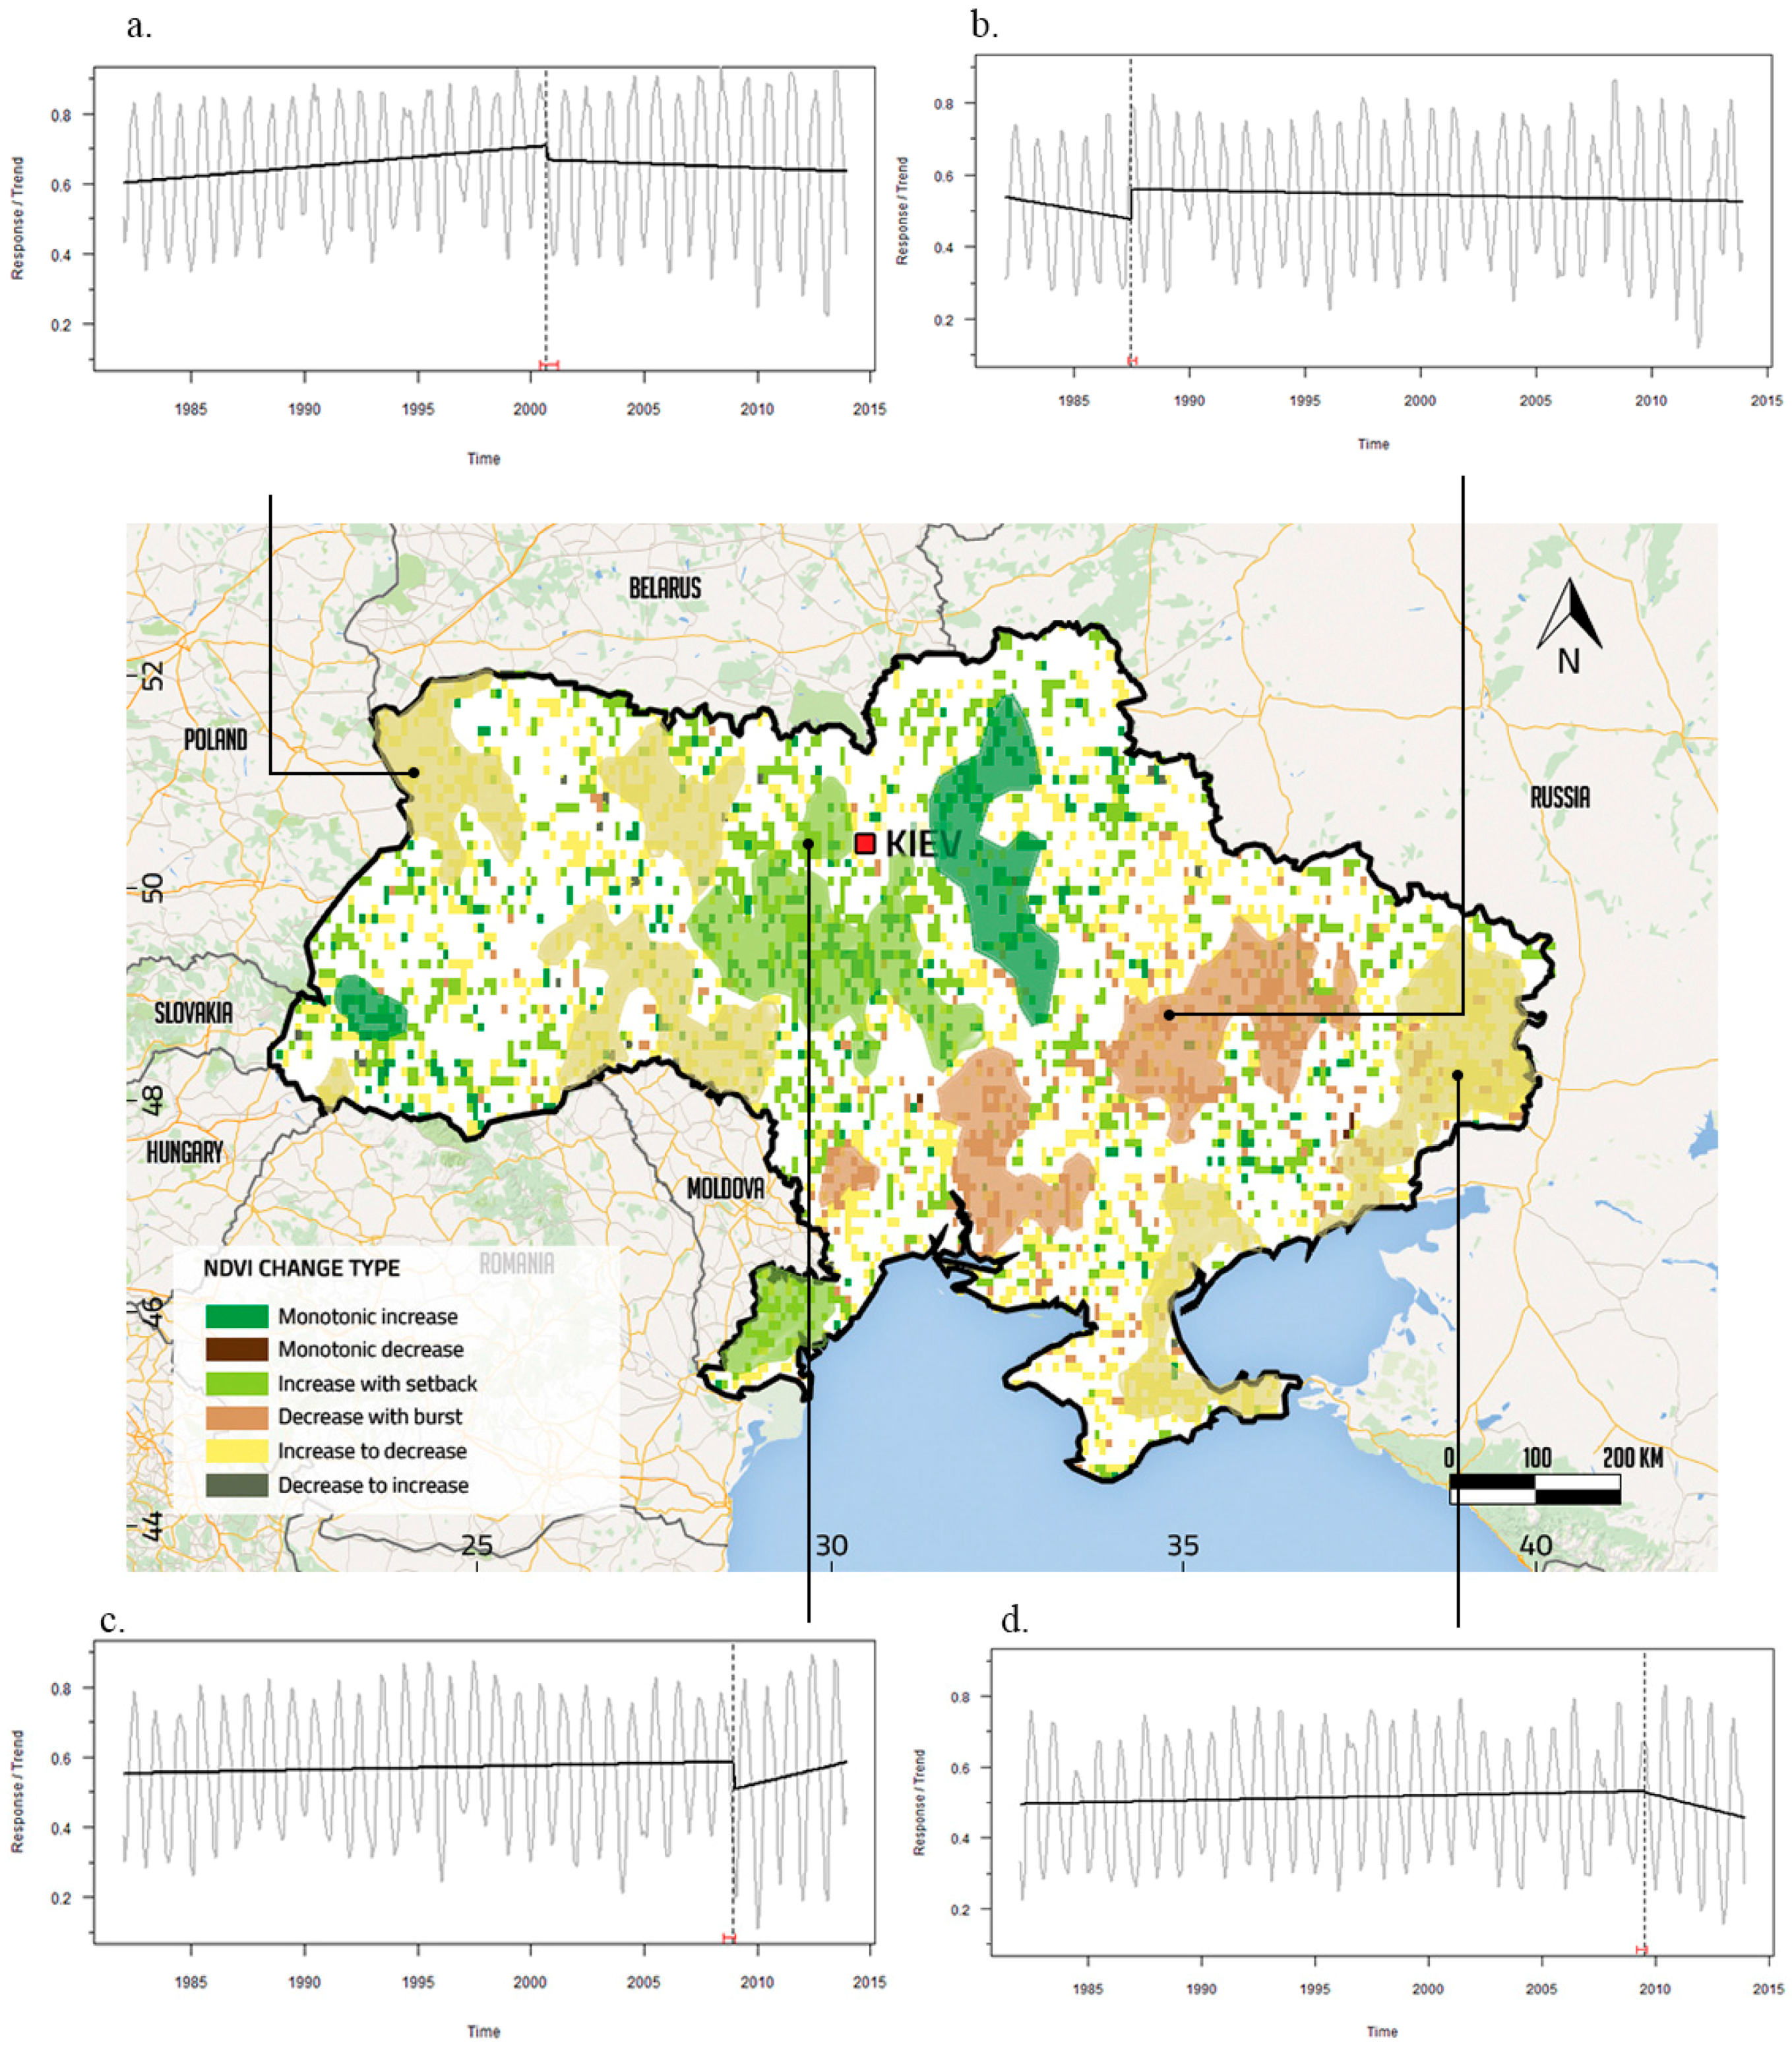
3.1. Trends of NDVI Series

Figure 2 shows the results of the non-parametric Mann–Kendall trend analysis of annually aggregated NDVI time series from 1982 to 2013 for Ukraine. Areal statistics (Figure 2b) depict the occurrence of positive and negative trends in each administrative unit proportional to its area. As changes of environmental conditions are most likely to affect the land-cover classes in a different way [33], we interpreted the relative influence of each factor based on the spatial context of the observed associations i.e., land cover class and the agro-ecological zone.
Overall, around one-third of the area of Ukraine is characterized by significant positive trends, clustered mainly in northern and western parts, which are mostly in the relatively humid and temperature limited area with forests and forest-steppe zones. These areas are also characterized by less frequent crop cultivation and observed land abandonment processes [18]. The secondary succession on the former croplands is captured by a positive trend signal in our analysis. Around 30% of cropland is characterized by positive trends, which also indicates changes in agricultural practices. A large cluster of the positive trend was identified in the northwest from Kiev, where the Chernobyl zone is located. This area has been closed since 1986 after the occurrence of the Chernobyl disaster, which is one of the major anthropogenic disasters of the last century. Within the Chernobyl zone, active vegetation growth and environmental recovery are observed and documented [4], which is also reflected in the results of the trend analysis. The observed positive trends in forest cover 32% of its area. This is evident in the areas such as mountainous regions in the Carpathian Mountains in the west of Ukraine and in the Crimean Mountains [9].
Statistically significant negative trends were less frequent (<2% of the total area) and are mostly scattered across the country. This could probably be explained by the fact that the area was more dynamic, and, instead of a monotonic trend, land surface was varying over the entire study period. Most of the steppe zone does not reveal significant trends. The steppe zone of Ukraine, sometimes also referred to as the ‘bread basket’ of Ukraine, is the area where most intensively cultivated lands are located. The absence of the big clusters of significant trends within this part of Ukraine may indicate that, despite the overall socio-economic and environmental processes that have occurred in the country since 1982, these areas were continuously managed in a similar way, which has not led to noticeable land surface trends.
It should be emphasized that the analysis of long-term earth observation time series is affected by several factors, such as the spatial resolution of the imagery, the level of temporal aggregation, number of observations, pre-processing steps, and the analysis method itself. The temporal resolution of the time series has an effect on the trend significance estimation. In comparison to the full-resolution time series, the use of annually aggregated data reduces the number of observations, which results in the underestimation of the trend significance. Nevertheless, annual aggregation decreases the risk of detecting false positive trends [12]. Furthermore, the aggregation is an effective method to account for autocorrelation: dependence between successive observations in a time series [50].
Although monotonic trend analysis can reveal the general tendency of land surface changes, the trends are not always continuously increasing or decreasing but can fluctuate over time [21]. To account for these changes, a breakpoint analysis was conducted. Figure 3 illustrates the spatial distribution of change categories. Pixels with insignificant trends (p ≥ 0.05) were masked out. For each category of land surface change, representative points were selected, and the temporal profiles of NDVI response and the observed trend were studied in detail (Figure 3a–d).
In general, NDVI varied and pixels with trend shifts prevailed (Figure 3). Increasing trends with the shifts is the dominant type covering 28% of Ukraine (Table 1). Although the hotspots of the monotonic increase can be noticed (3.67% of the area), the results of the analysis of the change type reveal a higher number of interrupted trends (i.e., increase with setback) and reversal trends (increase to decrease). The interrupted increasing trends could probably be conditioned by human interventions and by the effect of extremely dry periods (observed in 10.24% of the area). The reversal trend indicating trend change from increase to decrease stated the decline of ecosystem functioning. We suggest that these types of changes can be associated with the large socioeconomic disturbances followed by the collapse of the Soviet Union and associated processes of land abandonment after 1991 and land re-cultivation after the 2000s [6,7].
We also evaluated the percentage of change types in each land cover class (Table 1). The estimates reflect the percentage of the trend type within the dominant class, using the land cover information from the 1990 reference year. Generally, the interpretation of these trends is challenging as the trend shifts can be explained by several factors [47]. The reversal trend can be attributed to long-term increasing human pressures [48], particularly the cultivation of abandoned croplands, which was also observed by Smaliychuk et al. [7]. Another abundant category of change is the increasing trend with an abrupt negative change, which can be related to the extreme events such as drought. In Ukraine, frequent drought events have been observed during the last 16 years [29]. The drought in 2003 in most of the pixels was not detected as a major break and this can be explained by the fact, that in long-term series from 1982–2013, the drought did not have the biggest break in the NDVI trajectory. Furthermore, during the consecutive drought in 2007–2010, the break was not detected in the first year of the drought. The effects of droughts should be further investigated. Another challenge for the interpretation is the spatial resolution of the dataset, as one pixel of NDVI3g dataset can contain diverse land cover types, due to the fragmented landscapes in some regions and the size of the land management units [51,52]. Despite of this sub-pixel heterogeneity, the dataset is still representing the large-scale land use/land cover patterns and their spatiotemporal variance over this vast area. The validation of these trends is not straightforward because the field observations are not temporally dense and mostly were restricted to a few-time steps. In addition, the scale compatibility was another issue, as the datasets might be not representative for an 8 km grid [53]. To overcome this, we compared our results with the results of the previous studies [1,4,5,6,7,8,9] and investigated the validity of the results by local experts.

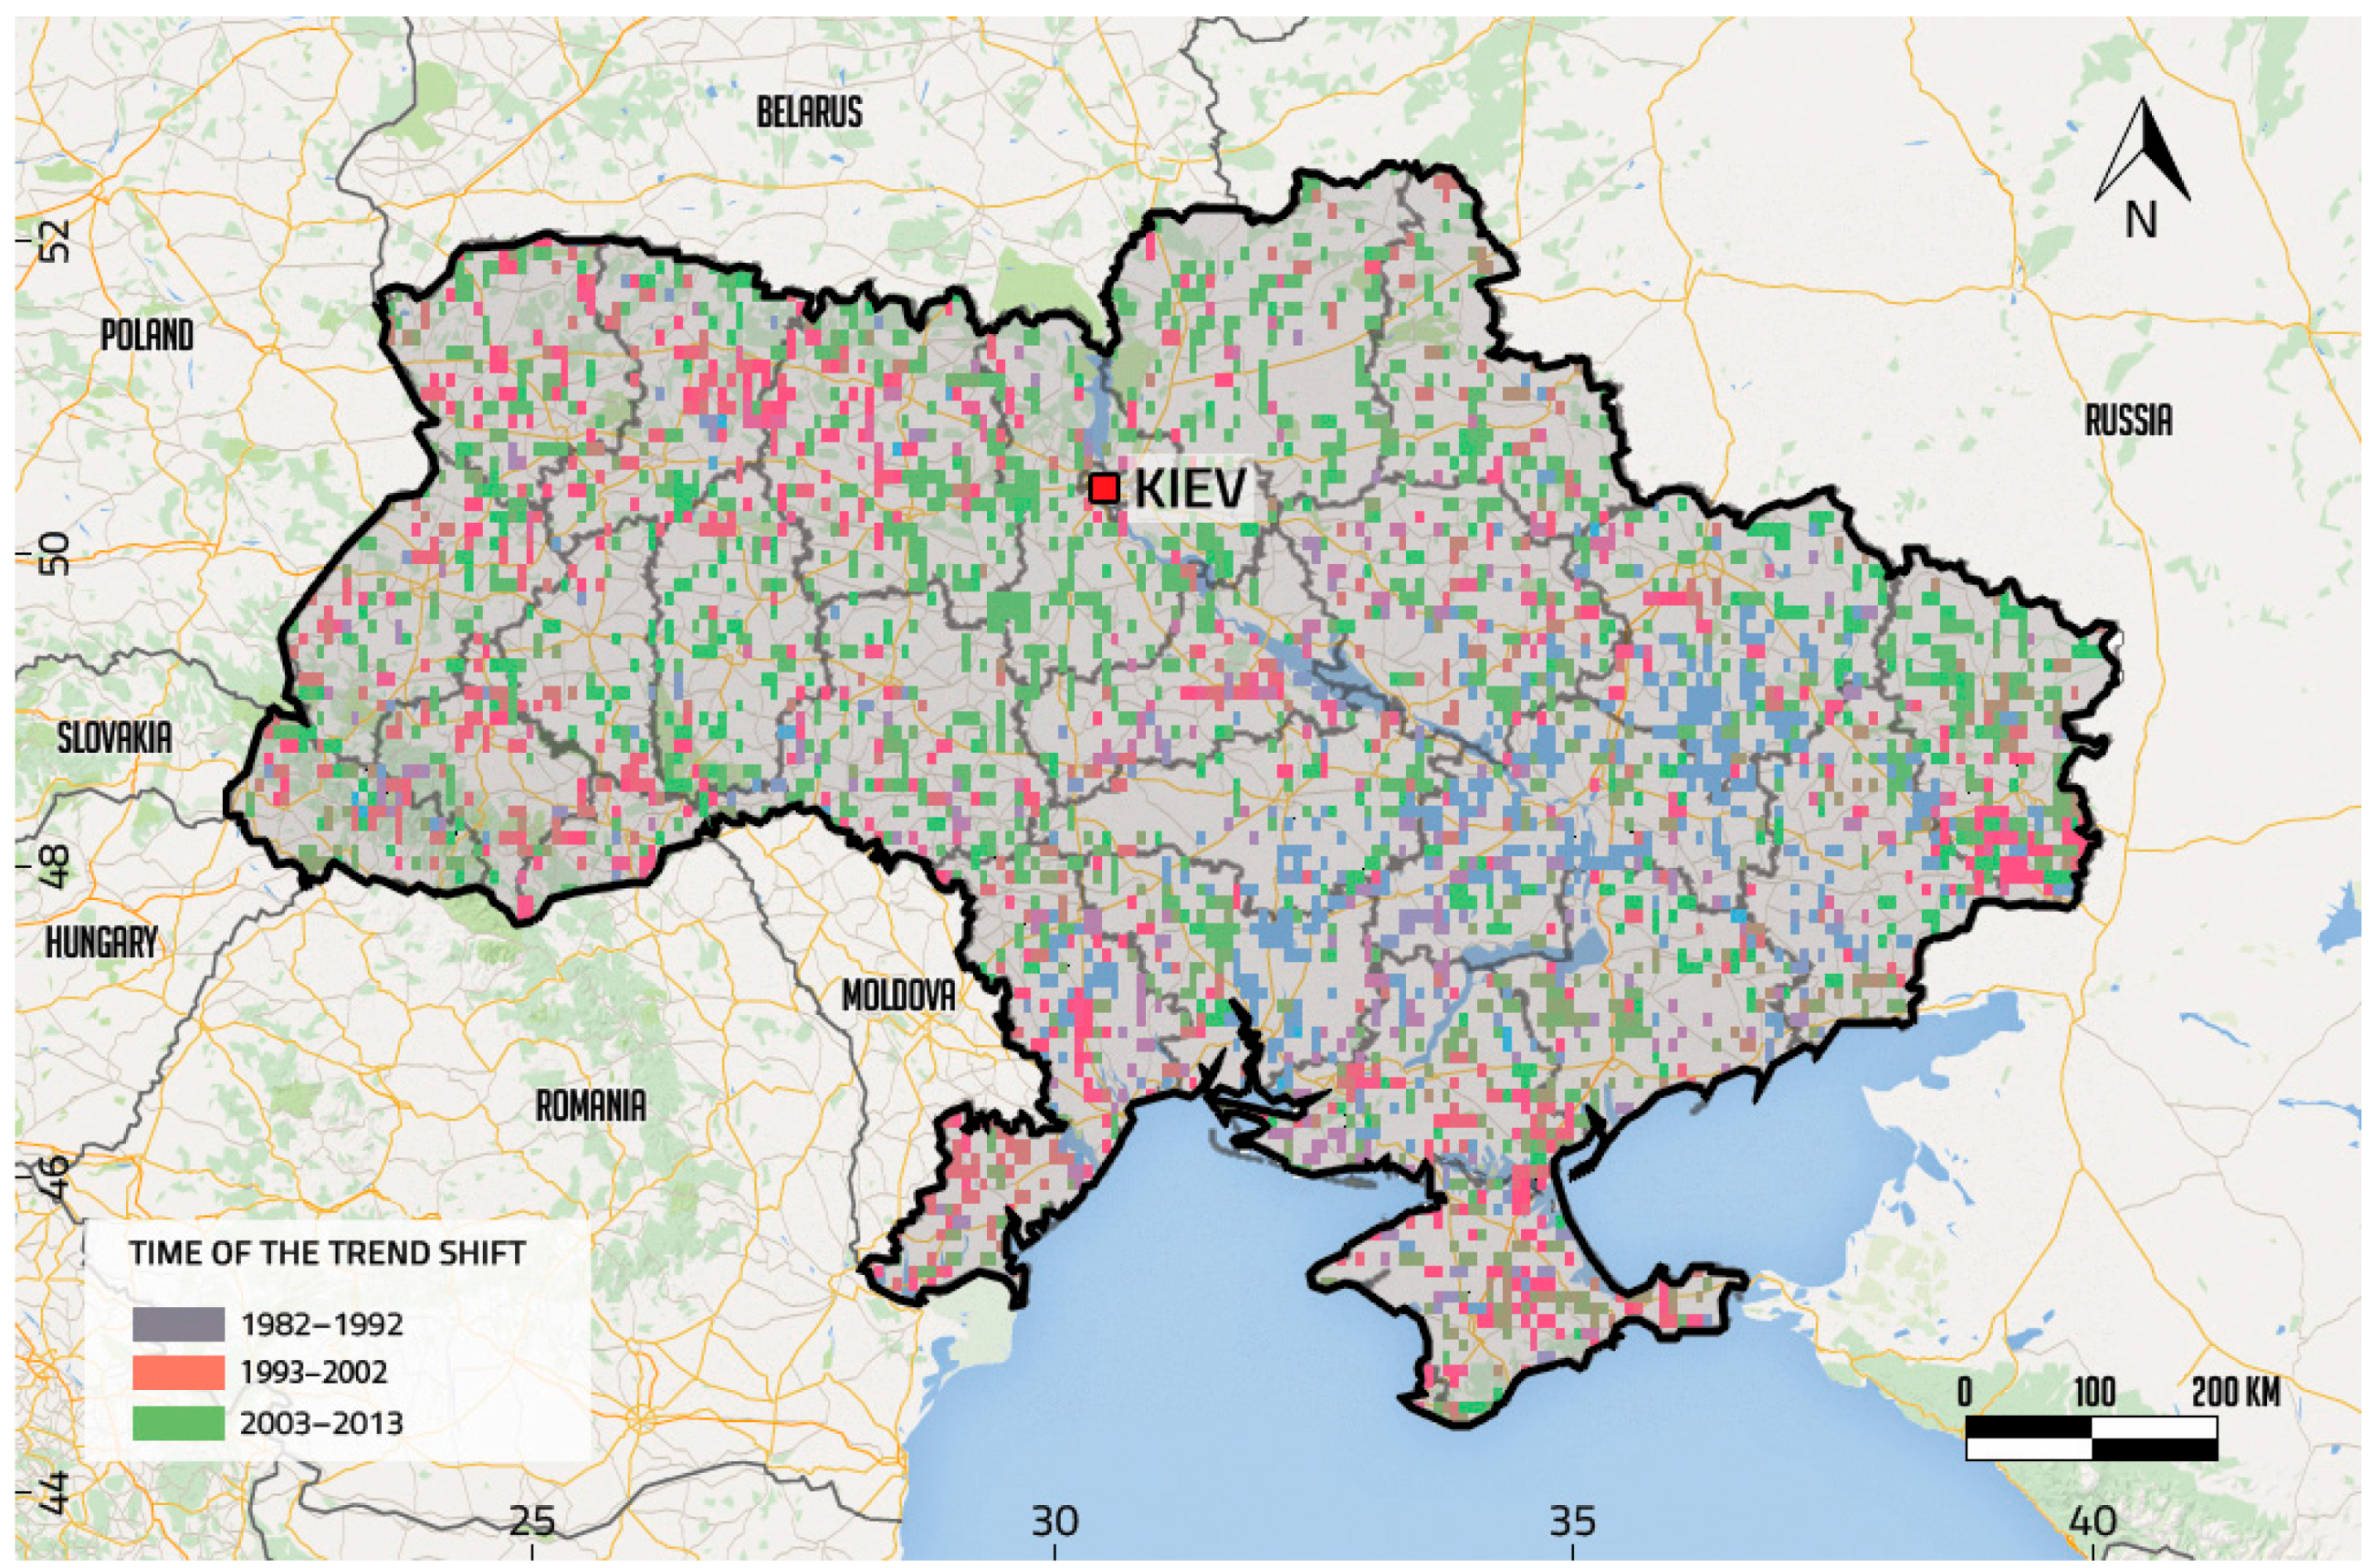
3.2. Characteristics of the Main Time Periods of the Trend Shifts in Ukraine

To understand the land surface dynamics and the main drivers of its changes, it is essential not only to look at the spatial distribution of the trend shifts but also the timing of these changes. We classified the time of the NDVI changes in three time periods of 1982–1992, 1993–2002 and 2003–2013 as the socio-economic pressures and environmental conditions were different during these periods (Figure 4). According to our results, the decrease with the abrupt positive break predominated during the first period of 1982–1992 within the steppe zone of Ukraine, which is the main agricultural zone of the country. This period was the last period before the collapse of the Soviet Union and was still characterized by extensive cultivation and agricultural land expansion in the country.
During the second period (1993–2002), most of the changes occurred in the northwest of Ukraine (Figure 4). The first post-socialistic years were described with high abandonment rates as well as with prevailing forest disturbances. The agricultural activities were mostly affected after the collapse of the Soviet Union due to the ongoing transformation processes and structural changes in the agricultural sector at that time. Almost 70% of cropland abandonment occurred within the first 10 years of the transition from a state-command to a market-driven economy [5]. Since the late 1990s and early 2000s, due to the economic recovery, the re-cultivation of formerly abandoned land emerged [5]. The last period (2003–2013) was also associated with strong environmental impacts (i.e., droughts and extreme weather conditions) [8,27].
Although the effect of sensor change that affected the quality of the AVHRR data is significantly reduced in NDVI3g [17,54], some research found that GIMMS3g NDVI data are still showing an inconsistency between sensors in humid, dry-sub humid, semi-arid and hyper-arid regions [54]. As the AVHRR platform changes (1985, 1988, 1994, 1995, 2000 and 2004) could potentially cause the breakpoints in the trends [47], we have conducted the corresponding tests. We compared these changes with the frequency of the detected changes and the detected breakpoint did not show the same result, suggesting that our results are unlikely to be affected by the platform changes.

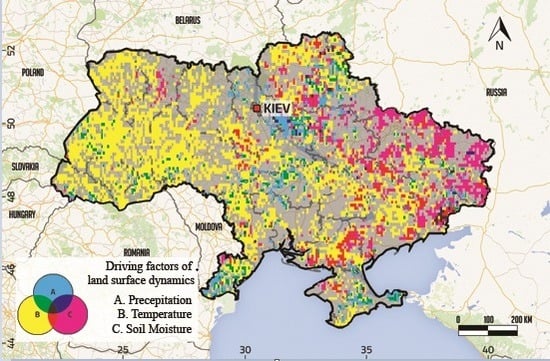
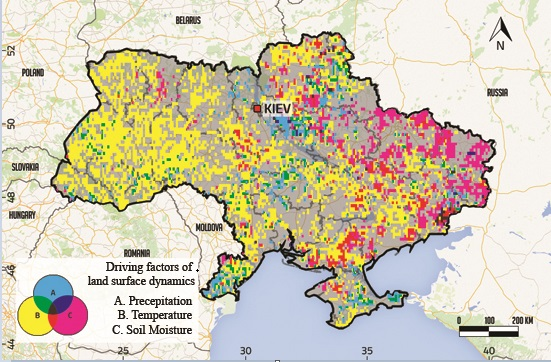
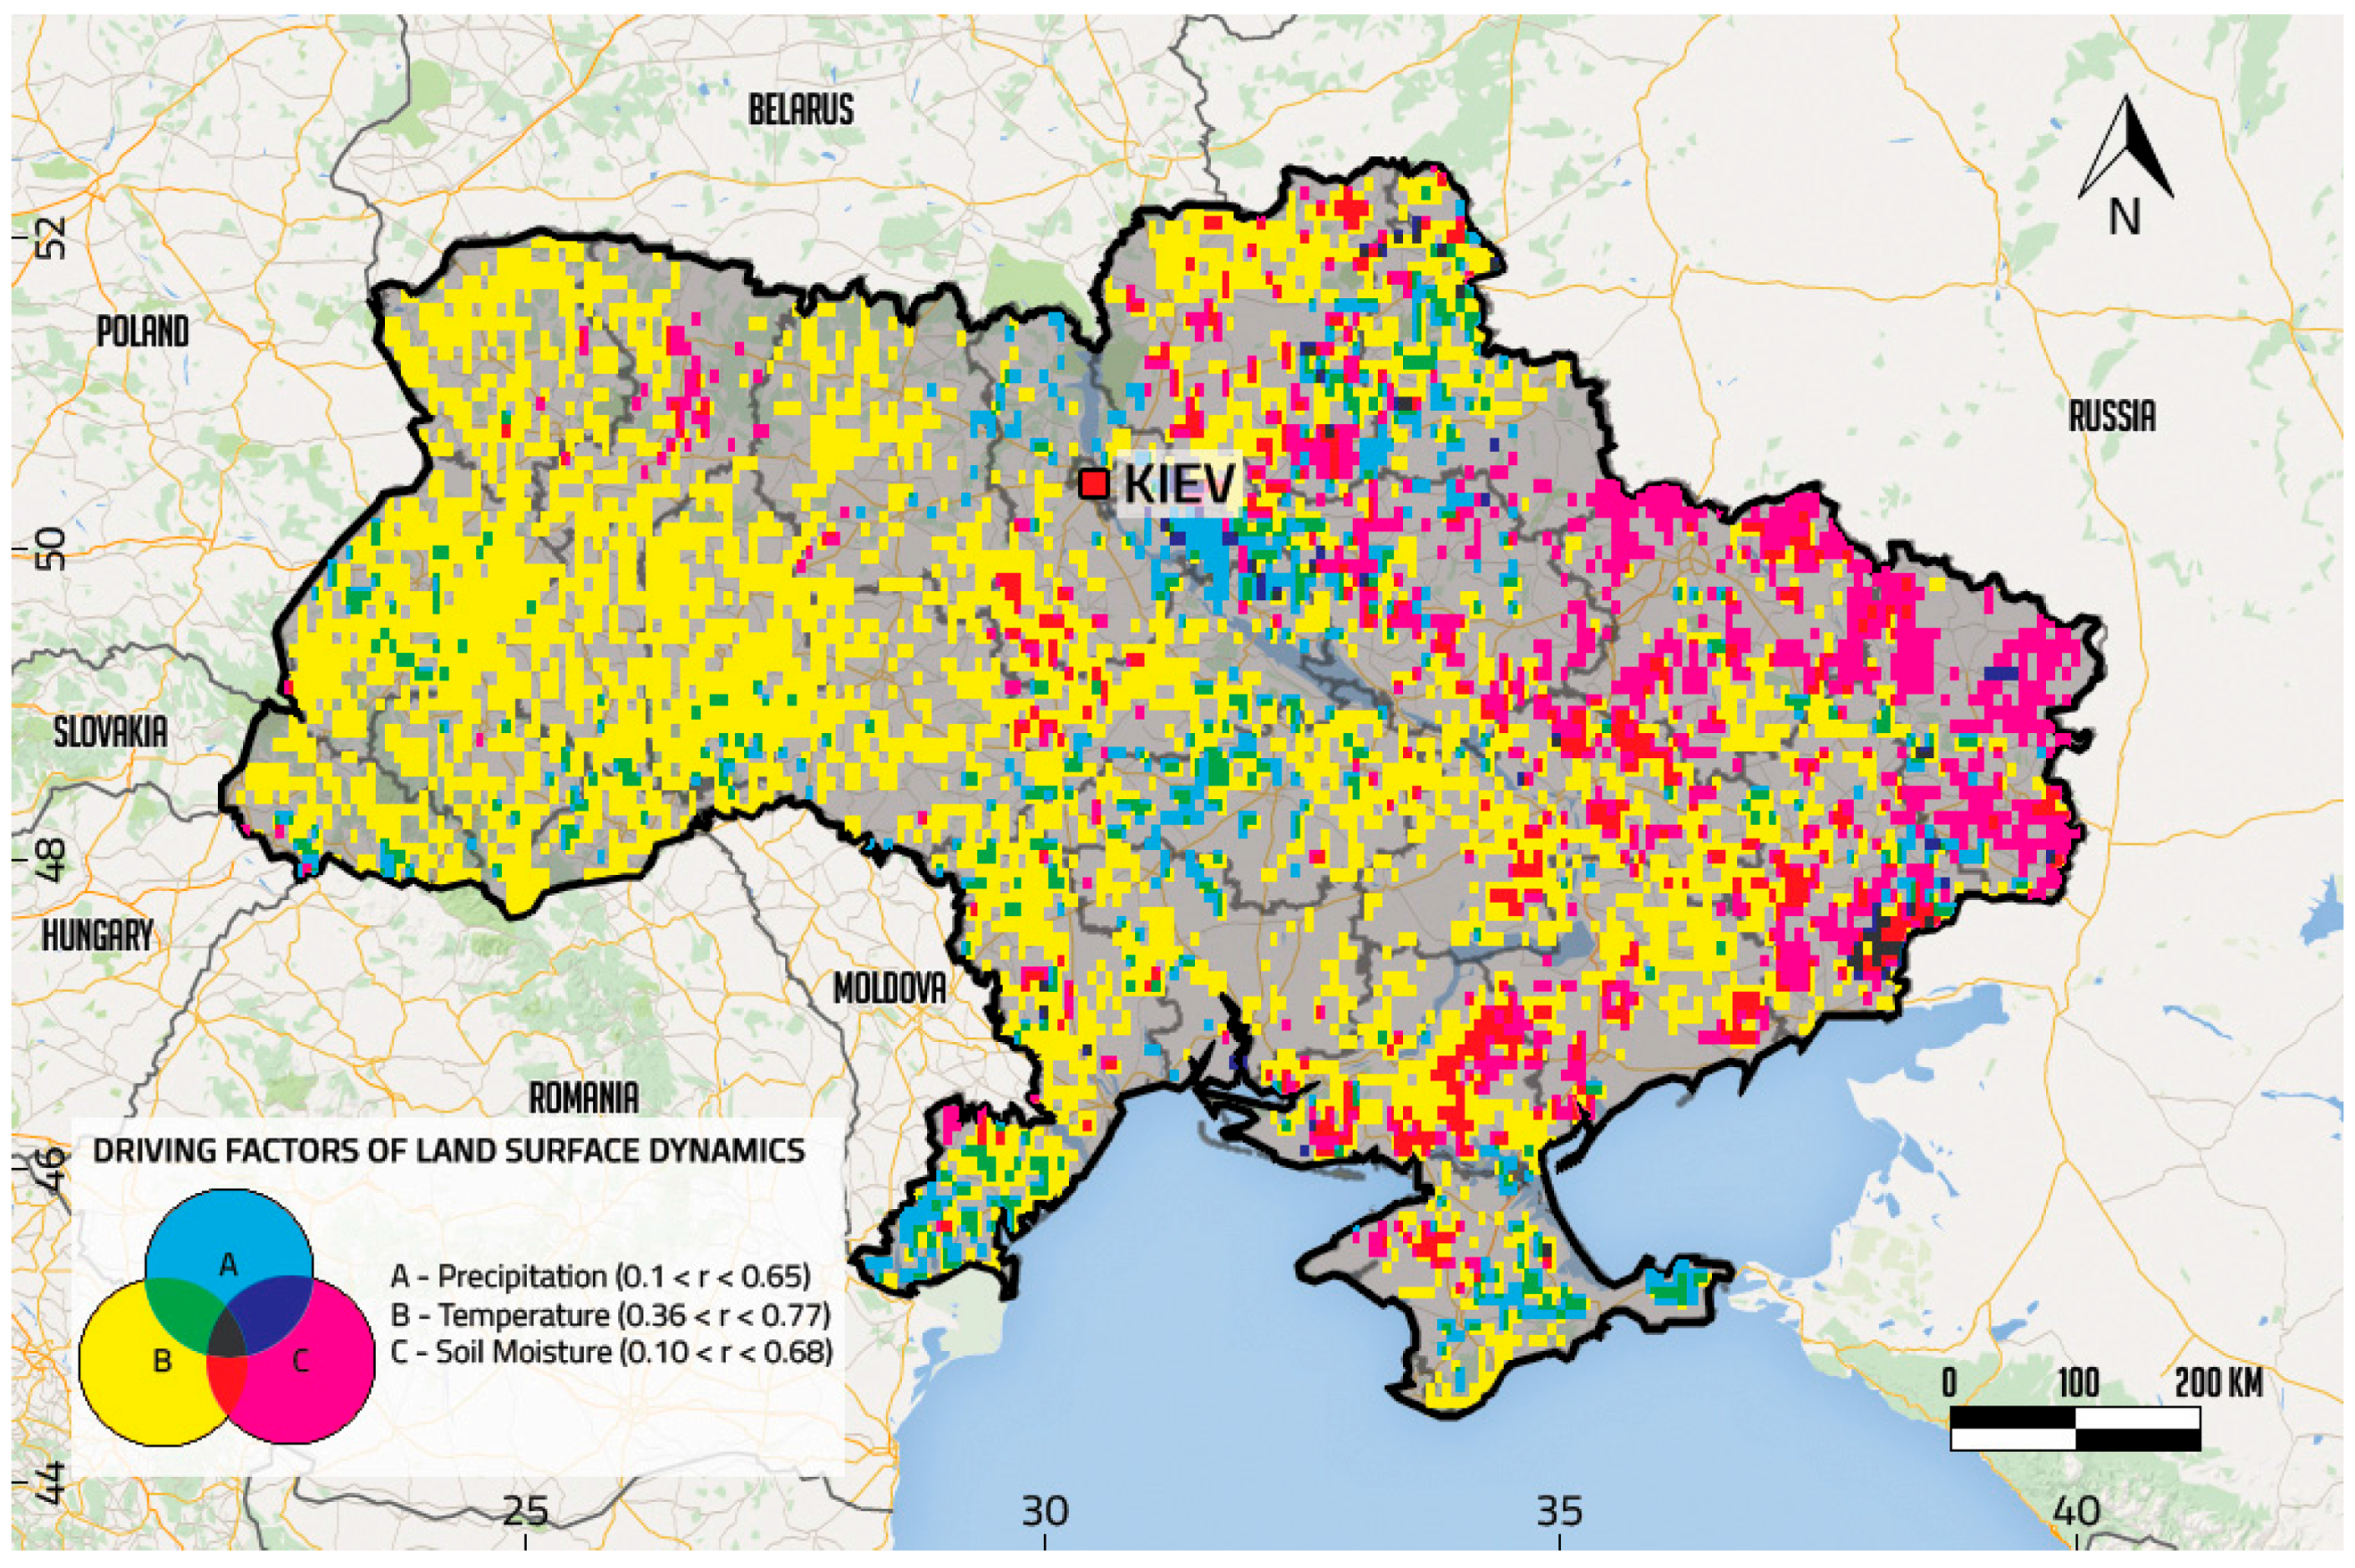
3.3. Factors of Land Surface Dynamics in Ukraine

We explored the correlations between NDVI time series and environmental variables (mean annual temperature, total precipitation and mean soil moisture) using the partial rank correlation method. Prior to correlation analysis, we evaluated multicollinearity by obtaining VIF (variance inflation factor) for each variable. Non-stationarity (time dependency) could be excluded due to a significant the Augmented Dickey–Fuller test and inspection of the autocorrelation graphs and the related tests of annually aggregated time series. As the VIF was smaller than two, we continued the partial ranked correlation analysis of the driving factors and NDVI.
Figure 5 illustrates the spatial distribution of the extent of the effect of each factor. We used a subtractive model for visualization, where the primary factors are illustrated with a pure color and the overlapping areas of influence are depicted by the intersection of colors.
Although the studies have discussed the impact of climatic variation on land surface changes [33,55,56], very few of them have focused on the impact of environmental factors on land surface trends in Ukraine as opposed to management and land tenure factors [1,2,3,4,5,6,7,8]. Our results show that the changes in land surface can be partially explained by the combination of thermal and water conditions.
It is important to mention, that we do not raise any causal argument for the statistical results of presented correlations. The only aim we had was to assess the effect of an estimator and describe possible associations between environmental variables and land surface changes.
Among all of the analyzed factors, air temperature explained most of the NDVI variability (Table 2). The impacts of air temperature were observed in 31.5% of the area, with a positive correlation coefficient (0.36–0.77). This can be explained by the fact, that in western and northern regions, the temperature is the main limiting factor for the vegetation growth, and with the increase of temperature over the study period, the correlation becomes higher. The percentage of the area in each land cover class with NDVI/Air temperature correlation depicts that grasslands were the most sensitive to temperature.
Soil moisture content is influential in eastern (r = 0.68), semi-steppe, and steppe zones, covering around 12% of the area. High correlation coefficients between NDVI and soil moisture is observed in grasslands (Table 3). Furthermore, we observed small clusters of negative correlations between NDVI and soil moisture that might be referred to anthropogenic influences in this area and unfavorable socio-economic conditions. Finally, precipitation is a dominant factor (r = 0.65) in central regions of the country (Table 4). Relatively low correlation coefficients were estimated between NDVI and precipitation in forests, which were conditioned by lower water limitation compared to other classes. Again, there is a small cluster of a negative correlation between NDVI and precipitation in the northwest of Ukraine. Since it is not driven by climate variability, this could be an indicator of human-induced changes such as land transformations [57] (not represented on a map). Moreover, the results of NDVI/soil moisture partial correlation analysis show a higher number of pixels with a significant association within the study area than NDVI/rainfall. Although theoretically the precipitation is considered as an essential forcing factor for soil moisture variability, the latter is also affected by conditions such as soil hydraulic properties, land cover, evapotranspiration, and topography. This is in line with several studies [17,58] where soil moisture had better performance for the explanation of land surface dynamics. In addition, when evaluating the partial rank correlations between variables, the effect of the other confounders is eliminated by adjusting the target correlation for any other monotonic association with the variables of this study.
Although the additional datasets give insight about the processes that can affect the land surface changes, further analysis should consider the use of complementary factors and include datasets representing anthropogenic activity. Several studies discussed the factors that affect the land abandonment in Ukraine, and they depicted that factors such as soil type, yield decrease, unfavourable socio-economic conditions and population density demonstrate a significant association with land abandonment and cultivation rate [1,10]. The observed increasing and decreasing trends and their interruptions are only partially explained by temperature, precipitation and soil moisture. Other factors—such as CO2 fertilization, agricultural management practices and the intensity of land use and fertilizer use may affect the land surface changes. To improve our analysis, this should be considered in the context of overall land surface dynamics.

4. Conclusions

The current study addressed the assessment of long-term land surface dynamics over a 32 -year period between 1982 and 2013 in Ukraine. The interpretation of the influences of environmental variables on the observed land surface dynamics were supplemented and improved by employing additional datasets. Fundamentally, we concluded that long-term increasing NDVI trends are widespread across the country. Decreasing trends with abrupt positive breaks predominated during the initial 1982–1992 study period within the steppe zone of Ukraine. This period is characterized by extensive cultivation and agricultural land expansion in the country. During 1993 and 2002, most of the changes occurred in northwest Ukraine. The first post-socialistic years in the country were characterized by high rates of land abandonment as well as widespread forest disturbances. Following the collapse of the Soviet Union, agricultural activities and practices were principally affected by transformational processes and structural changes in this sector. A general economic recovery has been occurring in Ukraine since the late 1990s and early 2000s. These conditions have stimulated re-cultivation of formerly abandoned land. This process has emerged mainly in the central portion of the country and is reflected by the monotonic increase and increase with a setback that is seen to predominate during the recent years of 2003–2013. Critical, high impact environmental events (including droughts and other extreme weather conditions) also occurred with an increased frequency during these years. Based on our results, we conclude that the combined trend and breakpoints analysis captures and reflects the spatial patterns of these trends as well as describes the timing of those changes. This capability will allow increased understanding of dynamic land surface processes over extensive areas. We found that the GIMMS NDVI3g dataset was extremely useful for regional scale trend analysis. In particular, a data record spanning more than three decades enabled a markedly improved trend characterization.
With respect to the effects of environmental factors on NDVI change, we conclude that partial correlation analysis is useful for determining the individual contribution of each specific environmental factor on NDVI dynamics. Correlation analysis shows that temperature accounts for approximately 30% of overall NDVI variance. Grassland and cropland environments show similar responses to the drivers, demonstrating high sensitivity to soil moisture and precipitation as well as temperature.
Additional analyses should include complementary causal factors along with datasets that accurately characterize anthropogenic activity. There is also a requirement for analyses at higher spatial resolutions. This will enhance interpretation of land surface trends and provide for assessments at scales complimentary to land management practices.
We are confident that this study demonstrates that the effective combination of different trend analysis techniques, integrated multiple datasets, and effective statistical modelling allows derivation of valuable, previously unavailable spatially explicit information on land surface dynamics and their causal factors. Finally, such information will enable an improved understanding of land surface processes and environmental changes ongoing over space and through time that are specific to Ukraine.

Acknowledgments

We thank the GIMMS group, ESA Climate change initiative (CCI) group, and CRU group for generating and sharing the NDVI3g, merged soil moisture and CRU gridded datasets. We would also like to thank the R community for sharing their knowledge. We are grateful to Guido Lüchters for his help with the statistical analysis. We are also thankful to Joseph Scepan of Medford, Oregon, USA, for his comments.

Author Contributions

Gohar Ghazaryan processed and analyzed the data and manuscript. Olena Dubovyk contributed to the study design and manuscript preparation. Nataliia Kussul contributed to the interpretation of the results and provided the land cover maps. Gunter Menz supervised the design of the research and interpretation of the results.

Conflicts of Interest

The authors declare no conflicts of interest.

Abbreviations

The following abbreviations are used in this manuscript:
NDVINormalized Difference Vegetation Index
AVHRRAdvanced Very High Resolution Radiometer
GIMMSGlobal Inventory Monitoring and Modelling System
ESAEuropean Space Agency
CRUClimate Research Unit
BFASTBreak For Additive Season and Trend

References

  1. Baumann, M.; Kuemmerle, T.; Elbakidze, M.; Ozdogan, M.; Radeloff, V.C.; Keuler, N.S.; Kruhlov, I.; Hostert, P. Patterns and drivers of post-socialist farmland abandonment in Western Ukraine. Land Use Policy 2011, 28, 552–562. [Google Scholar] [CrossRef]
  2. Kovalskyy, V.; Henebry, G.M. Change and persistence in land surface phenologies of the Don and Dnieper river basins. Environ. Res. Lett. 2009. [Google Scholar] [CrossRef]
  3. Kuenzer, C.; Dech, S.; Wagner, W. Remote sensing time series revealing land surface dynamics: Status quo and the pathway ahead. In Remote Sensing Time Series; Kuenzer, C., Dech, S., Wagner, W., Eds.; Springer International Publishing: Cham, Switzerland, 2015; pp. 1–24. [Google Scholar]
  4. Hostert, P.; Kuemmerle, T.; Prishchepov, A.; Sieber, A.; Lambin, E.F.; Radeloff, V.C. Rapid land use change after socio-economic disturbances: The collapse of the Soviet Union versus Chernobyl. Environ. Res. Lett. 2011. [Google Scholar] [CrossRef]
  5. Schierhorn, F.; Müller, D.; Beringer, T.; Prishchepov, A.V.; Kuemmerle, T.; Balmann, A. Post-Soviet cropland abandonment and carbon sequestration in European Russia, Ukraine, and Belarus. Glob. Biogeochem. Cycles 2013, 27, 1175–1185. [Google Scholar] [CrossRef]
  6. Alcantara, C.; Kuemmerle, T.; Baumann, M.; Bragina, E.V.; Griffiths, P.; Hostert, P.; Knorn, J.; Müller, D.; Prishchepov, A.V.; Schierhorn, F.; et al. Mapping the extent of abandoned farmland in Central and Eastern Europe using MODIS time series satellite data. Environ. Res. Lett. 2013, 8, 035035. [Google Scholar] [CrossRef]
  7. Smaliychuk, A.; Müller, D.; Prishchepov, A.V.; Levers, C.; Kruhlov, I.; Kuemmerle, T. Recultivation of abandoned agricultural lands in Ukraine: Patterns and drivers. Glob. Environ. Chang. 2016, 38, 70–81. [Google Scholar] [CrossRef]
  8. Adamenko, T.; Prokopenko, A. Monitoring droughts and impacts on crop yield in Ukraine from weather and satellite data. In Use of Satellite and in-Situ Data to Improve Sustainability; Kogan, F., Powell, A., Fedorov, O., Eds.; Springer: Dordrecht, The Netherlands, 2011; pp. 3–9. [Google Scholar]
  9. Kuemmerle, T.; Chaskovskyy, O.; Knorn, J.; Radeloff, V.C.; Kruhlov, I.; Keeton, W.S.; Hostert, P. Forest cover change and illegal logging in the Ukrainian Carpathians in the transition period from 1988 to 2007. Remote Sens. Environ. 2009, 113, 1194–1207. [Google Scholar] [CrossRef]
  10. Meyfroidt, P.; Schierhorn, F.; Prishchepov, A.V.; Müller, D.; Kuemmerle, T. Drivers, constraints and trade-offs associated with recultivating abandoned cropland in Russia, Ukraine and Kazakhstan. Glob. Environ. Chang. 2016, 3, 1–15. [Google Scholar] [CrossRef]
  11. De Beurs, K.M.; Henebry, G.M.; Owsley, B.C.; Sokolik, I. Using multiple remote sensing perspectives to identify and attribute land surface dynamics in Central Asia 2001–2013. Remote Sens. Environ. 2015, 170, 48–61. [Google Scholar] [CrossRef]
  12. Forkel, M.; Carvalhais, N.; Verbesselt, J.; Mahecha, M.D.; Neigh, C.S.R.; Reichstein, M. Trend change detection in NDVI time series: Effects of inter-annual variability and methodology. Remote Sens. 2013, 5, 2113–2144. [Google Scholar] [CrossRef]
  13. Dubovyk, O.; Menz, G.; Conrad, C.; Kan, E.; Machwitz, M.; Khamzina, A. Spatio-temporal analyses of cropland degradation in the irrigated lowlands of Uzbekistan using remote-sensing and logistic regression modeling. Environ. Monit. Assess. 2013, 185, 4775–4790. [Google Scholar] [CrossRef] [PubMed]
  14. Baldi, G.; Nosetto, M.D.; Aragón, R.; Aversa, F.; Paruelo, J.M.; Jobbágy, E.G. Long-term satellite NDVI data sets: Evaluating their ability to detect ecosystem functional changes in South America. Sensors 2008, 8, 5397–5425. [Google Scholar] [CrossRef]
  15. Waylen, P.; Southworth, J.; Gibbes, C.; Tsai, H. Time series analysis of land cover change: Developing statistical tools to determine significance of land cover changes in persistence analyses. Remote Sens. 2014, 6, 4473–4497. [Google Scholar] [CrossRef]
  16. Chen, J.; Wan, S.; Henebry, G.; Qi, J.; Gutman, G.; Sun, G.; Kappas, M. Dryland East Asia: Land Dynamics Amid Social and Climate Change; Walter de Gruyter: Berlin, Germany, 2014. [Google Scholar]
  17. Ibrahim, Y.; Balzter, H.; Kaduk, J.; Tucker, C. Land degradation assessment using residual trend analysis of GIMMS NDVI3g, soil moisture and rainfall in sub-Saharan West Africa from 1982 to 2012. Remote Sens. 2015, 7, 5471–5494. [Google Scholar] [CrossRef]
  18. Estel, S.; Kuemmerle, T.; Alcántara, C.; Levers, C.; Prishchepov, A.; Hostert, P. Mapping farmland abandonment and recultivation across Europe using MODIS NDVI time series. Remote Sens. Environ. 2015, 163, 312–325. [Google Scholar] [CrossRef]
  19. De Beurs, K.M.; Henebry, G.M. Spatio-temporal statistical methods for modelling land surface phenology. In Phenological Research; Hudson, I.L., Keatley, M.R., Eds.; Springer: Dordrecht, The Netherlands, 2010; pp. 177–208. [Google Scholar]
  20. Verbesselt, J.; Zeileis, A.; Herold, M. Near real-time disturbance detection using satellite image time series. Remote Sens. Environ. 2012, 123, 98–108. [Google Scholar] [CrossRef]
  21. Teferi, E.; Uhlenbrook, S.; Bewket, W. Inter-annual and seasonal trends of vegetation condition in the Upper Blue Nile (Abay) Basin: Dual-scale time series analysis. Earth Syst. Dyn. 2015, 6, 617–636. [Google Scholar] [CrossRef]
  22. De Jong, R.; Verbesselt, J.; Schaepman, M.E.; de Bruin, S. Trend changes in global greening and browning: Contribution of short-term trends to longer-term change. Glob. Chang. Biol. 2012, 18, 642–655. [Google Scholar] [CrossRef]
  23. Jamali, S.; Jönsson, P.; Eklundh, L.; Ardö, J.; Seaquist, J. Detecting changes in vegetation trends using time series segmentation. Remote Sens. Environ. 2015, 156, 182–195. [Google Scholar] [CrossRef]
  24. State Statistics Service of Ukraine. Available online: http://www.ukrstat.gov.ua/ (accessed on 1 November 2015).
  25. Food and Agriculture Organization. Country Report on the State of Plant Genetic Resources for Food and Agriculture, 2008. Available online: http://www.fao.org/docrep/013/i1500e/Ukraine.pdf (accessed on 15 November 2015).
  26. Zastavnyi, F. Geography of Ukraine; Svit: Lviv, Ukraine, 1994. [Google Scholar]
  27. Shishenko, P.G.; Munich, N.V. Physical Geography of Ukraine; Zodiak-EKO: Kiev, Ukraine, 2008. [Google Scholar]
  28. Nazarov, N.; Cook, H.F.; Woodgate, G. Environmental issues in the post-communist Ukraine. J. Environ. Manag. 2001, 63, 71–86. [Google Scholar] [CrossRef] [PubMed]
  29. Skakun, S.; Kussul, N.; Shelestov, A.; Kussul, O. The use of satellite data for agriculture drought risk quantification in Ukraine. Geomat. Nat. Hazards Risk 2016, 7, 901–917. [Google Scholar] [CrossRef]
  30. Pinzon, J.E.; Tucker, C.J. A non-stationary 1981–2012 AVHRR NDVI3g time series. Remote Sens. 2014, 6, 6929–6960. [Google Scholar] [CrossRef]
  31. Atzberger, C.; Klisch, A.; Mattiuzzi, M.; Vuolo, F. Phenological metrics derived over the European continent from NDVI3g data and MODIS time series. Remote Sens. 2013, 6, 257–284. [Google Scholar] [CrossRef]
  32. Eastman, J.R.; Sangermano, F.; Machado, E.A.; Rogan, J.; Anyamba, A. Global trends in seasonality of Normalized Difference Vegetation Index (NDVI), 1982–2011. Remote Sens. 2013, 5, 4799–4818. [Google Scholar] [CrossRef]
  33. De Jong, R.; Schaepman, M.E.; Furrer, R.; de Bruin, S.; Verburg, P.H. Spatial relationship between climatologies and changes in global vegetation activity. Glob. Chang. Biol. 2013, 19, 1953–1964. [Google Scholar] [CrossRef] [PubMed]
  34. Evans, J.P.; Pitman, A.J.; Cruz, F.T. Coupled atmospheric and land surface dynamics over southeast Australia: A review, analysis and identification of future research priorities. Int. J. Climatol. 2011, 31, 1758–1772. [Google Scholar] [CrossRef]
  35. De Beurs, K.M.; Henebry, G.M. Land surface phenology, climatic variation, and institutional change: Analyzing agricultural land cover change in Kazakhstan. Remote Sens. Environ. 2004, 89, 497–509. [Google Scholar] [CrossRef]
  36. Harris, I.; Jones, P.D.; Osborn, T.J.; Lister, D.H. Updated high-resolution grids of monthly climatic observations—The CRU TS3.10 Dataset: Updated high-resolution grids of monthly climatic observations. Int. J. Climatol. 2014, 34, 623–642. [Google Scholar] [CrossRef] [Green Version]
  37. Dorigo, W.; de Jeu, R.; Chung, D.; Parinussa, R.; Liu, Y.; Wagner, W.; Fernández-Prieto, D. Evaluating global trends (1988–2010) in harmonized multi-satellite surface soil moisture. Geophys. Res. Lett. 2012, 39, L18405. [Google Scholar] [CrossRef]
  38. Liu, Y.Y.; Parinussa, R.M.; Dorigo, W.A.; de Jeu, R.A.M.; Wagner, W.; van Dijk, A.I.J.M.; McCabe, M.F.; Evans, J.P. Developing an improved soil moisture dataset by blending passive and active microwave satellite-based retrievals. Hydrol. Earth Syst. Sci. 2011, 15, 425–436. [Google Scholar] [CrossRef] [Green Version]
  39. Chen, T.; de Jeu, R.A.M.; Liu, Y.Y.; van der Werf, G.R.; Dolman, A.J. Using satellite based soil moisture to quantify the water driven variability in NDVI: A case study over mainland Australia. Remote Sens. Environ. 2014, 140, 330–338. [Google Scholar] [CrossRef]
  40. ESA CCI Soil Moisture. Available online: http://www.esa-soilmoisture-cci.org/ (accessed on 1 November 2015).
  41. Lavreniuk, M.; Kussul, N.; Skakun, S.; Shelestov, A.; Yailymov, B. Regional retrospective high resolution land cover for Ukraine: Methodology and results. In Proceedings of the IEEE International Geoscience and Remote Sensing Symposium (IGARSS), Milan, Italy, 26–31 July 2015.
  42. Eklundh, L.; Jönsson, P. TIMESAT: A software package for time-series processing and assessment of vegetation dynamics. In Remote Sensing Time Series; Kuenzer, C., Dech, S., Wagner, W., Eds.; Springer International Publishing: Cham, Switzerland, 2015; pp. 141–158. [Google Scholar]
  43. R Core Team. R: A Language and Environment for Statistical Computing; R Foundation for Statistical Computing: Vienna, Austria, 2016. [Google Scholar]
  44. De Jong, R.; de Bruin, S. Linear trends in seasonal vegetation time series and the modifiable temporal unit problem. Biogeosciences 2012, 9, 71–77. [Google Scholar] [CrossRef] [Green Version]
  45. Tüshaus, J.; Dubovyk, O.; Khamzina, A.; Menz, G. Comparison of medium spatial resolution ENVISAT-MERIS and terra-MODIS time series for vegetation decline analysis: A case study in central Asia. Remote Sens. 2015, 6, 5238–5256. [Google Scholar] [CrossRef]
  46. Verbesselt, J.; Hyndman, R.; Newnham, G.; Culvenor, D. Detecting trend and seasonal changes in satellite image time series. Remote Sens. Environ. 2010, 114, 106–115. [Google Scholar] [CrossRef]
  47. De Jong, R.; Verbesselt, J.; Zeileis, A.; Schaepman, M.E. Shifts in global vegetation activity trends. Remote Sens. 2013, 5, 1117–1133. [Google Scholar] [CrossRef] [Green Version]
  48. Horion, S.; Prishchepov, A.V.; Verbesselt, J.; de Beurs, K.; Tagesson, T.; Fensholt, R. Revealing turning points in ecosystem functioning over the Northern Eurasian agricultural frontier. Glob. Chang. Biol. 2016. [Google Scholar] [CrossRef] [PubMed]
  49. Peng, J.; Li, Y.; Tian, L.; Liu, Y.; Wang, Y. Vegetation dynamics and associated driving forces in Eastern China during 1999–2008. Remote Sens. 2015, 7, 13641–13663. [Google Scholar] [CrossRef]
  50. Zhou, Y.; Zhang, L.; Fensholt, R.; Wang, K.; Vitkovskaya, I.; Tian, F. Climate contributions to vegetation variations in central Asian drylands: Pre- and post-USSR collapse. Remote Sens. 2015, 7, 2449–2470. [Google Scholar]
  51. Chandler, R.; Scott, M. Statistical Methods for Trend Detection and Analysis in the Environmental Sciences; John Wiley & Sons: Hoboken, NJ, USA, 2011. [Google Scholar]
  52. Sutton, W.R. Integrating Environment into Agriculture and Forestry: Progress and Prospects in Eastern Europe and Central Asia; World Bank Publications: Washington, DC, USA, 2008. [Google Scholar]
  53. De Jong, R.; de Bruin, S.; de Wit, A.; Schaepman, M.E.; Dent, D.L. Analysis of monotonic greening and browning trends from global NDVI time-series. Remote Sens. Environ. 2011, 115, 692–702. [Google Scholar] [CrossRef] [Green Version]
  54. Tian, F.; Fensholt, R.; Verbesselt, J.; Grogan, K.; Horion, S.; Wang, Y. Evaluating temporal consistency of long-term global NDVI datasets for trend analysis. Remote Sens. Environ. 2015, 163, 326–340. [Google Scholar] [CrossRef]
  55. Liu, Y.; Li, Y.; Li, S.; Motesharrei, S. Spatial and temporal patterns of global NDVI trends: Correlations with climate and human factors. Remote Sens. 2015, 7, 13233–13250. [Google Scholar] [CrossRef]
  56. Nemani, R.R.; Keeling, C.D.; Hashimoto, H.; Jolly, W.M.; Piper, S.C.; Tucker, C.J.; Myneni, R.B.; Running, S.W. Climate-driven increases in global terrestrial net primary production from 1982 to 1999. Science 2003, 300, 1560–1563. [Google Scholar] [CrossRef] [PubMed]
  57. Dubovyk, O.; Landmann, T.; Erasmus, B.F.N.; Tewes, A.; Schellberg, J. Monitoring vegetation dynamics with medium resolution MODIS-EVI time series at sub-regional scale in southern Africa. Int. J. Appl. Earth Obs. Geoinf. 2015, 38, 175–183. [Google Scholar] [CrossRef]
  58. Sohoulande Djebou, D.C.; Singh, V.P. Retrieving vegetation growth patterns from soil moisture, precipitation and temperature using maximum entropy. Ecol. Model. 2015, 309–310, 10–21. [Google Scholar] [CrossRef]
Figure 1. Study area, the Walter-Lieth climate graphs for different locations in the country (ac) and the agro-ecological zones (d) [26].
Remotesensing 08 00617 g001
Figure 2. Spatial distribution of annually aggregated Normalized Difference Vegetation Index (NDVI) trends for the period 1982 to 2013 (a); and the areal statistics for each region (oblast) (b).
Remotesensing 08 00617 g002
Figure 3. Spatial distribution of the change categories. The pixels with significant trends in both segments and significant monotonic trends are represented (p < 0.05). Temporal profiles show the most frequent change types. (a) Increase to decrease (b) Decrease with burst (c) Increase with setback (d) Increase to decrease.
Remotesensing 08 00617 g003
Figure 4. Spatial distribution of the time of the shift classified in three major time intervals.
Remotesensing 08 00617 g004
Figure 5. Dominant factors of Normalized Difference Vegetation Index (NDVI) change: pixel-wise correlation coefficients between NDVI and environmental variables. The graycolor denotes pixels without statistically significant correlations (p < 0.05).
Remotesensing 08 00617 g005
Table 1. Percentage of change types in each land cover class.
Trend TypeCroplandGrasslandForest
Monotonic increase4.667.342.53
Decrease with burst6.9613.270.73
Increase with setback11.2124.417.43
Increase to decrease18.9744.4910.31
Table 2. Percentage of the area in each land cover class with Normalized Difference Vegetation Index (NDVI)/Air temperature correlation.
Correlation Coefficient RangeCroplandForestGrassland
0.36–0.4420.3410.4541.04
0.45–0.5316.949.8634.67
0.54–0.778.704.4715.10
Table 3. Percentage of the area in each land cover class with Normalized Difference Vegetation Index (NDVI)/Soil Moisture correlation.
Correlation Coefficient RangeCroplandForestGrassland
−0.55–(−0.21)0.530.312.27
0.1–0.448.911.8419.72
0.45–0.687.791.2514.80
Table 4. Percentage of land cover class with significant correlation coefficients Normalized Difference Vegetation Index (NDVI)/ precipitation.
Correlation Coefficient RangeCroplandForestGrassland
−0.47–(−0.18)0.320.591.02
0.1–0.446.242.019.53
0.45–0.653.640.596.01

