Article

High-Resolution NDVI from Planet’s Constellation of Earth Observing Nano-Satellites: A New Data Source for Precision Agriculture

King Abdullah University of Science and Technology (KAUST), Water Desalination and Reuse Center (WDRC), Biological and Environmental Science & Engineering (BESE), Thuwal 23955, Saudi Arabia
*
Author to whom correspondence should be addressed.
Submission received: 5 July 2016 / Revised: 11 September 2016 / Accepted: 12 September 2016 / Published: 19 September 2016

Abstract

:
Planet Labs (“Planet”) operate the largest fleet of active nano-satellites in orbit, offering an unprecedented monitoring capacity of daily and global RGB image capture at 3–5 m resolution. However, limitations in spectral resolution and lack of accurate radiometric sensor calibration impact the utility of this rich information source. In this study, Planet’s RGB imagery was translated into a Normalized Difference Vegetation Index (NDVI): a common metric for vegetation growth and condition. Our framework employs a data mining approach to build a set of rule-based regression models that relate RGB data to atmospherically corrected Landsat-8 NDVI. The approach was evaluated over a desert agricultural landscape in Saudi Arabia where the use of near-coincident (within five days) Planet and Landsat-8 acquisitions in the training of the regression models resulted in NDVI predictabilities with an r2 of approximately 0.97 and a Mean Absolute Deviation (MAD) on the order of 0.014 (~9%). The MAD increased to 0.021 (~14%) when the Landsat NDVI training image was further away (i.e., 11–16 days) from the corrected Planet image. In these cases, the use of MODIS observations to inform on the change in NDVI occurring between overpasses was shown to significantly improve prediction accuracies. MAD levels ranged from 0.002 to 0.011 (3.9% to 9.1%) for the best performing 80% of the data. The technique is generic and extendable to any region of interest, increasing the utility of Planet’s dense time-series of RGB imagery.

Graphical Abstract

1. Introduction

One of the constraints on the effective management and assessment of the terrestrial system at sub-field scales (e.g., 1–10’s of meters) lies in the challenge of achieving both high spatial and high temporal retrievals [1]. Satellite observations have made considerable progress in advancing such a capacity, but are inevitably constrained by optics, bandwidth, or orbital configurations that limit optimal spatio-temporal characteristics. One approach that has recently been proposed to overcome such limitations is the use of so-called constellations of nano-satellites i.e., a large number of small, compact sensor units (~10 kg) that are typically cheap, replaceable, and take advantage of economies of scale [2]. In recent years, the capacity to survey the entire Earth at very high spatial resolution and high frequency (daily) has approached operational reality, with a number of commercial efforts exploring such an observation strategy.
One such company, Planet Labs (www.planet.com), operates the largest constellation of satellite systems in orbit, with nano-satellite “Doves” collecting RGB (i.e., red, green, blue) imagery at 3–5 m resolution on a daily scale, based on a full constellation of 150–200 satellites. Through such imagery, the opportunities for change detection and surface characterization are enormous. From an agricultural monitoring perspective for instance, timely and repeatable information on within-field variability in growing conditions has specific utility in precision agriculture [3,4] as a means to optimize production efficiencies via more sustainable and spatially explicit management practices [5,6]. Potential application of such data span diverse aspects of earth observation and provide numerous opportunities for advancing science and operational outcomes. Such an observational strategy represents a revolution in earth observation.
Traditional single-source satellite missions are costly and physically constrained in terms of spatial resolution and frequency of image capture. For instance, Landsat-8 is the continuation of an impressive 40-year mission heritage that has demonstrated great capacity for land surface characterization and monitoring at high spatial resolution [7]. The advances that have been made with Landsat observations result partly from the high quality sensor designs, high signal to noise ratios, and impressive absolute radiometric accuracies and reflectance error specifications [8,9]. However, the 16-day revisit cycle constitutes a major limitation for applications requiring time-critical information on surface conditions. Improvements in spatio-temporal frequency will be realized by the pair of Sentinel-2 satellites, which will deliver 10–60 m resolution multi-spectral data with a five-day revisit capability [10]. In addition, Landsat-8 and Sentinel-2 synergies offer opportunities to further enhance the temporal resolution [11]. Nevertheless, the simultaneous requirements of very high spatial resolution (<10 m) and near-daily frequency are currently only met through targeted acquisition via programmable commercial multi-sensor systems such as WorldView and RapidEye [12]: and even then on a spatially limited basis.
While Planet’s Doves will provide very high spatial resolution imagery at an unprecedented frequency over the terrestrial surfaces of the Earth, the deliberately inexpensive sensor designs and commercial off the shelf components do not match the signal-to-noise characteristics, radiometric performance, cross-sensor consistency, and spectral enhancements of satellite imagers that comprise more traditional space agency based operational missions. In addition, the lack of at-sensor radiance conversions and atmospheric correction of the RGB imagery will affect the interpretation and time and space consistency of any time-series data. Bands in the visible domain are particularly sensitive to the atmospheric correction process [13,14] and failure to account for contaminations from time-varying atmospheric influences may significantly impair the utility of the RGB imagery for reliably inferring actual changes in surface cover conditions.
Broadband imaging in just the RGB domain presents a potential limitation for vegetation monitoring and categorization. Such applications typically require information in the near-infrared (NIR) to represent the reflectance plateau of green vegetation and is the spectral region most responsive to changes in vegetation density [15]. The Normalized Difference Vegetation Index (NDVI), developed based on pioneering work by Rouse et al. [16] and Tucker [17] using bands in the NIR and red domain, i.e., NDVI = (NIR − red)/(NIR + red), has shown to be an effective and widely used indicator of spatio-temporal changes in vegetation growth and distribution [18,19,20], vegetation stress [21,22,23], and vegetation productivity [24,25,26]. However, indices based entirely on the visible range of the spectrum have also demonstrated utility for assessing vegetation growth and development [27]. The Green-Red Vegetation Index serves as a visible analog to NDVI and has been shown to correlate strongly with that index [17,28], while the Visible Atmospherically Resistant Index (VARI) has demonstrated utility for estimating green vegetation fractions [27,29]. However, the robustness of these indices for assessing vegetation density remains particularly challenged by confounding factors introduced by the atmospheric medium [30] and pigment absorption [31], and significantly reduced sensitivity to changes in vegetation density with increasing leaf area [32]. Important advances in monitoring of vegetation status and retrieval of plant biochemical, structural, and physiological quantities have been realized with the development of a variety of broadband and narrowband vegetation indices that exploit specific regions and features of the electromagnetic spectrum [33,34,35]. However, a standard index such as the NDVI continues to serve as a very simple and useful satellite observable metric in the remote sensing of vegetation response [36].
A key objective of the current study is to exploit the high radiometric quality and near-infrared imaging capability of Landsat-8 to maximize the utility of Planet’s RGB time series imagery for agricultural applications. The capacity of the RGB to reproduce insights provided by traditional Landsat NDVI dynamics was investigated using a data mining approach. An accurate translation of the RGB imagery into maps of Landsat consistent NDVI is seen as a particularly useful step given the recognition of NDVI as a key metric for the state and functioning of vegetation. To do this, associations between the NDVI and RGB data were established on a scene-specific basis using atmospherically corrected Landsat NDVI, in an attempt to minimize cross-sensor inconsistencies (i.e., resulting from many individual Dove cameras) and time and space varying contaminations from atmospheric influences. Coarser resolution (i.e., 250 m) NDVI from the Moderate Resolution Imaging Spectroradiometer (MODIS) were also integrated into the downscaling framework to account for surface variations in NDVI occurring between the Planet and Landsat scene acquisitions. An important objective was to develop an operational framework, building upon an automated processing stream and generic techniques that are capable of translating dense time-series of raw RGB imagery into Landsat consistent and atmospherically corrected estimates of NDVI at 3–5 m resolution.

2. Data and Methodology

2.1. Study Region

The Tawdeehiya agricultural facility (24.174°N, 48.015°E) located southeast of Riyadh in Saudi Arabia, was used as a test site for the analysis undertaken herein. Tawdeehiya is a commercial farm occupying an area of approximately 120 km2 (12,000 ha) comprised of 47 fields employing center pivot irrigation systems and planted with a rotation of alfalfa, corn, Rhodes grass, carrots, and other vegetables and forage crops. The irrigated pivots (~800 m diameter) are situated within desert terrain approximately 380 m a.s.l. and are exposed to harsh environmental conditions that include very limited rainfall (~100 mm·year−1), extreme temperatures, and dust events [37]. The data used for this study was collected across the period from 8 October 2015 to 1 January 2016 (day of year, DOY, 281 and 1, respectively). The pivots were primarily planted with Alfalfa, corn, and Rhodes grass during the study period. Cumulative rainfall was 27 mm and the average daytime high varied from ~35 °C in October to ~20 °C in December.

2.2. Satellite Data

Clear-sky imagery from Planet’s Doves (Section 2.2.1), Landsat-8 (Section 2.2.2), and MODIS (Section 2.2.3) were acquired within a 90-day window over the Tawdeehiya farm as detailed below.

2.2.1. Planet

A total of four scenes were acquired from Planet’s Dove satellites deployed into the International Space Station Orbit (i.e., a low Earth orbit with an altitude of ~420 km). The Doves are characterized as 3U CubeSats (i.e., 10 × 10 × 30 cm) and weigh around 4 kg. The scenes are captured in broad red (610–700 nm), green (500–590 nm), and blue (420–530 nm) (RGB) wavelength bands with variable view and sun illumination geometries and a ground sampling distance of approximately 3 m (Table 1). The scenes are provided orthorectified in the Univeral Transverse Mercator (UTM) projection with a geo-location accuracy approximated as 20 m relative to Landsat-8. While Planet’s images have undergone a series of sensor and basic radiometric calibrations involving corrections for sensor distortions and adjustments for sun angle variations, corrections for atmospheric effects or conversions into top of atmosphere radiances have not been implemented. The analytic datasets are distributed as digital counts in a 16-bit GeoTiff file format.

2.2.2. Landsat-8

Multi-spectral data at 30 m resolution were acquired from the Ocean Land Imager (OLI) onboard Landsat-8 for eight dates in 2015 (Table 1) via the Landsat archive on the Google cloud storage. While the repeat cycle of Landsat-8 is 16 days, the location of the farm near the swath edges facilitates acquisitions from two different swaths, with an optimal repeat cycle of eight days. The collected scenes have been resampled using cubic convolution and processed to Level 1T by the United States Geological Survey (USGS) to ensure systematic radiometric and geometric accuracy.
The positional accuracy has been reported as approximately 12 m [38]. Landsat red (640–670 nm), green (530–590 nm), and blue (450–510 nm) bands are considerably narrower than the Planet counterparts and have acquisition times that are fixed at approximately 10:15 am (local time). As the farm is located in proximity to the swath edge, the exact view angle was calculated as a function of satellite altitude, scene orientation, and distance to the center meridian [39] (Table 1).
The automated framework adopted for translating the at-sensor radiances into bidirectional surface reflectances is detailed in Houborg et al. [39] and Houborg and McCabe [37]. In brief, the 6SV atmospheric correction code [40,41] was used with inputs of acquisition specific view and sun illumination angles, surface elevation from the GTOPO30 digital elevation model, total columnar ozone from the Ozone Monitoring Instrument (OMI), total precipitable water and atmospheric profiles from the Atmospheric Infrared Sounder (AIRS), and aerosol optical thickness at 550 nm (AOT550) from Terra MODIS deep blue algorithm retrievals [42]. The aerosol model was parameterized using AOT550-dependent aerosol radiative characteristics based on observations at the nearby Solar Village AERONET site.
Adjacency effects can be substantial over the farm due to large reflectance contrasts between dark vegetated pivots and surrounding bright desert surfaces. In fact, correction for adjacency effects was shown to increase the NDVI by up to 50% over vegetated fields in a recent investigation [39]. This phenomenon was considered in accordance with Houborg and McCabe [37] using a scene and AOT550-specific optimization of the horizontal range of the adjacency effect.

2.2.3. MODIS

The 250 m resolution Terra MODIS surface reflectance product (MOD09Q1, collection 6) was acquired for the corresponding Landsat eight-day collections over the duration of the study period (i.e., total of 11 images). The MOD09Q1 product composites the best (i.e., low view angle, absence of clouds, lowest aerosol loading) near-infrared (NIR) and red spectral observations collected during an eight-day period, with corrections for atmospheric influences applied. Specific DOY records for individual pixel observations collected during the eight-day retrieval period are not included in the MOD09Q1. Instead, these were extracted from the 500 m surface reflectance product (MOD09A1) and resampled to match the resolution of the MOD09Q1. While daily NDVI could be calculated directly from the MODIS daily surface reflectance product (MOD09GQ), existence of clouds and cloud shadows, high view angles, and high aerosol loadings all affect the utility of the daily products for accurately describing day-to-day dynamics in NDVI. A more complete coverage of best quality observations represents a key advantage of using the eight-day products in the present context.

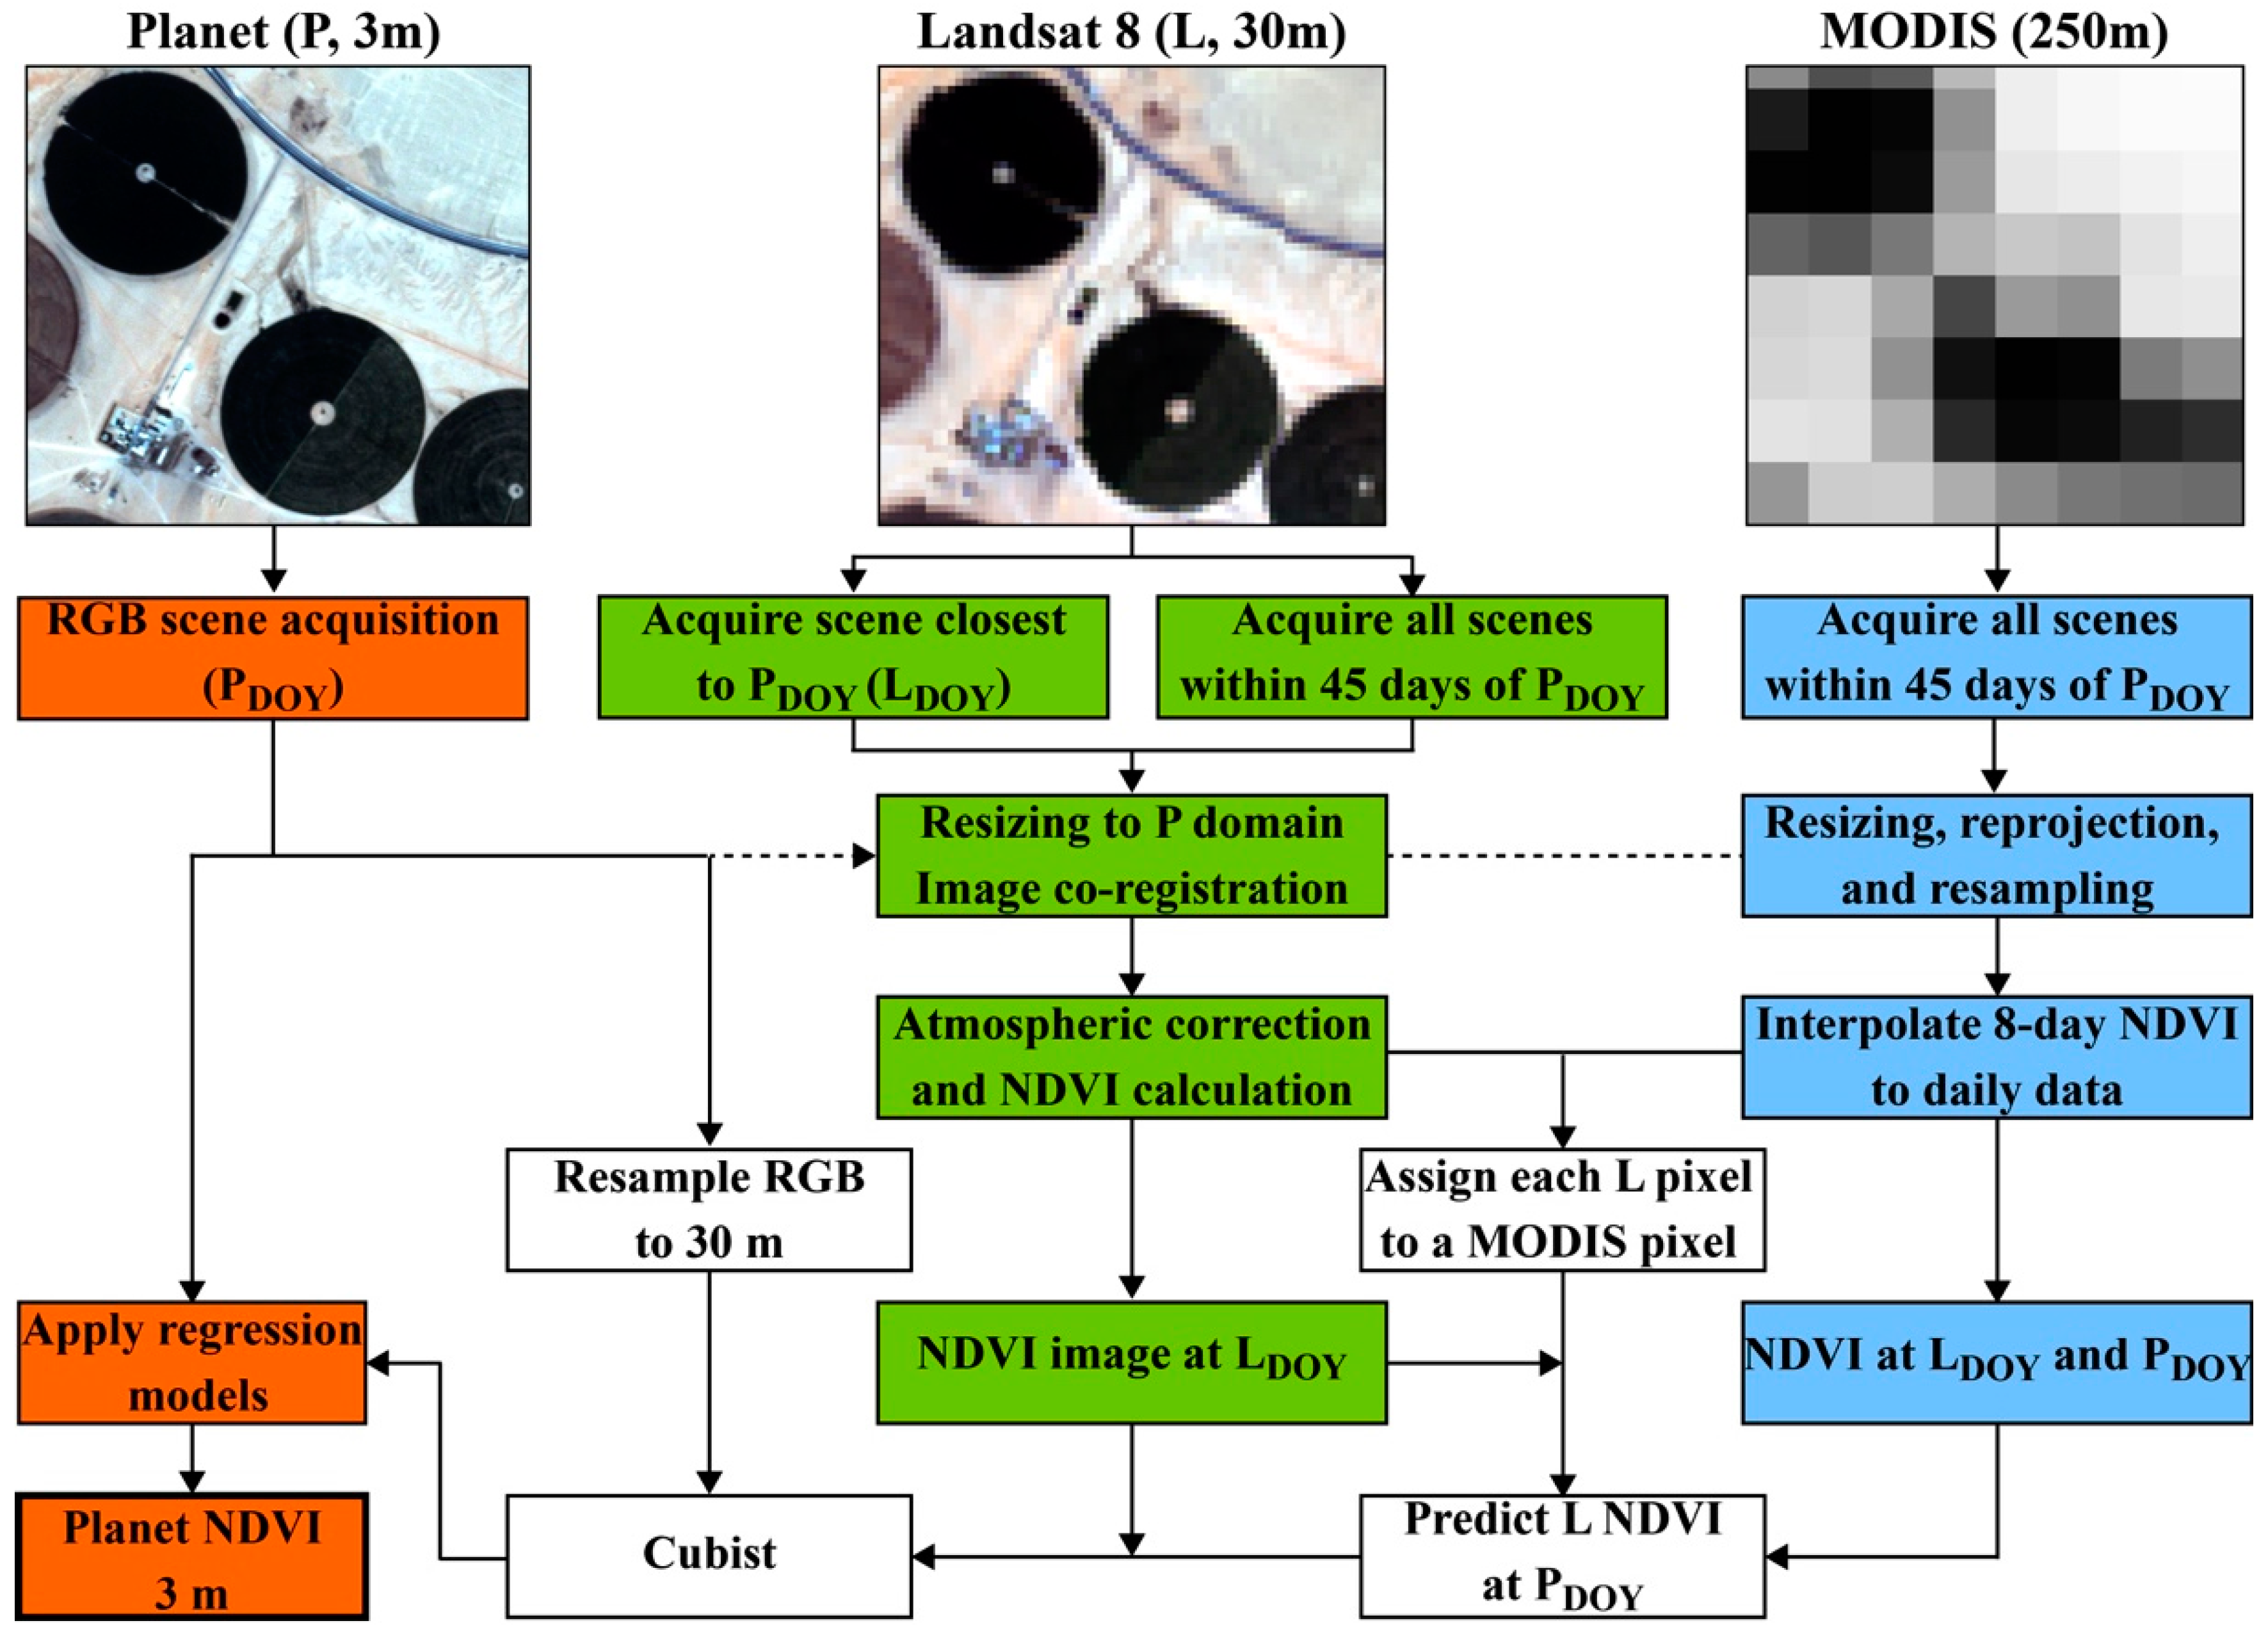
2.3. Method Description

A multi-scale framework was developed with an aim to seamlessly translate broadband Planet RGB imagery into Landsat-8 consistent estimates of atmospherically corrected NDVI. Figure 1 describes this process. MODIS based NDVI estimates at 250 m resolution are integrated into this approach to account for potential surface variations in NDVI that might occur between the Planet and Landsat scene acquisitions. This supplemental MODIS processing stream (Section 2.3.2) is only invoked if the Planet and Landsat acquisitions are more than four days apart. Otherwise, the Landsat-only processing stream (Section 2.3.1) takes precedence. The scheme employs a data mining technique (see Section 2.3.3) to build a set of rule-based multi-variate regression models relating the Planet RGB data to Landsat-8 consistent NDVI. The generated regression models are specific to each Planet scene, thereby avoiding potential uncertainties induced by variations in the calibration and acquisition characteristics (i.e., view and illumination geometry) of each Dove satellite sensor (Table 1). The end result is a high-resolution Planet-based NDVI map at 3 m ground sampling distance. The full processing stream has been established in an automated and unsupervised manner to facilitate straightforward execution over any selected region of interest (see Figure 1).

2.3.1. Landsat-Only Processing Stream

When a Landsat-8 acquisition occurs within a few days of the Planet acquisition, changes in surface conditions between the two satellite acquisitions are expected to be relatively minor. In this case, the near-coincident Landsat scene is resized to the domain of the Planet imagery that has first been resampled (using pixel aggregation) to the Landsat 30 m resolution, to ensure a scale consistent comparison and regression analysis. Geolocation mismatches between the Planet and Landsat imagery are minimized by applying appropriate pixel shifts (in x and y directions) based on optimizing the goodness of fit between scatters of Planet and Landsat red reflectances [43,44]. Atmospheric correction of the Landsat data is performed on the resized imagery as described in Section 2.2.2. Subsequently, the atmospherically corrected NDVI is calculated and then directed to the Cubist regression modeling as the target variable, the process of which is described in Section 2.3.3.

2.3.2. MODIS Processing Stream

When the acquisition time between the Planet and nearest valid Landsat-8 overpass is greater than a few days (set here to four days), changes in surface conditions between overpasses may influence the fidelity of the developed regressions. To account for this, the framework ingests higher frequency MODIS 250 m resolution imagery to predict a Landsat scale NDVI at the Planet acquisition DOY (PDOY), that is more representative of the actual surface cover conditions for that specific day. For this purpose, all Landsat and composited eight-day MODIS scenes within ±45 days of the Planet satellite overpass are acquired. However, for near real-time processing the window may be extended further backwards in time. The Landsat scenes are then resized, co-registered, and atmospherically corrected as described in the single scene processing of Section 2.3.1. MODIS NDVI maps are produced from NIR and red reflectance images, and subsequently resized to the common Landsat/Planet domain, re-projected from Sinusoidal to UTM projection, and resampled (using a nearest neighbor approach) to 30 m resolution. Precise co-registration of the resized MODIS and Landsat imagery is ensured by identifying appropriate pixel shifts based on the maximum goodness of fit between a near-coincident Landsat and MODIS NDVI scene for different 30 m pixel shifts. The resized MODIS eight-day NDVI time-series dataset is then interpolated to the daily scale as follows. Each pixel observation within a given eight-day period is associated with a specific DOY (i.e., corresponding to the best acquisition conditions). Associated values of NDVI and DOY are collected for each of the eight-day products over the scene domain, amounting to a total of 11 pairs (i.e., NDVI–DOY) for each pixel over a 90-day window. The NDVI values are then interpolated to the daily scale by assuming a linear progression between the observation DOYs. This process produces needed information on day-specific changes in surface conditions and also serves to fill any existing gaps in the MODIS eight-day product (e.g., due to clouds or low retrieval quality over the eight-day interval).
In order to reliably predict the change occurring at the Landsat scale, each Landsat pixel must be associated with a MODIS 250 m pixel. Due to the mismatch in scale, the nearest 250 m pixel may not be the best representation of the temporal vegetation dynamics occurring at the given Landsat pixel location. Instead, the optimum MODIS pixel is identified based on the correlation between time-series of day-coincident MODIS (interpolated) and Landsat NDVI within the neighborhood (i.e., ±375 m, which corresponds to a 3 × 3 MODIS pixel box) of the given Landsat pixel. The MODIS pixel associated with the highest correlation coefficient is then assigned as the best representation of surface cover changes for the given Landsat pixel.
As a final step, Landsat scale NDVI at PDOY can be predicted by multiplying the Landsat NDVI image closest to PDOY (i.e., LDOY) by the relative change in MODIS NDVI (MNDVI) observed between LDOY and PDOY (Figure 1). This can be formulated as
NDVI PDOY [ x , y ] = NDVI LDOY [ x , y ] ( 1 + MNDVI PDOY [ x o , y o ] MNDVI LDOY [ x o , y o ] MNDVI LDOY [ x o , y o ] )
where x and y represent the pixel location in the 2D image array and xo and yo represent the corresponding pixel location of the associated MODIS pixel. The resulting Landsat scale NDVI (NDVIPDOY) is then used as the target variable in the Cubist regression modeling described below.

2.3.3. Cubist Regression Modeling

Cubist (RuleQuest; www.rulequest.com) represents a data mining technique for building a collection of rule-based predictive models on the basis of a training dataset of target and input explanatory variables. Each of the resulting rules represents a multi-variate linear regression model that is used to calculate the predicted value whenever the conditions of the rule are met. The algorithm is based on the model tree approach described in Quinlan [45,46]. Cubist is computationally fast and specifically designed to efficiently handle very large datasets. As a result, it has been widely used in remote sensing applications [47,48,49].
For the analysis undertaken here, Landsat NDVI (at or close to PDOY) represents the target variable and Planet RGB data represent the input explanatory variables. Cubist is applied to RGB data that is resampled (using pixel aggregation) to 30 m resolution in order to be consistent with the scale of the Landsat NDVI (Figure 1). The blue band does not provide relevant information in the context of NDVI so is excluded from the list of explanatory attributes. The Green-Red Vegetation Index, GRVI = (G − R)/(G + R) [17], is added as an input to the model training along with the squared and cubed form of R, G, and GRVI. The GRVI is expected to act as a useful proxy for NDVI, as it records changes in vegetation density via variations in the surface reflectance contrast between the green reflectance peak and red reflectance minimum characteristic of dense canopies [28].
Cubist is operated in an iterative manner in order to learn the most effective regression relationships based on pixels that present the most consistent patterns between the Planet and Landsat imagery. For instance, pixels that have undergone change in surface cover between LDOY and PDOY, or that are being poorly predicted based on the MODIS information, should be excluded from the model training. Initially, the target and explanatory data are extracted from all pixels within the domain of the Planet scene, and Cubist is applied to the training dataset with the maximum number of allowed rules (nrul) set to 2. If the resulting NDVI predictions diverge from the target Landsat-based NDVI by more than 40% (i.e., in terms of the relative mean absolute deviation), those pixels are removed from the next Cubist run. The nrul is gradually increased (to a maximum of 10) concurrent with a decrease in the divergence threshold (to a minimum of 25%). The iterative process stops if the overall relative mean absolute deviation falls below 10% or the maximum number of iterations is reached (n = 10). Once completed, the developed rule-based regression models are applied to the full scene 3 m resolution RGB imagery to enable computation of Landsat consistent NDVI estimates at PDOY (Figure 1). Note that a new suite of rule-based regression models will be established for each Planet scene.

2.4. Evaluation of Approach

The fidelity of the approach in translating Planet RGB imagery into Landsat consistent estimates of NDVI is evaluated via scale consistent (i.e., 30 m) pixel-wise comparisons of the predicted (Planet) and actual (Landsat) NDVI for near-coincident acquisitions. In the Landsat-only mode (Section 2.3.1), the Landsat imagery at LDOY is used for both model training and validation of the NDVI predictions on PDOY. The validation is done on a full scene basis and thus includes pixels not involved in the training of the regression models. The traditional separation of the training database into independent training and validation groups [37] is not relevant in this case, as the developed rule-based models are specific to the given Planet scene and will not be applied to other data (i.e., another Planet scene). As such, the resulting validation statistics represent the accuracy level expected when the Planet scene is associated with a near-coincident Landsat-8 acquisition.
The approach is also tested using a Landsat acquisition that is temporally displaced (i.e., 11–16 days) from the PDOY as the training base and using MODIS to inform on changes in NDVI occurring over the timespan between acquisitions. In this case, the imagery used for model training is independent of the actual Landsat imagery near PDOY used for model validation.
Standard statistical metrics are used to assess the prediction performance. These include the coefficient of determination (r2), the Mean Absolute Deviation (MAD), the relative MAD (calculated by dividing the MAD with the mean of the observed Landsat NDVI values), and the relative Mean Bias Deviation (MBD; positive if the Planet predictions overestimate the Landsat based observations). In addition, density scatter plots and histograms of normalized probability density functions for Landsat and Planet based NDVI are used to visualize the utility of the approach in reproducing magnitudes and spatial features in NDVI. In the statistical evaluations, the worst performing 1% of data points were removed from the analyses to limit the impact of extreme outliers at pivot boundaries resulting from co-registration, scale, and pixel resampling issues.

3. Results

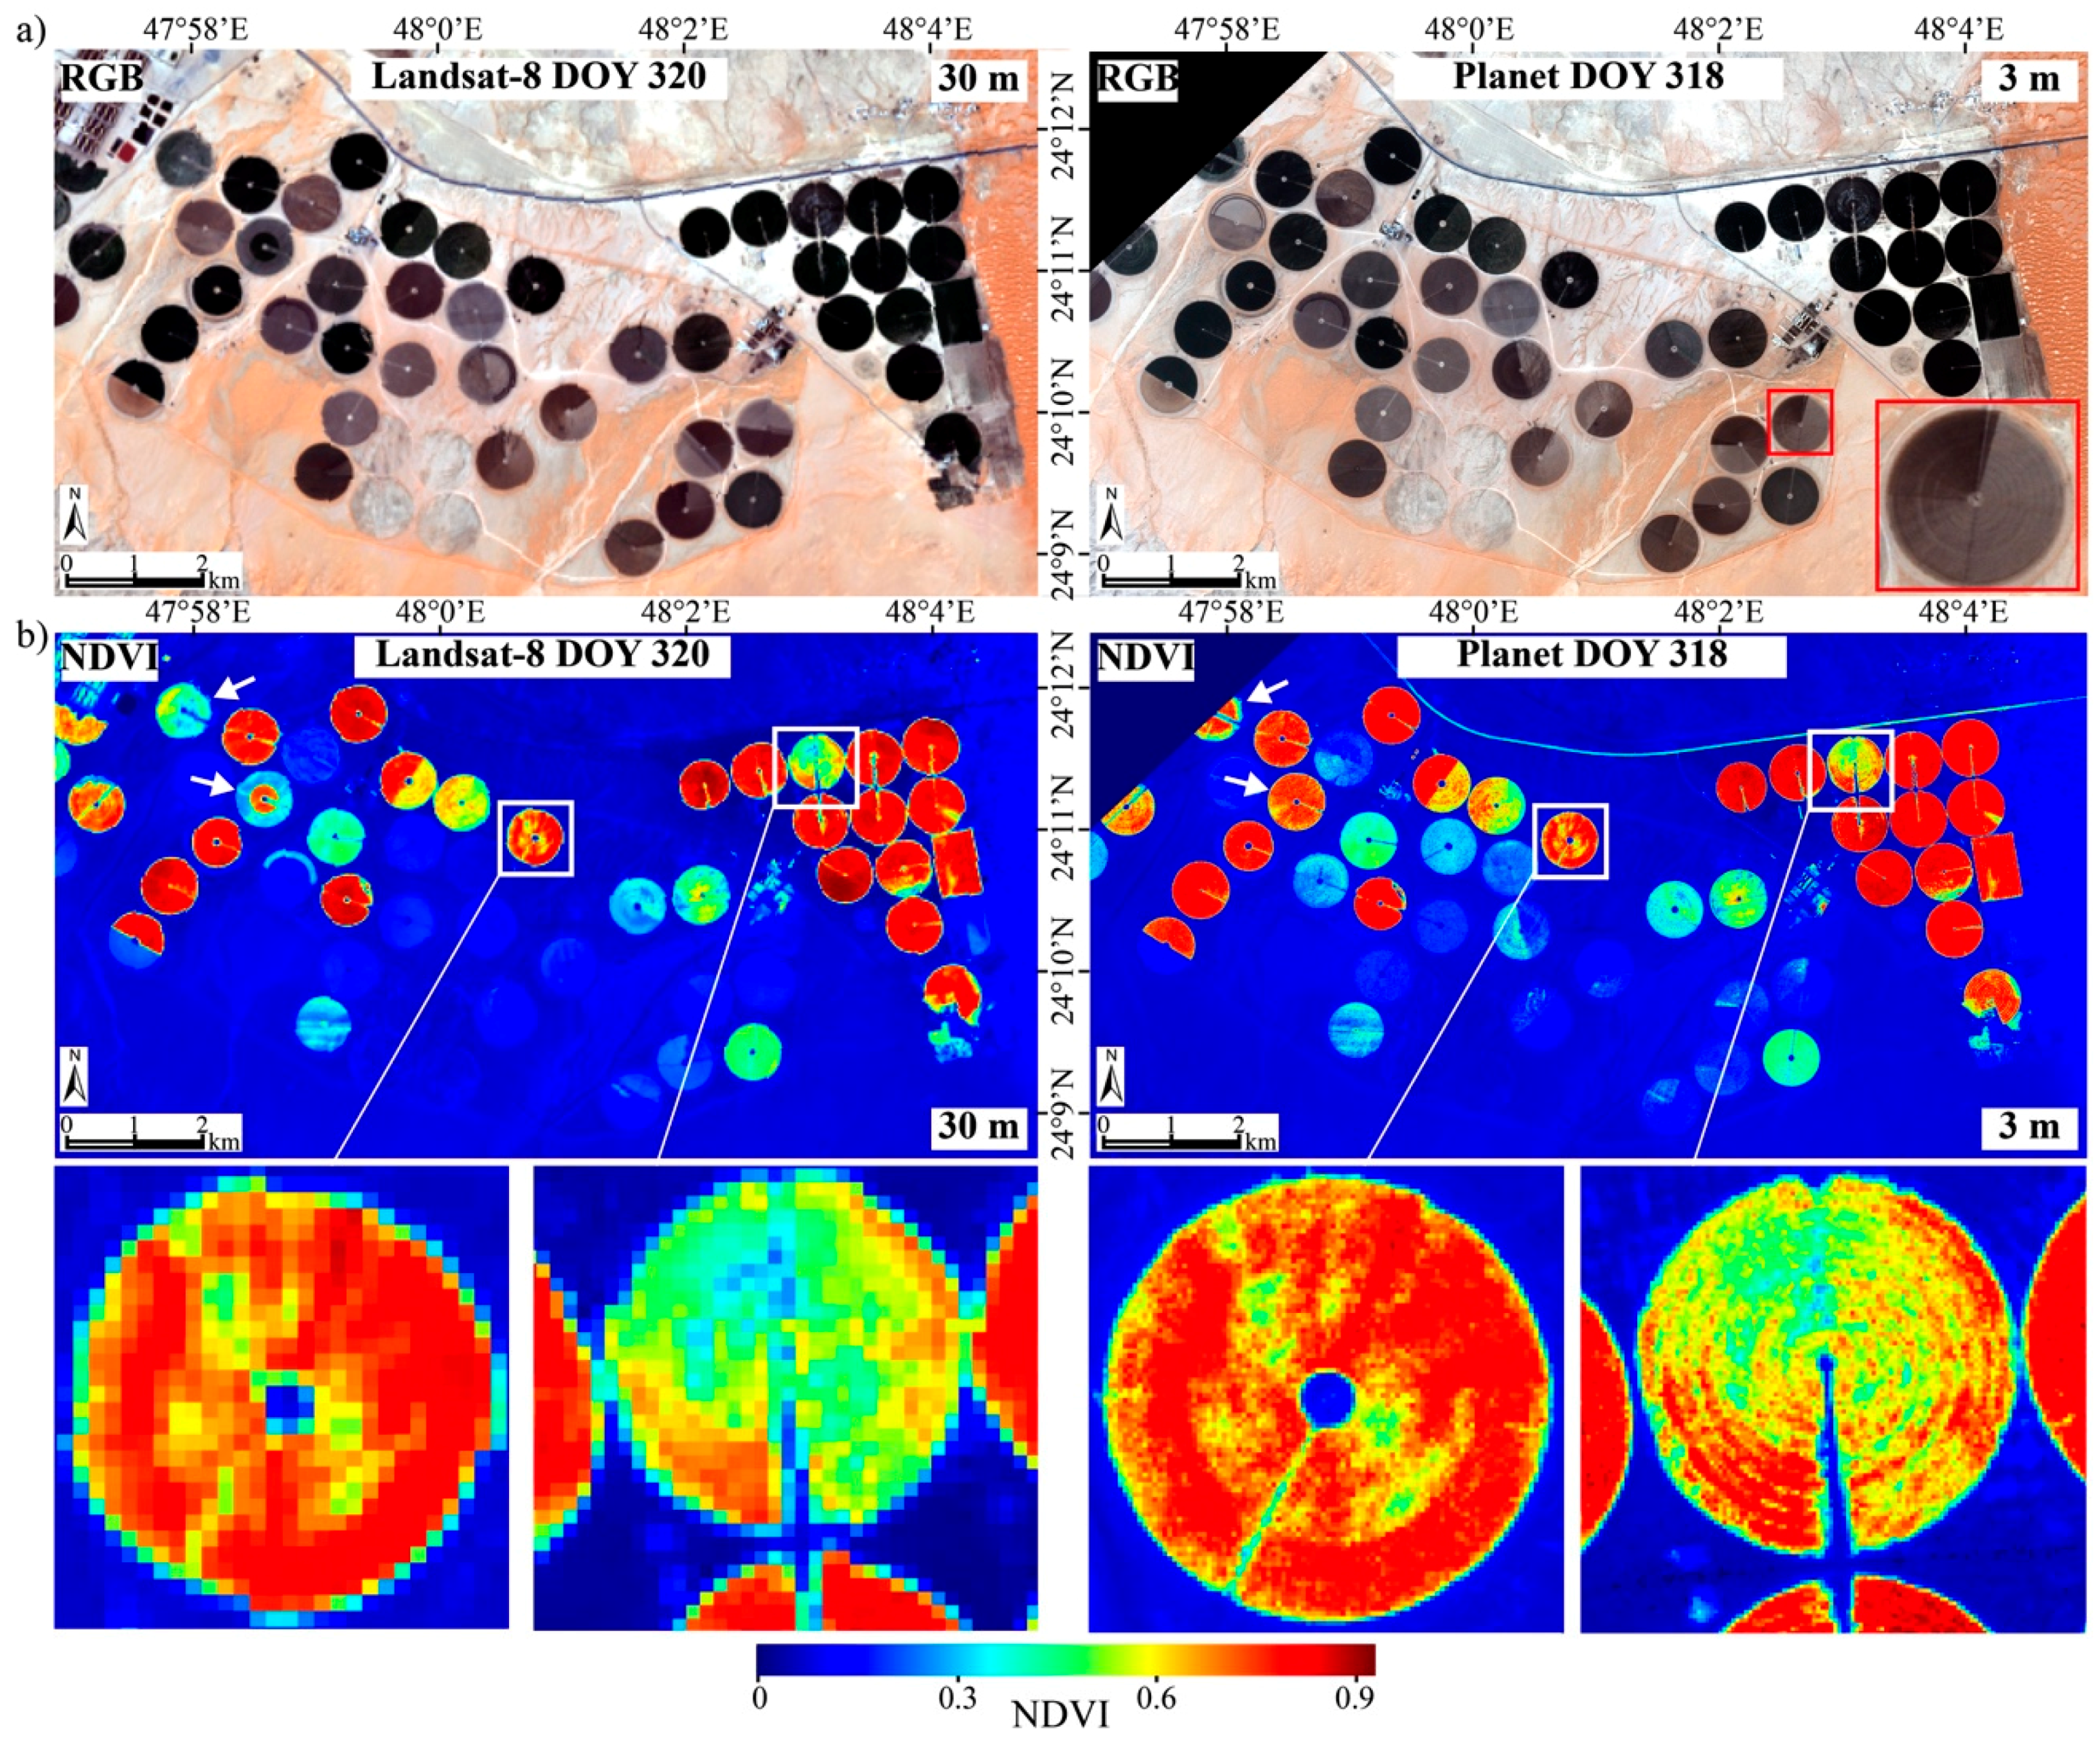
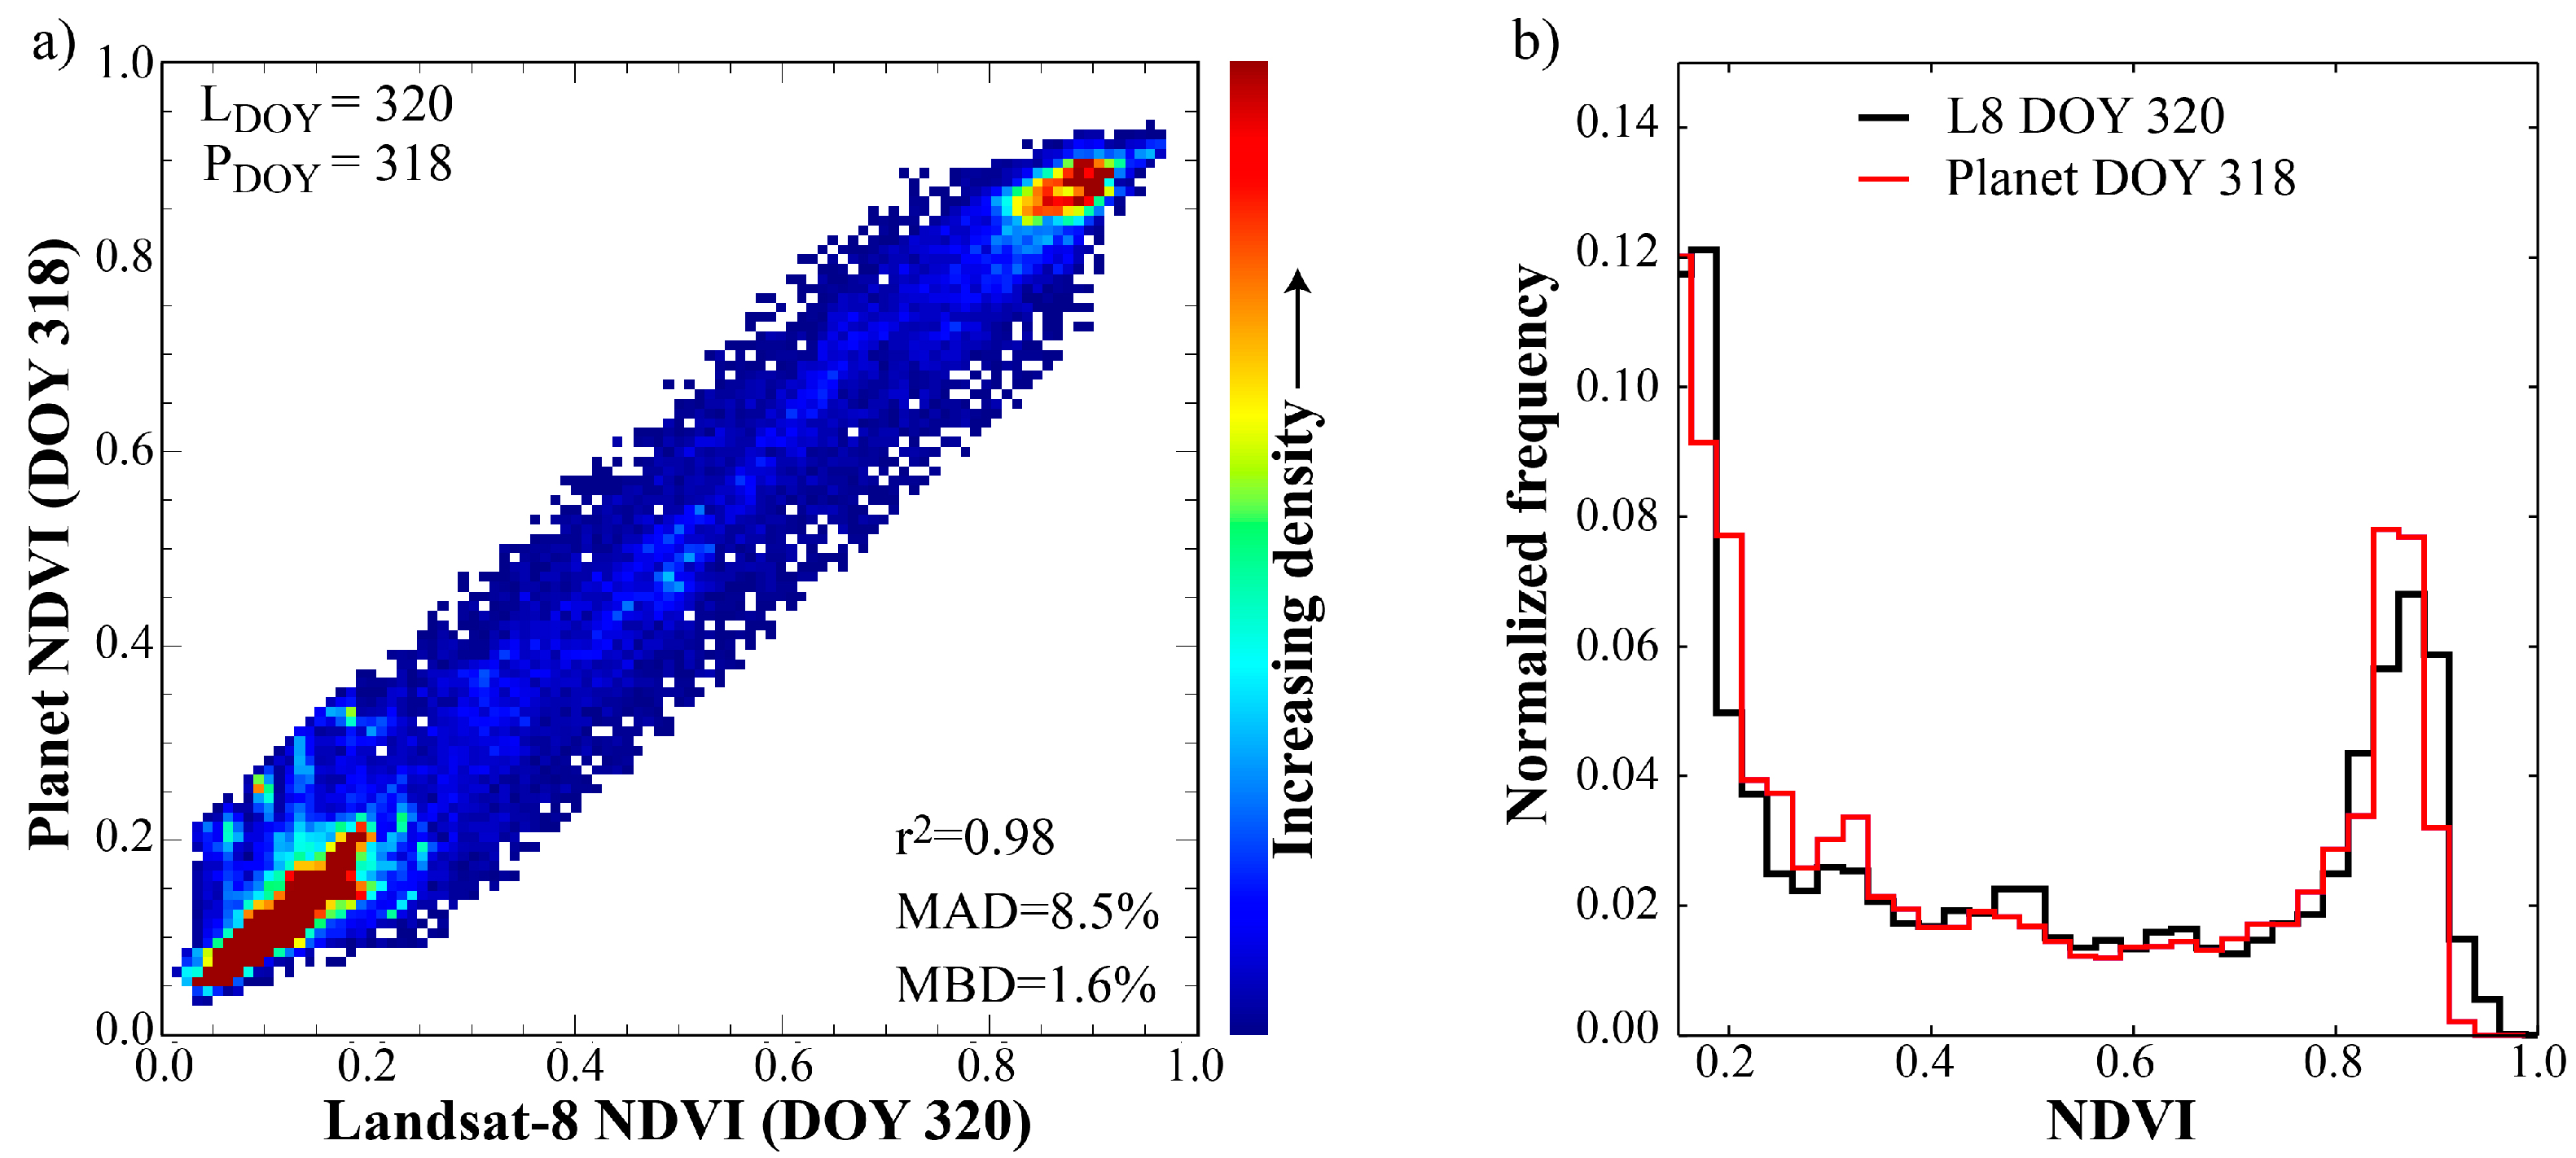
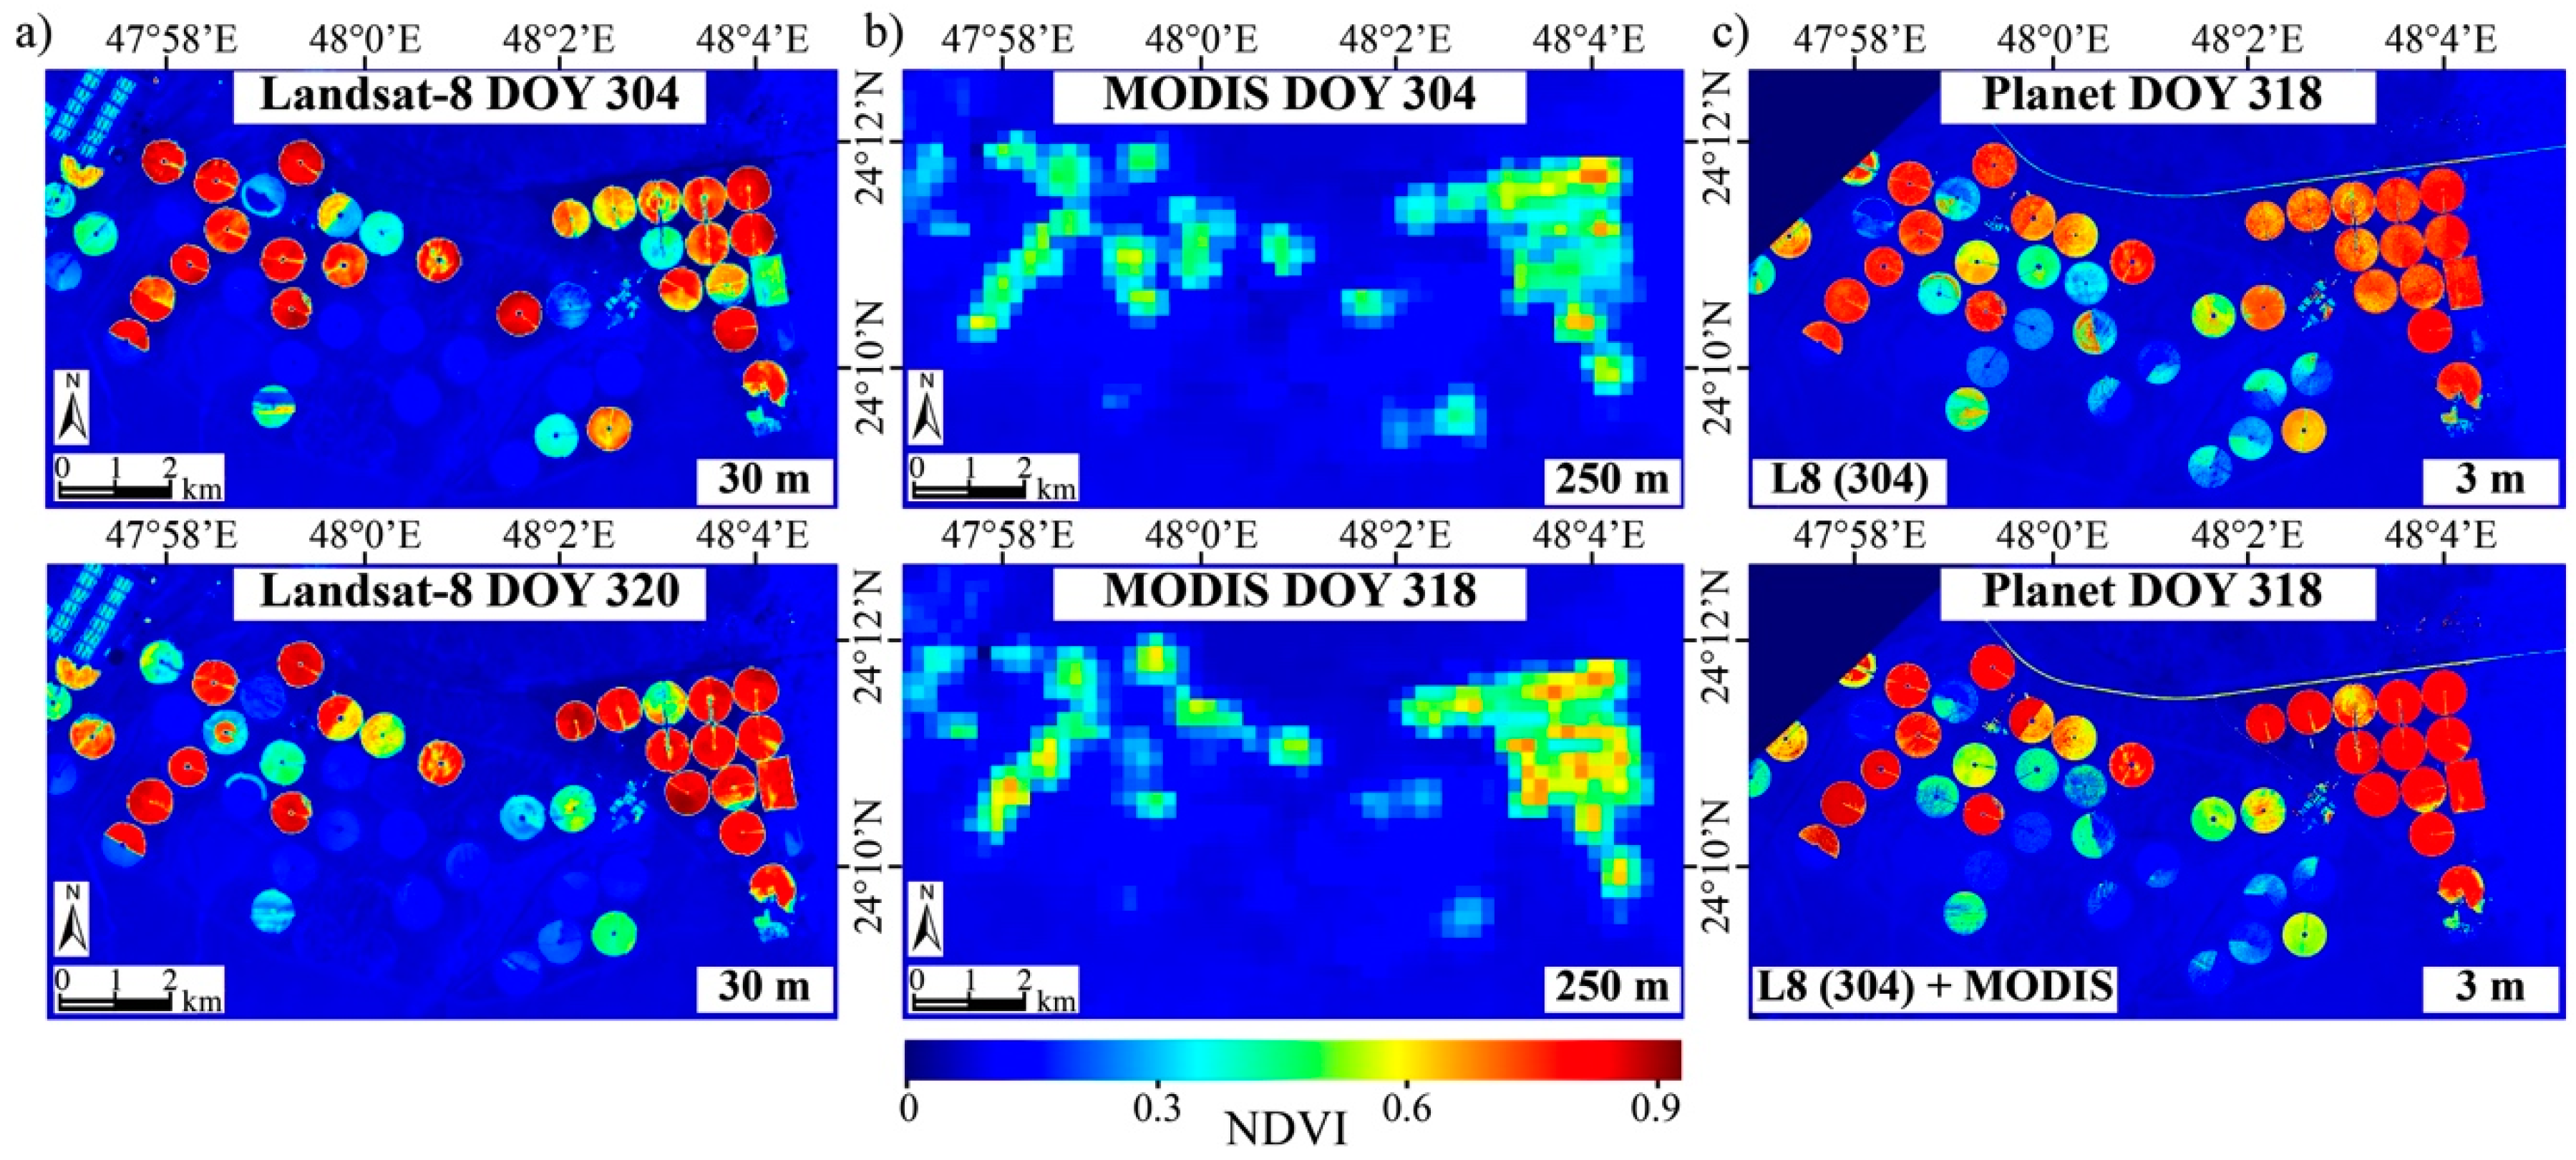
3.1. Case of Near-Coincident Acquisitions

In the ideal scenario, a clear-sky Landsat-8 image would be available within a few days of the Planet acquisition. In this case, changes in surface cover conditions (i.e., NDVI) between acquisitions will typically be minor and the training of the rule-based regression models will be based on observed NDVI spatial dynamics. Figure 2a shows true color (i.e., RGB) images over the farm from Landsat-8 and Planet acquired two days apart. As can be seen, the spatial features are generally similar, with dense vegetation pivots appearing dark (due to radiation absorption by chlorophyll pigments) and the surrounding highly reflective desert soil appearing bright. Some of the sparsely vegetated pivots also appear in darker colors, which is a result of the active irrigation. In fact, the position of the center pivot irrigation arm and the clockwise rotation of the center pivot can be observed, with darker shades trailing and brighter shades leading the irrigation arm (Figure 2a insert).
Figure 2b compares the Landsat-8 derived NDVI on DOY 320 with the Planet NDVI on DOY 318. The Planet NDVI was calculated via Cubist, using Landsat-8 NDVI from DOY 320 as the target variable and the Planet R, G, and GRVI information as the explanatory variables (see Section 2.3.3). The application of Cubist to the training dataset (total of 139,200 30 m resolution pixels; ~95% of all pixels) resulted in 10 rules, each associated with a unique multi-variate linear regression model. As an example, rule 8 is established based on 3535 pixels, has a target NDVI varying between 0.327 and 0.943 and is expressed by:
NDVI Planet = 2.6827423 0.015379 R + 0.013228 G 33.48 GRVI + 88.5 GRVI 2
In converting RGB imagery, rule 8 is used whenever R ≤ 1011 and G > 997 and GRVI ≤ 0.09592 apply. The R, G, and RGVI attributes were used in all of the rules, whereas R2 and RGVI2 were used in 40% and 60% of the rules, respectively. Evaluation of the converted Planet NDVI map against the training data resulted in a coefficient of determination of 0.99 for this particular example. Visually, the spatial features and magnitudes of the Landsat NDVI are accurately reproduced by the Planet predicted NDVI (Figure 2). As a counter-example, the NDVI of two pivots towards the northwestern edge of the farm (indicated by white arrows) differ significantly between the two images. These discrepancies are attributed to partial harvesting of the fields after the Planet acquisition, which can also be seen in the true color maps. Another distinguishing feature is the relatively high NDVI recorded in the Planet image over the paved road surfaces (Figure 2). The red and green band reflectances are relatively low and mostly the same over these surfaces, which may be mistaken for vegetation development at low to intermediate stages. In these cases, NIR capability is needed to accurately reproduce the true NDVI.
The benefits of the enhanced resolution (3 m) are clearly evident in the level of spatial detail discernable from the zoomed NDVI images of Figure 2b. While a high degree of within-field variability resulting from irrigation and soil variability can be seen in both the Landsat and Planet imagery, the fine-scale impact of center-pivot irrigation wheel trenches on the NDVI signal is only evident in the Planet imagery (rightmost zoom in Figure 2b). In addition, variations in NDVI dynamics at the Landsat sub-pixel scale occur in several places, which provide important insight into crop conditions for precision management purposes.
The density scatter plot of NDVI for all pixels (30 m) over the full domain of the farm demonstrates significant utility of the rule-based regression approach in predicting Landsat-8 NDVI from Planet’s RGB imagery, with a low bias (1.6%) and a relative MAD of 8.5% (Figure 3a). In fact, the large majority (i.e., 80%) of the data points are characterized by an r2 of 0.998 and a MAD of only 0.005 (3.9%) (Table 2). Comparative normalized frequency distributions of actual (Landsat on DOY 320) and predicted (Planet on DOY 318) NDVI also demonstrate a close correspondence between the estimates both at the lower and higher extremes of the NDVI range (Figure 3b).

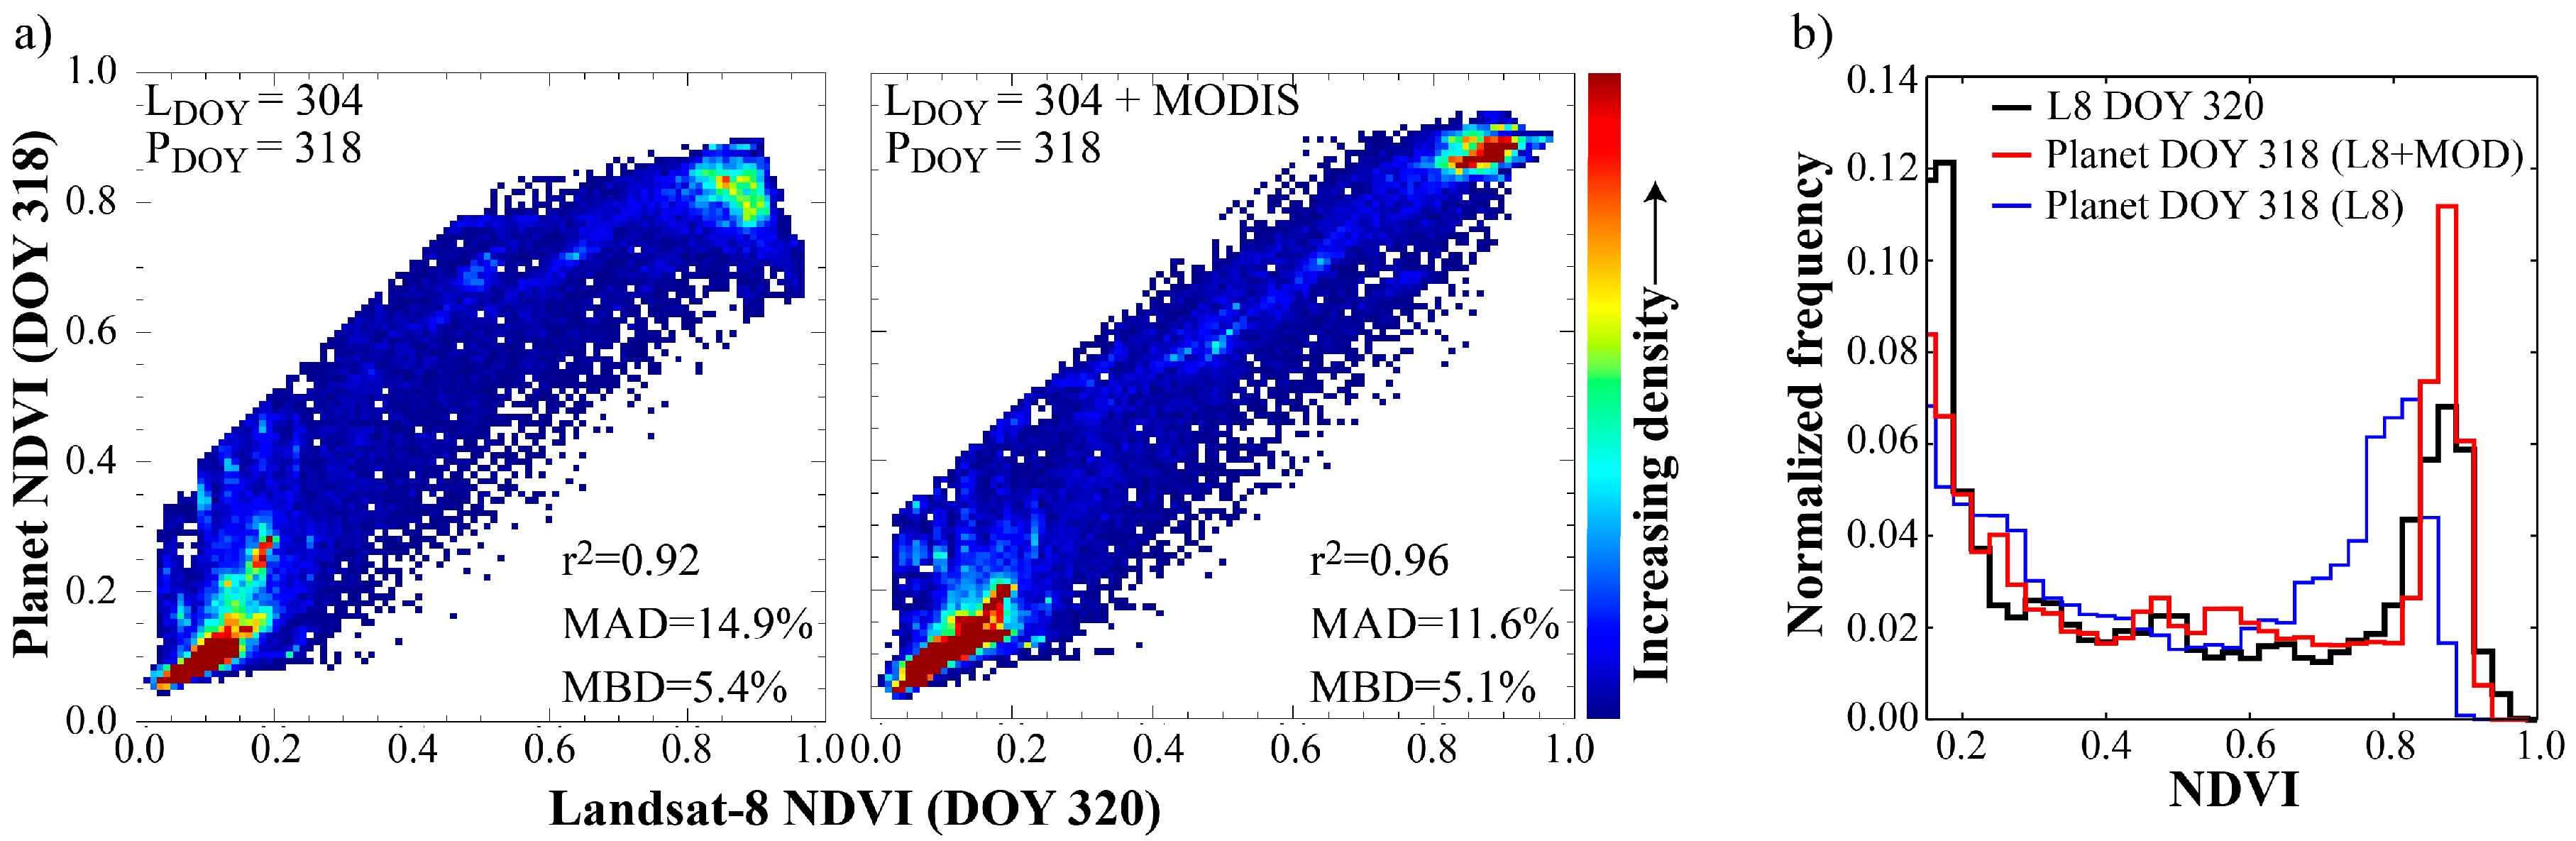
3.2. Case When Satellite Acquisitions Are Further Apart

When the Planet and Landsat-8 acquisitions are further apart, changes in surface cover conditions can be significant, which will impact the utility of the Landsat-only processing stream in reproducing the NDVI dynamics on PDOY. To examine such a scenario, NDVI at PDOY (DOY 318) was predicted using Landsat NDVI training data from DOY 304. As seen in Figure 4a, the majority of the pivots on the eastern half of the farm experience a significant green up between DOY 304 and 320. This is reflected in the Planet NDVI predictions (Figure 4c, top plot), which underestimate the actual NDVI magnitudes, particularly over those areas (Figure 4a, bottom plot). Improved NDVI predictability is achieved when the day-specific MODIS NDVI imagery (Figure 4b) is used to inform upon the Landsat-scale changes in NDVI occurring between DOY 304 and PDOY. In that case, the NDVI magnitudes are more accurately reproduced and the spatial features in the predicted NDVI (Figure 4c, bottom plot) are generally consistent with the observed patterns in the Landsat NDVI on DOY 320 (Figure 4a, bottom plot).
While the trends in NDVI recorded in the MODIS imagery are consistent with the Landsat observations, peak MODIS NDVI values over the vegetated pivots (~0.8) differ significantly from the corresponding Landsat values (~0.95) (Figure 4a,b). These high Landsat NDVI values agree with field collected spectroradiometer measurements over the farm (not shown), and are the result of well-watered dense canopies and generally dark (i.e., wet) soil backgrounds. The impact of adjacency effects can be substantial over vegetated pivots surrounded by bright desert soils [37], and algorithm differences in the treatment of this complex phenomenon provide a plausible reason for the observed discrepancy between the MODIS and Landsat-based NDVI estimates. Regardless, these issues are expected to have a relatively minor influence on the results, as the framework utilizes the relative change in MODIS NDVI (Equation (1)).
The density scatter plots of observed Landsat NDVI (DOY 320) versus the Landsat-only (DOY 304) and MODIS informed NDVI predictions on PDOY (318) (Figure 5a) demonstrate the benefit of integrating MODIS information, with the r2 increasing from 0.92 to 0.96 and the relative MAD decreasing from 14.9% to 11.6%. The normalized frequency distribution for the Landsat-only predictions indicates a displacement of the frequency peak at the high end of the NDVI range relative to the observed NDVI (Figure 5b), consistent with the underestimation of NDVI over the dense vegetation pivots (Figure 4c, top plot). Fortunately, this issue is largely resolved when both Landsat and MODIS NDVI are employed in the prediction process (Figure 5b).

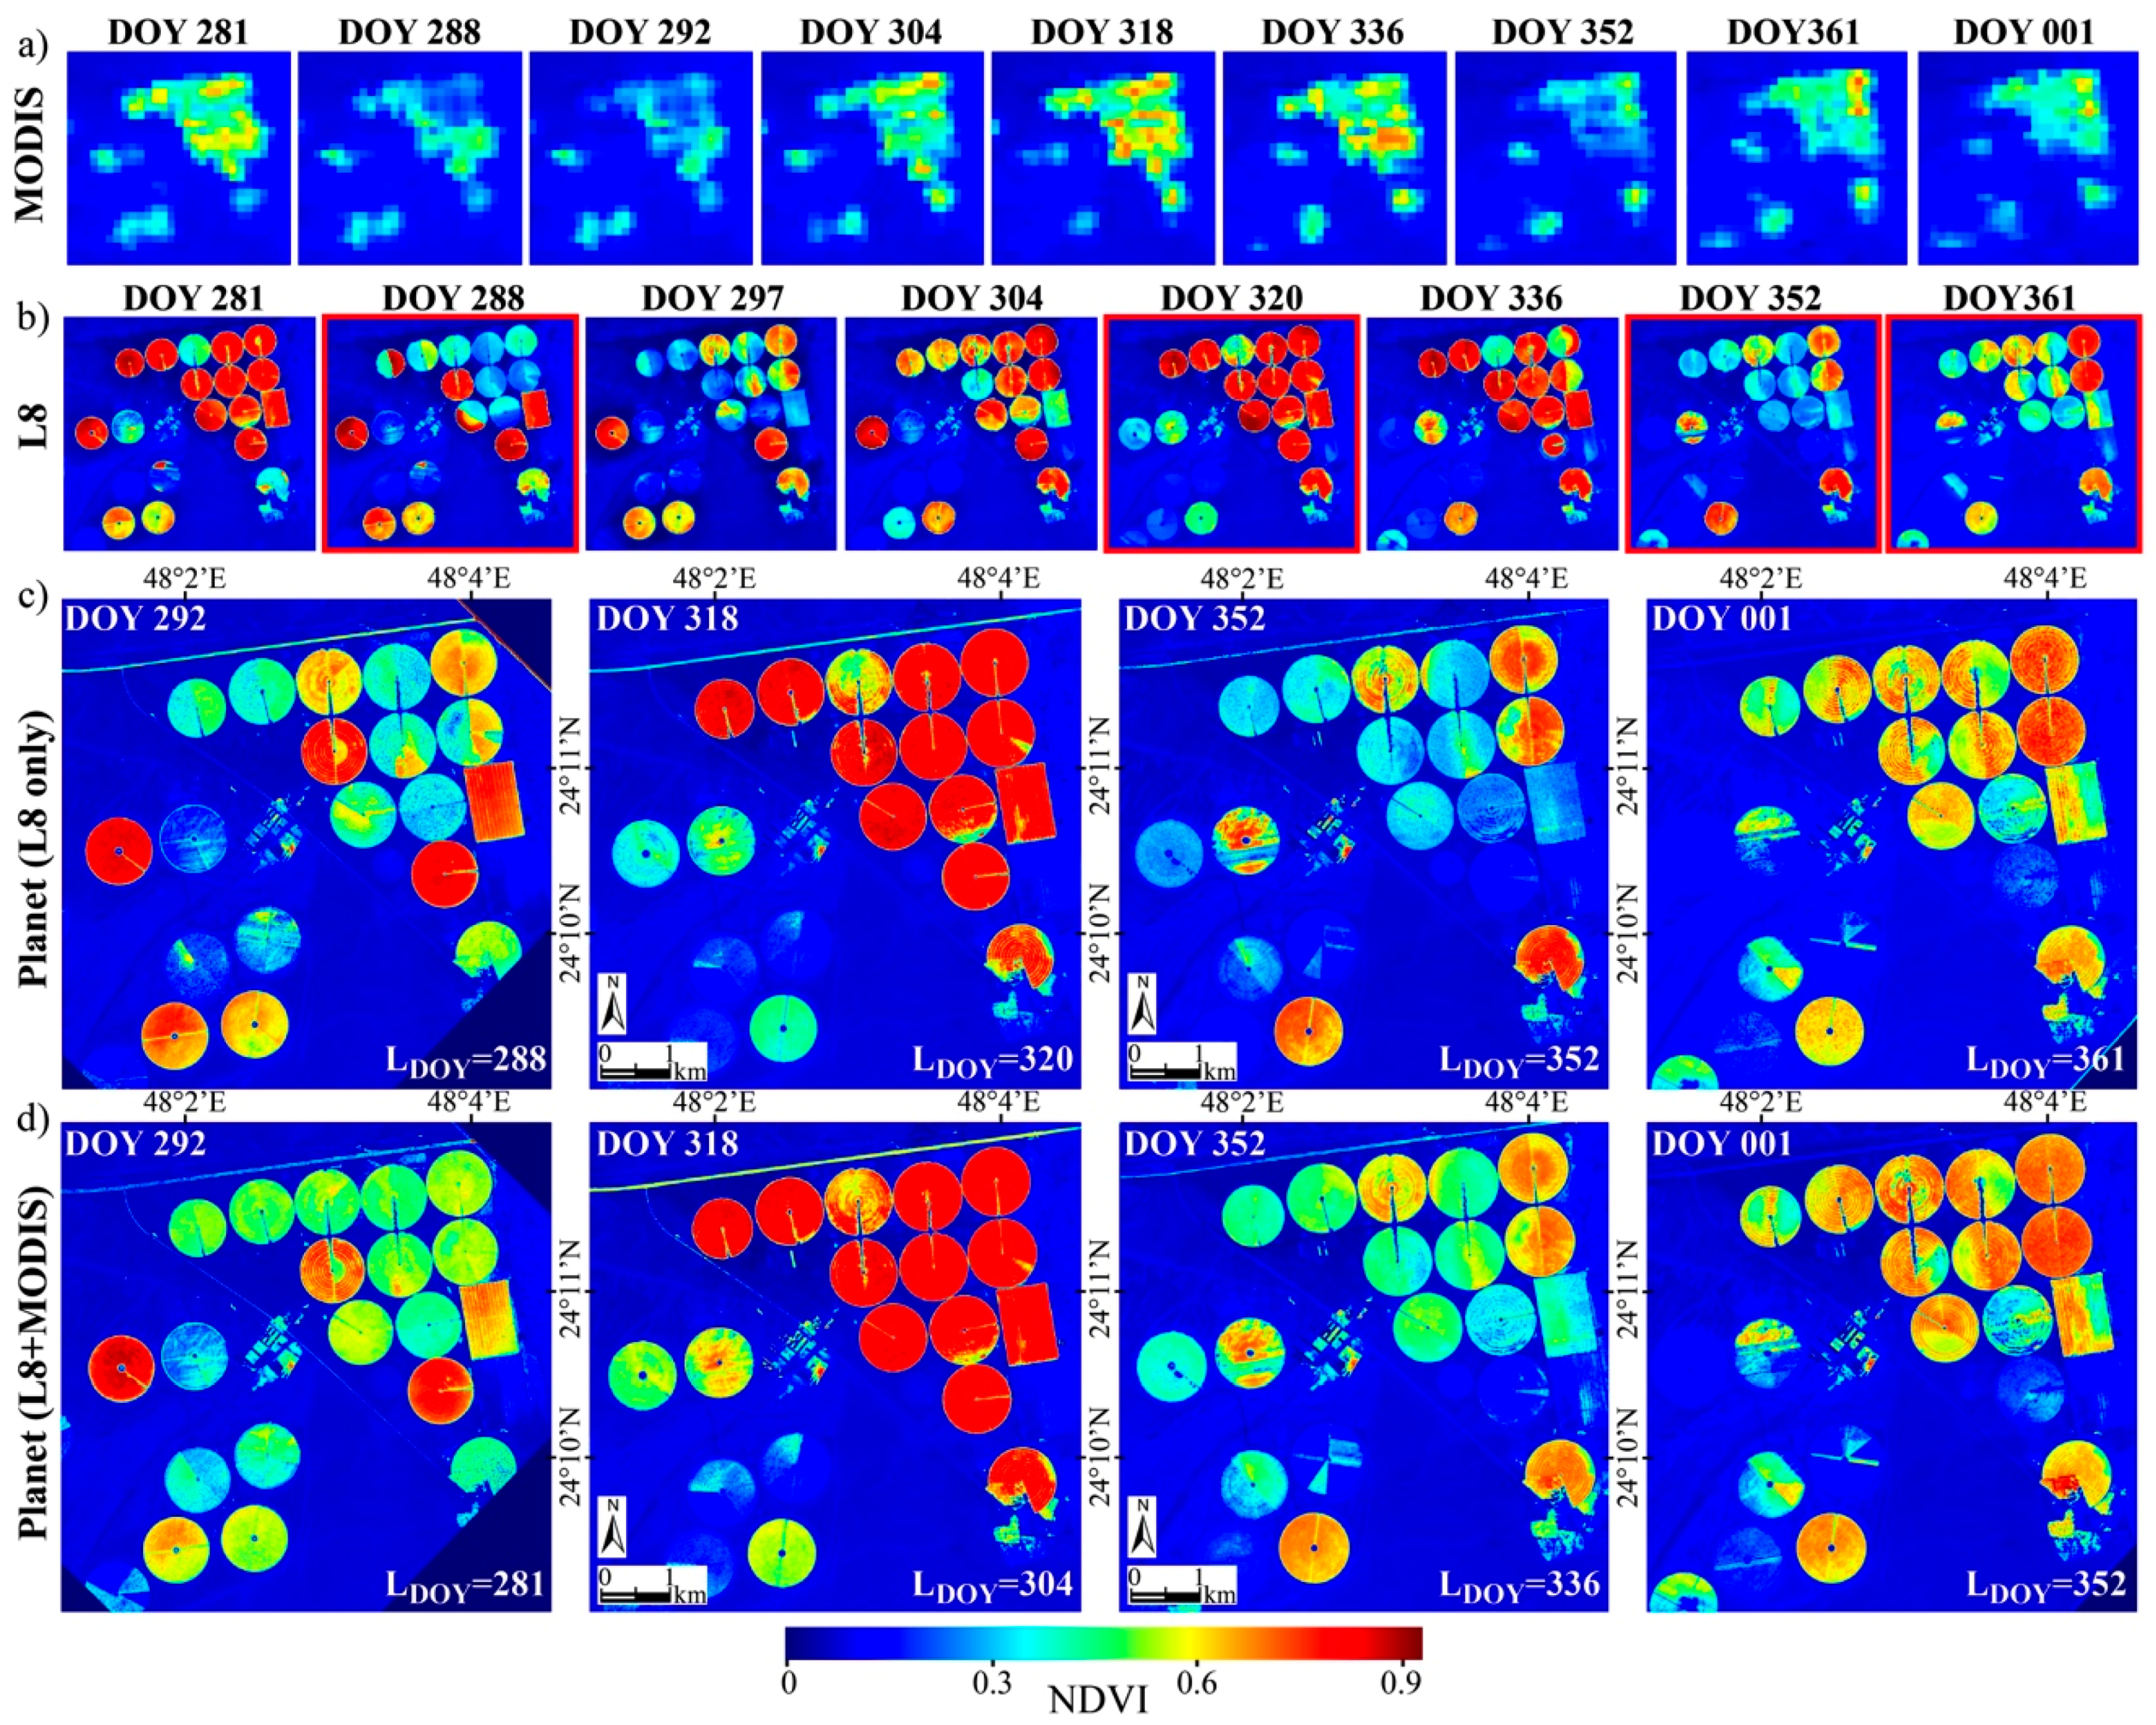
3.3. Planet NDVI Time-Series

Figure 6 displays spatio-temporal features in (a) MODIS, (b) Landsat-8 and (c,d) Planet NDVI over the eastern part of the farm during the period of study, and showcases the two procedures (Landsat only or combination of Landsat and MODIS) for generating time-series of Planet NDVI. In all cases, each Cubist simulation is independent, with resultant rules specific to the given Planet scene. In Figure 6c, a near-coincident Landsat NDVI image was used to train the rule-based NDVI predictive models, whereas a Landsat scene further away from PDOY together with MODIS NDVI imagery from LDOY and PDOY were used to produce the Planet NDVI maps in Figure 6d.
Rapid changes in NDVI are evident in the Landsat-8 based time-sequence of maps (Figure 6b). The majority of the fields (predominantly alfalfa) are harvested between DOY 281 and 288, followed by a period of rapid green up. The mature alfalfa fields are harvested again between DOY 336 and 352. These same tendencies are evident in the coarser scale MODIS NDVI images (Figure 6a). Planet NDVI predictions on DOY 292 (Figure 6c,d) differ significantly from the Landsat NDVI on DOY 288 over some of the pivots, as illustrated by a relative MAD of 18.5% (c) and 25.1% (d) (Table 2). The relatively poor performance is believed to be the result of rapid changes in NDVI occurring between DOY 288 and 292 (Figure 6a,b), which partly invalidates the use of the Landsat NDVI on DOY 288 as the basis for evaluating NDVI predictions on DOY 292.
As previously demonstrated, the predicted Planet NDVI on DOY 318 closely resembles the observed NDVI on DOY 320 for both cases (Figure 6c,d). Planet NDVI predictions on DOY 352, based on day-coincident Landsat NDVI training data, accurately reproduce the observed NDVI (Figure 6c) with an r2 of 0.967, a MAD of 0.014 and a relative MAD of 9.5% (Table 2). Planet NDVI predictions based on Landsat NDVI from DOY 336 and MODIS NDVI from DOY 336 and 352 are characterized by a larger relative MAD (16.5%) (Table 2), which is mainly attributable to a positive bias (i.e., NDVI is overestimated by 10.9%) over low-to-intermediate NDVI pixels (Figure 6d and Table 2). On DOY 001 (2016), the two approaches provide very similar NDVI predictions over the displayed section of the farm that are in good correspondence with the observed NDVI on DOY 361 (Figure 6b–d and Table 2).
Based on these results (excluding DOY 292), Planet NDVI time-series data can be predicted with an overall MAD of 0.014 (9.2%) when a near-coincident (i.e., 0–5 days) Landsat NDVI image is used to train the regression models (Table 3). Robust predictabilities are observed for all of the dominant cover types (i.e., MAD varying from 7.8% to 11.2%) (Table 3), and the majority (i.e., 80%) of the data points are described by a relative MAD less than 5% (Table 2). The level of overall agreement decreases to a MAD of 0.021 (13.7%) when the Landsat NDVI training image is further away (i.e., 11–16 days) from PDOY and the MODIS processing stream is invoked (Table 3). In these cases, the Planet NDVI predictions tend to overestimate the Landsat observations over alfalfa (MBD = 8.5%) and corn (MBD = 14.5%), which reflect uncertainties associated with describing the actual rate of change in cover specific NDVI between the Landsat training image and PDOY. Regardless, the majority of the MODIS informed predictions reproduce the observed NDVI with an r2 ≈ 0.99 and a relative MAD ranging from 4.5% to 9.1% (Table 2).

4. Discussion

Planet’s flock of Dove satellites has been collecting high spatial resolution imagery in broad red, green, and blue spectral bands since March 2014. Daily image capture on a global scale is anticipated with a full constellation of Dove satellites in the near future. While unique in terms of spatio-temporal resolution, the limited spectral resolution and lack of atmospherically corrected or radiometrically calibrated radiance data may pose a limitation for reliably characterizing the changing conditions of land surface features generally, and vegetation canopies specifically. To address such potential restrictions, Planet’s RGB imagery were translated into Landsat-8 consistent and atmospherically corrected NDVI.
Whenever a NIR retrieval capability is lacking, the translation of the visible (i.e., RGB) imagery into estimates of NDVI is not straightforward. To overcome the RGB data constraint, a data mining approach based on establishing rule-based predictive regression models was shown to be effective at predicting Landsat observed NDVI from information contained in the red and green bands of the Planet imagery. NDVI predictability was best, i.e., characterized by a MAD of 0.014 (9.2%), when a Landsat acquisition within a few days of the Planet acquisition was available to train the rule-based models. The MAD increased to 0.021 (13.7%) when the Landsat NDVI training image was further away (i.e., 11–16 days) from the Planet acquisition and MODIS NDVI images were used to inform on the change in NDVI occurring between the overpasses.
The Planet NDVI predictions were aggregated to the Landsat 30 m resolution in order to facilitate scale consistent pixel-wise comparisons. While efforts were made to ensure precise co-registration of the imagery (via the pixel shifting approach described in Section 2.3.1), differences between the Planet pixel aggregation and the Landsat-8 cubic convolution resampling technique are likely to affect the pixel comparability, particularly at field boundaries. As a result, the prediction accuracy was also assessed on the best performing majority (i.e., 80%) of the data, which reduced the overall MAD to ~0.006 (~4.5%) and ~0.008 (~7%) (Table 2) for the Landsat-only and MODIS informed cases, respectively. The retrieval accuracy levels may be impacted by the number of days between the Planet acquisition and the Landsat NDVI image used to validate the Planet NDVI predictions. For example, rapid changes in surface cover conditions between the Landsat and Planet overpasses on DOY 288 and 292, respectively, raised some questions on the validity of the Landsat NDVI image on DOY 288 for evaluating the Planet predictions on DOY 292. Overall, reported prediction accuracies were highest for Planet imagery associated with a Landsat NDVI validation image acquired within two days of the Planet imagery.
The high correlations (r2 > 0.9) reported between the Planet explanatory data (red, green, GRVI) and the Landsat target NDVI, might seem surprising given the lack of NIR information. Dense green vegetation canopies are characterized by a surface reflectance peak in the green wavelength domain and a reflectance minimum in the red domain (absorption maximum by chlorophyll pigments), whereas the typical background soil reflectance signal is characterized by a steady increase over the visible domain [15,50]. As a result, the reflectance contrast between green and red reflectances will directly relate to changes in vegetation density. This makes a visible normalized difference index such as the GRVI a particularly good proxy for NDVI, as has been observed in a number of previous studies [17,28,29]. Confusion between the RGB and NDVI signals is most likely over non-vegetated non-soil surfaces (e.g., roads, buildings, water), where the distinctive spectral signatures can be mistaken for vegetation development without the presence of NIR information. Clearly, the link is not universal and will depend on time-specific and spatially varying surface characteristics. The adopted data mining approach is particularly useful at inferring these links on a repeatable scene-specific basis via the definition of multiple rule-based regressions. The rule-based models will not be applied beyond the given Planet scene, thereby avoiding traditional issues associated with the transferability of regression-based predictions [51]. As such, changes in environmental or surface characteristics are expected to have little effect on the algorithm performance, as the Cubist-based regressions will adapt to any given condition.
The standard 16-day revisit cycle of Landsat-8 in addition to cloud cover issues reduces the chance of near-coincident Landsat and Planet acquisitions over many regions. In those situations, effective predictions of NDVI at the Planet acquisition DOY will rely on the ability to properly describe variations in NDVI at the Landsat scale over the acquisition timespan. Day-specific (linearly interpolated) MODIS NDVI images (250 m) computed from eight-day products of NIR and red reflectances were found to be useful for this purpose. The 250 m MODIS resolution may not always be sufficient for distinguishing the change in NDVI of individual land cover types in heterogeneous landscapes. However, uncertainties associated with the mixed pixel issue were reduced by searching for the “purest” (i.e., least mixed) MODIS pixel within the neighborhood of the given Landsat pixel based on pixel-wise time-series correlations of coincident MODIS and Landsat NDVI images collected within 45 days of the Planet acquisition (Section 2.3.2). Uncertainties are naturally associated with describing the change in NDVI occurring between the DOYs of the optimal pixel observations in the eight-day periods, which may vary from 1 to 16 days. A linear rate of change in NDVI between DOYs (as adopted here) may not always be a good approximation for extended timespans. Supplementing the data mining approach with eight-day Aqua MODIS products (i.e., MYD09Q1) or daily surface reflectance products (i.e., MOD/MYD09GQ) during optimal acquisition conditions is likely to help in establishing a higher frequency account of observed NDVI dynamics at the 250 m scale. Overall, the approach relies on high quality retrievals for ensuring time and space consistent time-series records of NDVI, and reliably describing relative variations in land cover specific NDVI occurring over the acquisition timespan.
Reducing the time interval between the Planet acquisition DOY and the NDVI training image is key to achieving good NDVI predictabilities. Unfortunately, extended timespans between overpasses are likely to be an issue in regions with more frequent cloud coverage. While the framework has been demonstrated using Landsat-8, it can be easily extended to high spatial resolution multi-spectral sensors such as RapidEye (5 m) and Sentinel-2 (10 m) using their respective red and near-infrared bands for providing NDVI target inputs to the Cubist regression modeling. Synergistic use of multi-sensor NDVI data streams, atmospherically corrected and normalized to a common standard, would significantly increase the chance of usable clear-sky NDVI training images close to the Planet scene acquisition.
The developed approach uses generic techniques, adaptable scene-specific model regressions, and automated processing streams to ensure transferability to any region of interest. The approach involves the acquisition and atmospheric correction of the Landsat NDVI imagery, which is accomplished in a fully automated manner using extendable atmospheric correction techniques [37,39]. Careful removal of atmospheric influences in the target NDVI images is particularly pertinent over desert agricultural systems due to high aerosol loadings, a heterogeneous surface reflectance field, and bright desert soils [37], and represent a critical step in the construction of high quality NDVI time-series from Planet RGB imagery. Contamination from space and time varying atmospheric effects, inherent variations in the spectral and radiometric characteristics of individual Planet RGB sensors, and differences in the orbit and acquisition characteristics of individual Doves can easily confound the time-series signal relating to the actual change in surface cover conditions. A key objective of ongoing work is to evaluate the robustness of the framework over other regions with contrasting environmental and surface conditions.
The framework developed here exploits the high absolute radiometric accuracy and reflectance error specification of the Landsat-8 push-broom sensor [8,9] to correct the Planet time-series imagery into estimates of NDVI, with a comparable level of accuracy and consistency over time and space domains. This is expected to significantly enhance the utility of Planet’s dense time-series of imagery for near real-time monitoring of the state and condition of vegetation canopies. Capability will be further enhanced with the addition of near-infrared sensors on-board the Dove platforms in the near future. While this will enable Planet NDVI estimation directly from the imagery, the data mining approach remains useful in producing Landsat consistent and atmospherically corrected NDVI estimates at the scale and time of the Planet acquisition. Obviously, the approach outlined here may also be applied directly to the Planet spectral band (RGB) data in order to retrieve Landsat consistent surface reflectance data in associated visible wavelength bands, which could further advance the utility of Planet’s imagery in agricultural applications.

5. Conclusions

The expanding flock of Planet’s Dove satellites surveys the globe with frequent RGB imagery capture at high spatial resolution (~3 m). A daily frequency of global coverage is foreseen in the near future with a full constellation of Dove satellites. In order to enhance the use of this unique capacity for earth observation, the Planet RGB imagery was translated into Landsat-consistent estimates of atmospherically corrected NDVI via a set of scene-specific rule-based predictive models. The adopted data mining technique was shown to be effective at reproducing observed features and magnitudes in Landsat NDVI from information contained in the red and green bands of the Planet imagery. Predictabilities were optimal when a near-coincident Landsat NDVI image was available to train the regression models: but accuracy levels remained high with larger time intervals between acquisitions and when MODIS 250 m data were used to inform on the change in NDVI occurring between the Landsat and Planet acquisitions.
The developed framework builds upon an automated processing stream and generic techniques, which makes it extendable, scalable, and transferable to other regions of interest. The approach offers significant potential for translating dense time-series of Planet RGB imagery, captured by a multitude of Dove satellites during variable acquisition conditions, into consistent and atmospherically corrected estimates of an important metric of vegetation density and health. Apart from being a useful metric of vegetation health globally, this newly developed earth observation resource serves as a high resolution tool for precision agriculture with the potential to significantly enhance the ability to identify within-field variability in crop growing conditions on a timely and repeatable basis, which is likely to help farmers optimize agricultural production and manage resources more sustainably.

Acknowledgments

Research reported in this publication was supported by the King Abdullah University of Science and Technology (KAUST). We acknowledge Planet’s Ambassadors program for providing access to their imagery archive as well as the outreach efforts of Planet’s Nuno Vilaça and Joseph Mascaro. We greatly appreciate the logistical, equipment, and scientific support offered to our team by Jack King, Alan King, and employees of the Tawdeehiya Farm in Al Kharj, Saudi Arabia, without whom this research would not have been possible.

Author Contributions

R.H. and M.F.M. conceived the project. R.H. developed the algorithm and designed the framework, processed and analyzed the data, and prepared the figure material. R.H. wrote the paper with assistance from M.F.M.

Conflicts of Interest

The authors declare no conflict of interest. The funding sponsors had no role in the design of the study; in the collection, analyses, or interpretation of data; in the writing of the manuscript, and in the decision to publish the results.

References

  1. Berni, J.; Zarco-Tejada, P.J.; Suarez, L.; Fereres, E. Thermal and Narrowband multispectral remote sensing for vegetation monitoring from an unmanned aerial vehicle. IEEE Trans. Geosci. Remote Sens. 2009, 47, 722–738. [Google Scholar] [CrossRef]
  2. Esper, J.; Panetta, P.V.; Ryschkewitsch, M.; Wiscombe, W.; Neeck, S. NASA-GSFC Nano-satellite technology for Earth Science missions. Acta Astronaut. 2000, 46, 287–296. [Google Scholar] [CrossRef]
  3. Moran, M.S.; Inoue, Y.; Barnes, E.M. Opportunities and limitations for image-based remote sensing in precision crop management. Remote Sens. Environ. 1997, 61, 319–346. [Google Scholar] [CrossRef]
  4. Zhang, N.; Wang, M.; Wang, N. Precision agriculture—A worldwide overview. Comput. Electron. Agric. 2002, 36, 113–132. [Google Scholar] [CrossRef]
  5. Robert, P.C. Precision agriculture: A challenge for crop nutrition management. Plant Soil 2002, 247, 143–149. [Google Scholar] [CrossRef]
  6. Gebbers, R.; Adamchuk, V.I. Precision agriculture and food security. Science 2010, 327, 828–831. [Google Scholar] [CrossRef] [PubMed]
  7. Roy, D.P.; Wulder, M.A.; Loveland, T.R.; Woodcock, C.E.; Allen, R.G.; Anderson, M.C.; Helder, D.; Irons, J.R.; Johnson, D.M.; Kennedy, R.; et al. Landsat-8: Science and product vision for terrestrial global change research. Remote Sens. Environ. 2014, 145, 154–172. [Google Scholar] [CrossRef]
  8. Irons, J.R.; Dwyer, J.L.; Barsi, J.A. The next Landsat satellite: The Landsat data continuity mission. Remote Sens. Environ. 2012, 122, 11–21. [Google Scholar] [CrossRef]
  9. Czapla-Myers, J.; McCorkel, J.; Anderson, N.; Thome, K.; Biggar, S.; Helder, D.; Aaron, D.; Leigh, L.; Mishra, N. The ground-based absolute radiometric calibration of Landsat 8 OLI. Remote Sens. 2015, 7, 600–626. [Google Scholar] [CrossRef]
  10. Drusch, M.; Del Bello, U.; Carlier, S.; Colin, O.; Fernandez, V.; Gascon, F.; Hoersch, B.; Isola, C.; Laberinti, P.; Martimort, P.; et al. Sentinel-2: ESA’s optical high-resolution mission for GMES operational services. Remote Sens. Environ. 2012, 120, 25–36. [Google Scholar] [CrossRef]
  11. Yan, L.; Roy, D.P.; Zhang, H.; Li, J.; Huang, H. An Automated Approach for sub-pixel registration of Landsat-8 Operational Land Imager (OLI) and Sentinel-2 Multi Spectral Instrument (MSI) imagery. Remote Sens. 2016, 8, 520. [Google Scholar] [CrossRef]
  12. Houborg, R.; Fisher, J.B.; Skidmore, A.K. Advances in remote sensing of vegetation function and traits. Int. J. Appl. Earth Obs. Geoinf. 2015, 3, 1–6. [Google Scholar] [CrossRef]
  13. Kaufman, Y.J.; Tanre, D. Strategy for direct and indirect methods for correcting the aerosol effect on remote sensing: from AVHRR to EOS-MODIS. Remote Sens. Environ. 1996, 55, 65–79. [Google Scholar] [CrossRef]
  14. Vermote, E.F.; El Saleous, N.Z.; Justice, C.O. Atmospheric correction of MODIS data in the visible to middle infrared: First results. Remote Sens. Environ. 2002, 83, 97–111. [Google Scholar] [CrossRef]
  15. Asner, G.P. Biophysical and Biochemical sources of variability in canopy reflectance. Remote Sens. Environ. 1998, 64, 234–253. [Google Scholar] [CrossRef]
  16. Rouse, J.; Haas, R.; Schell, J.; Deering, D. Monitoring vegetation systems in the Great Plains with ERTS. In Proceedings of the Third ERTS-1 Symposium NASA SP-351, Washington, DC, USA, 10–14 December 1973; pp. 309–317.
  17. Tucker, C.J. Red and photographic Infrared linear combinations for monitoring vegetation. Remote Sens. Environ. 1979, 8, 127–150. [Google Scholar] [CrossRef]
  18. Tucker, C.J.; Townshend, J.R.G.; Goff, T.E. African land-cover classification using satellite data. Science 1985, 227, 369–375. [Google Scholar] [CrossRef] [PubMed]
  19. Myneni, R.B.; Keeling, C.D.; Tucker, C.J.; Asra, G.; Nemani, R.R. Increased plant growth in the northern high latitudes from 1981 to 1991. Nature 1997, 386, 698–702. [Google Scholar] [CrossRef]
  20. Fensholt, R.; Rasmussen, K.; Nielsen, T.T.; Mbow, C. Evaluation of earth observation based long term vegetation trends—Ntercomparing NDVI time series trend analysis consistency of Sahel from AVHRR GIMMS, Terra MODIS and SPOT VGT data. Remote Sens. Environ. 2009, 113, 1886–1898. [Google Scholar] [CrossRef]
  21. Olsen, J.L.; Stisen, S.; Proud, S.R.; Fensholt, R. Evaluating EO-based canopy water stress from seasonally detrended NDVI and SIWSI with modeled evapotranspiration in the Senegal River Basin. Remote Sens. Environ. 2015, 159, 57–69. [Google Scholar] [CrossRef]
  22. Peters, A.J.; Walter-Shea, E.A.; Ji, L.; Viña, A.; Hayes, M.; Svoboda, M.D. Drought monitoring with NDVI-Based standardized vegetation index. Photogramm. Eng. Remote Sens. 2002, 68, 71–75. [Google Scholar]
  23. Karnieli, A.; Agam, N.; Pinker, R.T.; Anderson, M.; Imhoff, M.L.; Gutman, G.G.; Panov, N.; Goldberg, A. Use of NDVI and land surface temperature for drought assessment: Merits and limitations. J. Clim. 2010, 23, 618–633. [Google Scholar] [CrossRef]
  24. Running, S.W.; Nemani, R.R.; Heinsch, F.A.; Zhao, M.; Reeves, M.; Hashimoto, H. A continuous satellite-derived measure of global terrestrial primary production. Bioscience 2004, 54, 547–560. [Google Scholar] [CrossRef]
  25. Gitelson, A.A.; Peng, Y.; Huemmrich, K.F. Relationship between fraction of radiation absorbed by photosynthesizing maize and soybean canopies and NDVI from remotely sensed data taken at close range and from MODIS 250m resolution data. Remote Sens. Environ. 2014, 147, 108–120. [Google Scholar] [CrossRef]
  26. Ruimy, A.; Saugier, B.; Dedieu, G. Methodology for the estimation of terrestrial net primary production from remotely sensed data. J. Geophys. Res. 1994, 99, 5263–5283. [Google Scholar] [CrossRef]
  27. Gitelson, A.A.; Kaufman, Y.J.; Stark, R.; Rundquist, D. Novel algorithms for remote estimation of vegetation fraction. Remote Sens. Environ. 2002, 80, 76–87. [Google Scholar] [CrossRef]
  28. Motohka, T.; Nasahara, K.N.; Oguma, H.; Tsuchida, S. Applicability of Green-Red Vegetation Index for remote sensing of vegetation phenology. Remote Sens. 2010, 2, 2369–2387. [Google Scholar] [CrossRef]
  29. Schneider, P.; Roberts, D.A.; Kyriakidis, P.C. A VARI-based relative greenness from MODIS data for computing the Fire Potential Index. Remote Sens. Environ. 2008, 112, 1151–1167. [Google Scholar] [CrossRef]
  30. Vermote, E.F.; Kotchenova, S. Atmospheric correction for the monitoring of land surfaces. J. Geophys. Res. Atmos. 2008, 113, 1–12. [Google Scholar] [CrossRef]
  31. Blackburn, G.A. Hyperspectral remote sensing of plant pigments. J. Exp. Bot. 2007, 58, 855–867. [Google Scholar] [CrossRef] [PubMed]
  32. Houborg, R.; Soegaard, H.; Boegh, E. Combining vegetation index and model inversion methods for the extraction of key vegetation biophysical parameters using Terra and Aqua MODIS reflectance data. Remote Sens. Environ. 2007, 106, 39–58. [Google Scholar] [CrossRef]
  33. Thenkabail, P.S.; Lyon, J.G.; Huete, A. Hyperspectral Remote Sensing of Vegetation; CRC Press: Boca Raton, FL, USA, 2011. [Google Scholar]
  34. Haboudane, D. Hyperspectral vegetation indices and novel algorithms for predicting green LAI of crop canopies: Modeling and validation in the context of precision agriculture. Remote Sens. Environ. 2004, 90, 337–352. [Google Scholar] [CrossRef]
  35. Broge, N.; Leblanc, E. Comparing prediction power and stability of broadband and hyperspectral vegetation indices for estimation of green leaf area index and canopy chlorophyll density. Remote Sens. Environ. 2000, 76, 156–172. [Google Scholar] [CrossRef]
  36. Candiago, S.; Remondino, F.; De Giglio, M.; Dubbini, M.; Gattelli, M. Evaluating Multispectral images and vegetation indices for precision farming applications from UAV images. Remote Sens. 2015, 7, 4026–4047. [Google Scholar] [CrossRef]
  37. Houborg, R.; McCabe, M.F. Adapting a regularized canopy reflectance model (REGFLEC) for the retrieval challenges of dryland agricultural systems. Remote Sens. Environ. 2016, 186, 105–120. [Google Scholar] [CrossRef]
  38. Landsat 8. Available online: http://landsat.usgs.gov/landsat8.php (accessed on 14 September 2016).
  39. Houborg, R.; McCabe, M.; Cescatti, A.; Gao, F.; Schull, M.; Gitelson, A. Joint leaf chlorophyll content and leaf area index retrieval from Landsat data using a regularized model inversion system (REGFLEC). Remote Sens. Environ. 2015, 159, 203–221. [Google Scholar] [CrossRef]
  40. Kotchenova, S.Y.; Vermote, E.F.; Matarrese, R.; Klemm, F.J. Validation of a vector version of the 6S radiative transfer code for atmospheric correction of satellite data. Part I: Path radiance. Appl. Opt. 2006, 45, 6762–6774. [Google Scholar] [CrossRef] [PubMed]
  41. Vermote, E.F.; Tanre, D.; Deuze, J.L.; Herman, M.; Morcette, J.J. Second simulation of the satellite signal in the solar spectrum, 6S: An overview. IEEE Trans. Geosci. Remote Sens. 1997, 35, 675–686. [Google Scholar] [CrossRef]
  42. Hsu, N.C.; Tsay, S.C.; King, M.D.; Herman, J.R. Aerosol properties over bright-reflecting source regions. IEEE Trans. Geosci. Remote Sens. 2004, 42, 557–569. [Google Scholar] [CrossRef]
  43. Houborg, R.; McCabe, M.F.; Gao, F. A Spatio-Temporal Enhancement Method for medium resolution LAI (STEM-LAI). Int. J. Appl. Earth Obs. Geoinf. 2016, 47, 15–29. [Google Scholar] [CrossRef]
  44. Wang, P.; Gao, F.; Masek, J.G. Operational data fusion framework for building frequent Landsat-like imagery. IEEE Trans. Geosci. Remote Sens. 2014, 52, 7353–7365. [Google Scholar] [CrossRef]
  45. Quinlan, R. Learning with continuous classes. In Proceedings of the 5th Australian Joint Conference on Artificial Intelligence, Hobart, Australian, 16–18 November 1992; pp. 343–348.
  46. Quinlan, R. Combining instance-based and model-based learning. In Proceedings of the Tenth International Conference on Machine Learning, Amherst, MA, USA, 27–29 June 1993; pp. 236–243.
  47. Moisen, G.G.; Freeman, E.A.; Blackard, J.A.; Frescino, T.S.; Zimmermann, N.E.; Edwards, T.C., Jr. Predicting tree species presence and basal area in Utah: A comparison of stochastic gradient boosting, generalized additive models, and tree-based methods. Ecol. Model. 2006, 199, 176–187. [Google Scholar] [CrossRef]
  48. Gleason, C.J.; Im, J. Forest biomass estimation from airborne LiDAR data using machine learning approaches. Remote Sens. Environ. 2012, 125, 80–91. [Google Scholar] [CrossRef]
  49. Walton, J.T. Subpixel urban land cover estimation: Comparing cubist, random forests, and support vector regression. Photogramm. Eng. Remote Sens. 2008, 74, 1213–1222. [Google Scholar] [CrossRef]
  50. Price, J.C. On the information content of soil reflectance spectra. Remote Sens. Environ. 1990, 33, 113–121. [Google Scholar] [CrossRef]
  51. Atzberger, C.; Darvishzadeh, R.; Immitzer, M.; Schlerf, M.; Skidmore, A.; le Maire, G. Comparative analysis of different retrieval methods for mapping grassland leaf area index using airborne imaging spectroscopy. Int. J. Appl. Earth Obs. Geoinf. 2015, 43, 19–31. [Google Scholar] [CrossRef]
Figure 1. Overview of the multi-sensor processing framework used for converting the Planet (P) RGB information into Landsat-8 (L) consistent estimates of atmospherically corrected NDVI. The integration of MODIS 250 data is needed to correct for changes in cover conditions occurring between the Planet and Landsat scene acquisitions when they are more than ~4 days apart. Specific details are provided in Section 2.3.
Remotesensing 08 00768 g001
Figure 2. (a) True color RGB imagery from Landsat-8 and Planet acquisitions two days apart. The insert in the Planet image is included to demonstrate the impact of pivot irrigation on the RGB signal; (b) Intercomparison of Landsat-8 NDVI and Planet NDVI computed from RGB imagery using Cubist regressions generated on the basis of Landsat-8 training data from DOY 320. The two white arrows highlight fields that have undergone significant change in cover conditions between the two acquisitions. Zoomed images are included to demonstrate the enhanced spatial detail achievable with Planet data.
Remotesensing 08 00768 g002
Figure 3. (a) Density scatter plot intercomparing Landsat-8 and Planet NDVI. The Planet NDVI at DOY 318 was estimated from multi-variate regression models using Landsat NDVI from DOY 320 as training data; (b) Normalized frequency distributions of the Landsat-8 and Planet NDVI using DOY 320 as the Landsat training base. Note that the Planet data have been resampled to 30 m resolution to facilitate a scale consistent intercomparison and statistic evaluation.
Remotesensing 08 00768 g003
Figure 4. (a) Landsat-8 NDVI on DOY 304 (top) and 320 (bottom); (b) Day-specific (i.e., interpolated) MODIS NDVI on DOY 304 (top) and 318 (bottom); (c) Planet NDVI on DOY 318 predicted on the basis of Landsat-8 NDVI from DOY 304. The bottom plot demonstrates the utility of using higher frequency MODIS data to inform the Cubist-based regression models when near-coincident Landsat and Planet acquisitions do not exist.
Remotesensing 08 00768 g004
Figure 5. (a) Density scatter plots intercomparing Landsat-8 and Planet NDVI. In the leftmost plot, Planet NDVI on DOY 318 was estimated from Cubist regression models using Landsat NDVI from DOY 304 as training data. In the rightmost plot, MODIS NDVI from DOY 304 and 318 were used to inform on the change in cover conditions occurring between the Landsat and Planet overpasses; (b) Normalized frequency distributions of the Landsat-8 and Planet NDVI using DOY 304 as the Landsat training base. Note that the Planet data have been resampled to 30 m resolution to facilitate a scale consistent intercomparison and statistic evaluation.
Remotesensing 08 00768 g005
Figure 6. Time-series of (a) 250 m resolution MODIS, (b) 30 m resolution Landsat-8, and (c,d) 3 m resolution Planet NDVI over a subset of the farm. In (c), NDVI was predicted on the basis of a near-coincident (i.e., within 0–5 days) Landsat acquisition that is indicated by a red boundary box (b). In (d), the Landsat-8 NDVI image used as training base is within 11–16 days of the Planet acquisition, and MODIS NDVI is used to inform on the change occurring over these timespans.
Remotesensing 08 00768 g006
Table 1. Acquisition details for the Planet (in italics) and Landsat-8 satellite images. DOY is the day of year, θsz is the sun zenith angle, θvz is the view zenith angle, and GSD is the ground sampling distance.
SatelliteDatesDOYTimeθsz (°)θvz (°)GSD (m)
Landsat-88 October 201528110:11 am36.37.530
Landsat-815 October 201528810:18 am37.64.830
Planet19 October 201529210:27 am30.13.22.6
Landsat-824 October 201529710:11 am40.97.430
Landsat-831 October 201530410:17 am42.34.930
Planet14 November 201531808:31 am45.06.33.0
Landsat-816 November 201532010:17 am46.64.930
Planet18 December 201535209:36 am47.72.43.0
Landsat-818 December 201535210:17 am52.14.930
Landsat-827 December 201536110:11 am53.17.430
Planet1 January 201600101:08 pm67.18.43.0
Table 2. Statistical metrics of the agreement in NDVI between four Planet acquisition days (PDOY) and near-coincident (i.e., left columns) Landsat-8 acquisitions (LDOY). Landsat NDVI close to (0–5 days) or further away (11–16 days) from PDOY was used to train the Cubist regression models. In the latter case, MODIS NDVI was used to inform on any change occurring between LDOY and PDOY. The statistics are based on Planet data resampled to 30 m, and are reported for the full set of data points (i.e., 99%) in addition to a reduced set incorporating 80% of the data.
PDOY:292318352001
LDOY:288281 *320304 *352336 *361352 *
99% incl.r20.9070.8430.9770.9570.9670.9180.9560.950
MAD0.0320.0430.0140.0190.0140.0240.0160.022
MAD (%)18.525.18.511.69.516.49.813.6
MBD (%)8.59.41.65.11.310.91.1−5.4
80% incl.r20.9930.9780.9980.9970.9950.9910.9910.987
MAD0.0100.0130.0050.0050.0020.0080.0060.011
MAD (%)7.311.13.94.54.67.74.99.1
MBD (%)1.43.10.2−0.20.55.41.0−7.6
* Predictions with the MODIS processing stream invoked (see Section 2.3.2 and Figure 1).
Table 3. Overall (i.e., Planet DOY 318, 352 and 001) NDVI prediction results on a cover specific basis. Results based on the Landsat-only (L8) and MODIS informed (M) processing streams are reported in separate columns (i.e., L8 and L8 + M). The statistics are based on Planet data resampled to 30 m, and are reported for the full set of data points (i.e., 99%). The number of pixel samples (n), and average NDVI and standard deviation of each cover type are also given.
All CoversAlfalfaGrassCornBare/Sparse
L8L8 + ML8L8 + ML8L8 + ML8L8 + ML8L8 + M
r20.9700.9410.9530.9410.9350.8740.9590.8920.7500.636
MAD0.0140.0210.0430.070.0480.0660.0330.0660.0090.013
MAD (%)9.213.79.515.57.810.711.222.08.712.1
MBD (%)1.33.71.48.5−2.5−1.03.114.51.40.58
NDVI0.16 ± 0.170.45 ± 0.270.62 ± 0.230.30 ± 0.240.10 ± 0.04
n401,90238,51611,1489660342,578

