1. Introduction
Crowdsourcing is a new term for an old, but increasingly important, concept: the completion of large projects by combining small distributed contributions from the public. Even though the term is not yet widely known, many crowdsourced products are widely used, such as Wikipedia, the online, user-contributed encyclopedia whose popularity—and perhaps even accuracy—rivals traditional reference materials [
1]. Within the scientific community, the crowdsourced statistical platform R is displacing traditional closed-source for-profit statistical packages [
2]. Crowdsourcing can refer to passive contribution of data—for instance the Google Maps traffic congestion layer that comes from location data sent by Android phones—or more active contributions.
When the goal of a crowdsourcing campaign is to promote and benefit from active public participation in research, the process is often called ‘citizen science’. Citizen science has a long tradition. The Audubon Society Christmas Bird Count has taken place every year since 1900, with an ever-growing geographical scope and number of participants [
3]. In recent years, public participation in the collection and analysis of data for scientific purposes has exploded [
4]. This growth is due, in part, to the proliferation of smartphones and tablets that are always on, close at hand, and perpetually networked. Perhaps the best known internet-based citizen science campaign has been the Galazy Zoo project [
5] in which volunteers are tasked with the classification of galaxy shapes. This is the type of task for which crowdsourcing is ideally suited—difficult for computers to reliably perform, but relatively easy for humans, perhaps requiring only a simple training module to learn. While Galaxy Zoo is typical in that it takes a micro-task approach, more macro-task approaches are possible. The FoldIt project uses volunteer labor to determine the three dimensional structure of proteins based on their nucleotide compositions [
6]. This task is more akin to a complicated game, like solving a Rubik’s Cube, that can be so time consuming that most volunteers do not complete even a single task. Rather, the project is driven forward by a small cadre of participants with exceptional geometric visualization abilities.
When the scope of a crowdsourced project is explicitly geographical, it is often called ‘volunteered geographical information’ (VGI). Perhaps the best-known VGI project is OpenStreetMap (OSM) [
7], an online, open-source mapping project in which the local knowledge of contributors is a key driver to its success. This work is somewhat intermediate between the micro-task and macro-task ends of the spectrum. Typical contributions involve mapping of geographical features such as street names, rivers, and footpath locations, among many others.
One promising area where VGI is so far underexploited is in applications of Earth observation, in particular for the collection of data for the training and validation of products derived from remote sensing [
8]. Geo-Wiki is one example of a VGI application for gathering training and validation data for improving global land cover maps [
9,
10]. To be useful for training and validation, the data provided by volunteers must correctly identify relevant landscape features. This is true of all VGI that is being used in further applications and, hence, there is a considerable body of literature surrounding the development of quality control measures and methods for VGI [
11,
12]. A recent trend in VGI quality studies has been in the development of indicators related to the contributors and filtering systems driven by user needs [
13,
14,
15]. Contributions to self-directed VGI campaigns, such as OSM, are often focused near volunteers’ homes [
16], but the relevance of local familiarity to campaigns centered on image classification micro-tasks is not well studied, although some distance-related effect may be expected based on the geographical literature. Tobler’s first law of geography states: “everything is related to everything else, but near things are more related than distant things” [
17]. This notion has proven relevant to studies across disciplines as diverse as botany [
18], hydrology [
19], politics [
20], and urban planning [
21]. As of August 2016, Tobler’s original paper had over 1290 peer-reviewed citations on Web of Science, but only three of those contain the search terms ‘crowdsourcing’ or VGI [
22,
23,
24]. These papers rely on Tobler’s Law as a theoretical underpinning, but none tests it in the context of VGI. One conference paper has addressed distance and image rating ability [
25], but we are unaware of any other study on this topic. Clearly, this is a fertile field for research.
In this paper, we investigate how factors like geographic distance, professional background, and familiarity of a landscape affect volunteer performance in a land-cover classification task. We also look at the impact of landscape familiarity on volunteer confidence in their ratings. These questions are answered using data from online land-cover classification games—developed as part of the Geo-Wiki set of tools—played by participants from around the world.
2. Materials and Methods
2.1. The Cropland Capture Game
The Cropland Capture game took place between November 2013 and May 2014. It has been described in detail elsewhere [
26], so we only outline it briefly here. Cropland Capture was a gamified image classification campaign in which volunteers were asked to determine whether a satellite image or ground-based photograph contains cropland within a demarcated region. Volunteers had the option to answer ‘yes’, ‘no’, or ‘maybe’ if they were uncertain or unable to tell. Players were awarded one point for answers that were correct, with correctness defined in terms of agreement with other volunteer ratings. Since the majority classification may be incorrect, particularly for difficult images, some forgiveness was built into the grading system. When between 20% and 80% of non-maybe volunteer ratings were in the ‘cropland’ category, answers of both ‘cropland’ and ‘no cropland’ were considered correct. In other words, points were deducted only when a volunteer disagreed with at least 80% of previous ratings of an image. When this criterion was met, one point was deducted from a volunteer’s score. Of the 108,367 images that received at least 10 volunteer ratings, only 8974, or 8.3% fell in the 20%–80% cropland rating range at the end of the competition. Responses of ‘maybe’ neither added to nor deducted from a volunteer’s score. While the competition period has ended, the game mechanics and interface can still be seen at the project website [
27].
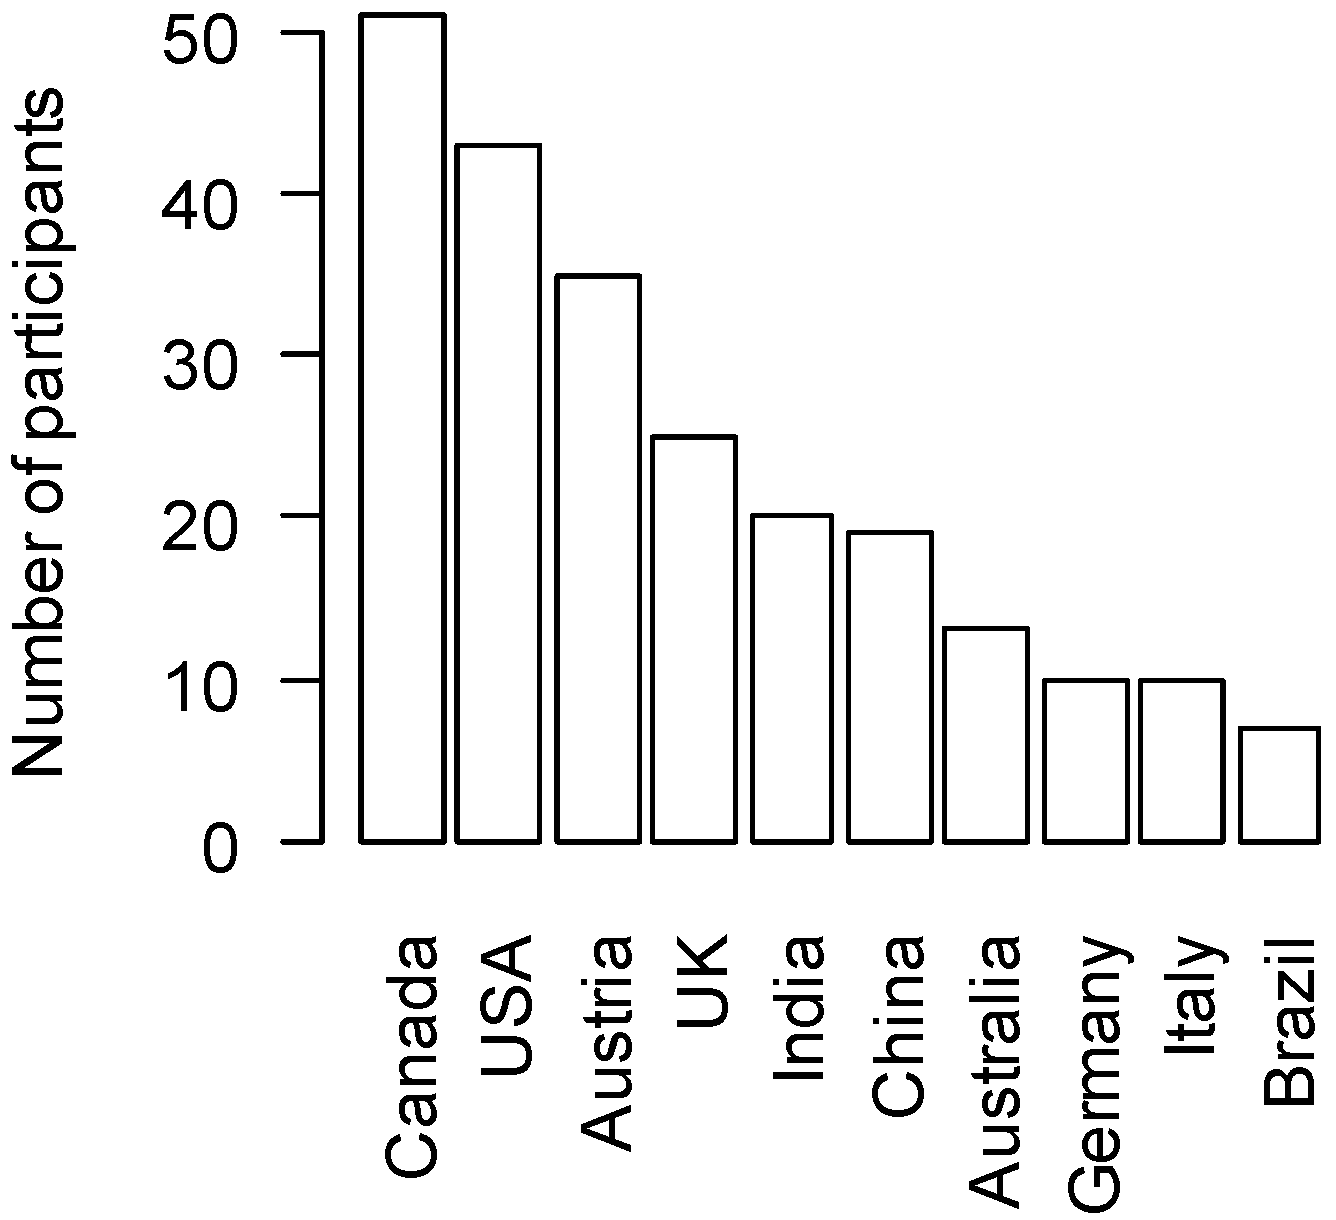
Volunteers taking part in Cropland Capture were asked to fill out a background questionnaire. Responses were voluntary, and we have no way to verify specific answers, but the overall response patterns were in line with demographics and our volunteer outreach efforts. Countries with large populations and places with widespread access to high-speed internet were well represented among the volunteers (
Figure 1). All of our outreach and publicity for the game took place in the English- and German-language media, and countries where those languages are widely spoken made up seven of the top 10 countries of volunteer origin (
Figure 1). However, a few responses were unlikely or completely impossible, and these were eliminated from the data analyzed. For instance, reported home countries included Antarctica, North Korea, and Bouvet Island, an uninhabited Norwegian territory in the south Atlantic.
As a basis for evaluating the quality of responses we used a metric we refer to as ‘crowd accuracy’, or simply ‘accuracy’ for short. Crowd accuracy is simply the proportion of a player’s ratings that agree with the crowd’s majority vote for a particular image. For calculating this metric, responses of ‘maybe’ and all images with a tied vote were omitted. Ideally, we would like to use an externally-validated metric that relies on expert-derived information beyond the ratings only of other players of the game. Unfortunately, decisions taken to optimize use of player contributions inadvertently made expert validation of players’ performance more data hungry than was practical for all but the most active volunteers [
28]. However, these difficulties are largely overcome by using the crowd accuracy metric as this measure shows strong positive correlations with other ways of measuring player performance [
26].
2.2. The Land Cover Game
A second data source was a Geo-Wiki campaign in which participants were asked to identify the land cover classes present within a satellite image and estimate the percentage of the image occupied by each class. The potential classes were tree cover, shrub cover, herbaceous vegetation or grassland, cropland, regularly flooded or wetland, urban, snow and ice, barren, and open water. Participants were also asked to rate how confident they were of their classifications on a four-point ordinal scale. This campaign differed from the Cropland Capture game in that it was implemented in the Google Earth API. This allowed users to pan and zoom to explore micro- and macro-scale features of the landscape to help make their determinations. During 2012, participants in an international summer school for PhD students were asked to list places in the world where they had lived and were familiar with the landscape. Each student was given images to evaluate that were roughly mixed between familiar and unfamiliar places. A total of 12 students took part in this exercise, and contributed 1516 ratings of 624 unique images. Since the students came from many parts of the world, what was a familiar location for one student was unfamiliar for most others.
2.3. Statistical Analysis—Cropland Capture
User accuracy on images from their home country or continent vs. other areas was compared using two-tailed binomial tests with the user as the level of replication. These tests essentially ask if individual users’ image classification accuracy rates were higher at home than in other areas significantly more frequently than expected by chance alone. While this analysis only included participants who had rated at least 1000 images, sample size was still sometimes a consideration, particularly at the country level for players from countries with small land areas (the game did not take a user’s country of origin into account when assigning particular images). To ensure that these results were not biased by small sample sizes or arbitrary cutoffs, we applied two different minimum thresholds, 10 and 50 images, for the number of home-country images rated in order to be included in this analysis. This and all subsequent analyses were performed using R version 3.0.2 (R Foundation for Statistical Computing, Vienna Austria).
We assessed user accuracy as a function of distance from home in three different ways. The first was great-circle distance between a volunteer’s home and the image location. To compute this distance, we first determined the approximate latitude and longitude of the center of the city where the volunteer reported living. We then calculated the distance between this location and each point the volunteer had rated using the haversine formula [
29]. The other two metrics were absolute latitude and longitude difference between a user’s home and the point. Our logic for using these metrics was that they may reflect different components of the biophysical and cultural familiarity of a landscape. Latitude difference would reflect differences in user familiarity with boreal, temperate, or tropical landscapes, while longitude difference may have a bearing on the cultural similarities between familiar land-use practices and those depicted in the game images.
Our first analyses of these response variables were generalized linear models (GLM) of correctness as a function of distance measured in the three ways described in the previous paragraph. Since the response variable was simply whether a classification was correct (1) or incorrect (0), all models (including those described below) used a binomial error model with a logit link. This simple regression approach is not a perfect fit to the data due to the non-independence among data points—each user performed many ratings and most points were evaluated by many volunteers. To ensure that this confounding factor did not lead to false results, we re-ran the distance models as linear mixed models with random effects specified for either volunteer or point. Generalized linear models with logit links were also applied to analyses of the interactions between distance of a point from a volunteer’s home and other variables: professional background and whether a volunteer lived in a western (North America, Europe and Oceania) or non-western (Asia, Africa and Latin America) country. These and all other analyses were performed using the R package ‘lme4’ [
30].
The impact of professional background on rating reliability was evaluated in two different ways. First, differences among volunteers as a function of self-reported career category were assessed using one-way ANOVA. The relative distance-based effects (see previous paragraph) among volunteers with a remote sensing or land cover (RS/LC) background were compared to other volunteers by adding an interaction term between distance and a dummy variable for RS/LC professionals to the GLM.
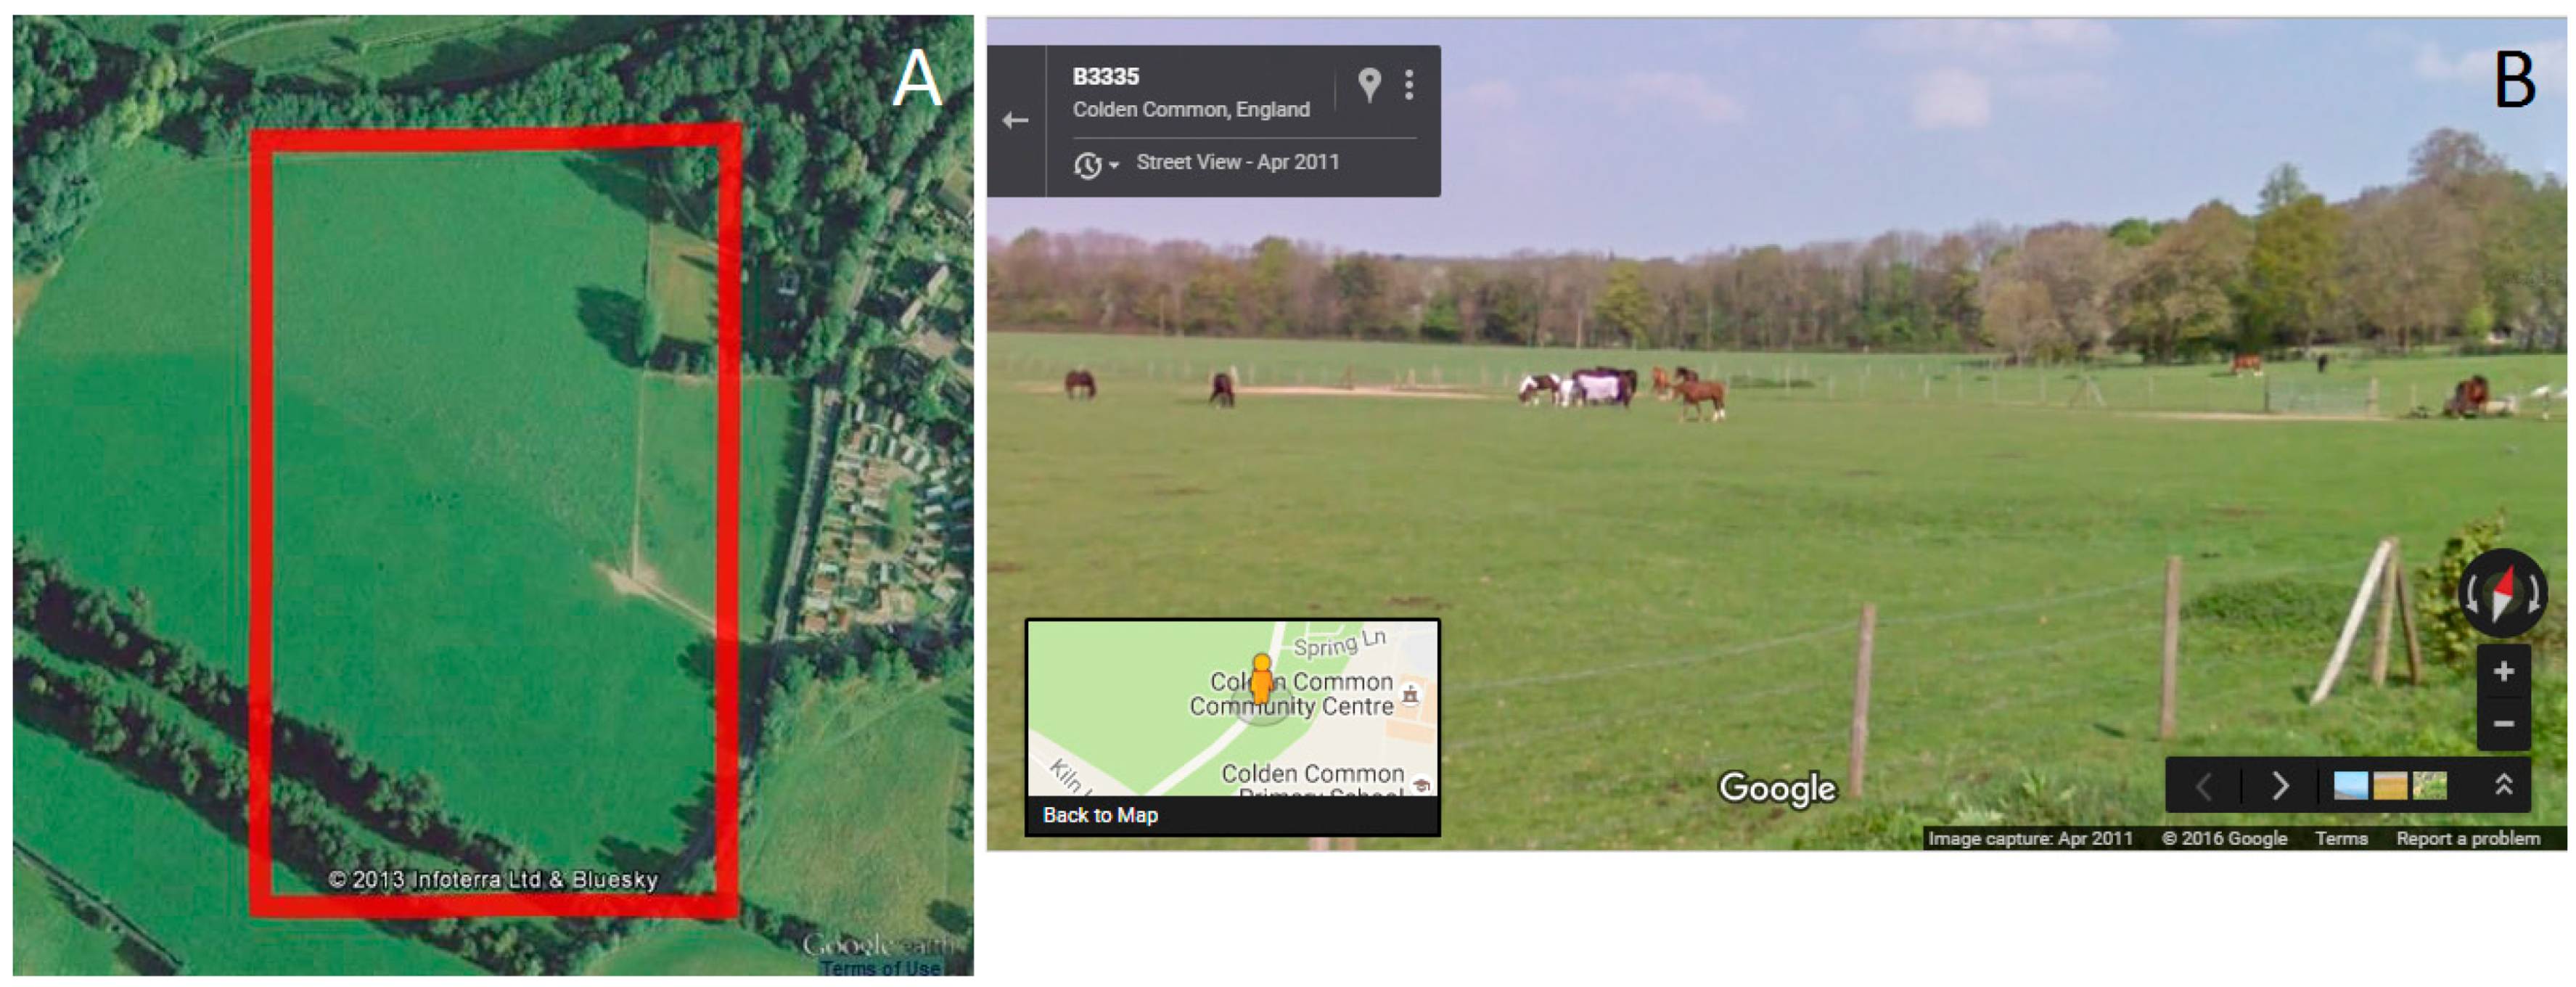
To test more specifically the effect of specialized local knowledge on image classification performance we took advantage of a subset of images within the Cropland Capture game that were extremely tricky for most participants to classify correctly. These images came from Ireland and western Great Britain where pastures are commonly bounded by rock walls or hedgerows. As seen in satellite imagery, this landscape is characterized by bright green geometrically-patterned patches. To most eyes, this looks like cropland in spite of not fitting the provided definition. We manually examined all satellite images in the game coming from the region bounded by longitudes 11°W and 1°W and latitudes 50°N and 55°N. This region covers the entire island of Ireland, all of Wales, western England, and Southwestern Scotland. Of these images, we selected 84 that many participants rated as containing cropland, but could be confirmed to contain no cropland. The confirmation was done with the aid of Google Earth and Street View. An example of such an image is shown in
Figure 2. We tested the hypotheses that volunteers from Britain and Ireland would be better at correctly identifying these images as non-cropland than players from other places using a two-tailed exact binomial test. We also tested whether British and Irish players would be more likely to express uncertainty by rating these images as ‘maybe’ using the same statistical test.
User response speed was assessed using timestamps associated with each rating. Since the server tended to cluster timestamps in approximately 10 s intervals, the individual differences among timestamps could not be directly analysed. However, when averaged, the differences between successive timestamps give an accurate indication of the mean response time of an individual volunteer. To avoid skewing means with large values that indicate a volunteer taking a break rather than answering slowly, we omitted all values >300 s, a value beyond which the response time distribution for similar tasks has been shown to break down [
31]. Since individual volunteers’ mean response times were non-normally distributed, we tested for differences between remote sensing specialists and volunteers with other backgrounds using a Mann-Whitney-Wilcoxon U test.
2.4. Statistical Analysis—Land Cover Game
The land cover game involved answering several questions about an image, including the dominant land-cover types present and their cover percentages. Participants were also asked to evaluate their confidence about particular images using an ordinal scale, with four possible responses, ‘sure’, ‘quite sure’, ‘less sure’, and ‘unsure’. These responses were internally stored as the numbers 0, 10, 20, and 30, respectively. To test whether volunteers were more confident in their responses to tasks in familiar regions, we used a bootstrapping procedure known as a ‘permutation test.’ In this test, the confidence responses were randomly reassigned among the images. The mean of the newly-randomized uncertainty scores was then calculated for the familiar and unfamiliar locations. The randomization procedure was repeated 10,000 times. This process maintains the same distribution of scores while allowing calculation of the variability in the mean of the familiar and unfamiliar locations’ confidence levels assuming they are drawn from the same distribution. The proportion of randomizations that resulted in group-level means with a bigger difference than the observed difference between the familiarity groups’ means is an estimate of the probability of results more extreme than observed resulting from chance alone when the groups are drawn from identical distributions.
Since user-reported uncertainty is on an ordinal scale, there is no completely objective method of converting the responses into a numerical scale. To increase confidence in our results, we performed a sensitivity analysis by re-running the analysis described above with different numerical values assigned to the four responses on the sure-unsure scale. In these sensitivity analyses, the endpoints of the scale retained the same values, 0 for ‘sure’ and 30 for ‘unsure’. The intervening two values were changed to represent different scenarios of dispersion and skew among the certainty levels. Under these scenarios, the values for the ‘quite sure’ and ‘less sure’ responses were 5 and 10, 20 and 25, 5 and 25, and 12.5 and 17.5.
3. Results
3.1. National and Continental Familiarity—Cropland Capture
Volunteers showed small, but significant, differences in classification accuracy between their home country and other countries. Of the 253 volunteers who rated at least 1000 points and at least 10 points in their home country, mean accuracy was 92.12% at home and 91.41% in other countries. Although small, this difference was statistically strong (two-tailed binomial test, 146 successes on 253 trials, p = 0.017). When more stringent cutoffs were used (a minimum of 50 points in the home country, limiting the sample to 145 volunteers), the small home country advantage persisted (92.51% at home vs. 92.05% away), however, its statistical strength disappeared (two-tailed binomial test, 77 successes on 145 trials, p = 0.507). This pattern was even weaker for ratings in volunteers’ home continents vs. other continents. The 337 volunteers with at least 1000 total ratings averaged 91.35% agreement for images from their home continent and 91.30% on other continents (two-tailed binomial test, 175 successes on 337 trials, p = 0.513).
3.2. Distance-Based Familiarity—Cropland Capture
Classification accuracy decreased slightly with distance of the image location from a volunteer’s home. This pattern persisted regardless of whether great circle distance, latitude difference, or longitude difference was used, but the statistical significance of the pattern depended on how it was measured and what random effects were included in the model. When measured along a great circle, accuracy decreased significantly with distance from home (GLM results in
Table 1). Similar patterns were seen for both latitude (
Table 1) and longitude difference between a player’s home location and image locations (
Table 1). Volunteers from western and non-western countries showed similar patterns of slightly reduced accuracy with distance from home (
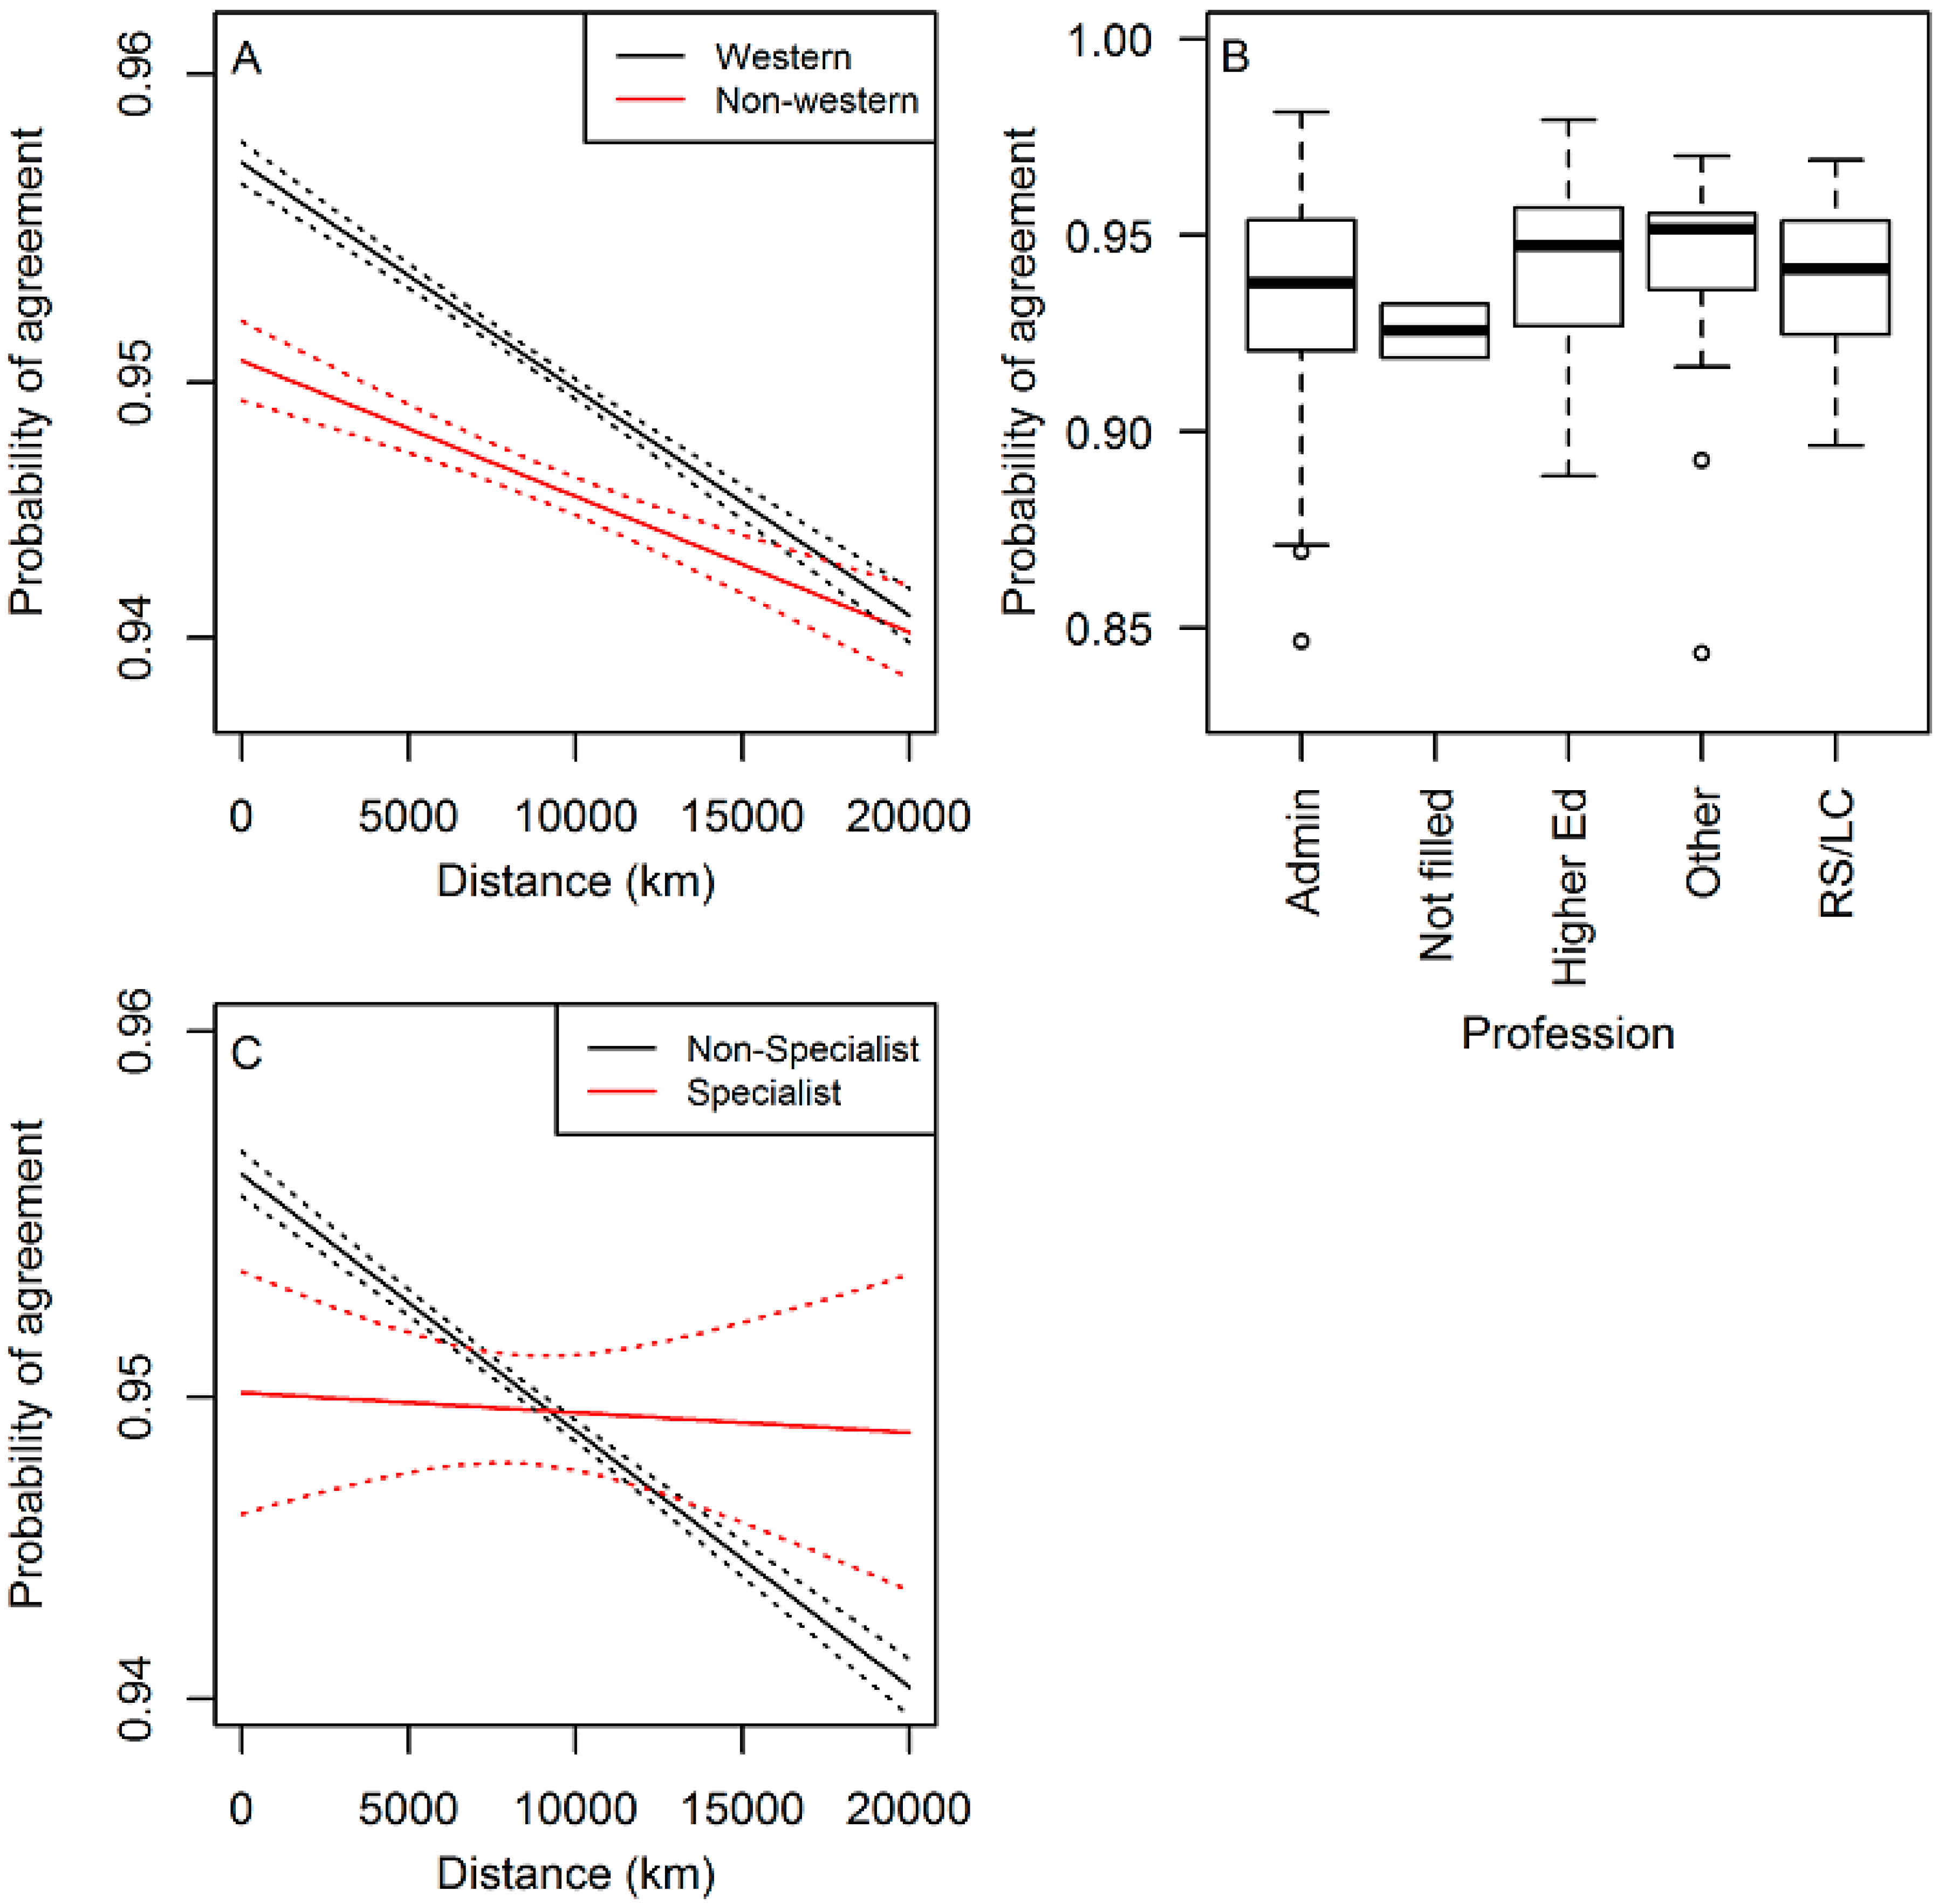
Figure 3A). Due to the binomial response model used in these analyses, standard measures of model fit, like R
2, are not easily interpreted. However, the narrow range of fitted values seen in
Figure 3 gives an indication of the relatively weak explanatory power of these models. Since most individual ratings agreed with the crowd majority vote, predicted agreement probability varied little (note the small ranges on the y-axes in
Figure 3). When random effects were included for images, the results showed little change (
Table 1). However, when random effects for volunteers were included, coefficients for distance measures shrank and model p-values increased; for latitude and longitude differences traditional cutoffs for significance were no longer met (
Table 1).
3.3. Local Knowledge in a Confusing Landscape—Cropland Capture
A total of 3096 ratings of images showing pastures superficially similar to cropland in western Britain and Ireland were completed by players whose home country was known. Of these, 128 ratings were performed by players whose home was in the Republic of Ireland or the United Kingdom (
Table 2). Players from these countries were no more likely than players from other countries to correctly rate these images as non-cropland (two-tailed binomial test,
p = 0.443). Similarly, Irish and British players were no more likely to express uncertainty by using the ‘maybe’ rating than other players (two-tailed binomial test,
p = 0.505;
Table 2).
3.4. Professional Background—Cropland Capture
Volunteers in the Cropland Capture game showed no direct pattern of work quality as a function of professional background. Among users with >1000 points rated, there was no significant difference among professions (ANOVA,
F(4) = 1.1151,
p = 0.349). Users with a background in remote sensing or land cover had an average rate of agreeing with the crowd (
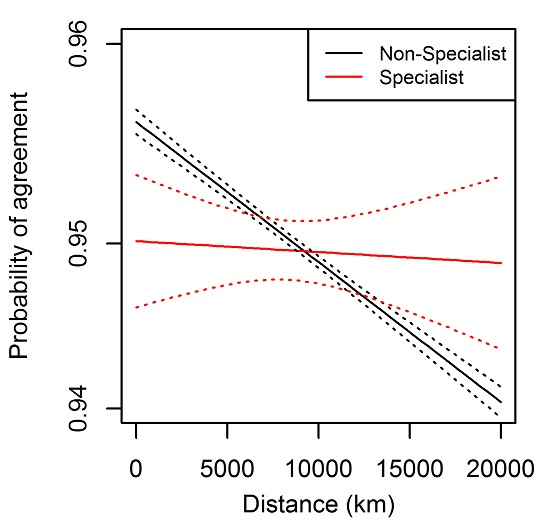
Figure 3B). Similarly, a logit-linked GLM assessing how well a professional background in remote sensing or land cover predicted agreement with the volunteer majority vote showed no relationship (full results not shown). A separate model with an interaction term between professional background (non-specialist vs. specialist in remote sensing or land cover background) and distance from home to the image location showed that the non-specialists actually performed slightly better than specialists near home (
Table 3;
Figure 3C). This advantage decreased with distance from home; non-specialist performance decreased with distance, but specialists maintained similar performance regardless of distance from home (
Table 3;
Figure 3C). As in the analysis combining all professions (
Figure 3C), the magnitude of this distance-based trend was very small. Volunteers with a remote sensing or land cover background worked faster than other volunteers. Average response time was 2.248 s among 10 RS/LC specialists and 2.712 s for 52 other volunteers. However, these numbers were quite variable among participants and the difference between the two groups was statistically weak (unpaired two-tailed Mann-Whitney test, U = 212,
p = 0.363).
3.5. Volunteer Confidence—Land Cover Game
Volunteers were more confident in their ratings in familiar regions. The mean uncertainty score was 6.24 for images from familiar areas, and 8.89 in unfamiliar areas. The permutation test revealed strong statistical support for this difference; all 10,000 randomizations of the uncertainty scores resulted in differences between the group-level means that were smaller than observed in the un-randomized data. The sensitivity analysis showed these results to be robust to changes in the numbers assigned to the ordinal uncertainty scores; in all scalings of the data, all 10,000 randomizations resulted in mean differences smaller than the observed difference.
4. Discussion
This paper has tested an idea analogous to Tobler’s Law [
17]—that land-cover classification tasks are easier when they are from closer to the home of the person doing the classification. Our results have found support for this notion in some circumstances, but the magnitude of the effect is so small that, at least for cropland detection, it is unlikely to be of much practical importance for future design of global classification tasks. Similar trends toward decreasing accuracy with distance were seen whether the response variable was the home country vs. other countries or simply the linear distance from one’s home. Even when particularly tricky Irish and British pasturelands were singled out for evaluation, residents of those areas showed no advantage. When home vs. other continent, latitudinal or longitudinal distance were used as response variables, trends were all in the same direction, although non-significantly so. These findings are congruent with the results of the only other study we are aware of looking at distance effects in VGI [
25], which analysed Geo-Wiki data from the first human impact campaign that was run in 2011 [
32]. They found that the relative odds of participants correctly choosing the right land cover decreased by 2% per 1000 km distance from the participant’s home location, with little difference between land cover types. Yet location and local knowledge have been found to be relevant in studies of other types of tasks. A comparison of the contributions of local volunteers in classifying road types from imagery with professional surveyors found that the accuracy increased from 68% to 92% when the data were collected by the local volunteers [
33]. OpenStreetMap is built on the idea that local knowledge is of fundamental importance in contributing and tagging features [
34] yet many humanitarian mapping exercises use remote mappers to provide rapid information for response teams. A recent study compared the results from remote mappers with local mappers in terms of how well they digitized buildings in Kathmandu [
35]. The results showed that the remote mappers missed around 10% of buildings and that there were issues with positional accuracy. These two latter examples were focussed on data collection in a small area where the effect of local knowledge may simply have much more influence than on the worldwide classification data presented here. From a design perspective, there appears to be little need to geographically target the tasks to individuals in closer proximity to the task location for these types of global data collection exercises.
Professional background has little first-order relationship with task accuracy, although it apparently interacts with distance, suggesting that the distance effects described above may be common among the general population, but do not apply to remote sensing specialists. In contrast, a study of the Geo-Wiki database found relative odds of correctly predicting land cover around 1.7 times larger for experts when compared to non-experts in remote sensing [
25]. This may be because the Geo-Wiki human impact campaign involved more detailed identification of all land cover types while Cropland Capture focussed on only one type, so it was a much simpler task. This points toward a widely accepted axiom of game design, that simpler tasks require less training.
Interestingly, self-rated confidence of responses in a small experiment involving students increased in familiar landscapes. While this was not an idea we could test on the large dataset used for the rest of our analyses, it suggests that confidence (or lack thereof in unfamiliar regions) has little to do with actual performance—confidence varied much more than did actual task performance. In contrast, the relative odds of correctly classifying the land cover was twice as high for confident volunteers compared to non-confident ones in the same Geo-Wiki study cited above [
25]. Again, this may relate to the increased task difficulty, and should motivate keeping tasks as simple as possible while preserving meaningful scientific use.
The volunteer participants in this study somewhat over-represent western industrialized countries of North America and Europe (
Table 1). This is a common pattern found in many citizen science intiatives [
36] and likely has several explanations, including the targeting of our media outreach, English as the language of the application and the availability of high-speed internet connections. Regional mis-representation could potentially explain some of our results. Smallholder and subsistence agriculture are more common in non-western countries, so participants from those areas might enjoy an advantage in recognizing these types of farming. Conversely, the large-scale mechanized agriculture typical of industrialized countries and its geometrically-patterned landscapes should be relatively easy for anyone to identify. This possibility is congruent with the slightly stronger distance-based effects we observe among volunteers from industrialized nations (
Figure 3A). However, Asia and Latin America, but not Africa, still had substantial representation among the participants. This, combined with the quite small impact of distance-based effects, supports the conclusion that the overall impact of regional effects on our results was minimal.
In spite of the small magnitude of the location-based effects we observed, finer-grained local knowledge may still play a role in volunteer task performance. For instance, the result that British and Irish volunteers are no better than others at recognizing the unique pasture landscapes in their region may be due, in part, to combining urban and rural residents for this analysis. It is possible that rural residents of these countries, particularly those in areas were grazing is commonplace, would be better at this task than urban residents. Unfortunately, our data was insufficient to parse this possibility. Similarly, rural residents of non-western countries may be quite adept at identifying local agricultural patterns, a phenomenon difficult to detect in our worldwide database. Bias in participation in urban areas is a pattern strongly identified in other geographical crowdsourcing applications such as OpenStreetMap [
37]. It would be interesting to test whether differences in urban-rural knowledge have an effect on the accuracy of classification tasks related to cropland if targeted recruitment strategies can be incorporated into future campaigns.
The response variable used in part of our study (the rate classification agreement with the majority of other users) may reasonably be questioned as a metric of use performance [
26]. However, we believe that it still provides a useful assessment of the impact of local knowledge on response quality. A previous study using this data has shown that for the vast majority of tasks, there is little disagreement between volunteers and experts. Even for the tiny proportion of the hardest points, the crowd agreed with experts nearly 80% of the time [
28]. Thus, the volunteer majority is correct in the vast majority of cases, providing a robust comparison for the distance- and region-based analyses in this study. This previously-observed difference in agreement with experts between easy and hard points is of a magnitude that dwarfs the variation in performance with distance or country demonstrated in this paper. Thus, the inherent difficulty of a task appears much more important for predicting classification correctness than any trait of individual volunteers that we assessed. Distance, country, and profession have truly tiny effects in comparison. However, it would be interesting to evaluate volunteer performance in a smaller geographical region where the effect of local knowledge may be much more relevant.


