Article

Near Real-Time Browsable Landsat-8 Imagery

1
Global Earth Observation and Data Analysis Centre, National Cheng Kung University, No. 1 Ta-Hsueh Road, Tainan 701, Taiwan
2
Department of Earth Sciences, National Cheng Kung University, No. 1 Ta-Hsueh Road, Tainan 701, Taiwan
3
Information Technology Research Institute, National Institute of Advanced Industrial Science and Technology, Tsukuba 305-8568, Japan
4
Debris Flow Disaster Prevention Center, Soil and Water Conservation Bureau, Council of Agriculture, Nantou 54044, Taiwan
5
Hsinchu Forest District Office, Forestry Bureau, Council of Agriculture, The Executive Yuan, Hsinchu 30046, Taiwan
*
Author to whom correspondence should be addressed.
Submission received: 9 October 2016 / Revised: 23 November 2016 / Accepted: 6 January 2017 / Published: 16 January 2017

Abstract

:
The successful launch and operation of Landsat-8 extends the remarkable 40-year acquisition of space-based land remote-sensing data. To respond quickly to emergency needs, real-time data are directly downlinked to 17 ground stations across the world on a routine basis. With a size of approximately 1 Gb per scene, however, the standard level-1 product provided by these stations is not able to serve the general public. Users would like to browse the most up-to-date and historical images of their regions of interest (ROI) at full-resolution from all kinds of devices without the need for tedious data downloading, decompressing, and processing. This paper reports on the Landsat-8 automatic image processing system (L-8 AIPS) that incorporates the function of mask developed by United States Geological Survey (USGS), the pan-sharpening technique of spectral summation intensity modulation, the adaptive contrast enhancement technique, as well as the Openlayers and Google Maps/Earth compatible superoverlay technique. Operation of L-8 AIPS enables the most up-to-date Landsat-8 images of Taiwan to be browsed with a clear contrast enhancement regardless of the cloud condition, and in only one hour’s time after receiving the raw data from the USGS Level 1 Product Generation System (LPGS). For any ROI in Taiwan, all historical Landsat-8 images can also be quickly viewed in time series at full resolution (15 m). The debris flow triggered by Typhoon Soudelor (8 August 2015), as well as the barrier lake formed and the large-scale destruction of vegetation after Typhoon Nepartak (7 July 2016), are given as three examples of successful applications to demonstrate that the gap between the user’s needs and the existing Level-1 product from LPGS can be bridged by providing browsable images in near real-time.

Graphical Abstract

1. Introduction

The Landsat program is the longest running project for the acquisition of space-based moderate-resolution land remote sensing data [1]. It can be traced back to 1972, with the Earth Resources Technology Satellite, that was eventually renamed Landsat [2]. After four decades of relayed operation, the most recent satellite, Landsat 8, was successfully launched on 11 February 2013. The instruments on the Landsat satellites have acquired millions of images, which are a unique resource for global climate change research and applications in agriculture, cartography, geology, forestry, regional planning, surveillance, and education. Since the onboard recorder on the satellite might lose some capacity or fail completely in some cases, United States Geological Survey (USGS) initiated the Landsat International Cooperator Network (LICN) that is able to receive a direct downlink of data from the spacecraft to respond quickly to any emergency data needs [3]. This model meets local and regional user needs and provides the best user experience possible. As of March 2016, a total of 17 active ground stations are fully operational for Landsat-8 data receiving and distribution. Another station is also under construction while others are being upgraded to carry out the same functions. Figure 1 shows the locations of all active ground stations. The circles show the approximate area over which each station has the capability for direct reception of Landsat data.
USGS provides each ground station the Level 1 Product Generation System (LPGS) with source code and technical documents. By using LPGS, all the raw data received from the spacecraft can be processed to level-1 product type. Although the same product can be downloaded from several USGS web sites directly at no charge within 24 h of being received, a ground station equipped with an LPGS is able to respond more quickly to any emergency data needs and serve the user community without a latency of several hours. The general public, however, expect much more than the level-1 product that is processed and stored at the ground station. Such users generally have specific regions of interest (ROI), and like to be informed immediately once new images of their ROIs are available. They also like to view these new images from anywhere and by using various kinds of platforms, soon after they receive the related notifications. All these considerations are challenges to the processing and distribution of Landsat-8 data.
Similar to the Worldwide Reference System (WRS) used in cataloguing Landsat data, Formosat-2 has been operating in a daily revisit orbit ever since its successful launch in 2004, so that each accessible scene can be systematically observed from the same angle under similar illumination conditions [4]. To fully exploit the advantages of Formosat-2 daily-revisit imagery and meet the requirement of serving as an image application and distribution center, the Formosat-2 automatic image processing system (F-2 AIPS) was developed [5] and implemented in 2005. F-2 AIPS is able to digest raw data in the Gerald format, apply the basic radiometric and geometric correction, output the level-1A product, conduct rigorous band-to-band coregistration [6], automatic orthorectification [7], multi-temporal image geometrical registration [8], multi-temporal image radiometric normalization [9], Spectral Summation Intensity Modulation pan-sharpening [6], edge enhancement and adaptive contrast enhancement, the absolute radiometric calibration [10], as well as the superoverlay output for displaying on the Google Earth platform [11]. Experience acquired from F-2 AIPS motivated us to develop a Landsat-8 automatic image processing system (L-8 AIPS) that is able to process and share near-real-time Landsat-8 imagery via the internet.

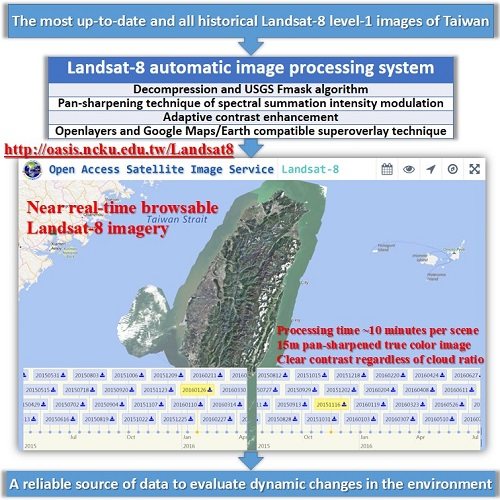
2. Landsat-8 Automatic Image Processing System

Based on the LPGS level-1 product, L-8 AIPS employs a set of techniques to prepare browsable images and publish them on the World Wide Web in the format of image tiles, with the aim of bridging the gap between the user’s needs and the existing Level-1 product from LPGS. The Level-1 product from LPGS is consistent with all standard Level-1 data products created using Landsat 1 to Landsat 7 data. A rigorous orthorectification process is conducted by incorporating ground control points and Digital Elevation Models (DEM) from the GLS2000 data set [12]. The geographic extent of each scene is slightly different, depending on the coverage of the WRS grid. L-8 AIPS is written in Interactive Data Language (IDL®) using some of Environment for Visualizing Images (ENVI®) library of built-in routines. It is currently installed on an ordinary PC-based server equipped with an Intel® Core™ i7-4790K (4.0-GHz) CPU (ASUS, Taipei, Taiwan), as well as a regular solid state disk. To give an idea of the required computer resources to operate L-8 AIPS, we use the scene (ID: LC81180442016234LGN00) as an example to list the processing time of each step in Table 1 for reference. A detailed description of each processing step is provided, as follows.

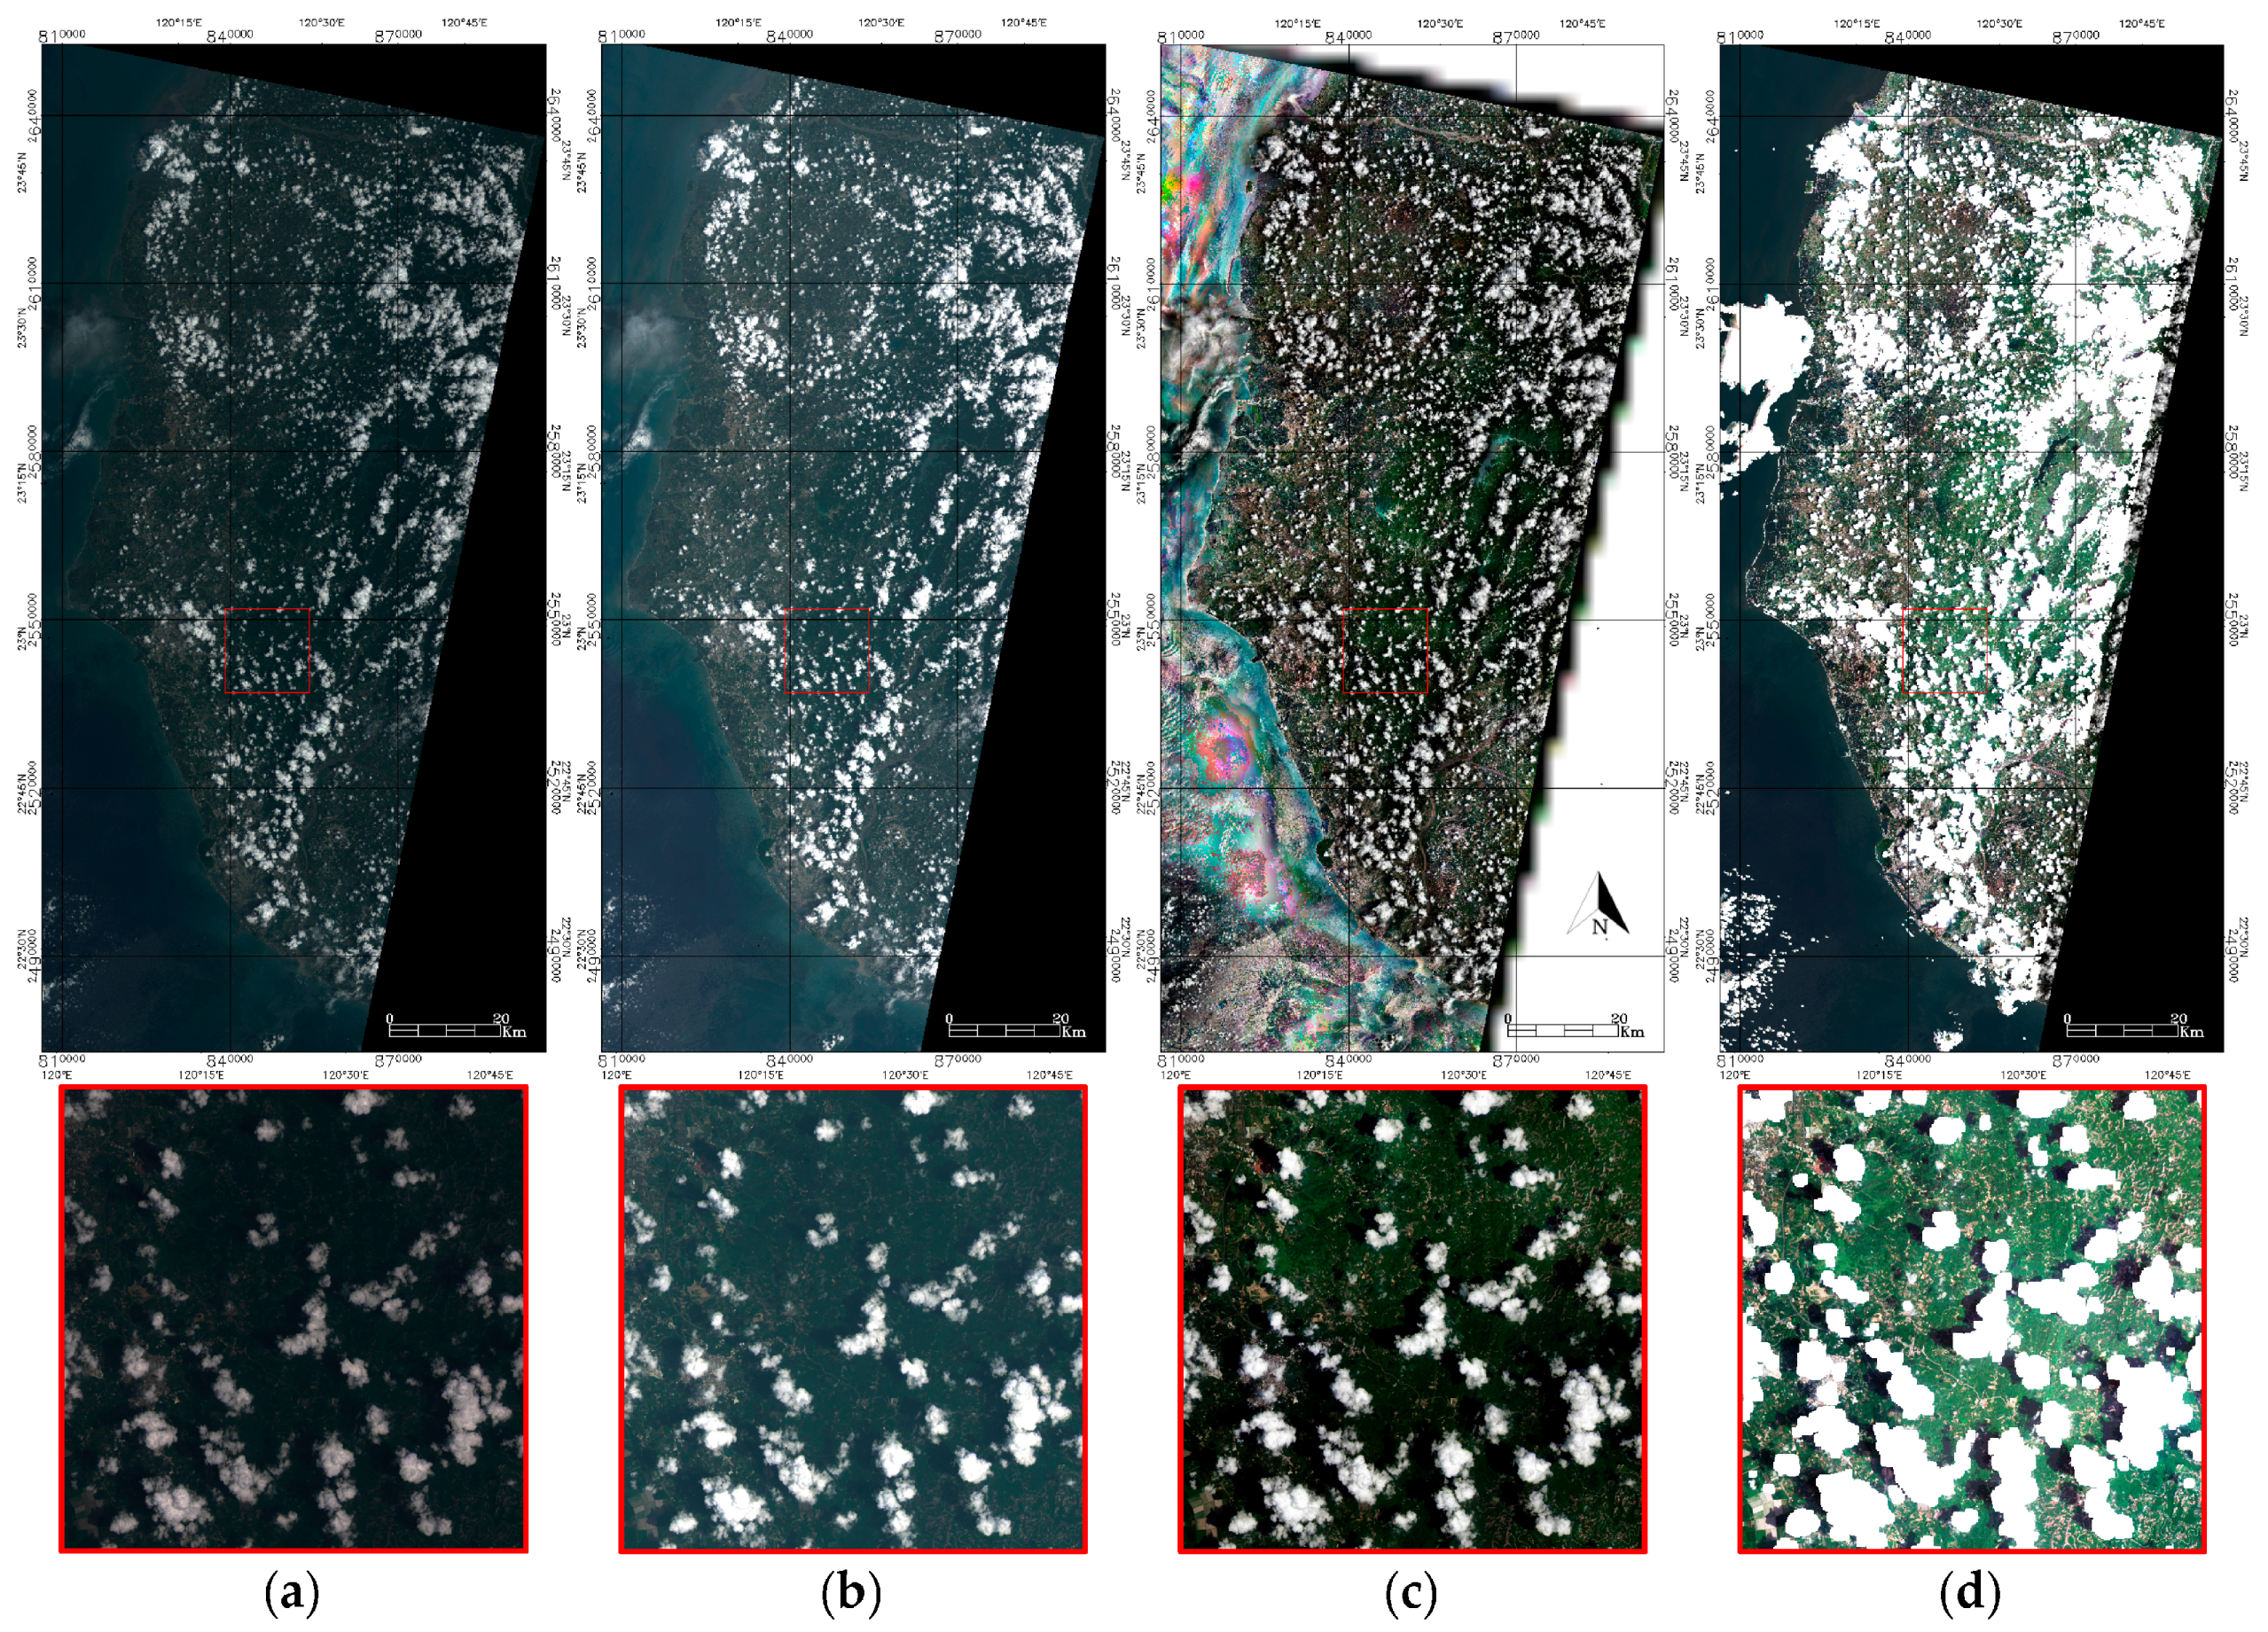
2.1. Decompression and USGS Fmask Algorithm of Cloud, Shadow, Snow, and Water Masks

The standard level-1 product of Landsat-8 can be obtained from any LPGS or downloaded from USGS directly as a compressed tar file with a size of approximately 1 Gb per scene. After decompression, the images recorded at eleven spectral bands are saved separately in eleven files (GeoTiFF format) with a unified spatial resolution of 30 m, except for the panchromatic band (band 8) that has the highest resolution of 15 m. To identify clouds, shadows, snow, and water before any kind of remote sensing activity is performed, Zhu et al. [13] employed rules of cloud physical properties to separate potential cloud and clear-sky pixels. Together with the combination of normalized temperature probability, spectral variability probability, and brightness probability, they developed a new algorithm called Fmask (Function of mask) to derive the potential cloud layer, with an accuracy as high as 96.4%. In addition to clouds, Fmask also provides shadow, snow, and water masks that are suitable for routine usage with Landsat images. After taking advantage of the new cirrus band, Fmask is further improved to achieve better detection of thin cirrus clouds, even without any input from thermal bands [14].
The C version of Fmask is made available by Earth Resources Observation and Science (EROS) Center of the U.S. Geological Survey (https://code.google.com/p/cfmask/). Version 3.3 of the Windows standalone software of Fmask was downloaded from https://github.com/prs021/fmask (browsed on 2 July 2016) and incorporated into L-8 AIPS. Note that all pixel buffer values are set to those default values suggested by USGS (3, 3, 0 for cloud, shadow, and snow, respectively), and the cloud probability threshold is set to 22.5% to get the best overall accuracy. All eleven bands are resampled to the same resolution (15 m) using the nearest-neighborhood method and stacked into one file (ENVI format). The required time is approximately 52.51 s for Fmask processing and 40.17 s for decompression/stacking per standard scene, using our PC-based server. For practical applications, such as the case of Taiwan, all scenes acquired from the same path during the same day are mosaicked into one file before further processing. Likewise, the results of Fmask processing are also mosaicked into one file.

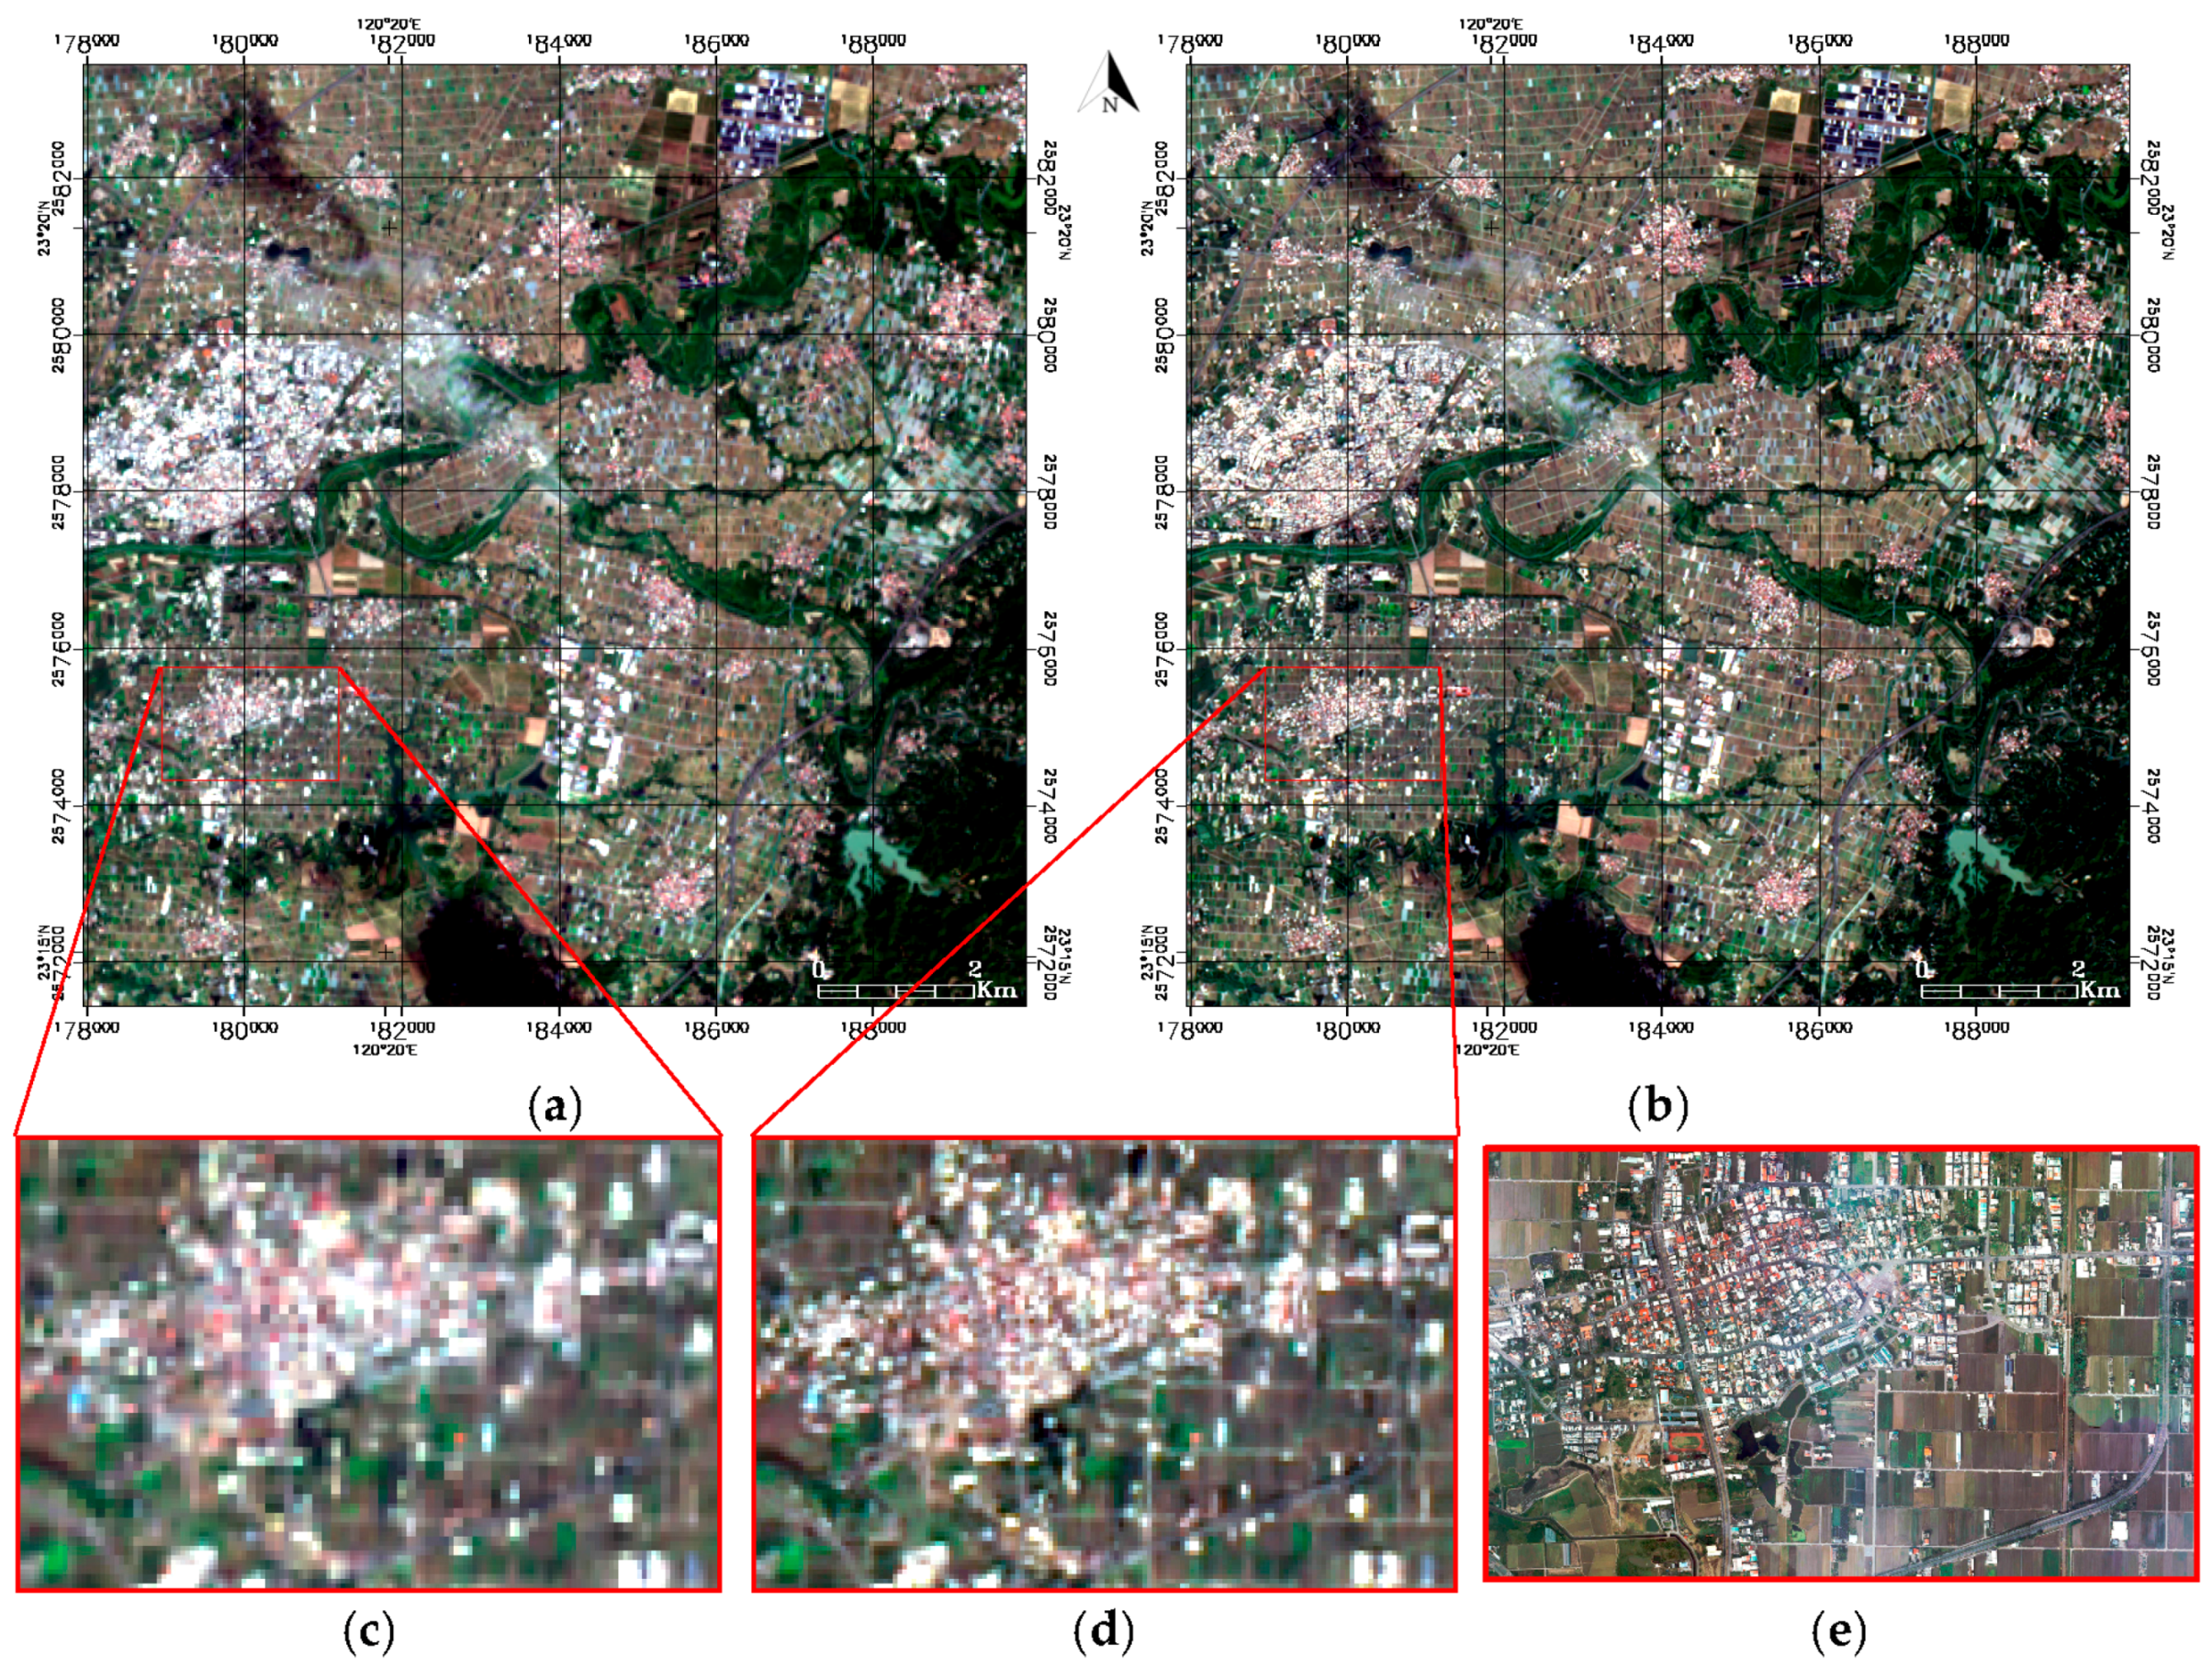
2.2. Pan-Sharpening Technique of Spectral Summation Intensity Modulation

The higher the spatial resolution, the better the visual effect. As such, pan-sharpening processing is preferred because both the spatial and spectral information can be retained and represented in one single image. Liu et al. [6] demonstrated that both the spatial details can be improved and the spectral properties can be preserved, using the technique of spectral summation intensity modulation (SSIM). The essential condition is that the spectral range of the panchromatic band must be equal to that of multi-spectral bands to be pan-sharpened. This condition is satisfied in most high-resolution satellite sensors, such as Formosat-2, IKONOS, Quickbird, and so on. For the case of Landsat-8, fortunately, the same condition is almost fully satisfied (panchromatic band 8 covers approximately the same range as bands 2, 3, and 4), except for a small gap between bands 3 and 4. To illustrate the benefits of using an SSIM pan-sharpened image, one Landsat-8 image of Tainan City taken on 11 February 2016 is shown in Figure 2. The image was taken after an earthquake with a moment magnitude of 6.4 struck southern Taiwan on 6 February 2016. Bands 2, 3, and 4 of the Landsat-8 image make an ideal true color composite (Figure 2a) and the SSIM pan-sharpened image (Figure 2b) does indeed improve the spatial details and preserves the spectral properties. To examine and compare the details, the red boxes shown in Figure 2a,b are enlarged in Figure 2c,d, respectively. Compared to the aerial photo (25-cm resolution) of the same area taken on 8 February 2016 (Figure 2e), the main roads, basic shape of buildings, as well as spectral properties, are all retained well in the SSIM pan-sharpened image. The improvement in spatial resolution from 30 m to 15 m is indeed crucial for applications in urban areas, where the land cover and land use are mainly controlled by humans. However, this improvement of spatial resolution needs a sound pan-sharpening technique, such as SSIM, to really benefit users. The time required for SSIM processing is 12.5 s per scene, using our PC-based server.

2.3. Adaptive Contrast Enhancement

Clouds are often found in a remotely-sensed imagery, and these reduce the contrast of surface features and deteriorate the visual effects, particularly for the case of cirrocumulus clouds, as in the example shown in Figure 3a. Although the total area of clouds is less than 30%, the clouds and shaded areas are scattered around the entire image, resulting in a rather dark image with poor contrast. Even after applying the USGS Fmask algorithm, there are still some fractus clouds that cannot be completely masked out. As a result, the general approach of linear contrast enhancement would be limited by the bright pixels of unmasked fractus clouds, and the contrast of the entire image remains rather poor, as shown as Figure 3b. By assigning each pixel to an intensity proportional to its rank within the surrounding neighborhood, the adaptive contrast enhancement (ACE) technique [15] has been shown to be broadly applicable to those images with clouds and shadows. For example, Liu and Chang [16] employed ACE to process a large number of cloudy images acquired by Formosat-2, in order to support rapid damage assessments in the aftermath of Typhoon Morakot. For the case of cirrocumulus clouds shown in Figure 3a, however, a large number of overlapped tiles would be needed to ensure that the contrast of the dark regions could be fully stretched. Because the histogram variation is equalized after ACE, the spectral information of cloudy regions with brighter pixels might also be biased, resulting in some artificial colorful strips (Figure 3c). This side effect is tackled in L-8 AIPS by applying ACE to those regions without cloud masking (determined by USGS Fmask), and then adding back the cloud mask with a saturated value, shown as the white pixels in Figure 3d. In other words, ACE gives a better contrast enhancement by excluding those brighter pixels masked as clouds, which are then added back as white pixels for they are generally perceived as clouds. Note that the cloud regions in Figure 3d look slightly larger than those shown in Figure 3a–c, because a 3 × 3 buffer is used by USGS Fmask. The time required for ACE processing is 20.83 s per scene, using our PC-based server.

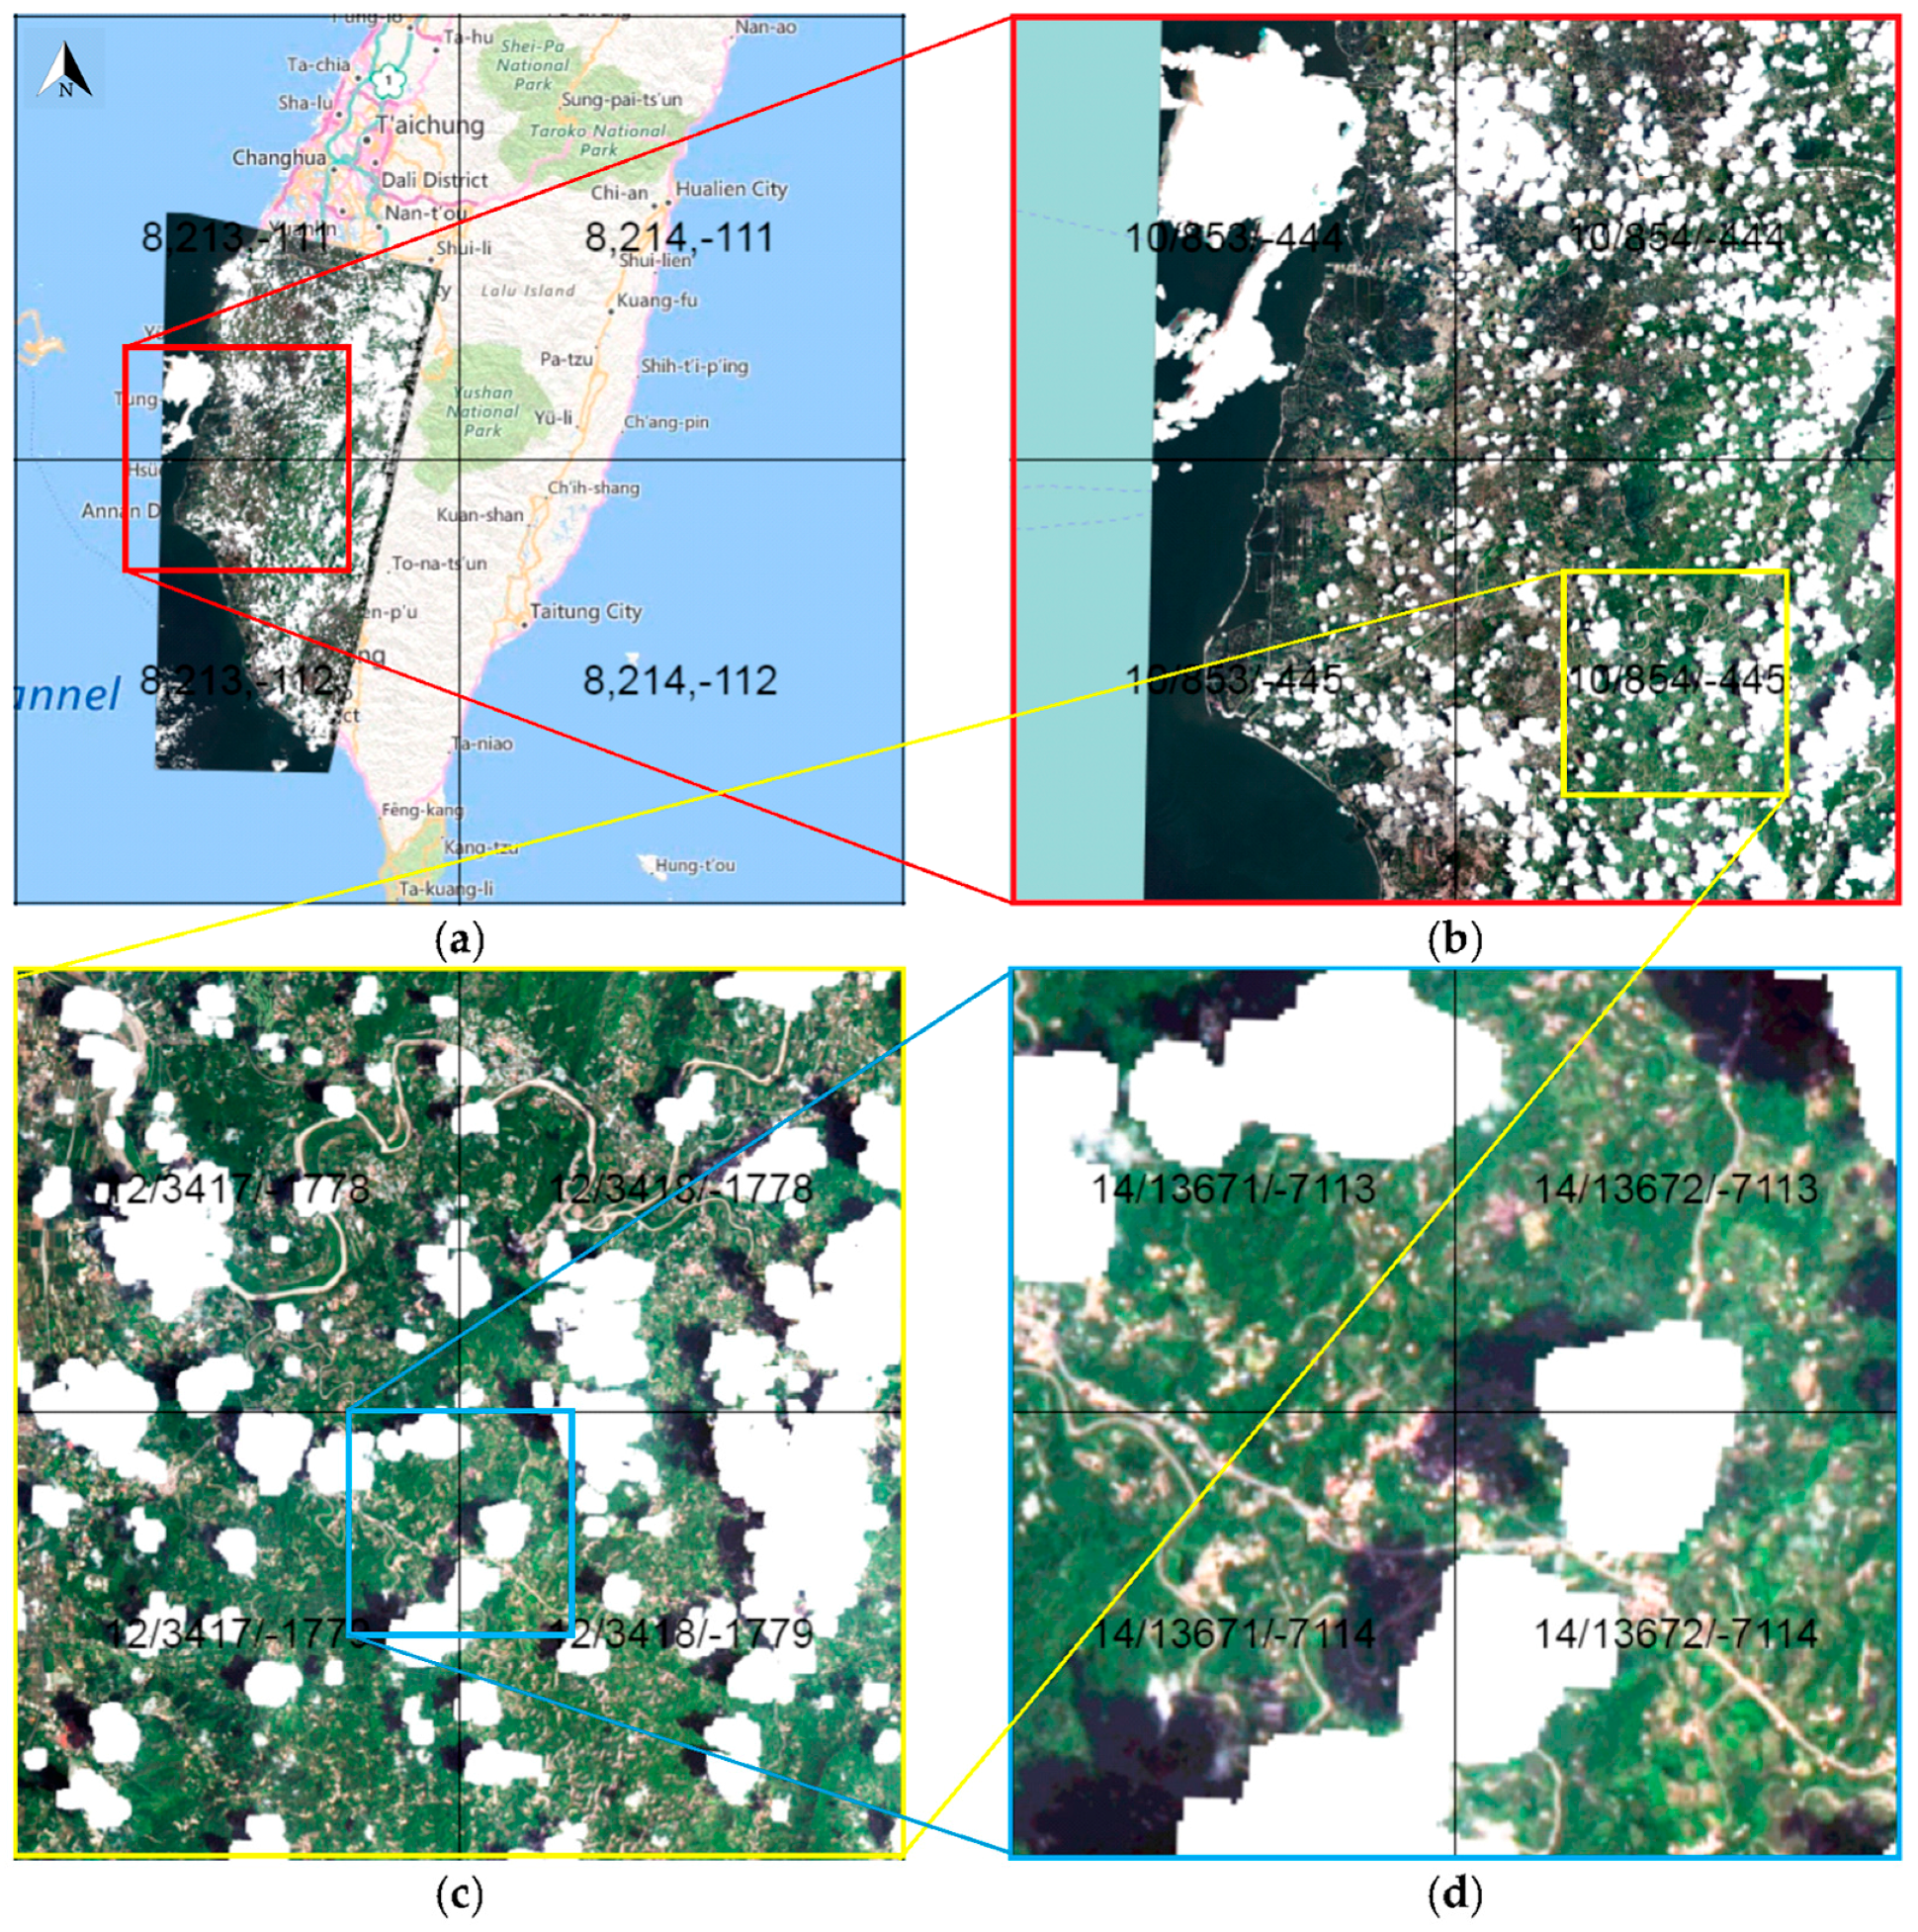
2.4. Openlayers and Google Maps/Earth Compatible Superoverlay Technique

Exchanging geospatial information via the internet, and particularly large amounts of remote sensing imagery, is the most efficient approach to provide such knowledge to the general public and decision makers. Among the various commercial platforms that are available, the free to use Openlayers and Google Maps/Earth systems have the largest number of users. Since everyone around the world can freely access these platforms via his/her web browser, without purchasing or installing expensive software, more and more data owners, such as government organizations and space agencies, would like to distribute their geospatial data or remote sensing imagery on these systems. We, thus, follow the standard format of superoverlay to convert each Landsat-8 image to a set of pyramid image tiles that are fully compatible with Openlayers and Google Maps/Earth [17]. All tiles are stored in a cloud-based server and the user can browse any region of this image at different levels of detail (LOD) through the internet following the standard technical approach proposed more than a decade ago, as illustrated in Figure 4. Since only a few tiles are transmitted and no calculation is actually conducted at the server end, one machine can serve many users simultaneously. The number of users can be further expanded using cloud-based services, as demonstrated during the rapid response to Japan’s earthquake and tsunami event in 2011 [11]. Note that the time required for superoverlay processing is 403.52 s per scene, using our PC-based server. The set of pyramid image tiles can be rapidly distributed and browsed via devices like mobile phones, tablets, and desktop computers.

3. Results

3.1. Browsable Landsat-8 Images of Taiwan

According to the Worldwide Reference System-2 (WRS-2), a global notation system for Landsat-8 data, Taiwan is covered by five scenes (Path-Row: 117-043, 117-044, 117-045, 118-043, 118-044). All Landsat-8 scenes of Taiwan, starting from the date 16 April 2013, were downloaded from USGS, processed by L-8 AIPS, and published on the Open Access Satellite Imagery Service (OASIS) (http://oasis.ncku.edu.tw/Landsat8) in the format of image tiles. Thanks to the free and open map service powered by Openlayers 3, these browsable image tiles of Taiwan can be viewed from any platform with ordinary web browsers, such as Chrome, Internet Explorer, Firefox, or Safari. Figure 5 gives a screen shot of OASIS.

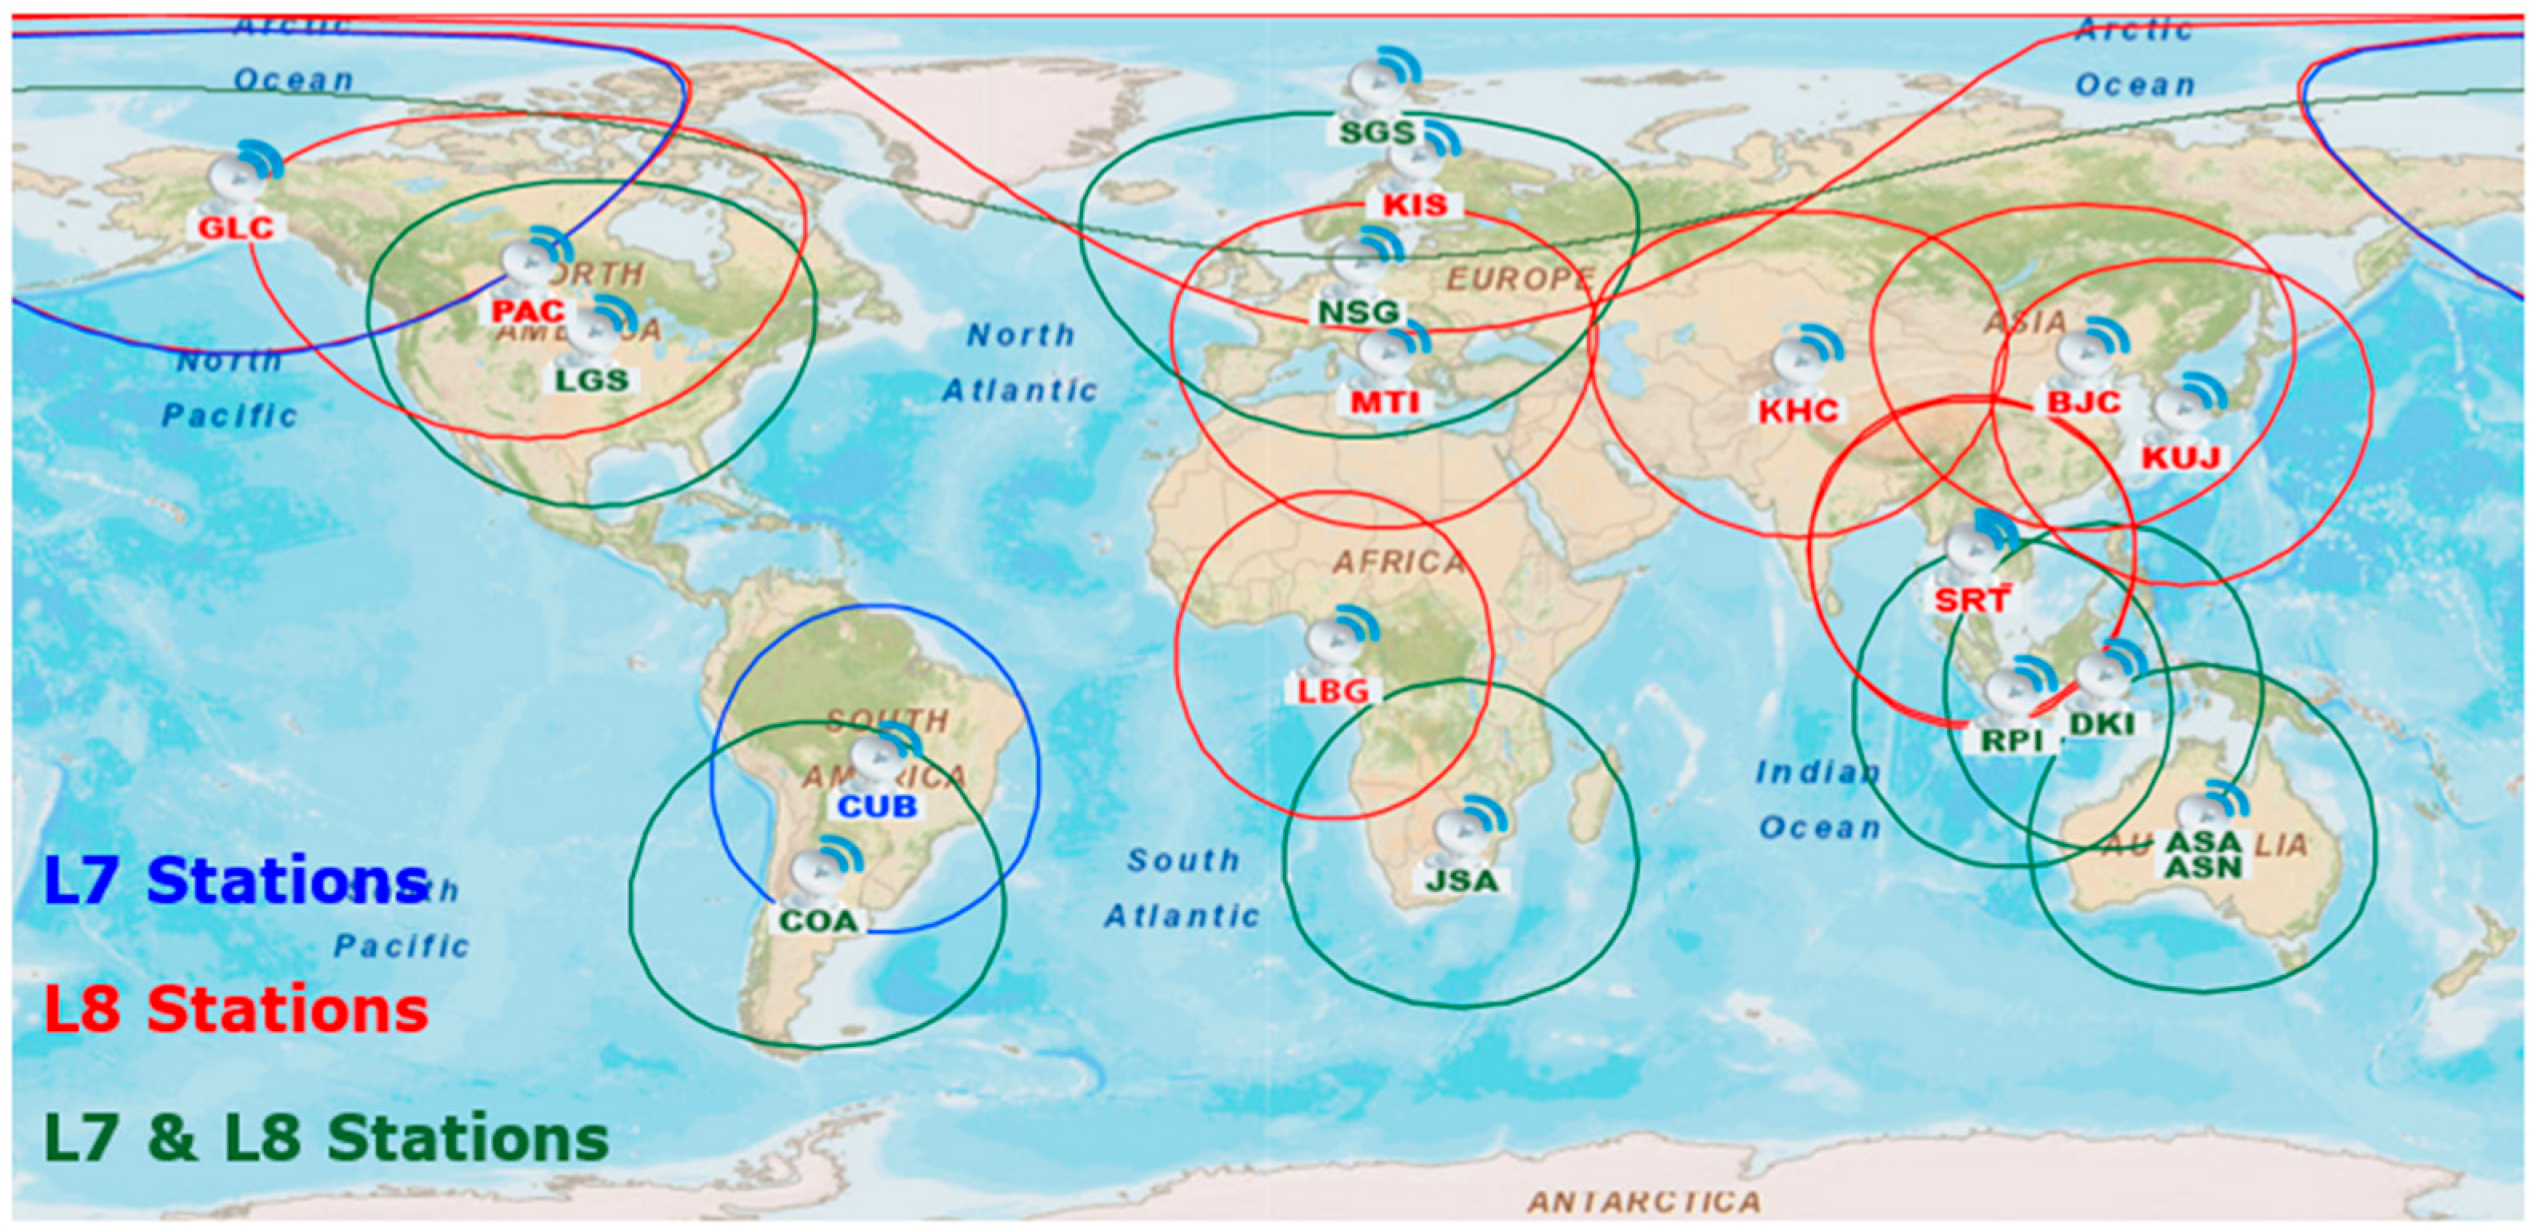
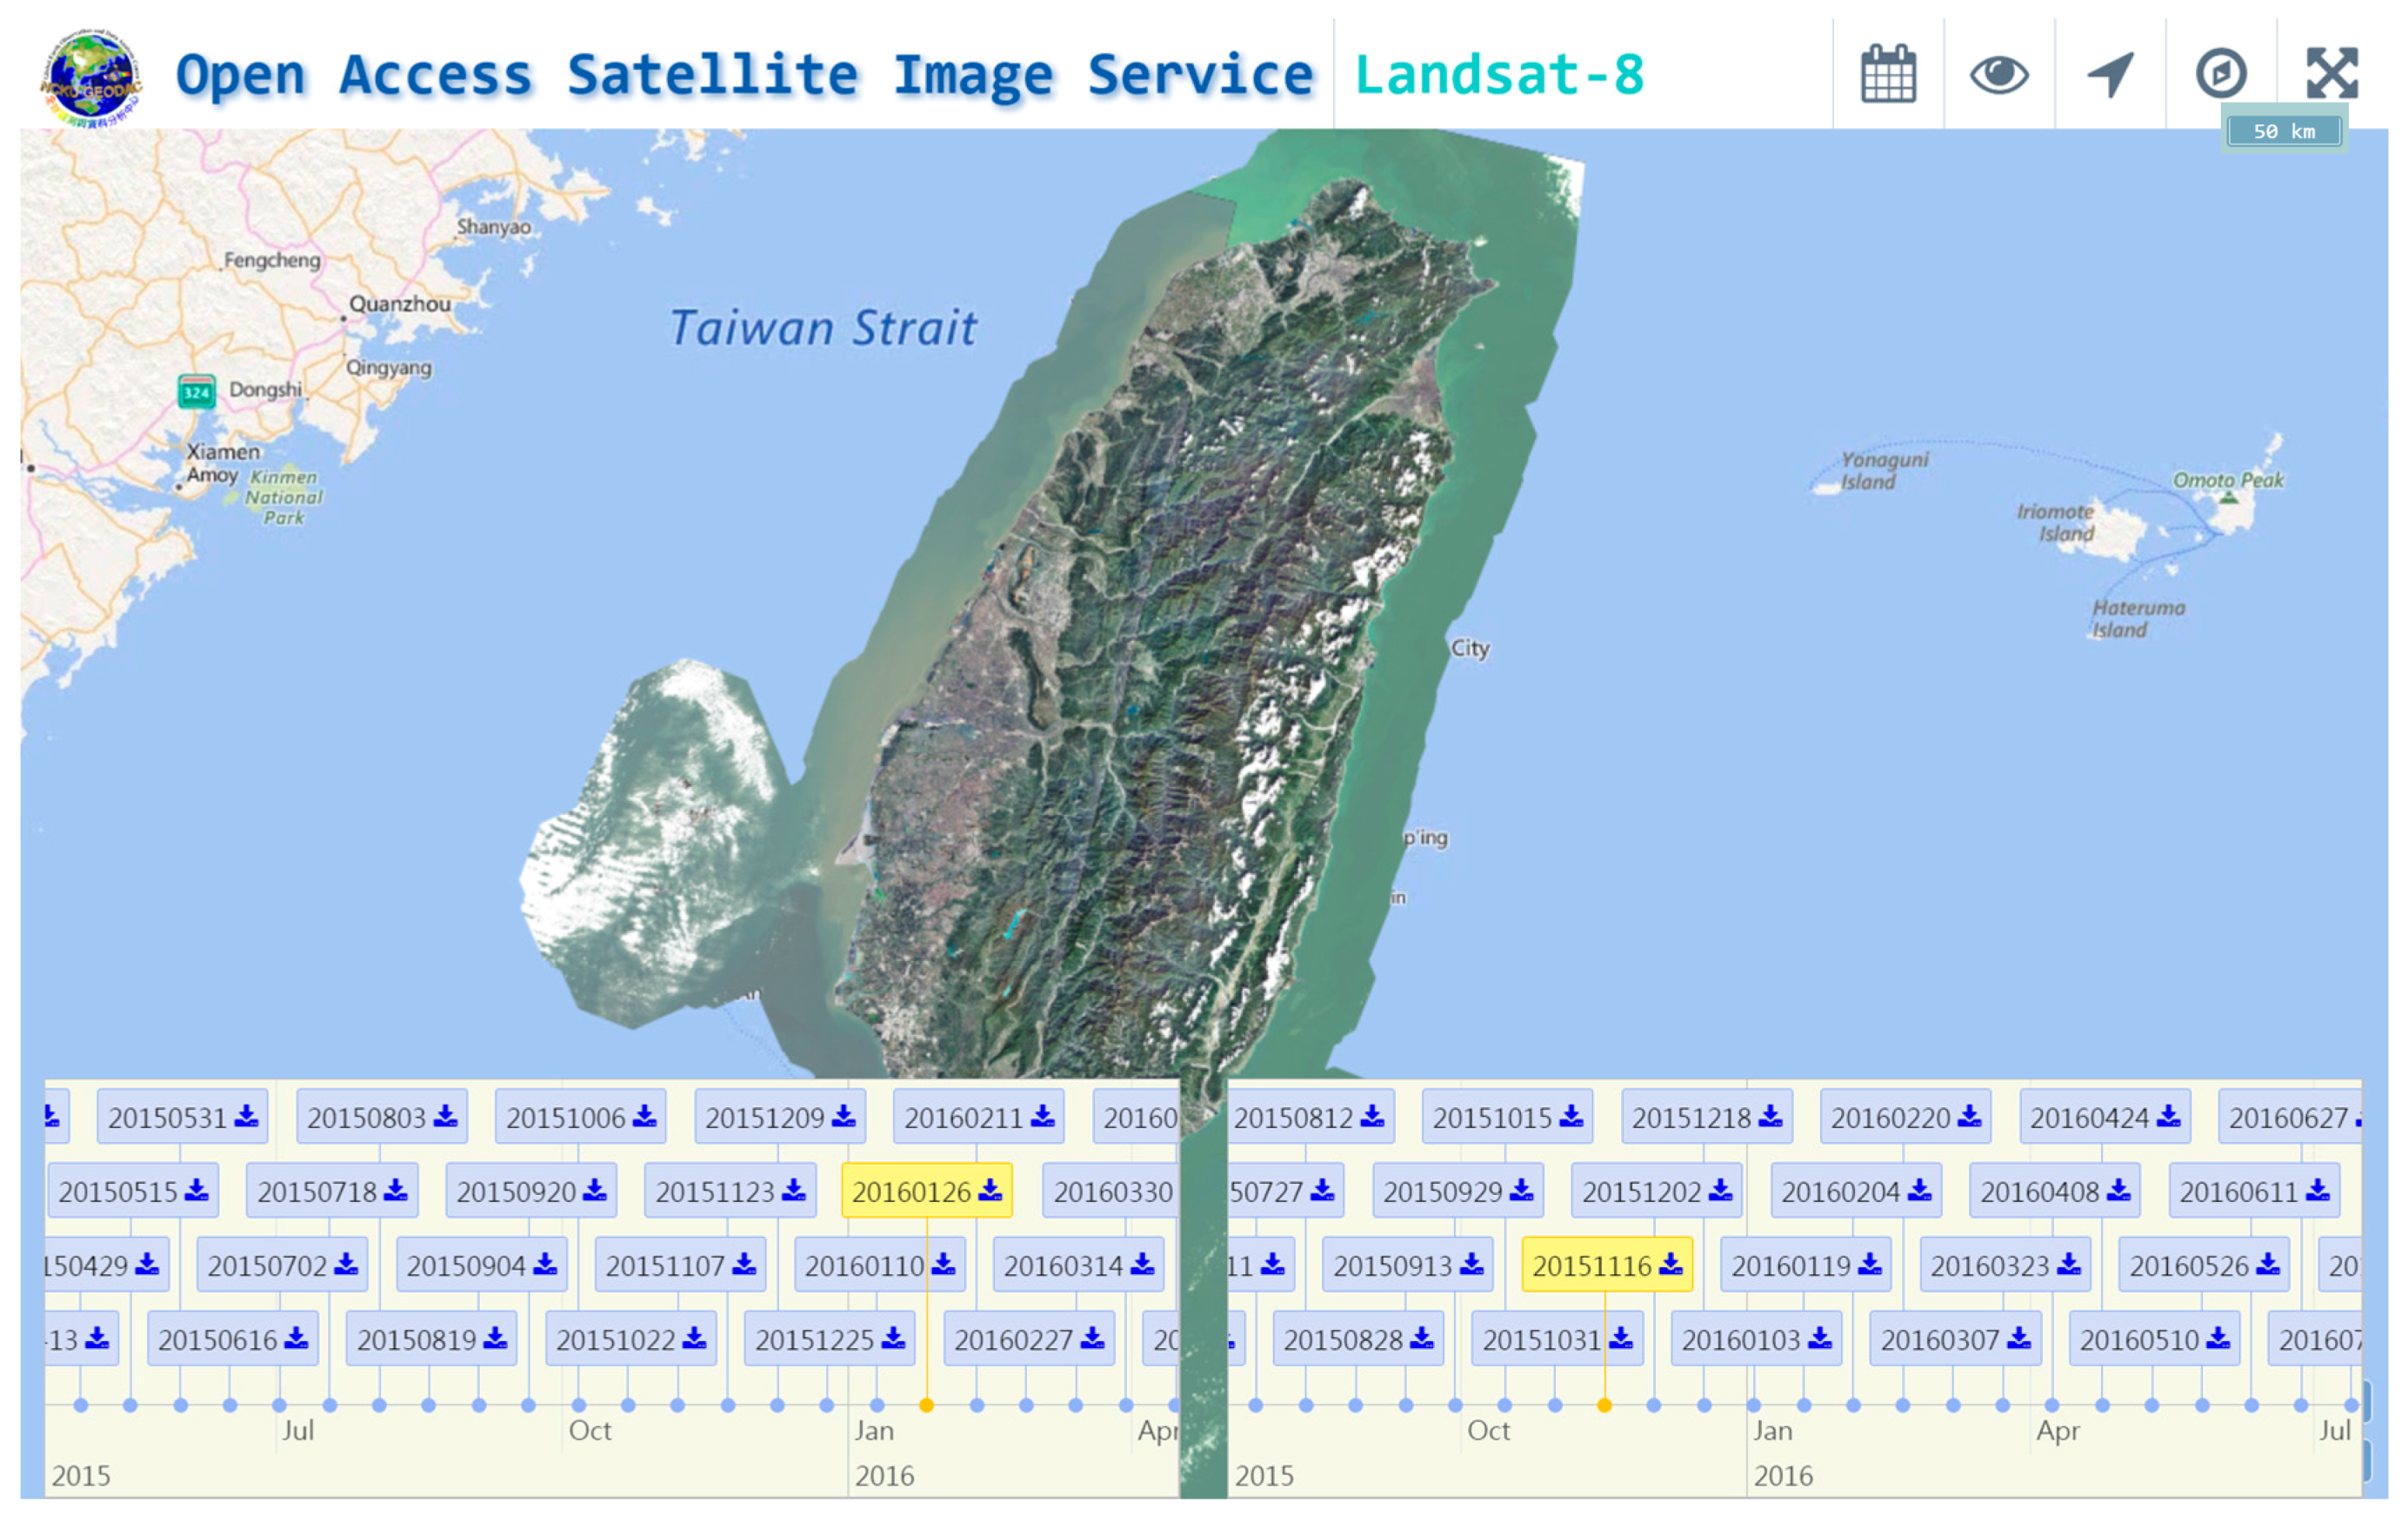
3.2. Rapidly Access to Full Archive

Google recently started upgrading most of the satellite images used on Google Maps to the latest Landsat-8 images, but only at a frequency of about half a year using cloudless scenes. There would thus be a lag of a few months before some changes were found on the Landsat-8 images on Google Maps. For the case of Taiwan, OASIS archives the full set of Landsat-8 images, regardless of the cloud coverage. Once a change is spotted in one particular image, it would be easier to narrow down to the period in which the change emerged and infer the possible causes. Figure 6 gives an example of a barrier lake near Shangde Village in Taitung County found in the Landsat-8 image taken on 29 July 2016 (Figure 6a). The same lake can still be identified in an earlier Landsat-8 image taken on 13 July 2016 (Figure 6b) despite the heavy coverage of clouds. No signs of the barrier lake, however, can be found on the Landsat-8 image taken earlier on 27 June 2016 (Figure 6c). Since the category 5 Super Typhoon Nepartak made landfall in the south-east coast of Taiwan on 7 July 2016 and the barrier lake was right in its path, a landslide triggered by Typhoon Nepartak could be the cause of the formation of the barrier lake. OASIS enables us to rapidly access the full archive of Landsat-8 imagery and select three earlier images taken in the same season: 25 June 2015 (Figure 6d), 8 July 2014 (Figure 6e), and 21 July 2013 (Figure 6f). These images confirm that the landslide had been there since 2013, and this area is prone to forming barrier lakes if the existing landslide material increases, as happened in the case of Typhoon Nepartak.
Another example is a large-scale debris flow found in Zhongzhi Village, Wulai District, New Taipei City. This was triggered by Typhoon Soudelor on 8 August 2015. Comparing the latest Landsat-8 image taken on 29 July 2016 (Figure 7a) with that taken on 12 August 2015 (Figure 7b) after Typhoon Soudelor, the large-scale debris flow looks clear and no significant changes are found during this period of time. By comparing this image to the one taken on 25 June 2015 (Figure 7c) before Typhoon Soudelor, the area of debris flow can be clearly delineated and calculated. Such a significant change highlights the threat of this large-scale debris flow to residents and buildings downstream. Likewise, OASIS enables us to rapidly access the full archive of Landsat-8 imagery and select three earlier images taken on 25 August 2014 (Figure 7d), 26 November 2013 (Figure 7e), and 16 April 2013 (Figure 7f). Unlike the previous example of a barrier lake formed by the expansion of an existing landslide, this region is more stable and there are no signs of large-scale debris flow or landslides found in the past few years. This suggests that an unusual rainfall pattern brought about by Typhoon Soudelor might be the main reason for such a large-scale debris flow. At the time of writing this study, both the barrier lake near Shangde Village of Taitung County and the large-scale debris flow near Zhongzhi Village of New Taipei City are being continuously monitored by Landsat-8 imagery on a 16-day basis. This gives two good examples of monitoring ROIs by rapidly accessing the full archive of browsable Landsat-8 images through OASIS.

3.3. Update in Near-Real Time

All ground stations of LICN are able to receive a direct downlink of raw data from the spacecraft and process them to level-1 products in about two hours, using the LPGS provided by USGS. It takes another hour to generate the higher level product of browsable image tiles using L-8 AIPS (Table 1). In other words, combining LPGS with L-8 AIPS enables us to provide users with browsable image tiles in no more than three hours. Even for those regions without an LICN station nearby, the level-1 product can be downloaded from several USGS web sites directly at no charge within 24 h of being received. Together with the L-8 AIPS, the browsable Landsat-8 image tiles can still be updated within the same day. Our recent experience of rapidly responding to Typhoon Nepartak with the aid of Landsat-8 images gives a good demonstration of the practical implications of this process. After the landfall of the category 5 Super Typhoon Nepartak on 7 July 2016, the first date of Landsat-8 image acquisition on Path 117 was 13 July 2016 was. The standard level-1 products of three scenes (Path-Row: 117-043, 117-044, 117-045) were processed and released by USGS about ten hours after image acquisition. These products were then downloaded from USGS, processed by L-8 AIPS, and within two hours published on OASIS in the format of image tiles.
Comparing the before-Nepartak image taken on 27 June 2016 to the after-Nepartak image taken on 13 July 2016, large-scale destruction of vegetation was found in the mountainous areas near Taitung County, but not in other areas, such as Hualien County (Figure 8). These changes were soon delineated and reported to the Soil and Water Conservation Bureau early in the morning of 14 July 2016. High-spatial-resolution aerial photographs of these areas were taken on the same day, which confirmed the large-scale destruction of vegetation seen in the Landsat-8 image, as illustrated by Figure 8e. Although the spatial resolution of Landsat-8 (15 m) is inferior to that of Formosat-2 (2 m), this makes no difference to the application of large-scale change detection. From the point of view of swath, by contrast, that of Landsat-8 (185 km) is much wider than that of Formosat-2 (24 km). As long as the weather is good and the timing is appropriate, more than half of Taiwan can thus be examined by one overpass of Landsat-8, as in the case of disaster assessment after Typhoon Nepartak.

4. Discussion

More than four decades of the Landsat program have demonstrated the value of using space-based land remote sensing data to evaluate dynamic changes in the environment due to both natural phenomena and those caused by human activities and climate change. After failuing to make a successful commercial business out of the Landsat program, Landsat-8 was planned and launched in 2013 to ensure the continued acquisition and availability of Landsat data. In accordance with USGS policy, Landsat 8 data products are distributed to the general public on a nondiscriminatory basis at no cost to the user [18]. The same policy has been followed by other earth observation missions, such as Sentinel-2 of the European Space Agency, which is expected to provide even higher spatial resolution images with greater frequency [19]. Despite the efforts put into building LICN and developing LPGS, the entry level of browsing Landsat-8 imagery at its full spatiotemporal resolution is still too high for the general public. Not every user can afford the required resources/techniques to carry out data downloading, decompressing, and image processing. Google recently started upgrading most of the satellite images used in Google Maps to the latest Landsat-8 images, but only at a frequency of about half a year using cloudless scenes, representing less than 5% of the entire Landsat-8 collection. The major challenges to fully exploiting the advantages of the entire Landsat-8 archive are to obtain the best visual effect from images that are usually contaminated by clouds, and to distribute them through the internet efficiently. USGS released a prototype tool, namely LandsatLook Viewer (http://landsatlook.usgs.gov/viewer.html), to provides visual and download access to all USGS natural color image product archives. Two options of image enhancement, including percent clip and stretch 3 standard deviation, are available to change the appearance of the image display. For those images with a higher ratio of cloud or haze, however, the color are inevitably distorted and the contrast is not satisfied with both options. Other commercial solutions, such as Mapbox® (https://www.mapbox.com/satellite/) and Sentinel Hub® (http://www.sentinel-hub.com/), as well as the open source project Remote Pixel (https://remotepixel.ca/projects/satellitesearch.html), are also dedicated to making Landsat-8 data easily accessible. But the influence of cloud/haze on image contrast is not taken into account, and the highest spatial resolution (15 m) at band 8 of Landsat-8 is not utilized to provide the pan-sharpened imagery either. This paper reports on the use of L-8 AIPS that integrates four existing techniques to provide browsable Landsat-8 imagery in near-real time. The processing and publishing of all Landsat-8 scenes of Taiwan have proven the feasibility of the system. With the capability of quickly accessing the entire archive and examining various ROIs at full resolution (15 m) with a clear contrast enhancement regardless of the cloud condition, the browsable Landsat-8 imagery can thus serve as a reliable source of data to evaluate dynamic changes in the environment.
The experiences learned and benefits received from developing L-8 AIPS indicate that the data covered should be expanded to include other open data and more advanced functions of analysis in the future. A collaborative project with the Korean Ocean Research Center is focused on processing all images collected by the Geostationary Ocean Color Imager since 2011 (500 m resolution, eight times per day, 2500 km × 2500 km coverage). Attempts at processing Sentinel-2A imagery have also been made. The success of L-8 AIPS highlights the opportunity that exists to integrate all open data collected by various space-based sensors into one platform. The browsable images serve as a portal for users to select the space- and time- frame. Instead of duplicating all data in one place, this request can be directed to the host to acquire the raw or value-added data. The browsable images are meant to provide timely information for qualitative analysis, rather than detailed quantitative analysis. For some applications, such as the three cases of rapidly responding to a disaster discussed in this paper, these images can provide very valuable information. The key to the success of these applications is thus providing browsable images in a timely and comprehensive manner. For other applications that require more in-depth analysis, such as estimating the amount of changes or identifying targets with a specific property, shape, or size, more advanced functions of analysis can be added to L-8 AIPS. Every scene of a Landsat-8 image has been decompressed and resampled to one stacked file with the same spatial resolution (15 m) for all spectral bands, and the masks of cloud, shadow, snow, and water are also calculated and saved in separate files. It would thus be convenient and efficient to cut the stacked file and the corresponding mask with the specified ROI, and conduct detailed analysis for the entire time series. To evaluate the effects of forest restoration, for example, the ROI can be set to those compartments of concern. All possible techniques of image processing, such as radiance normalization and calculation of the spectral index, can be selected and conducted only within the same ROI for every image in the archive. The computation can even be done at the user end. Instead of processing a large image to generate all kinds of products for users to download, it would thus be more efficient and flexible to focus on one user-specified ROI.
Remote sensing imagery with high spatial resolution gives more detailed information of the ground surface, and such images are usually commercially available at high cost. However, the amount of data for the same spatial coverage is becoming larger as the spatial resolution becomes higher. Therefore, the computational time and resources required to handle such large amounts of data is another cost that should be taken into account. For some applications, such as environmental monitoring and disaster assessment, it would be impractical to acquire and process high-spatial-resolution remote sensing imagery over a large area. With the characteristics of middle resolution, broad area, and multispectral coverage, this work demonstrates that Landsat-like satellites are appropriate for the applications of environment monitoring and disaster assessment, provided that the browsable images can be accessed in near-real time. Note that there is no intention to abandon the use of high-spatial-resolution remote sensing imagery, because the quality of information drives the quality of results. On the contrary, following the concept of multi-stage remote sensing, we suggest the best use of high-spatial-resolution remote sensing imagery is under the guidance of those disaster/change hot spots determined from Landsat-8 browsable images with a middle resolution but much larger coverage. For example, in order to rapidly respond to a natural disaster event with high-spatial-resolution imagery acquired from a low-cost unmanned aerial vehicle [20], airborne sensor, or satellite [11,21], we can select and deploy the most appropriate platform to those hot spots at the most appropriate time.

5. Conclusions

Based on the experience learned from the Formosat-2 image processing and application, we successfully integrated four existing techniques to develop the L-8 AIPS system that is able to provide browsable Landsat-8 images in near-real time and publish them on the World Wide Web in the format of image tiles. Operation of L-8 AIPS for Taiwan has proven the feasibility of browsing the most up-to-date Landsat-8 images after only one hour after receiving the raw data from LPGS, and quickly accessing all historical Landsat-8 images at full-resolution. With three examples of a barrier lake, debris flow, and large-scale destruction of vegetation after typhoon events, this work demonstrates that the browsable Landsat-8 imagery with characteristics of middle resolution, broad area, and multispectral coverage is indeed appropriate for the applications of environment monitoring and disaster assessment. Considering the time and effort needed to provide Landsat-8 data to the general public on a nondiscriminatory basis and at no cost to the user, L-8 AIPS plays a crucial role in bridging the gap between the user’s needs and the existing Level-1 product from LPGS. Therefore, not only can the existing 17 ground stations of Landsat-8 data reception and distribution take advantage of Landsat-8 imagery, but so can every individual user via the L-8 AIPS system, which is available on request from the corresponding author.

Acknowledgments

This research was supported by the Ministry of Science and Technology of Taiwan under Contract No. MoST 105-2611-M-006-001, Soil and Water Conservation Bureau under Grant 105AS-7.5.1-SB-S3, and Forestry Bureau under Contract No. TFBR-1040215. The authors also acknowledge the assistance received from the U.S. Geological Survey’s Earth Resources Observation and Science (EROS) Center. All Landsat-8 data are available from the U.S. Geological Survey.

Author Contributions

Cheng-Chien Liu organized the research, developed L-8 AIPS, and drafted the manuscript. Ryosuke Nakamura took charge of the Landsat 8 International Ground Station of Japan, and contributed the Landsat-8 data and provided technical assistance of the Level 1 Product Generation System (LPGS). Ming-Hsun Ko and Tomoya Matsuo processed and analyzed the data. Soushi Kato contributed details of the experience of change detection using Landsat-8 data. Hsiao-Yuan Yin initiated the missions of rapidly responding to the debris flow triggered by Typhoon Soudelor (8 August 2015) and the barrier lake formed after Typhoon Nepartak (7 July 2016). Chung-Shiou Huang initiated the mission of rapidly responding to the large-scale destruction of vegetation after Typhoon Nepartak (7 July 2016) and provided the aerial photographs of Taitung County. All authors contributed useful suggestions and comments in the process of preparing this manuscript. All authors have read and approved the final manuscript.

Conflicts of Interest

The authors declare no conflict of interest.

References

  1. Williams, D.L.; Goward, S.; Arvidson, T. Landsat. Photogramm. Eng. Remote Sens. 2006, 72, 1171–1178. [Google Scholar] [CrossRef]
  2. Lauer, D.T.; Morain, S.A.; Salomonson, V.V. The landsat program: Its origins, evolution, and impacts. Photogramm. Eng. Remote Sens. 1997, 63, 831–838. [Google Scholar]
  3. Landsat International Cooperators and Global Archive Consolidation. Available online: https://www2.usgs.gov/science/cite-view.php?cite=5631 (accessed on 6 January 2017).
  4. Wu, A.-M.; Wu, F.; Shieh, C.-J. Daily repetitive imaging from rocsat-2 satellite. In Proceedings of the 55th International Astronautical Congress of the International Astronautical Federation, the International Academy of Astronautics, and the International Institute of Space Law, Vancouver, BC, Canada, 4–8 October 2004.
  5. Liu, C.-C. Processing of formosat-2 daily revisit imagery for site surveillance. IEEE Trans. Geosci. Remote Sens. 2006, 44, 3206–3214. [Google Scholar] [CrossRef]
  6. Liu, C.-C.; Liu, J.-G.; Lin, C.-W.; Wu, A.-M.; Liu, S.-H.; Shieh, C.-L. Image processing of formosat-2 data for monitoring south asia tsunami. Int. J. Remote Sens. 2007, 28, 3093–3111. [Google Scholar] [CrossRef]
  7. Liu, C.-C.; Chen, P.-L. Automatic extraction of ground control regions and orthorectification of formosat-2 imagery. Opt. Express 2009, 17, 7970–7984. [Google Scholar] [CrossRef] [PubMed]
  8. Liu, C.-C.; Shieh, C.-L.; Wu, C.-A.; Shieh, M.-L. Change detection of gravel mining on riverbeds from the multi-temporal and high-spatial-resolution formosat-2 imagery. River Res. Appl. 2009, 25, 1136–1152. [Google Scholar] [CrossRef]
  9. Chang, C.-H.; Liu, C.-C.; Wen, C.-G.; Cheng, I.-F.; Tam, C.-K.; Huang, C.-S. Monitoring reservoir water quality with formosat-2 high spatiotemporal imagery. J. Environ. Monit. 2009, 11, 1982–1992. [Google Scholar] [CrossRef] [PubMed]
  10. Liu, C.-C.; Kamei, A.; Hsu, K.H.; Tsuchida, S.; Huang, H.M.; Kato, S.; Nakamura, R.; Wu, A.M. Vicarious calibration of the formosat-2 remote sensing instrument. IEEE Trans. Geosci. Remote Sens. 2010, 48, 2162–2169. [Google Scholar]
  11. Liu, C.-C.; Chen, N.-Y. Responding to natural disasters with satellite imagery. SPIE Newsroom 2011. [Google Scholar] [CrossRef]
  12. Rengarajan, R.; Sampath, A.; Storey, J.; Choate, M. Validation of geometric accuracy of global land survey (gls) 2000 data. Photogramm. Eng. Remote Sens. 2015, 81, 131–141. [Google Scholar] [CrossRef]
  13. Zhu, Z.; Woodcock, C.E. Object-based cloud and cloud shadow detection in landsat imagery. Remote Sens. Environ. 2012, 118, 83–94. [Google Scholar] [CrossRef]
  14. Zhu, Z.; Wang, S.; Woodcock, C.E. Improvement and expansion of the fmask algorithm: Cloud, cloud shadow, and snow detection for landsats 4–7, 8, and sentinel 2 images. Remote Sens. Environ. 2015, 159, 269–277. [Google Scholar] [CrossRef]
  15. Pizer, S.; Amburn, E.; Austin, J.; Cromartie, R.; Geselowitz, A.; Greer, T.; Romeny, B.; Zimmerman, J.; Zuiderveld, K. Adaptive histogram equalization and its variations. Comput. Vis. Graph. Image Process. 1987, 39, 355–368. [Google Scholar] [CrossRef]
  16. Liu, C.-C.; Chang, C.-H. Searching the strategy of responding to the extreme weather events from the archive of formosat-2 remote sensing imagery. Geology 2009, 28, 50–54. (In Chinese) [Google Scholar]
  17. Gratier, T.; Spencer, P.; Hazzard, E. Openlayers 3: Beginner’s Guide; Packt Publishing: Birmingham, UK, 2015. [Google Scholar]
  18. Irons, J.R.; Dwyer, J.L.; Barsi, J.A. The next landsat satellite: The landsat data continuity mission. Remote Sens. Environ. 2012, 122, 11–21. [Google Scholar] [CrossRef]
  19. Drusch, M.; Del Bello, U.; Carlier, S.; Colin, O.; Fernandez, V.; Gascon, F.; Hoersch, B.; Isola, C.; Laberinti, P.; Martimort, P.; et al. Sentinel-2: Esa’s optical high-resolution mission for gmes operational services. Remote Sens. Environ. 2012, 120, 25–36. [Google Scholar] [CrossRef]
  20. Liu, C.-C.; Chen, P.-L.; Matsuo, T.; Chen, C.-Y. Rapidly responding to landslides and debris flow events using a low-cost unmanned aerial vehicle. J. Appl. Remote Sens. 2015, 9, 096016. [Google Scholar] [CrossRef]
  21. Liu, C.-C.; Wu, A.-M.; Yen, S.-Y.; Huang, S. Rapid locating of fire points from formosat-2 high-spatial-resolution imagery: Example of the 2007 california wildfire. Int. J. Wildland Fire 2009, 18, 415–422. [Google Scholar] [CrossRef]
Figure 1. The Landsat 7 and Landsat 8 International Ground Stations and the Landsat Ground Network. (http://landsat.usgs.gov/about_ground_stations.php; browsed on 26 June 2016)
Remotesensing 09 00079 g001
Figure 2. Illustration of the benefits of using an summation intensity modulation (SSIM) pan-sharpened image. Comparison of (a) the true color composite of a Landsat-8 image taken on 11 February 2016 (band 2, 3, and 4 correspond to the blue, green, and red channels, respectively); (b) the pan-sharpened Landsat-8 image obtained by employing the technique of spectral summation intensity modulation; (c) enlarge of the red box shown in (a); (d) enlarge of the red box shown in (b); and (e) the aerial photo (25-cm resolution) of Tainan City taken on 8 February 2016.
Remotesensing 09 00079 g002
Figure 3. Illustration of the benefits of using adaptive contrast enhancement (ACE) with an image. Comparison of the true color composite of a Landsat-8 image taken on 21 August 2016 (Scene ID: LC81180442016234LGN00) with (a) no enhancement; (b) linear stretch enhancement; (c) ACE with cloud masks not excluded; and (d) ACE with the cloud masks excluded.
Remotesensing 09 00079 g003
Figure 4. Illustration displaying a Landsat-8 image at different levels of detail (LOD): (a) 8; (b) 10; (c) 12; and (d) 14.
Remotesensing 09 00079 g004
Figure 5. Screen shot of Open Access Satellite Imagery Service (OASIS) (http://oasis.ncku.edu.tw/Landsat8). The base map is the open street map.
Remotesensing 09 00079 g005
Figure 6. A barrier lake near Shangde Village in Taitung County found in the Landsat-8 image taken on (a) 29 July 2016. The same lake can still be identified in an earlier Landsat-8 image taken on (b) 13 July 2016, despite the heavy cloud coverage. No signs of the barrier lake, however, can be found in the Landsat-8 images taken earlier on (c) 27 June 2016; (d) 25 June 2015; (e) 8 July 2014; and (f) 21 July 2013. Each image has 151 × 141 pixels with a spatial resolution of 15 m. The center coordinates are (22°56’42.5’’E, 121°13’47.32’’N).
Remotesensing 09 00079 g006
Figure 7. A large-scale debris flow found in Zhongzhi Village, Wulai District, New Taipei City. (a) 29 July 2016; (b) 12 August 2015; (c) 25 June 2015; (d) 25 August 2014; (e) 26 November 2013; and (f) 16 April 2013. Each image has 266 × 285 pixels with a spatial resolution of 15 m. The center coordinates are (24°53′10.42′′E, 121°32′59.95′′N).
Remotesensing 09 00079 g007
Figure 8. Example of rapidly responding to Typhoon Nepartak with near-real time Landsat-8 images: (a) Hualien County (27 June 2016, before-Nepartak); (b) Hualien County (13 July 2016, after-Nepartak); (c) Taitung County (27 June 2016, before-Nepartak); (d) Taitung County (13 July 2016, after-Nepartak). The area in the yellow box shown in (d) is investigated by (e) the high-spatial-resolution aerial photograph taken on 14 July 2016, and the green box shown in (e) is enlarged in (f). The high-spatial-resolution aerial photograph confirms the large-scale destruction of vegetation interpreted from the Landsat-8 image.
Remotesensing 09 00079 g008
Table 1. Time required by Landsat-8 automatic image processing system (L-8 AIPS) for each step of processing. Based on the scene (ID: LC81180442016234LGN00).
ProcessingTime (s) 1
Decompression and United States Geological Survey (USGS) Function of mask (Fmask) algorithm92.68
Pan-sharpening technique of spectral summation intensity modulation12.50
Adaptive contrast enhancement20.83
Openlayers and Google Maps/Earth compatible superoverlay technique403.52
1 Using an ordinary PC-based server equipped with an Intel® Core™ i7-4790K (4.0-GHz) CPU.

