
A Fuzzy-GA Based Decision Making System for Detecting Damaged Buildings from High-Spatial Resolution Optical Images


Faculty of Geodesy & Geomatics Engineering, K. N. Toosi University of Technology, Tehran 1996715433, Iran
*
Author to whom correspondence should be addressed.
Remote Sens. 2017, 9(4), 349; https://0-doi-org.brum.beds.ac.uk/10.3390/rs9040349
Submission received: 14 January 2017
/
Revised: 27 March 2017
/
Accepted: 1 April 2017
/
Published: 20 April 2017
(This article belongs to the Special Issue Learning to Understand Remote Sensing Images)
Abstract
:In this research, a semi-automated building damage detection system is addressed under the umbrella of high-spatial resolution remotely sensed images. The aim of this study was to develop a semi-automated fuzzy decision making system using Genetic Algorithm (GA). Our proposed system contains four main stages. In the first stage, post-event optical images were pre-processed. In the second stage, textural features were extracted from the pre-processed post-event optical images using Haralick texture extraction method. Afterwards, in the third stage, a semi-automated Fuzzy-GA (Fuzzy Genetic Algorithm) decision making system was used to identify damaged buildings from the extracted texture features. In the fourth stage, a comprehensive sensitivity analysis was performed to achieve parameters of GA leading to more accurate results. Finally, the accuracy of results was assessed using check and test samples. The proposed system was tested over the 2010 Haiti earthquake (Area 1 and Area 2) and the 2003 Bam earthquake (Area 3). The proposed system resulted in overall accuracies of 76.88 ± 1.22%, 65.43 ± 0.29%, and 90.96 ± 0.15% over Area 1, Area 2, and Area 3, respectively. On the one hand, based on the concept of the proposed Fuzzy-GA decision making system, the automation level of this system is higher than other existing systems. On the other hand, based on the accuracy of our proposed system and four advanced machine learning techniques, i.e., bagging, boosting, random forests, and support vector machine, in the detection of damaged buildings, it seems that our proposed system is robust and efficient.
1. Introduction
Detecting damaged buildings after a massive disaster in a robust manner is a critical task, because it helps relief and rescue teams to manage related works accurately and precisely and then may reduce losses. Hence, the production of accurate building damage maps after disasters would help relief and rescue teams in emergency situations. Remote sensing (RS) data is one of the sources which can be used for generating building damage maps. Due to specific characteristics of the RS data such as its high temporal frequency and the availability of various sensors with different spatial and spectral resolutions, it plays an important role in producing building damage maps. Satellite optical images, as a source of the RS data, have been frequently used to produce damage maps [1]. In this study, we present a novel semi-automated decision making system based on the fuzzy theory and genetic algorithm (GA) in order to produce the building damage maps. Our proposed system can be used as a knowledge extraction tool in future works. Knowledge extraction is a necessary stage in order to convert a semi-structured problem into a structured one [2].
1.1. Literature Review
The existing damage detection methods can be discussed from viewpoints of data used and methodology. From the perspective of data used, researchers employed different sources of RS data, including Light Detection and Ranging (LiDAR) [3], Synthetic Aperture Radar (SAR) [4,5,6,7,8,9], and optical imagery [10,11,12]. Optical satellite imagery is one of the useful sources in building damage detection process. Disasters may damage components of a building. A building’s roof is one of these components. Optical satellite sensors usually observe the roof of buildings. The spectral signature is the outcome of an optical satellite sensor. The spectral signature of each phenomenon is unique. Therefore, spectral signatures of a damaged roof and an intact roof are different from each other. For this reason, spectral signatures obtained from optical satellite sensors or their extracted features are suitable for detecting damaged buildings [2,13].
From the viewpoint of the methodology, presenting a comprehensive analysis about existing methods used in damage detection application is a difficult task, because there are many research studies. Therefore, we attempt to mention the related works to our research. In this study, we propose a fuzzy decision making system in order to detect damaged buildings from textural features extracted from post-event optical images. Hence, the literature review is presented in three parts: (1) the use of optical images for detecting damaged areas, (2) the role of textural features for detecting damaged areas, and (3) fuzzy systems used for detecting damaged areas.
Some researchers attempted to specify the role of optical images in damage detection application. Eguchi and Mansouri (2005) focused on investigating and categorizing papers that used RS technology for detecting buildings damaged after the 2003 Bam earthquake. It was concluded that detecting regional damages by RS technology is possible [14]. Voigt et al. (2011) presented results concerning actions of the German Aerospace Center (DLR) after the 2010 Haiti earthquake. It was deduced that extracting building damage maps even with high spatial-resolution optical satellite images is not an easy task and needs several human experts [15]. Lu et al. (2012) implemented a building damage detection method based on mono-temporal very high-spatial resolution optical images. In this paper, integrating manual and automatic interpretations resulted in a robust building damage map [16]. Tiede et al. (2011) used shadow information extracted from pre- and post-event optical images for generating a damage map after the 2010 Haiti earthquake. The proposed method was able to create the damage map of the Carrefour area after 12 h [17]. Lemoine et al. (2013) used aerial optical data for providing a realistic estimate from damaged buildings. Using the aerial optical data instead of satellite data was the key objective of the presented study to obtain more accurate results [18]. Based on the presented research works, it appears that optical data is a suitable source for detecting damaged buildings. However, owing to the complexity of this problem (i.e., damage detection), the role of experts is important and undeniable.
Many researches have benefited from textural features extracted from the RS data for identifying areas damaged after disasters. The ability of textural features in measuring spectral and height variations in the spatial domain over RS data is the main reason for use of them in the damage detection problem. Table 1 briefly depicts researches that used textural features in damage detection applications, especially for building damage detection [1] and road damage detection [19]. The existing researches can be discussed from three viewpoints. The used feature extraction method is the first viewpoint. From this perspective, Laws mask [1], Haralick [20], Multivariate variogram [21], 1st statistical [19], and Gabor filter [22] feature extraction methods were frequently employed to produce textural features in previous research works. Moreover, from the second viewpoint, textural features were extracted from different remotely sensed data including optical images, light detection and ranging (LiDAR) data, and synthetic aperture radar (SAR) data. Based on the literature, textural features extracted from pre- and/or post-event optical images were widely employed for detecting damaged areas. From the third viewpoint, researchers utilized textural features for improving the accuracy of the final damage map. In fact, it seems that textural features positively affect the performance of machine learning techniques and decision making systems in identifying damaged areas.
After extracting features, it is necessary to use a classifier or machine learning technique or decision making system for creating a relation between the extracted features and the damage extent of buildings. To this end, some researchers used advanced and non-parametric classifiers. Chesnel et al. (2008) utilized the Support Vector Machine (SVM) classifier to partition the feature space for detecting damaged and undamaged buildings [22]. Li et al. (2010) used the One-Class Support Vector Machine (OCSVM) classifier to obtain damaged areas from high spatial-resolution optical images [21]. Dubois and Lepage (2014) employed a multilayer backpropagation perceptron neural network to detect damaged buildings after the 2010 Haiti earthquake [1]. In addition to advanced classifiers, based on Table 2, some researchers used fuzzy-based decision making systems in the damage detection process [2,13]. The fuzzy-based decision making systems are usually employed in issues where experts want to model their knowledge. Damage detection is one of these issues. Producing damage maps using experts after disasters in a manual manner proves our claim. To the best of our knowledge, in the damage detection application, the fuzzy-based decision making systems can be used for two main procedures including: (1) land use/cover classification [29,30] and (2) modeling the damage extent of buildings from the extracted features [2,13]. Ural et al. (2011) employed a fuzzy classifier in order to map buildings and their rubble after the 2010 Haiti earthquake in a robust manner [30]. Moreover, researches have used Mamdani fuzzy inference systems (MFISs) as a decision making system for modeling the damage extent of buildings [19,27,28]. In these researches, parameters of fuzzy inference systems were manually adjusted in a trial and error manner that is a time consuming task. In these cases, the accuracy of results completely relies on the selected parameters. For this reason, Janalipour, M. et al. [2,13] used semi-automated Sugeno fuzzy decision making systems in order to detect damage and changed areas. The use of these systems was a good solution for improving the automation level of fuzzy systems, but it is a difficult task to extract knowledge from a Sugeno fuzzy system due to the structure of its rules [31]. Knowledge extraction is an important stage for converting a semi-structured problem (i.e., the damage detection) into a structured one. For further study on damage detection methods, we encourage readers to refer to [32,33,34].
1.2. Research Aims
In this study, three important objectives are satisfied. Based on the previous works, researchers widely used Mamdani fuzzy decision making systems for detecting damaged areas whose parameters of these systems were manually chosen in a trial and error basis which is a time consuming task. Moreover, the robustness of outcomes relies on the selected parameters. For this reason, Janalipour, M. et al. [2,13] proposed a semi-automated Sugeno fuzzy decision making system. However, for knowledge extraction, the Sugeno fuzzy system is not appropriate due to the structure of its rules. To this end, it is necessary to employ a semi-automated Mamdani fuzzy system. However, there is no semi-automated Mamdani fuzzy system. Therefore, it is essential to propose a semi-automated (or fully-automated) Mamdani fuzzy decision making system to detect damaged areas. In the first and main objective, we develop a semi-automated Mamdani fuzzy decision making system using Genetic Algorithm (GA). Based on the previous researches [2,13], sensitivity analysis plays an important role in identifying the appropriate parameters of a system leading to more accurate results. In the mentioned researches, a step-by-step sensitivity analysis method was used. However, it is necessary to simultaneously test all parameters of a system, because it permits us to consider the relationship between changes of all the parameters. For this reason, in the second objective, we study the effect of the simultaneous change of all parameters of the system on the final result. To investigate the robustness and effectiveness of our semi-automated Mamdani fuzzy decision making system, we compare results of this system with four advanced machine learning techniques including random forests (RF), bagging, boosting, and support vector machine (SVM)—that is our third objective.
2. Materials and Methods
In this section is included information about study areas and data used and description about our proposed methodology.
2.1. The First Study Area: The 2010 Haiti Earthquake
Port-au-Prince city is the first study area, where an earthquake occurred on 12 January 2010. Port-au-Prince is the capital of Haiti. Two areas including Area 1 and Area 2 were chosen over Port-au-Prince.
The previous research studies proved that ancillary information such as a pre-event vector map improves the accuracy of damage detection methods [36,37,38]. On the other hand, the use of the pre-event map in our proposed system is necessary, because it is difficult to find the footprint of buildings on post-earthquake optical images. For these reasons, a pre-event building map was injected into our methodology. There are some old-vector maps in the Haiti area such as [39]. To update the old-vector map, pre-event Geoeye-1 and IKONOS-2 images were employed. To this end, the old-vector map was updated as much as possible by an expert. Moreover, in the first study area, an ortho-rectified, pansharpened and georeferenced post-event Geoeye-1 image acquired on 13 January 2010 with a spatial resolution of 50 cm and three spectral bands (blue, green, and red) was employed.
2.2. The Second Study Area: The 2003 Bam Earthquake
Bam city is the second study area, a city located in southwestern Iran, where an earthquake occurred on 26 December 2003. The post- earthquake pansharpened QuickBird image and pre-event digital vector map of the Bam area were used in this study. The post-earthquake image was acquired on 3 January 2004 and also has 61 cm spatial resolution and four spectral bands (red, green, blue, and near infrared). The second study area has about 400 buildings with different damage extent. The pre-event digital vector map with a scale of 1:500 was produced by the National Cartographic Center (NCC) of Iran in 1994, which was updated using an expert according to [13].
2.3. Methodology
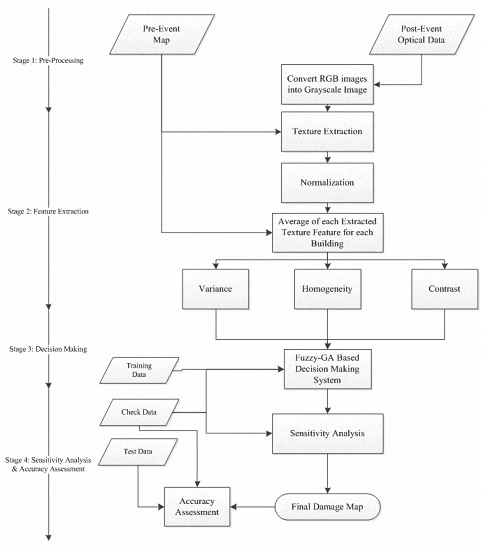
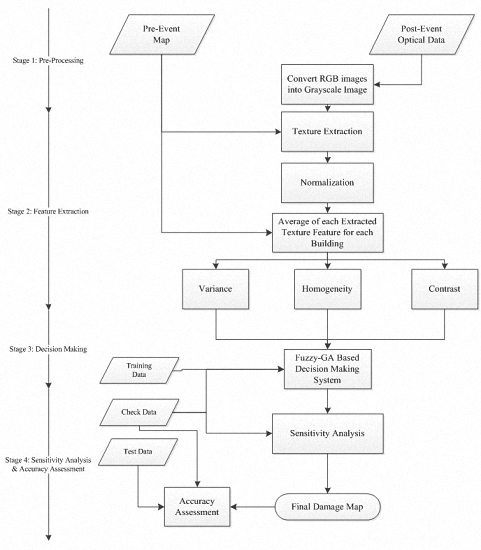
Our proposed damage detection system is presented in four main stages according to Figure 1. In stage “1”, post-event optical images are pre-processed. In stage “2”, Haralick texture features are extracted from the pre-processed optical images using the pre-event map and related equations. In stage “3”, a Fuzzy- GA (Genetic Algorithm) based decision making system is developed to estimate the damage extent of buildings from the extracted texture features. In stage “4”, a comprehensive sensitivity analysis is performed to achieve the best parameters leading to more accurate results. Finally, the accuracy of results is firstly assessed and then the building damage map is obtained. The aforementioned stages are presented in more detail below.
2.3.1. Stage 1: Pre-Processing
Pre-processing is one of the important stages in building damage detection. Geo-rectification and pansharpening are two of the important pre-processes, which should be performed on the post-event optical images. Georeferencing and pansharpening were performed on the post-event optical image of the Haiti earthquake. Moreover, the mentioned pre-processes were performed on the post-event optical image of the Bam earthquake according to [13].
As another pre-process, based on previous research works [2], the correlation between corresponding textural features extracted from spectral bands (i.e., red, blue, and green) is high. Hence, numerous and correlated features result, which increase the computational cost of the proposed method. For this reason, a grayscale image is produced from red, blue, and green bands using Equation (1) (please see [40] for further study about Equation (1)). Textural features are extracted from the grayscale band.
2.3.2. Stage 2: Feature Extraction
Extracting textural features is the main process of the feature extraction stage. The potential of textural features in measuring variations of digital numbers in the spatial domain enables us to use them in satellite image processing, especially after natural hazards. Natural hazards suddenly cause damage of objects of the earth’s surface leading to reflectance changes in the spatial domain. Therefore, the textural features extracted from remotely sensed optical data are widely used for detecting damaged areas. Based on previous works presented in the literature review section, different texture extraction methods have been used in damage detection applications. In most of the previous works [20,23], Haralick features were widely chosen for extracting textural features. For this reason, these features are also used in our study. For further study on the Haralick texture extraction method, please see [41,42].
In this study, in order to detect damaged buildings from textural features, variance, homogeneity, and contrast features were chosen, which can be calculated from Equation (2), Equation (3), and Equation (4), respectively. The selection of these features was based on three reasons. First of all, three texture features with three linguistic terms and Gaussian membership functions (MFs) generate 24 unknown parameters regarding MFs in a Mamdani fuzzy inference system which should be simultaneously set. It seems that the number of unknown parameters is sufficient to test an optimization algorithm and the selection of them by an expert is a difficult task. For the second reason, based on equations of the mentioned features, it appears that correlation among the selected features is low. Finally, the performance of our decision making system and advanced machine learning techniques would be investigated in similar conditions (i.e., with three texture features). Hence, the selection of the mentioned texture features is within the path of objectives of this study.
There are two important points about extracting textural features in this study. For the first point, for preserving the negative effects of non-building pixels on extracted textural features, building pixels are specified by the pre-event map and are only used to extract textural features. For the second point, to compare the three mentioned texture features, they should be standardized. Hence, Equation (5) is employed to standardize the extracted textural features.
2.3.3. Stage 3: Decision Making
After extracting textural features, it is necessary to employ a decision making system [43] or a machine learning technique to provide a relation between the extracted features and the damage extent of buildings. In this study, a decision making system based on MFIS and GA is used to provide the mentioned relation. MFIS was firstly proposed by Zadeh [44]. In a MFIS, initially, crisp input values are converted into fuzzy values by input MFs. This is called “fuzzification”. In fact, fuzzification is a mapping process that is performed using membership functions. In this process, membership functions act as connectors among crisp and fuzzy spaces. Then, using fuzzy values, the inference system and existing rules in the fuzzy rule base, fuzzy output values are generated. Finally, the fuzzy output values are transformed into crisp output values by a defuzzification method [31].
In general, a MFIS is a function of three main parameters according to Equation (6) including: parameters of membership functions (), rules (), and parameters of the inference system (). Therefore, in designing a MFIS, two essential tasks must be performed by an expert: (1) designing rules of the fuzzy rule base and parameters of the inference system, and (2) designing and selecting type and parameters of input and output MFs. In this study, we focus on the second task, because the number of rules in our study is minor and can be easily selected and also an expert could select the small parameters of the inference system.
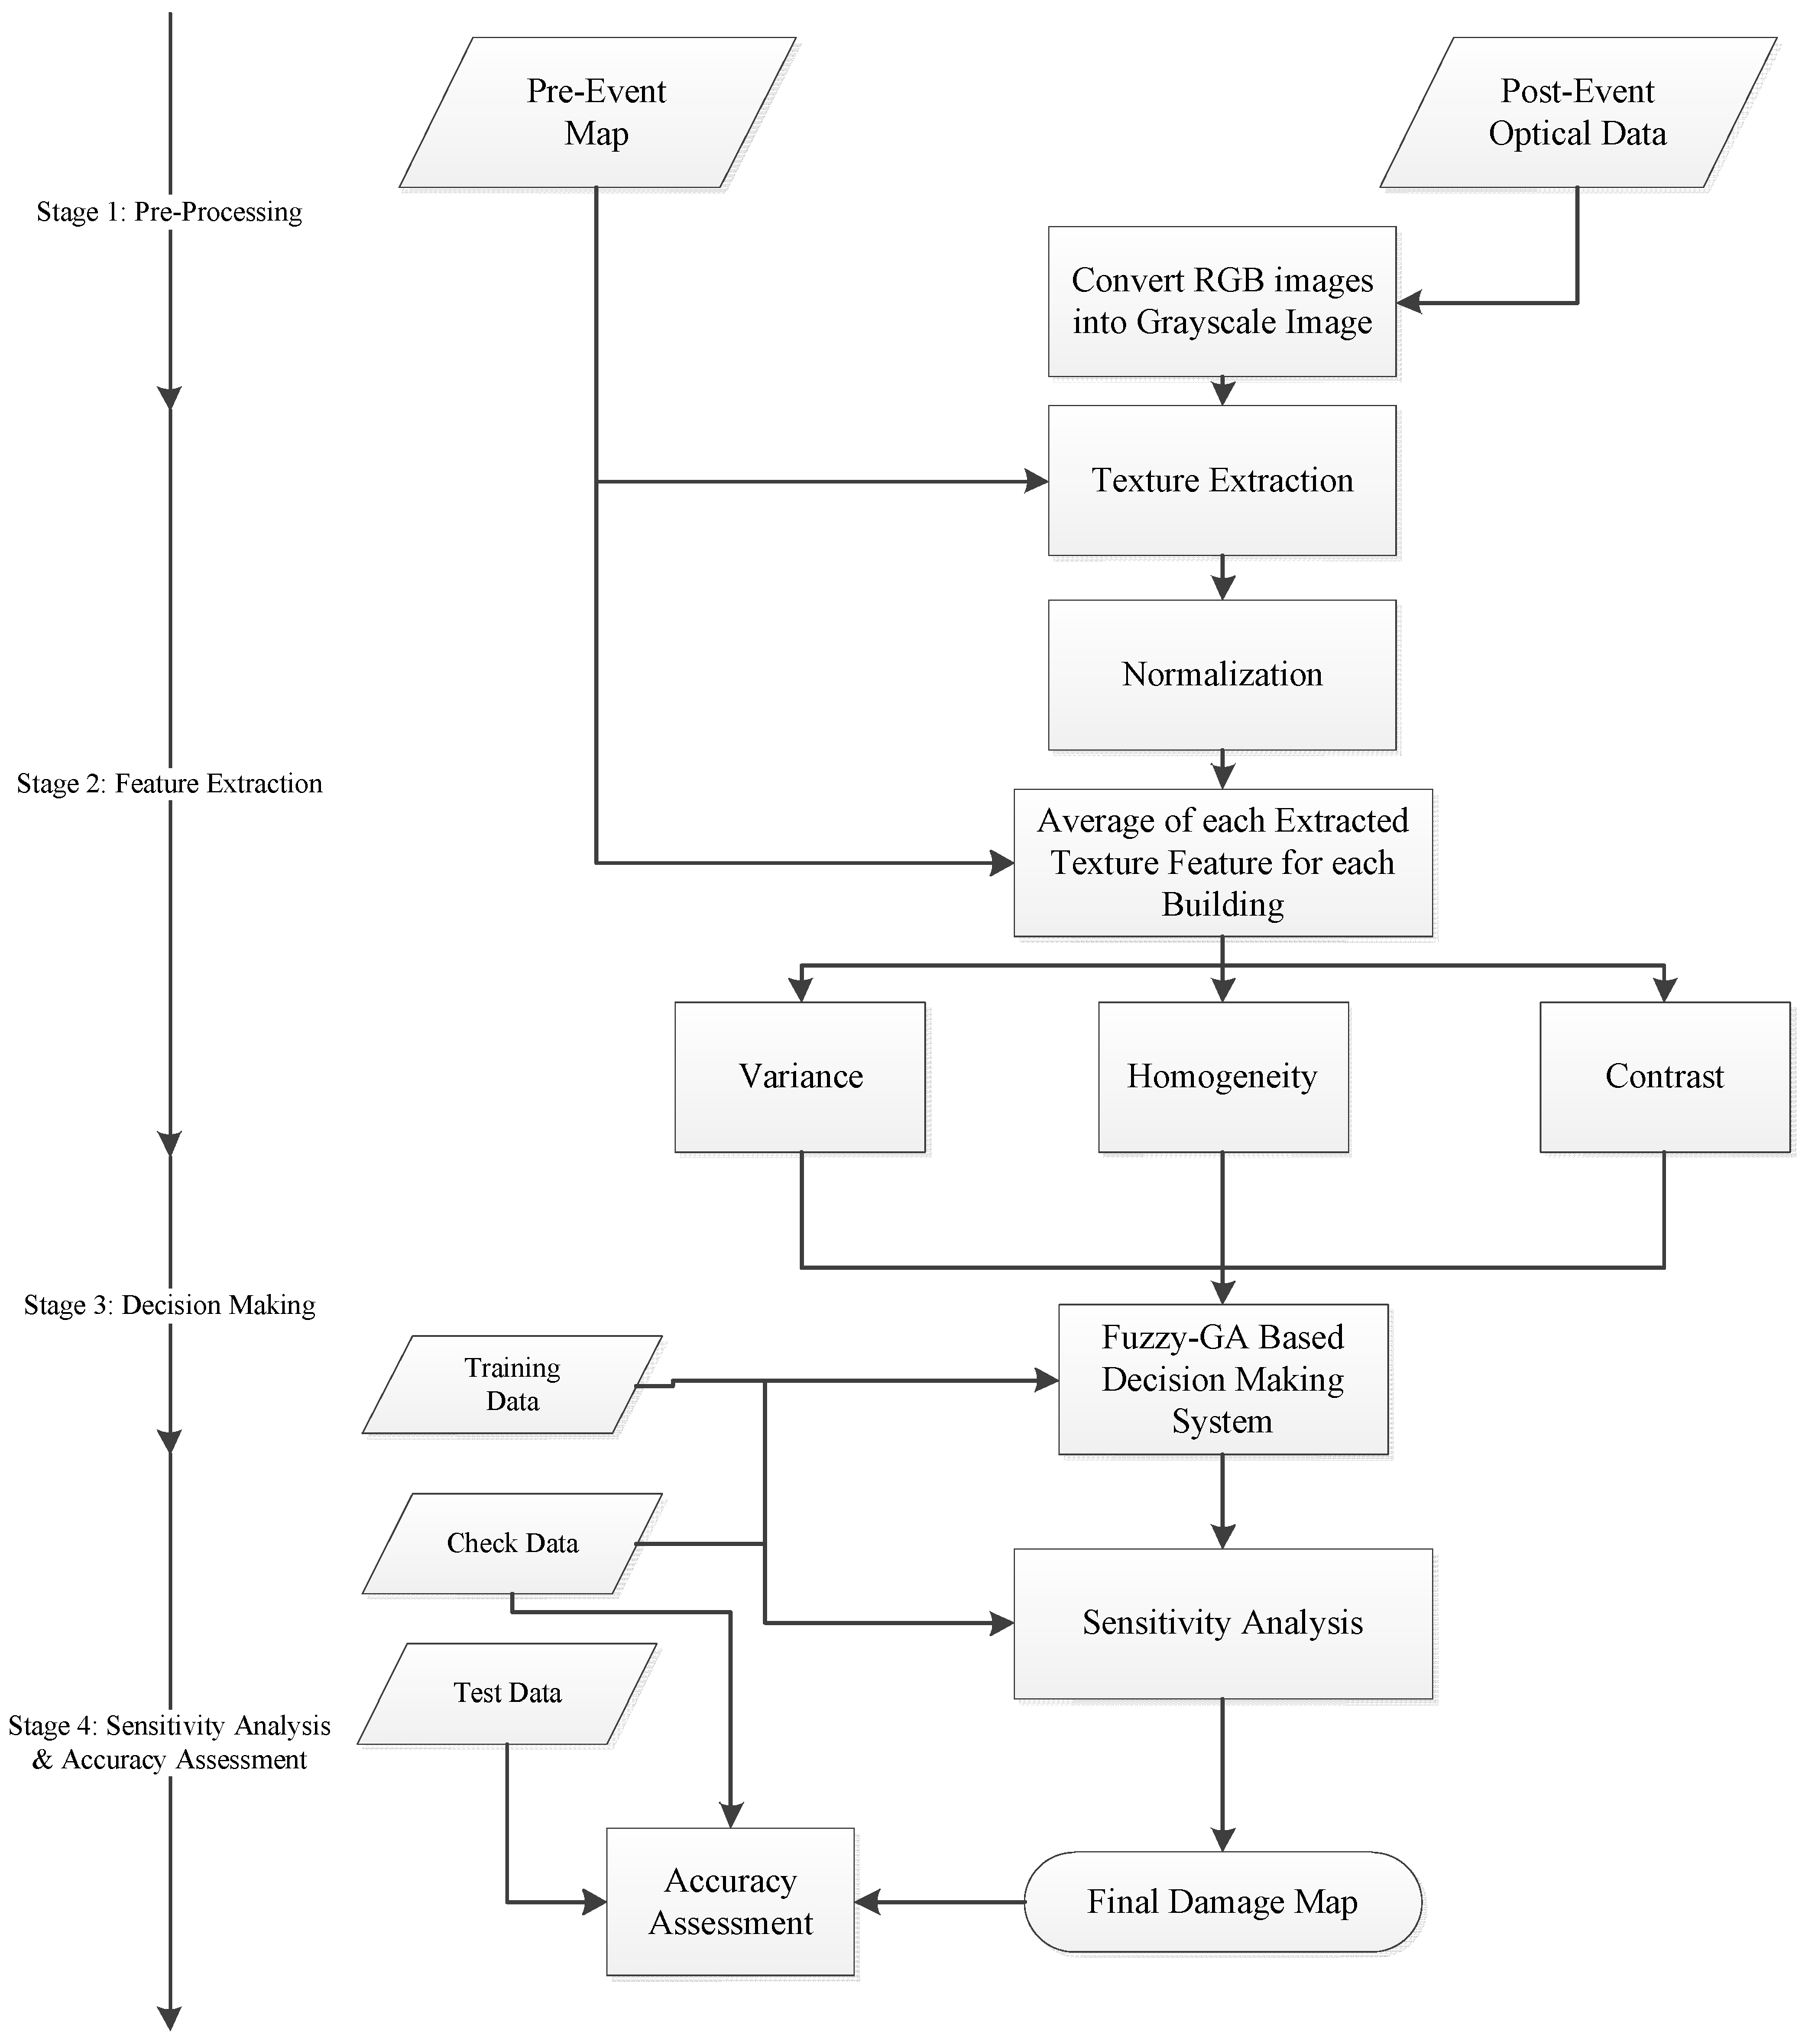
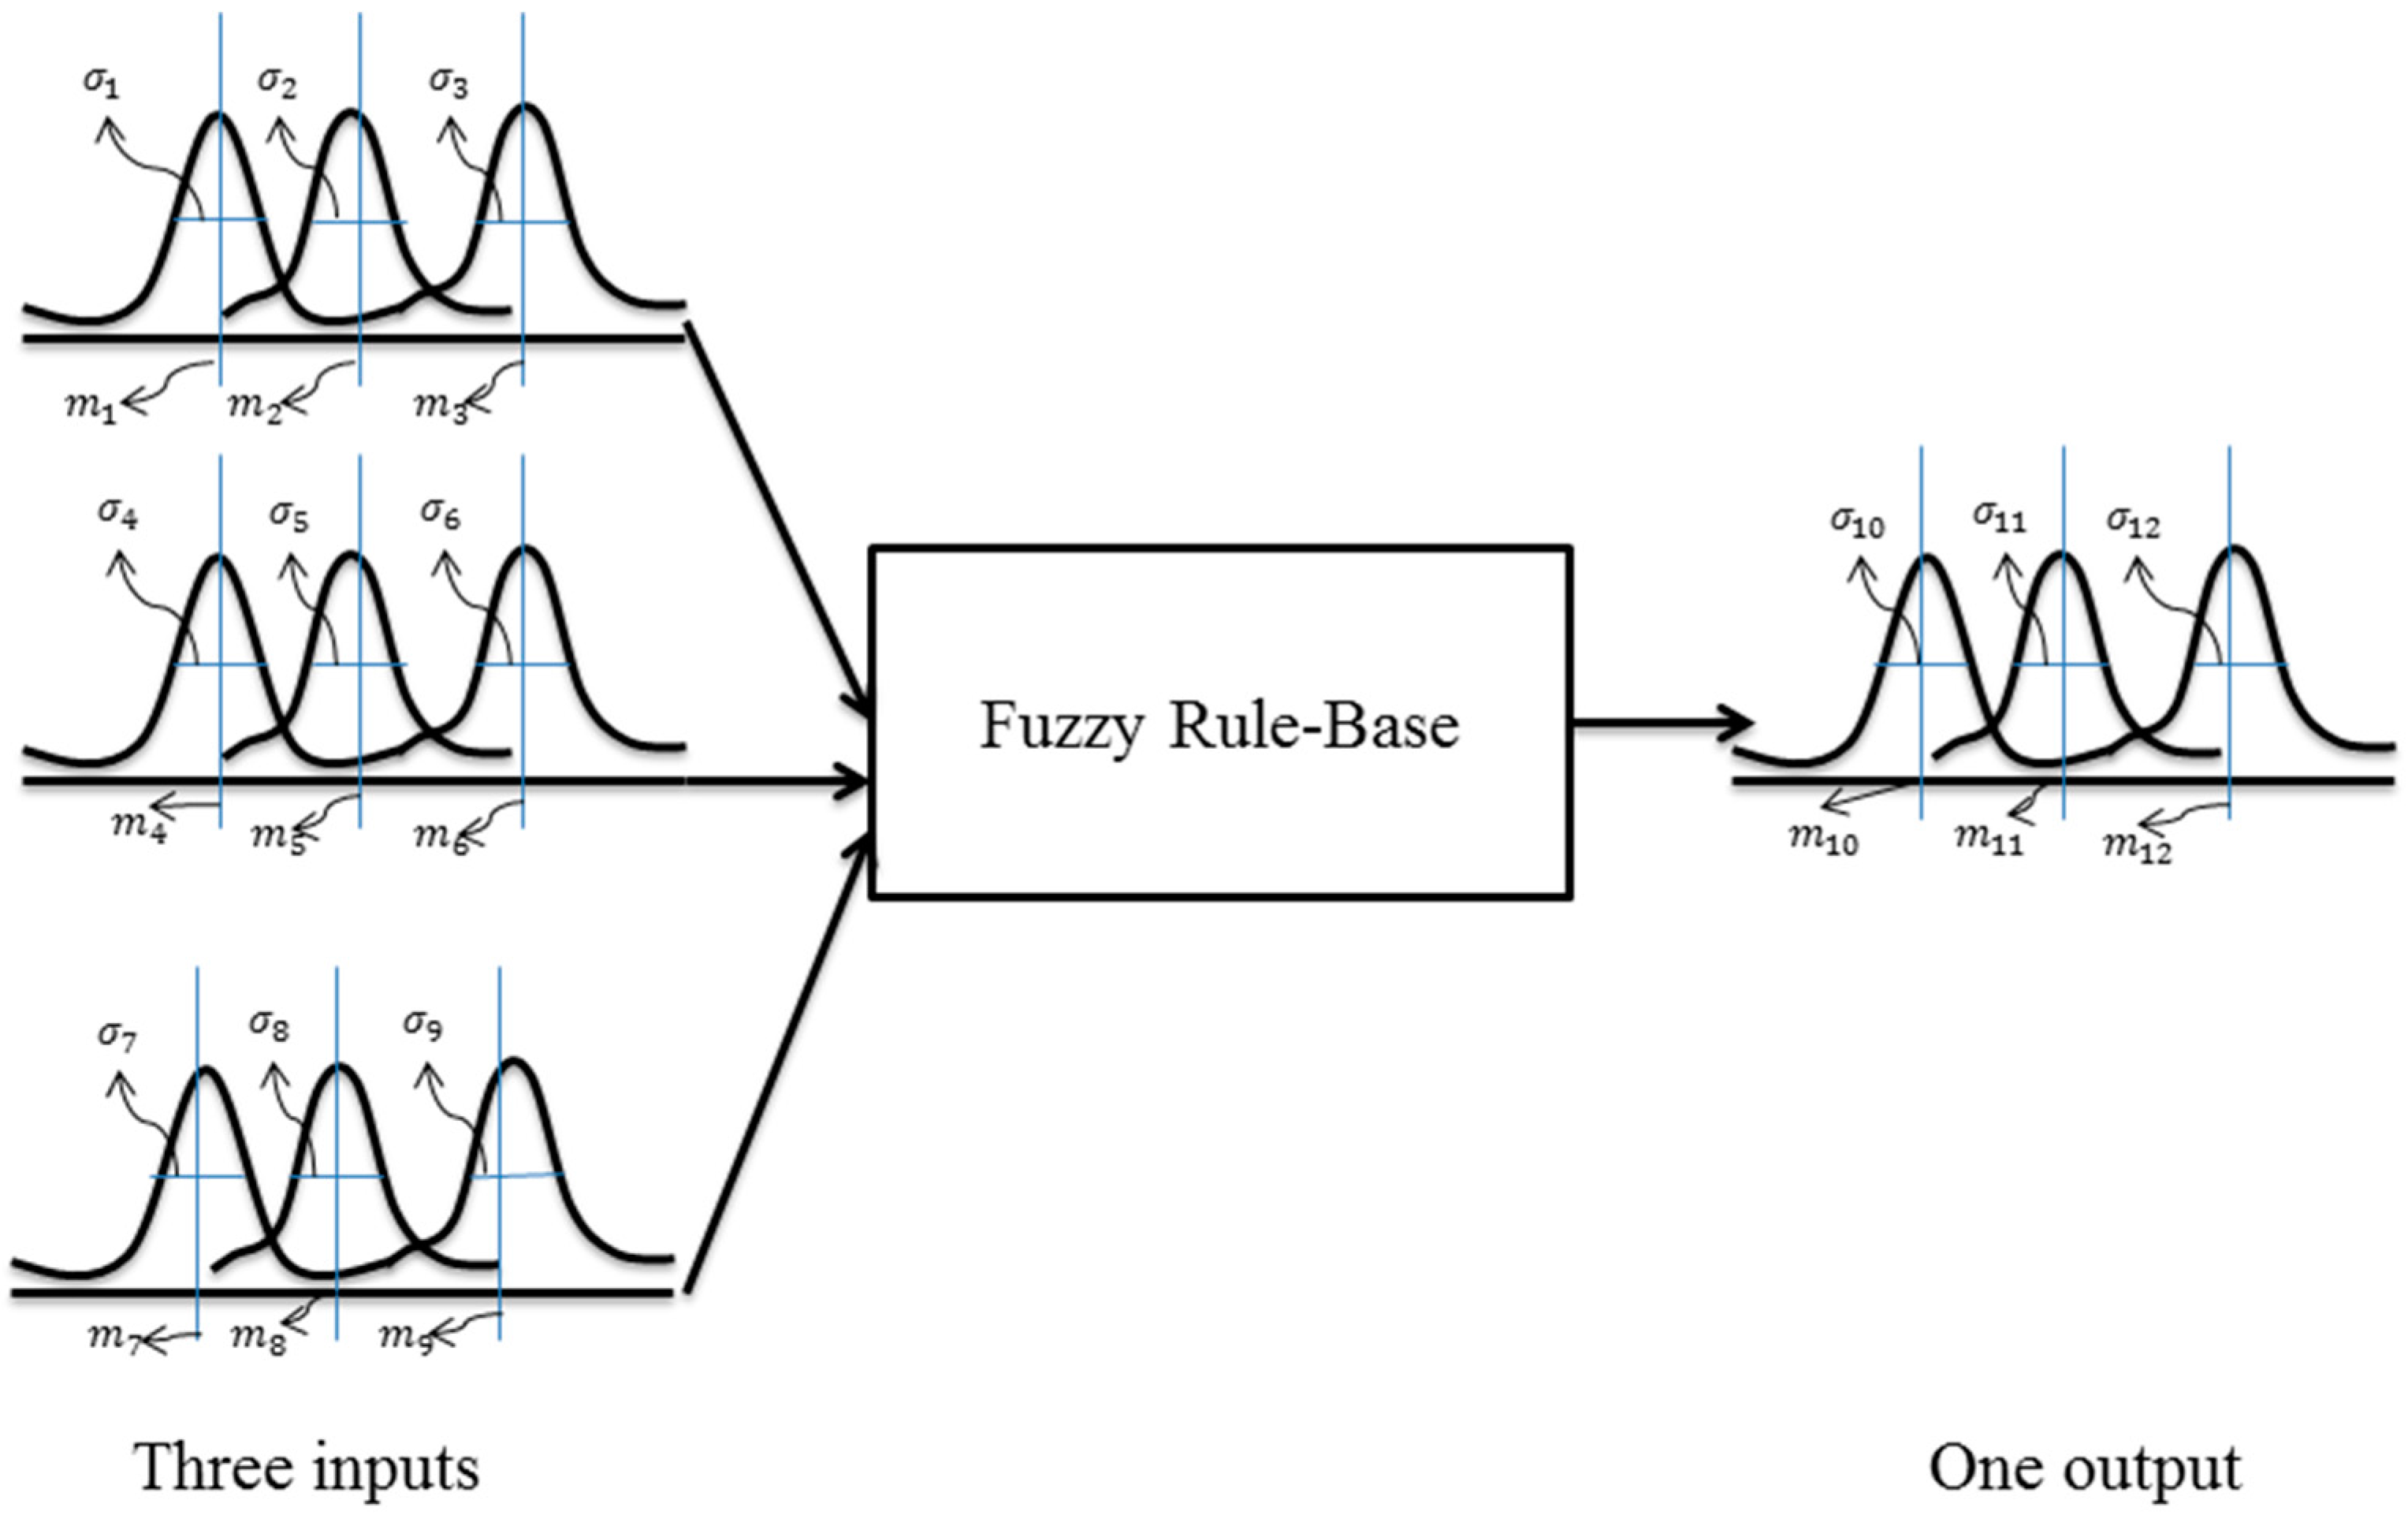
For expressing the importance of the second mentioned task, an example is employed here. Please note that this example is also used as a MFIS in our damage detection method. A MFIS with three inputs and one output (its MF type is Gaussian) is presented in Figure 2. Suppose three rules similar to Equations (7) to (9) have been designed by an expert. Based on these equations, we can express that is a function of some unknown parameters (Equation (10)).
According to Figure 2 and the designed rules, 24 unknown parameters of MFs (Equation (11)) must be set by an expert. From our viewpoint, the procedure of selection of 24 unknown parameters in a continuous-space is an optimization problem. For this reason, in this study, Genetic Algorithm (GA), as an optimization algorithm, is employed to select unknown parameters [45,46]. The ability of GA in selecting optimum answers was the main reason for the selection of this algorithm. In fact, in this research, MFIS and GA are integrated to select appropriate parameters of MFs leading to the best result. In the following, concepts of GA and its integration with the MFIS are presented.
Genetic Algorithm (GA) is based on the mechanism exhibited by nature incorporating the robustness of biological systems as presented by Charles Darwin [47]. This algorithm is one of the powerful artificial intelligence algorithms, which selects the optimal answer using a random searching method in the search-space.
To find the optimal unknown parameters regarding MFs of a fuzzy inference system using GA, five main steps are employed in GA. The employed steps are presented below:
The first step: initial parameters regarding MFs of the fuzzy system are generated in a random manner. Suppose the number of the population is equal to k and the generated parameters are:
After generating the initial parameters, it is necessary to use a cost function to calculate the efficiency of each population. It should be considered that the fitness function and objective function terms are also used instead of the cost function one. The cost function is at the heart of our proposed system. The integration of the fuzzy system and GA is the main task of this function. Moreover, the cost function is responsible for assessing population. In this study, to obtain the cost of population, some training and check samples according to Equations (13) and (14) are considered. The duty of training samples is to learn the fuzzy-GA system. Furthermore, check samples are employed to prevent an over-learning problem.
To estimate the cost of each population for training samples (Equation (15)), at first, the parameters of the MFs are updated using the population (Equation (16)). For population r, the updated MFIS is represented by Equation (17). Then, using the updated MFIS and Equation (18), the damage extent of training samples is obtained from Equation (19). Finally, the cost of population r () obtained from the training samples is calculated from Equation (20). The cost of check samples is also estimated in the same way.
The second step: In this step, new MF parameters are obtained from crossover function and population generated by the previous step. Crossover is one of the important functions in GA, which is responsible for generating new children (parameters of fuzzy systems) from their parents. To generate new children, the number of uses of crossover function () should be specified. To this end, at first, parameter is calculated from the crossover rate and the number of population () using Equation (21). Then, the number of uses of crossover function is obtained from Equation (22). For generating new MF parameters from the crossover function, first, two random parents (like and ) are chosen. Afterwards, new children are achieved from Equation (23). Since unknown parameters were defined in specific ranges, there are two conditions according to Equations (24) and (25) for undefined values. Finally, by using Equations (15) to (20), costs of the new children are calculated and inserted into Equation (26) [47].
The third step: In this step, one of the parameters of a population is changed using the mutation function. The mutation is another important function in GA. The mutation function has an undeniable role in solving the local minimum problem in GA. To generate new children by the mutation function, the number of uses of the mutation function () should be specified. To this end, at first, parameter is calculated from the mutation rate and the number of population using Equation (27). Then, the number of uses of the mutation function is obtained from Equation (28). For each use of the mutation function, one random population is selected. Afterwards, a new child is achieved. Equation (29) depicts all new children achieved from the mutation function. Undefined values of variables are corrected using Equations (24) and (25). Finally, using Equations (15) to (20), costs of the new children are calculated and inserted into Equation (30).
The fourth step: In this step, using elitism operator, GA is able to preserve the best answer of iterations. To this end, at first, all population and costs obtained from the previous steps are inserted in two pools according to Equations (32) and (33). Afterwards, they are sorted in descending order by Equation (34) (i.e., a population with the minimum cost value is the best answer). Finally, we select population with minimum cost values as the best answers from the sorted population (Equation (35)). With the elitism operator, it is possible to preserve the best solutions and GA can be converged on the best solution. In fact, with deep insight into this step, we can conclude that the artificial intelligence of GA exists in the fourth step.
The fifth step: The second, third and fourth steps should be repeated to obtain the best solution. The first row of Equation (35) is the best solution with the minimum cost value.
2.3.4. Stage 4: Damage Map and Accuracy Assessment
In order to assess the accuracy of the final damage maps, the confusion matrix and statistical descriptors extracted from this matrix are considered. To generate a confusion matrix, it is necessary to employ training, test, and check samples. To this end, the damage extent of some buildings was specified as training, test, and check samples. More information about these samples is presented in Section 3.2. After generating the confusion matrix, statistical descriptors are employed to specify the accuracy of results. For this purpose, some statistical descriptors, including overall, user, and producer accuracies extracted from the confusion matrix, are used to display the accuracy of the proposed system. Based on a sample confusion matrix presented in Table 3, the overall, user, and producer accuracies are calculated from Equations (36) to (38), respectively.
Sensitivity Analysis
A sensitivity analysis should be carried out to confirm the stability and the reliability of the proposed system’s results with respect to changes of its parameters [48,49,50]. In this study, the sensitivity of the Fuzzy-GA is assessed against any changes in GA’s parameters: (a) the number of iterations; (b) the number of population; (c) the mutation rate; and (d) the crossover rate. In the previous works [2,13], a step-by-step sensitivity analysis method was used. However, step-by-step sensitivity analysis methods are unable to consider simultaneous changes of parameters of a system [51]. For this reason, in this study, a grid-partitioning based sensitivity analysis method was performed to study the effect of change of parameters on the accuracy of the final results [52]. In this method, the mentioned parameters of GA are changed in a limited and meaningful range to achieve accurate results. The range of parameters was adjusted based on experimental results and our knowledge about GA.
3. Results
3.1. Feature Extraction Considerations
In the feature extraction stage, variance, homogeneity, and contrast features were extracted by producing the probability matrix (P) for a distance of 1 pixel, orientation angles of 0, 45, 90, and 135 degrees and a window size of 3 × 3. Our experimental results showed that increasing the window size and the distance parameter negatively affects the accuracy of the building damage detection methods. For this reason, the mentioned parameters were chosen for producing textural features. The textural features were finally calculated from the average of features obtained on all orientation angles.
3.2. The Number of Training, Test and Check Samples Used over Area 1, Area 2, and Area 3
Training, check, and test samples must be used in modeling and validation processes of the Mamdani fuzzy system. To this end, two different sources were employed to extract these samples from the Haiti and Bam areas. The Haiti building damage atlas (the first source) was used to collect the mentioned samples over the Haiti area (Area 1 and Area 2). In this atlas, buildings were classified as undamaged (D1), substantial to heavy damage (D3), very heavy damage (D4), and destruction (D5). Moreover, according to [13], the damage extent of buildings over the Bam area was specified using the visual interpretation of an expert on pre- and post-event high-spatial resolution images (the second source). Table 4 shows the number of training, check, and test samples selected over Area 1, Area 2, and Area 3.
3.3. Considerations for Implementing the Fuzzy System
For implementing the fuzzy system, in this study, its parameters were adjusted according to Table 5. Based on the opinion of an expert about the number of linguistic terms and results presented to [2,13], it seems that a number of three MFs for each input or output variable are appropriate for building damage detection. Moreover, according to the previous works [2,13], the Gaussian MF is efficient and robust for damage detection application, therefore this function was also utilized in this study. Furthermore, 12 fuzzy rules were designed by an expert, which were employed over three selected areas. In addition, Min, Max, Min and Max operators were chosen for “and”, “or”, “aggregation” and “implication” methods, respectively.
3.4. Sensitivity Analysis on Fuzzy-GA Parameters
In order to perform the sensitivity analysis of results with respect to GA parameters, including the number of iteration (), the number of population (), the mutation rate () and the crossover rate (), these parameters were varied in a limited range. Table 6, Table 7 and Table 8 depict the overall accuracy of our proposed system obtained from variations of GA parameters over Area 1, Area 2, and Area 3, respectively. The range of values of parameters was selected based on experimental results and our knowledge about GA. Here, our description is presented on the range of the selected values. In general, low mutation rates are selected in GA, because increasing the mutation rate leads GA into a random search method. For this reason, mutation rates 0.1, 0.2, and 0.3 were chosen in this study. In contrast with the mutation rate, the selection of high values for the crossover rate guaranties optimized solutions to be achieved in a speedy manner. Hence, crossover rates 0.7, 0.8, and 0.9 were selected. Furthermore, based on the diagram of convergence of GA (see Section 3.5), it seems that GA is approximately converged after the 100th iteration. Therefore, the sensitivity of results with respect to iterations 100, 200, and 300 was tested. Finally, based on the previous works [53], the effect of population 50, 150, and 250 on the accuracy of the proposed damage detection system was investigated.
3.5. Results of Optimized Fuzzy System
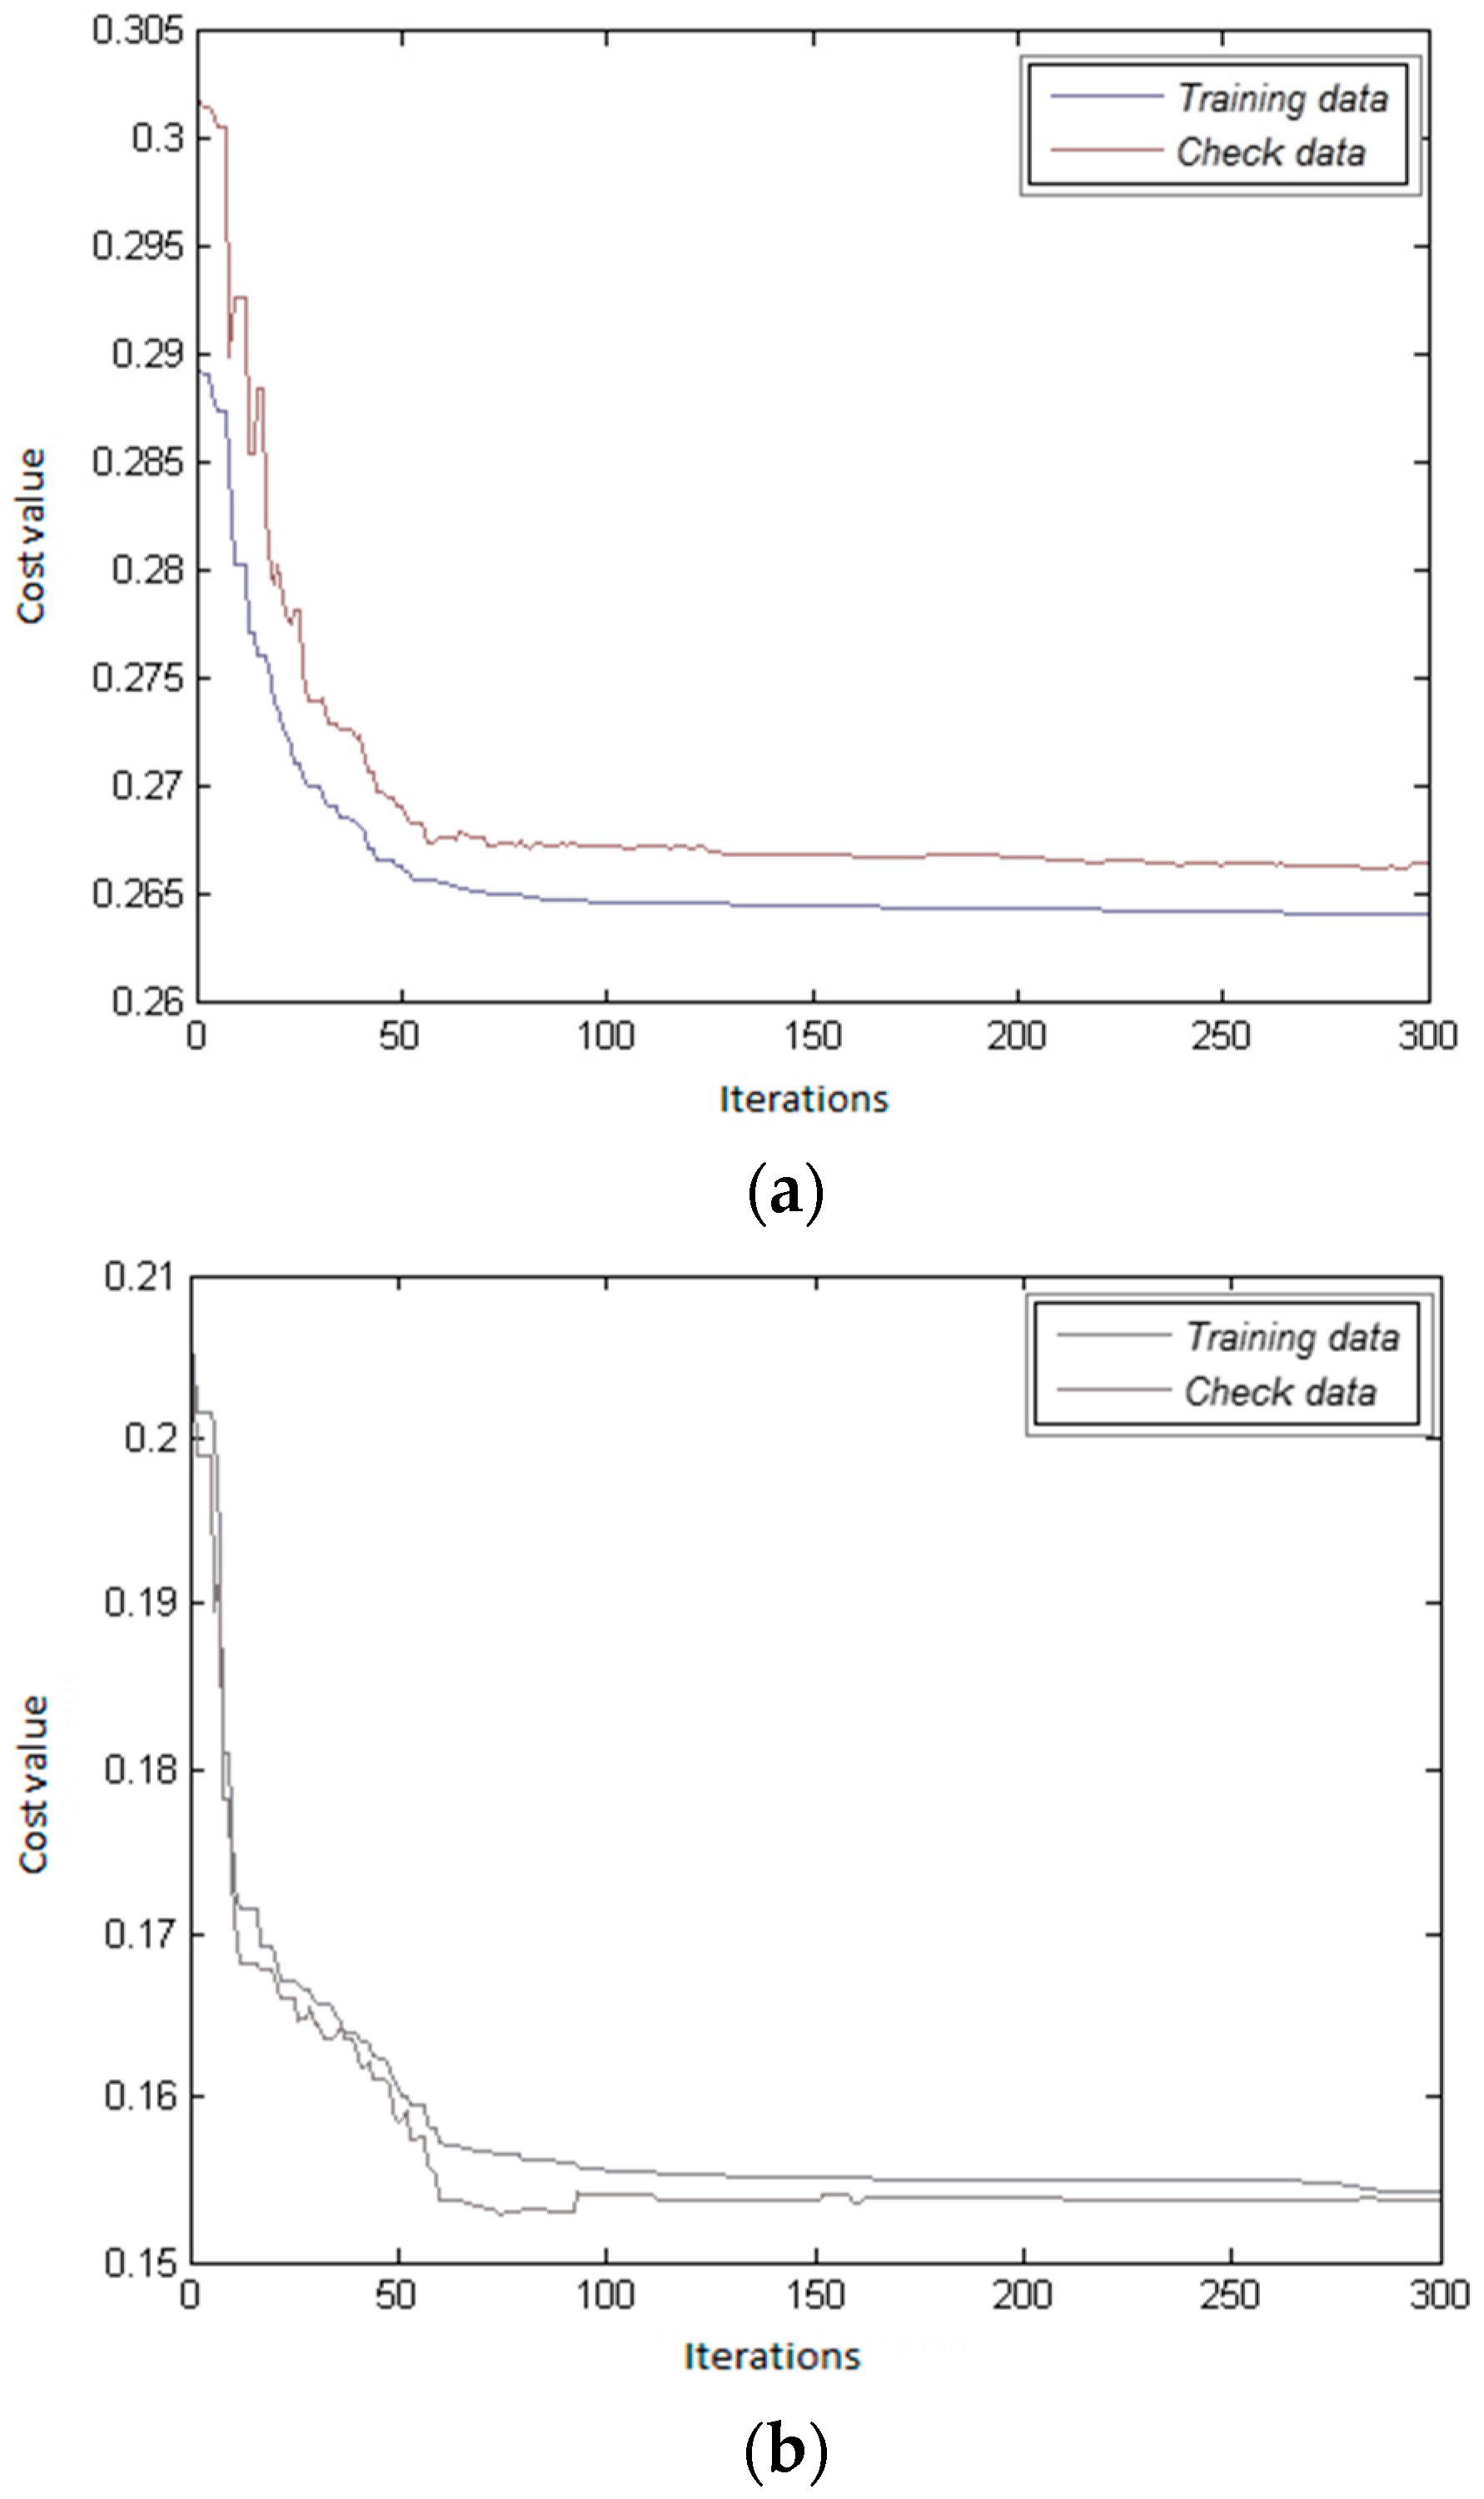
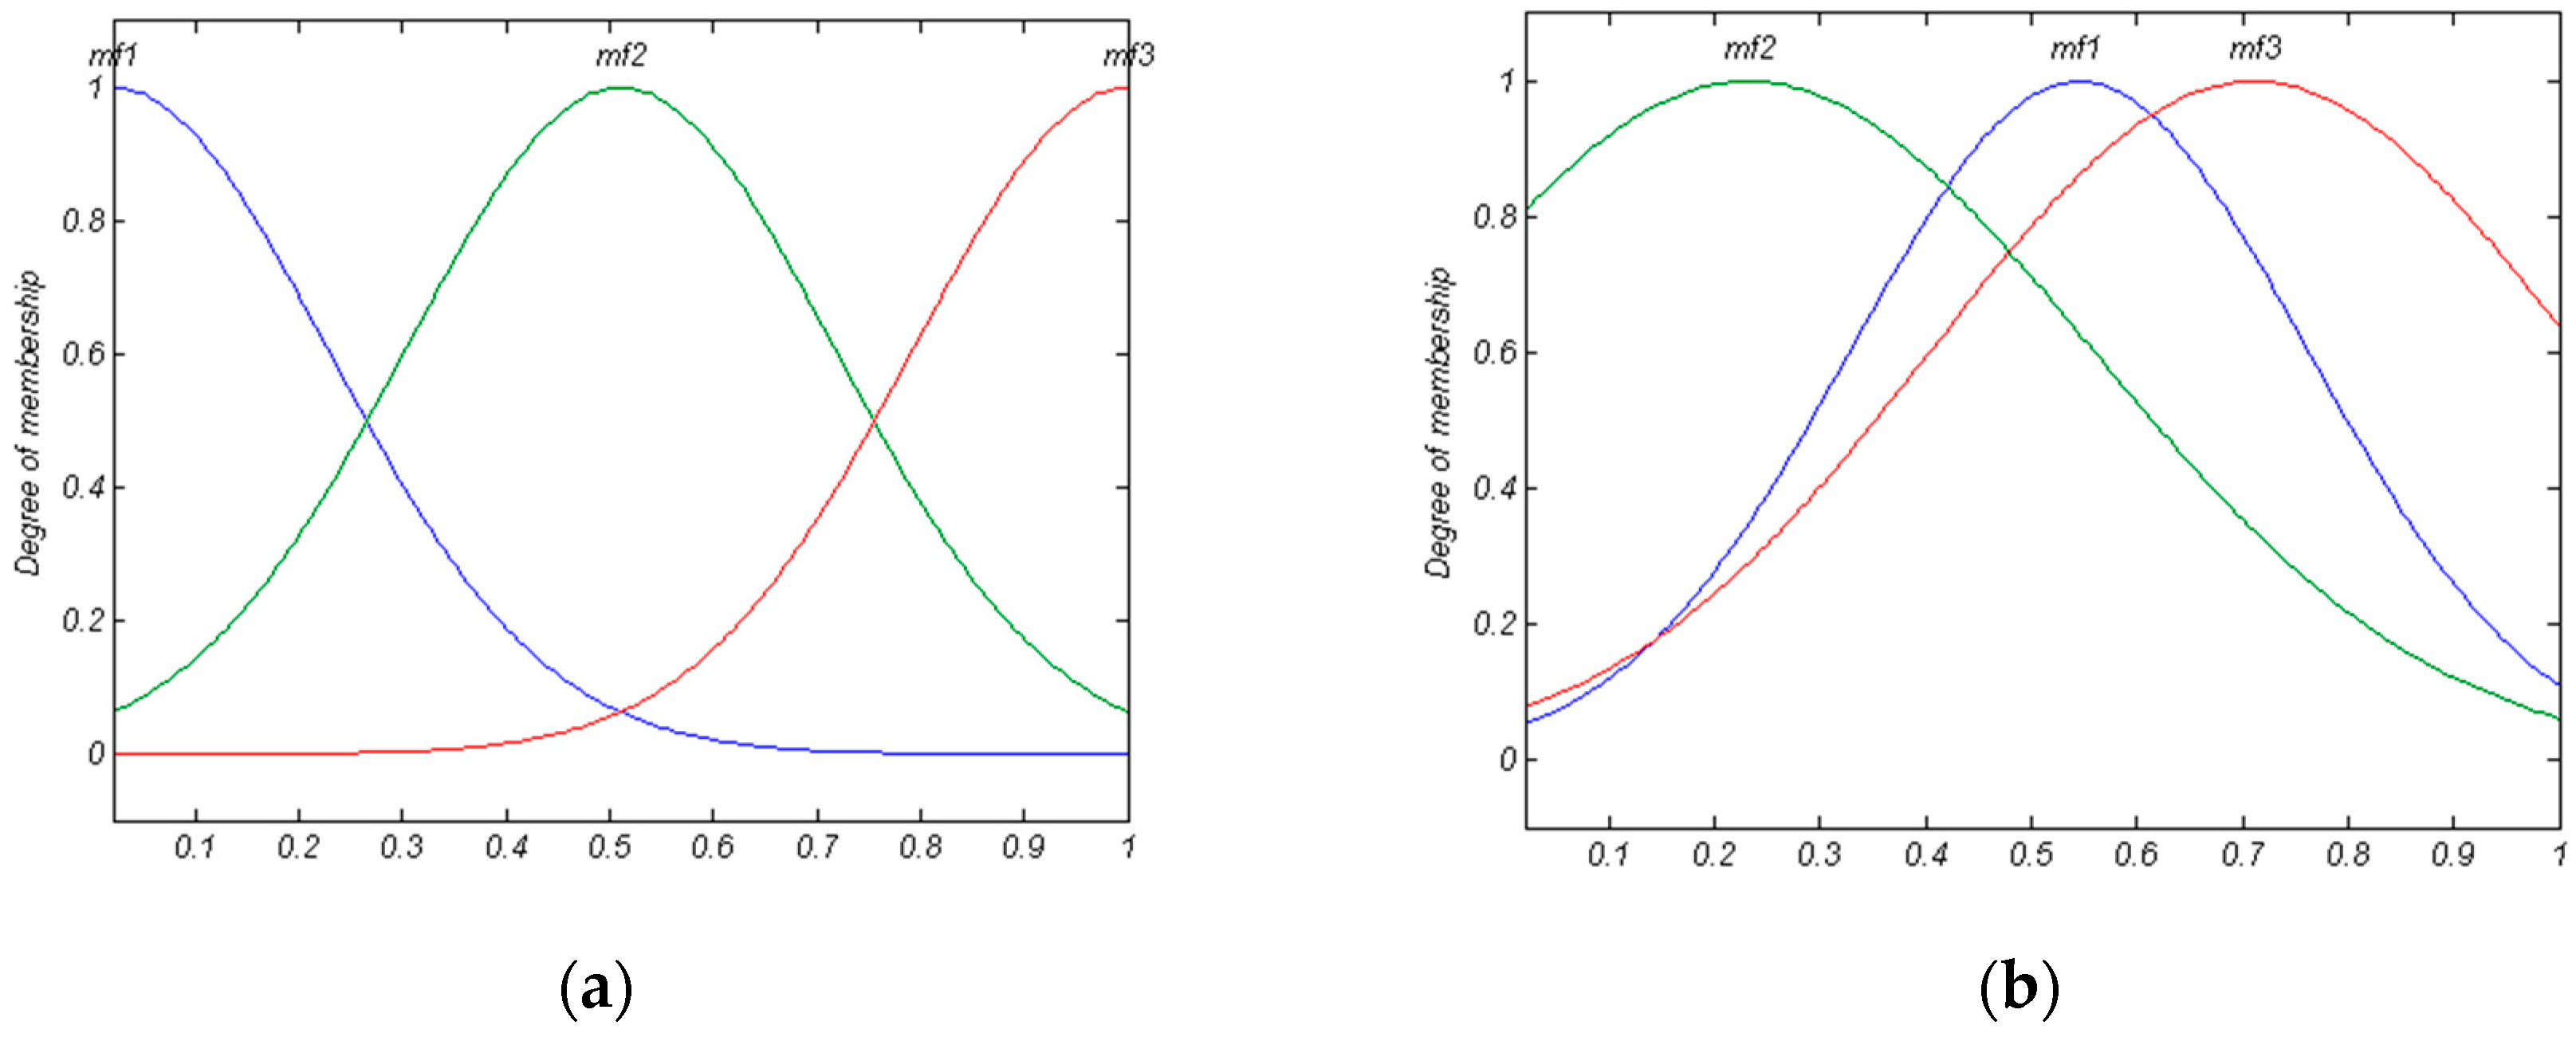
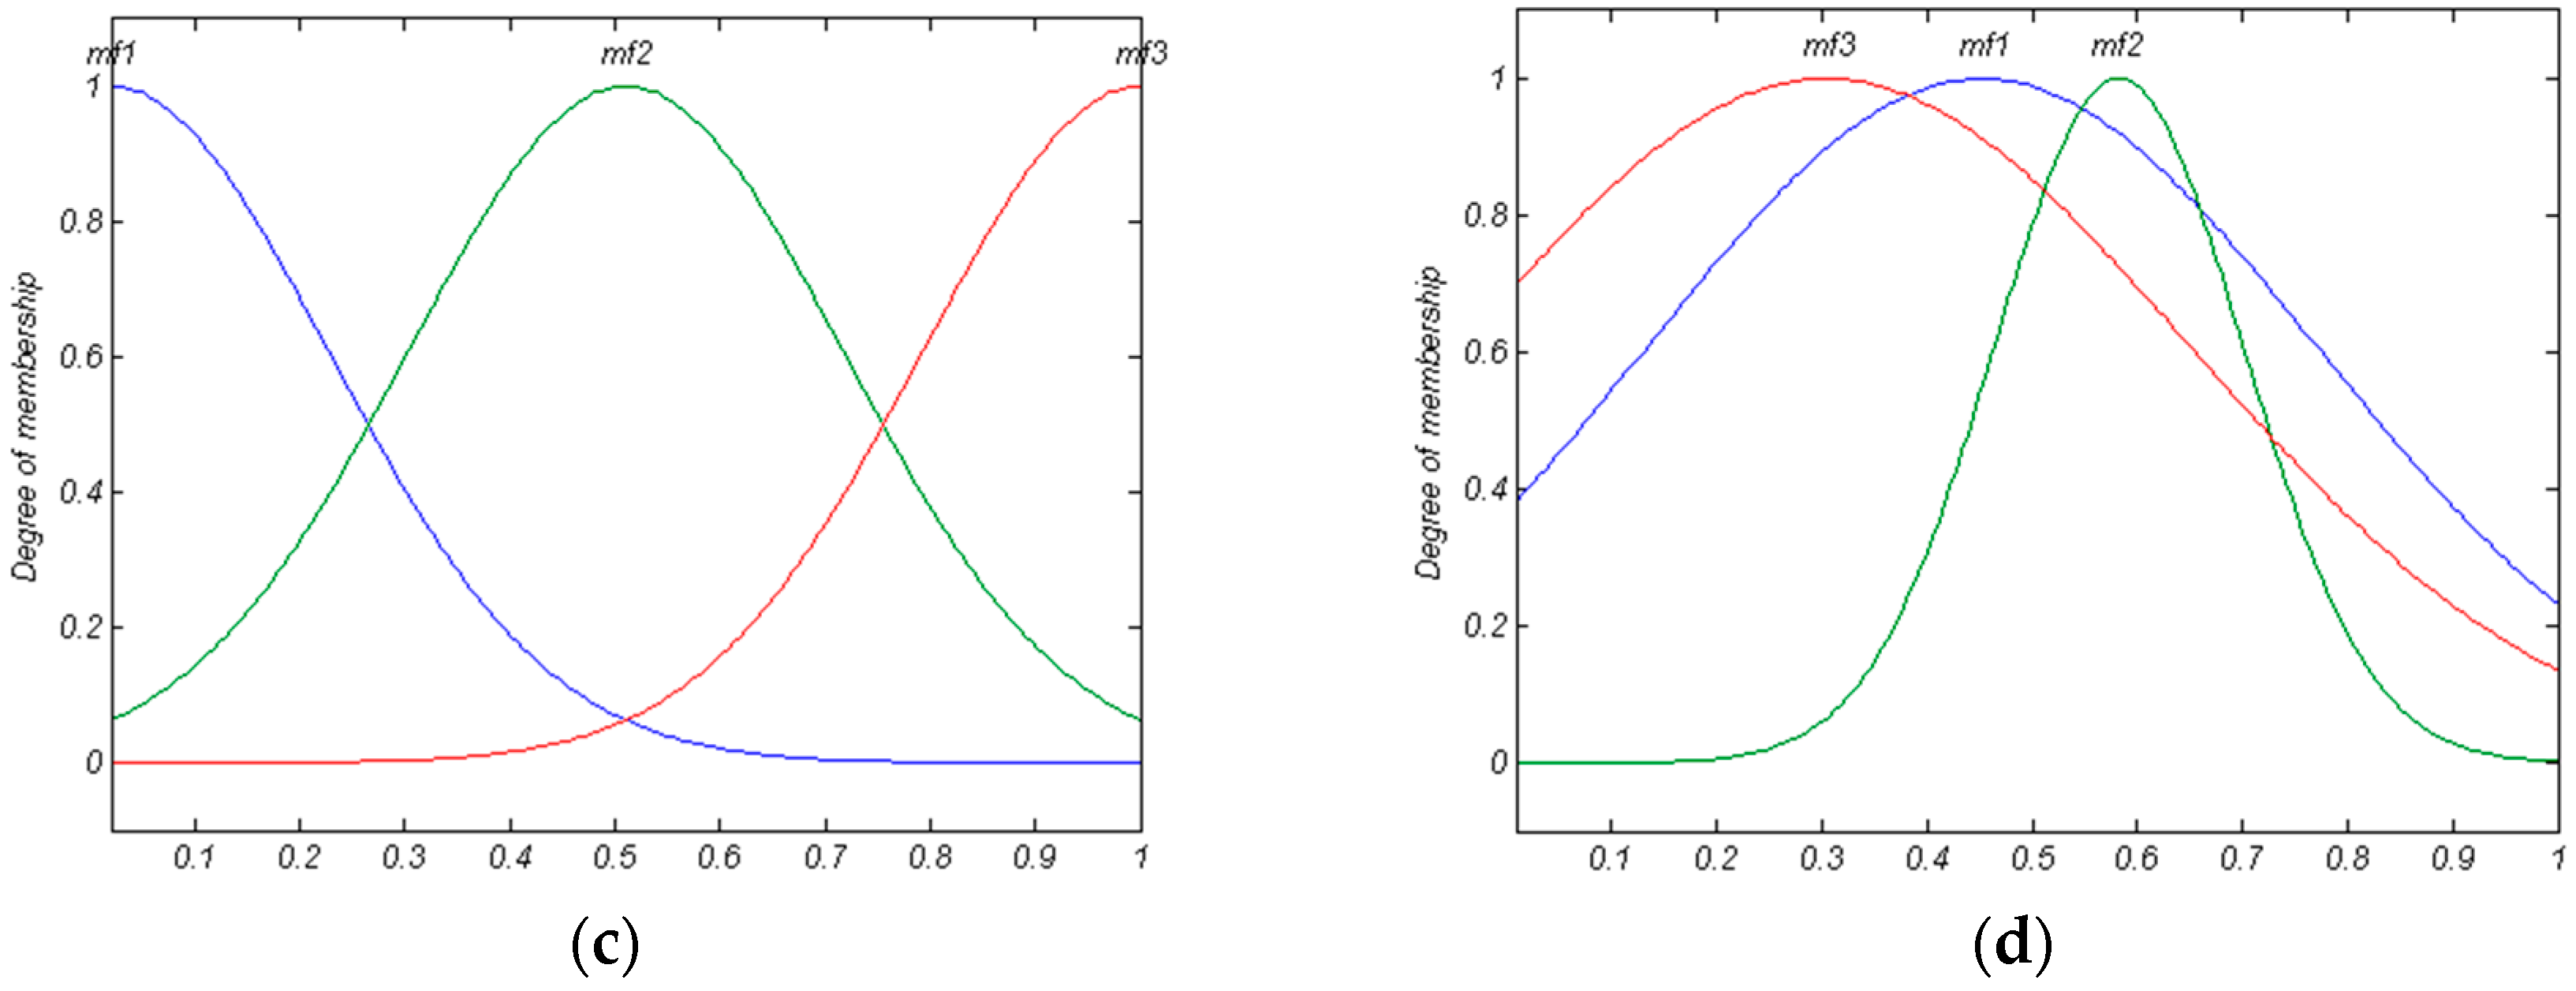
In this section, results of optimized fuzzy systems, including the diagram of convergence of GA and optimized parameters regarding MFs, are presented. Figure 3 depicts the cost value of the best population with the minimum cost at 300 iterations over Area 1 and Area 3. Figure 3 shows that 300 iterations are appropriate for converging GA in this research. Moreover, in order to illustrate the importance of GA in selecting parameters of the fuzzy system, changes of MFs of input “2” and input “3” in an experiment are presented in Figure 4. Based on Figure 4, it is easily observed that vast variations must be applied on MF parameters to achieve optimized results. Therefore, it seems that selecting these parameters by an expert is not an easy task.
3.6. Accuracy Assessment by Confusion Matrix
According to Section 3.5, to produce a confusion matrix, it is necessary to specify the number of classes and their definitions. In this study, we consider two damage classes including “damaged” and “undamaged” regarding each building. The “damaged” class includes very heavy damage (D4) and destruction (D5) whose definitions of D4 and D5 were presented in European Macroseismic Scale 1998 (EMS 98) [54]. To the best of our knowledge, substantial to heavy damage class (D3) which is related to cracks on the buildings facades would not be detected by our optical data used [54]. Therefore, “undamaged” class includes negligible to slight damage (D1) and D3. The confusion matrix of training, test and check samples as well as some statistical descriptors such as user and producer accuracies are presented to Table 9. Moreover, the range of overall accuracy of the generated damage maps with 90% confidence level is presented in Table 10.
3.7. Damage Map Resulting
In this subsection, final building damage maps regarding Area 1, Area 2, and Area 3 extracted from the proposed method are presented. Figure 5 shows the building damage maps of the mentioned areas.
4. Discussion
In this section, a comprehensive discussion about the obtained results is presented. Moreover, sources of error of the proposed method are specified. Furthermore, the accuracy and precision of Fuzzy-GA are compared with advanced machine learning techniques.
Based on the convergence diagram of GA presented to Figure 3, it is concluded that GA has been fully converged. Figure 3 shows that the selected parameters regarding GA were appropriate for providing a robust fuzzy system. Moreover, based on Figure 3, Fuzzy-GA succeeded in decreasing the cost value of training and check samples over the selected areas. It should be considered that the reduction of cost value directly improves the accuracy of the final results. These results show that the change of parameters of MFs in a fuzzy system is very important in obtaining an accurate result. Furthermore, based on Figure 4, in order to obtain more accurate results, vast variations should be performed on parameters of MFs (i.e., mean () and variance () of Gaussian MF). Owing to employing an optimization algorithm (i.e., GA) in our study, the selection of the optimized parameters was carried out in a semi-automated way. However, it seems that adjusting these parameters in a manual way is not an easy task.
In this part, conclusions obtained from the sensitivity analysis stage are presented. Based on sensitivity analysis results (i.e., Table 6, Table 7 and Table 8), it was found that the selected parameters are appropriate for extracting an accurate damage map. Moreover, based on the outcomes, the accuracy of the final damage maps varies over a specific range. For example, overall accuracies of 90%, 91%, and 92% were achieved a lot over Area 3. In fact, in this study, it seems that the optimum answer is defined for a limited continuous range of variables. For this reason, increasing or decreasing the parameters of GA in the defined ranges does not follow a predictable procedure. Hence, based on these results, it appears that step-by-step sensitivity analysis methods presented to [2,13] are not proper for performing the sensitivity analysis in optimization-based decision making systems.
Based on the description presented in the previous paragraph on the range of optimum answers, it is better to present the overall accuracy of the obtained damaged maps in a form. In this form, is the most probable overall accuracy and is the most probable range of overall accuracy. Based on Table 10, overall accuracies obtained on Area 1, Area 2, and Area 3 were equal to 76.88 ± 1.22%, 65.43 ± 0.29% and 90.96 ± 0.15%, respectively. Based on these results, the study area and its characteristics completely affect the accuracy of the damage detection method. For example, Area 2 is a complex urban region. In this area, different types of buildings, including buildings connected with trees, buildings with small area, and gabled roof buildings, are observed. It should be considered that a complex area could spread many uncertainties and errors over the final damage maps (we will present the source of errors in the following). For this reason, the overall accuracy of the proposed system over Area 2 was lower than the other areas. In general, based on our visual observations from high-spatial resolution satellite images, Area 1 and Area 2 are more complex than Area 3. For this reason, the accuracy of our proposed system over Area 3 was higher than Area 1 and Area 2.
There have been many damage detection methods implemented in the Haiti and Bam areas [4,13,55,56]. However, it is a difficult issue to present a fair and comprehensive judgment between the existing methods over study areas and our proposed method, because based on our experimental results, study area and its characteristics affect the accuracy of damage detection methods. Results achieved on Area 1, Area 2, and Area 3 completely confirm our claim. In this part, we compare our achieved results with the outcomes of [13], because Area 3 of our study is similar to the selected area of the mentioned paper. Janalipour and Mohammadzadeh (2016) employed a Nuero-fuzzy decision making system in order to create a relation between geometrical features obtained from post-event satellite image and the damage extent of buildings [13]. They reported an overall accuracy of 76% for detecting damaged buildings. While, in our study, the use of Fuzzy-GA and Haralick textural features resulted in an overall accuracy of 90.96 ± 0.15%. Therefore, as a result, Fuzzy-GA and Haralick textural features outperformed Nuero-fuzzy and the geometrical features in detecting damaged buildings.
In this part, outcomes of Fuzzy-GA decision making system are compared with four advanced machine learning techniques, including bagging, boosting, random forests (RF) [57] and support vector machine (SVM), from viewpoints of accuracy and precision. It should be considered that results of the mentioned techniques and our decision making system were achieved with similar textural features. Hence, we can compare them with respect to each other. Based on [58], precision measures the degree of consistency among overall accuracies obtained in the selected areas (Table 6, Table 7 and Table 8) and accuracy shows the degree of closeness of measurements to true value. Based on the presented definitions and the form of presentation of overall accuracy (i.e.,), and can be used respectively as an accuracy measure and a precision creation. Based on Table 11, from the perspective of the accuracy, the Fuzzy-GA decision making system was more successful than bagging, boosting, and RF and SVM machine learning techniques. For example, over Area 3, overall accuracies of Fuzzy-GA, bagging, boosting, RF and SVM were respectively equal to 90.96%, 89.05%, 87.47%, 88.03% and 89.03%. To compare results of machine learning techniques with our proposed system from the viewpoint of precision, it should be considered that is a function of precision. A machine learning technique with the lowest is more precise than other ones. Because values of for our proposed system are lower than the corresponding values for the advanced machine learning techniques, it appears that Fuzzy-GA decision making system is more precise than bagging, boosting, RF and SVM machine learning techniques.
As mentioned, an urban area with a complex structure could spread many uncertainties and errors on outcomes. In this part, reasons of some misclassifications that occurred in the study areas are discussed. Table 12 depicts post-event optical image, variance feature, and damage map of nine miss-classified buildings. Building No. 1 is connected to a tall building. According to Table 12, parts from building No. 1 were covered with the shadow of the tall building. This is sufficient for texture extraction methods to produce high texture values in the roof of building No. 1. For this reason, this building was incorrectly classified as damaged class. The root of error of building No. 2 is similar to building No. 1 but with the difference that the overlapped shadow with this building resulted from a tall tree. This type error was frequently observed over Area 2 which is a complex urban area. Moreover, based on the Haiti building damage atlas, building No. 3 was classified as undamaged class by experts. While our visual interpretation showed that this is a damaged building. Hence, the proposed method correctly performed its task. Building No. 4 is an inclined damaged one. Based on the definition of inclined buildings [59] and Table 12, textural features are unable to detect these damage types. Therefore, the class of this building was incorrectly assigned as unchanged category. The use of LiDAR data may be an appropriate solution for detecting inclined damaged buildings.
The high spectral variation of pixels of undamaged building roofs over satellite optical images is a critical issue for texture-based damage detection methods, because the behavior of texture features of these buildings is similar to damaged ones. This issue was the main reason for classifying building No. 5 as a damaged one. Building No. 6 is a gabled roof one, in which parts of the roof of this building were destroyed. The texture extraction method correctly identified the damaged parts. However, it seems that the Fuzzy-GA decision making system was the main reason for classifying this building as undamaged category incorrectly. The class of building No. 7 is undamaged. The spectral variation of pixels of building No. 7 is very high. For this reason, our proposed system classified building No. 7 as damaged category. Based on our interpretation, the texture extraction method and Fuzzy-GA decision making system are two sources of error for the misclassification of building No. 8. Finally, the damage extent of building No. 9 is totally pancaked. The proposed system was unsuitable in the detection of the damage class of this building, because the variation of the digital numbers of the building roof was not high enough for assigning it to the damaged class. The use of a normalized digital surface model may be an appropriate way for identifying totally pancaked damaged buildings.
5. Conclusions
In this study, a semi-automated Mamdani based fuzzy decision making system was developed in order to identify damaged buildings using their textural features. For improving the automation level of the Mamdani fuzzy system, a genetic algorithm was used to find its optimized parameters concerning membership functions. The proposed system was tested over two areas of the 2010 Haiti earthquake and one area of the 2003 Bam earthquake. Based on the concept of our proposed system, its automation level is higher than other existing decision making systems [19,27,28]. Moreover, based on the statistical descriptors and results of bagging, boosting, RF, and SVM machine learning techniques, it seems that Fuzzy-GA decision making system is more accurate and precise than the mentioned techniques for building damage detection. Furthermore, based on outcomes of the sensitivity analysis stage, it seems that results of our proposed system are robust enough for building damage detection. Based on the results of the sensitivity analysis stage, the overall accuracy of 76.88 ± 1.22%, 65.43 ± 0.29% and 90.96 ± 0.15% was obtained on Area 1 (the Haiti earthquake), Area 2 (the Haiti earthquake), and Area 3 (the Bam earthquake), respectively. According to these results, the study area and its characteristics directly affect the accuracy achieved from the proposed method.
Based on the presented discussions, there are some major error sources: (1) high spectral variation of digital numbers over the roofs of undamaged buildings, (2) the shadow of tall buildings and trees connected with undamaged buildings, (3) inability of optical data in detecting inclined and pancaked damaged buildings.
As a future work, based on limitations of this study, it will be necessary to propose a damage detection method for integrating optical and LiDAR data. Moreover, due to the importance of the automation level of the damage detection method, it is important to present an automatic and accurate fuzzy decision making system in these future works. As another future work, the robustness of the Fuzzy-GA decision making system can be assessed over SAR data for detecting damaged areas. Moreover, the Fuzzy-GA decision making system can be adapted for applications that use hyperspectral bands. Because we are dealing with a high dimensional feature space, it is very important to select the appropriate bands using efficient feature selection methods such as [60,61]. Finally, owing to our proposed method which depends on a pre-event updated map, proposing an efficient building extraction method such as [62,63] for obtaining building footprints from pre-event optical images is very important to consider as a research study.
Acknowledgments
We would like to express our sincere thanks to the National Cartographic Center of Iran (NCC) who provided the pre-event map of BAM city. The author thanks DigitalGlobe for providing the pre- and post-event high spatial resolution images of the study area. The Haiti building damage atlas was produced by the United Nations’ Institute for Training and Research (UNITAR) Operational Satellite Applications Programme (UNOSAT), the European Commission’s Joint Research Centre (JRC), and the World Bank in support to the Post Disaster Needs Assessment (PDNA) process led by the Government of Haiti. The authors are grateful to the anonymous reviewers for their time and effort spent in reviewing the paper and for their constructive comments. We also like to thank Qi Wang, Nicolas H. Younan, and Carlos López-Martínez for the rapid peer reviewing process.
Author Contributions
Milad Janalipour proposed and implemented the method, also wrote the manuscript. Ali Mohammadzadeh supervised the research and also reviewed and revised the manuscript.
Conflicts of Interest
The authors declare no conflict of interest.
Abbreviations
The following abbreviations are used in this manuscript:
| LiDAR | Light Detection and Ranging |
| SAR | Synthetic Aperture Radar |
| OA | Overall Accuracy |
| EMS 98 | European Macroseismic Scale 1998 |
| GA | Genetic Algorithm |
| Fuzzy-GA | Fuzzy Genetic Algorithm |
| RS | Remote Sensing |
| SVM | Support Vector Machine |
| RF | Rnadom Forests |
| OCSVM | One-Class Support Vector Machine |
| MF | Membership Function |
| MFIS | Mamdani Fuzzy Inference System |
References
- Dubois, D.; Lepage, R. Fast and efficient evaluation of building damage from very high resolution optical satellite images. IEEE J. Sel. Top. Appl. Earth Obs. Remote Sens. 2014, 7, 4167–4176. [Google Scholar] [CrossRef]
- Janalipour, M.; Taleai, M. Building change detection after earthquake using multi-criteria decision analysis based on extracted information from high spatial resolution satellite images. Int. J. Remote Sens. 2017, 38, 82–99. [Google Scholar] [CrossRef]
- Khoshelham, K.; Oude Elberink, S. Role of dimensionality reduction in segment-based classification of damaged building roofs in airborne laser scanning data. In Proceedings of the International Conference on Geographic Object Based Image Analysis, Rio de Janeiro, Brazil, 7–9 May 2012; pp. 372–377. [Google Scholar]
- Dell’Acqua, F.; Gamba, P.; Polli, D.A. Earthquake damage assessment from post-event VHR radar data: From Sichuan, 2008 to Haiti, 2010. In Proceedings of the IEEE 2011 Joint Urban Remote Sensing Event, Munich, Germany, 11–13 April 2011; pp. 201–204. [Google Scholar]
- Balz, T.; Liao, M. Building-damage detection using post-seismic high-resolution SAR satellite data. Int. J. Remote Sens. 2010, 31, 3369–3391. [Google Scholar] [CrossRef]
- Matsuoka, M.; Yamazaki, F. Use of satellite SAR intensity imagery for detecting building areas damaged due to earthquakes. Earthq. Spectra 2004, 20, 975–994. [Google Scholar] [CrossRef]
- Matsuoka, M.; Yamazaki, F. Building damage mapping of the 2003 bam, Iran, earthquake using ENVISAT/ASAR intensity imagery. Earthq. Spectra 2005, 21, 285–294. [Google Scholar] [CrossRef]
- Matsuoka, M.; Yamazaki, F. Comparative analysis for detecting areas with building damage from several destructive earthquakes using satellite synthetic aperture radar images. J. Appl. Remote Sens. 2010, 4. [Google Scholar] [CrossRef]
- Dell’Acqua, F.; Polli, D.A. Post-event only VHR radar satellite data for automated damage assessment. Photogramm. Eng. Remote Sens. 2011, 77, 1037–1043. [Google Scholar] [CrossRef]
- Sirmacek, B.; Unsalan, C. Damaged building detection in aerial images using shadow information. In Proceedings of the IEEE 2009 4th International Conference on Recent Advances in Space Technologies, Istanbul, Turkey, 11–13 June 2009; pp. 249–252. [Google Scholar]
- Geiß, C.; Pelizari, P.A.; Marconcini, M.; Sengara, W.; Edwards, M.; Lakes, T.; Taubenböck, H. Estimation of seismic building structural types using multi-sensor remote sensing and machine learning techniques. ISPRS J. Photogramm. Remote Sens. 2015, 104, 175–188. [Google Scholar] [CrossRef]
- Geiß, C.; Taubenböck, H.; Tyagunov, S.; Tisch, A.; Post, J.; Lakes, T. Assessment of seismic building vulnerability from space. Earthq. Spectra 2014, 30, 1553–1583. [Google Scholar] [CrossRef]
- Janalipour, M.; Mohammadzadeh, A. Building damage detection using object-based image analysis and anfis from high-resolution image (case study: Bam earthquake, Iran). IEEE J. Sel. Top. Appl. Earth Obs. Remote Sens. 2016, 9, 1937–1945. [Google Scholar] [CrossRef]
- Eguchi, R.T.; Mansouri, B. Use of remote sensing technologies for building damage assessment after the 2003 Bam, Iran, earthquake—Preface to remote sensing papers. Earthq. Spectra 2005, 21, 207–212. [Google Scholar] [CrossRef]
- Voigt, S.; Schneiderhan, T.; Twele, A.; Gähler, M.; Stein, E.; Mehl, H. Rapid damage assessment and situation mapping: Learning from the 2010 Haiti earthquake. Photogramm. Eng. Remote Sens. 2011, 77, 923–931. [Google Scholar] [CrossRef]
- Lu, L.; Guo, H.; Corbane, C.; Pesaresi, M.; Ehrlich, D. Rapid damage assessment of buildings with VHR optical airborne images in Yushu earthquake. In Proceedings of the 2012 2nd International Conference on Remote Sensing, Environment and Transportation Engineering, Nanjing, China, 1–3 June 2012. [Google Scholar]
- Tiede, D.; Lang, S.; Füreder, P.; Hölbling, D.; Hoffmann, C.; Zeil, P. Automated damage indication for rapid geospatial reporting. Photogramm. Eng. Remote Sens. 2011, 77, 933–942. [Google Scholar] [CrossRef]
- Lemoine, G.; Corbane, C.; Louvrier, C.; Kauffmann, M. Intercomparison and validation of building damage assessments based on post-Haiti 2010 earthquake imagery using multi-source reference data. Nat. Hazards Earth Syst. Sci. Discuss. 2013, 1, 1445–1486. [Google Scholar] [CrossRef]
- Haghighattalab, A.; JAVAD Valadan zoej, M.; Mohammadzadeh, A.; Taleai, M.; Kalantari, M. Détection de dommages et évaluation des dégâts du réseau routier après un séisme, en utilisant des images quickbird haute résolution. XYZ J. 2010, 32, 41–47. [Google Scholar]
- Vu, T.T.; Matsuoka, M.; Yamazaki, F. Multilevel detection of damaged buildings from high-resolution optical satellite images. In Proceedings of the 2006 International Society for Optics and Photonics Asia-Pacific Remote Sensing Symposium, Goa, India, 13 November 2006. [Google Scholar]
- Wang, X.; Li, P. Urban building collapse detection using very high resolution imagery and airborne Lidar data. ISPRS Int. Arch. Photogramm. Remote Sens. Spat. Inf. Sci. 2013, 40, 127–132. [Google Scholar] [CrossRef]
- Chesnel, A.-L.; Binet, R.; Wald, L. Urban damage assessment using multimodal Quickbird images and ancillary data: The Bam and the Boumerdes earthquakes. In Proceedings of the 6th International Workshop on Remote Sensing for Disaster Management Applications, Pavia, Italy, 11–12 September 2008. [Google Scholar]
- Miura, H.; Modorikawa, S.; Chen, S.H. Texture characteristics of high-resolution satellite images in damaged areas of the 2010 Haiti earthquake. In Proceedings of the 9th International Workshop on Remote Sensing for Disaster Response, Stanford, CA, USA, 15–16 September 2011. [Google Scholar]
- Li, P.; Xu, H.; Guo, J. Urban building damage detection from very high resolution imagery using OCSVM and spatial features. Int. J. Remote Sens. 2010, 31, 3393–3409. [Google Scholar] [CrossRef]
- Tian, J.; Nielsen, A.A.; Reinartz, P. Building damage assessment after the earthquake in Haiti using two post-event satellite stereo imagery and DSMS. Int. J. Image Data Fusion 2015, 6, 155–169. [Google Scholar] [CrossRef]
- Polli, D.; Dell’Acqua, F.; Gamba, P.; Lisini, G. Earthquake damage assessment from post-event only radar satellite data. In Proceedings of the Eighth International Workshop on Remote Sensing for Disaster Response, Tokyo, Japan, 1 October 2010. [Google Scholar]
- Samadzadegan, F.; Rastiveisi, H. Automatic detection and classification of damaged buildings, using high resolution satellite imagery and vector data. ISPRS Int. Arch. Photogramm. Remote Sens. Spat. Inf. Sci. 2008, 37, 415–420. [Google Scholar]
- Mansouri, B.; Hamednia, Y. A soft computing method for damage mapping using VHR optical satellite imagery. IEEE J. Sel. Top. Appl. Earth Obs. Remote Sens. 2015, 8, 4935–4941. [Google Scholar] [CrossRef]
- Chen, P.; Wu, J.; Liu, Y.; Wang, J. Extraction method for earthquake-collapsed building information based on high-resolution remote sensing. In Proceedings of the IOP Conference Series: Earth and Environmental Science, Beijing, China, 22–26 April 2014; p. 012096. [Google Scholar]
- Ural, S.; Hussain, E.; Kim, K.; Fu, C.-S.; Shan, J. Building extraction and rubble mapping for city port-au-prince post-2010 earthquake with GeoEye-1 imagery and Lidar data. Photogramm. Eng. Remote Sens. 2011, 77, 1011–1023. [Google Scholar] [CrossRef]
- Jang, J.-S.R.; Sun, C.-T.; Mizutani, E. Neuro-fuzzy and soft computing; a computational approach to learning and machine intelligence. IEEE Trans. Autom. Control 1997, 42, 1482–1484. [Google Scholar] [CrossRef]
- Dong, L.; Shan, J. A comprehensive review of earthquake-induced building damage detection with remote sensing techniques. ISPRS J. Photogramm. Remote Sens. 2013, 84, 85–99. [Google Scholar] [CrossRef]
- Dell’Acqua, F.; Gamba, P. Remote sensing and earthquake damage assessment: Experiences, limits, and perspectives. IEEE Proc. 2012, 100, 2876–2890. [Google Scholar] [CrossRef]
- Geiß, C.; Taubenböck, H. Remote sensing contributing to assess earthquake risk: From a literature review towards a roadmap. Nat. Hazards 2013, 68, 7–48. [Google Scholar] [CrossRef]
- Rehor, M.; Bähr, H.P.; Tarsha-Kurdi, F.; Landes, T.; Grussenmeyer, P. Contribution of two plane detection algorithms to recognition of intact and damaged buildings in Lidar data. Photogramm. Rec. 2008, 23, 441–456. [Google Scholar] [CrossRef]
- Gamba, P.; Dell’Acqua, F.; Trianni, G. Rapid damage detection in the Bam area using multitemporal SAR and exploiting ancillary data. IEEE Trans. Geosci. Remote Sens. 2007, 45, 1582–1589. [Google Scholar] [CrossRef]
- Dell’Acqua, F.; Lisini, G.; Gamba, P. Experiences in optical and SAR imagery analysis for damage assessment in the Wuhan, May 2008 Earthquake. IEEE Int. Geosci. Remote Sens. Symp. 2009, 4, 37–40. [Google Scholar]
- Trianni, G.; Gamba, P. Fast damage mapping in case of earthquakes using multitemporal SAR data. J. Real-Time Image Process. 2009, 4, 195–203. [Google Scholar] [CrossRef]
- Berman, L. Haiti Earthquake Data (Vectors). Harv. Dataverse 2015. [Google Scholar] [CrossRef]
- Pascale, D. A Review of RGB Color Spaces; Technical Report; The Babel Color Company: Montreal, QC, Canada, 2003. [Google Scholar]
- Theodoridis, S.; Koutroumbas, K. Chapter 7–feature generation II. In Pattern Recognition; Academic Press: San Diego, CA, USA, 2009; pp. 411–479. [Google Scholar]
- Haralick, R.M.; Shanmugam, K.; Dinstein, I.H. Textural features for image classification. IEEE Trans. Syst. Man Cybern. 1973, 3, 610–621. [Google Scholar] [CrossRef]
- Mollalo, A.; Khodabandehloo, E. Zoonotic cutaneous leishmaniasis in northeastern Iran: A GIS-based spatio-temporal multi-criteria decision-making approach. Epidemiol. Infect. 2016, 144, 2217–2229. [Google Scholar] [CrossRef] [PubMed]
- Zadeh, L.A. The role of fuzzy logic in the management of uncertainty in expert systems. Fuzzy Sets Syst. 1983, 11, 199–227. [Google Scholar] [CrossRef]
- Homaifar, A.; McCormick, E. Simultaneous design of membership functions and rule sets for fuzzy controllers using genetic algorithms. IEEE Trans. Fuzzy Syst. 1995, 3, 129–139. [Google Scholar] [CrossRef]
- Lee, M.A.; Takagi, H. Integrating design stage of fuzzy systems using genetic algorithms. In Proceedings of the 2nd IEEE International Conference on Fuzzy Systems, San Francisco, CA, USA, 18 March–1 April 1993; pp. 612–617. [Google Scholar]
- Haupt, R.L.; Haupt, S.E. Practical Genetic Algorithms; Wiley-Interscience: Hoboken, NJ, USA, 2004. [Google Scholar]
- Hwang, D.; Karimi, H.A.; Byun, D.W. Uncertainty analysis of environmental models within GIS environments. Comput. Geosci. 1998, 24, 119–130. [Google Scholar] [CrossRef]
- Lodwick, W.A. Developing confidence limits on errors of suitability analyses in geographical information systems. Accuracy Spat. Databases 1989, 69–80. [Google Scholar]
- Tarantola, S.; Giglioli, N.; Jesinghaus, J.; Saltelli, A. Can global sensitivity analysis steer the implementation of models for environmental assessments and decision-making? Stoch. Environ. Res. Risk Assess. 2002, 16, 63–76. [Google Scholar] [CrossRef]
- Iooss, B.; Lemaître, P. A review on global sensitivity analysis methods. In Uncertainty Management in Simulation-Optimization of Complex Systems; Springer: New York, NY, USA, 2015; pp. 101–122. [Google Scholar]
- Srinivas, C.; Reddy, B.R.; Ramji, K.; Naveen, R. Sensitivity analysis to determine the parameters of genetic algorithm for machine layout. Procedia Mater. Sci. 2014, 6, 866–876. [Google Scholar] [CrossRef]
- Roeva, O.; Fidanova, S.; Paprzycki, M. Influence of the population size on the genetic algorithm performance in case of cultivation process modelling. In Proceedings of the 2013 Federated Conference on Computer Science and Information Systems, Krakow, Poland, 8–11 September 2013; pp. 371–376. [Google Scholar]
- Grünthal, G. European Macroseismic Scale 1998; European Seismological Commission, Subcommission on Engineering Seismology, Working Group Macroseismic Scales: Luxembourg, 1998. [Google Scholar]
- Labiak, R.C.; Van Aardt, J.A.; Bespalov, D.; Eychner, D.; Wirch, E.; Bischof, H.-P. Automated method for detection and quantification of building damage and debris using post-disaster Lidar data. Proc. SPIE 2011. [Google Scholar] [CrossRef]
- Pham, T.-T.-H.; Apparicio, P.; Gomez, C.; Weber, C.; Mathon, D. Towards a rapid automatic detection of building damage using remote sensing for disaster management: The 2010 Haiti earthquake. Disaster Prev. Manag. 2014, 23, 53–66. [Google Scholar] [CrossRef]
- Kuncheva, L.I. Combining Pattern Classifiers: Methods and Algorithms; John Wiley & Sons: Hoboken, NJ, USA, 2004. [Google Scholar]
- Wolf, P.R.; Ghilani, C.D. Adjustment Computations: Statistics and Least Squares in Surveying and GIS; Wiley-Interscience: Hoboken, NJ, USA, 1997. [Google Scholar]
- Schweier, C.; Markus, M. Classification of collapsed buildings for fast damage and loss assessment. Bull. Earthq. Eng. 2006, 4, 177–192. [Google Scholar] [CrossRef]
- Yuan, Y.; Lin, J.; Wang, Q. Dual-clustering-based hyperspectral band selection by contextual analysis. IEEE Trans. Geosci. Remote Sens. 2016, 54, 1431–1445. [Google Scholar] [CrossRef]
- Yuan, Y.; Zhu, G.; Wang, Q. Hyperspectral band selection by multitask sparsity pursuit. IEEE Trans. Geosci. Remote Sens. 2015, 53, 631–644. [Google Scholar] [CrossRef]
- Sirmacek, B.; Unsalan, C. Urban-area and building detection using sift keypoints and graph theory. IEEE Trans. Geosci. Remote Sens. 2009, 47, 1156–1167. [Google Scholar] [CrossRef]
- Sirmacek, B.; Unsalan, C. Building detection from aerial images using invariant color features and shadow information. In Proceedings of the 23rd International Symposium on Computer and Information Sciences, Istanbul, Turkey, 27–29 October 2008; pp. 1–5. [Google Scholar]
Figure 1.
The workflow of our semi-automated damage detection system in this study.

Figure 2.
A schematic presentation of a MFIS with three inputs and one output and its MFs.

Figure 3.
The diagram of convergence of GA over (a) Area 1, (b) Area 3.

Figure 4.
The presentation of preliminary MFs and optimized MFs in an experiment for input 2 and input 3: (a) preliminary MFs for input 2, (b) optimized MFs for input 2, (c) preliminary MFs for input 3, (d) optimized MFs for input 3.
Figure 4.
The presentation of preliminary MFs and optimized MFs in an experiment for input 2 and input 3: (a) preliminary MFs for input 2, (b) optimized MFs for input 2, (c) preliminary MFs for input 3, (d) optimized MFs for input 3.


Figure 5.
Building damage maps resulting from the proposed method on (a) Area 1, (b) Area 2, (c) Area 3.
Figure 5.
Building damage maps resulting from the proposed method on (a) Area 1, (b) Area 2, (c) Area 3.


Table 1.
A brief presentation from previous research studies that used textural features in damage detection applications.
Table 1.
A brief presentation from previous research studies that used textural features in damage detection applications.
| Reference | Textural Features Used | Remotely Sensed Data |
|---|---|---|
| [1] | Laws mask | Pre- and post-event optical images |
| [23] | Haralick | Pre- and post-event optical images |
| [20] | Haralick | Pre- and post-event optical images |
| [21] | Multivariate variogram | Pre- and post-event optical images and post-event LiDAR data |
| [22] | Gabor Filter | Pre- and post-event optical images |
| [19] | 1st statistical features, Gabor features and Haralick features | Pre- and post-event optical images |
| [24] | Multivariate variogram | Pre- and post-event optical images |
| [25] | Haralick | Pre- and post-event digital elevation models |
| [26] | Haralick | Post-event SAR data |
| [27] | 1st statistical features, Gabor features and Haralick features | Pre- and post-event optical images |
| [28] | Haralick | Pre- and post-event optical images |
Table 2.
A brief presentation from previous research works which used fuzzy inference systems in damage detection application.
Table 2.
A brief presentation from previous research works which used fuzzy inference systems in damage detection application.
| Reference | Type of Fuzzy System | Automation Level |
|---|---|---|
| [19] | Mamdani | Manually |
| [28] | Mamdani | Manually |
| [27] | Mamdani | Manually |
| [35] | Mamdani | Manually |
| [13] | Sugeno | Semi-automated |
| [2] | Sugeno | Semi-automated |
Table 3.
A sample confusion matrix.
| References | ||
|---|---|---|
| Class 1 | Class 2 | |
| Class 1 | a | b |
| Class 2 | c | d |
Table 4.
The number of training, check and test samples selected over Area 1, Area 2, and Area 3.
| Training Samples | Check Samples | Test Samples | ||||||||||
|---|---|---|---|---|---|---|---|---|---|---|---|---|
| D1 | D3 | D4 | D5 | D1 | D3 | D4 | D5 | D1 | D3 | D4 | D5 | |
| Area 1 | 172 | 15 | 30 | 83 | 66 | 5 | 13 | 40 | 185 | 8 | 36 | 100 |
| Area 2 | 380 | 22 | 196 | 102 | 118 | 10 | 61 | 35 | 530 | 43 | 268 | 142 |
| Area 3 | 25 | - | 56 | 115 | 14 | - | 30 | 74 | 23 | - | 38 | 93 |
Table 5.
Parameters of Mamdani fuzzy inference system selected in this study.
| Parameter Name | Fuzzy Parameters Selected |
|---|---|
| Number of MF for each input | 3 |
| Number of MF for each output | 3 |
| Type of input MF | Gaussian Function |
| Type of output MF | Gaussian Function |
| Number of iterations | Flexible |
| Defuzzification method | Centroid |
| “and” method | Min |
| “or” method | Max |
| Implication method | Min |
| Aggregation method | Max |
| Number of Rules | 12 |
Table 6.
Overall accuracies achieved from variations of GA parameters over Area 1.
| 50 | 50 | 50 | 150 | 150 | 150 | 250 | 250 | 250 | ||
|---|---|---|---|---|---|---|---|---|---|---|
| 0.1 | 76% | 73% | 73% | 77% | 79% | 79% | 77% | 79% | 79% | 100 |
| 0.2 | 76% | 77% | 74% | 79% | 77% | 72% | 79% | 78% | 77% | 100 |
| 0.3 | 76% | 75% | 74% | 76% | 80% | 77% | 79% | 73% | 79% | 100 |
| 0.1 | 73% | 75% | 75% | 77% | 76% | 78% | 77% | 79% | 79% | 200 |
| 0.2 | 74% | 77% | 79% | 77% | 79% | 77% | 79% | 79% | 79% | 200 |
| 0.3 | 77% | 77% | 78% | 77% | 73% | 77% | 79% | 79% | 77% | 200 |
| 0.1 | 79% | 78% | 70% | 75% | 77% | 77% | 75% | 73% | 80% | 300 |
| 0.2 | 77% | 79% | 77% | 78% | 79% | 78% | 78% | 79% | 77% | 300 |
| 0.3 | 77% | 79% | 77% | 77% | 80% | 78% | 71% | 71% | 79% | 300 |
| 0.7 | 0.8 | 0.9 | 0.7 | 0.8 | 0.9 | 0.7 | 0.8 | 0.9 |
Table 7.
Overall accuracies achieved from variations of GA parameters over Area 2.
| 50 | 50 | 50 | 150 | 150 | 150 | 250 | 250 | 250 | ||
|---|---|---|---|---|---|---|---|---|---|---|
| 0.1 | 65% | 65% | 65% | 64% | 66% | 66% | 64% | 64% | 64% | 100 |
| 0.2 | 64% | 67% | 66% | 64% | 66% | 66% | 66% | 66% | 64% | 100 |
| 0.3 | 65% | 67% | 66% | 66% | 66% | 66% | 66% | 66% | 66% | 100 |
| 0.1 | 65% | 65% | 66% | 65% | 67% | 66% | 65% | 65% | 63% | 200 |
| 0.2 | 65% | 64% | 67% | 65% | 65% | 66% | 66% | 65% | 66% | 200 |
| 0.3 | 63% | 65% | 64% | 67% | 66% | 66% | 65% | 66% | 65% | 200 |
| 0.1 | 66% | 67% | 66% | 66% | 65% | 64% | 66% | 66% | 65% | 300 |
| 0.2 | 65% | 67% | 67% | 65% | 65% | 65% | 64% | 65% | 66% | 300 |
| 0.3 | 65% | 65% | 66% | 67% | 67% | 65% | 66% | 65% | 65% | 300 |
| 0.7 | 0.8 | 0.9 | 0.7 | 0.8 | 0.9 | 0.7 | 0.8 | 0.9 |
Table 8.
Overall accuracies achieved from variations of GA parameters over Area 3.
| 50 | 50 | 50 | 150 | 150 | 150 | 250 | 250 | 250 | ||
|---|---|---|---|---|---|---|---|---|---|---|
| 0.1 | 91% | 91% | 92% | 90% | 89% | 90% | 91% | 90% | 91% | 100 |
| 0.2 | 91% | 90% | 90% | 90% | 91% | 90% | 91% | 92% | 92% | 100 |
| 0.3 | 92% | 90% | 90% | 89% | 90% | 92% | 92% | 90% | 92% | 100 |
| 0.1 | 90% | 90% | 90% | 91% | 91% | 91% | 90% | 91% | 91% | 200 |
| 0.2 | 93% | 92% | 91% | 91% | 92% | 92% | 91% | 91% | 92% | 200 |
| 0.3 | 92% | 90% | 90% | 91% | 92% | 92% | 91% | 92% | 91% | 200 |
| 0.1 | 92% | 90% | 90% | 91% | 91% | 90% | 91% | 91% | 91% | 300 |
| 0.2 | 92% | 91% | 90% | 92% | 92% | 92% | 91% | 92% | 90% | 300 |
| 0.3 | 92% | 91% | 89% | 91% | 92% | 90% | 92% | 91% | 91% | 300 |
| 0.7 | 0.8 | 0.9 | 0.7 | 0.8 | 0.9 | 0.7 | 0.8 | 0.9 |
Table 9.
Confusion matrix of training, check, and test samples over Area 1, Area 2, and Area 3.
| Area 1 | Area 2 | Area 3 | |||||||||||
| undamaged | damaged | User acc. (%) | Producer acc. (%) | undamaged | damaged | User acc. (%) | Producer acc. (%) | undamaged | damaged | User acc. (%) | Producer acc. (%) | ||
| Test samples | undamaged | 153 | 40 | 79 | 79 | 444 | 195 | 77 | 69 | 20 | 9 | 87 | 69 |
| damaged | 40 | 96 | 70 | 70 | 129 | 215 | 52 | 63 | 3 | 122 | 93 | 98 | |
| Check samples | undamaged | 51 | 11 | 72 | 82 | 97 | 45 | 76 | 68 | 10 | 7 | 71 | 59 |
| damaged | 20 | 42 | 79 | 68 | 31 | 51 | 53 | 62 | 4 | 97 | 93 | 96 | |
| Training samples | undamaged | 142 | 34 | 76 | 81 | 310 | 126 | 77 | 71 | 21 | 4 | 84 | 84 |
| damaged | 45 | 79 | 70 | 60 | 92 | 172 | 58 | 65 | 4 | 167 | 98 | 98 | |
Table 10.
Overall accuracy of the proposed method obtained on Area 1, Area 2, and Area 3.
| Area 1 (with 90% Confidence Level) | Area 2 (with 90% Confidence Level) | Area 3 (with 90% Confidence Level) | |
|---|---|---|---|
| Overall accuracy (%) | 76.88 ± 1.22 | 65.43 ± 0.29 | 90.96 ± 0.15 |
Table 11.
Overall accuracies of Fuzzy-GA, bagging, boosting, RF, and SVM machine learning techniques obtained on Area 1, Area 2, and Area 3.
Table 11.
Overall accuracies of Fuzzy-GA, bagging, boosting, RF, and SVM machine learning techniques obtained on Area 1, Area 2, and Area 3.
| Area 1 (%) | Area 2 (%) | Area 3 (%) | |
|---|---|---|---|
| Fuzzy-GA | 76.88 ± 1.22 | 65.43 ± 0.29 | 90.96 ± 0.15 |
| Bagging | 74.5 ± 2.0 | 56.03 ± 1.2 | 89.05 ± 0.6 |
| Boosting | 71.33 ± 2.2 | 62.79 ± 2.9 | 87.47 ± 1.0 |
| RF | 73.07 ± 1.4 | 55.92 ± 1.4 | 88.03 ± 0.5 |
| SVM with a radial basis function (RBF) kernel | 72.53 ± 1.6 | 60.52 ± 1.2 | 89.03 ± 0.6 |
Table 12.
The presentation of pre-event image, variance feature, and damage map of nine mis-classified buildings.
Table 12.
The presentation of pre-event image, variance feature, and damage map of nine mis-classified buildings.
| No. | Post-Event Image | Variance Feature | Damage Map |
|---|---|---|---|
| 1 |  |  |  |
| 2 |  |  |  |
| 3 |  |  |  |
| 4 |  |  |  |
| 5 |  |  |  |
| 6 |  |  |  |
| 7 |  |  |  |
| 8 |  |  |  |
| 9 |  |  |  |
© 2017 by the authors. Licensee MDPI, Basel, Switzerland. This article is an open access article distributed under the terms and conditions of the Creative Commons Attribution (CC BY) license (http://creativecommons.org/licenses/by/4.0/).
Share and Cite
MDPI and ACS Style
Janalipour, M.; Mohammadzadeh, A. A Fuzzy-GA Based Decision Making System for Detecting Damaged Buildings from High-Spatial Resolution Optical Images. Remote Sens. 2017, 9, 349. https://0-doi-org.brum.beds.ac.uk/10.3390/rs9040349
AMA Style
Janalipour M, Mohammadzadeh A. A Fuzzy-GA Based Decision Making System for Detecting Damaged Buildings from High-Spatial Resolution Optical Images. Remote Sensing. 2017; 9(4):349. https://0-doi-org.brum.beds.ac.uk/10.3390/rs9040349
Chicago/Turabian StyleJanalipour, Milad, and Ali Mohammadzadeh. 2017. "A Fuzzy-GA Based Decision Making System for Detecting Damaged Buildings from High-Spatial Resolution Optical Images" Remote Sensing 9, no. 4: 349. https://0-doi-org.brum.beds.ac.uk/10.3390/rs9040349
Note that from the first issue of 2016, this journal uses article numbers instead of page numbers. See further details here.