
Collaborative WiFi Fingerprinting Using Sensor-Based Navigation on Smartphones

Abstract
:1. Introduction
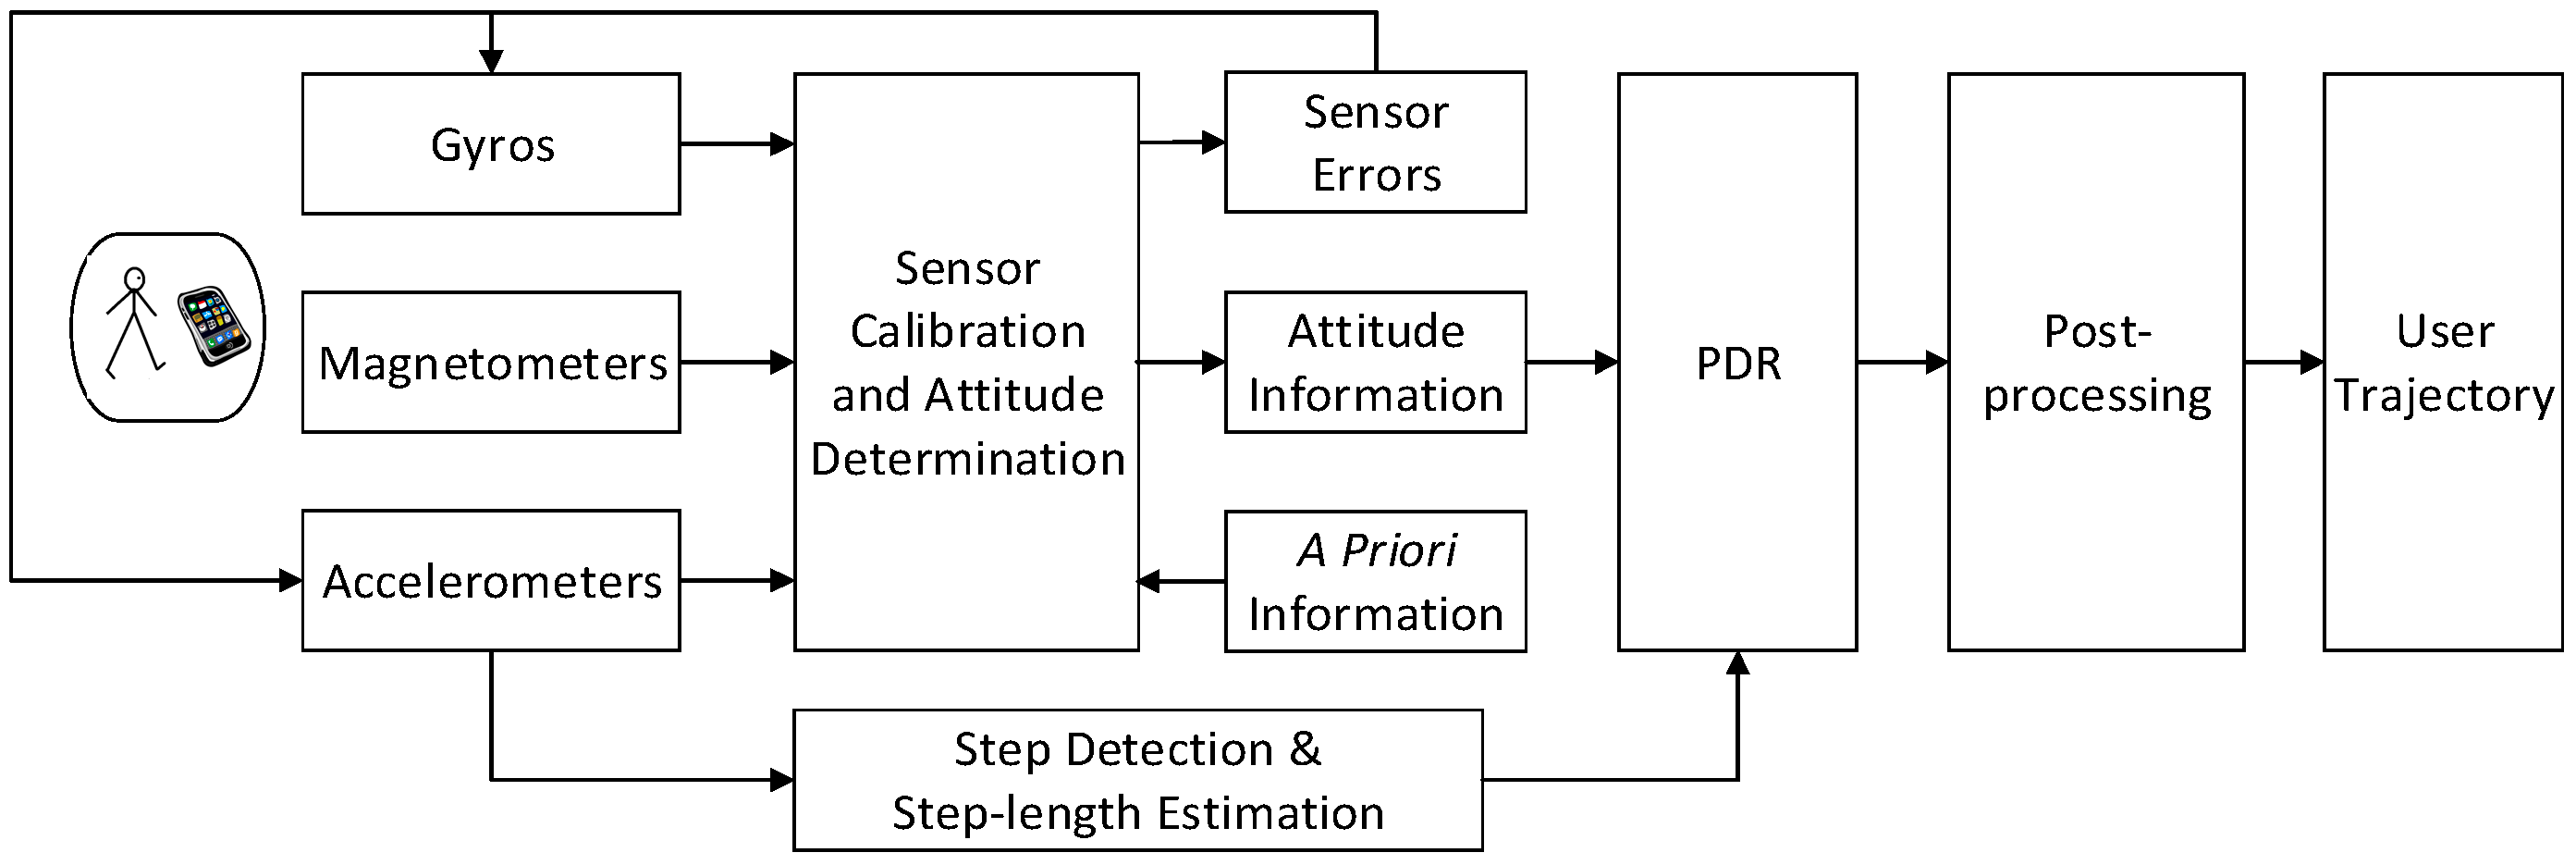
2. Sensor-Based Navigation

2.1. Multi-Sensor Based Attitude Determination
2.1.1. Kalman Filter System Model
2.1.2. Kalman Filter Measurement Models
2.1.3. Initial Alignment
2.2. Position Tracking
2.2.1. Pedestrian Dead-Reckoning
2.2.2. Step Length Model
2.3. Post-Processing
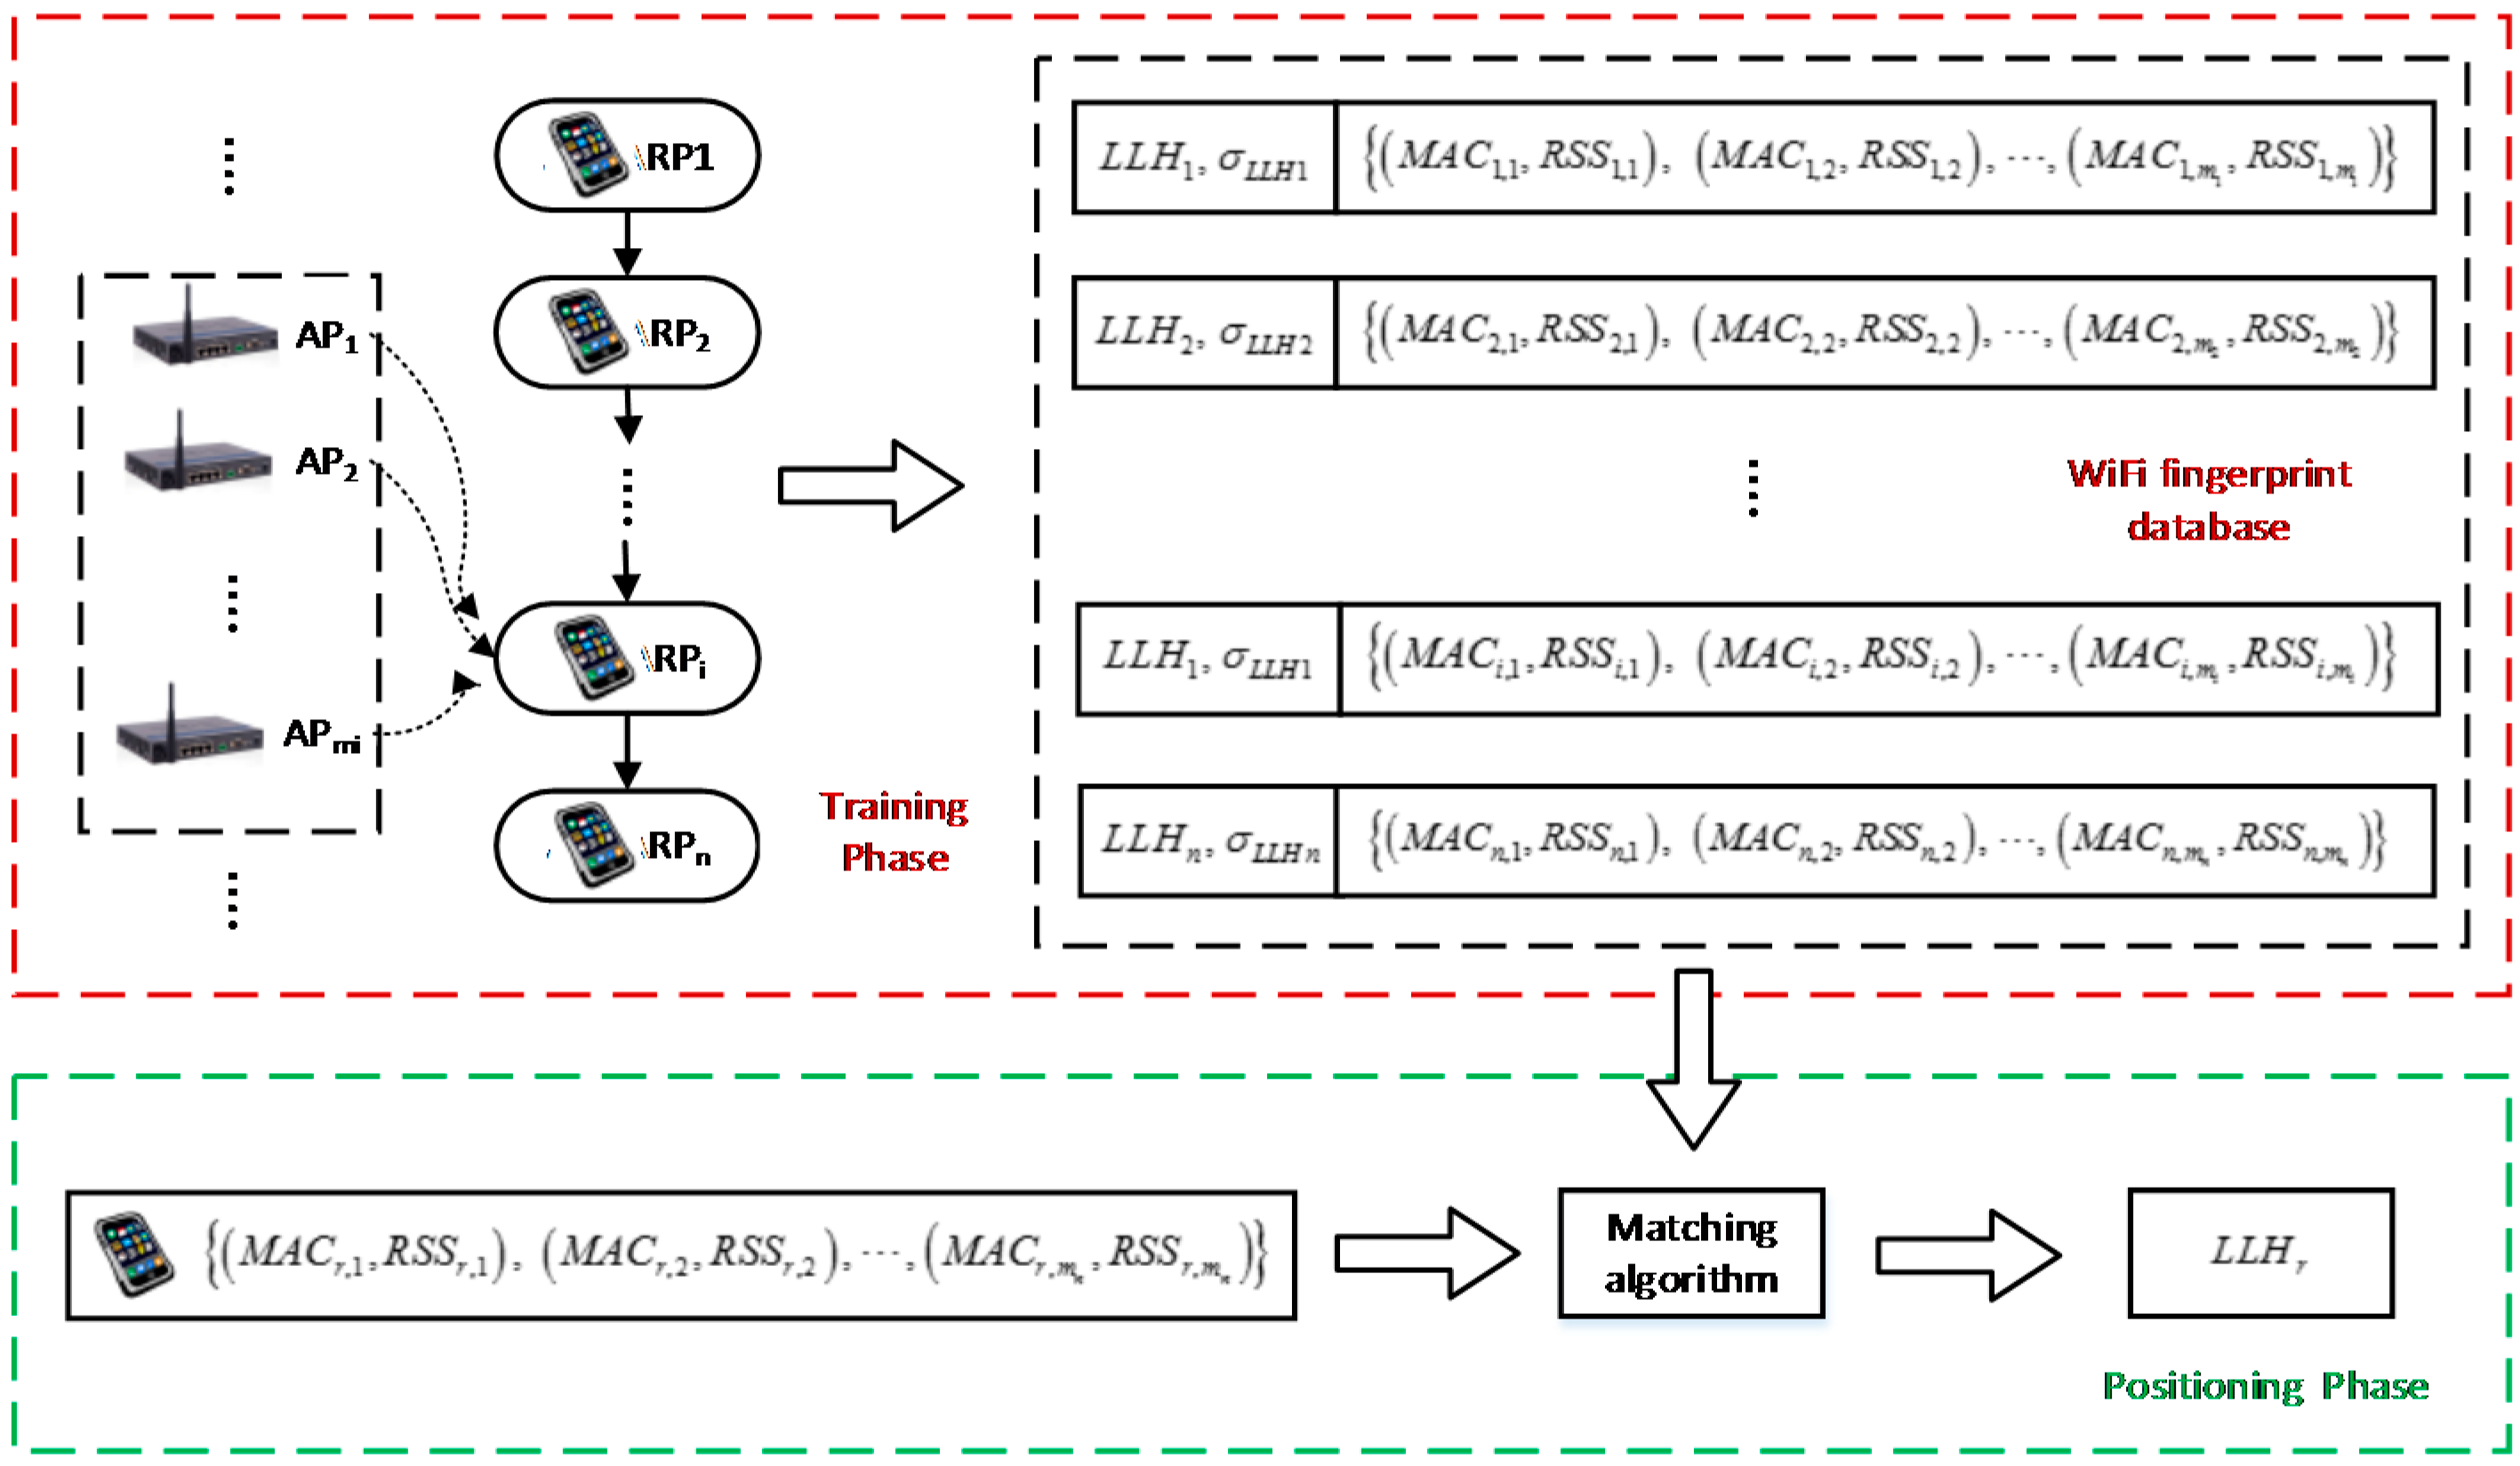
3. WiFi Fingerprinting

3.1. Training Phase
3.2. Positioning Phase
4. Tests and Results
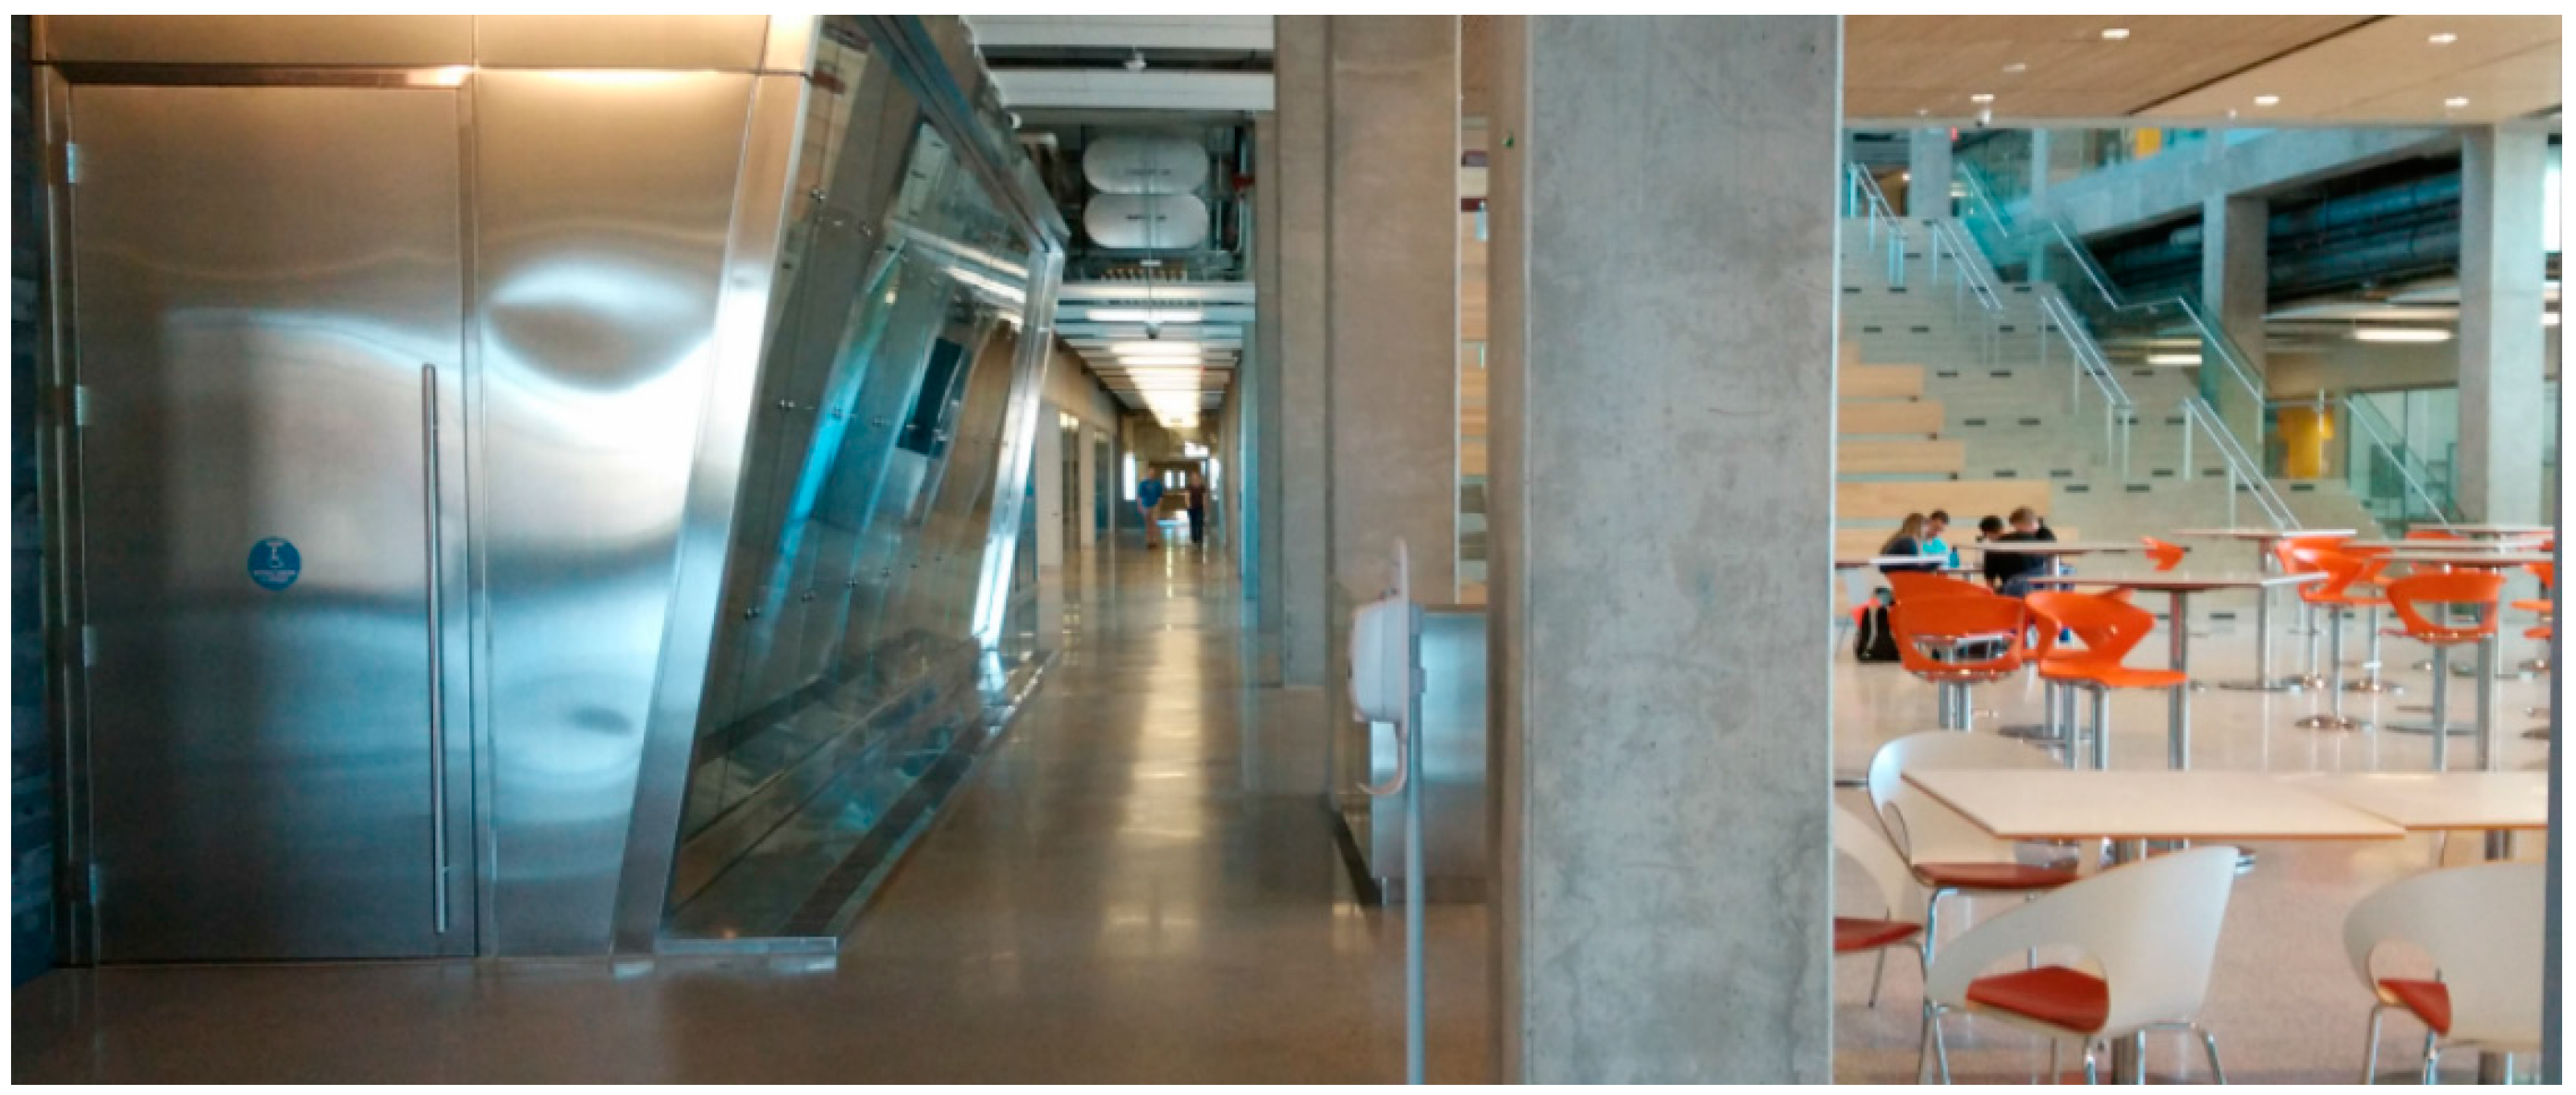
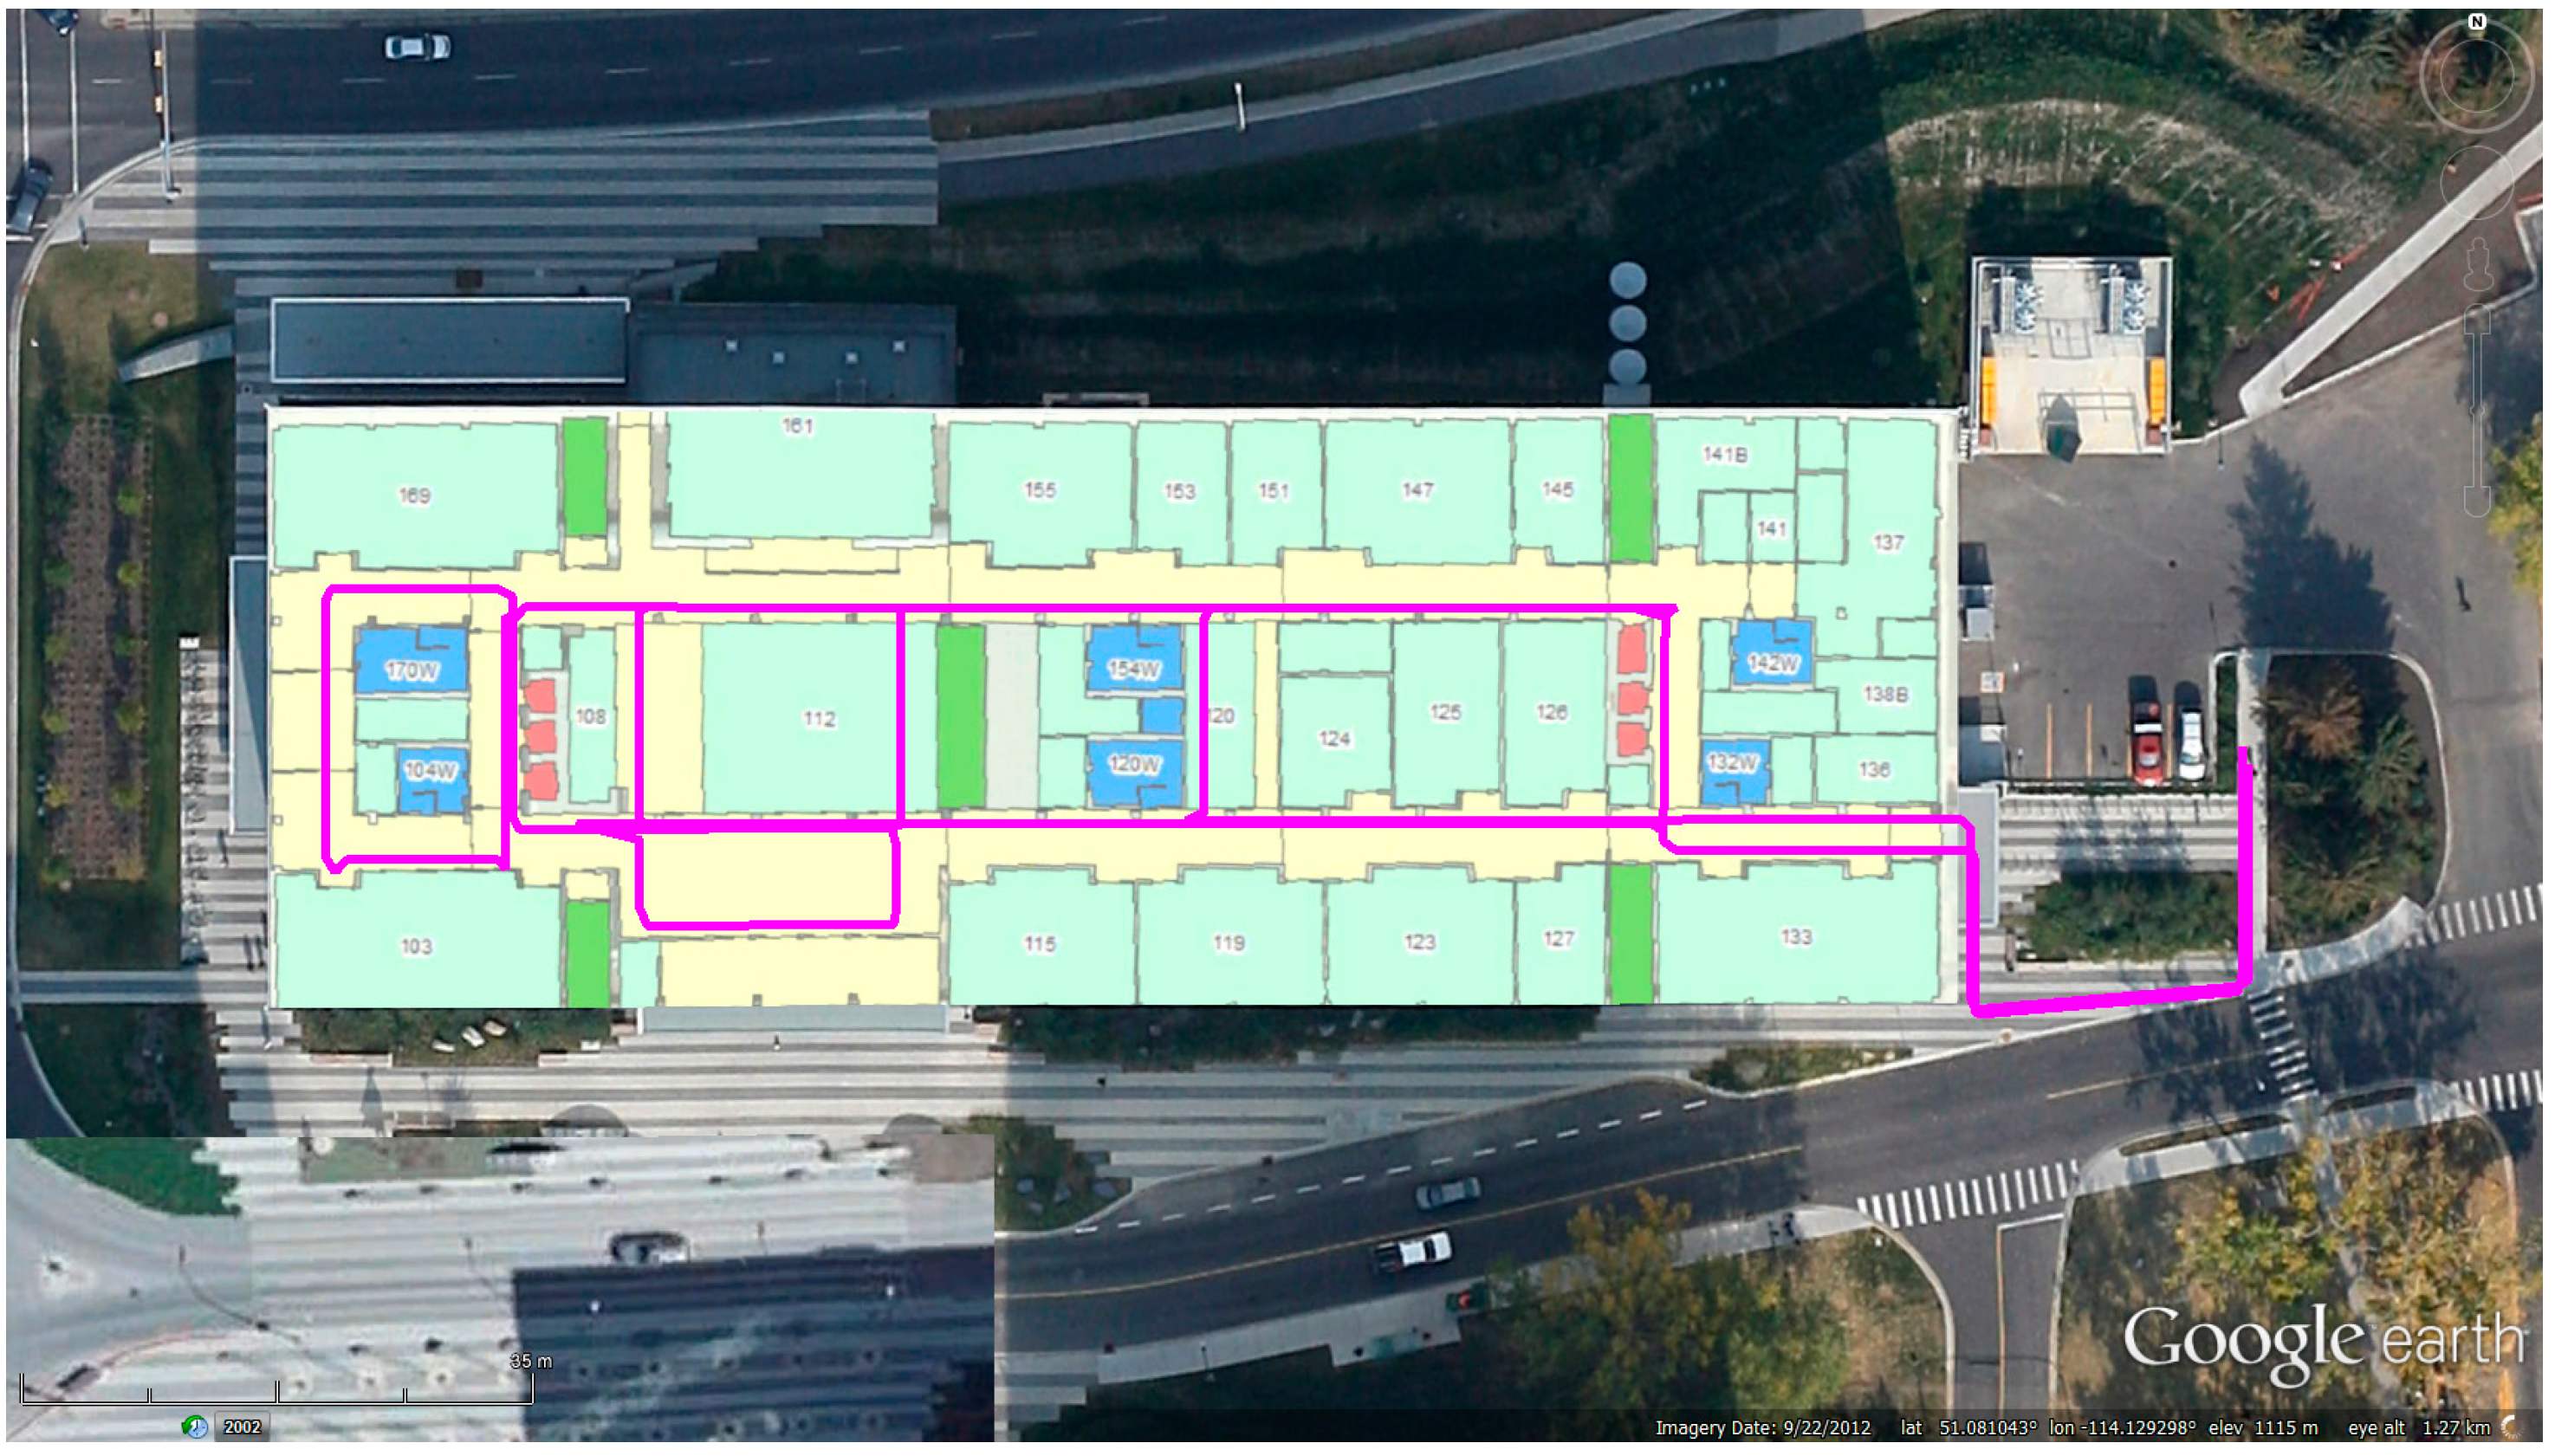
4.1. Tests at EEEL

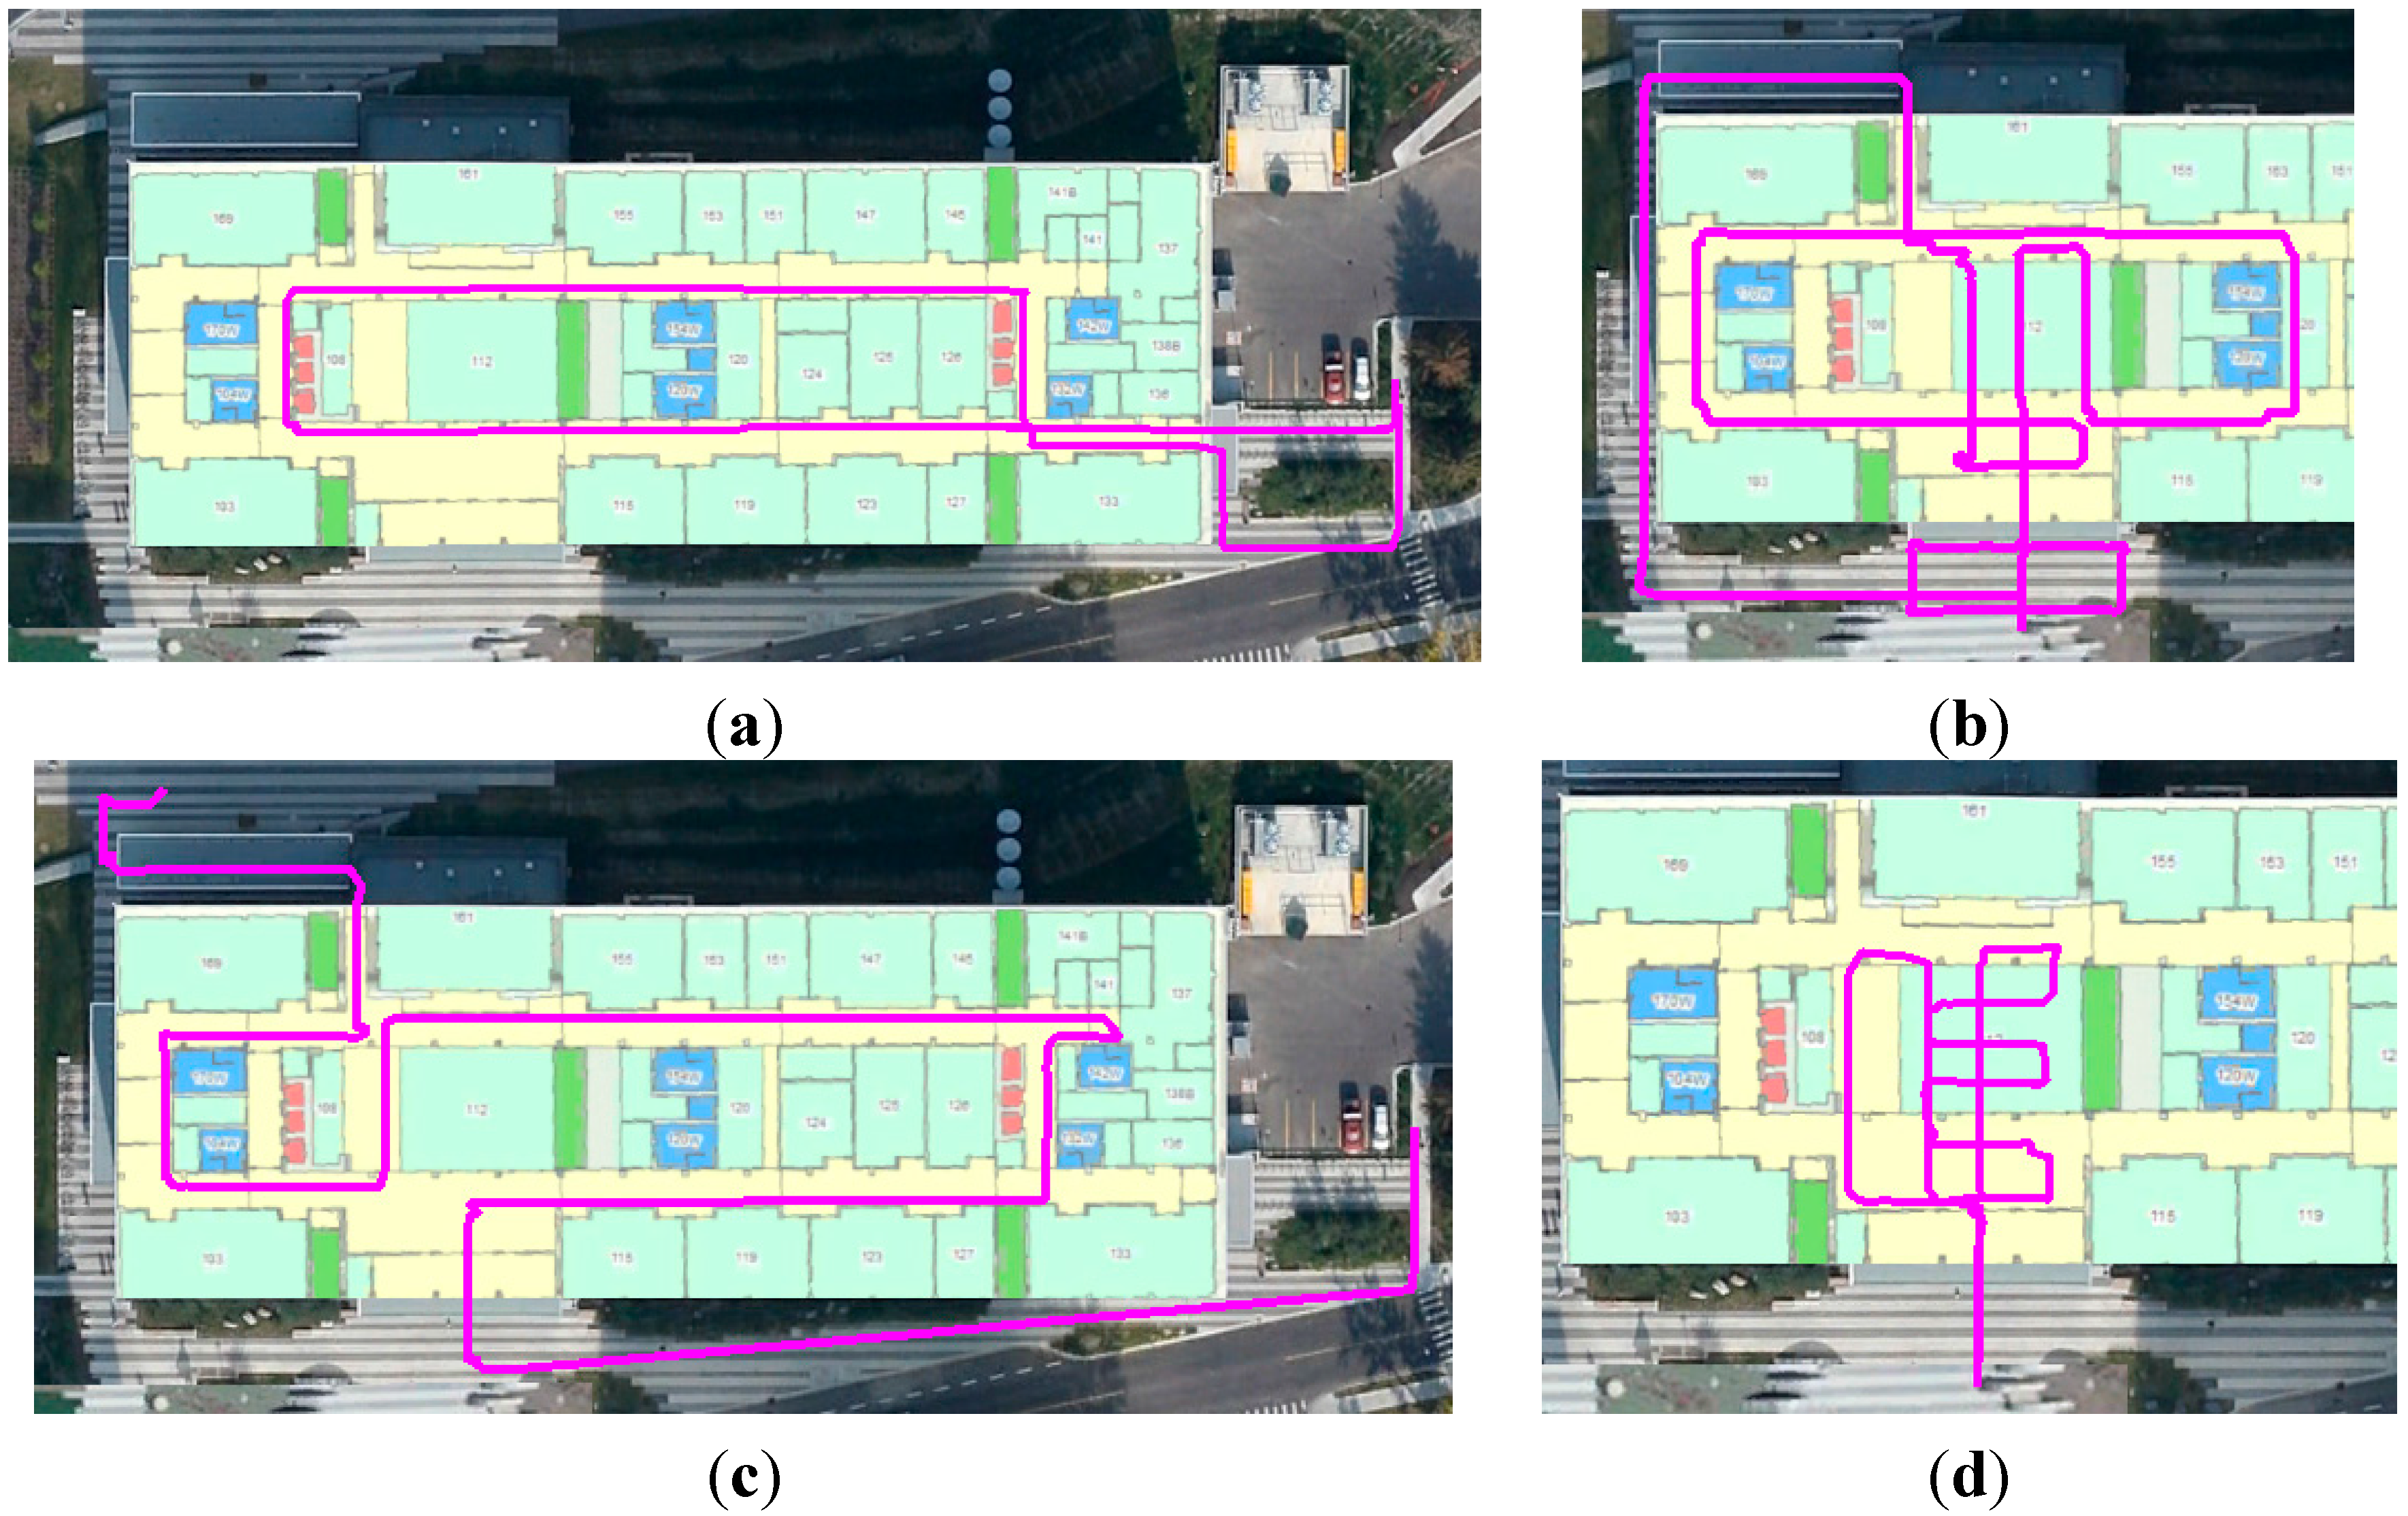
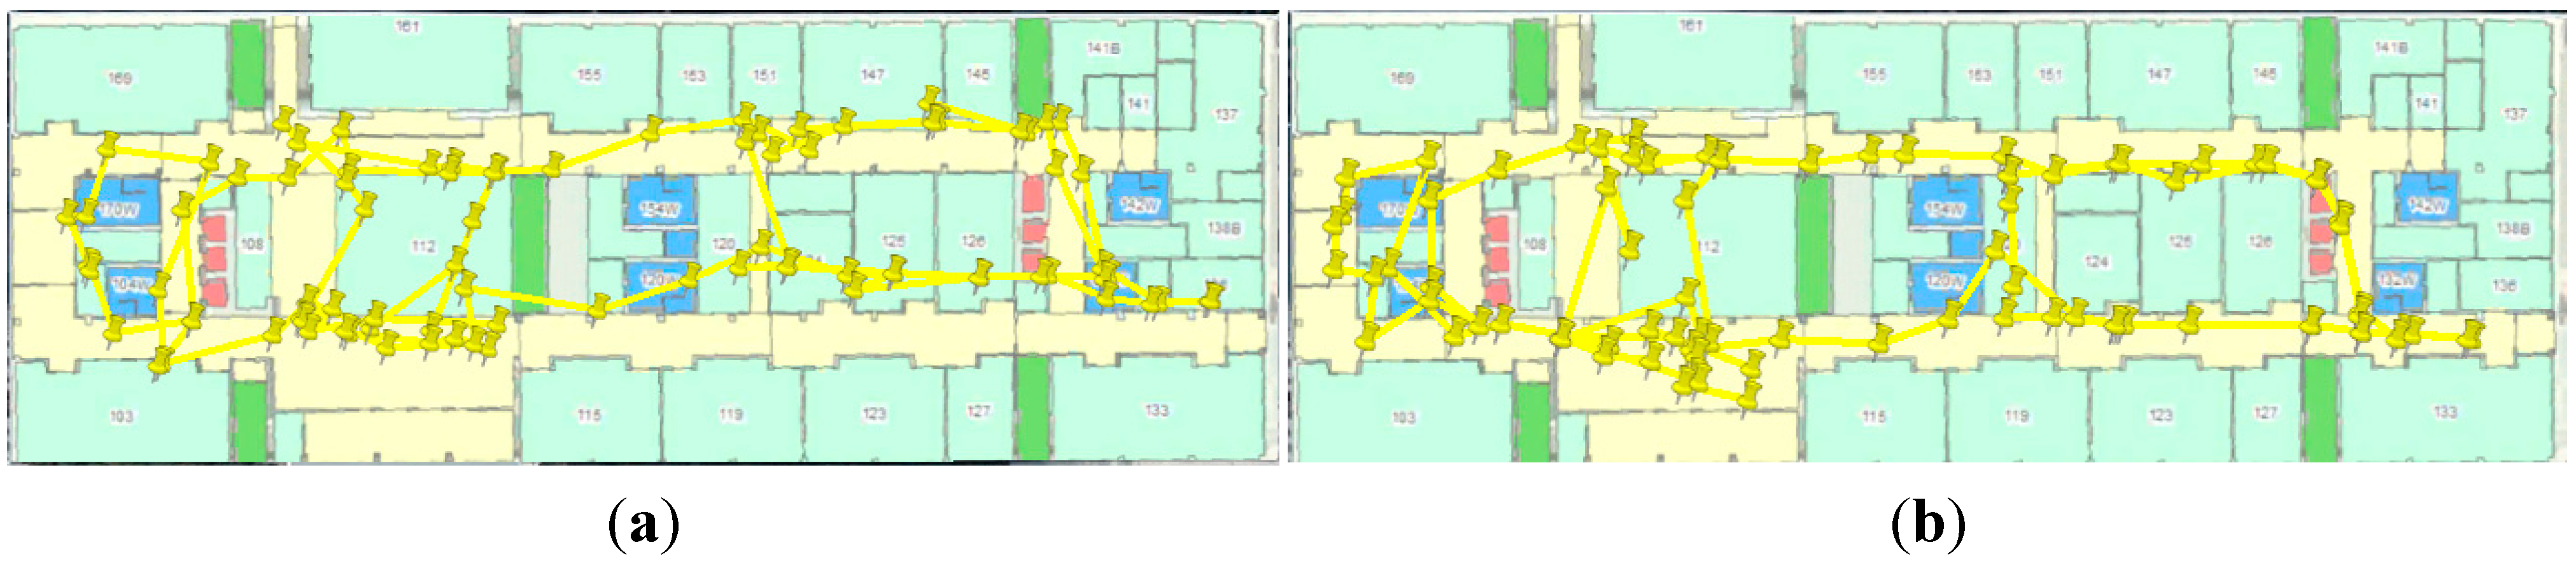
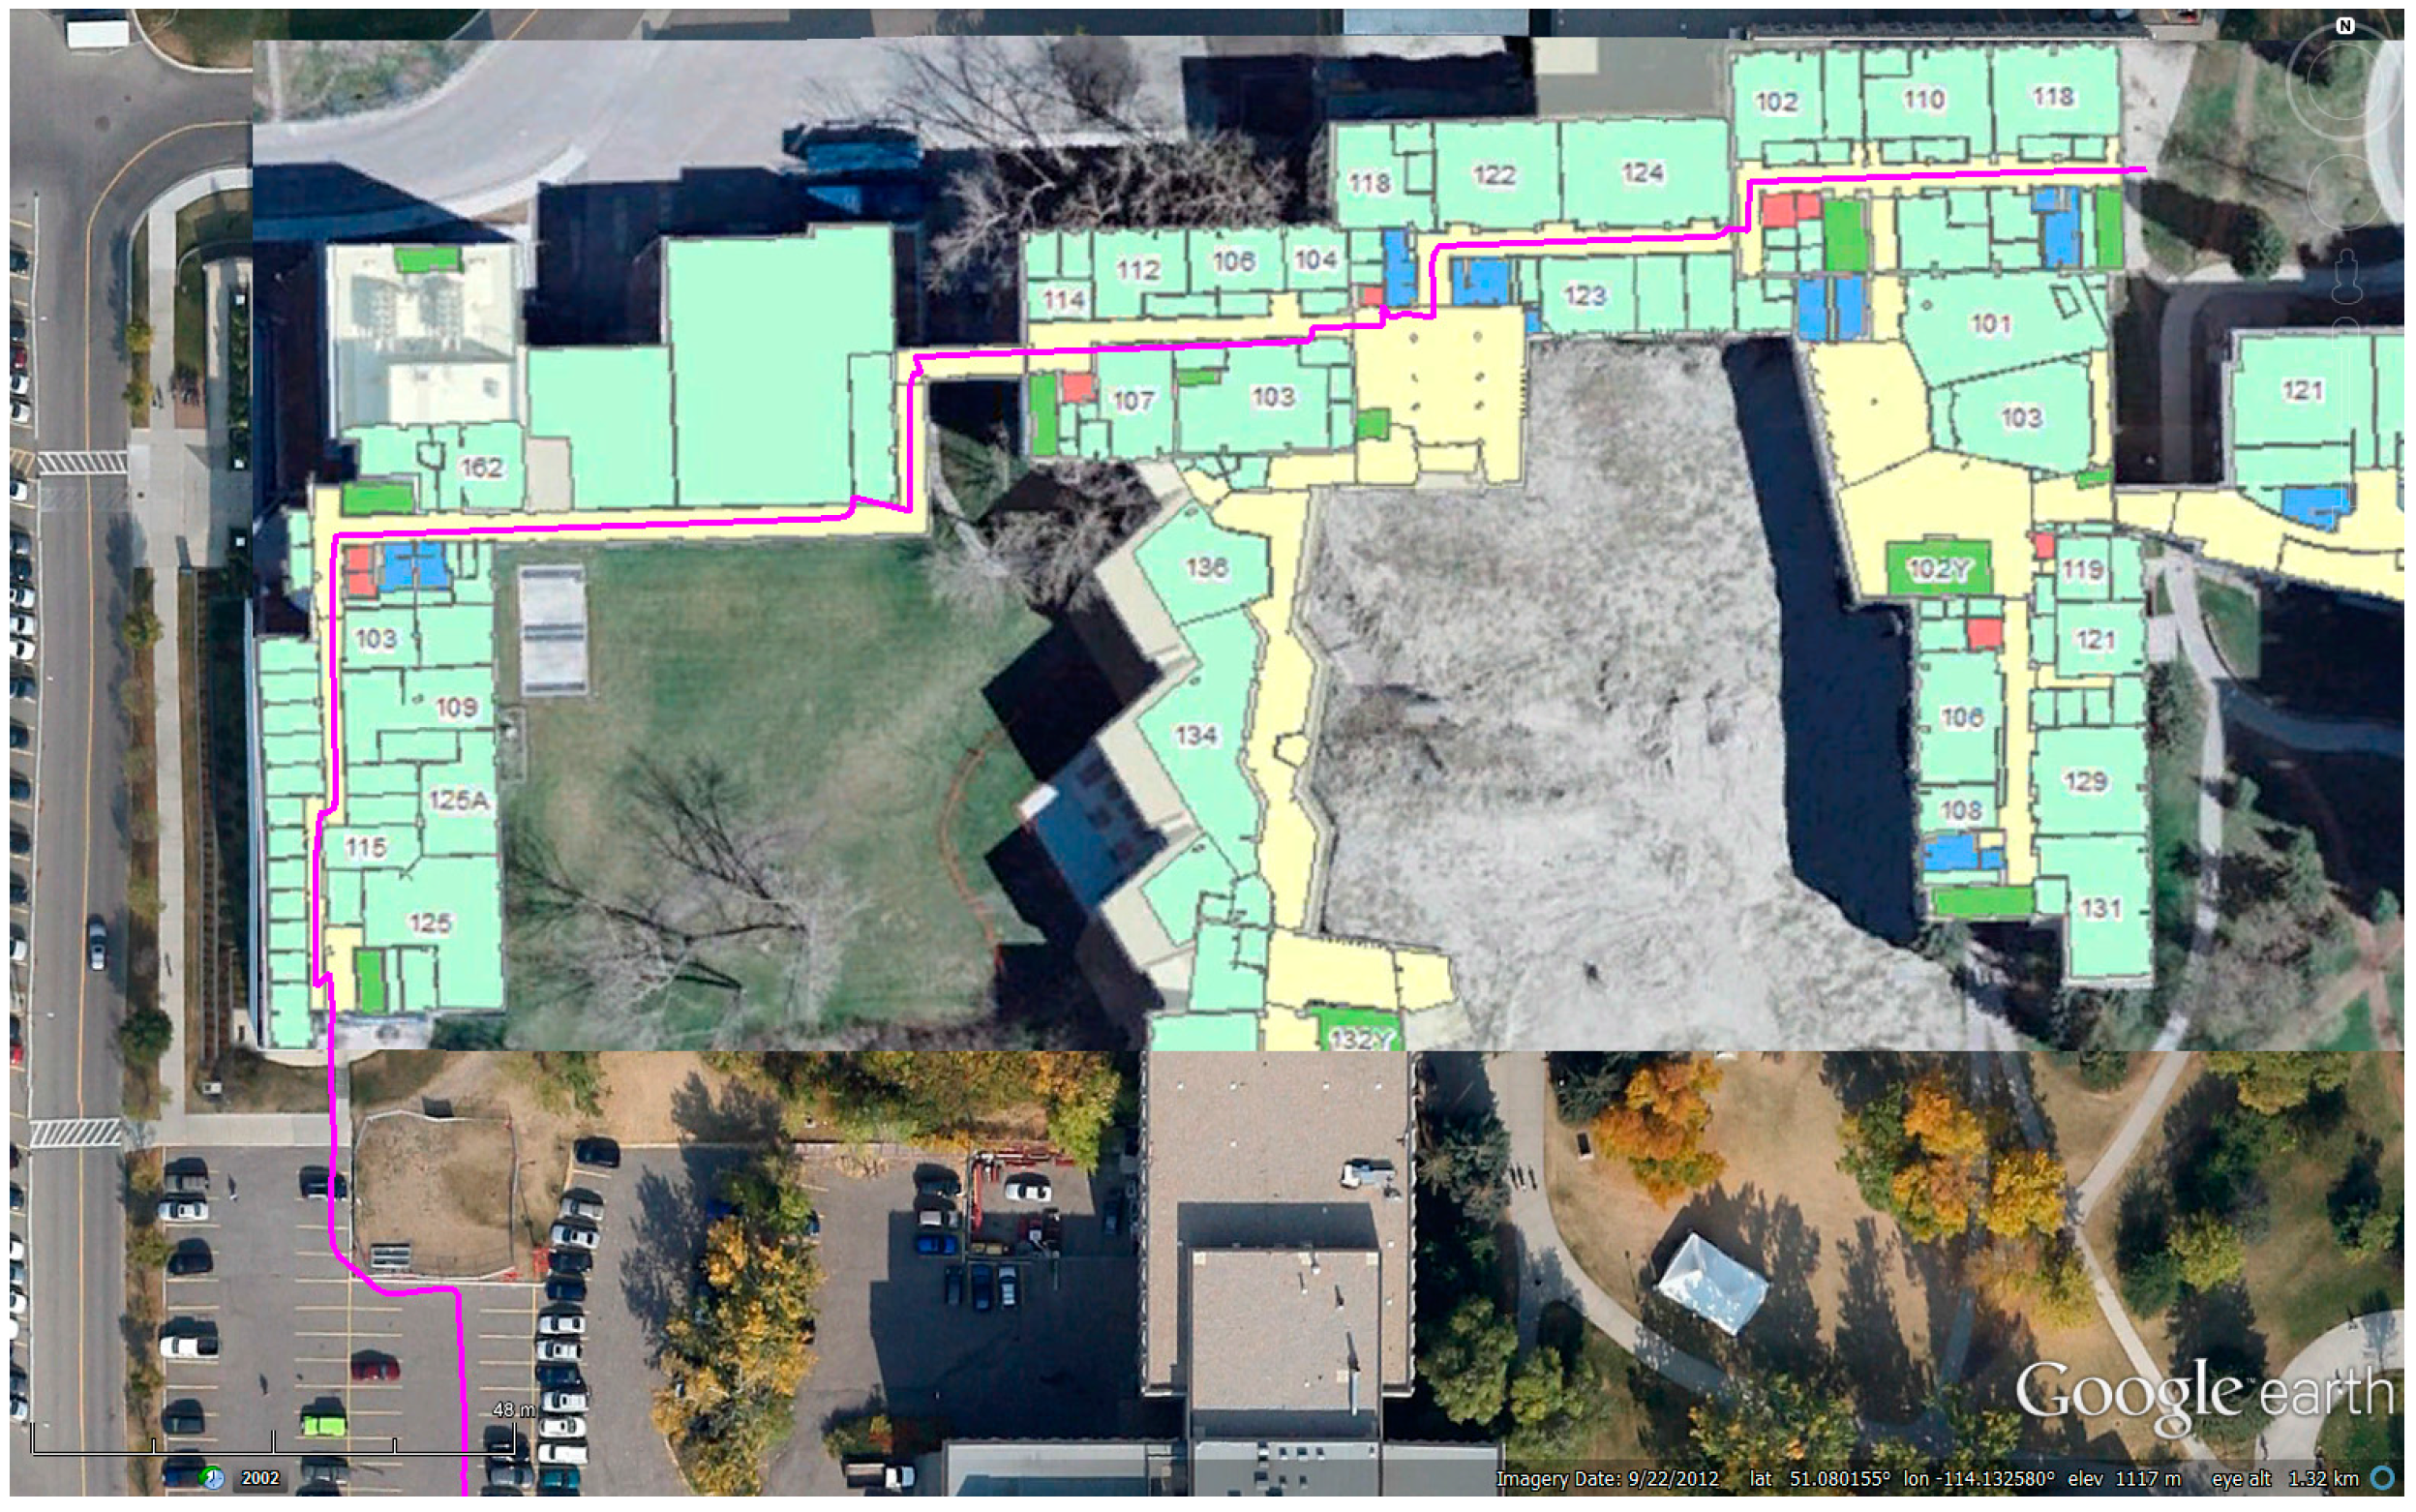
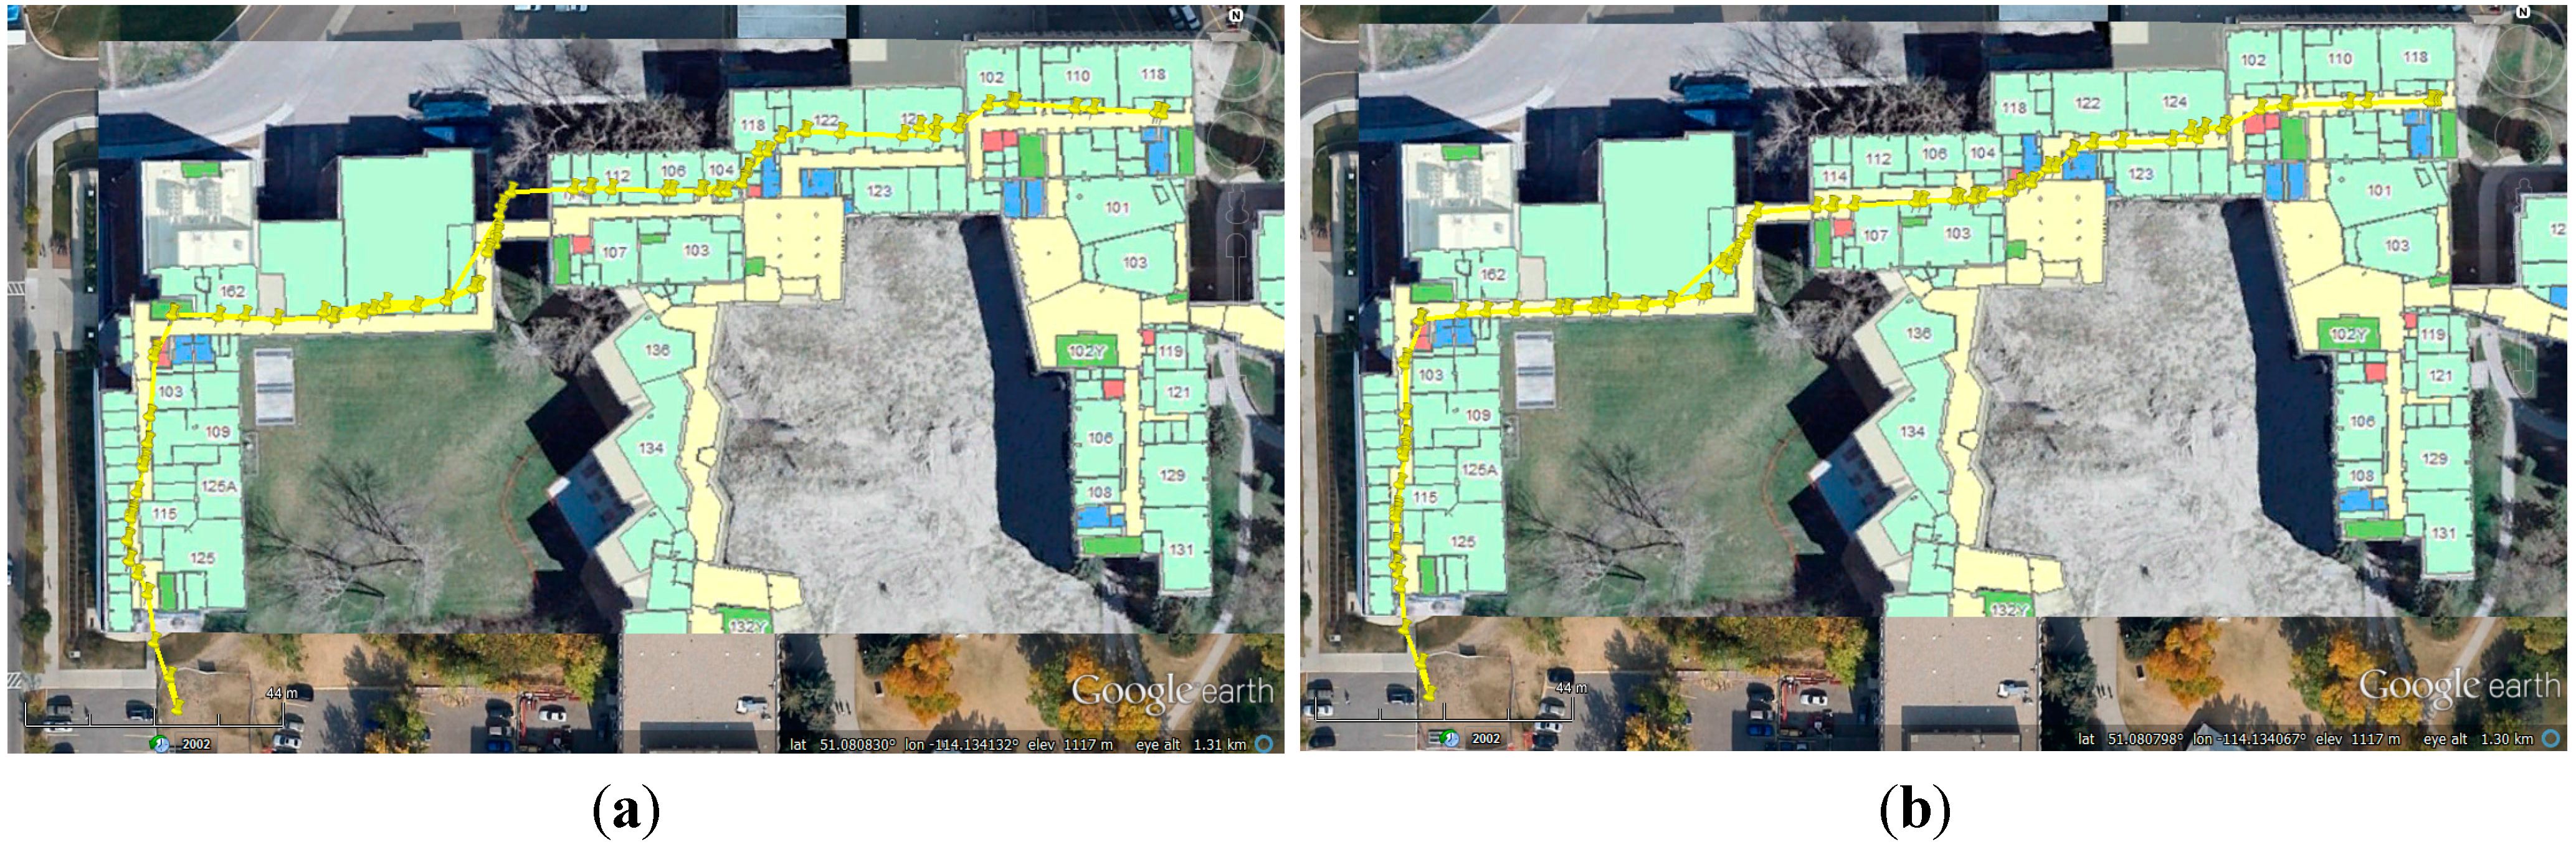
4.1.1. Trajectories for Building DB

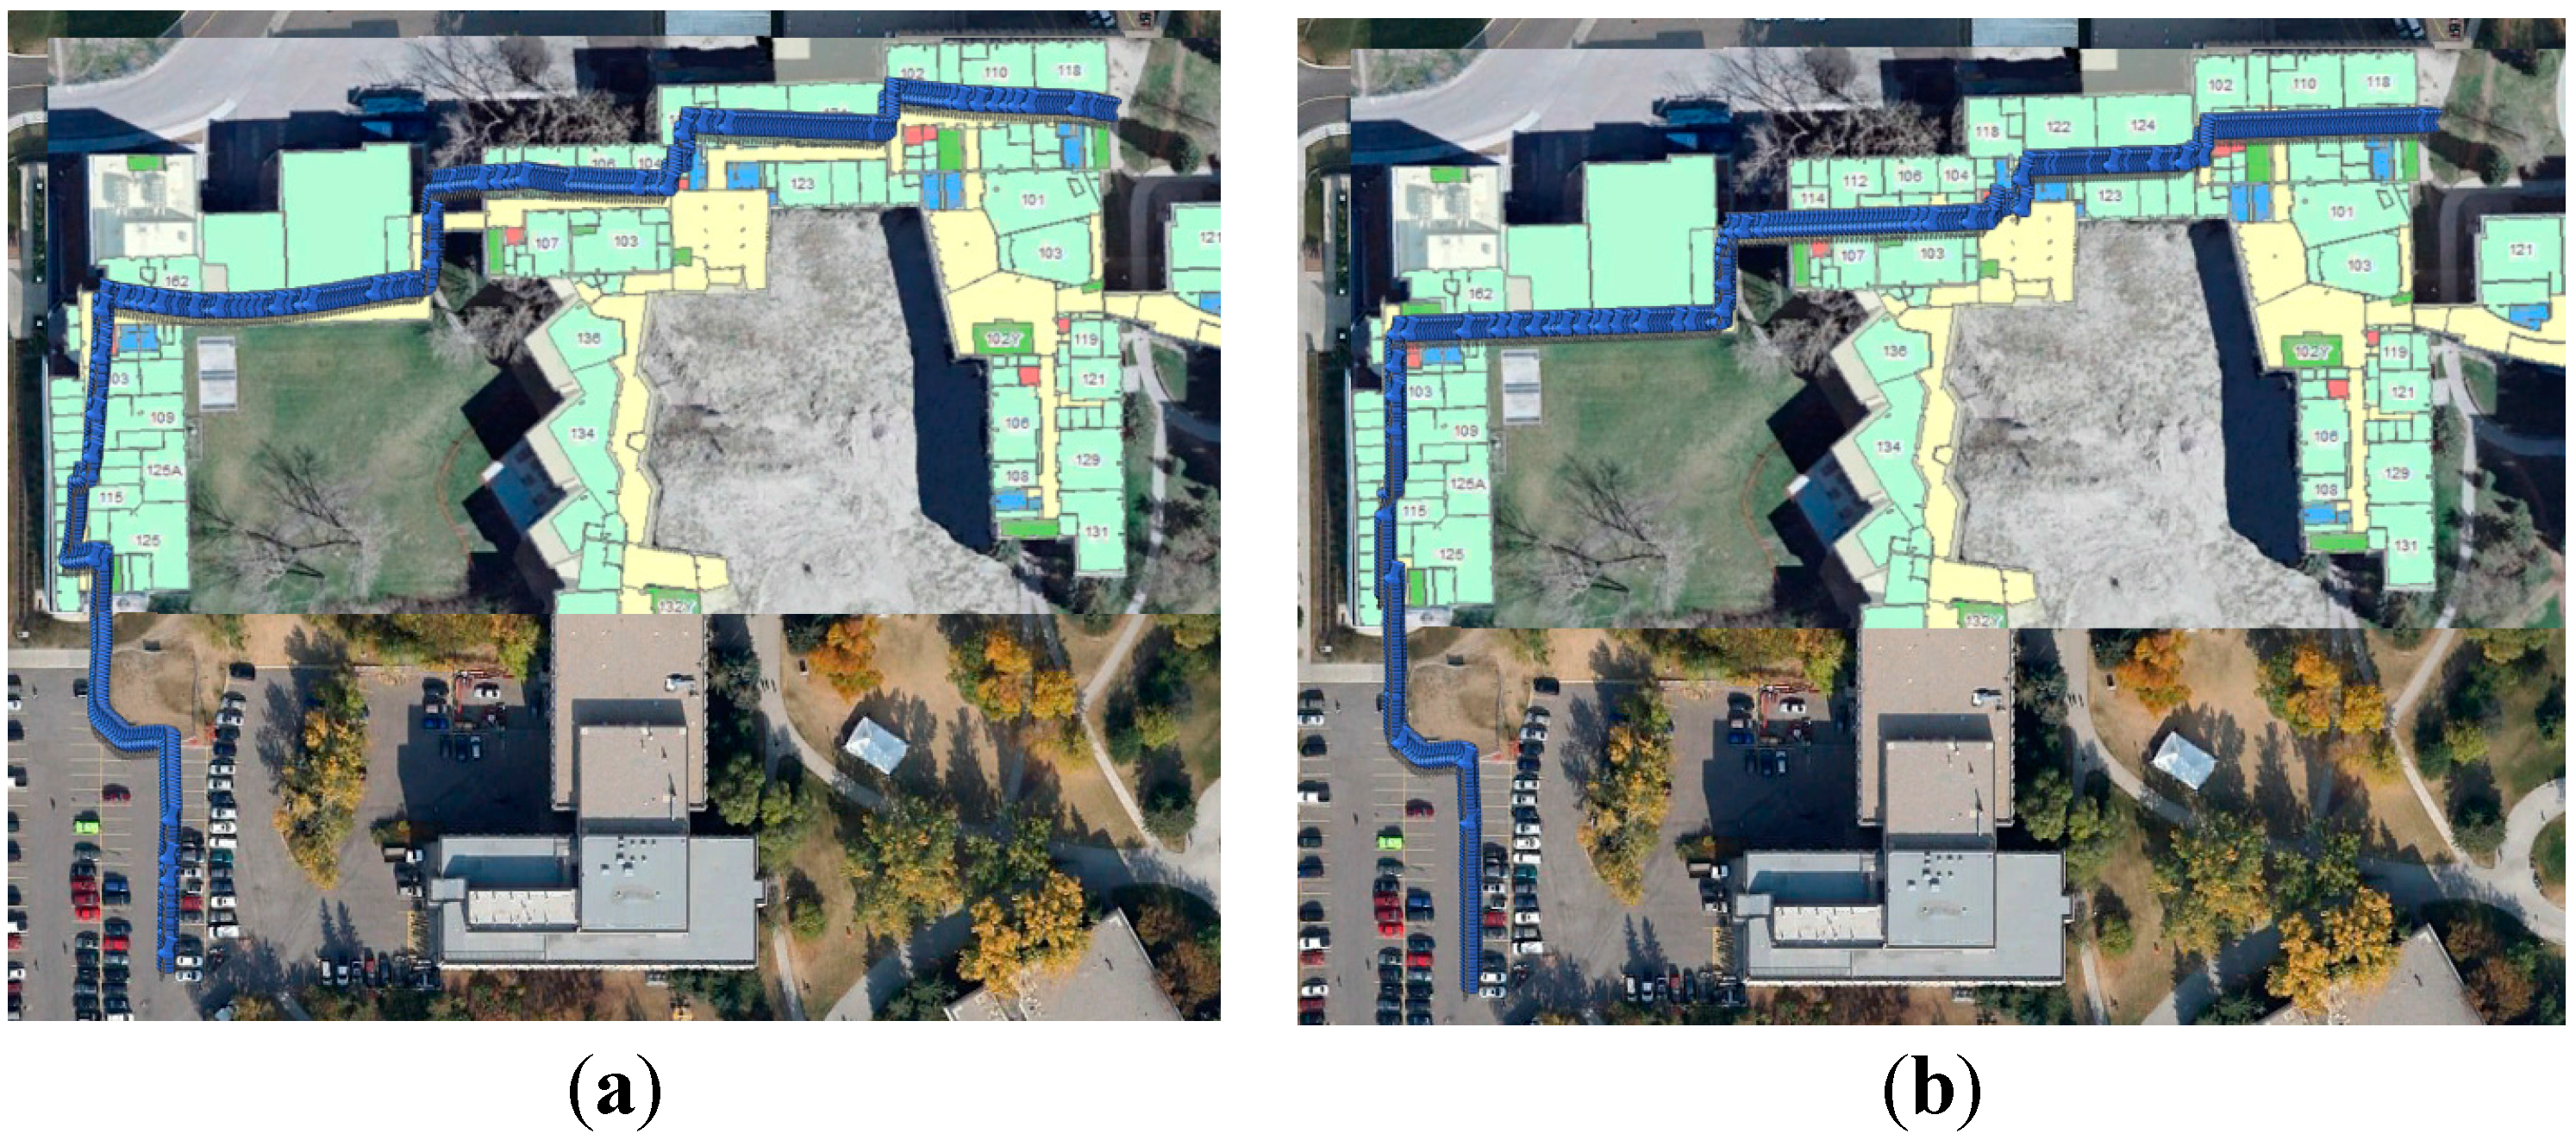
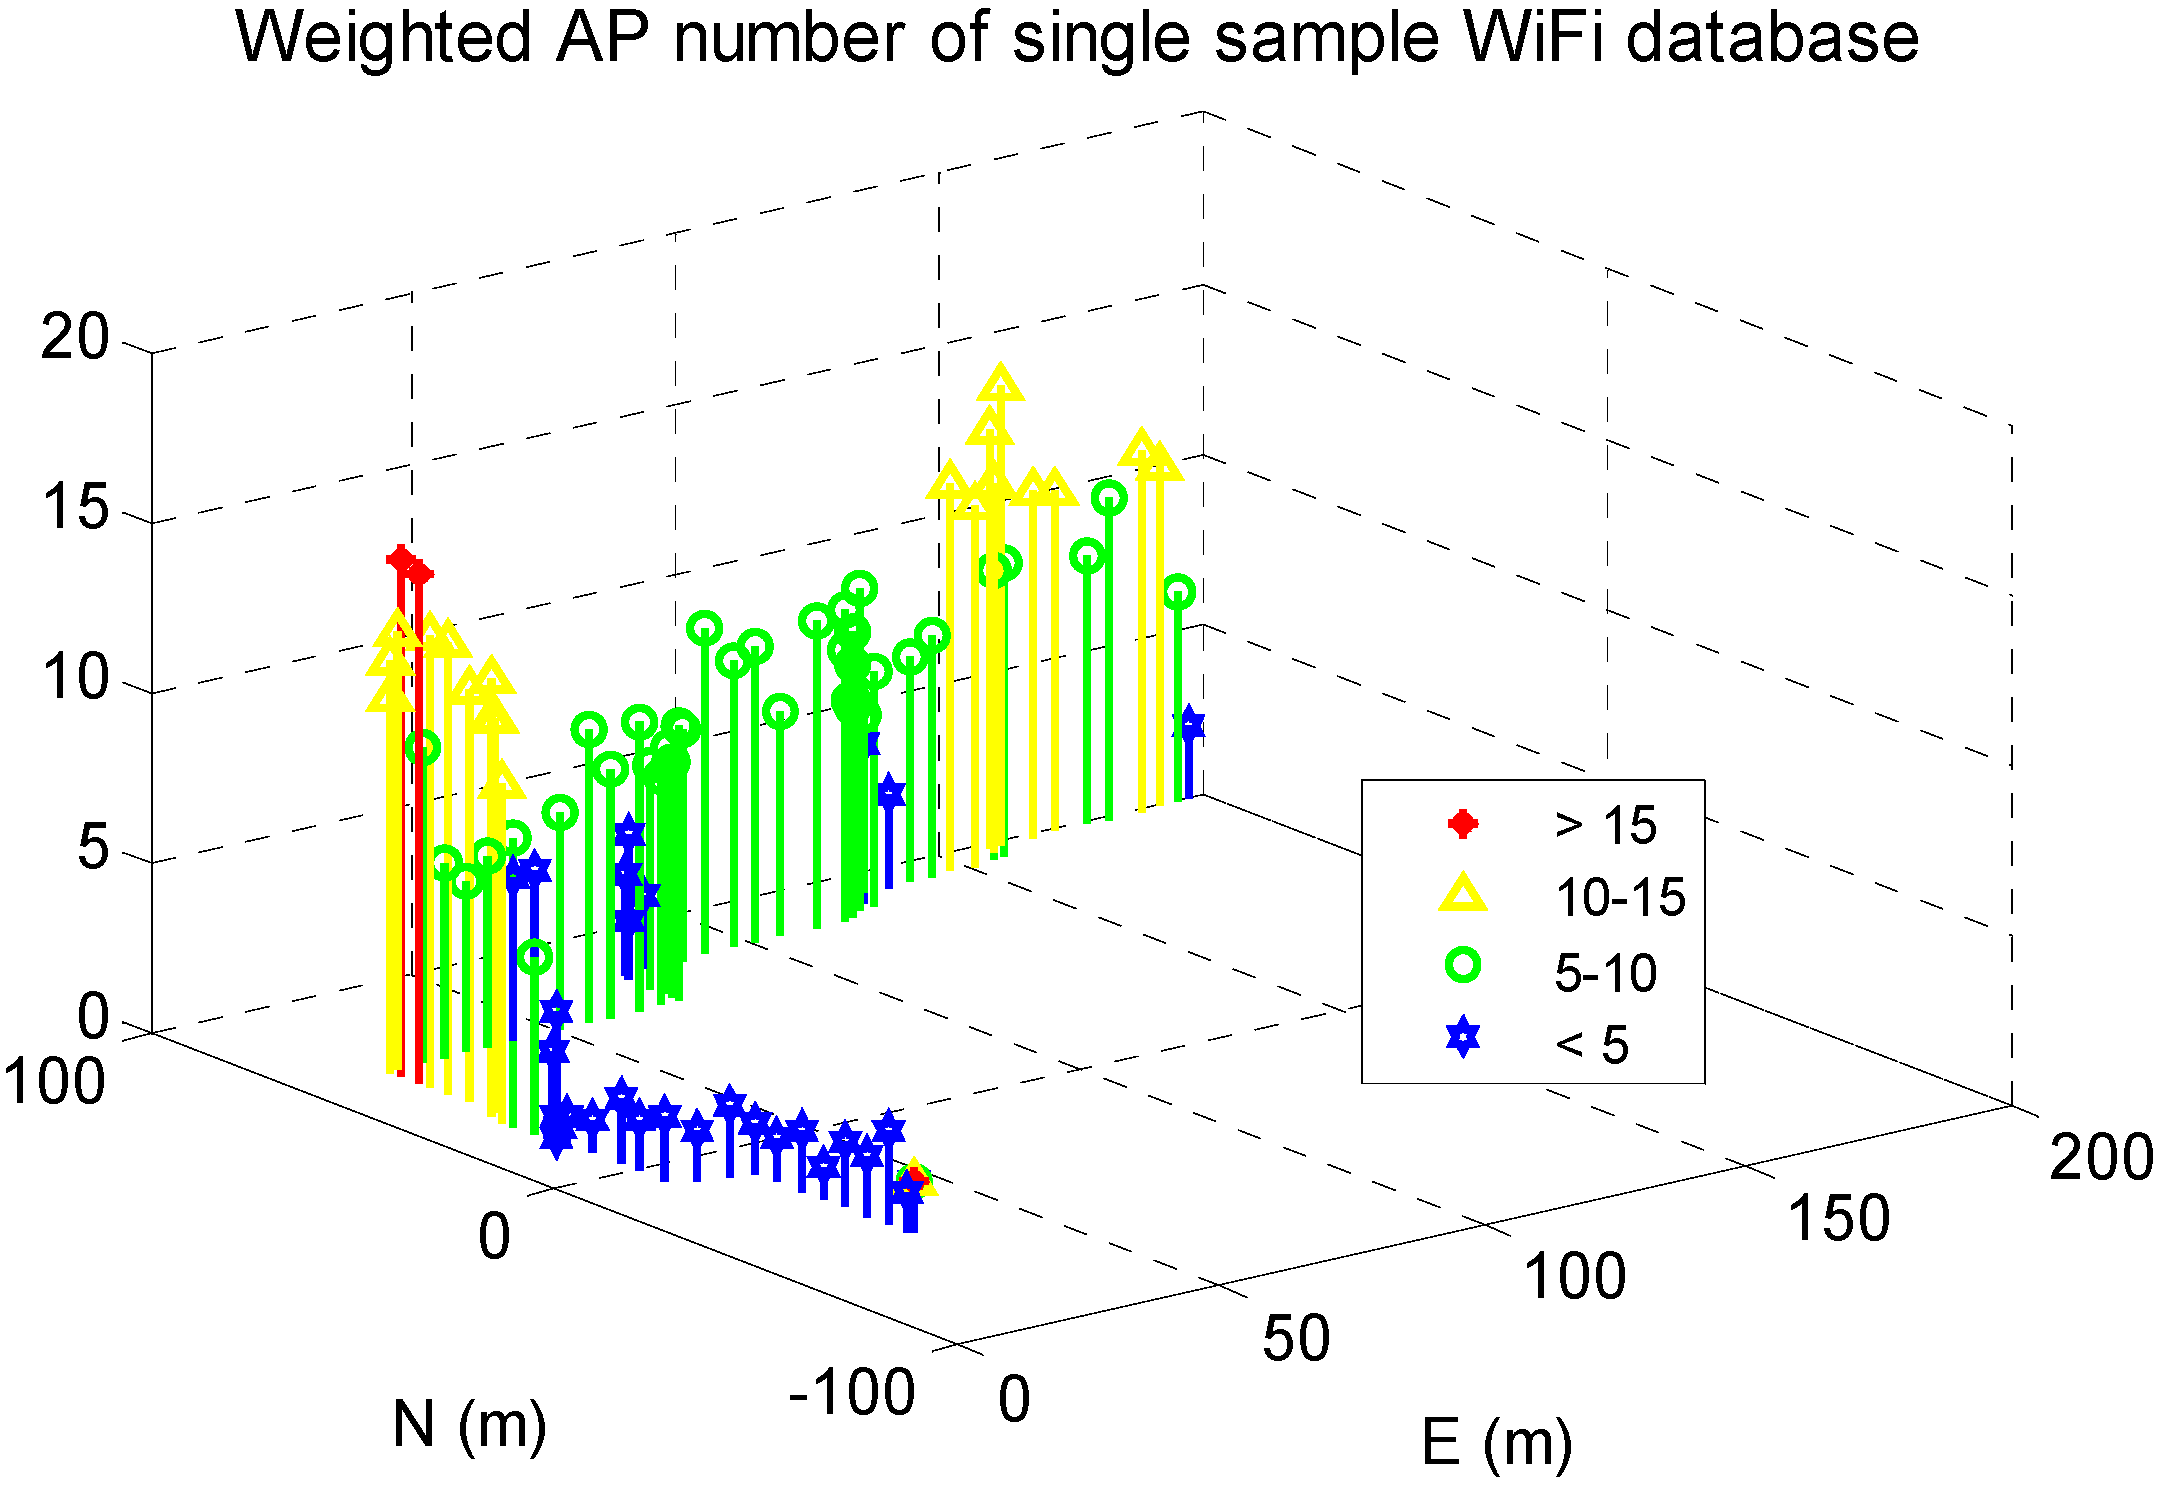
4.1.2. Building WiFi DB Using Sensor-Based Navigation Solutions


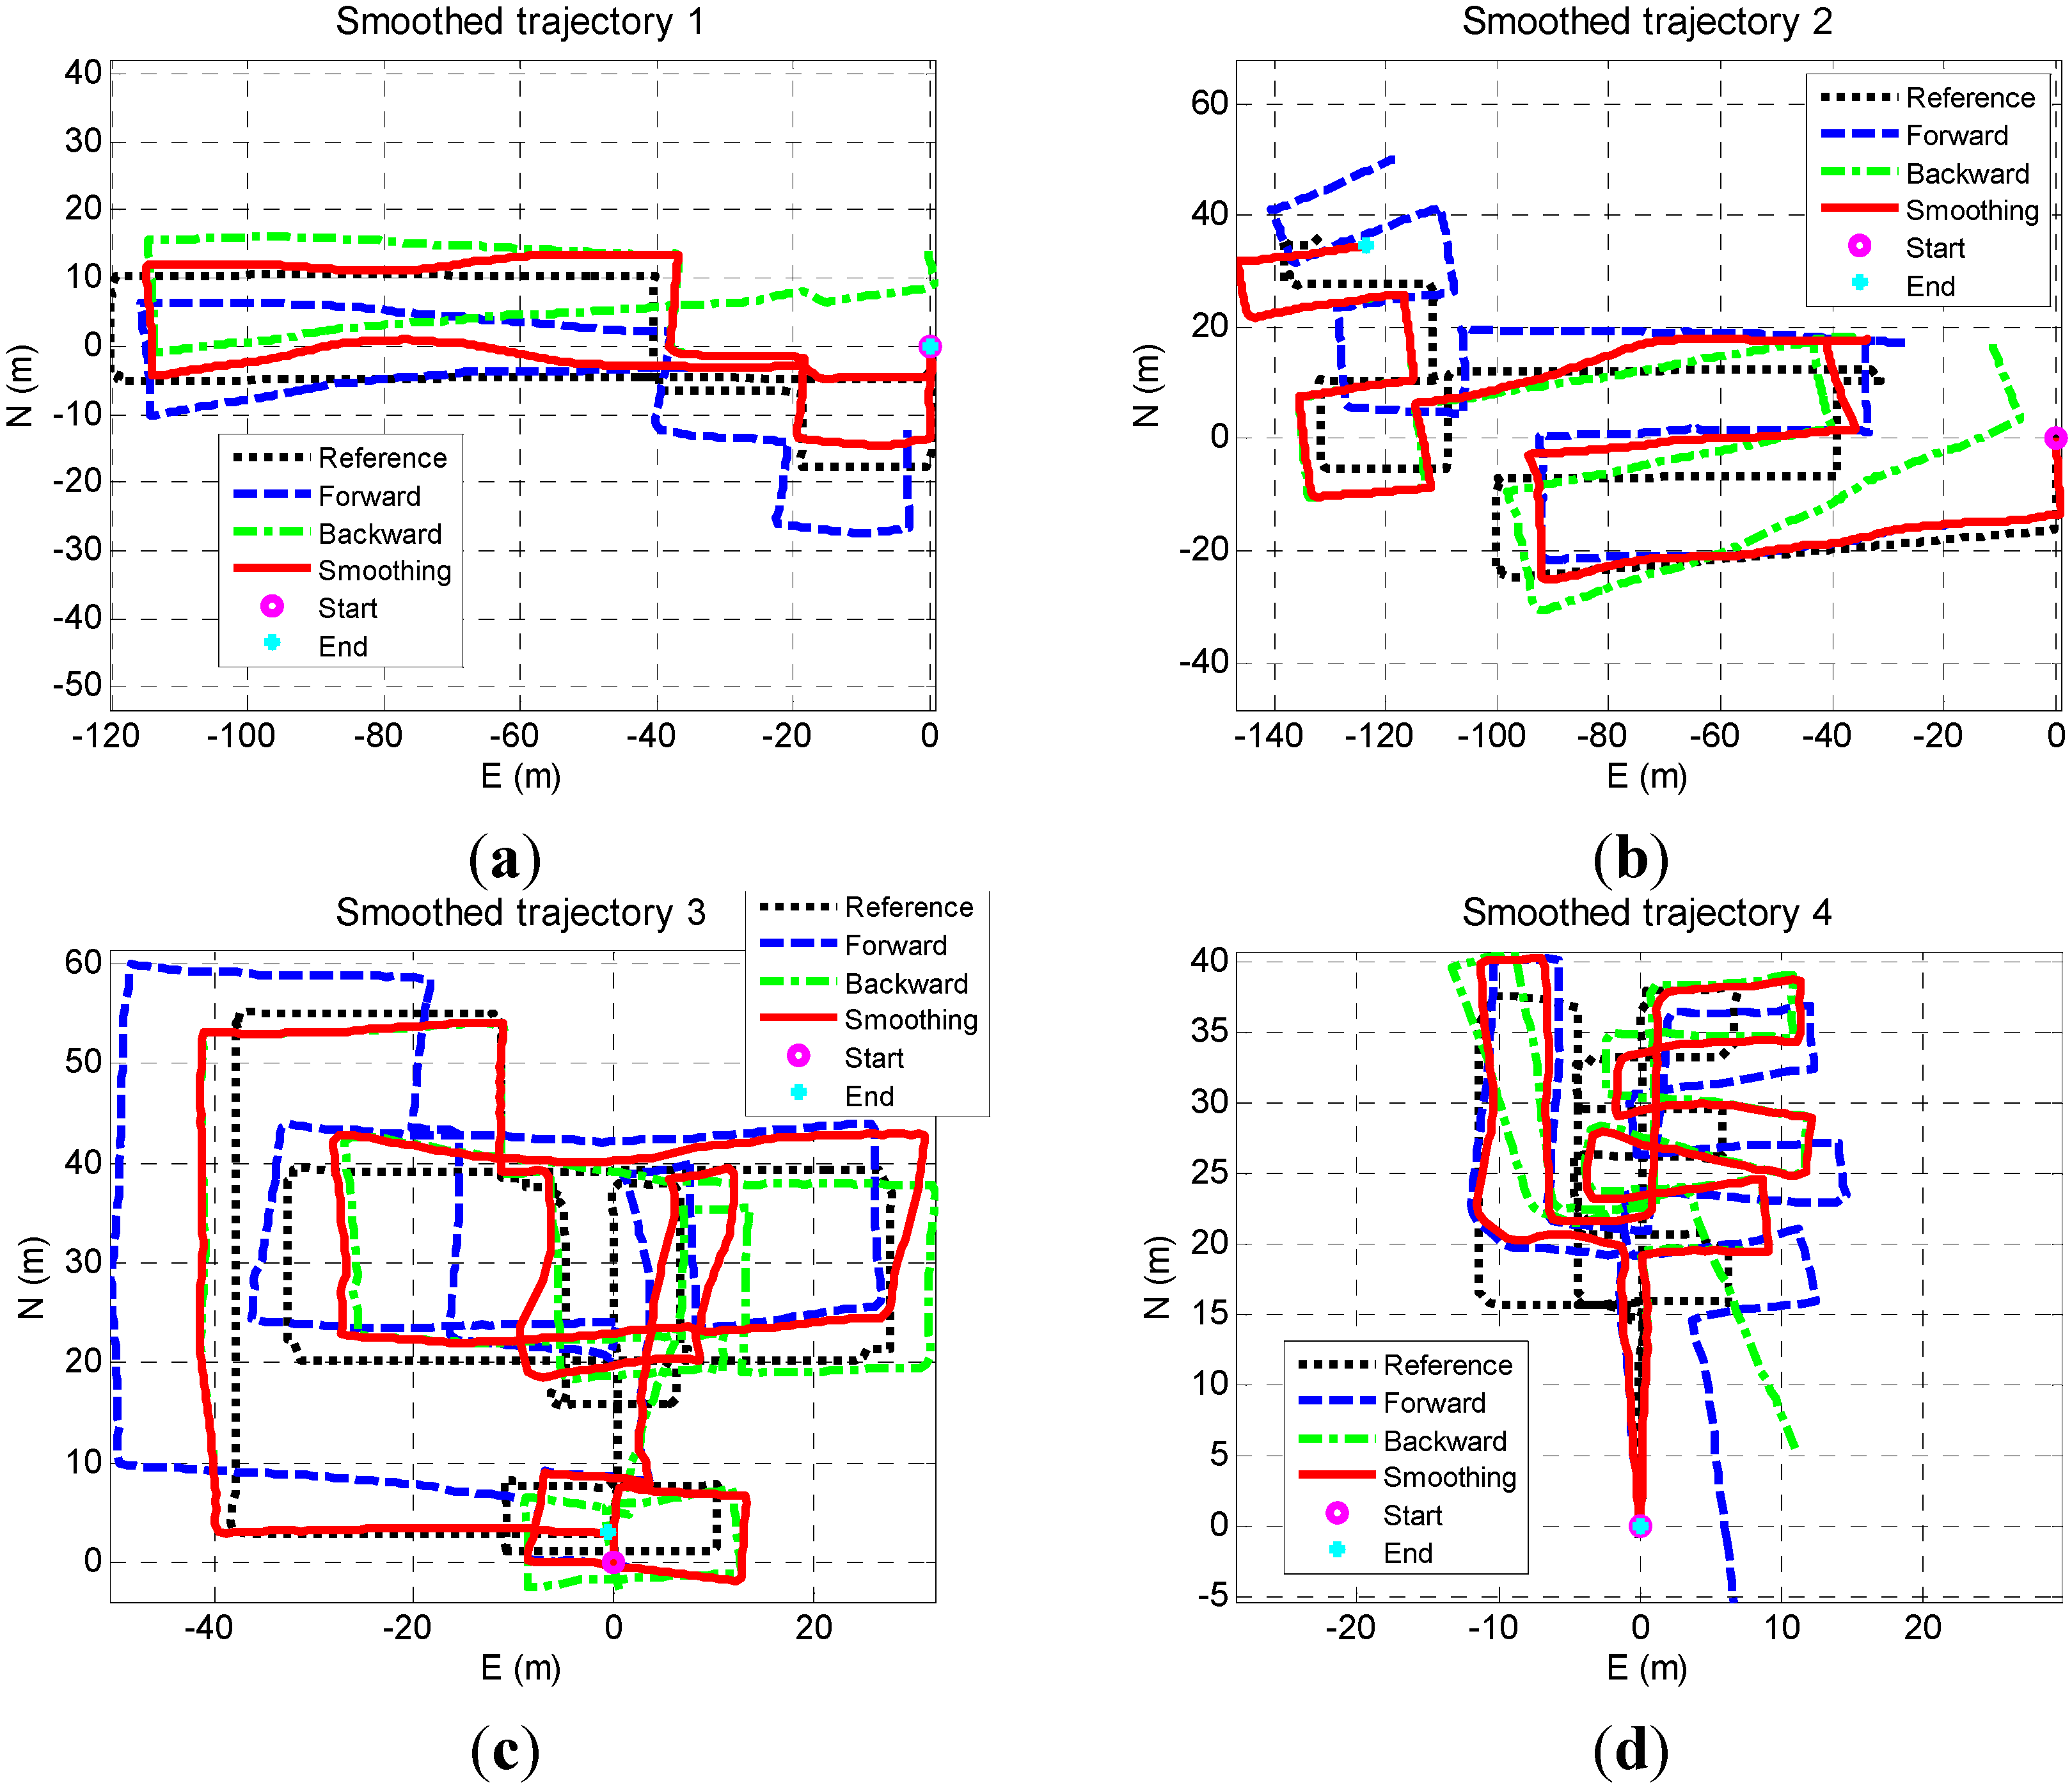
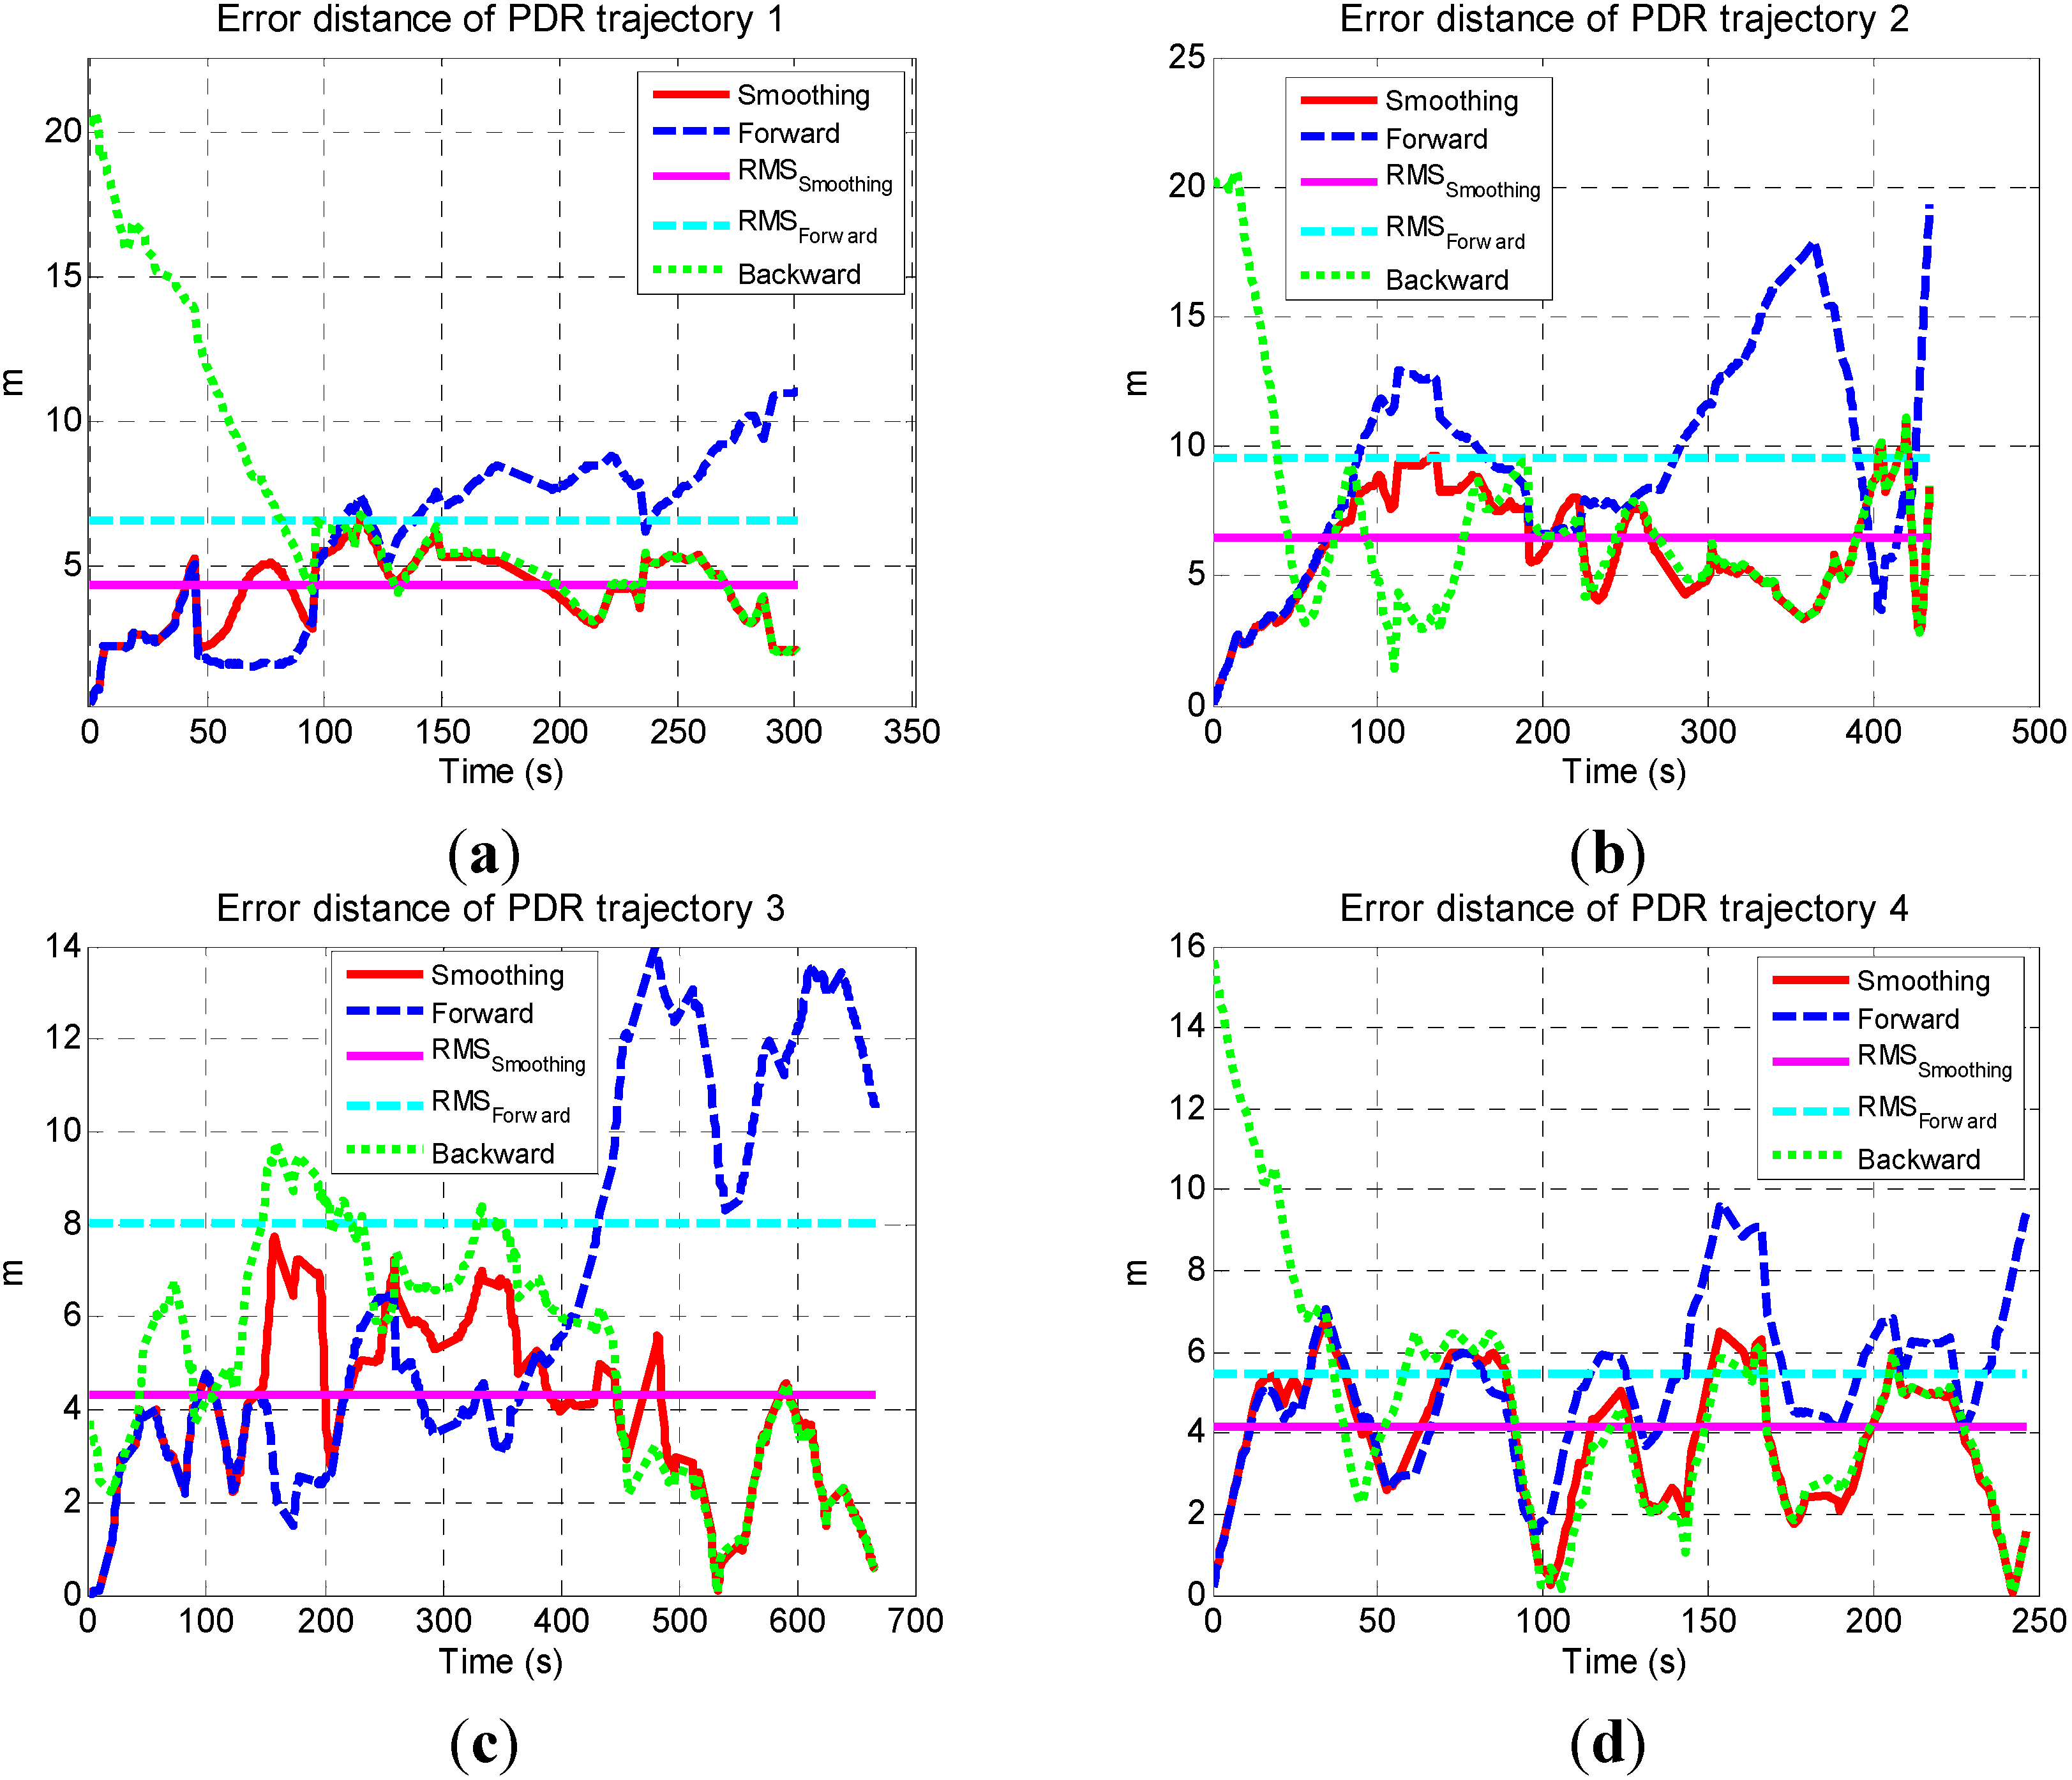
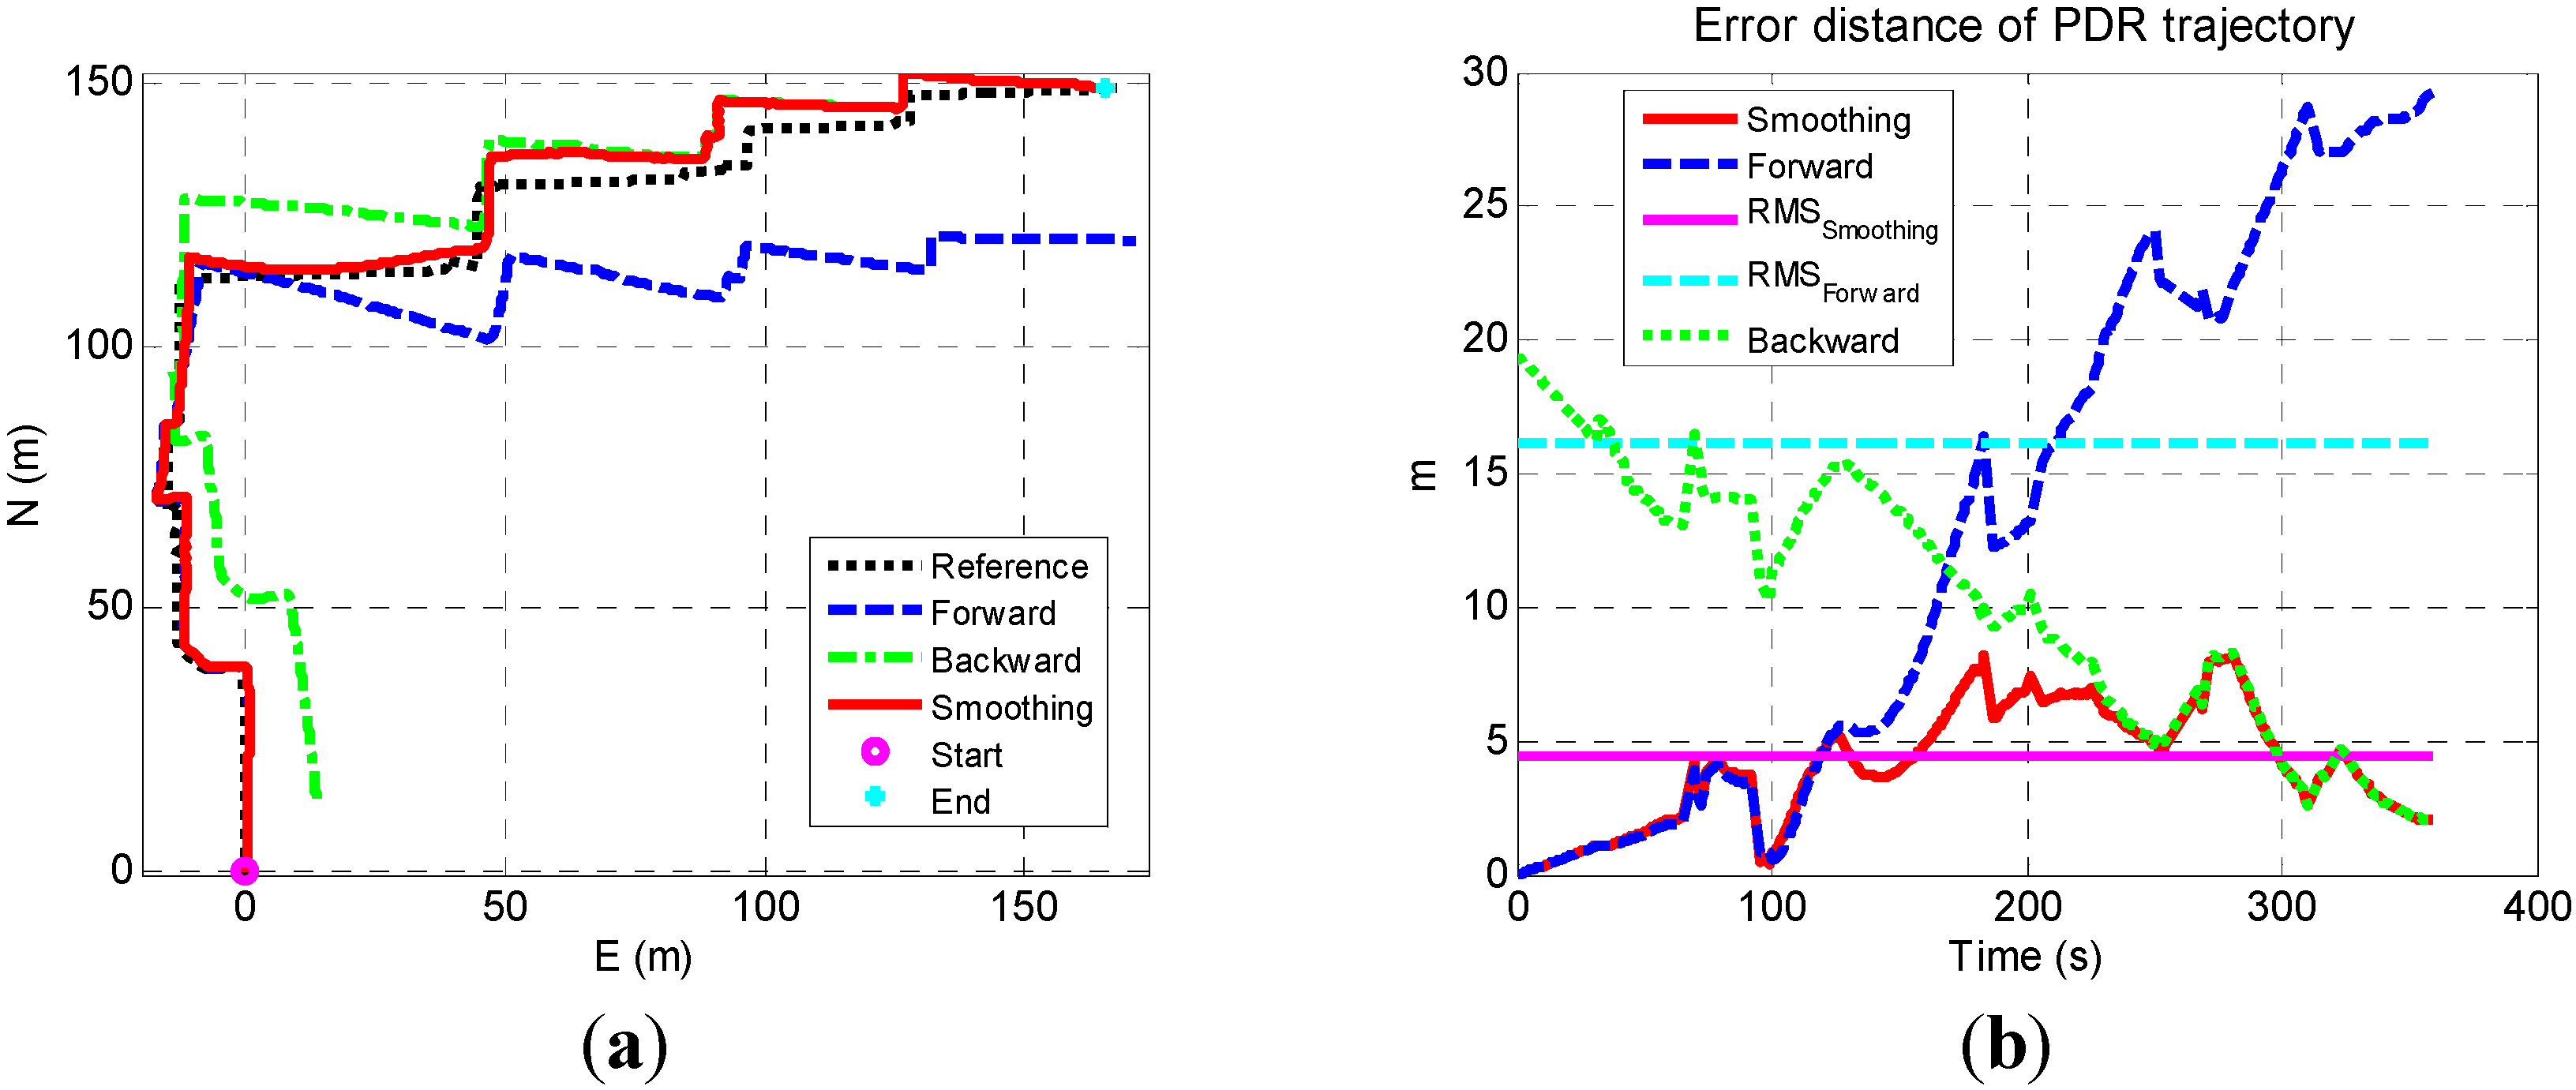
| Trajectory | Errors in Forward Results | Errors in Smoothed Results | RMS Reduction | ||
|---|---|---|---|---|---|
| Max | RMS | Max | RMS | ||
| 1 | 11.0 | 6.6 | 6.7 | 4.3 | 34.9% |
| 2 | 19.3 | 9.5 | 11.1 | 6.5 | 31.6% |
| 3 | 14.0 | 8.0 | 7.7 | 4.3 | 46.3% |
| 4 | 9.6 | 5.5 | 7.0 | 4.1 | 25.5% |
| RMS | 16.1 | 8.7 | 9.6 | 5.7 | 34.5% |


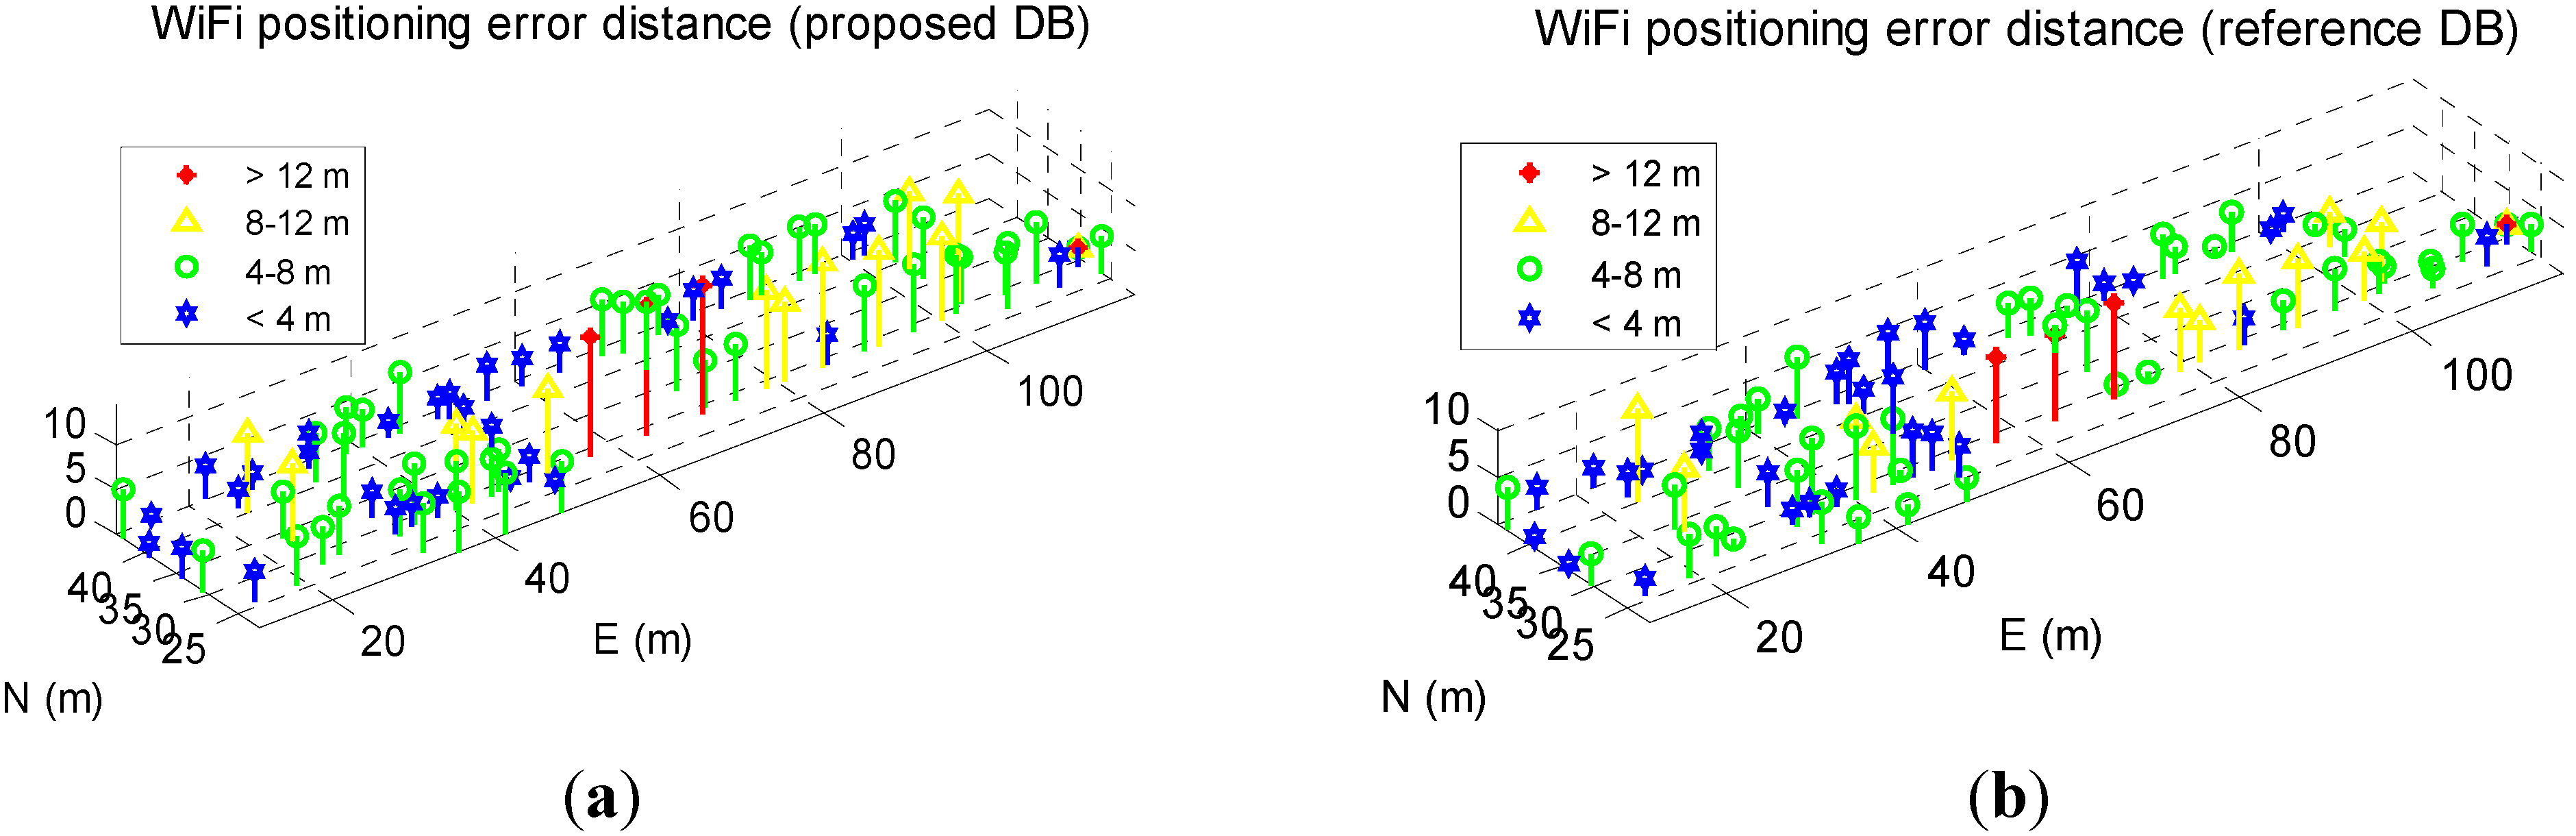
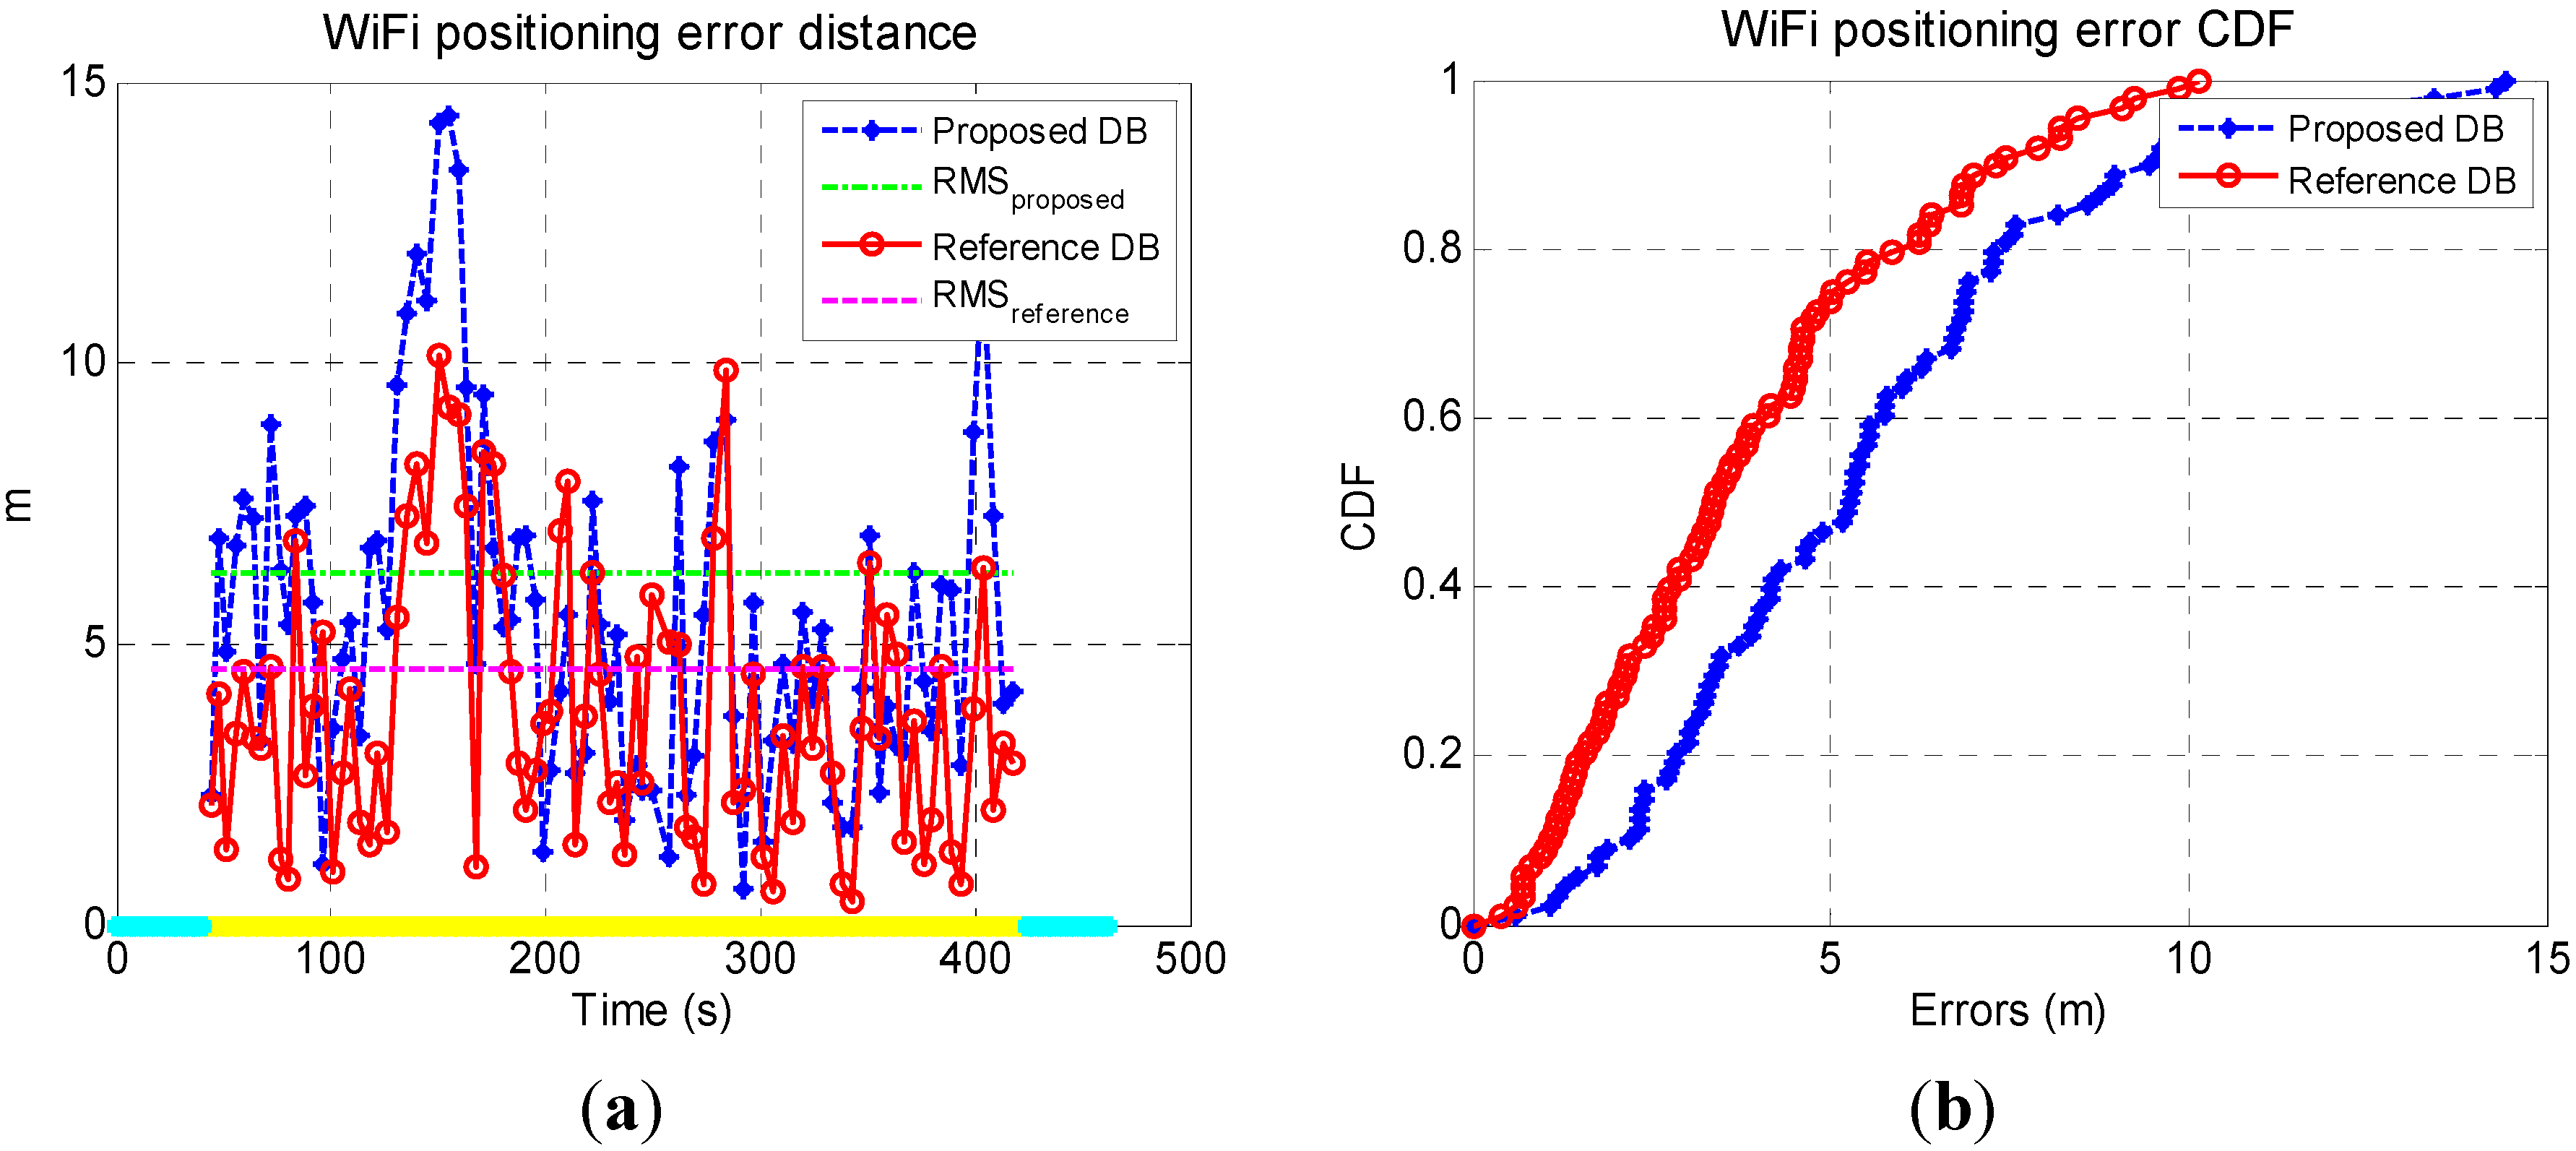
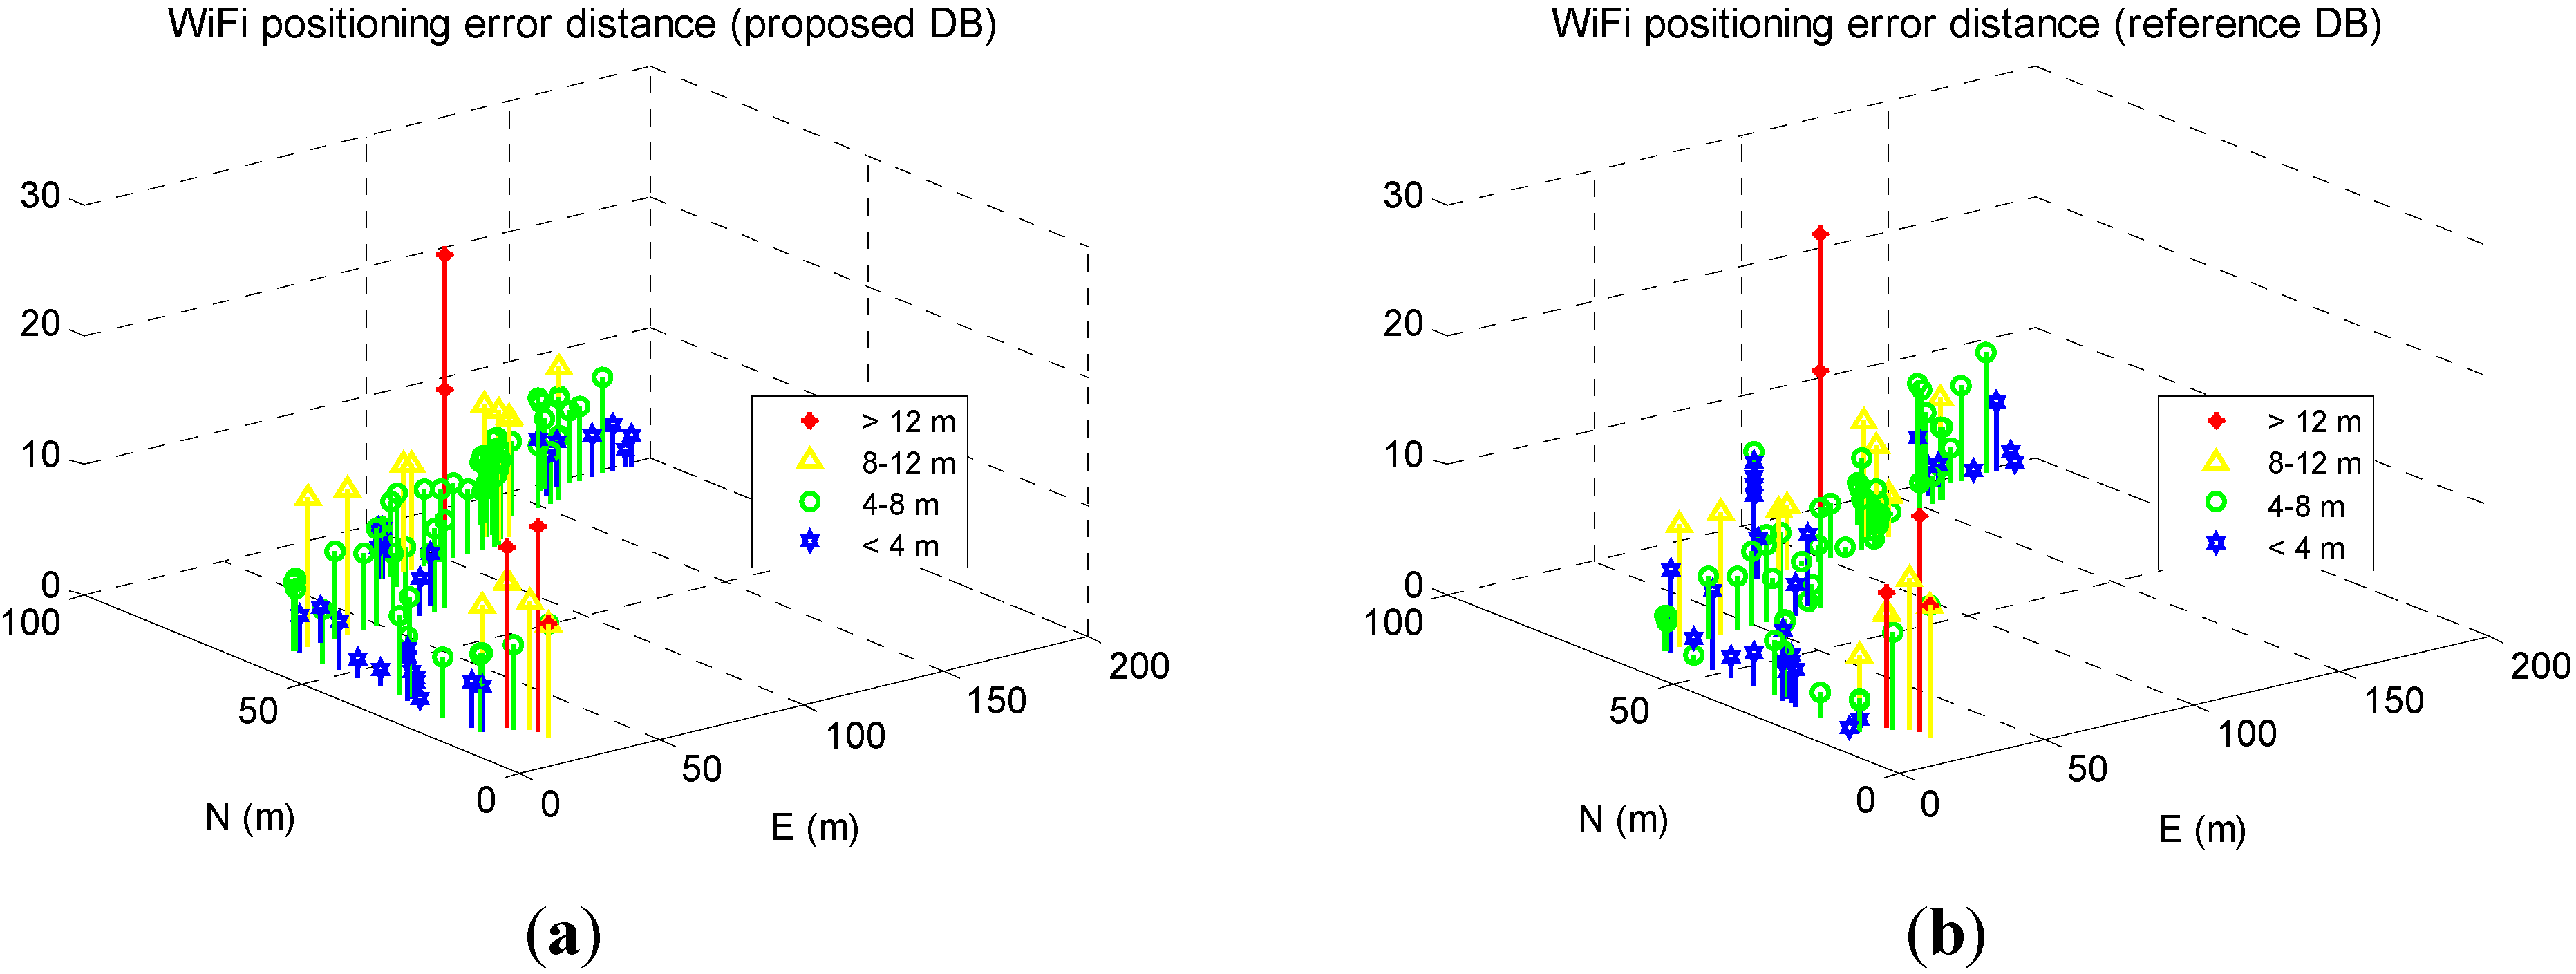
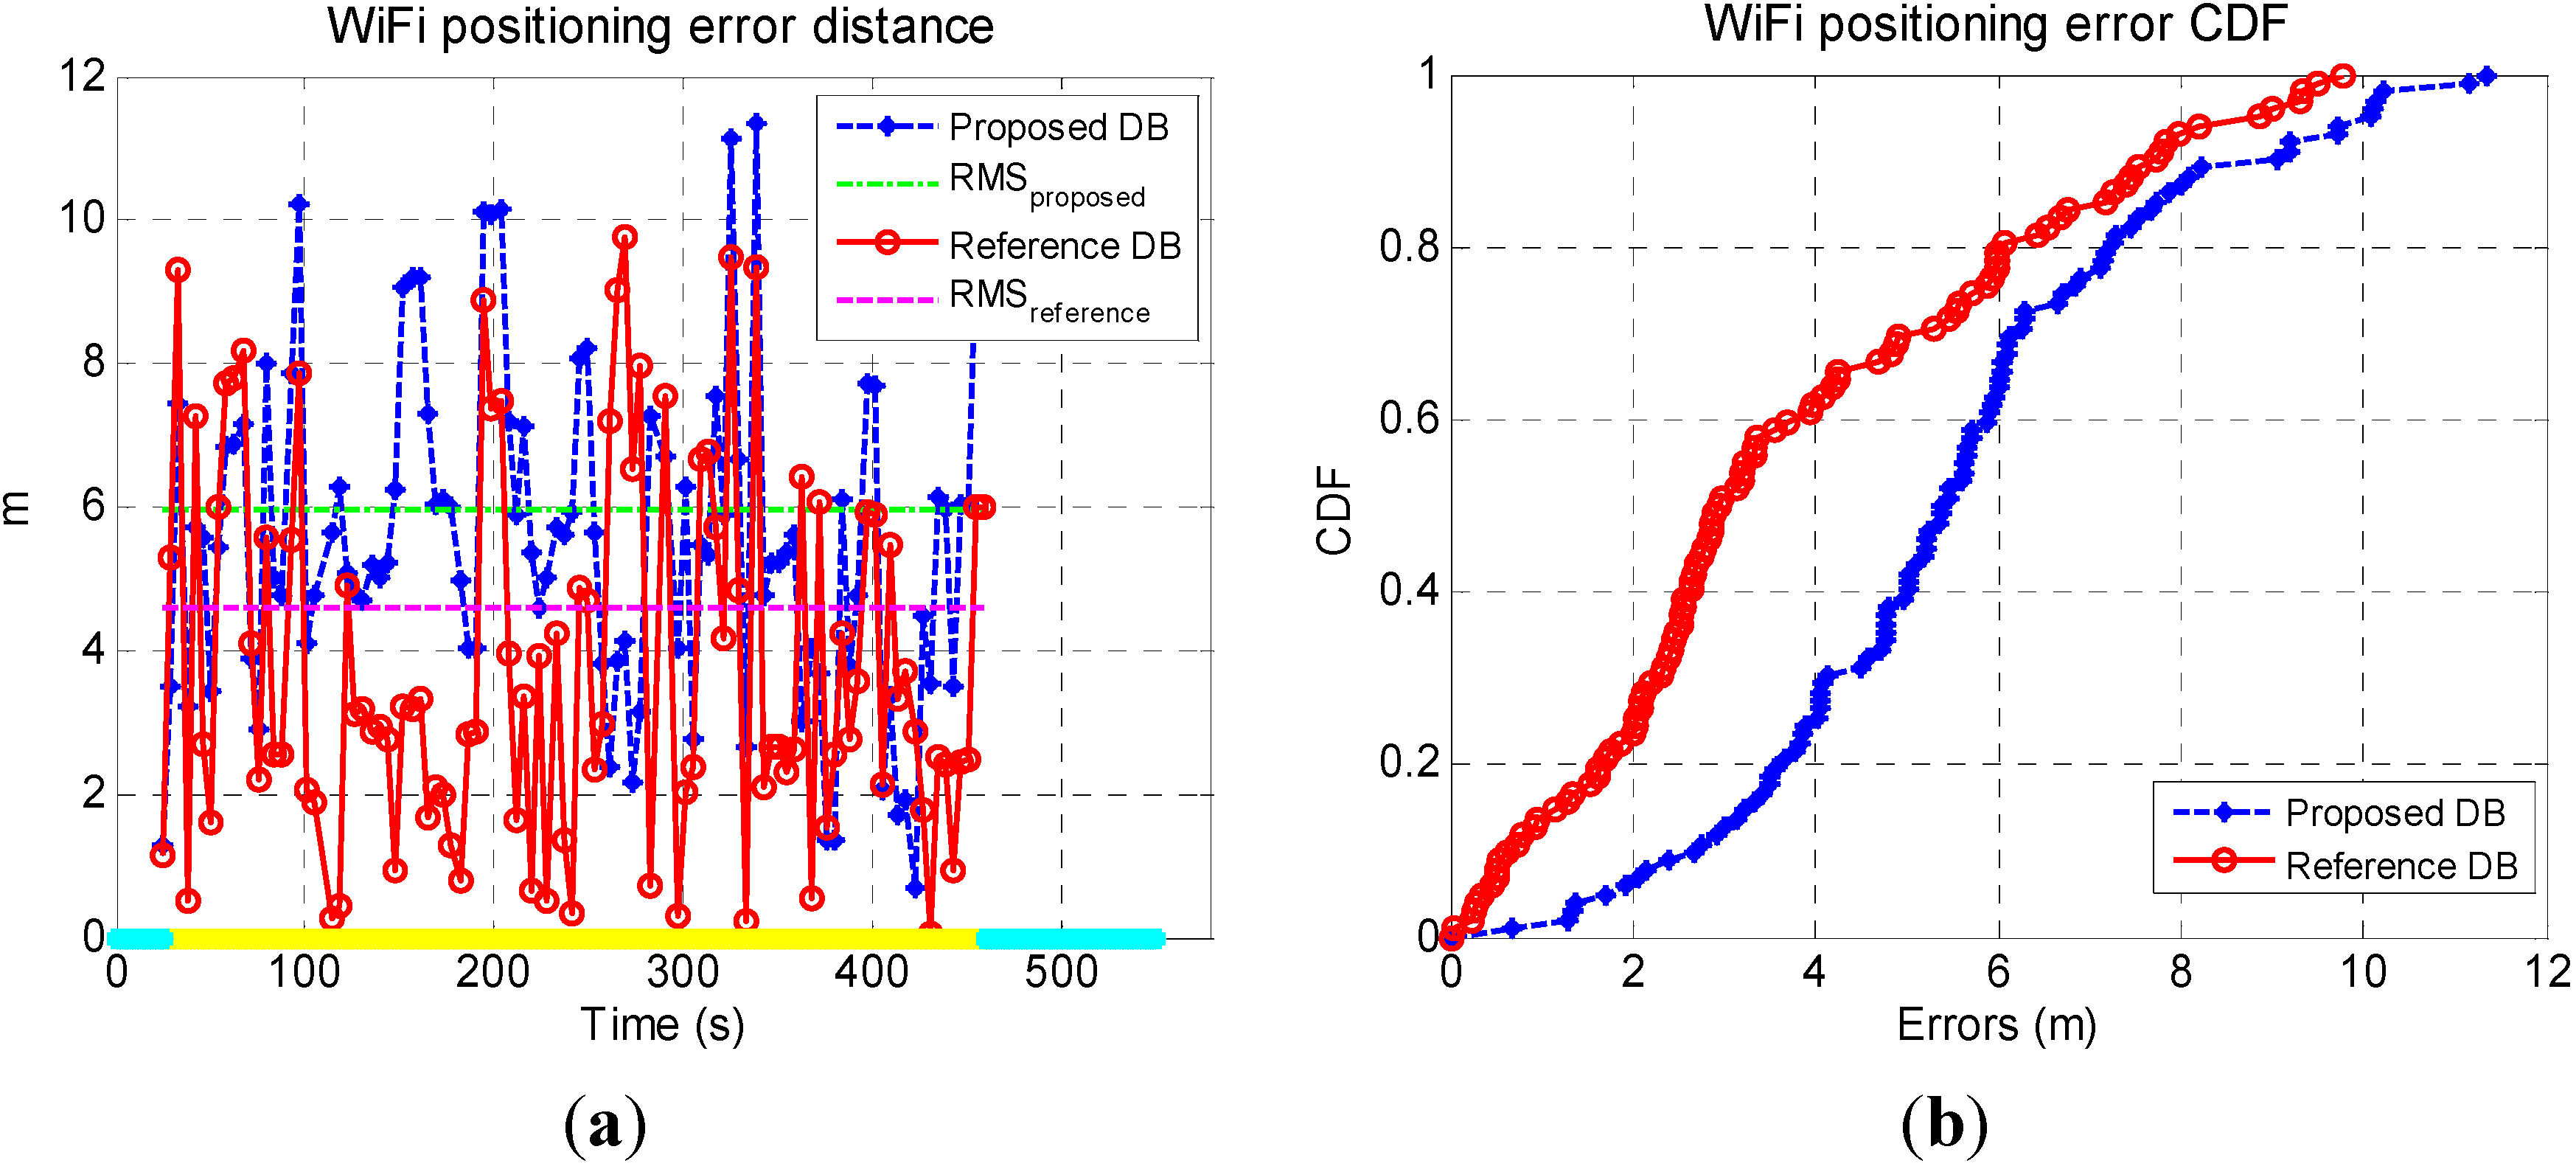
4.1.3. WiFi Fingerprinting Using Generated DB


4.2. Tests at ENB
4.2.1. Trajectory for Building DB


4.2.2. Building WiFi DB Using Sensor-Based Navigation Solution


4.2.3. WiFi Fingerprinting Using Generated DB


5. Conclusions
Acknowledgments
Author Contributions
Conflicts of Interest
References
- Berg insight. LBS Research Series: Mobile Location-Based Services. Available online: http://www.berginsight.com/ReportPDF/ProductSheet/bi-lbs8-ps.pdf (accessed on 7 July 2014).
- Mokbel, M.F.; Levandoski, J.J. Toward context and preference-aware location-based services. In Proceedings of the Eighth ACM International Workshop on Data Engineering for Wireless and Mobile Access, Providence, RI, USA, 29 July 2009; pp. 25–32.
- He, Z.; Petovello, M.; Lachapelle, G. Indoor doppler error characterization for high sensitivity GNSS receivers. IEEE Trans. Aerosp. Electron. Syst. 2014, 50. [Google Scholar] [CrossRef]
- Oppermann, F.J.; Boano, C.A.; Römer, K. A decade of wireless sensing applications: Survey and taxonomy. In The Art of Wireless Sensor Networks; Springer: Berlin/Heidelberg, Germany, 2014; pp. 11–50. [Google Scholar]
- Retscher, G. Pedestrian navigation systems and location-based services. In Proceedings of the Fifth IEE International Conference on 3G Mobile Communication Technologies, London, UK, 18–20 October 2004.
- Mirowski, P.; Ho, T.K.; Yi, S.; MacDonald, M. SignalSLAM: Simultaneous localization and mapping with mixed WiFi, Bluetooth, LTE and magnetic signals. In Proceedings of the 2013 International Conference on Indoor Positioning and Indoor Navigation (IPIN), Montbéliard, France, 28–31 October 2013.
- Ruiz, A.R.J.; Granja, F.S.; Prieto Honorato, J.C.; Rosas, J.I.G. Accurate pedestrian indoor navigation by tightly coupling foot-mounted IMU and RFID measurements. IEEE Trans. Instrum. Meas. 2012, 61, 178–189. [Google Scholar] [CrossRef]
- Goncalo, G.; Helena, S. Indoor location system using ZigBee technology. In Proceedings of the Third IEEE International Conference on Sensor Technologies and Applications (SENSORCOMM’09), Athens, Greece, 18–23 June 2009.
- Zampella, F.; de Angelis, A.; Skog, I.; Zachariah, D.; Jimenez, A. A constraint approach for UWB and PDR fusion. In Proceedings of 2012 International Conference on Indoor Positioning and Indoor Navigation (IPIN), Sydney, Australia, 13–15 November 2012.
- He, Z.; Renaudin, V.; Petovello, M.G.; Lachapelle, G. Use of high sensitivity GNSS receiver doppler measurements for indoor pedestrian dead reckoning. Sensors 2013, 13, 4303–4326. [Google Scholar] [CrossRef] [PubMed]
- Barnes, J.; Rizos, C.; Pahwa, A.; Politi, N.; van Cranenbroeck, J. The potential of locata technology for structural monitoring applications. Positioning 2007, 1, 166–172. [Google Scholar] [CrossRef]
- Fallah, N.; Apostolopoulos, I.; Bekris, K.; Folmer, E. Indoor human navigation systems: A survey. Interact. Comput. 2013, 25, 21–33. [Google Scholar]
- Uri Schatzberg, L.B.; Banin, L.; Amizur, Y. Intel-Enhanced WiFi ToF indoor positioning system with MEMS-based INS and pedometric information. In Proceedings of ION/IEEE PLANS, Monterey, CA, USA, 5–8 May 2014.
- Panyov, A.A.; Golovan, A.A.; Smirnov, A.S. Indoor positioning using WiFi fingerprinting pedestrian dead reckoning and aided INS. In Proceedings of 2014 International Symposium on Inertial Sensors and Systems (ISISS), Laguna Beach, CA, USA, 25–26 February 2014.
- Husen, M.N.; Lee, S. Indoor human localization with orientation using WiFi fingerprinting. In Proceedings of the Eighth International Conference on Ubiquitous Information Management and Communication, Siem Reap, Cambodia, 9–11 January 2014.
- Laoudias, C.; Larkou, G.; Zeinalipour-Yazti, D.; Panayiotou, C.G. Airplace: Indoor geolocation on smartphones through WiFi fingerprinting. Mob. Comput. 2013, 93, 37. [Google Scholar]
- Lin, P.; Li, Q.; Fan, Q.; Gao, X.; Hu, S. A real-time location-based services system using WiFi fingerprinting algorithm for safety risk assessment of workers in tunnels. Math. Probl. Eng. 2014, 2014, 1–10. [Google Scholar] [CrossRef]
- Farshad, A.; Li, J.; Marina, M.K.; Garcia, F.J. A microscopic look at WiFi fingerprinting for indoor mobile phone localization in diverse environments. In Proceedings of 2013 International Conference on Indoor Positioning and Indoor Navigation (IPIN), Montbéliard, France, 28–31 October 2013.
- Kodippili, N.; Dias, D. Integration of fingerprinting and trilateration techniques for improved indoor localization. In Proceedings of the Seventh International Conference on Wireless and Optical Communications Networks, Colombo, Sri Lanka, 6–8 September 2010; pp. 1–6.
- Bahl, P.; Padmanabhan, V.N. RADAR: An in-building RF-based user location and tracking system. In Proceedings of Nineteenth Annual Joint Conference of the IEEE Computer and Communications Societies, Tel Aviv, Israel, 26–30 March 2000.
- Torres-Solis, J.; Falk, T.H.; Chau, T. A review of indoor localization technologies: Towards navigational assistance for topographical disorientation. Ambient Intell. 2010, 2010, 51–84. [Google Scholar]
- Bose, A.; Foh, C.H. A practical path loss model for indoor WiFi positioning enhancement. In Proceedings of the Sixth International Conference on Information, Communications & Signal Processing, Singapore, Singapore, 10–13 December 2007.
- Akyildiz, I.F.; Sun, Z.; Vuran, M.C. Signal propagation techniques for wireless underground communication networks. Phys. Commun. 2009, 2, 167–183. [Google Scholar] [CrossRef]
- Nguyen, L.T.; Zhang, J. Wi-Fi fingerprinting through active learning using smartphones. In Proceedings of the 2013 ACM Conference on Pervasive and Ubiquitous Computing Adjunct Publication, Zurich, Switzerland, 8–12 September 2013.
- Kannan, B.; Meneguzzi, F.; Bernardine Dias, M.; Sycara, K. Predictive indoor navigation using commercial smart-phones. In Proceedings of the 28th Annual ACM Symposium on Applied Computing, Coimbra, Portugal, 18–22 March 2013.
- Kushki, A.; Plataniotis, K.N.; Venetsanopoulos, A.N. Kernel-Based positioning in wireless local area networks. IEEE Trans. Mob. Comput. 2007, 6, 689–705. [Google Scholar] [CrossRef]
- Ni, L.M.; Liu, Y.; Lau, Y.C.; Patil, A.P. LANDMARC: Indoor location sensing using active RFID. Wirel. Netw. 2004, 10, 701–710. [Google Scholar] [CrossRef]
- Fang, S.-H.; Lin, T.-N. Accurate indoor location estimation by incorporating the importance of access points in wireless local area networks. In Proceedings of IEEE Global Telecommunications Conference (GLOBECOM 2010), Miami, FL, USA, 6–10 December 2010.
- Cheng, Y.-C.; Chawathe, Y.; LaMarca, A.; Krumm, J. Accuracy characterization for metropolitan-scale WiFi localization. In Proceedings of the Third International Conference on Mobile Systems, Applications and Services, Seattle, WA, USA, 6–8 June 2005.
- Skyhook. Available online: http://www.skyhookwireless.com/products/#optimized (accessed on 7 July 2014).
- Cheng, J.; Yang, L.; Li, Y.; Zhang, W. Seamless outdoor/indoor navigation with WIFI/GPS aided low cost Inertial Navigation System. Phys. Commun. 2014, 13, 31–43. [Google Scholar] [CrossRef]
- Xiang, Z.; Song, S.; Chen, J.; Wang, H.; Huang, J.; Gao, X. A wireless LAN-based indoor positioning technology. IBM J. Res. Dev. 2004, 48, 617–626. [Google Scholar] [CrossRef]
- Lin, H.; Zhang, Y.; Griss, M.; Landa, I. Mobile Entity Localization and Tracking in GPS-Less Environnments; Springer: Berlin/Heidelberg, Germany, 2009; pp. 183–196. [Google Scholar]
- Bolliger, P. Redpin-adaptive, zero-configuration indoor localization through user collaboration. In Proceedings of the First ACM International Workshop on Mobile Entity Localization and Tracking in GPS-Less Environments, San Francisco, CA, USA, 14–19 September 2008.
- Li, Y.; Zhuang, Y.; Lan, H.; Zhang, P.; Niu, X.; El-Sheimy, N. WiFi-aided magnetic matching for indoor navigation with consumer portable devices. Micromachines 2015, 6, 747–764. [Google Scholar] [CrossRef]
- Ferris, B.; Fox, D.; Lawrence, N.D. WiFi-SLAM using Gaussian process latent variable models. In Proceedings of IJCAI-07, Hyderabad, India, 6–12 January 2007.
- The SLAM problem: A survey. Available online: http://eia.udg.es/~qsalvi/papers/2008-CCIAa.pdf (accessed on 14 July 2015).
- Woodman, O.; Harle, R. Rf-based initialisation for inertial pedestrian tracking. In Pervasive Computing; Springer: Berlin/Heidelberg, Germany, 2009; pp. 238–255. [Google Scholar]
- Kim, Y.; Chon, Y.; Cha, H. Smartphone-based collaborative and autonomous radio fingerprinting. IEEE Trans. Syst. Man Cybern. Part C Appl. Rev. 2012, 42, 112–122. [Google Scholar] [CrossRef]
- Zhuang, Y.; Shen, Z.; Syed, Z.; Georgy, J.; Syed, H.; El-Sheimy, N. Autonomous WLAN heading and position for smartphones. In Proceedings of 2014 IEEE/ION Position, Location and Navigation Symposium-PLANS, Monterey, CA, USA, 5–8 May 2014.
- Chintalapudi, K.; Padmanabha Iyer, A.; Padmanabhan, V.N. Indoor localization without the pain. In Proceedings of the Sixteenth Annual International Conference on Mobile Computing and Networking, Chicago, IL, USA, 20–24 September 2010.
- Shaeffer, D.K. MEMS inertial sensors: A tutorial overview. IEEE. Commun. Mag. 2013, 51, 100–109. [Google Scholar] [CrossRef]
- Zhuang, Y.; Syed, Z.; Georgy, J.; El-Sheimy, N. Autonomous smartphone based WiFi positioning system by using access points localization and crowdsourcing. Pervasive Mob. Comput. 2015, 18, 118–136. [Google Scholar] [CrossRef]
- Niu, X.; Li, Y.; Zhang, H.; Wang, Q.; Ban, Y. Fast thermal calibration of low-grade inertial sensors and inertial measurement units. Sensors 2013, 13, 12192–12217. [Google Scholar] [CrossRef] [PubMed]
- Titterton, D.H.; Weston, J.L. Strapdown Inertial Navigation Technology, 2nd ed.; The American Institute of Aeronautics and Astronautics: Reston, VA, USA, 2004. [Google Scholar]
- Niu, X.; Li, Y.; Zhang, Q.; Cheng, Y.; Shi, C. Observability analysis of non-holonomic constraints for land-vehicle navigation systems. J. Glob. Position. Syst. 2012, 11, 80–88. [Google Scholar] [CrossRef]
- Afzal, M.H.; Renaudin, V.; Lachapelle, G. Use of earth’s magnetic field for mitigating gyroscope errors regardless of magnetic perturbation. Sensors 2011, 11, 11390–11414. [Google Scholar] [CrossRef] [PubMed]
- Estimation techniques for low-cost inertial navigation. Available online: http://www.ucalgary.ca/engo_webdocs/NES/05.20219.EHShin.pdf (accessed on 14 July 2015).
- Liu, H.; Nassar, S.; El-Sheimy, N. Two-filter smoothing for accurate INS/GPS land-vehicle navigation in urban centers. IEEE Trans. Veh. Technol. 2010, 59, 4256–4267. [Google Scholar] [CrossRef]
- Simón Colomar, D.; Nilsson, J.-O.; Händel, P. Smoothing for ZUPT-Aided INSs. In Proceedings of 2012 International Conference on Indoor Positioning and Indoor Navigation, IPIN, Sydney, Australia, 13–15 November 2012.
- Li, Y.; Niu, X.; Zhang, Q.; Zhang, H.; Shi, C. An in situ hand calibration method using a pseudo-observation scheme for low-end inertial measurement units. Meas. Sci. Technol. 2012, 23, 105104. [Google Scholar] [CrossRef]
- Li, W.; Wang, J. Effective adaptive Kalman filter for MEMS-IMU/magnetometers integrated attitude and heading reference systems. J. Navig. 2013, 66, 99–113. [Google Scholar] [CrossRef]
- Han, S.; Wang, J. A novel method to integrate IMU and magnetometers in attitude and heading reference systems. J. Navig. 2011, 64, 727–738. [Google Scholar] [CrossRef]
- Saxena, A.; Gupta, G.; Gerasimov, V.; Ourselin, S. Knowledge-Based Intelligent Information and Engineering Systems; Springer-Verlag: Berlin/Heidelberg, Germany, 2005; pp. 595–601. [Google Scholar]
- Zhuang, Y.; Lan, H.; Li, Y.; El-Sheimy, N. PDR/INS/WiFi integration based on handheld devices for indoor pedestrian navigation. Micromachines 2015, 6, 793–812. [Google Scholar] [CrossRef]
- Renaudin, V.; Susi, M.; Lachapelle, G. Step length estimation using handheld inertial sensors. Sensors 2012, 12, 8507–8525. [Google Scholar] [CrossRef] [PubMed]
- Zhao, X.; Syed, Z.; Wright, D.B.; El-Sheimy, N. An economical and effective multi-sensor integration for portable navigation system. In Proceedings of the 22nd International Technical Meeting of the Satellite Division of the Institute of Navigation (ION GNSS 2009), Savannah, GA, USA, 22–25 September 2009.
- Welch, G.; Bishop, G. An Introduction to the Kalman Filter; University of North Carolina: Chapel Hill, CA, USA, 1995. [Google Scholar]
- Li, B.; Salter, J.; Dempster, A.G.; Rizos, C. Indoor positioning techniques based on wireless LAN. In Proceedings of the First IEEE International Conference on Wireless Broadband and Ultra Wideband Communications, Sydney, Australia, 27–30 August 2006.
- Lassabe, F.; Canalda, P.; Chatonnay, P.; Spies, F. Indoor Wi-Fi positioning: techniques and systems. Ann. Telecommun. 2009, 64, 651–664. [Google Scholar] [CrossRef]
- Li, Y.; Georgy, J.; Niu, X.; Li, Q.; El-Sheimy, N. Autonomous calibration of MEMS gyros in consumer portable devices. IEEE Sens. J. 2015, 15, 4062–4072. [Google Scholar] [CrossRef]
© 2015 by the authors; licensee MDPI, Basel, Switzerland. This article is an open access article distributed under the terms and conditions of the Creative Commons Attribution license (http://creativecommons.org/licenses/by/4.0/).
Share and Cite
Zhang, P.; Zhao, Q.; Li, Y.; Niu, X.; Zhuang, Y.; Liu, J. Collaborative WiFi Fingerprinting Using Sensor-Based Navigation on Smartphones. Sensors 2015, 15, 17534-17557. https://0-doi-org.brum.beds.ac.uk/10.3390/s150717534
Zhang P, Zhao Q, Li Y, Niu X, Zhuang Y, Liu J. Collaborative WiFi Fingerprinting Using Sensor-Based Navigation on Smartphones. Sensors. 2015; 15(7):17534-17557. https://0-doi-org.brum.beds.ac.uk/10.3390/s150717534
Chicago/Turabian StyleZhang, Peng, Qile Zhao, You Li, Xiaoji Niu, Yuan Zhuang, and Jingnan Liu. 2015. "Collaborative WiFi Fingerprinting Using Sensor-Based Navigation on Smartphones" Sensors 15, no. 7: 17534-17557. https://0-doi-org.brum.beds.ac.uk/10.3390/s150717534