The Comparison of Different Types of Heat Accumulators and Benefits of Their Use in Horticulture

 , , and
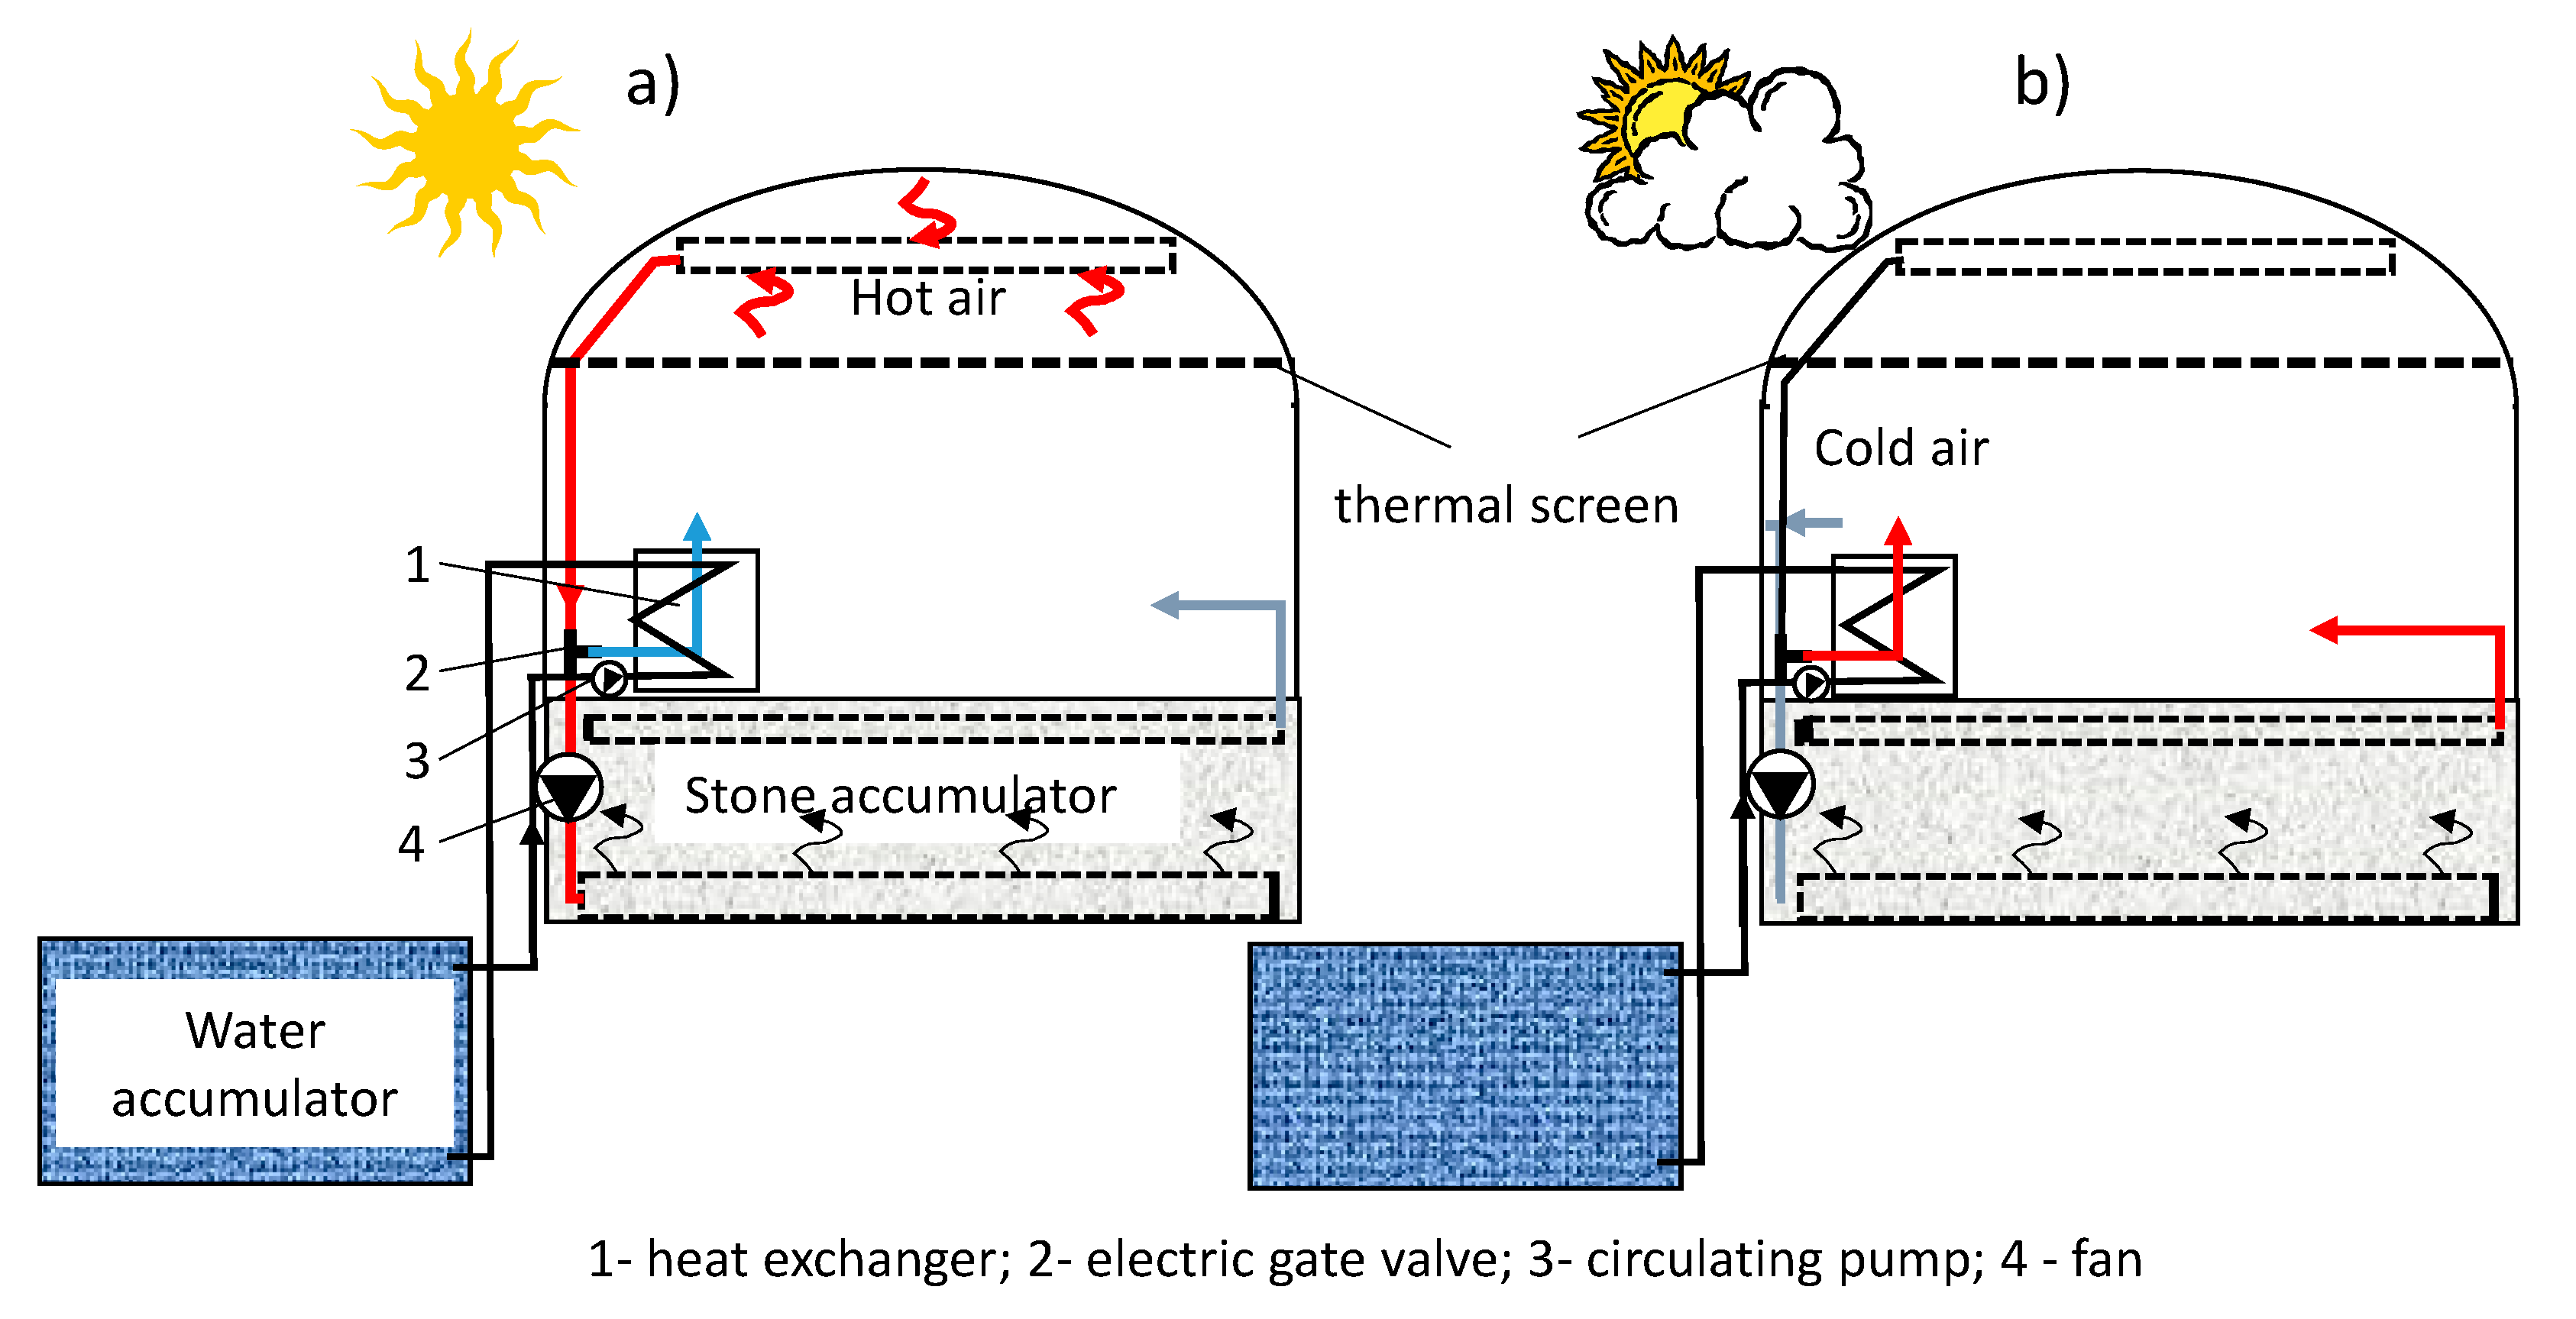
Abstract
:1. Introduction
1.1. Methods of Heat Storage
1.2. Heat Storage in Protected Crop Cultivation
1.3. The Importance of Heat Storage Research
2. Materials and Methods
2.1. The Stone-Bed Accumulator
2.2. The Water Accumulator
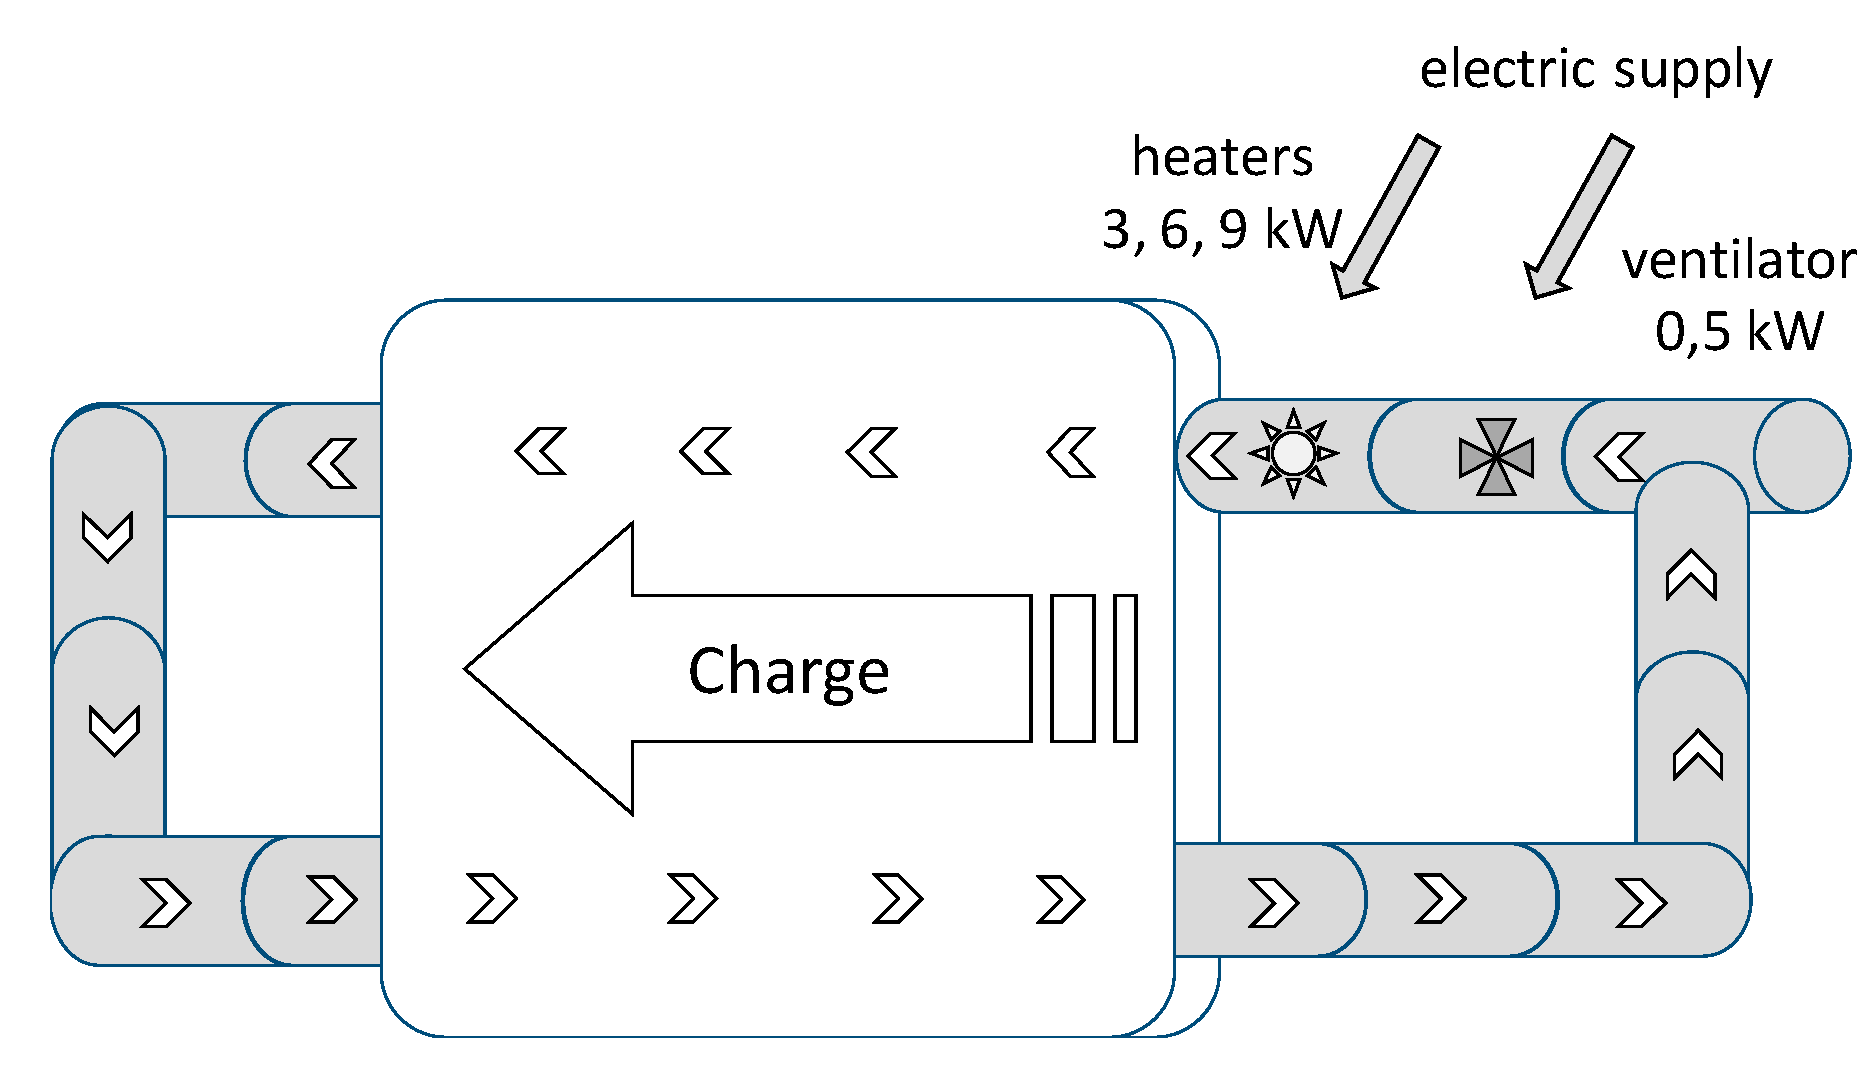
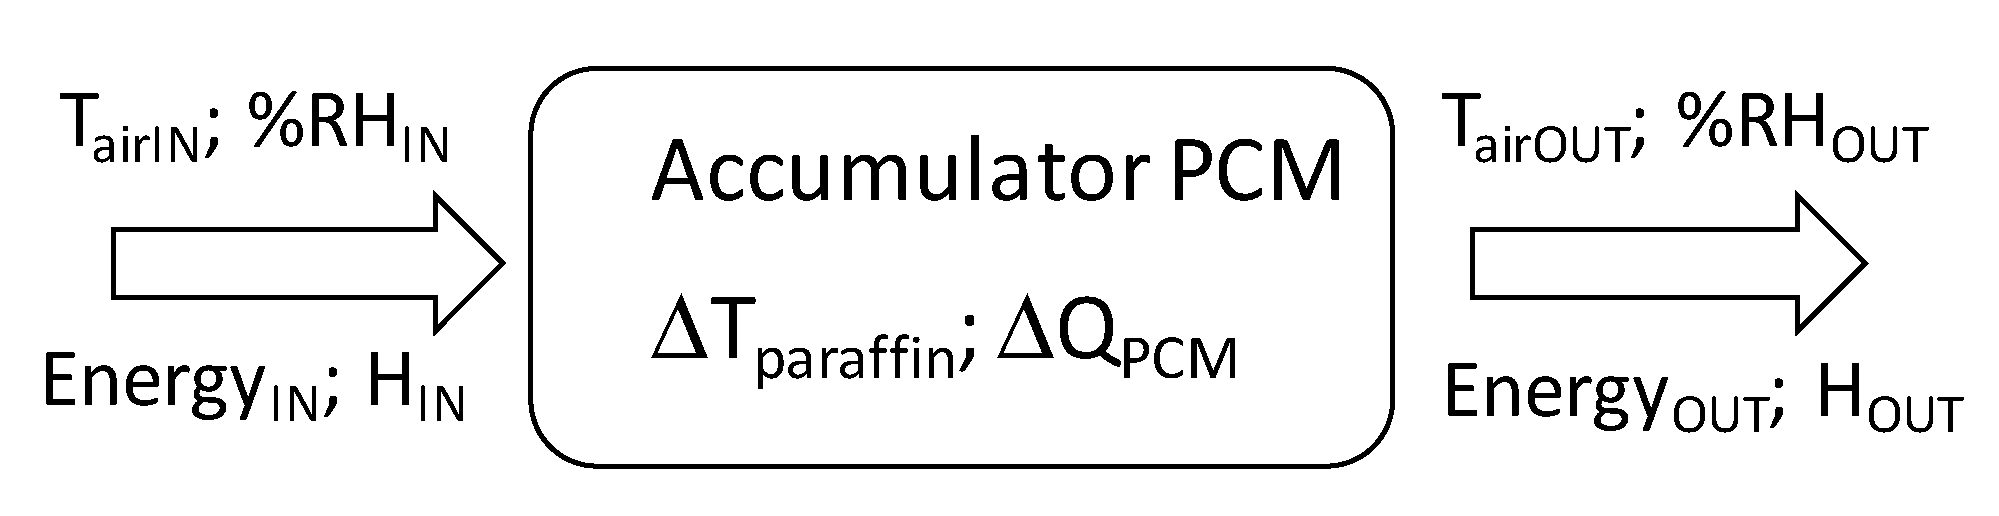
2.3. The Phase Change (PCM) Accumulator
- (1)
- at the input—working time, heating energy for the heaters and the fan, paraffin temperature, temperature and relative humidity of the air entering the battery.
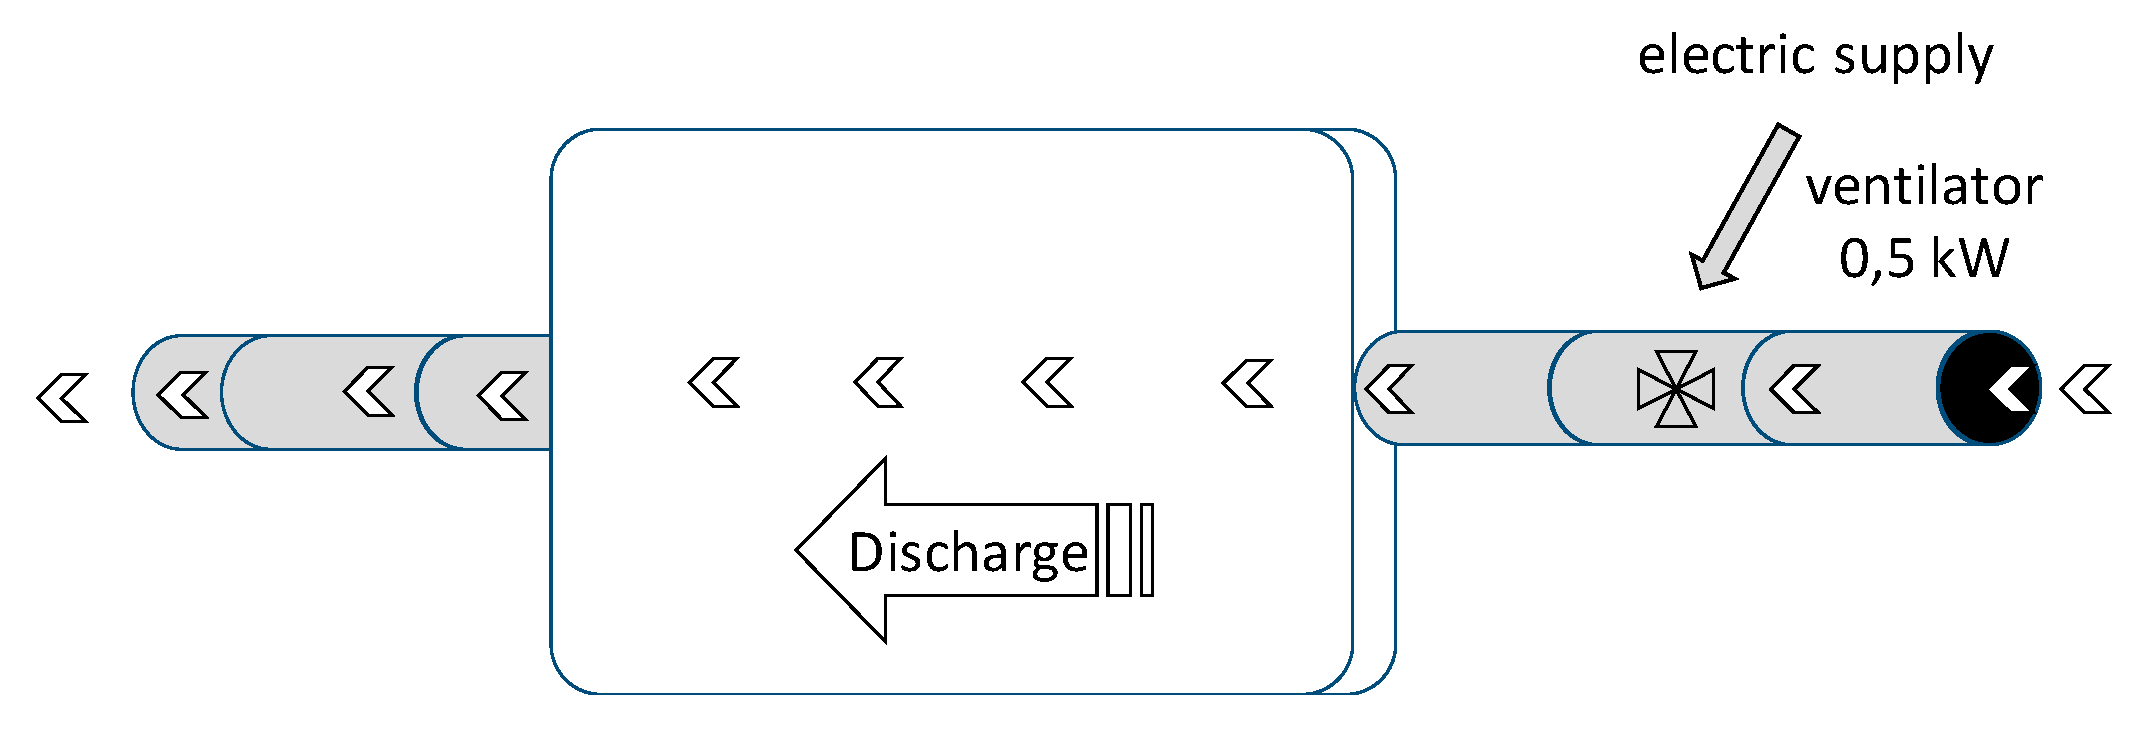
- (2)
- at the output—working time, fan power energy, paraffin temperature, temperature and relative humidity of the air inlet and outlet from the battery.
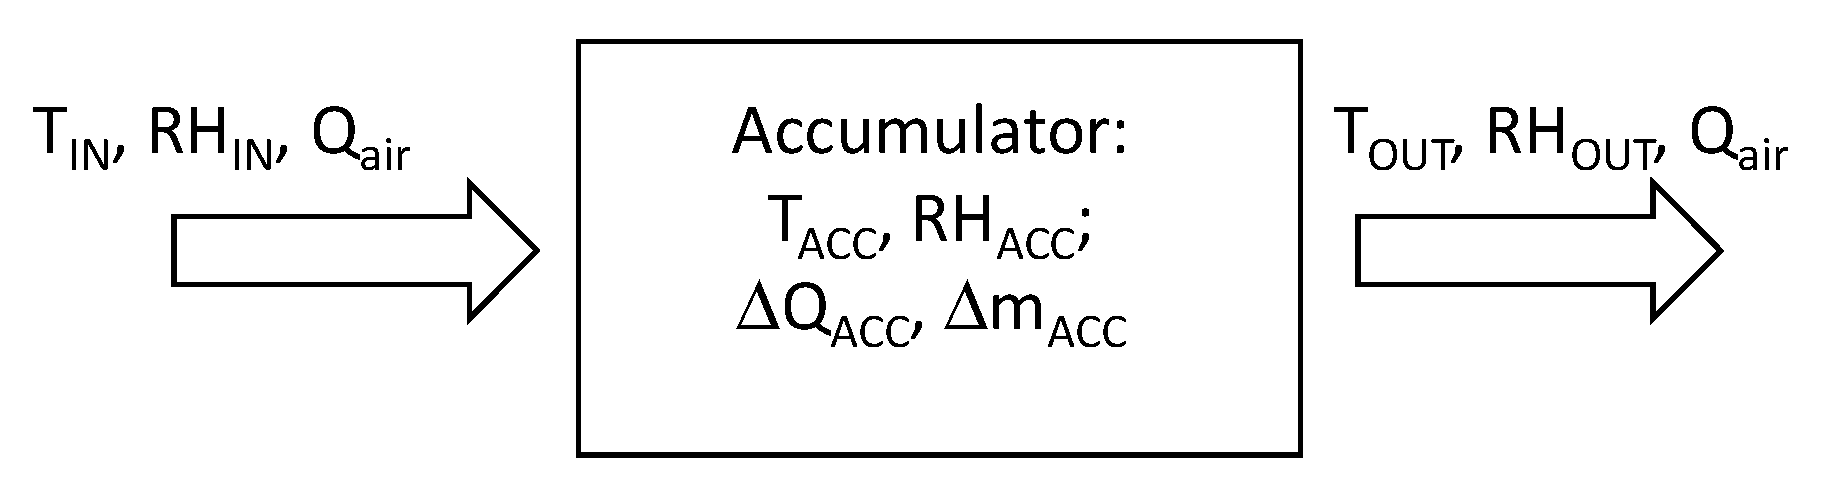
2.4. Methods
2.4.1. Stone-Bed Accumulator
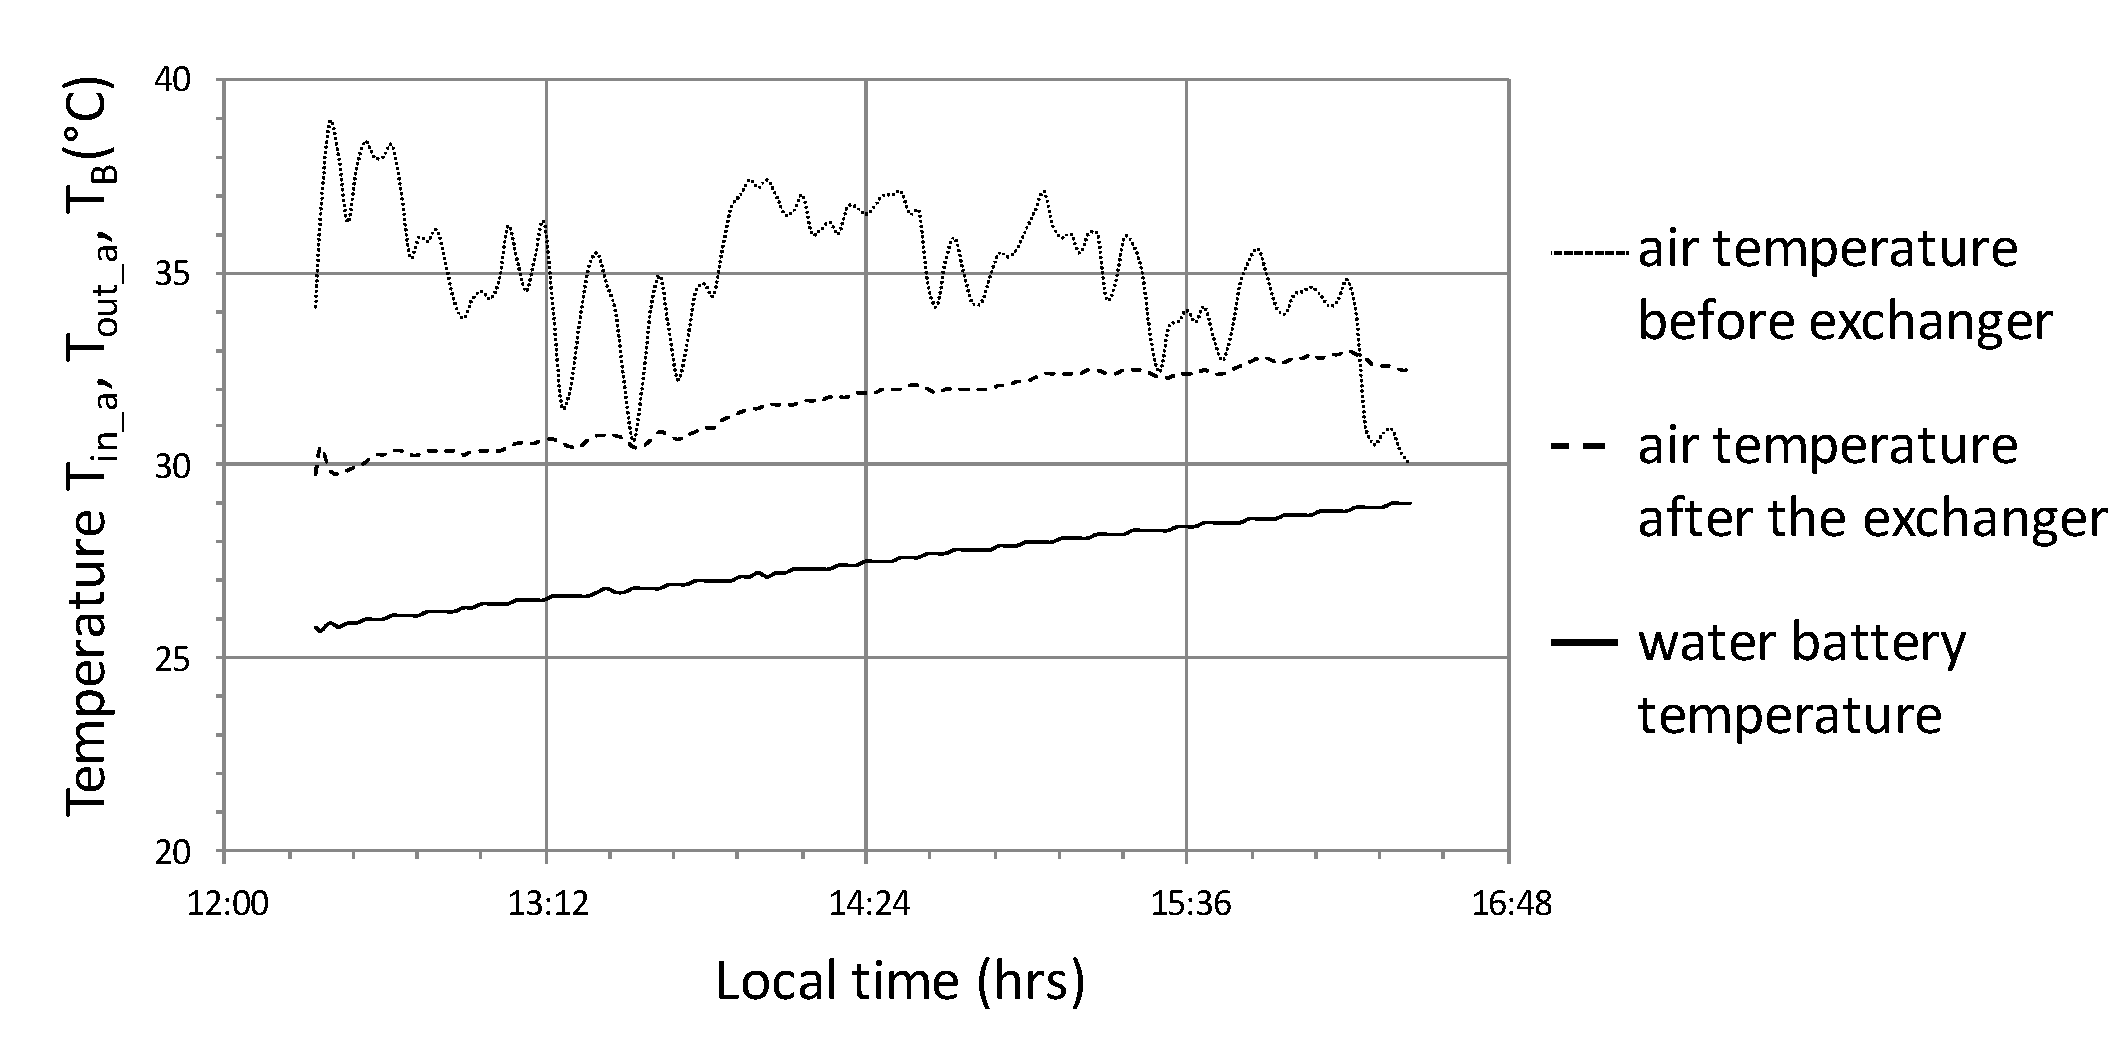
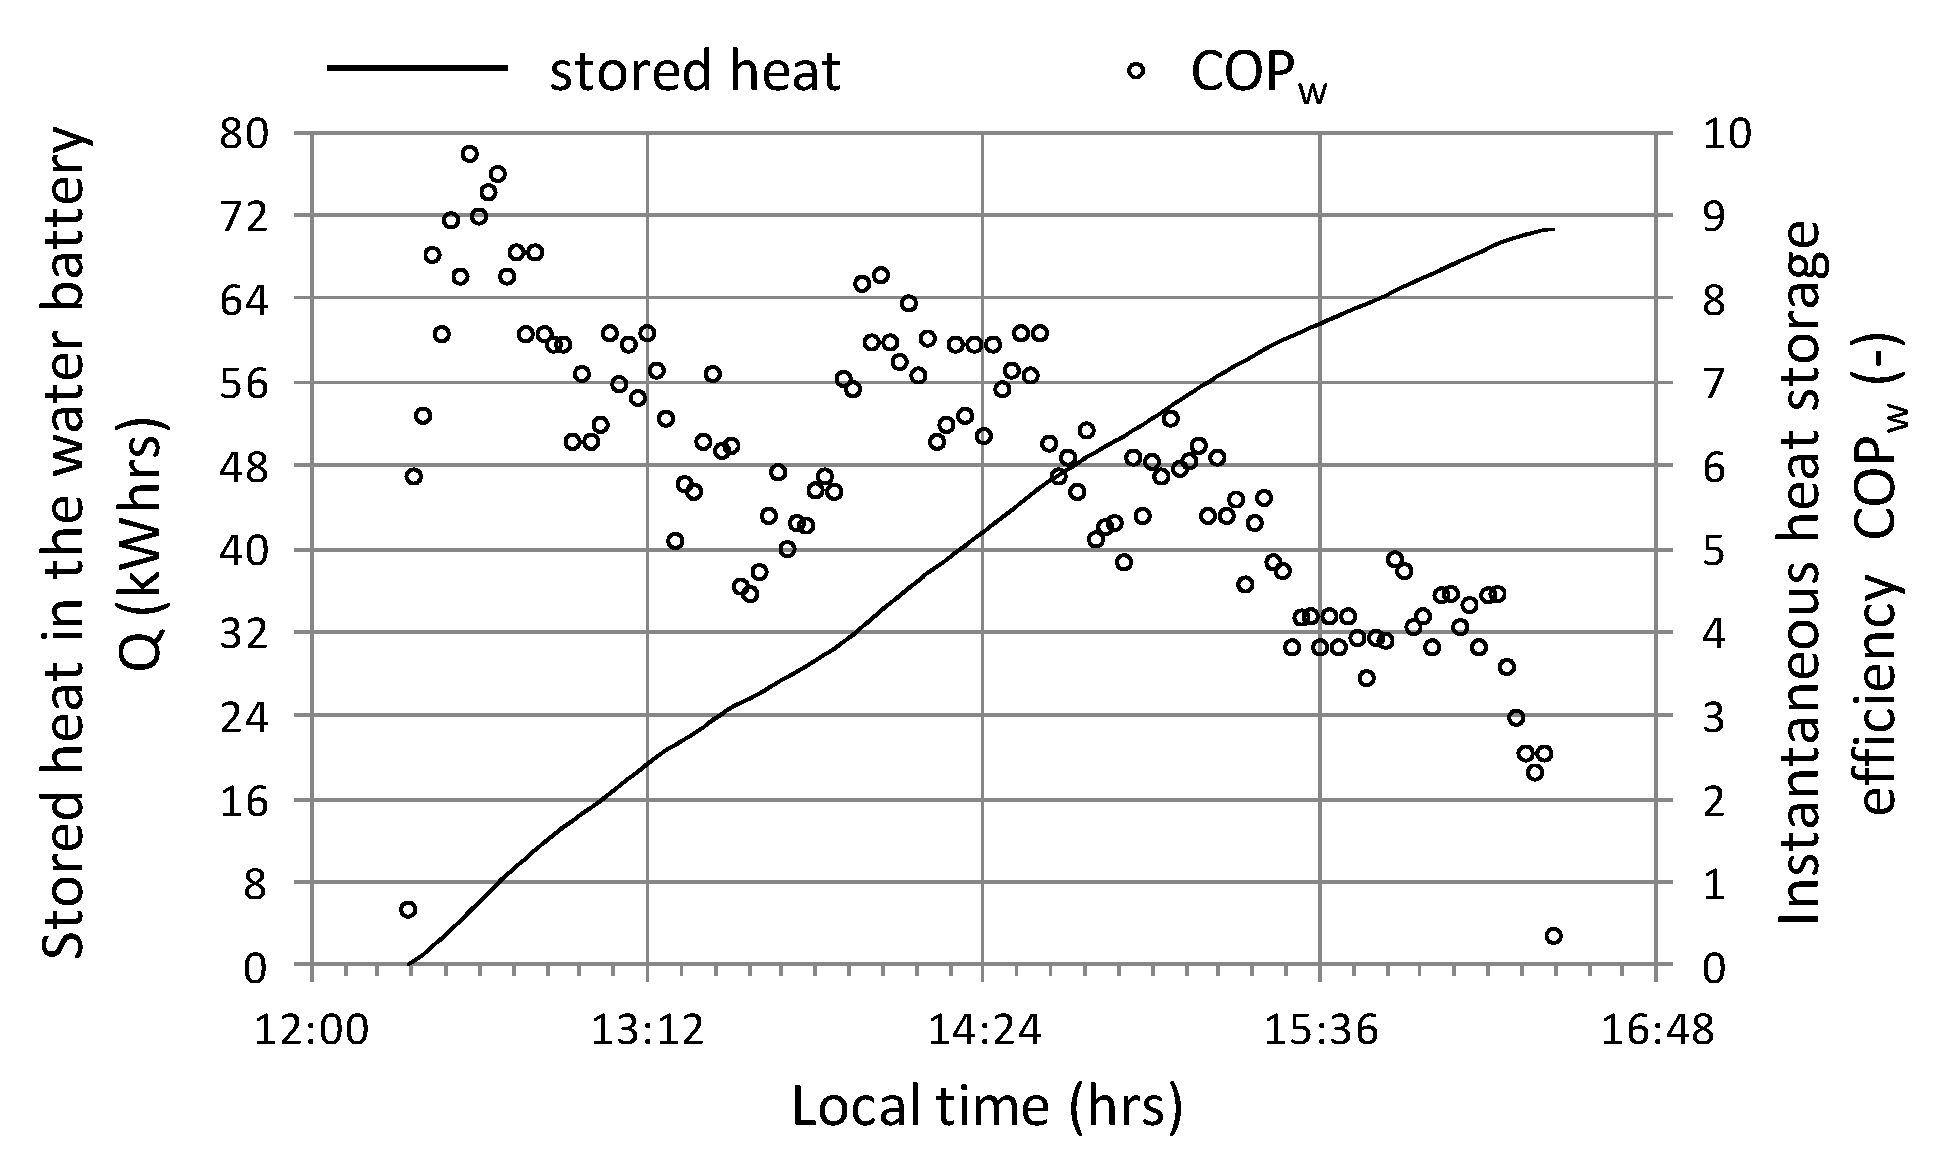
2.4.2. Water Accumulator
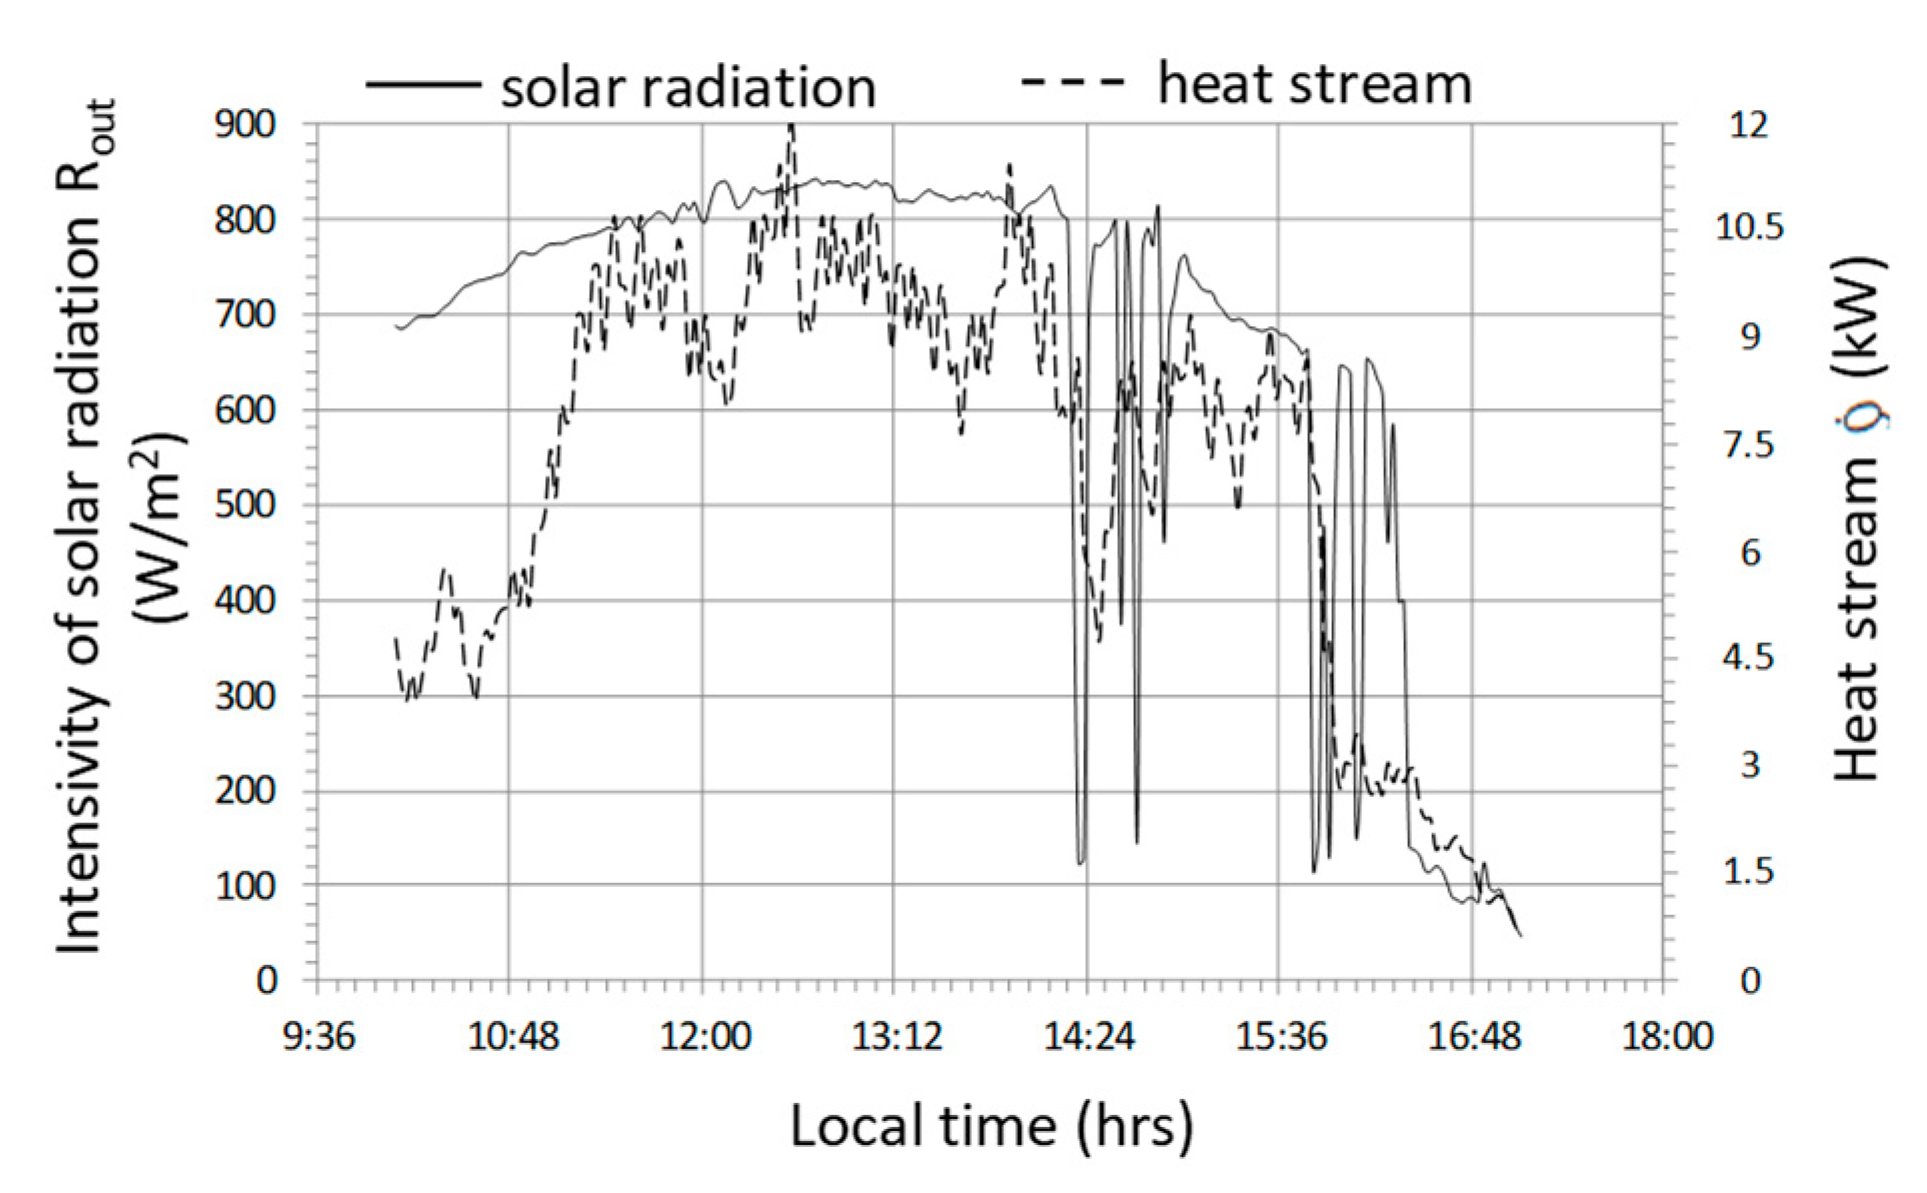
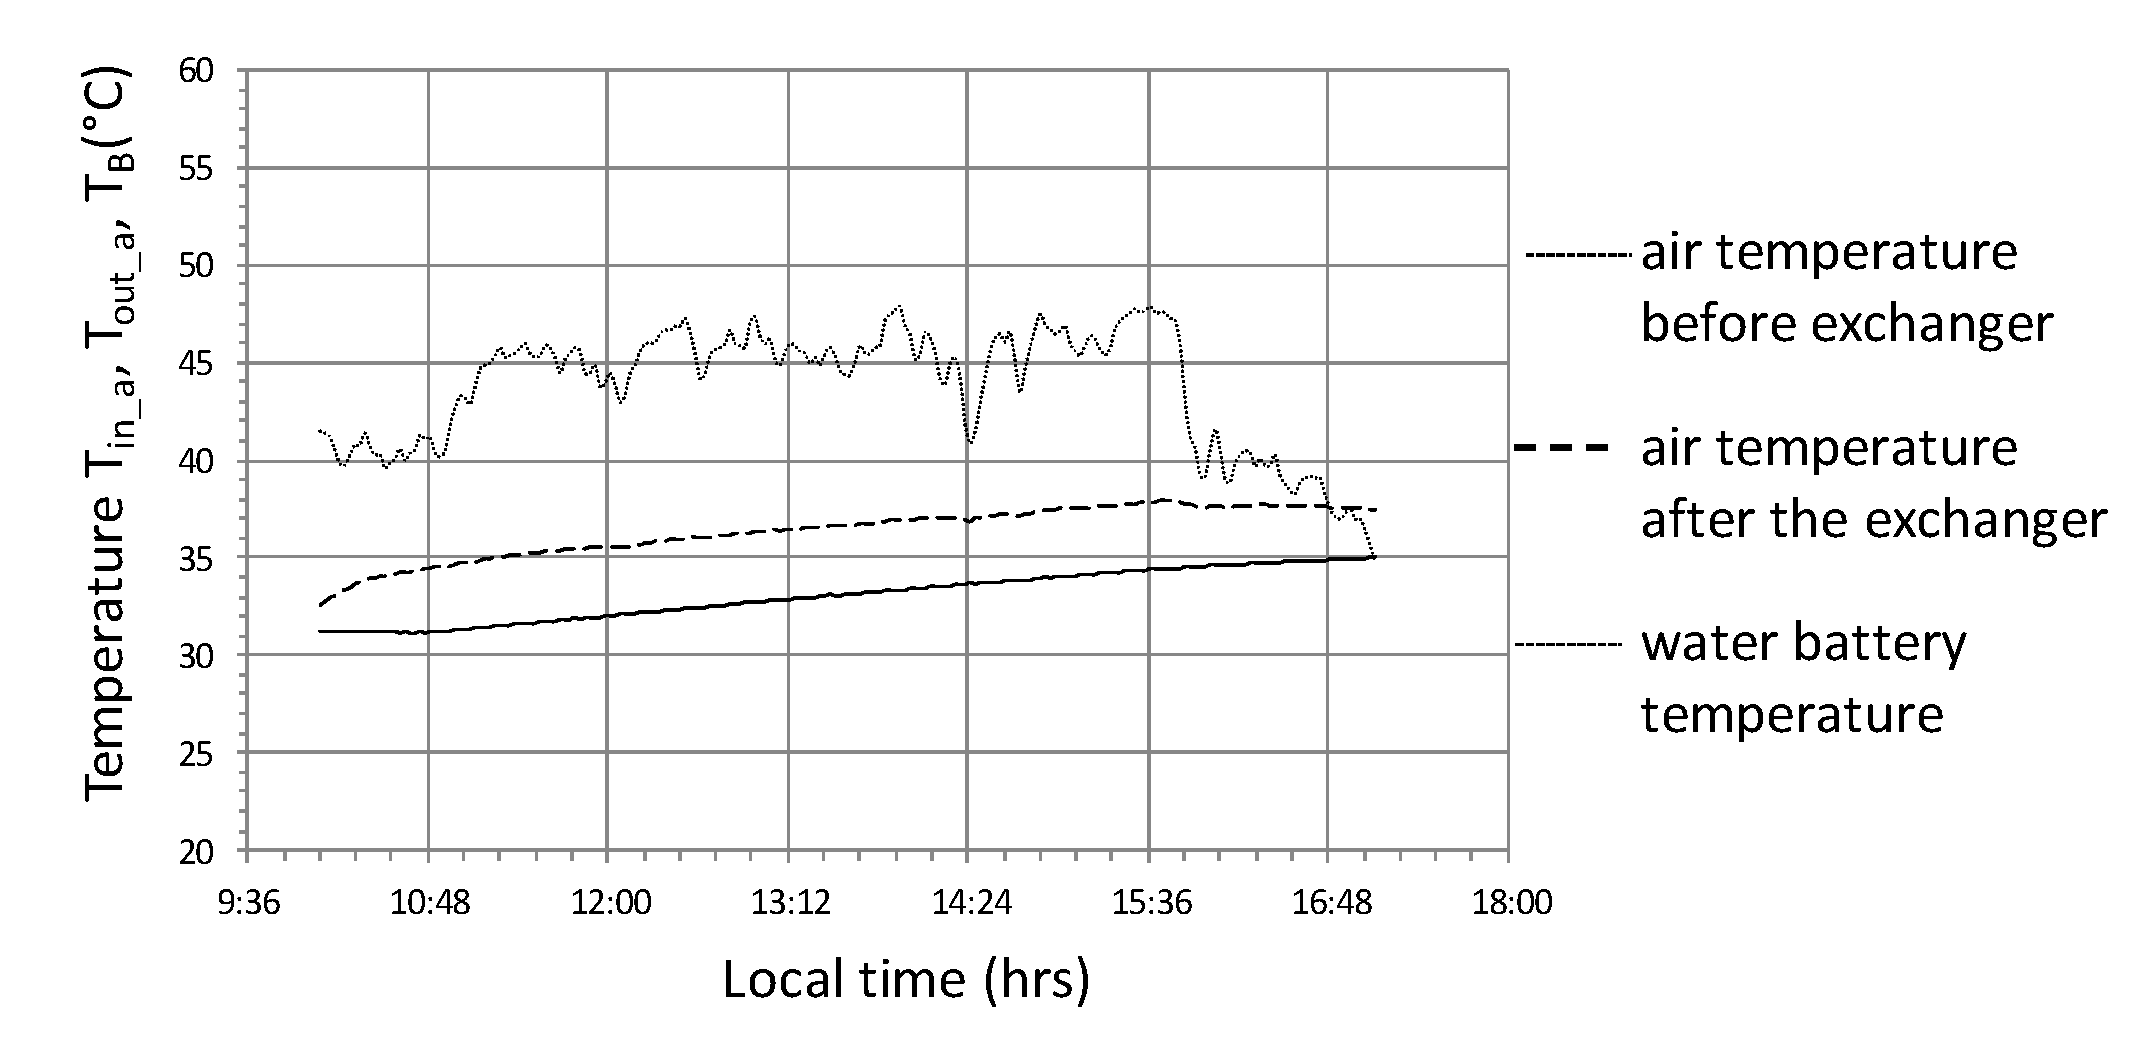
2.4.3. PCM Accumulator
3. Results
3.1. Stone-Bed Accumulator
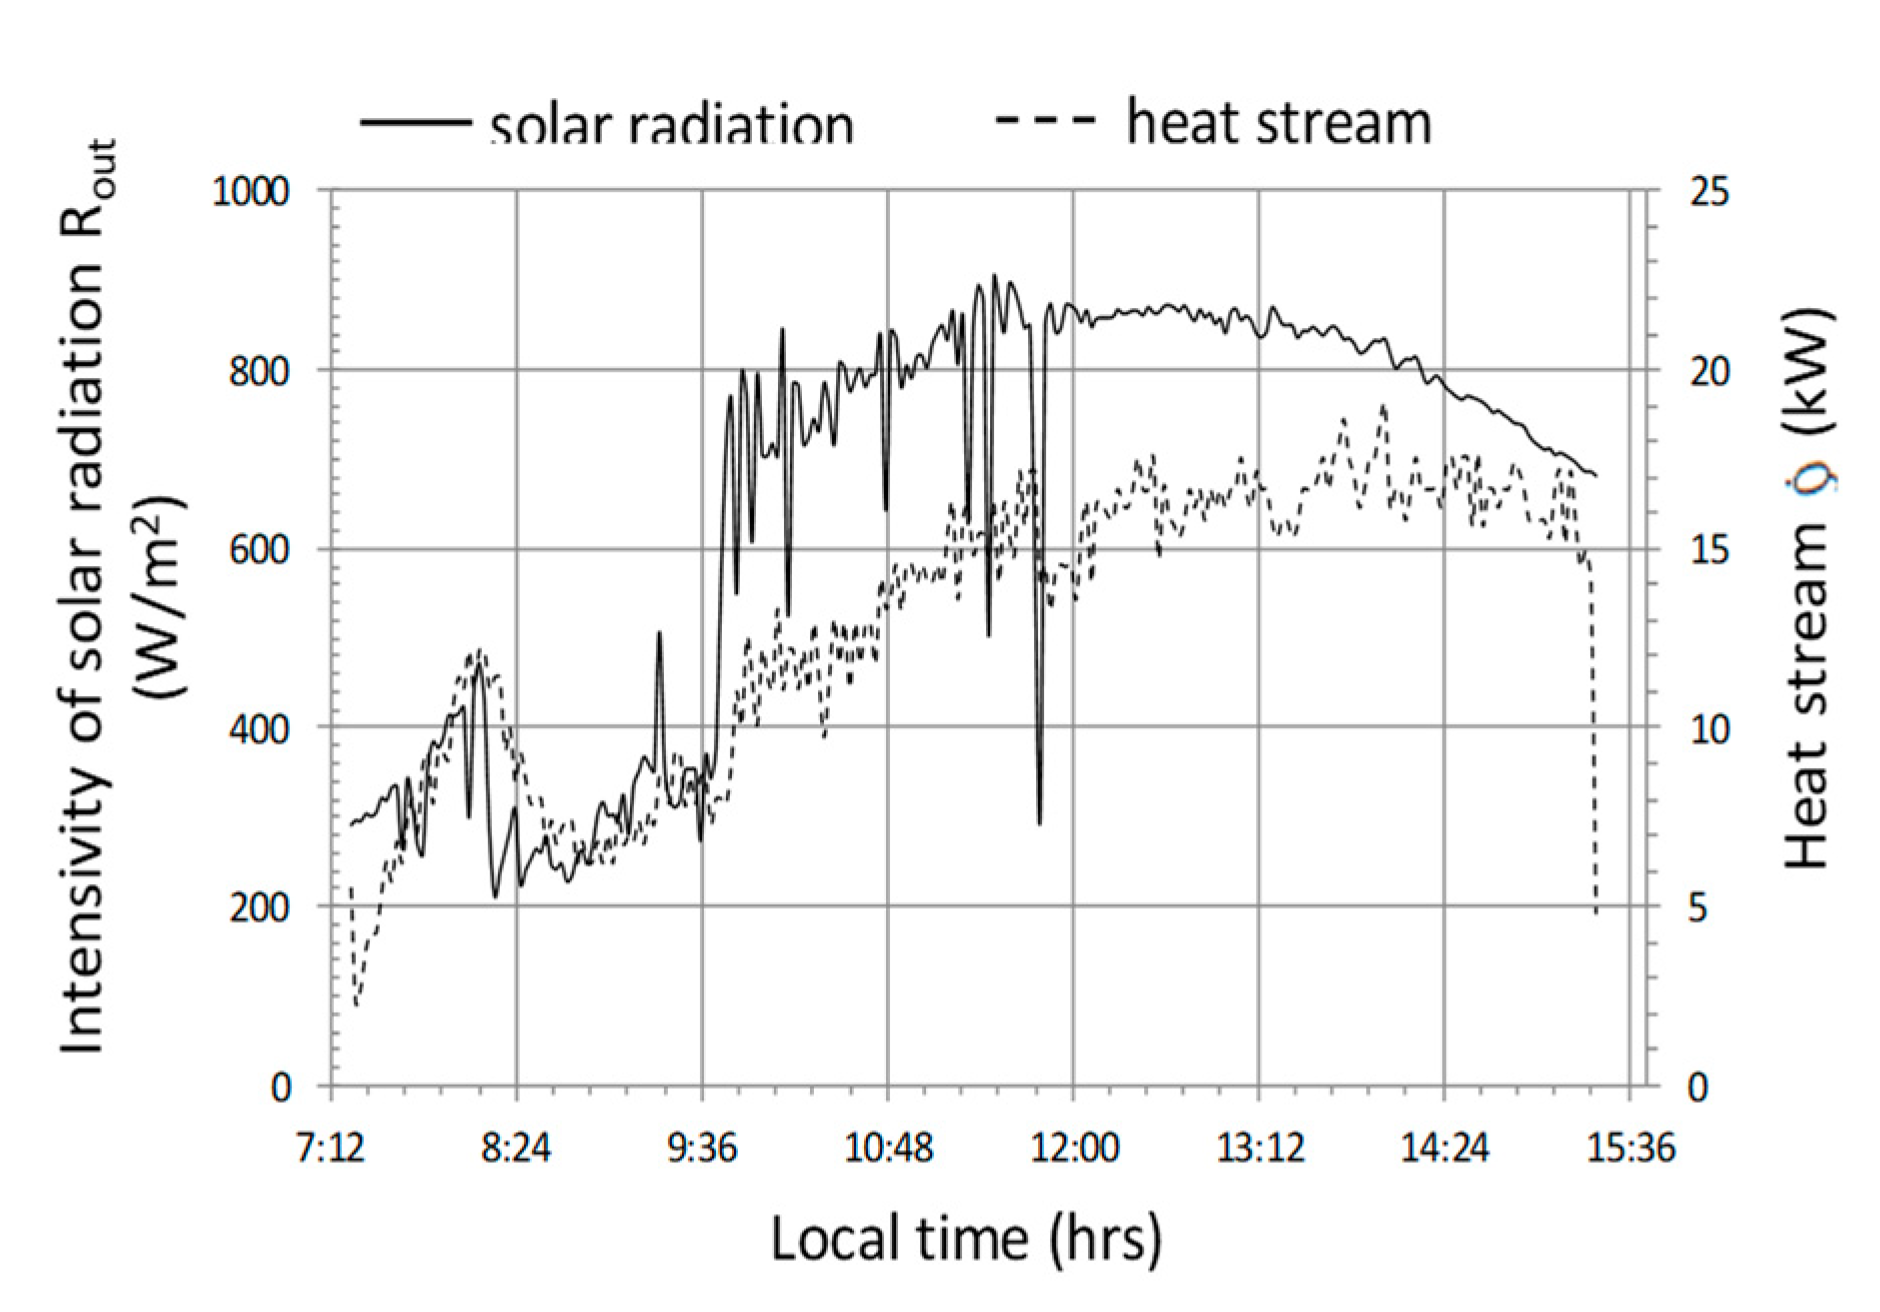
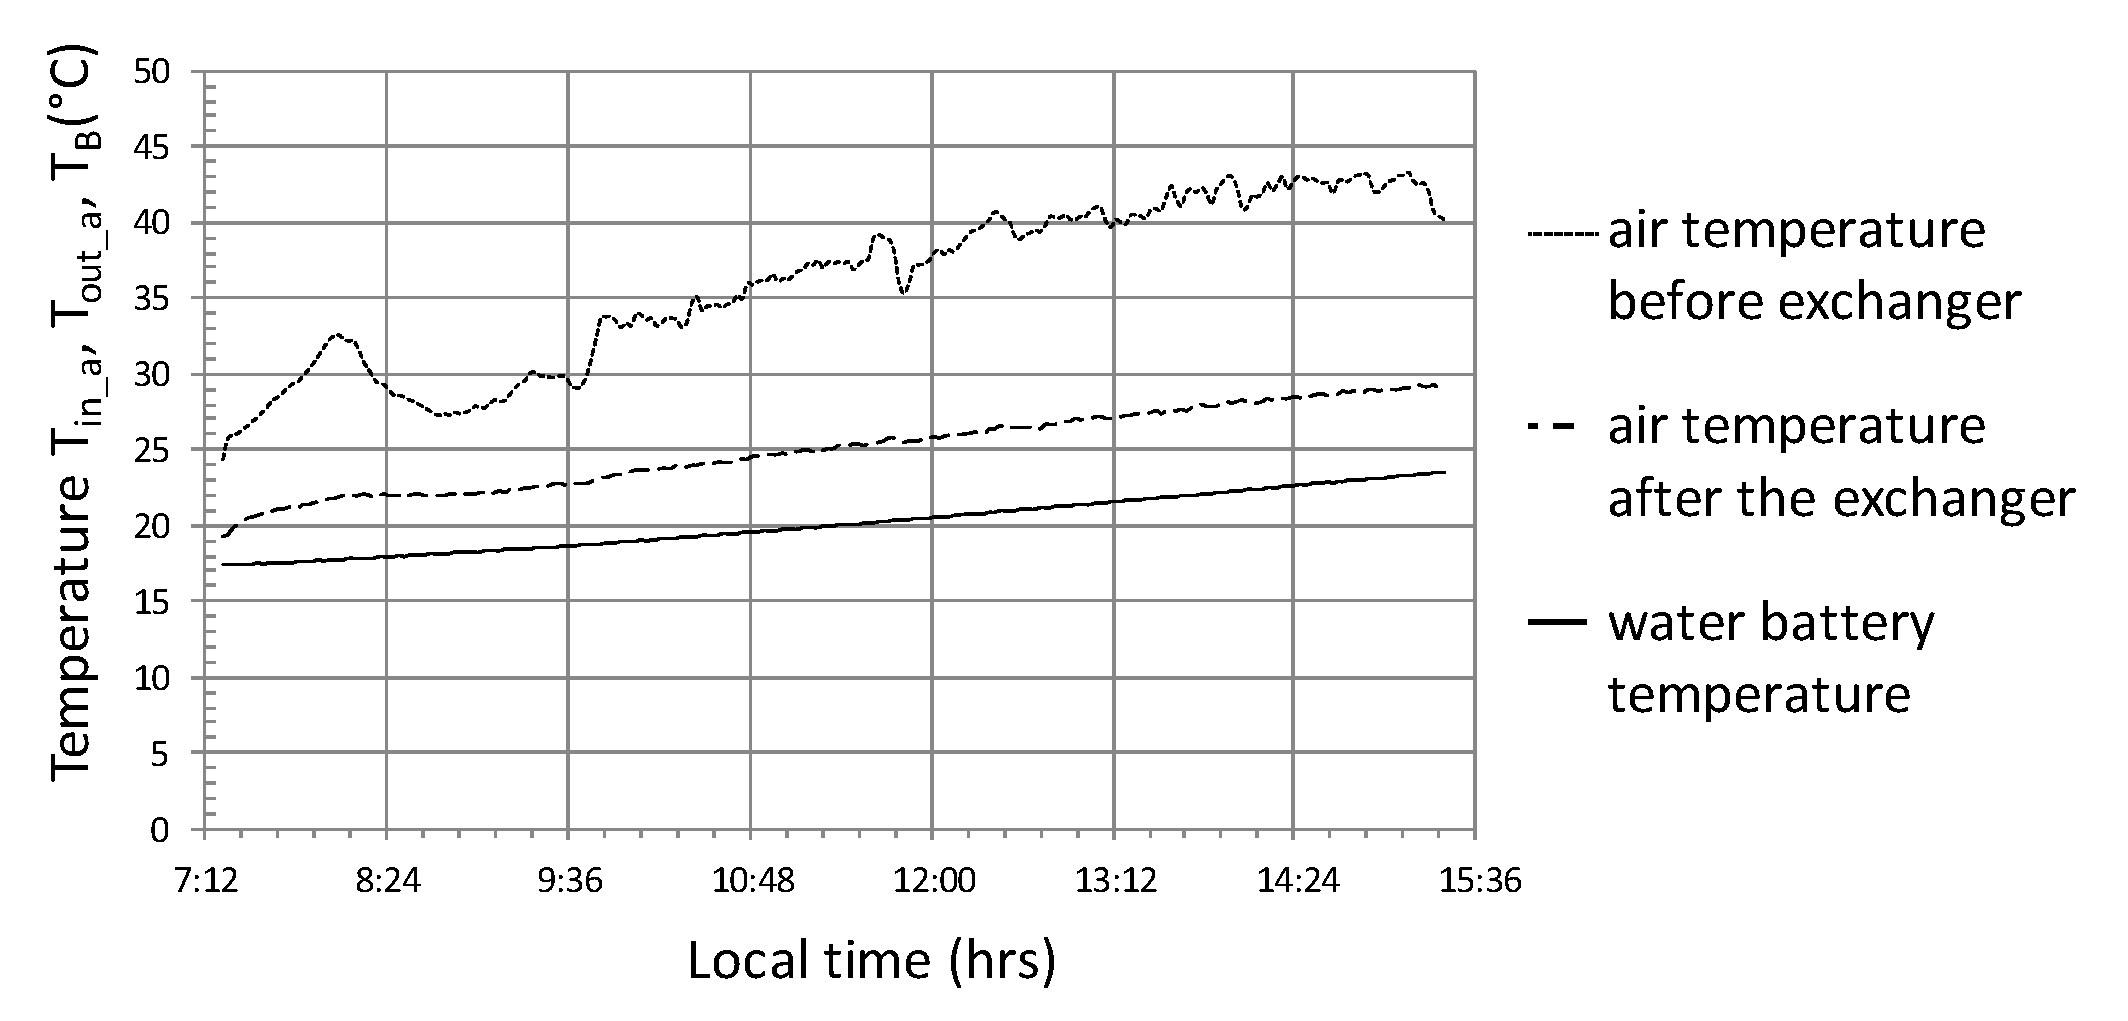
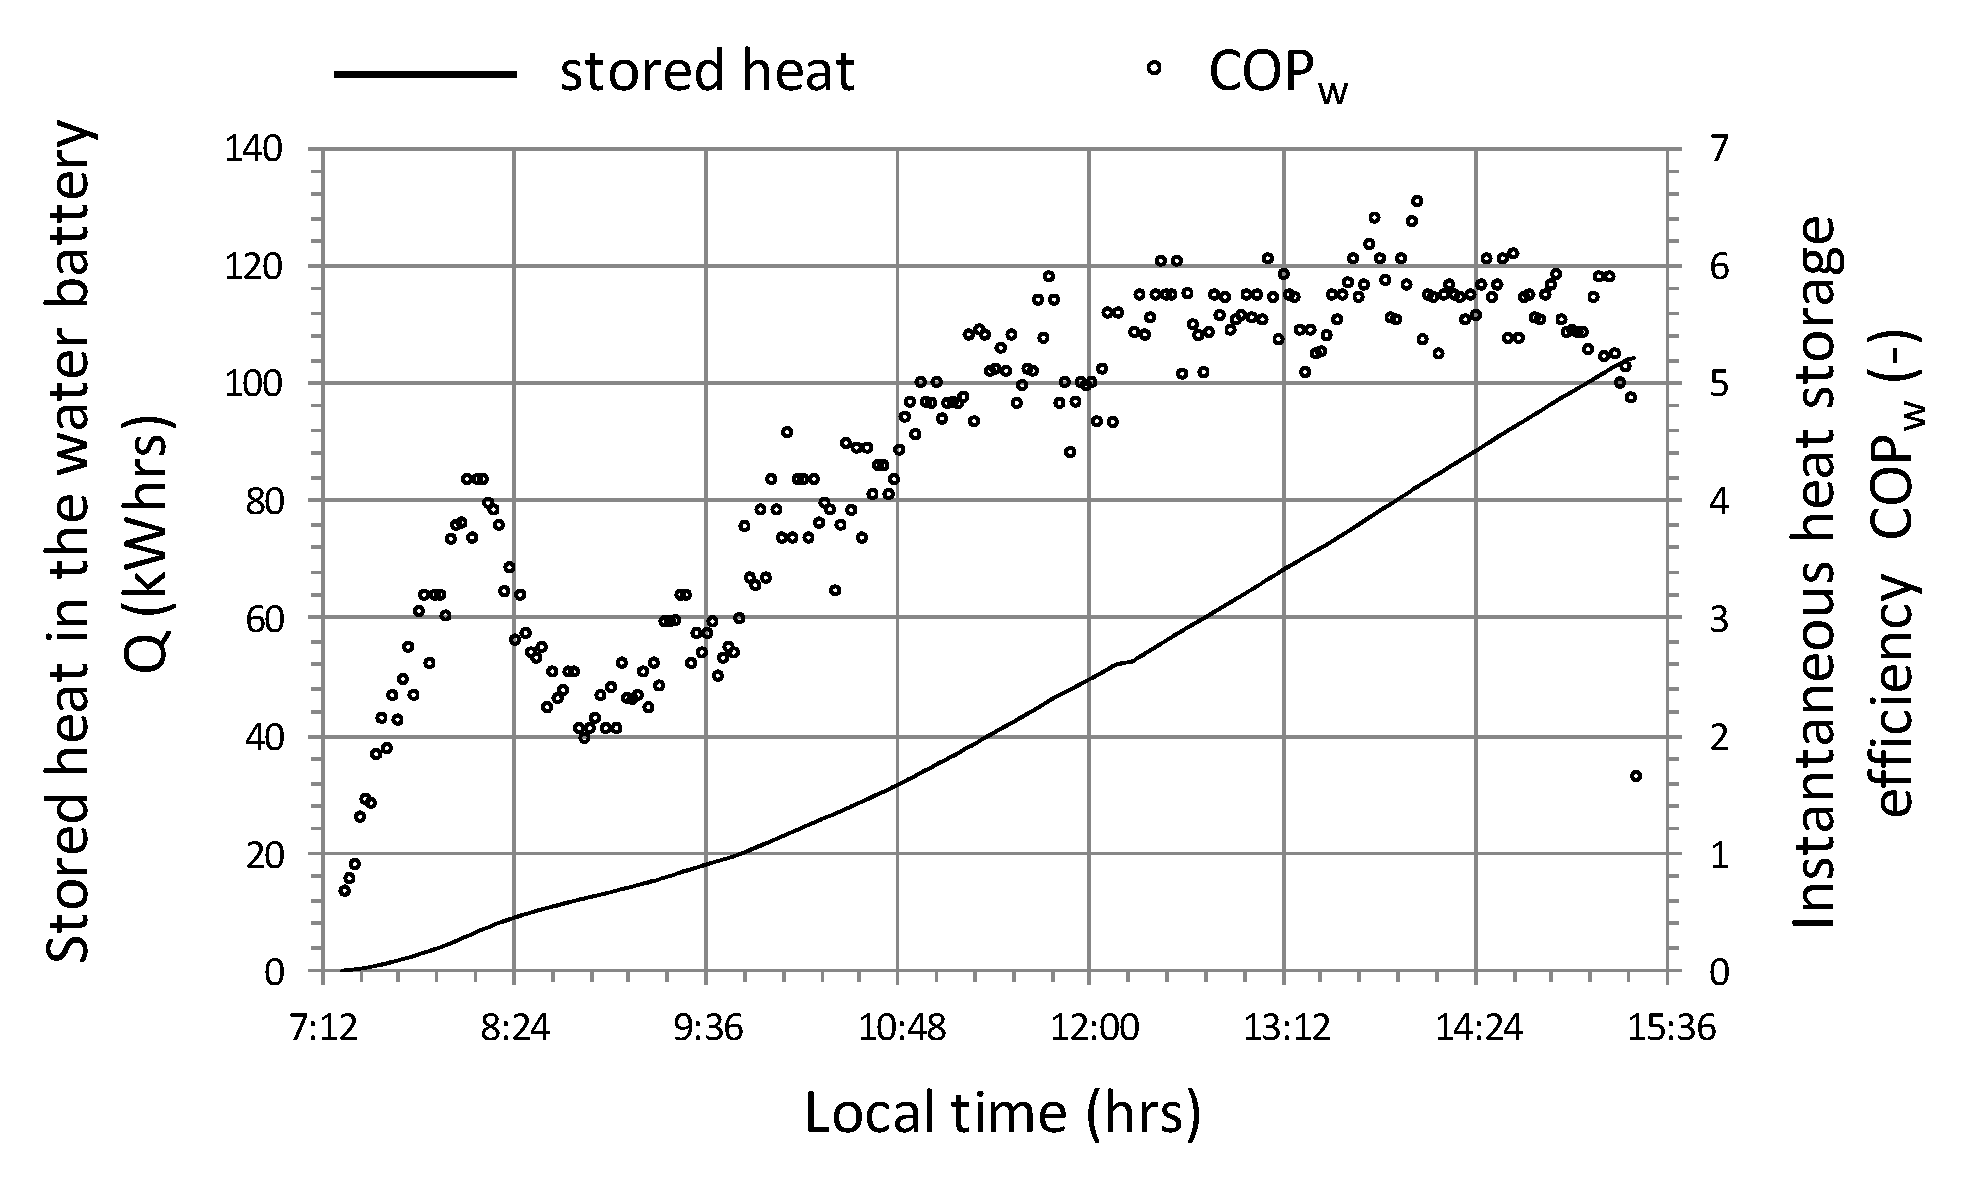
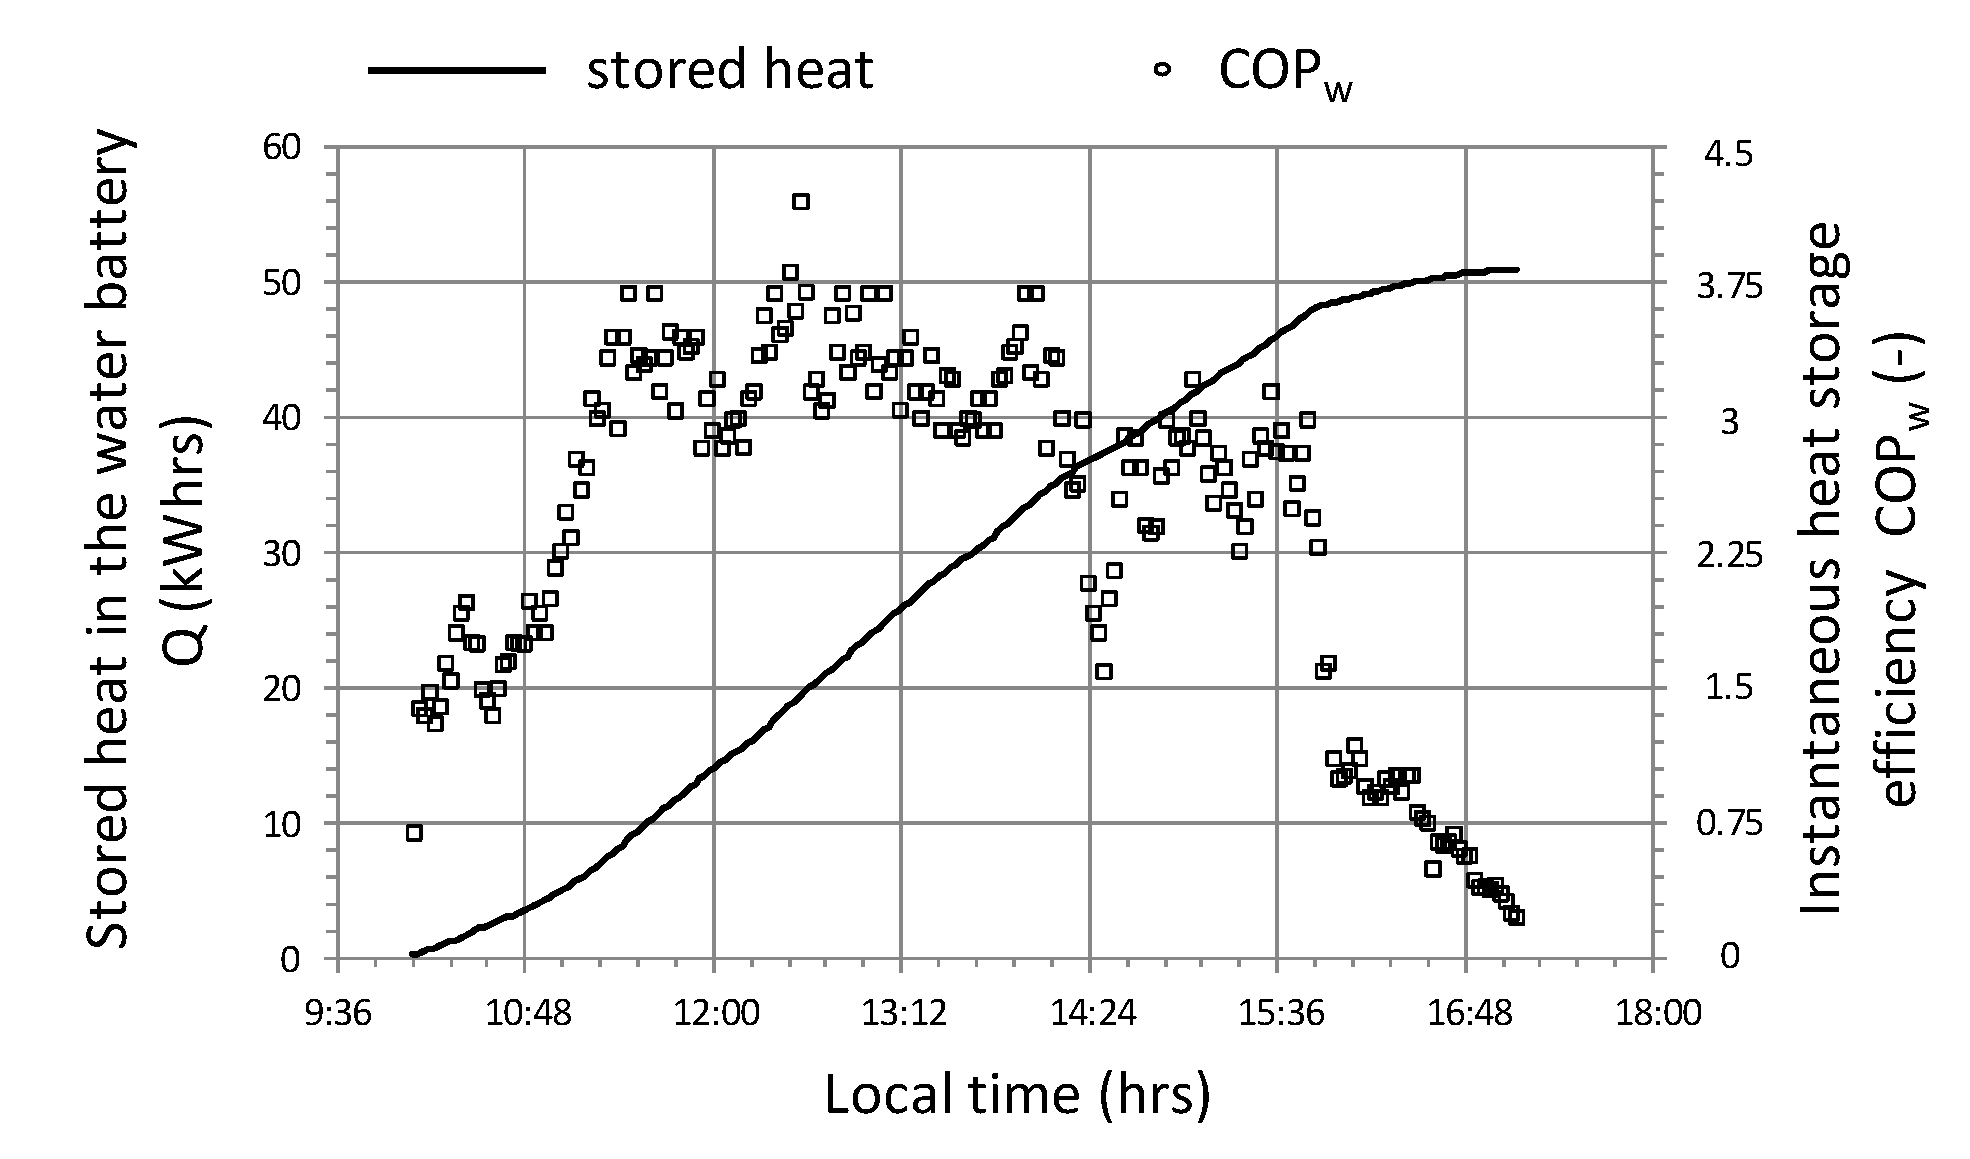
3.2. Water Accumulator
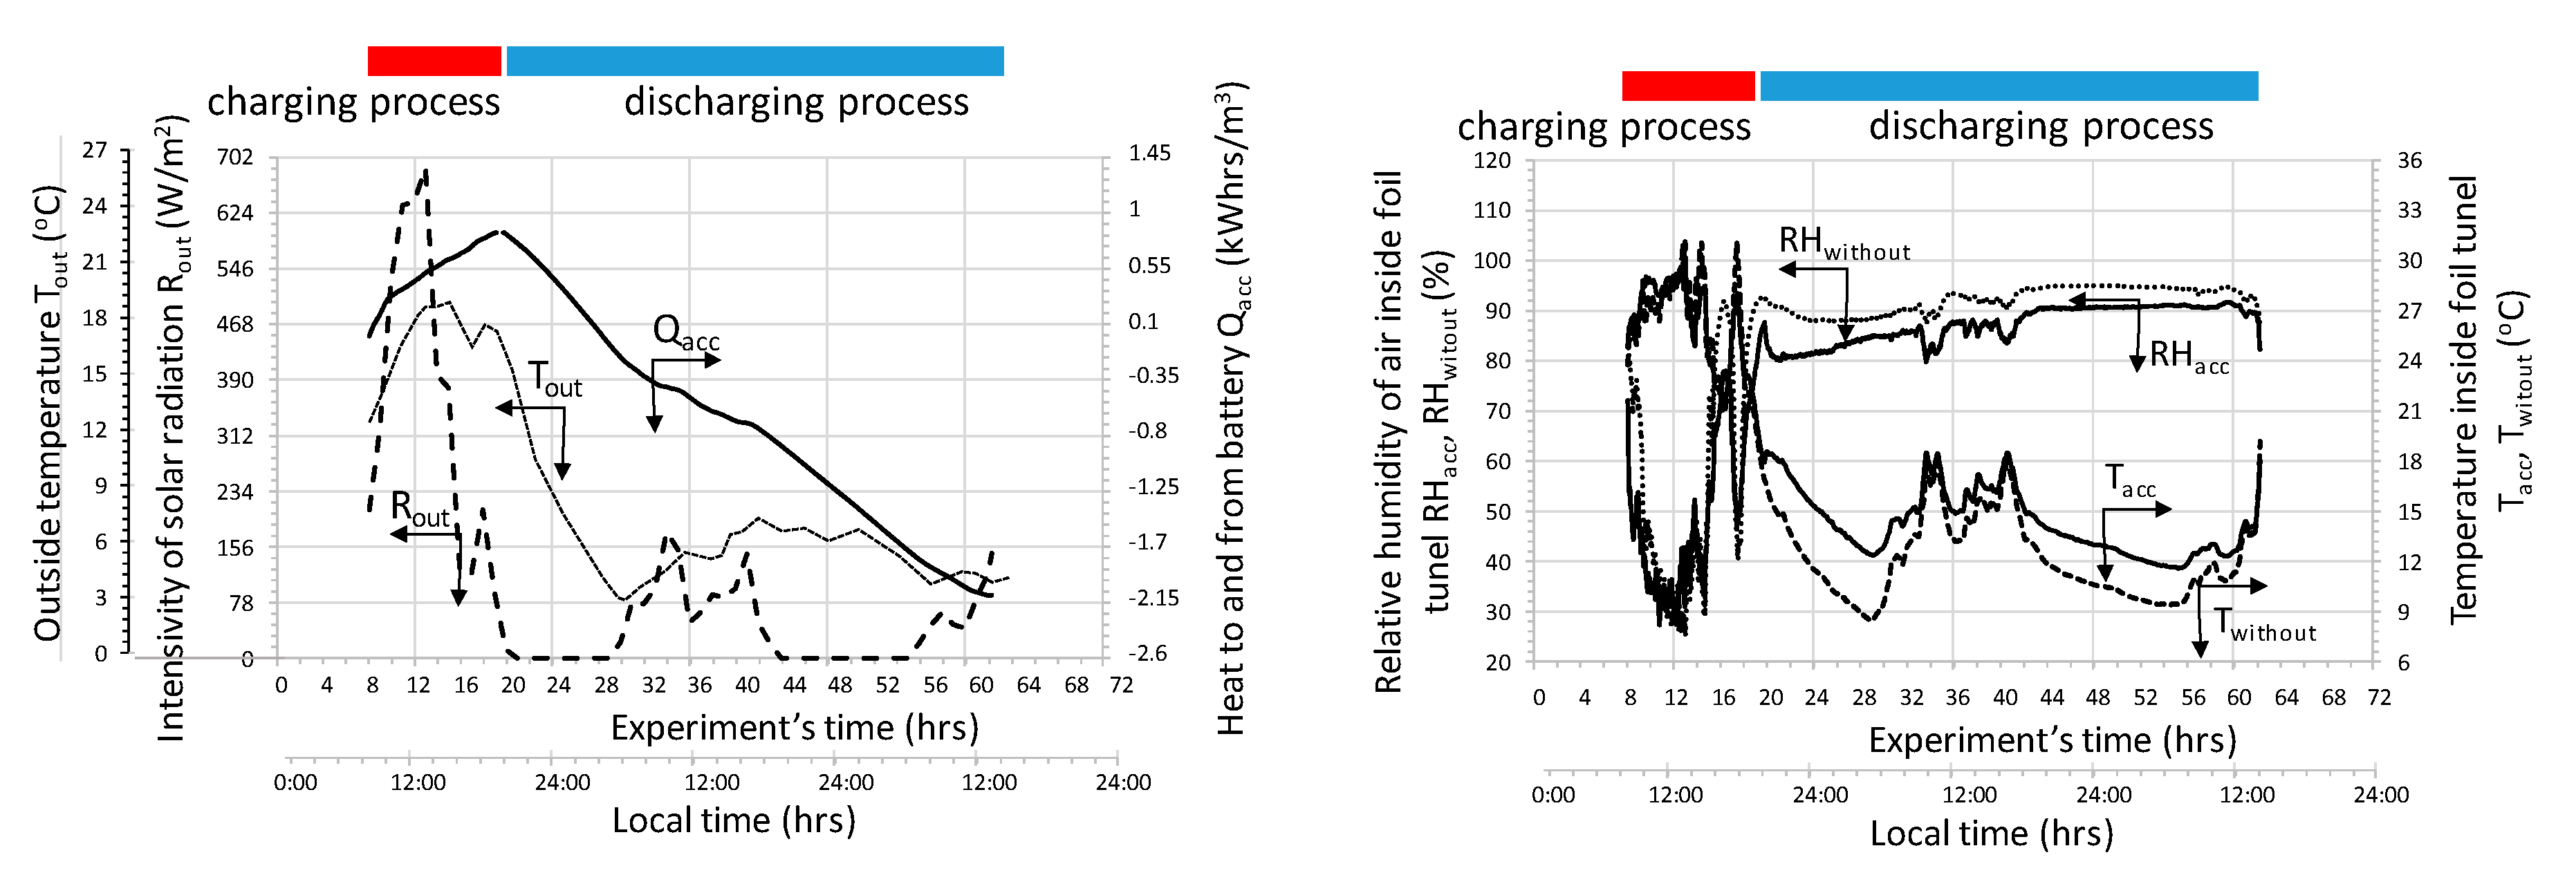
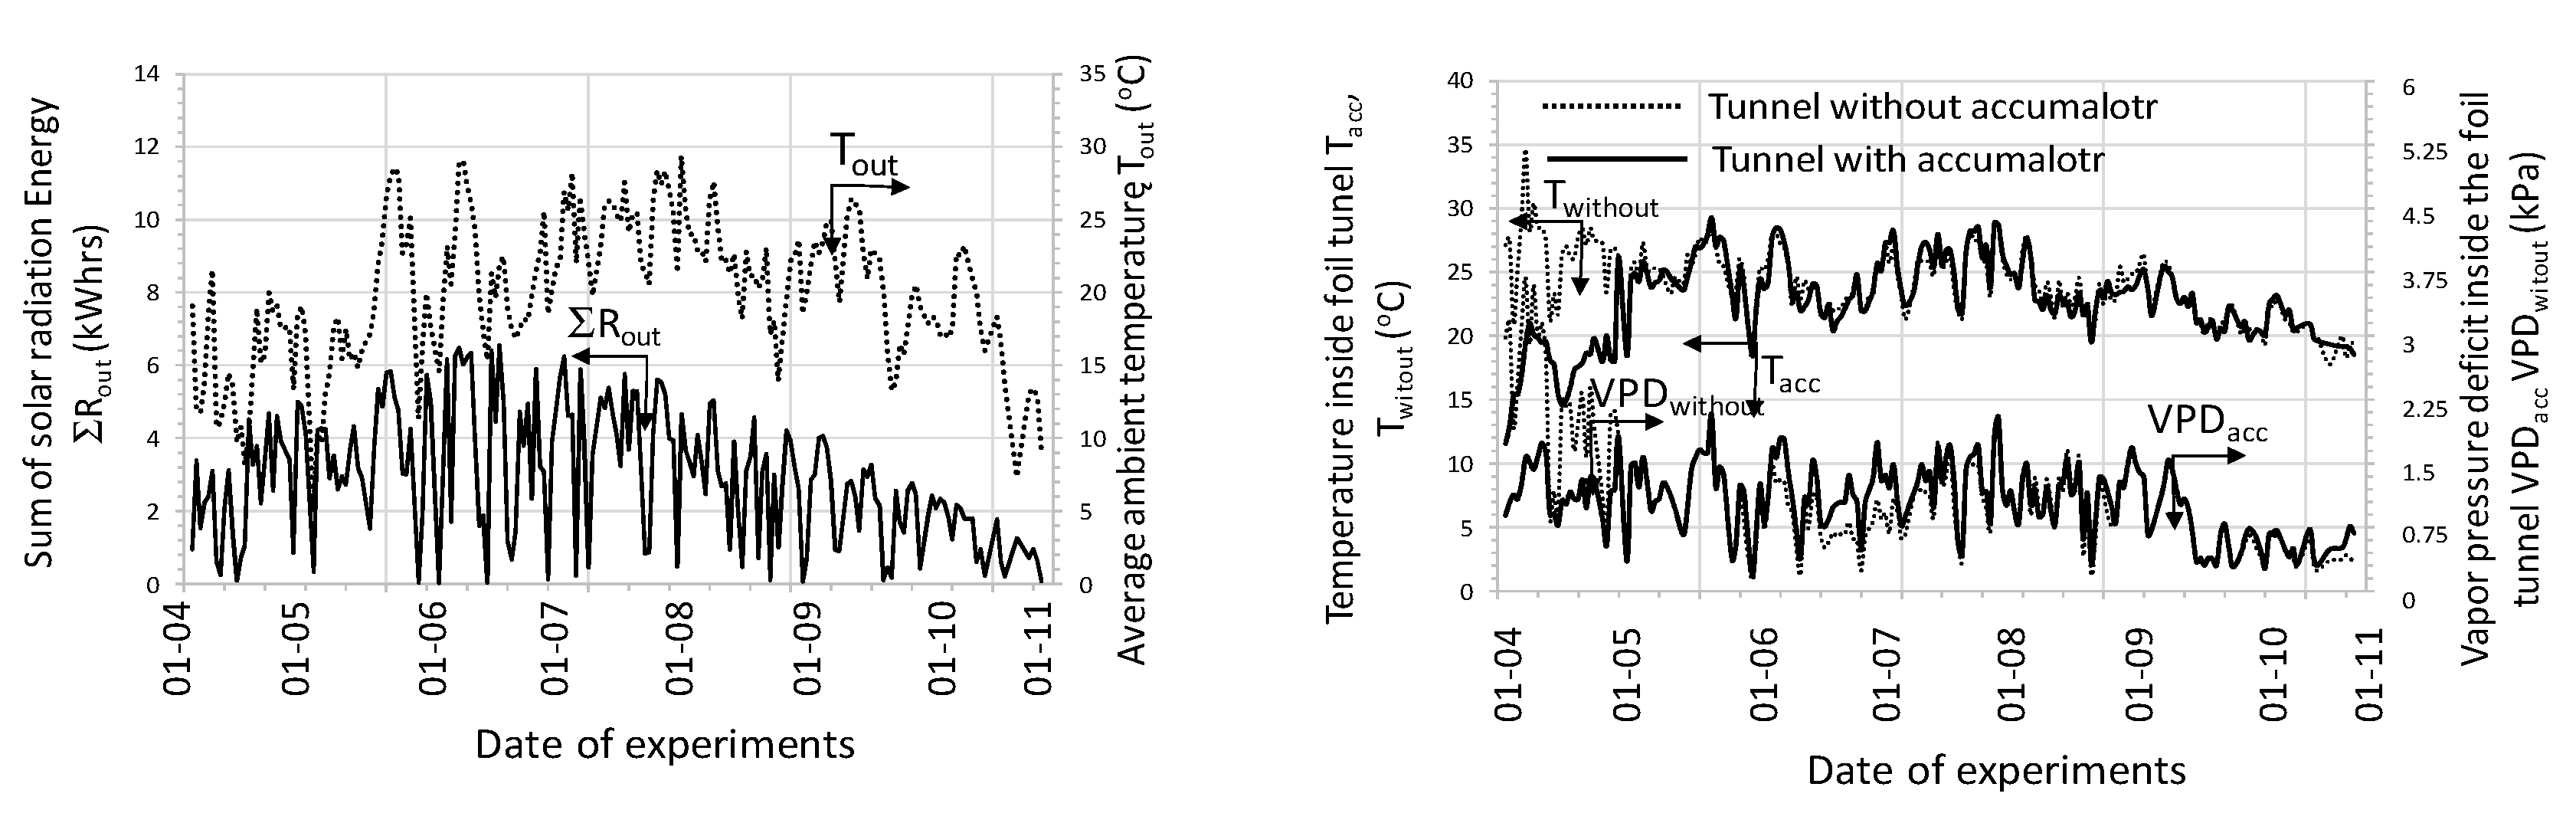
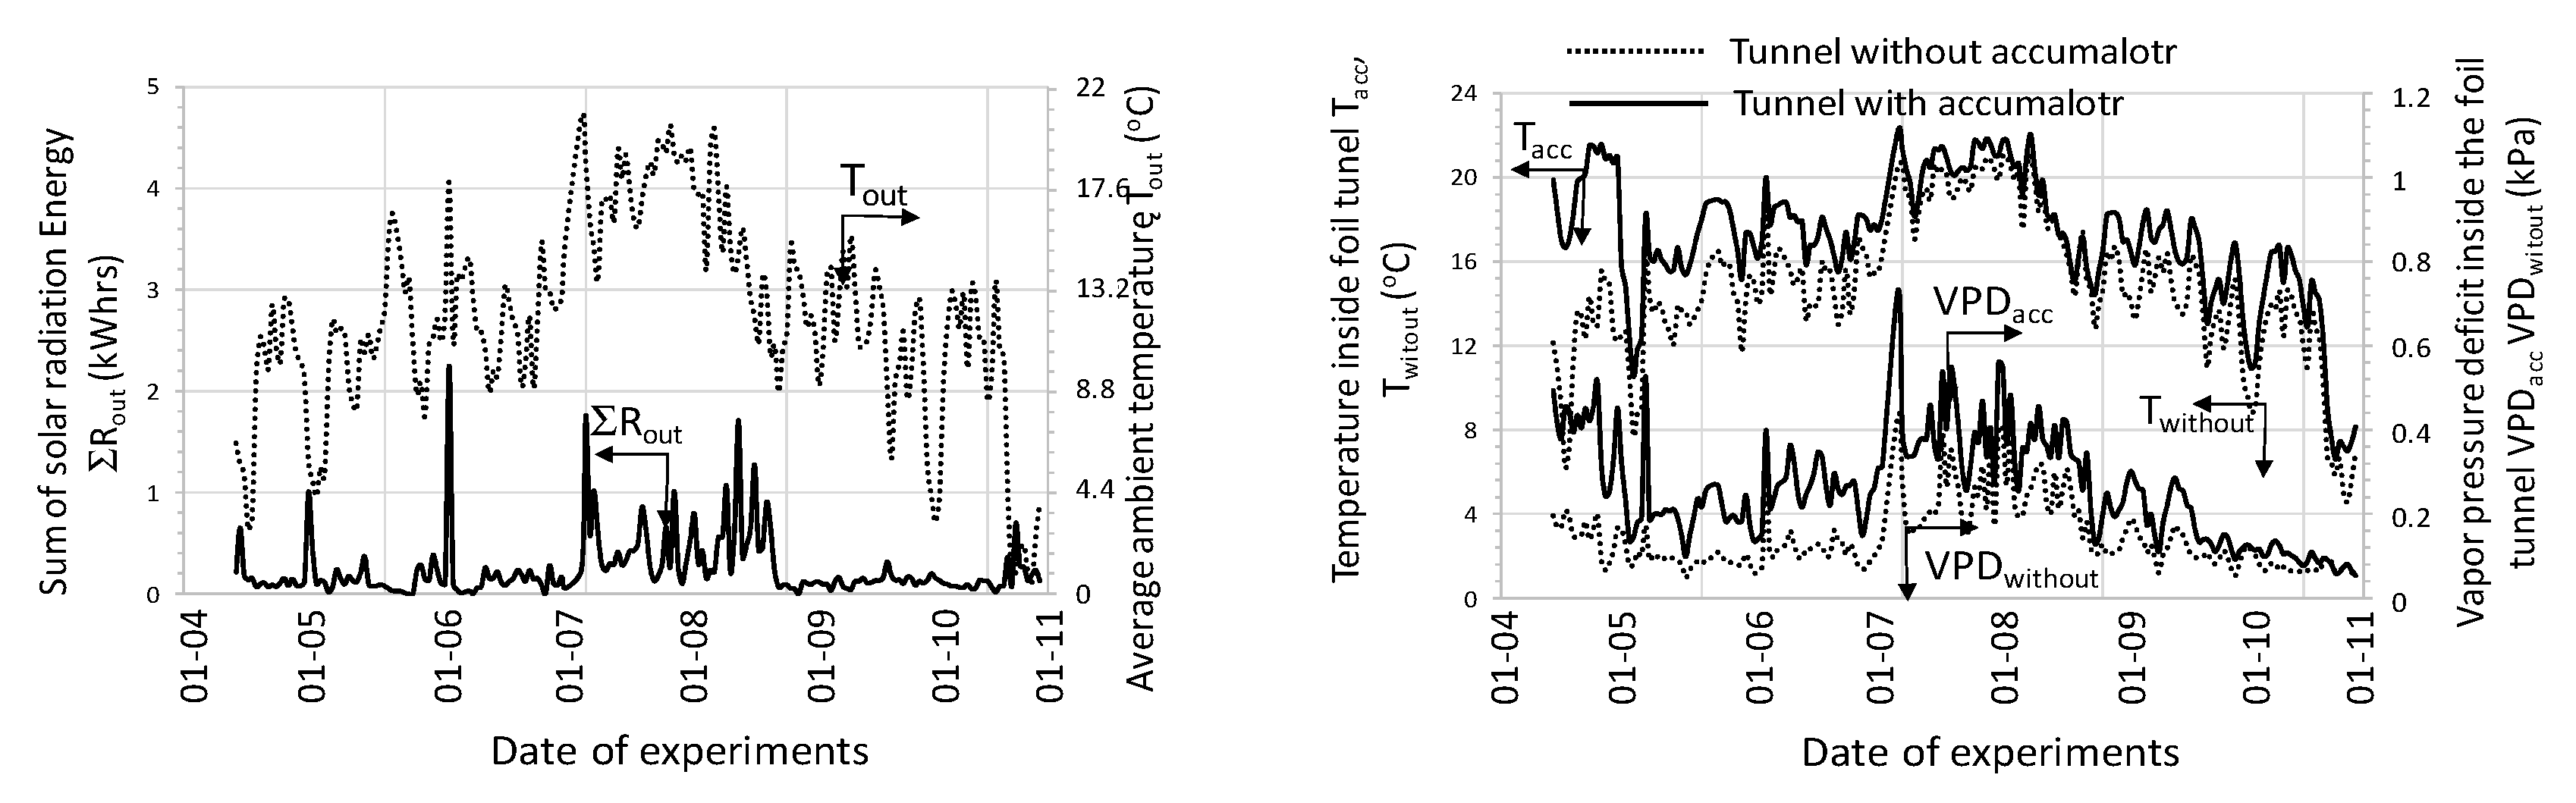
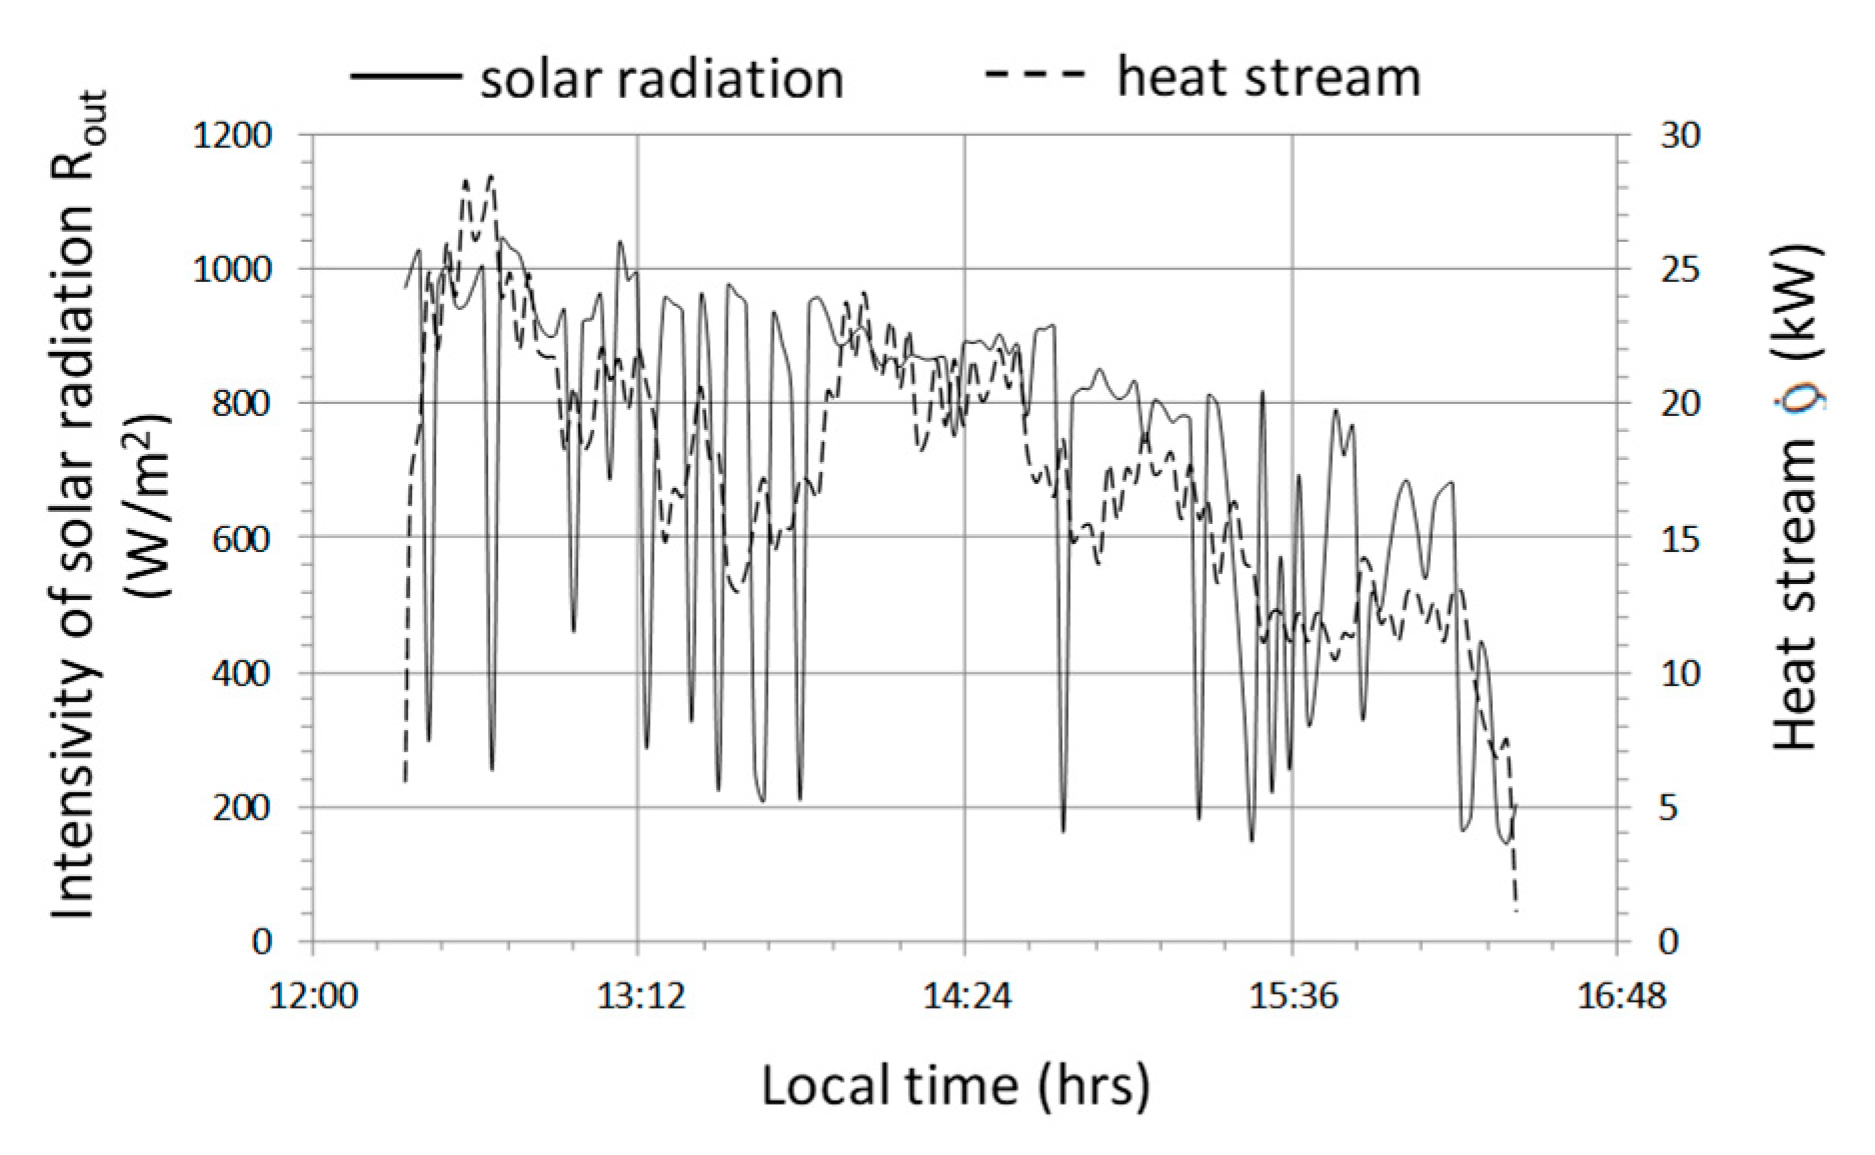
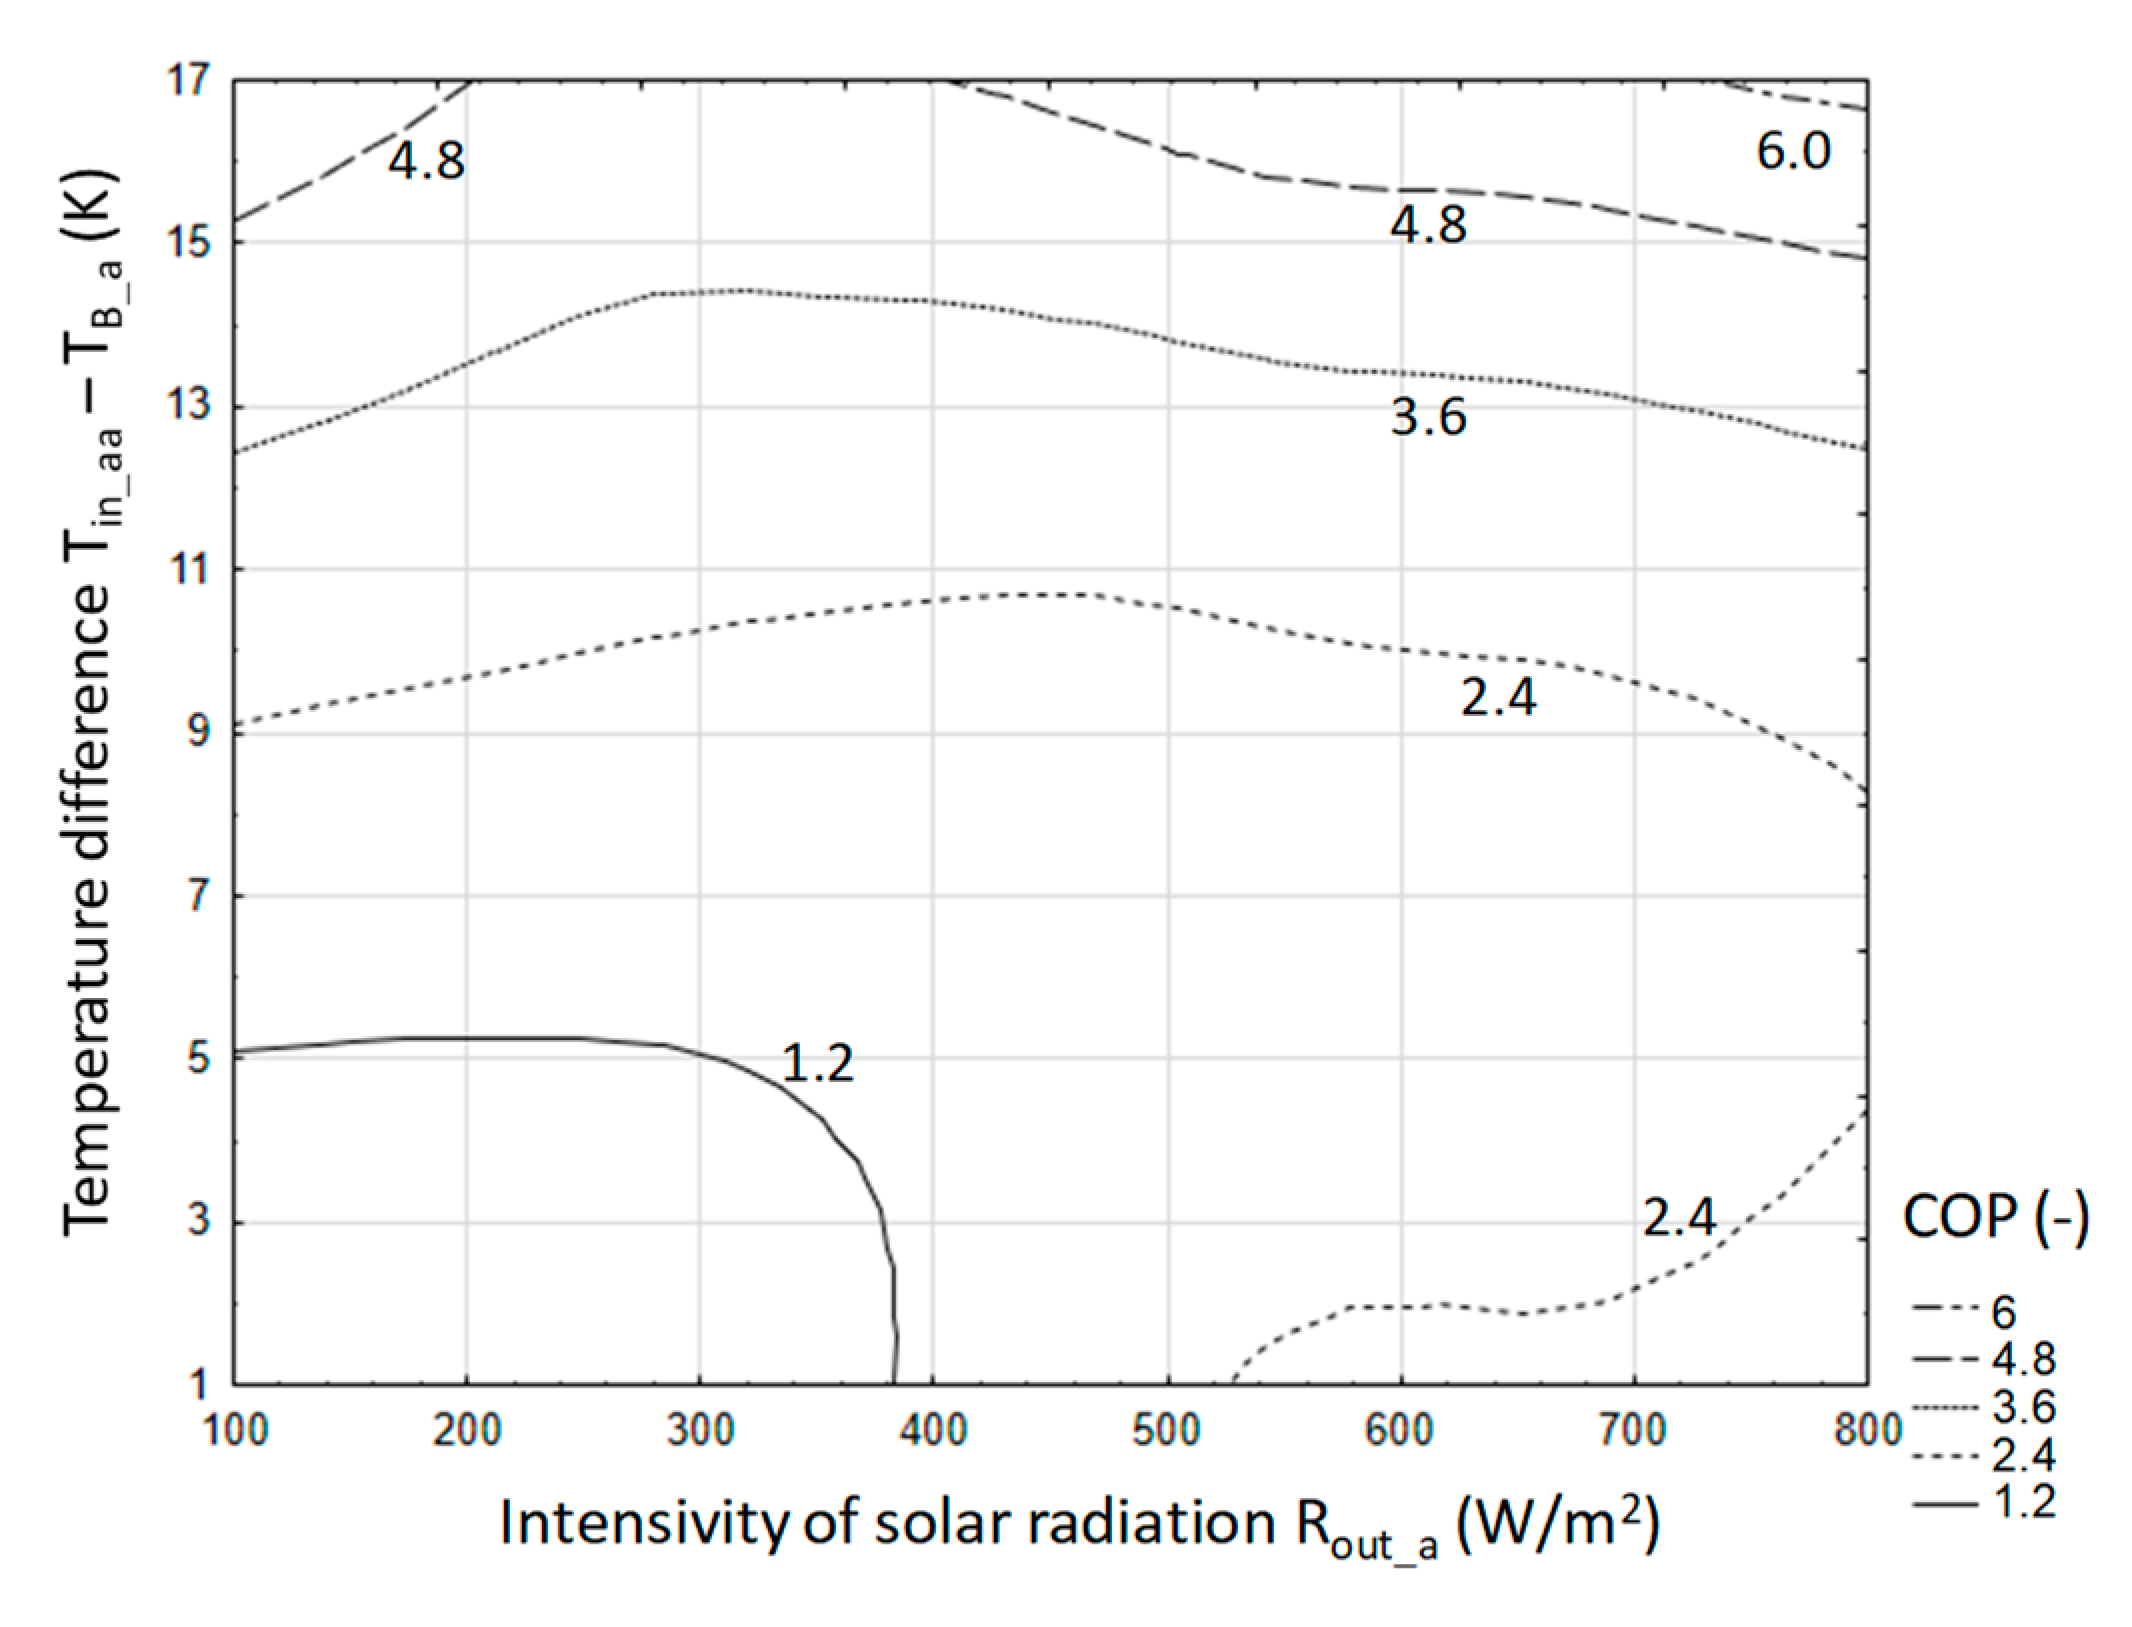
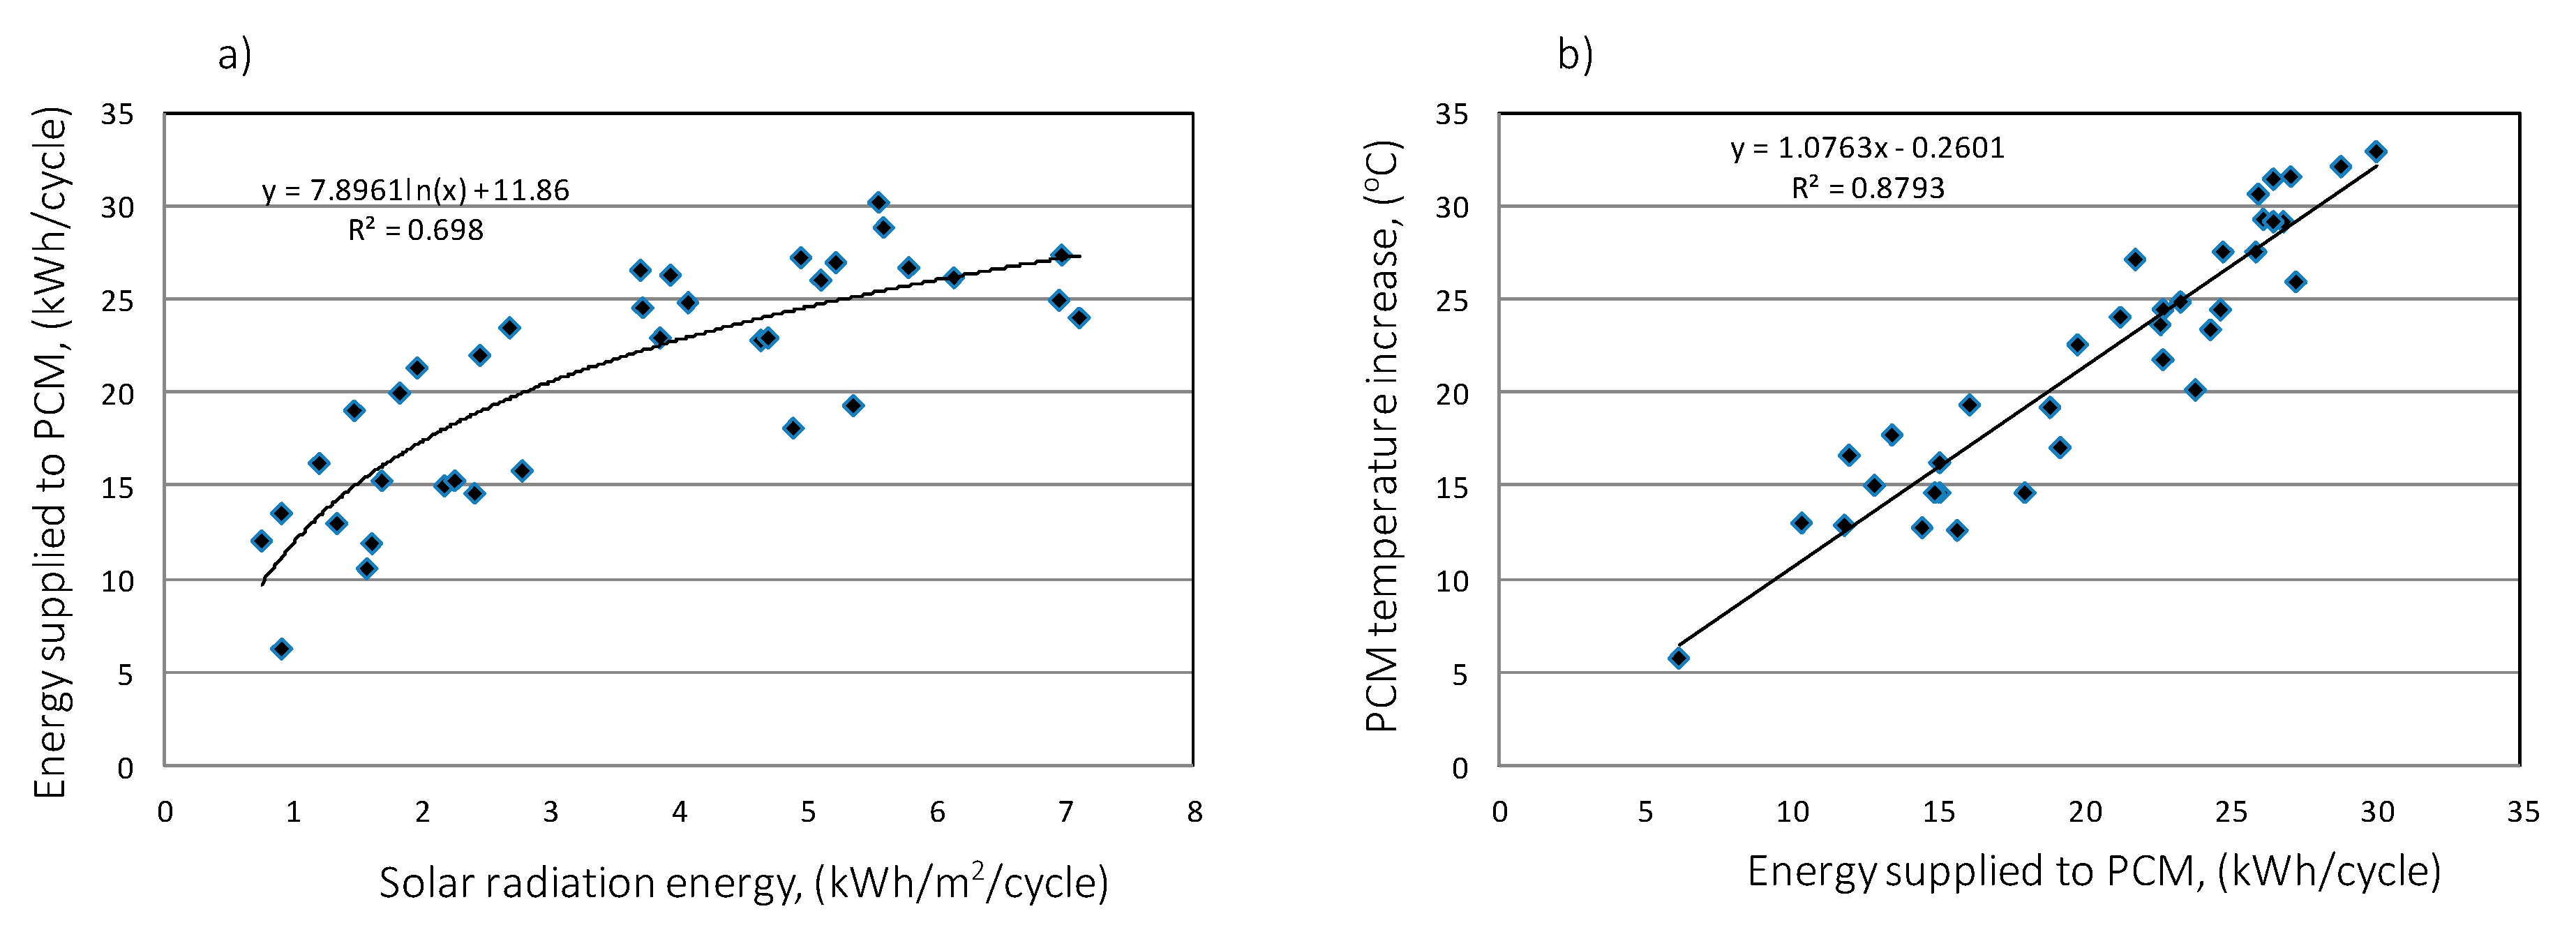
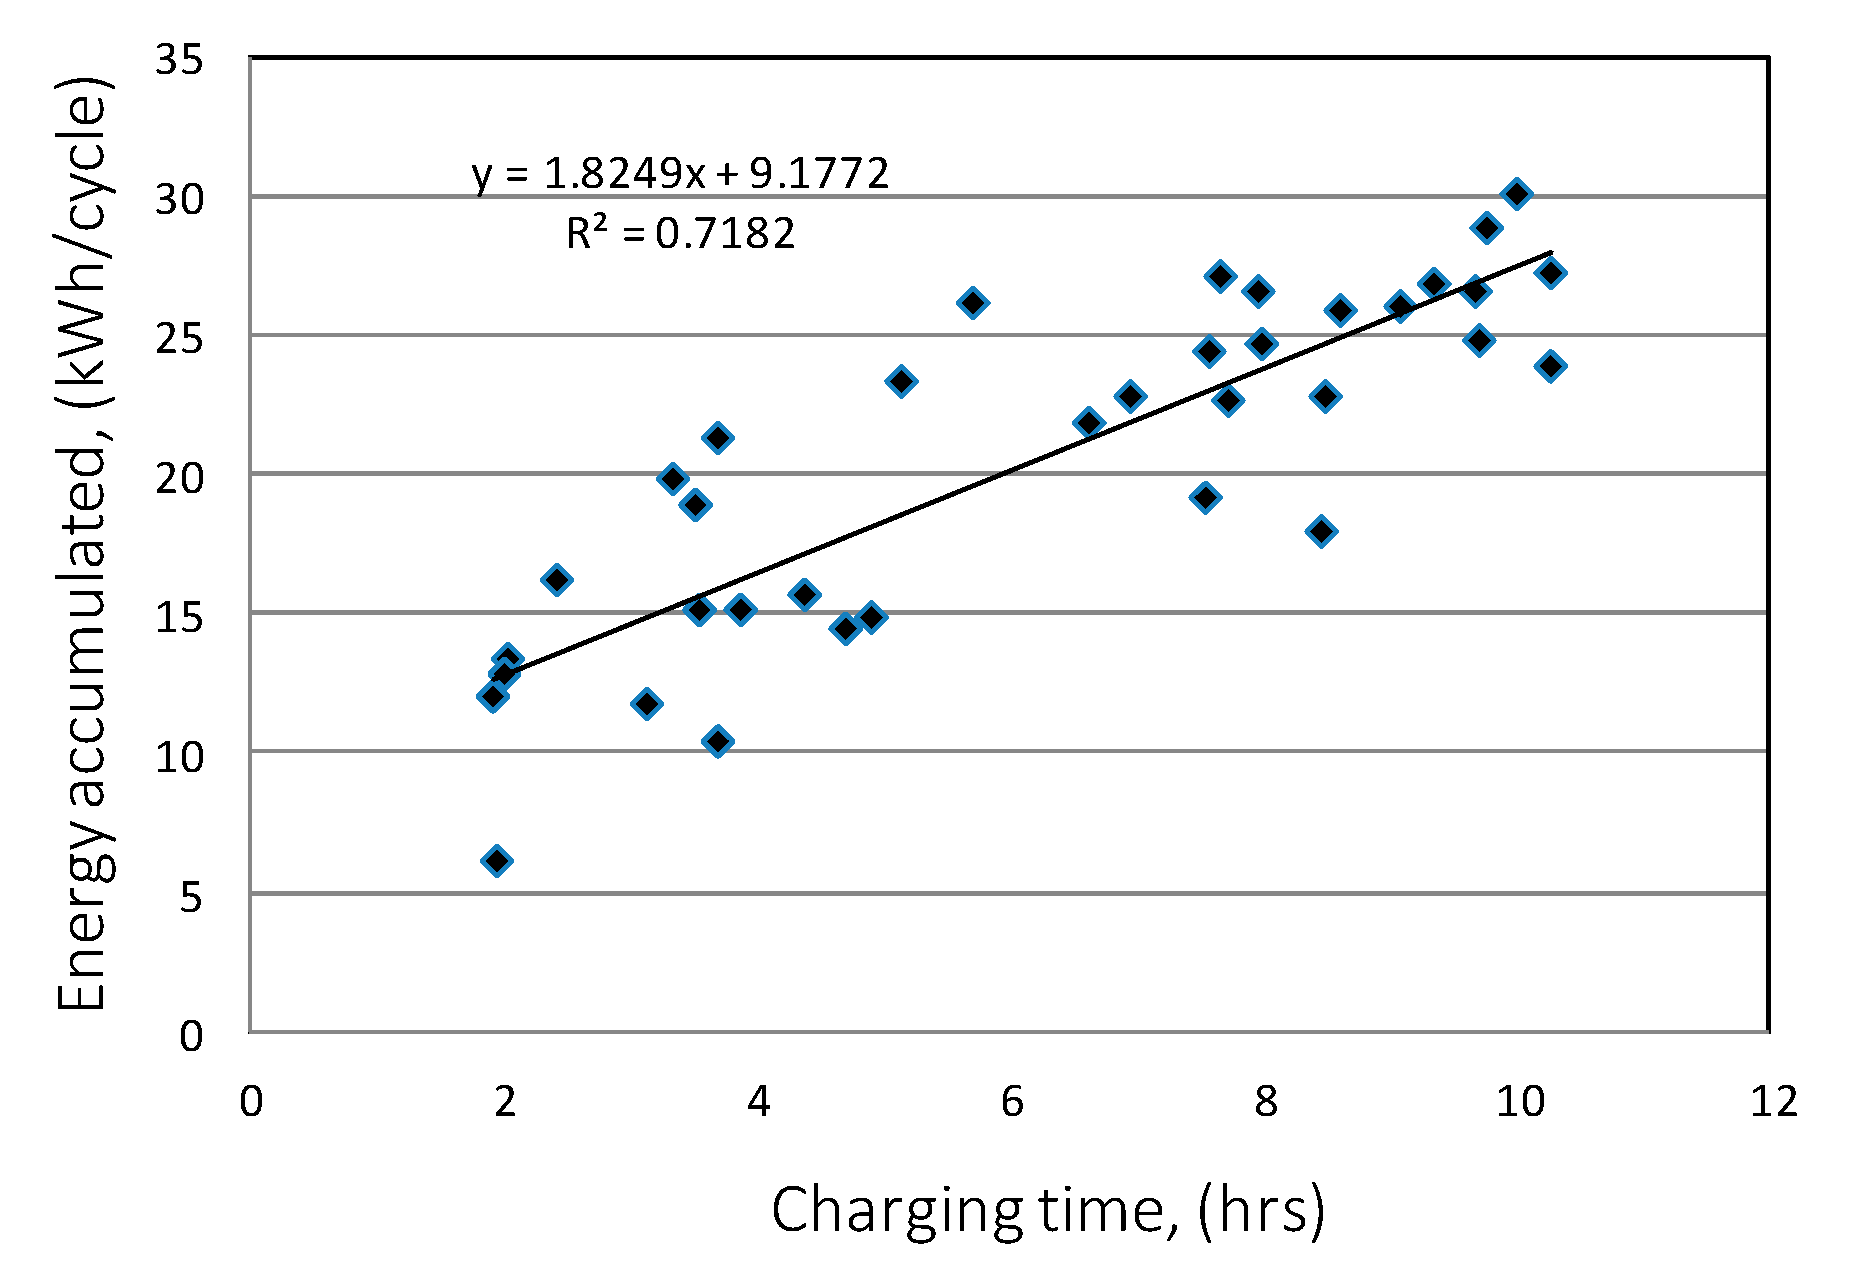
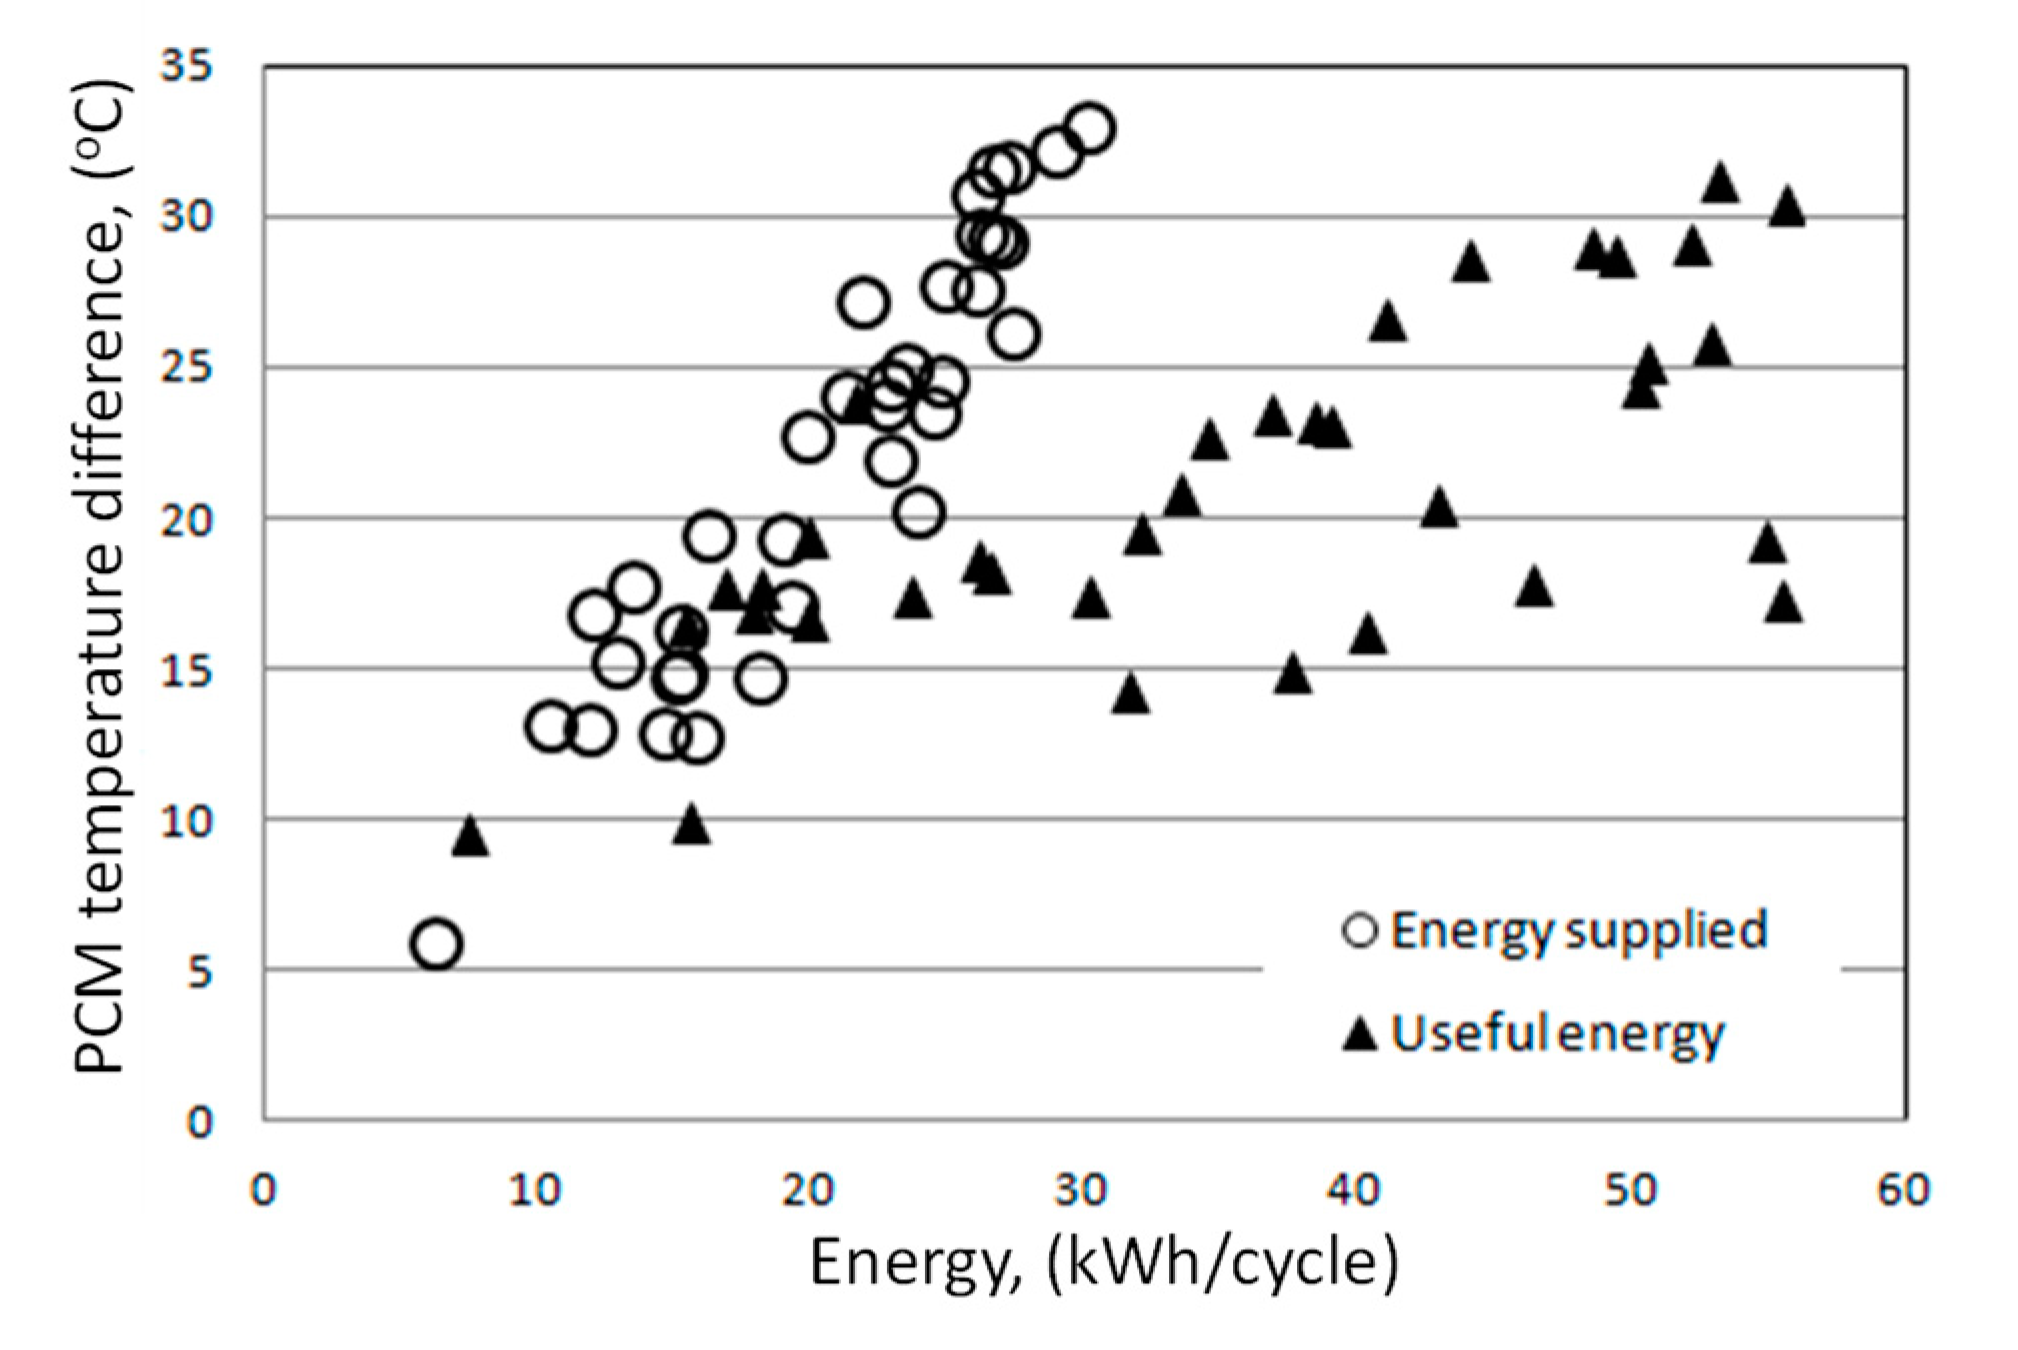
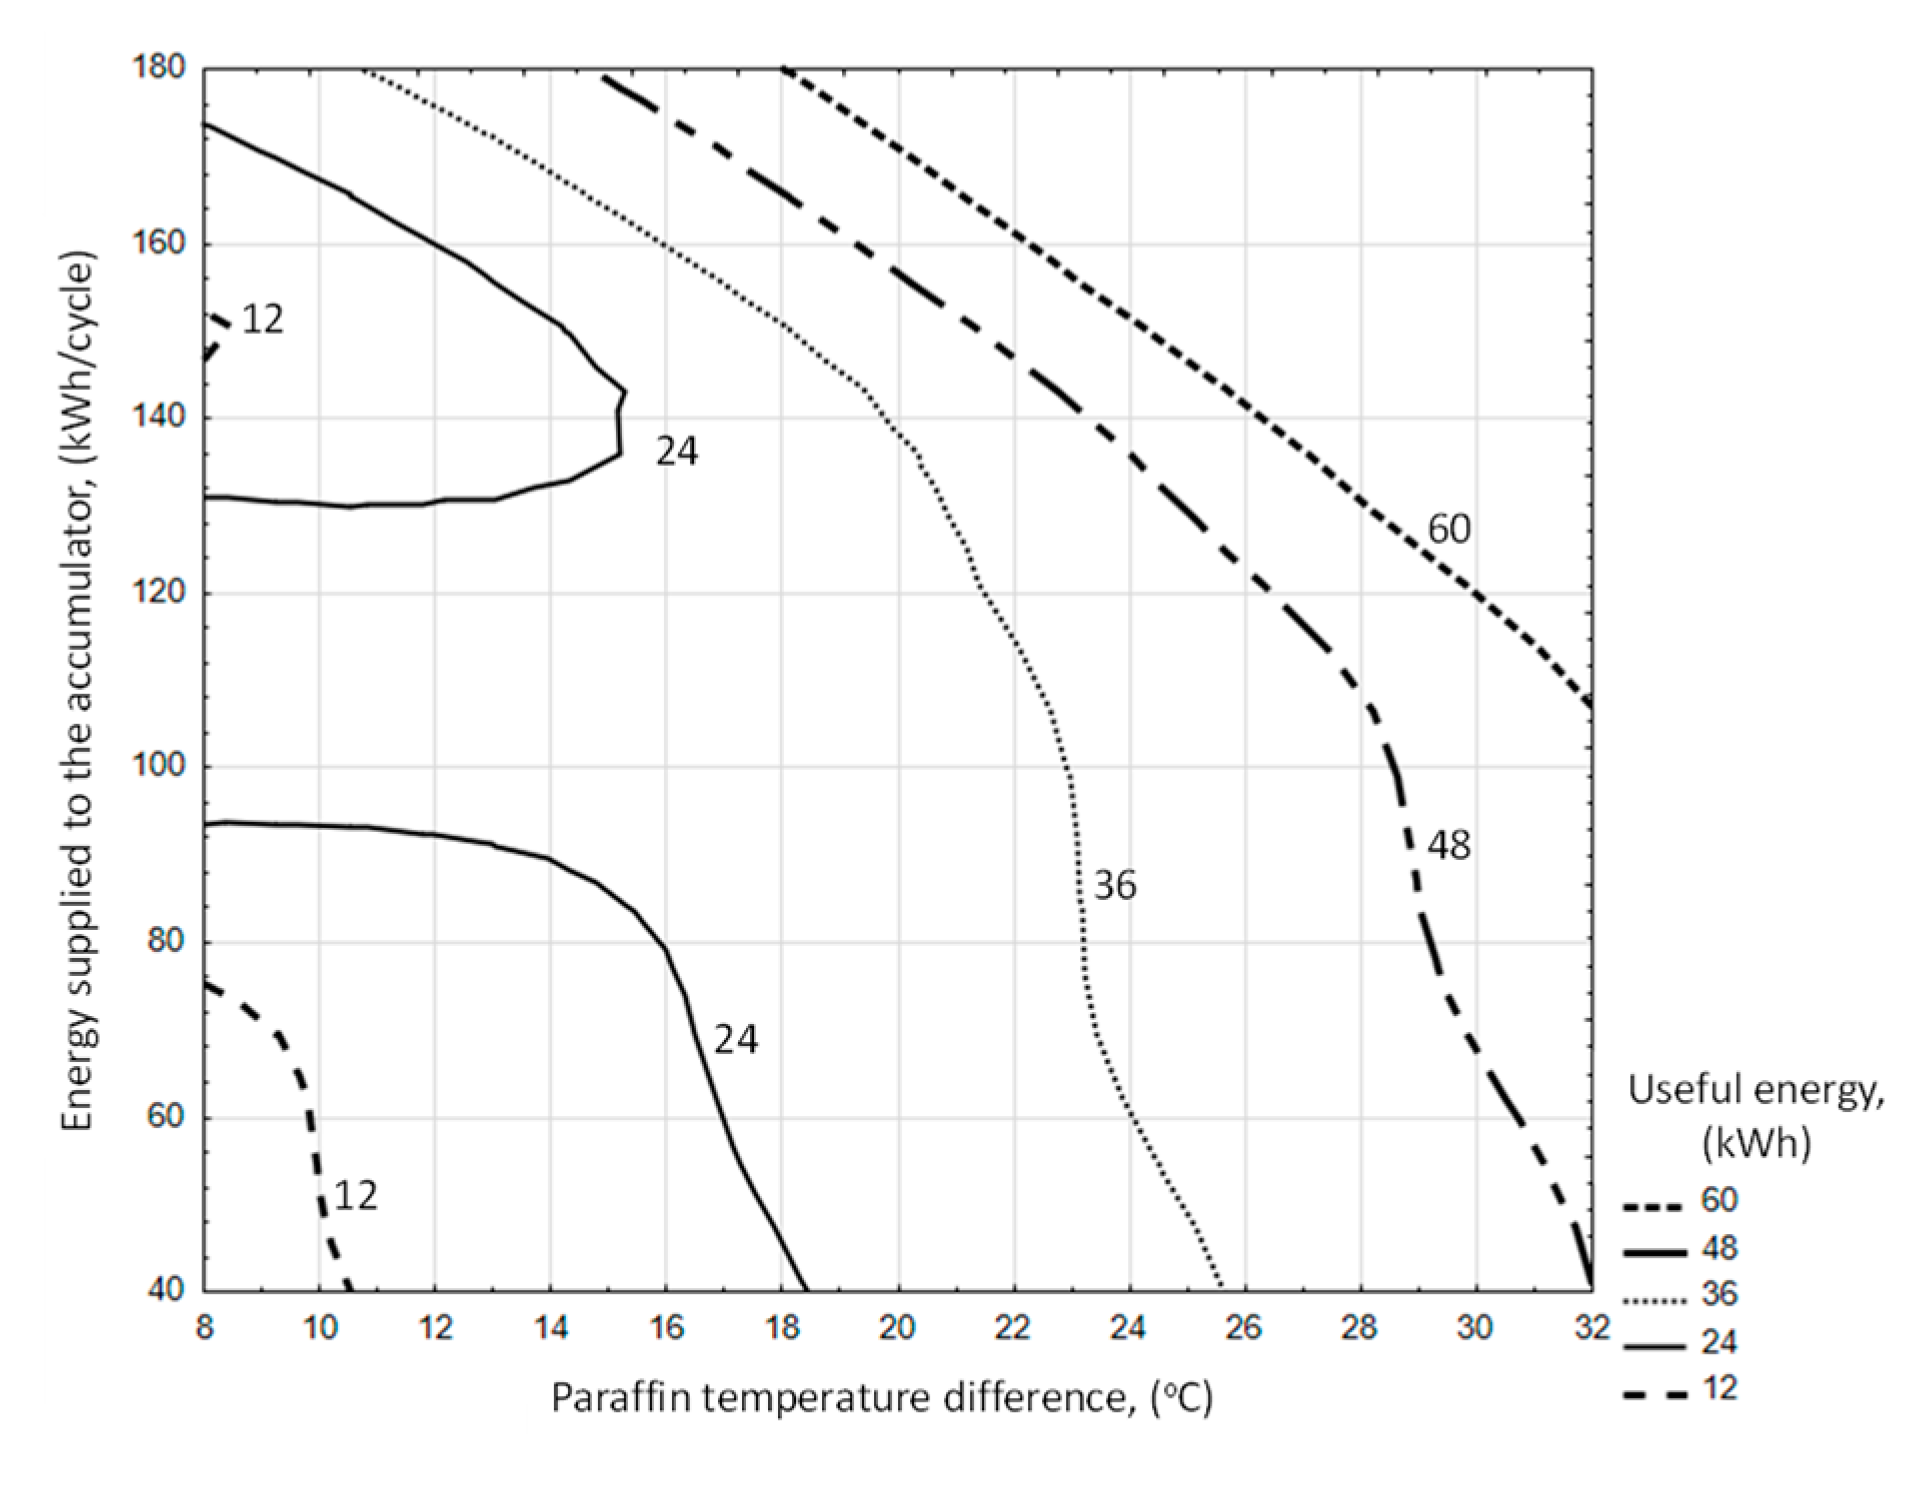
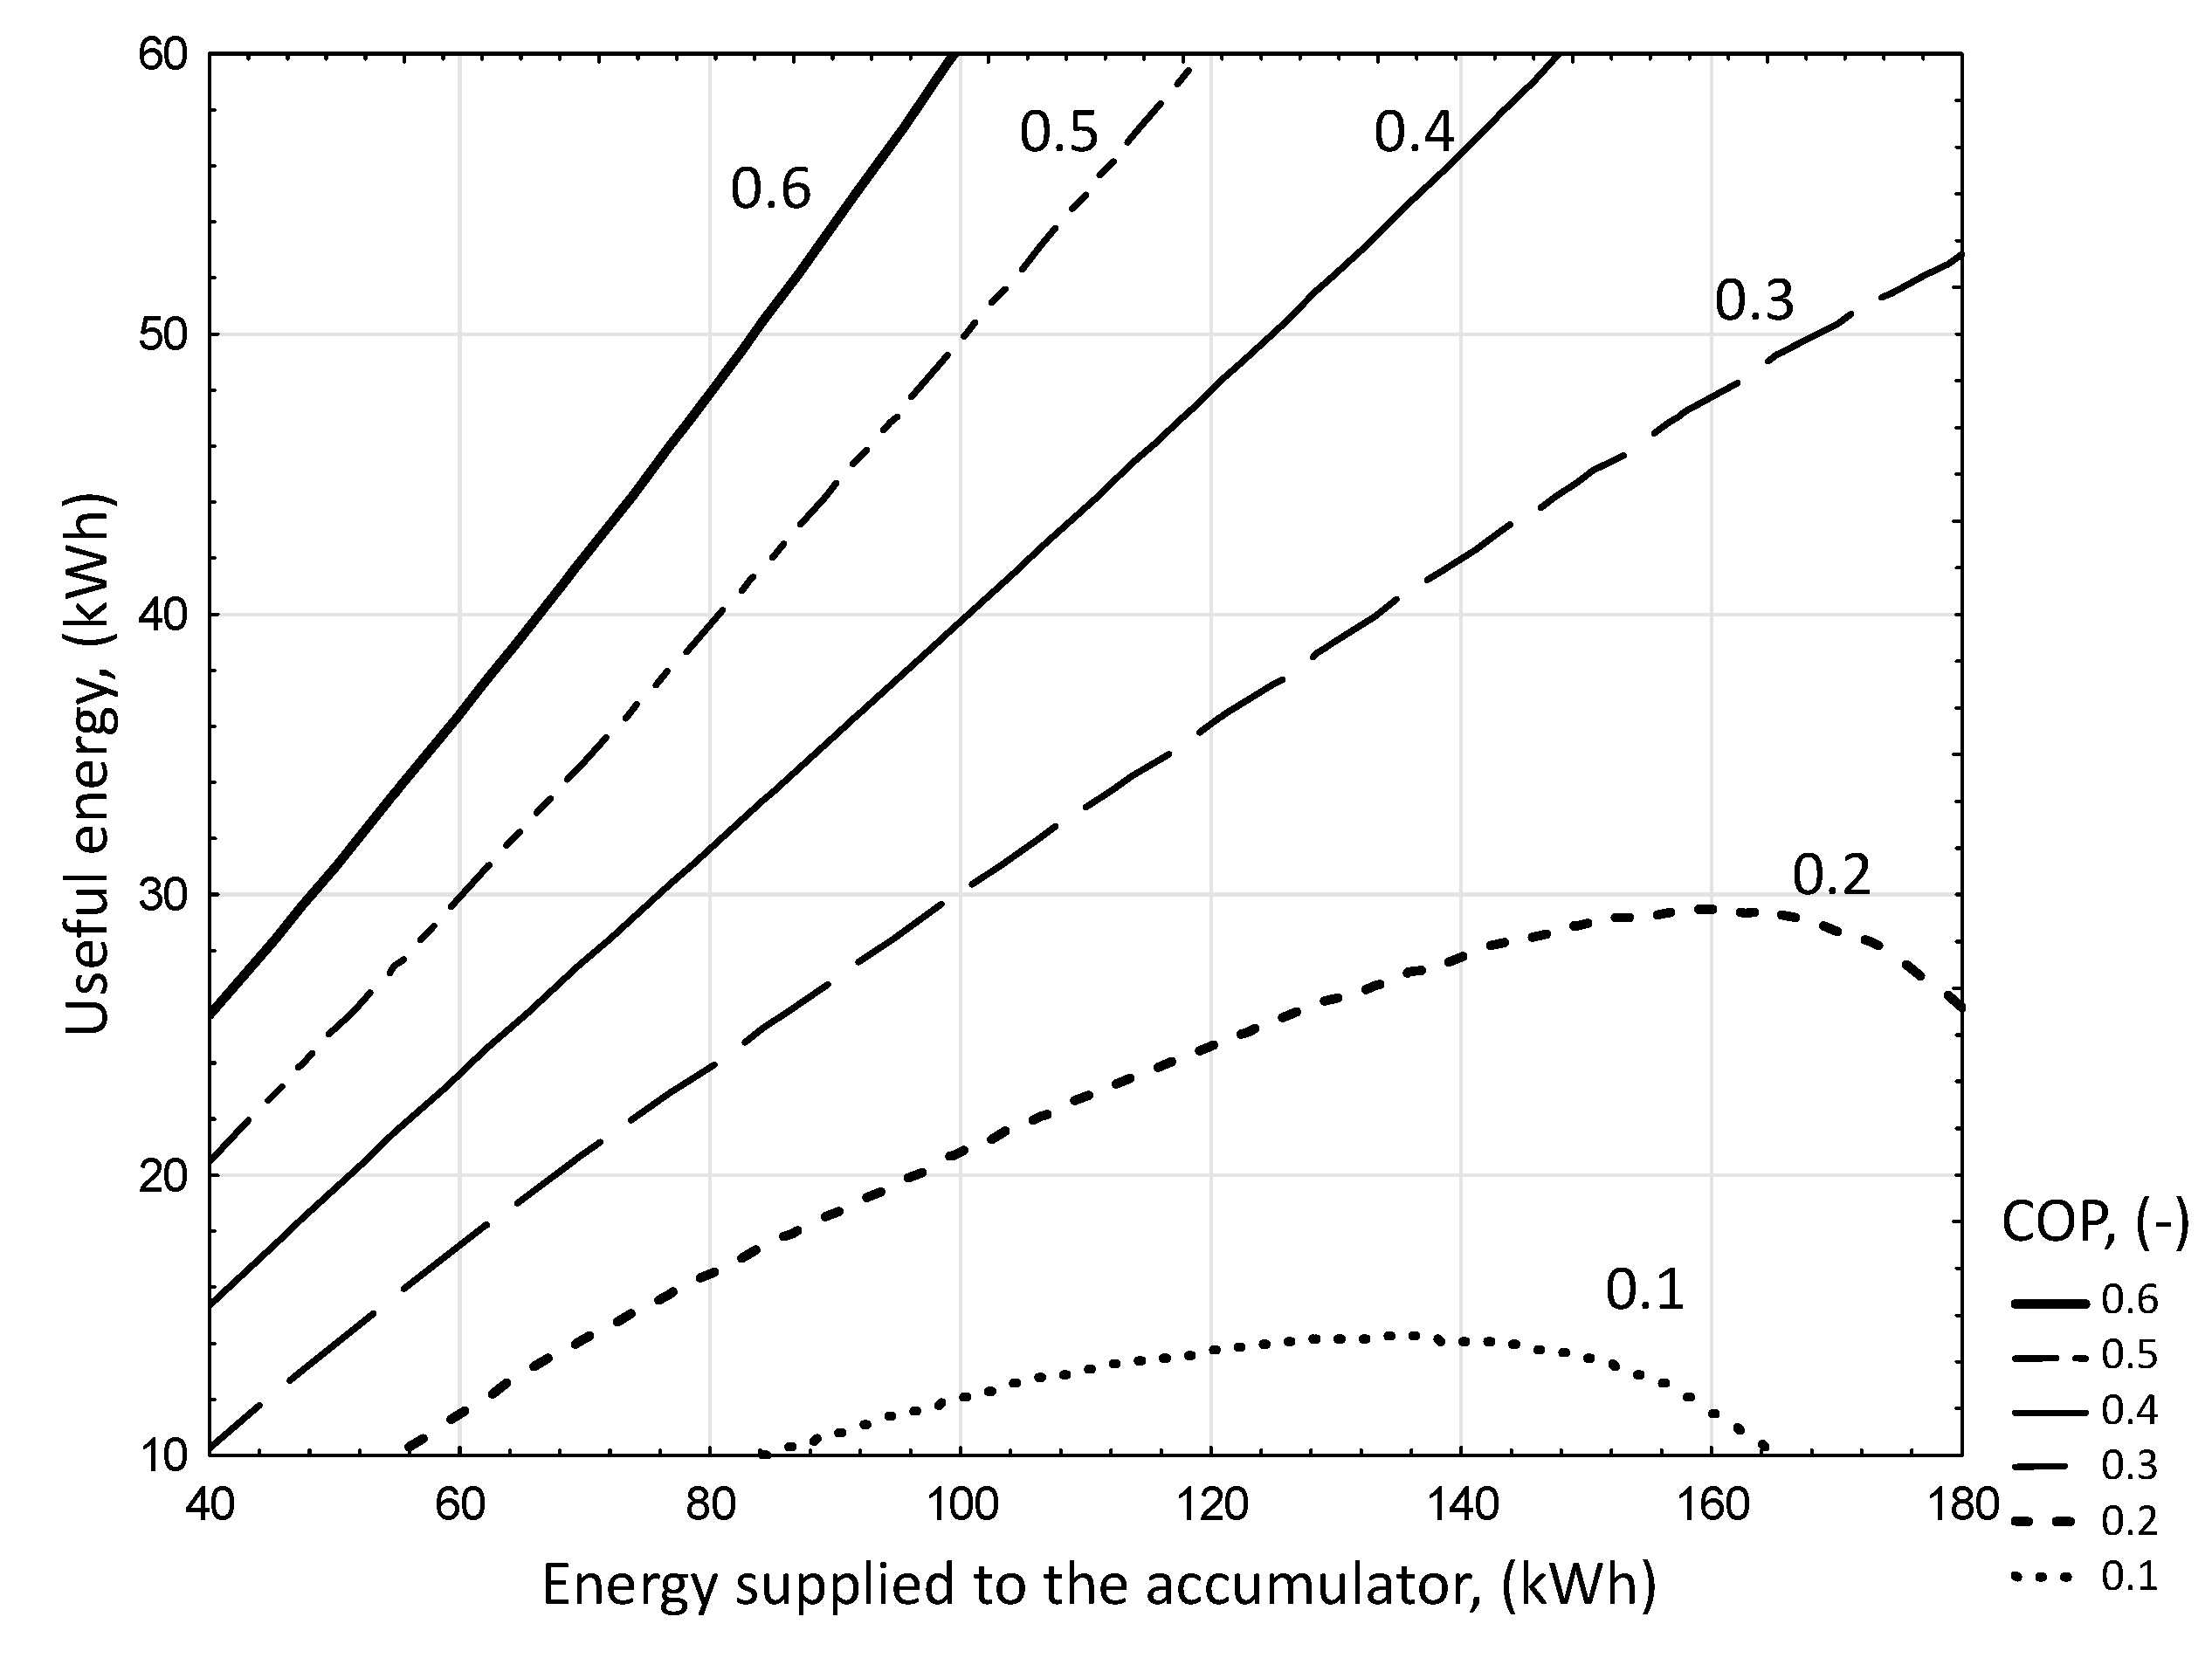
3.3. PCM Accumulator
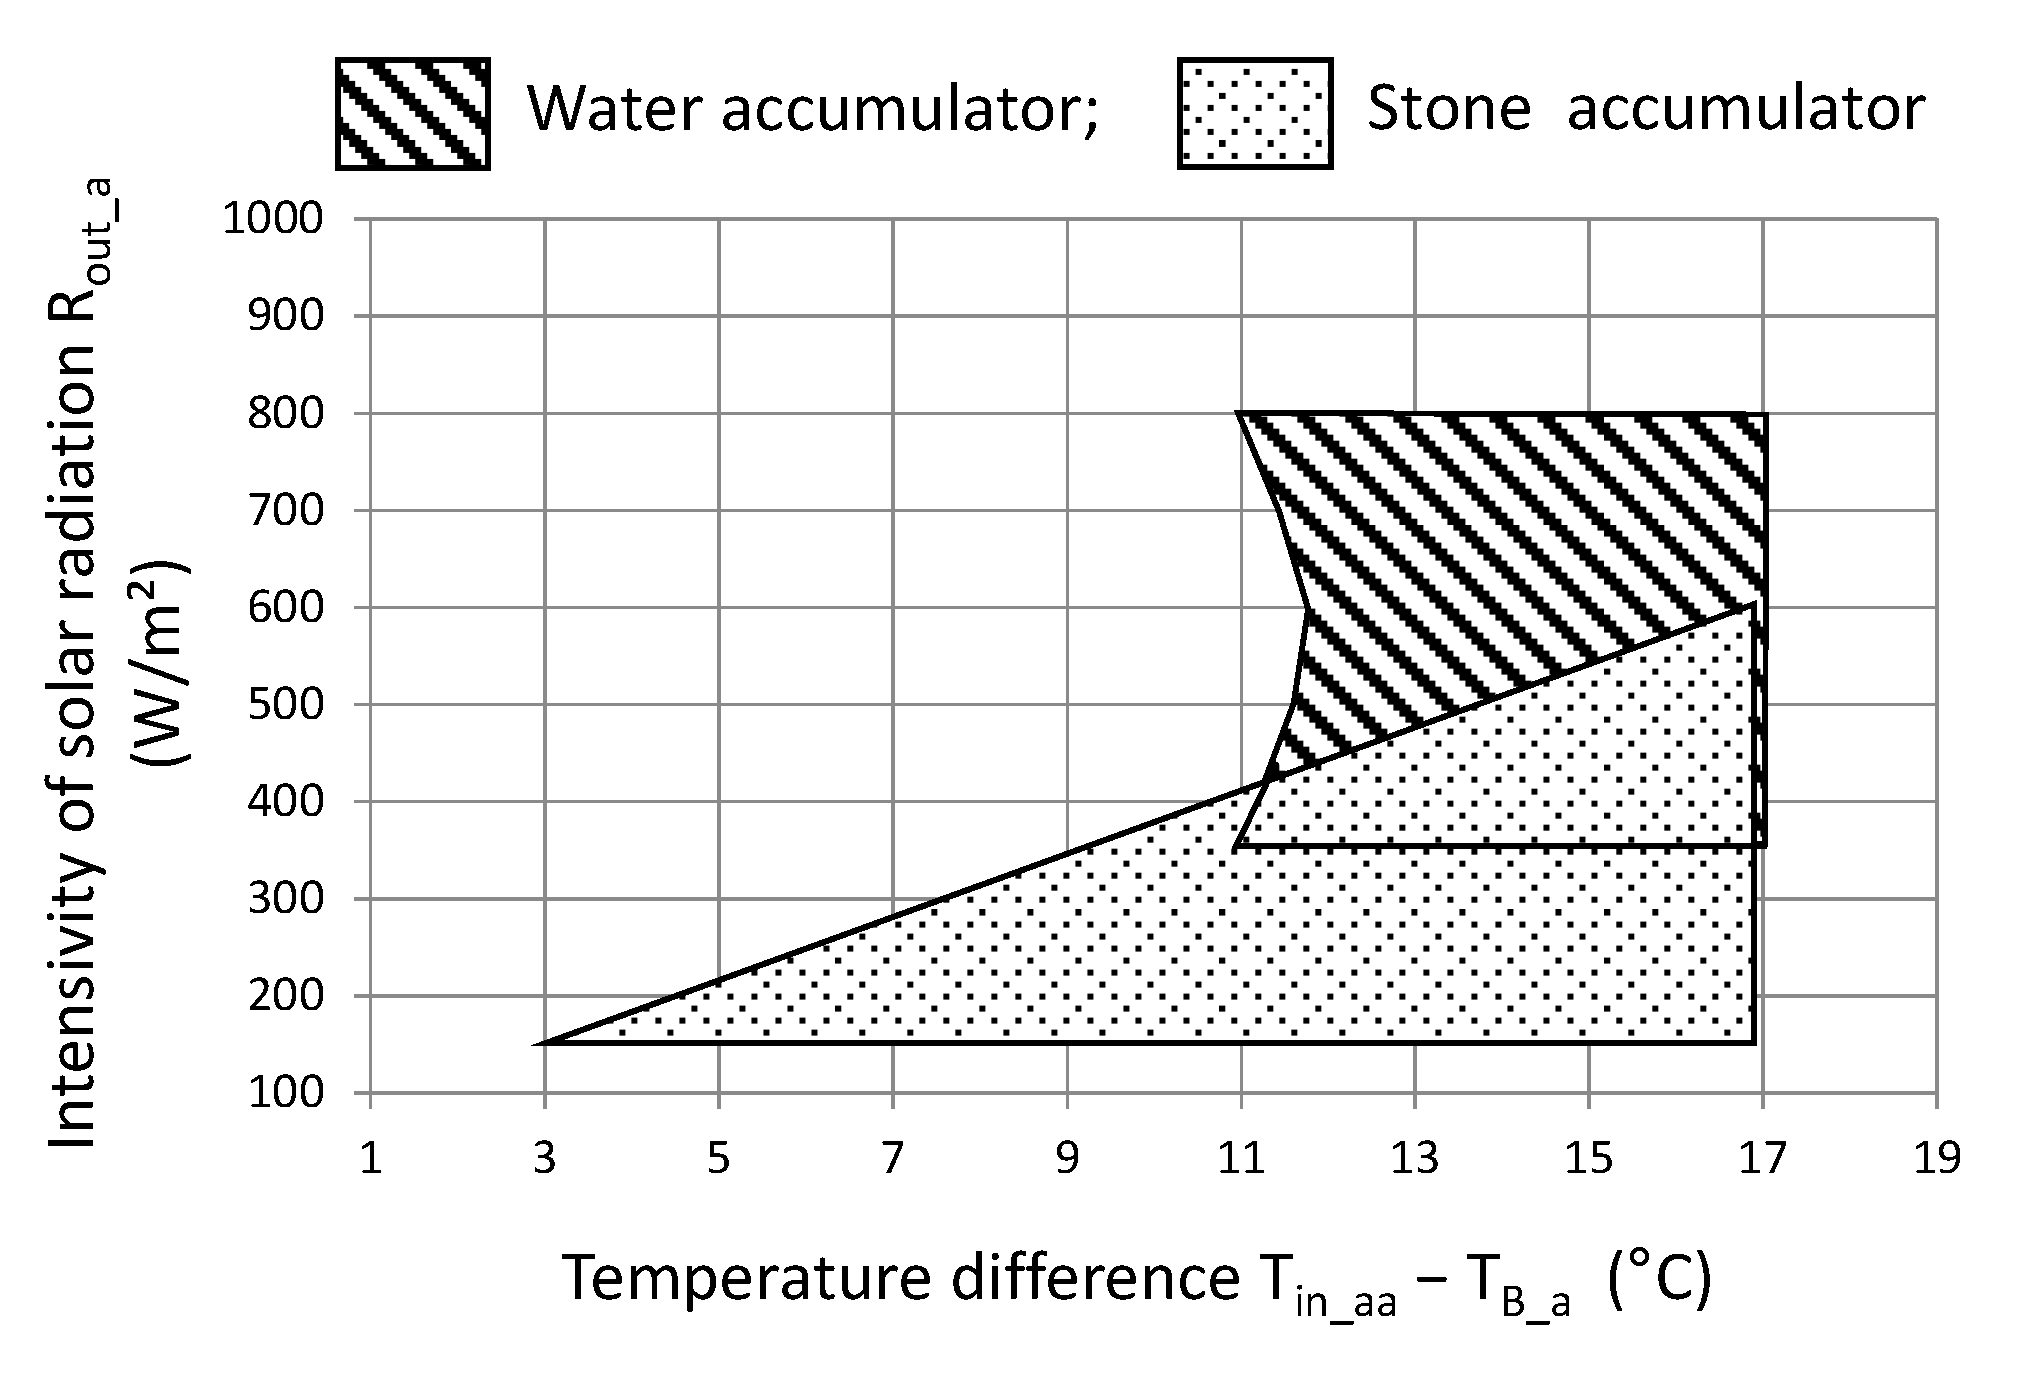
3.4. Comparison of Analyzed Battery Types
4. Conclusions
Author Contributions
Funding
Acknowledgments
Conflicts of Interest
References
- Gielen, D.; Boshell, F.; Saygin, D.; Bazilian, M.D.; Wagner, N.; Gorini, R. The role of renewable energy in the global energy transformation. Energy Strategy Rev. 2019, 24, 38–50. [Google Scholar] [CrossRef]
- Shivakumar, A.; Dobbins, A.; Fahl, U.; Singh, A. Drivers of renewable energy deployment in the EU: An analysis of past trends and projections. Energy Strategy Rev. 2019, 26, 100402. [Google Scholar] [CrossRef]
- Broda, W.; Kuboń, M.; Malaga-Tobola, U.; Kwaśniewski, D.; Cupiał, M. Economic and legal aspects of renewable energy production in Poland. In Proceedings of the International Multidisciplinary Scientific Geo Conference Surveying Geology and Mining Ecology Management, SGEM, Albena, Bulgaria, 19 December 2019; Volume 19, pp. 451–458. [Google Scholar]
- Xu, J.; Wang, R.Z.; Li, Y. A review of available technologies for seasonal thermal energy storage. Sol. Energy 2014, 103, 610–638. [Google Scholar] [CrossRef]
- Tian, Y.; Zhao, C.Y. A review of solar collectors and thermal energy storage in solar thermal applications. Appl. Energy 2013, 104, 538–553. [Google Scholar] [CrossRef] [Green Version]
- Weiss, W. Solar Heating Systems for Houses, 1st ed.; James & James: London, UK, 2003. [Google Scholar]
- Englmair, G.; Kong, W.; Brinkø Berg, J.; Furbo, S.; Fan, J. Demonstration of a solar combi-system utilizing stable supercooling of sodium acetate trihydrate for heat storage. Appl. Therm. Eng. 2019, 242, 1108–1120. [Google Scholar] [CrossRef]
- Reyes, A.; Pailahueque, N.; Henríquez-Vargas, L.; Vásquez, J.; Sepúlveda, F. Analysis of a multistage solar thermal energy accumulator. Renew. Energy 2019, 136, 621–631. [Google Scholar] [CrossRef]
- Ould Amrouche, S.; Rekioua, D.; Rekioua, T.; Bacha, S. Overview of energy storage in renewable energy systems. Int. J. Hydrog. Energy 2016, 41, 20914–20927. [Google Scholar] [CrossRef]
- Verda, V.; Guelpa, E.; Barbero, G.; Brundu, F.; Acquaviva, A.; Patti, E. Optimization of the thermal request profiles of buildings connected with a large district heating network. In Proceedings of the ASME International Mechanical Engineering Congress and Exposition, Proceedings (IMECE), American Society of Mechanical Engineers (ASME), Phoenix, AZ, USA, 11–17 November 2016; Volume 6A-2016. [Google Scholar]
- Li, G. Sensible heat thermal storage energy and exergy performance evaluations. Renew. Sustain. Energy Rev. 2016, 53, 897–923. [Google Scholar] [CrossRef]
- Tao, Y.B.; He, Y.L. A review of phase change material and performance enhancement method for latent heat storage system. Renew. Sustain. Energy Rev. 2018, 93, 245–259. [Google Scholar] [CrossRef]
- Ding, Y.; Riffat, S.B. Thermochemical energy storage technologies for building applications: A state-of-the-art review. Int. J. Low-Carbon Technol. 2013, 8, 106–116. [Google Scholar] [CrossRef] [Green Version]
- Alva, G.; Liu, L.; Huang, X.; Fang, G. Thermal energy storage materials and systems for solar energy applications. Renew. Sustain. Energy Rev. 2017, 68, 693–706. [Google Scholar] [CrossRef]
- Gil, A.; Medrano, M.; Martorell, I.; Lázaro, A.; Dolado, P.; Zalba, B.; Cabeza, L.F. State of the art on high temperature thermal energy storage for power generation. Part 1-Concepts, materials and modellization. Renew. Sustain. Energy Rev. 2010, 14, 31–55. [Google Scholar] [CrossRef]
- Kousksou, T.; Bruel, P.; Jamil, A.; El Rhafiki, T.; Zeraouli, Y. Energy storage: Applications and challenges. Sol. Energy Mater. Sol. Cells 2014, 120, 59–80. [Google Scholar] [CrossRef]
- Kurpaska, S.; Latała, H.; Konopacki, P. Storage of Heat Excess from a Plastic Tunnel in a Rock—Bed Accumulator: Tomato Yield and Energy Effects; Springer: Cham, Switzerland, 2018; pp. 549–560. [Google Scholar]
- Nahhas, T.; Py, X.; Sadiki, N. Experimental investigation of basalt rocks as storage material for high-temperature concentrated solar power plants. Renew. Sustain. Energy Rev. 2019, 110, 226–235. [Google Scholar] [CrossRef]
- Gourdo, L.; Fatnassi, H.; Tiskatine, R.; Wifaya, A.; Demrati, H.; Aharoune, A.; Bouirden, L. Solar energy storing rock-bed to heat an agricultural greenhouse. Energy 2019, 169, 206–212. [Google Scholar] [CrossRef]
- Pielichowska, K.; Pielichowski, K. Phase change materials for thermal energy storage. Prog. Mater. Sci. 2014, 65, 67–123. [Google Scholar] [CrossRef]
- Liu, M.; Saman, W.; Bruno, F. Review on storage materials and thermal performance enhancement techniques for high temperature phase change thermal storage systems. Renew. Sustain. Energy Rev. 2012, 16, 2118–2132. [Google Scholar] [CrossRef]
- Oró, E.; de Gracia, A.; Castell, A.; Farid, M.M.; Cabeza, L.F. Review on phase change materials (PCMs) for cold thermal energy storage applications. Appl. Energy 2012, 99, 513–533. [Google Scholar] [CrossRef]
- Asgharian, H.; Baniasadi, E. A review on modeling and simulation of solar energy storage systems based on phase change materials. J. Energy Storage 2019, 21, 186–201. [Google Scholar] [CrossRef]
- Mahfuz, M.H.; Kamyar, A.; Afshar, O.; Sarraf, M.; Anisur, M.R.; Kibria, M.A.; Saidur, R.; Metselaar, I.H.S.C. Exergetic analysis of a solar thermal power system with PCM storage. Energy Convers. Manag. 2014, 78, 486–492. [Google Scholar] [CrossRef]
- Belmonte, J.F.; Izquierdo-Barrientos, M.A.; Molina, A.E.; Almendros-Ibáñez, J.A. Air-based solar systems for building heating with PCM fluidized bed energy storage. Energy Build. 2016, 130, 150–165. [Google Scholar] [CrossRef]
- Semple, L.; Carriveau, R.; Ting, D.S.-K. A techno-economic analysis of seasonal thermal energy storage for greenhouse applications. Energy Build. 2017, 154, 175–187. [Google Scholar] [CrossRef]
- Paksoy, H.Ö.; Beyhan, B. Thermal energy storage (TES) systems for greenhouse technology. In Advances in Thermal Energy Storage Systems: Methods and Applications; Woodhead Publishing: Cambridge, UK, 2014; pp. 433–548. ISBN 9781782420965. [Google Scholar]
- Kurpaska, S.; Sikora, J.; Mudryk, K.; Latała, H.; Knaga, J. The effects of storing heat excess in a stone battery in a horticultural premise. E3s Web Conf. 2016, 10, 00052. [Google Scholar] [CrossRef]
- Campiotti, C.A.; Morosinotto, G.; Puglisi, G.; Schettini, E.; Vox, G. Performance Evaluation of a Solar Cooling Plant Applied for Greenhouse Thermal Control. Agric. Agric. Sci. Procedia 2016, 8, 664–669. [Google Scholar] [CrossRef] [Green Version]
- Riepl, M.; Loistl, F.; Gurtner, R.; Helm, M.; Schweigler, C. Operational performance results of an innovative solar thermal cooling and heating plant. Energy Procedia 2012, 30, 974–985. [Google Scholar] [CrossRef] [Green Version]
- Choudhury, B.; Saha, B.B.; Chatterjee, P.K.; Sarkar, J.P. An overview of developments in adsorption refrigeration systems towards a sustainable way of cooling. Appl. Energy 2013, 104, 554–567. [Google Scholar] [CrossRef]
- Cao, K.; Xu, H.; Zhang, R.; Xu, D.; Yan, L.; Sun, Y.; Xia, L.; Zhao, J.; Zou, Z.; Bao, E. Renewable and sustainable strategies for improving the thermal environment of Chinese solar greenhouses. Energy Build. 2019, 202, 109414. [Google Scholar] [CrossRef]
- Cuce, E.; Harjunowibowo, D.; Cuce, P.M. Renewable and sustainable energy saving strategies for greenhouse systems: A comprehensive review. Renew. Sustain. Energy Rev. 2016, 64, 34–59. [Google Scholar] [CrossRef]
- Zidar, M.; Georgilakis, P.S.; Hatziargyriou, N.D.; Capuder, T.; Škrlec, D. Review of energy storage allocation in power distribution networks: Applications, methods and future research. IET Gener. Transm. Distrib. 2016, 10, 645–652. [Google Scholar] [CrossRef]
- Wong, L.A.; Ramachandaramurthy, V.K.; Taylor, P.; Ekanayake, J.B.; Walker, S.L.; Padmanaban, S. Review on the optimal placement, sizing and control of an energy storage system in the distribution network. J. Energy Storage 2019, 21, 489–504. [Google Scholar] [CrossRef]
- Azhgaliyeva, D. Energy storage and renewable energy deployment: Empirical Evidence from OECD countries. Energy Procedia 2019, 158, 3647–3651. [Google Scholar] [CrossRef]
- Wang, L. Energy efficiency technologies for sustainable food processing. Energy Effic. 2014, 7, 791–810. [Google Scholar] [CrossRef]
- Ladha-Sabur, A.; Bakalis, S.; Fryer, P.J.; Lopez-Quiroga, E. Mapping energy consumption in food manufacturing. Trends Food Sci. Technol. 2019, 86, 270–280. [Google Scholar] [CrossRef]
- De Amorim, W.S.; Valduga, I.B.; Ribeiro, J.M.P.; Williamson, V.G.; Krauser, G.E.; Magtoto, M.K.; de Andrade Guerra, J.B.S.O. The nexus between water, energy and food in the context of the global risks: An analysis of the interactions between food, water and energy security. Environ. Impact Assess. Rev. 2018, 72, 1–11. [Google Scholar] [CrossRef]
- Kopittke, P.M.; Menzies, N.W.; Wang, P.; McKenna, B.A.; Lombi, E. Soil and the intensification of agriculture for global food security. Environ. Int. 2019, 132, 105078. [Google Scholar] [CrossRef] [PubMed]
- Szeląg-Sikora, A.; Cupiał, M.; Niemiec, M. Productivity of Farms in the Aspect of Various Activity Forms. Agric. Agric. Sci. Procedia 2015, 7, 94–98. [Google Scholar] [CrossRef] [Green Version]
- Ilbahar, E.; Cebi, S.; Kahraman, C. A state-of-the-art review on multi-attribute renewable energy decision making. Energy Strategy Rev. 2019, 25, 18–33. [Google Scholar] [CrossRef]
- McMichael, A.J.; Powles, J.W.; Butler, C.D.; Uauy, R. Food, livestock production, energy, climate change and health. Lancet 2007, 370, 1253–1263. [Google Scholar] [CrossRef]
- Fasulo, A.; Follari, J.; Barral, J. Comparison between a simple solar collector accumulator and a conventional accumulator. Sol. Energy 2001, 71, 389–401. [Google Scholar] [CrossRef]
- Turski, M.; Nogaj, K.; Sekret, R. The use of a PCM heat accumulator to improve the efficiency of the district heating substation. Energy 2019, 187, 115885. [Google Scholar] [CrossRef]
- Dinker, A.; Agarwal, M.; Agarwal, G.D. Heat storage materials, geometry and applications: A review. J. Energy Inst. 2017, 90, 1–11. [Google Scholar] [CrossRef]


© 2020 by the authors. Licensee MDPI, Basel, Switzerland. This article is an open access article distributed under the terms and conditions of the Creative Commons Attribution (CC BY) license (http://creativecommons.org/licenses/by/4.0/).
Share and Cite
Kurpaska, S.; Knaga, J.; Latała, H.; Cupiał, M.; Konopacki, P.; Hołownicki, R. The Comparison of Different Types of Heat Accumulators and Benefits of Their Use in Horticulture. Sensors 2020, 20, 1417. https://0-doi-org.brum.beds.ac.uk/10.3390/s20051417
Kurpaska S, Knaga J, Latała H, Cupiał M, Konopacki P, Hołownicki R. The Comparison of Different Types of Heat Accumulators and Benefits of Their Use in Horticulture. Sensors. 2020; 20(5):1417. https://0-doi-org.brum.beds.ac.uk/10.3390/s20051417
Chicago/Turabian StyleKurpaska, Sławomir, Jarosław Knaga, Hubert Latała, Michał Cupiał, Paweł Konopacki, and Ryszard Hołownicki. 2020. "The Comparison of Different Types of Heat Accumulators and Benefits of Their Use in Horticulture" Sensors 20, no. 5: 1417. https://0-doi-org.brum.beds.ac.uk/10.3390/s20051417