Simulation of Tunnel Fire for Evacuation Safety Assessment

1
Department of Mechanical System Engineering, Nagoya University, Furo-cho, Chikusa-ku, Nagoya-shi, Aichi 464-8603, Japan
2
Department of Mechanical Engineering, Kagoshima University, 1-21-40, Korimoto, Kagoshima-shi, Kagoshima 890-065, Japan
*
Author to whom correspondence should be addressed.
Safety 2018, 4(2), 12; https://0-doi-org.brum.beds.ac.uk/10.3390/safety4020012
Submission received: 25 October 2017
/
Revised: 20 February 2018
/
Accepted: 15 March 2018
/
Published: 26 March 2018
Abstract
:When a fire breaks out in a tunnel, smoke diffuses widely in the direction of the ventilation airflow. As a result, the evacuation environment may not be sufficiently safe during a fire incident. When ventilation equipment in a tunnel is changed, the safety and economic efficiency of the new ventilation equipment must be evaluated in advance. However, it is dangerous and not financially feasible to undertake the verification of new ventilation equipment by performing a demonstration experiment owing to its cost and versatility. It is therefore useful for predicting an evacuation situation in which a fire breaks out in a tunnel by performing a numerical simulation and examining the evacuation safety of the tunnel. In this study, a tunnel fire was reproduced using the Fire Dynamics Simulator (FDS) fire simulation software. Moreover, an evacuation was simulated using the real-coded cellular automaton (RCA) method and the effects of the wind velocity and the number of evacuees in the tunnel on the evacuation time were examined.
1. Introduction
The occurrence of an accident or a fire inside a tunnel on an expressway can cause significant damage. Since traffic may be jammed in the tunnel as a result of the fire, the evacuation safety of the tunnel must be sufficiently evaluated [1,2,3,4,5,6,7,8,9,10]. Therefore, there have been various studies globally on tunnel safety. When a tunnel is to be extended or its internal structure drastically changed, the safety of the final structure should be evaluated before the design and execution of the changes [11,12]. Ventilation equipment is generally used in a tunnel, (a) to secure the tunnel environment, (b) to secure the evacuation environment in the event of a fire and (c) to preserve the atmospheric environment of the peripheral areas. In tunnels, a transverse ventilation system equipped with air supply and exhaust ducts installed below the ceiling panels is ubiquitously adopted in Japan. In 2012, the ceiling of the Chuo Expressway’s Sasago Tunnel collapsed and therefore the design of future ventilation systems, especially the handling of ceiling panels, must be reexamined. For example, the Central Nippon Expressway Company Limited inspects ceiling panels in tunnels and removes the ones showing a malfunction and is replacing the transverse ventilation system with a longitudinal ventilation system having jet fans.
In the event of a fire breaking out in a tunnel, smoke diffuses widely along the ventilation airflow in the tunnel. The evacuation environment may therefore be insufficiently secured [13]. When ventilation equipment in a tunnel is replaced, the safety and economic efficiency of the new ventilation equipment must be evaluated in advance [11]. However, it is unrealistic to verify the new ventilation equipment by performing a demonstration experiment owing to its cost and versatility. It is considered useful to predict an evacuation situation in which a fire breaks out in a tunnel by performing a numerical simulation and examining the safety of the tunnel [14,15,16].
In this study, a tunnel fire was reproduced using Fire Dynamics Simulator (FDS) Version 5.5.3 [17], which is a fire simulation software developed by the U. S. National Institute of Standards and Technology. So far, FDS has been applied to fire research and fire protection engineering, as well as in tunnel fire research [6,7,13,18]. It is one of the most widely used software packages for representing burning gases with hot smoke [19]. Moreover, an evacuation was simulated using the RCA method and the effects of the wind velocity and the number of evacuees in the tunnel on the evacuation time were examined.
2. Numerical Method
2.1. Simulation of Tunnel Fire by FDS
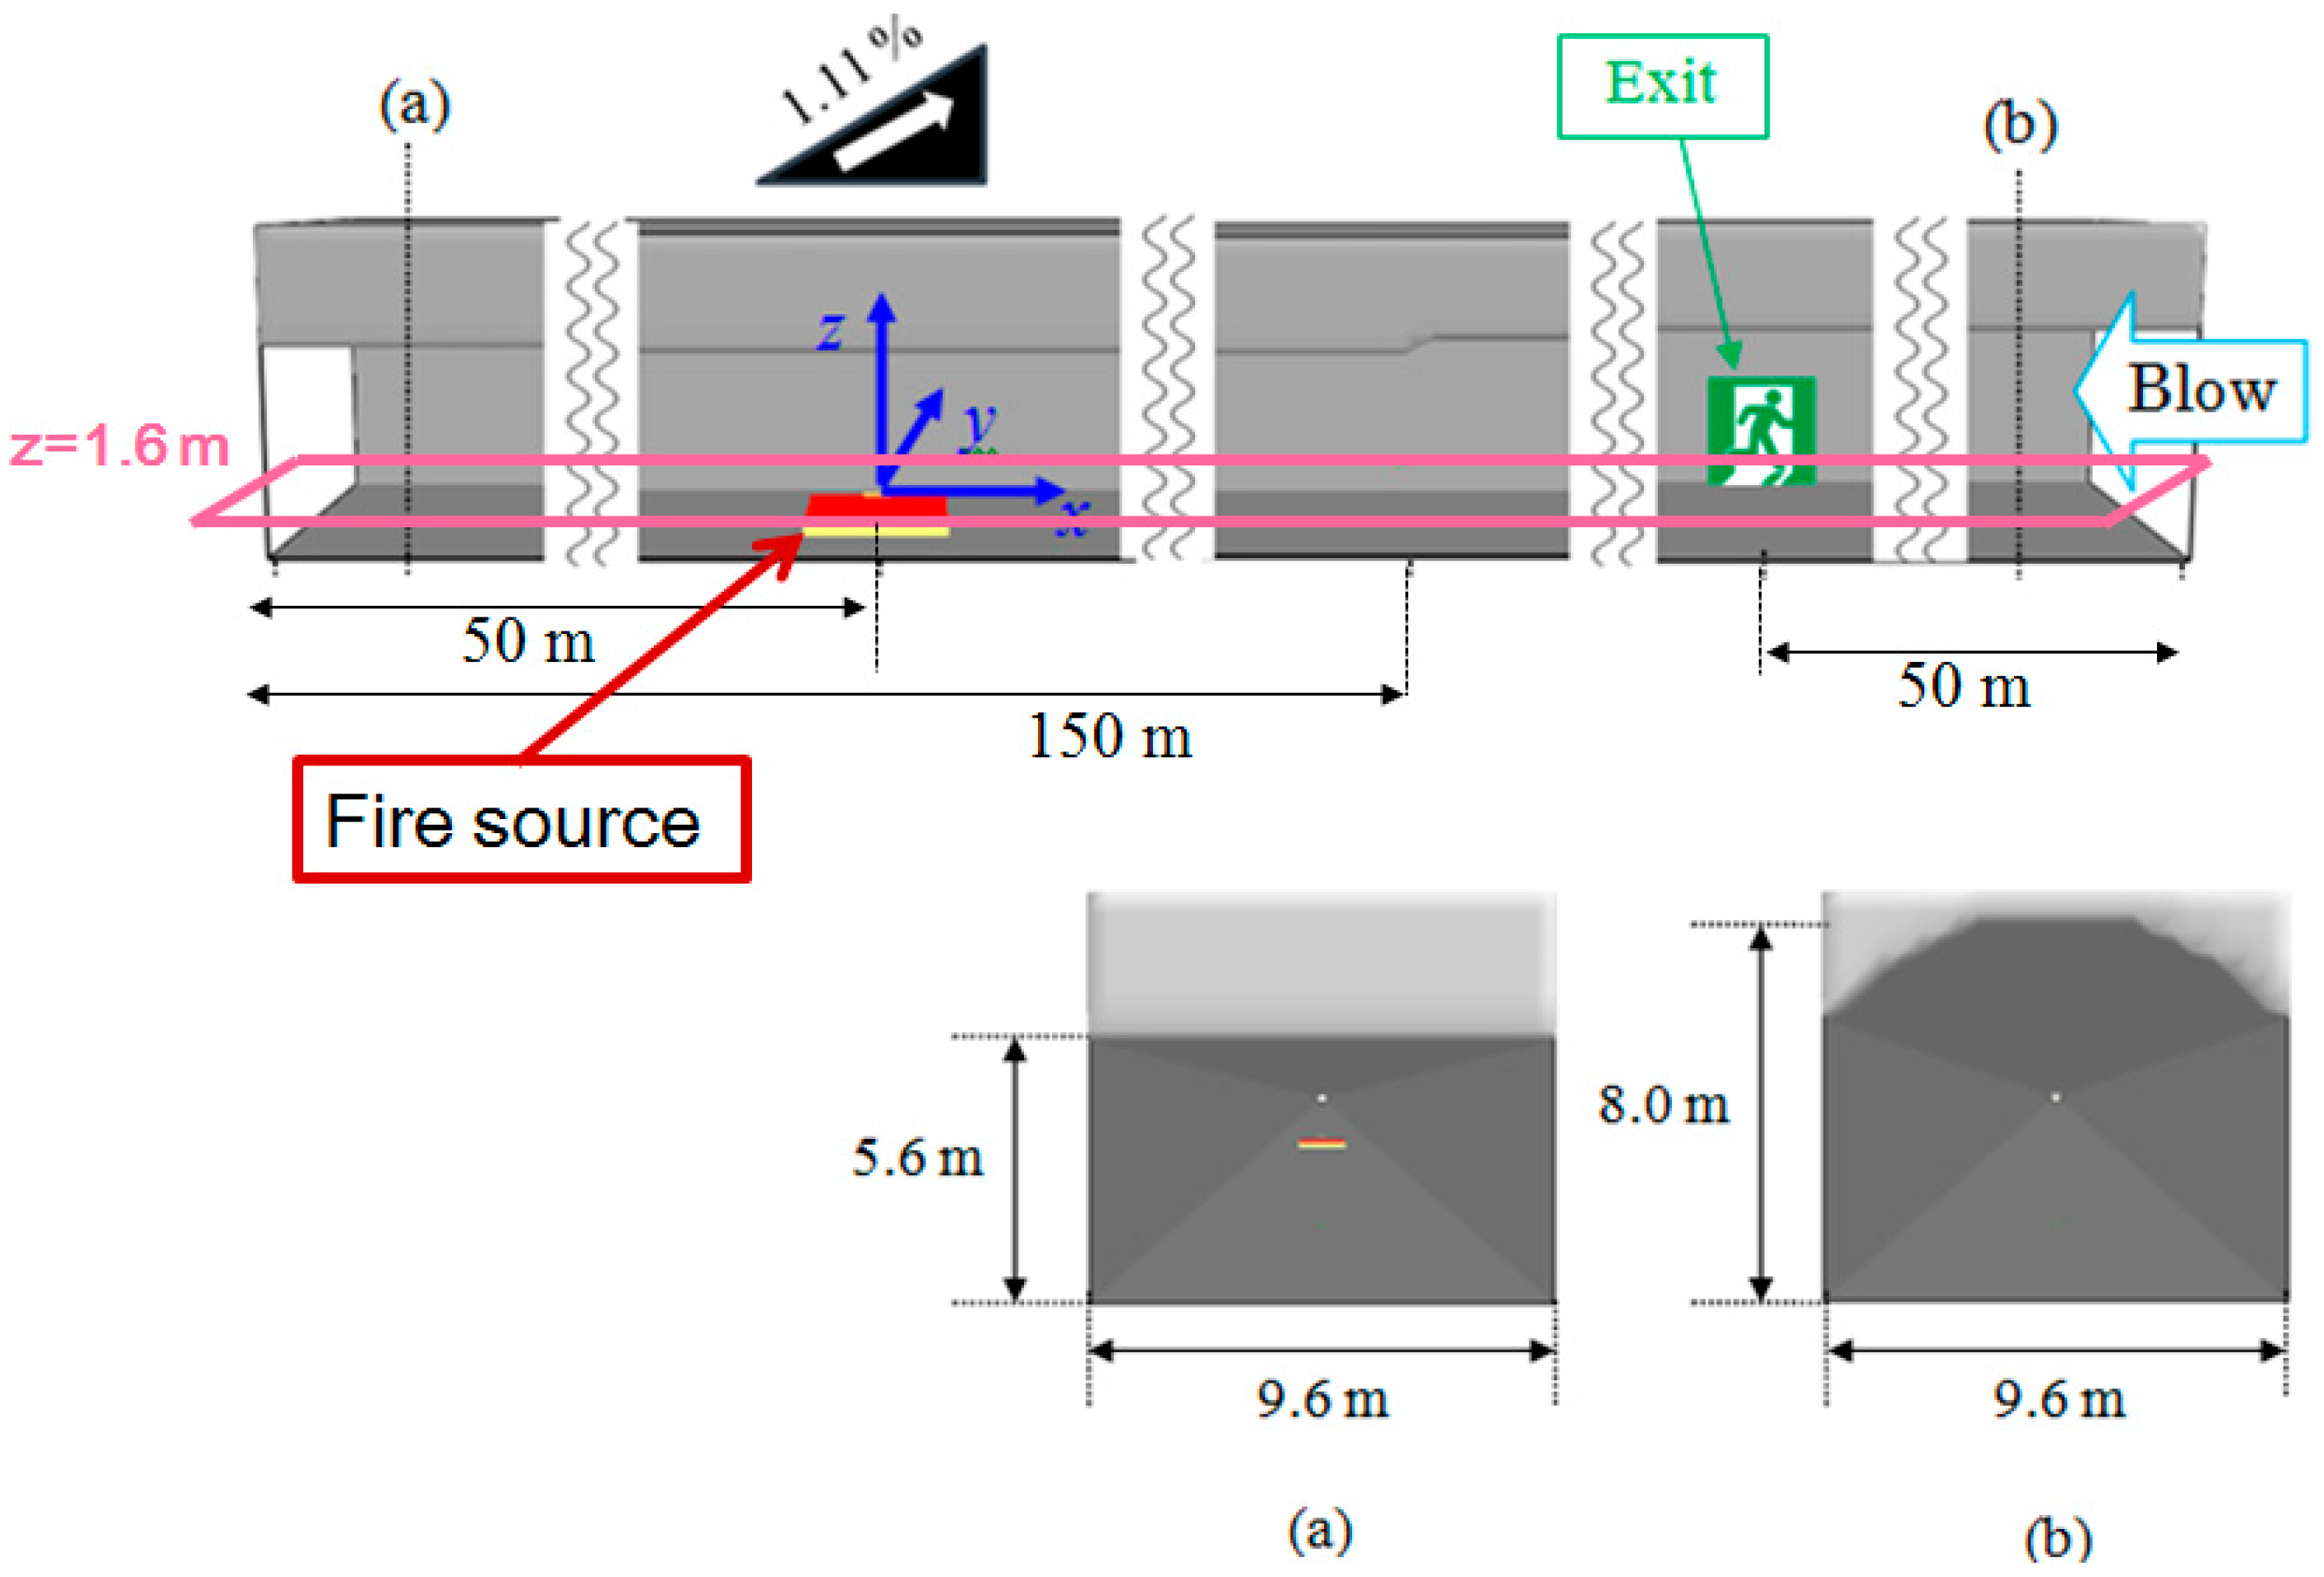
Figure 1 shows the analytical domain of the tunnel fire. In the coordinate system, the location at which the fire broke out was set as the origin, the direction toward the exit of the evacuation (the direction of evacuation) was set as the x axis, the direction perpendicular to the x axis was set as the y axis and the vertical direction was set as the z axis. The length of the tunnel to be examined was 700 m and an edge was assumed to exist on the ceiling of the tunnel 100 m away from the location at which the fire broke out (x = 100 m). At the edge of the ceiling, the transverse ventilation system equipped with the ventilation duct installed below the tunnel ceiling was changed to a longitudinal ventilation system that had a jet fan, which was installed after removing the ceiling panel. The shape of this tunnel was created by referring to the shape of an actual tunnel. As shown in Figure 1a, the shape of the cross section of the tunnel from its left edge to 150 m was rectangular (9.6 m wide × 5.4 m high). As shown in Figure 1b, the shape of the upper part of the tunnel from 150 m onward was semicircular (the cross-sectional area of the tunnel was 72 m2). Air exhaustion by an exhauster in the ventilation station was not taken into consideration. Instead, the transverse ventilation system was adopted. The edge of the ceiling was simply created in this study. Based on an actual tunnel, a rising gradient at 1.11% was set in the x direction.
In this study, it was assumed that there was no traffic jam around the region at which the fire broke out and that the smoke flowed from the location at which the fire broke out to the exit (forward smoke control). For comparison, a case in which there was no ventilation in the tunnel was defined as Case 1; a case in which there was ventilation with a uniform flow of constant velocity from the cross section at one side of the tunnel (x = 650 m) was defined as Case 2; and a case in which there was ventilation by a 1.2 m2 jet fan installed under the ceiling at x = 650 m was defined as Case 3. To make the uniform flow equal to the flow of the jet fan, the velocities of the uniform flow were set at 0.5 and 1.0 m/s in Cases 2-1 and 2-2, respectively and the velocities of the flow of the jet fan were set at 12.5 and 25 m/s in Cases 3-1 and 3-2, respectively. These cases are summarized in Table 1. As shown in this table, the average cross-sectional flow velocities of Cases 3-1 and 3-2 were set to be equal to those of Cases 2-1 and 2-2, respectively.
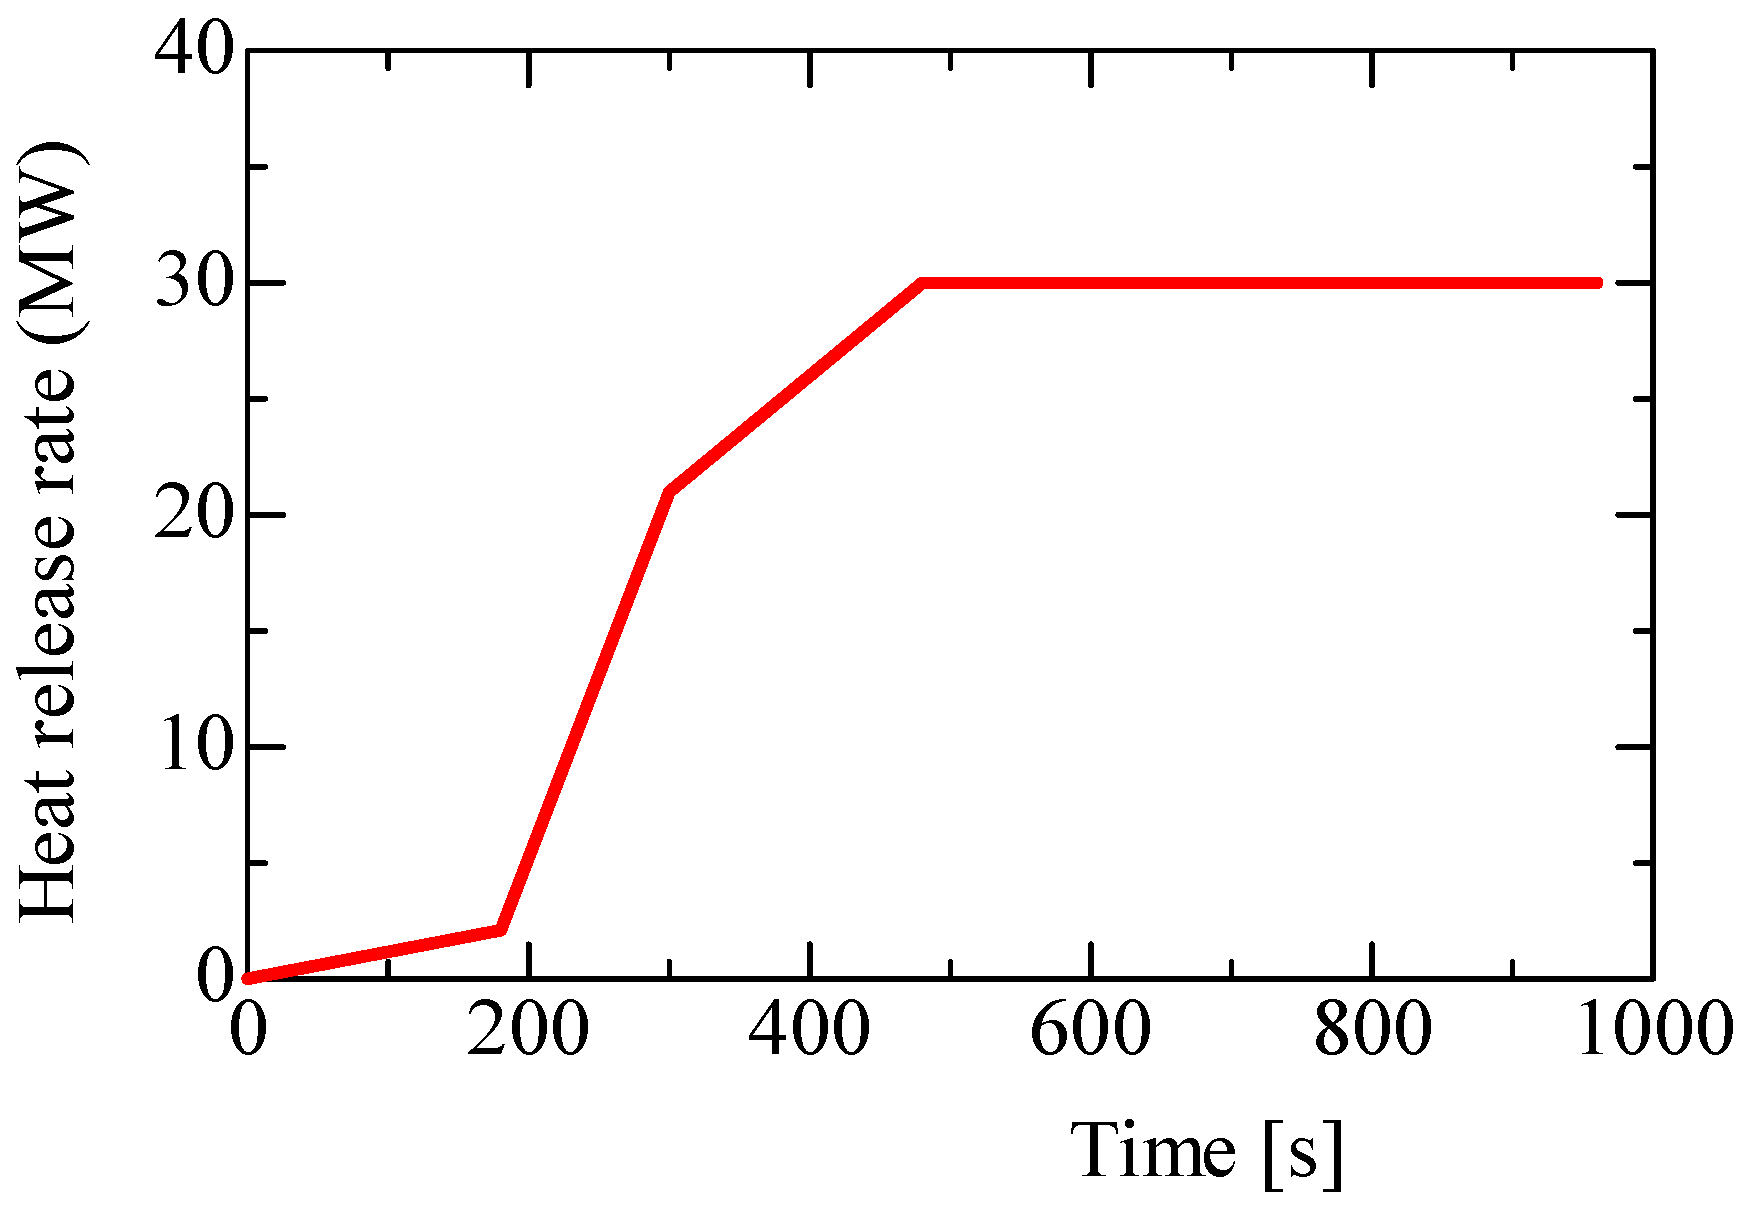
In the simulation, an accident was assumed to occur in which a fire broke out from a large-sized bus. Therefore, 480 L of diesel oil was placed on a 4 m2 floor, which was the source of fire. The calorific value of diesel oil is 44,400 kJ/kg [20] and the time-variation of the heat release rate was given, as shown in Figure 2. The fire was assumed to break out at time t = 0 s and the maximum value of the heat release rate was set at 30 MW. Smoke is generated when diesel oil is pyrolyzed. The amount of generated smoke was set at 17.9% (mass ratio) of the pyrolysis gas [13]. As for the spatial grid in the numerical domain, the uniform mesh with the size of 40 cm was adopted, which was equivalent to the average human shoulder width [14,15,16].
Table 2 shows a scenario in which a fire broke out. An evacuation situation was examined based on this scenario. As noted above, the fire was assumed to break out from a large-sized bus, which caused a traffic accident at t = 0 s. Evacuees in the tunnel were assumed to recognize the fire 120 s after the fire broke out (t = 120 s). Simultaneously, ventilation equipment in the tunnel began to operate. Approximately 240 s after the fire broke out (t = 240 s), the last evacuee was assumed to get off the bus and approach the exit.
2.2. Evacuation Model by RCA
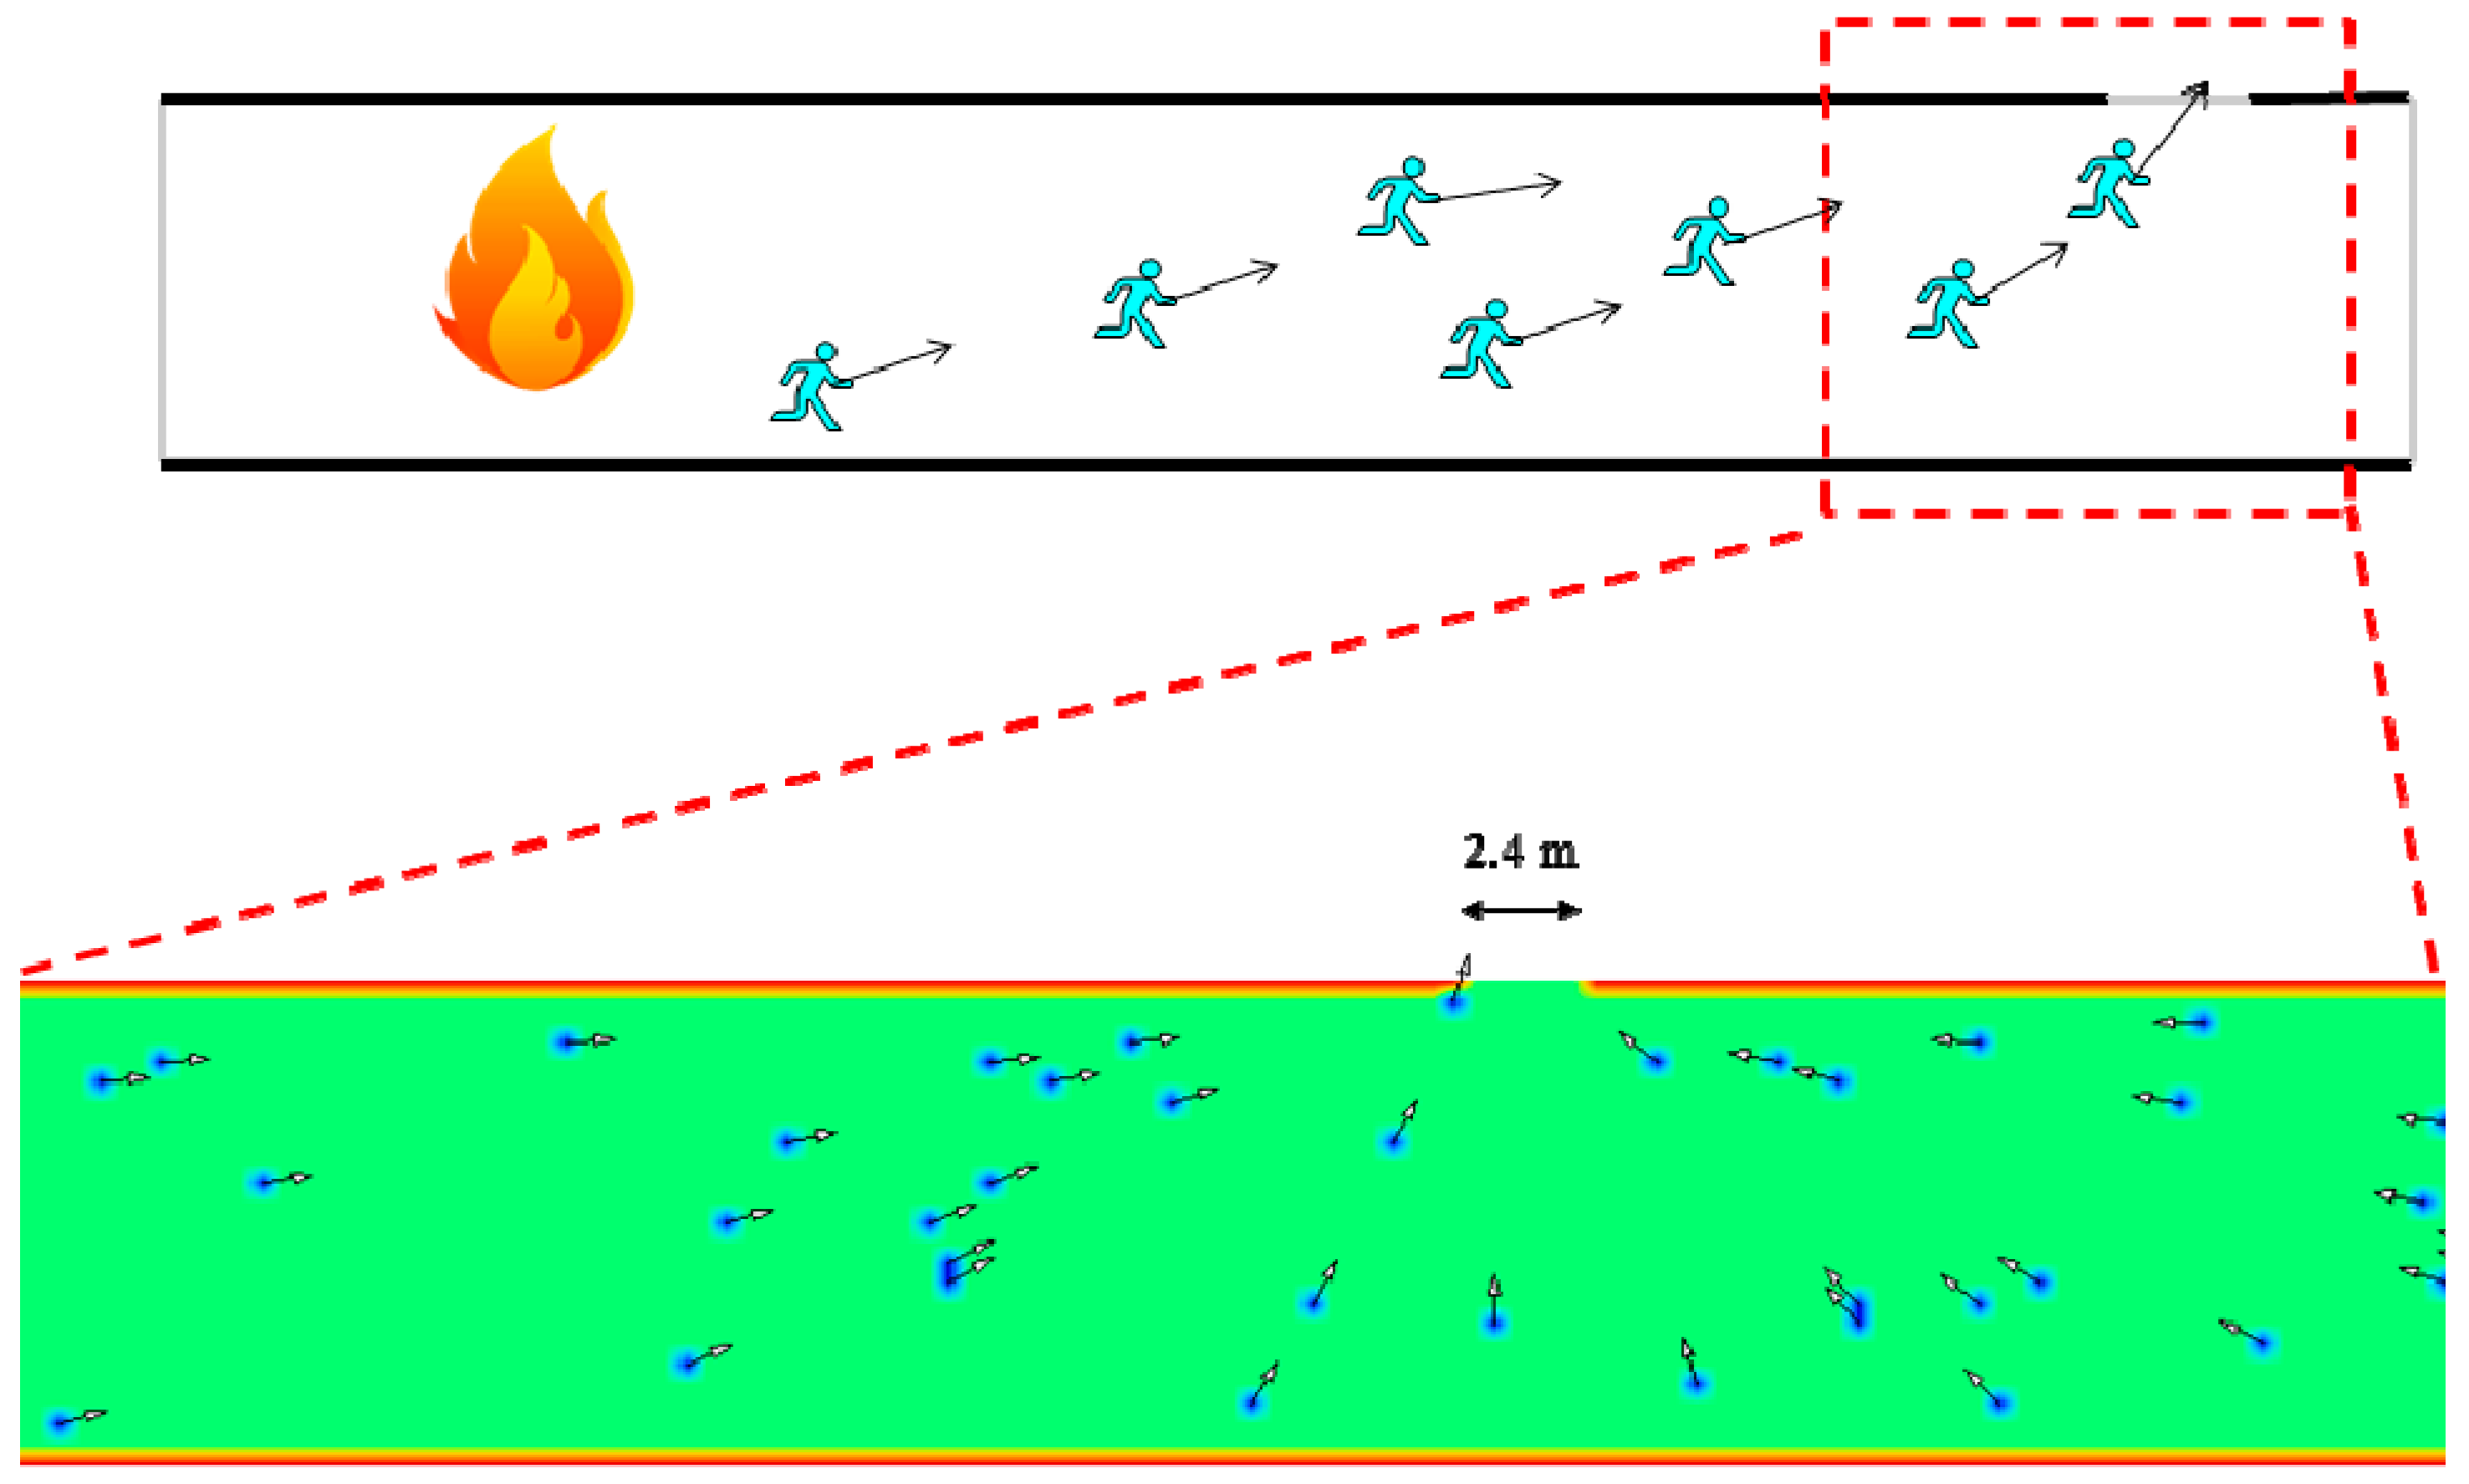
Figure 3 shows the calculation domain of the evacuation simulation. By using the results of the fire simulation obtained with the FDS, the region of smoke 1.6 m above the ground (z = 1.6 m) shown in Figure 1 was used for a two-dimensional evacuation simulation. An exit was located on the tunnel wall 600 m away from the ignition source and the width of the exit was set at W = 2.4 m. The jet fan was installed below the ceiling at x = 650 m (the right edge of the tunnel). The initial locations of evacuees in the tunnel were given using random numbers produced by the FORTRAN library. At this time, at least one evacuee was allocated at the furthest possible place from the exit, near the location at which the fire broke out.
As already explained in Table 2, the time when the fire broke out was set to 0 s, the ventilation equipment in the tunnel began to operate 120 s after the fire broke out and evacuees began to reach the exit 240 s after the fire broke out. It is reported that the average walking speed in the smoke-free part of the tunnel is 1.6 m/s [21]. By considering the stagnant vehicles in the tunnel, we set the evacuees’ velocity toward the exit to be 1.0 m/s [6,7,8]. Since the evacuees moved through smoke, a model of deceleration due to smoke was used. It is known that high-temperature smoke causes simultaneous reductions in visual information and physiological function [22], resulting in a reduction in the moving speed of evacuees. Therefore, the moving speed of evacuees in the region of smoke was set to 0.5 m/s. This speed was equivalent to the walking speed when the smoke density Cs was 0.4 1/m. The smoke density Cs (1/m) was calculated from the soot concentration using the following Formula (1) [23,24]:
where M represents the mass concentration of soot (kg/m3) obtained using the FDS. The region of smoke was defined as an area 1.6 m above the ground, in which Cs exceeded 0.4 1/m [24]. In this study, the evacuation simulation was performed five times and the evacuation times were averaged. Moreover, the number of evacuees initially allocated in the tunnel (N) was changed and an average evacuation time was obtained. Based on this, the effect of N on the evacuation time (TE) was examined. The effect of the wind velocity in the tunnel on the evacuation time was also examined (see Table 1).
Cs = 104·M: Cs < 2.5 (1/m)
Cs = 1.73ln(103·M) + 4.94: Cs ≥ 2.5 (1/m)
Cs = 1.73ln(103·M) + 4.94: Cs ≥ 2.5 (1/m)
3. Results and Discussion
3.1. Dynamics of Tunnel Fire without Ventilation System
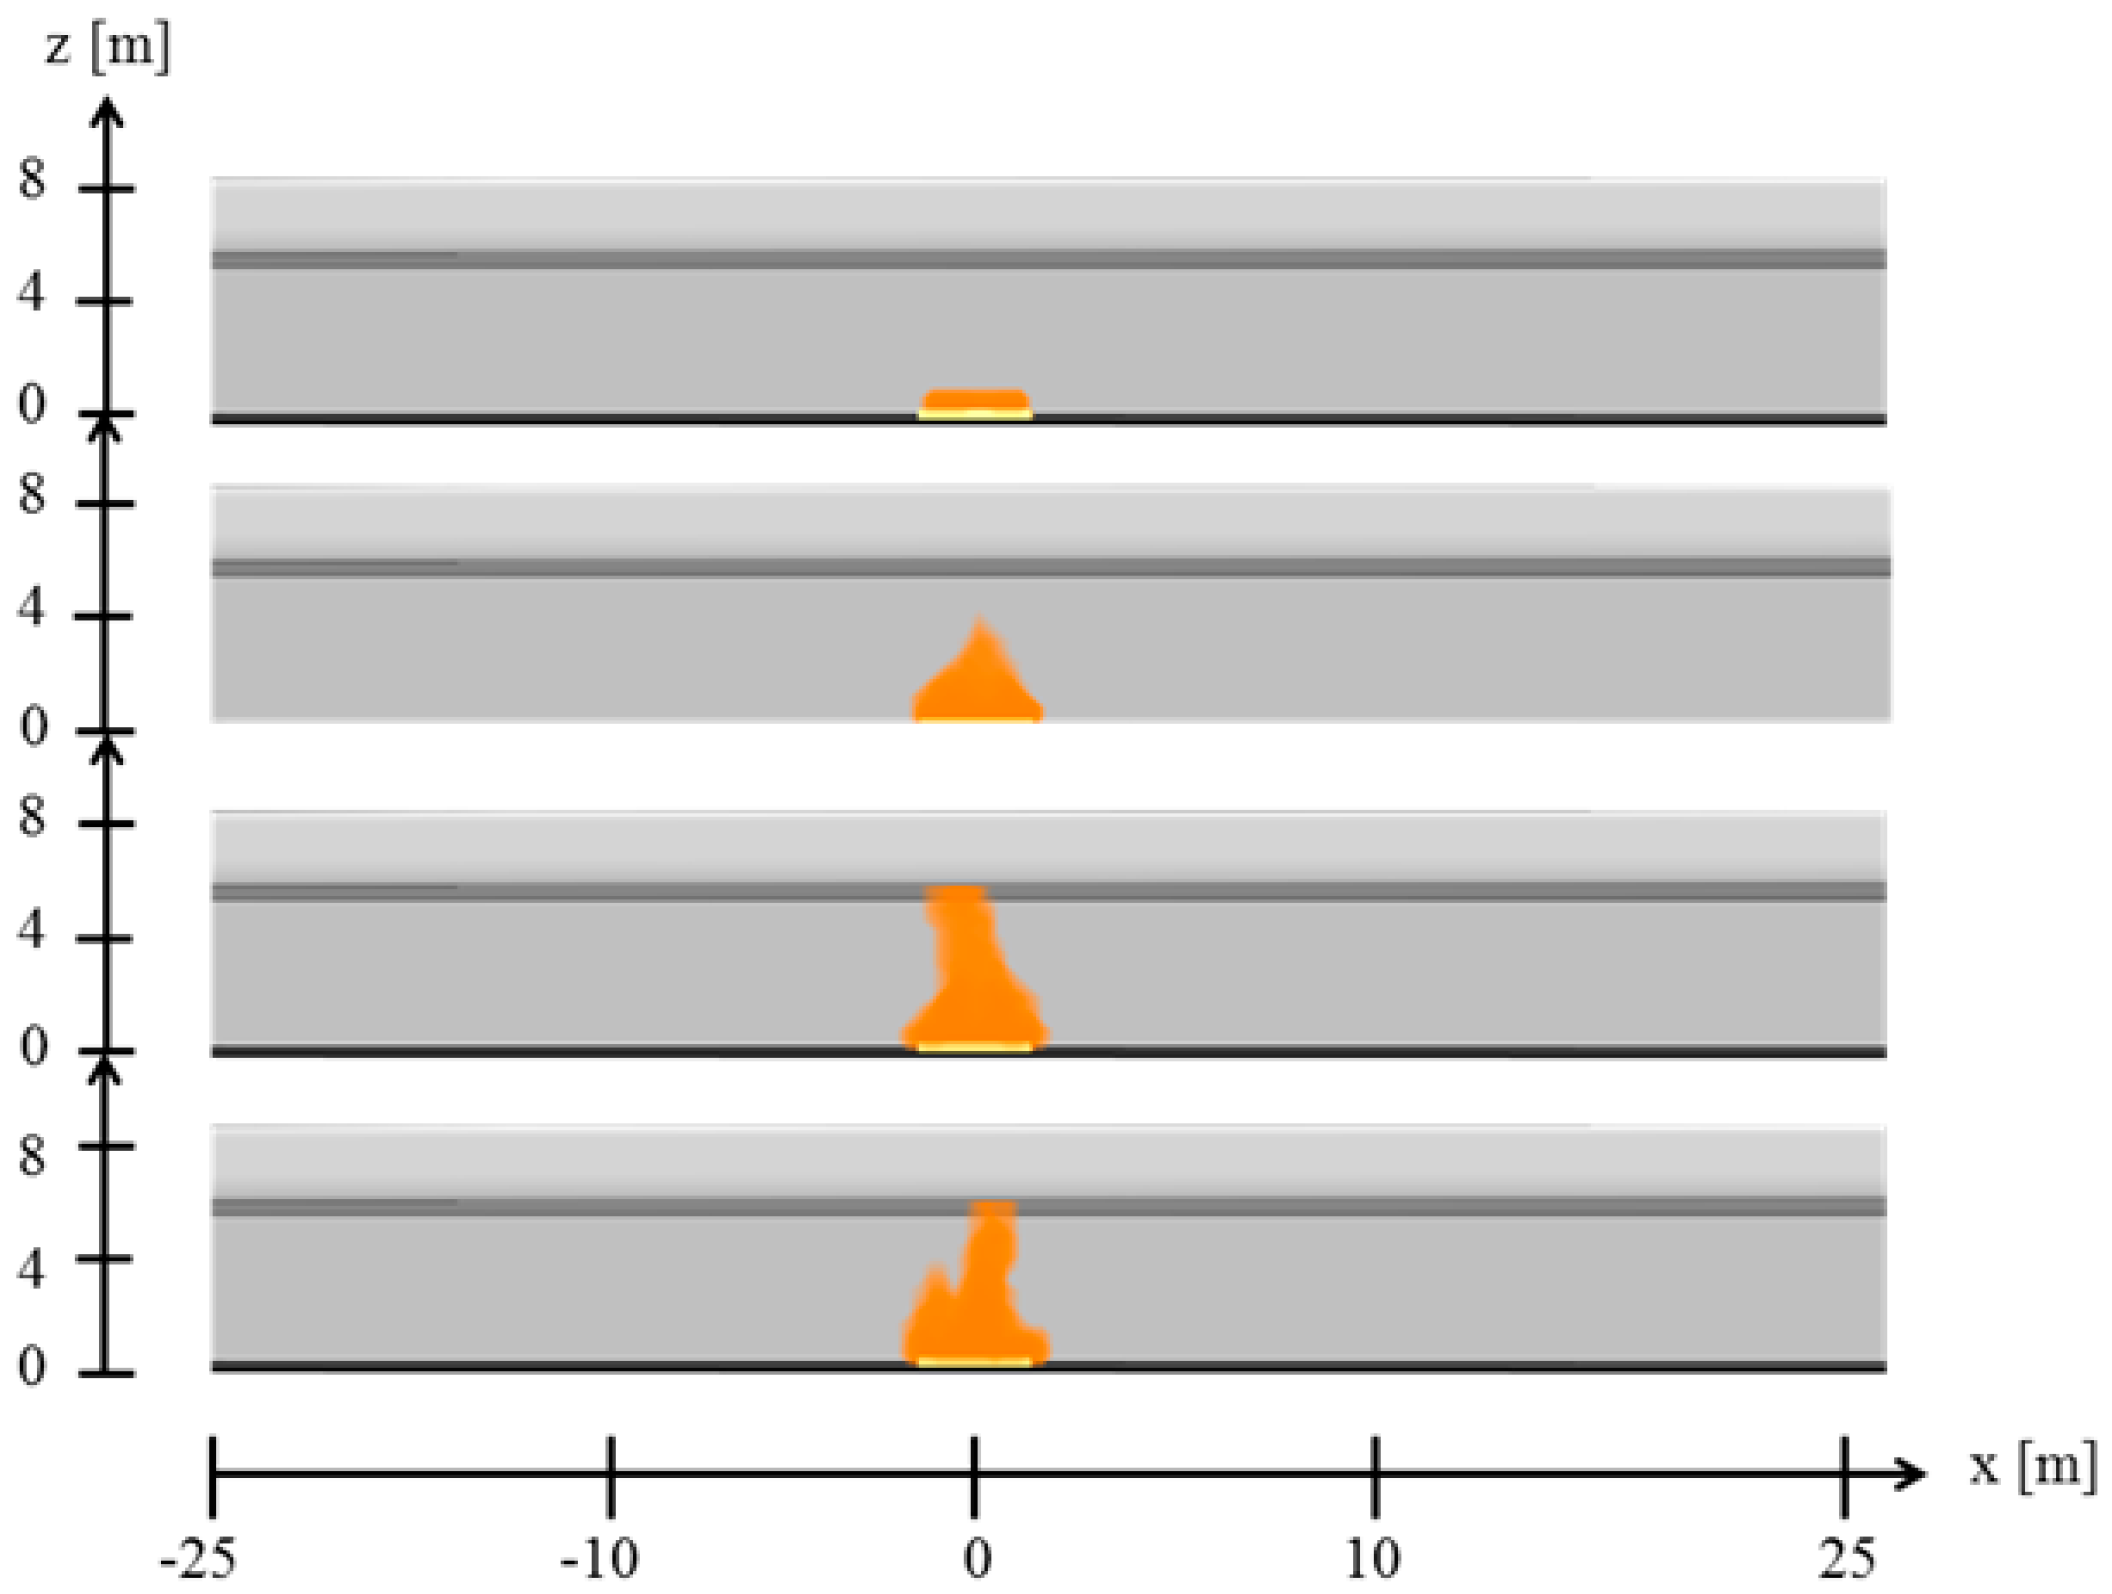
To investigate the tunnel fire when the jet fan was not operated, the smoke distributions and the heat release rates generated in Case 1 were visualized. Figure 4 shows the temporal expansion of smoke near the ignition source. This figure shows only the region in which the fire spread in the tunnel. At t = 120 and 240 s, a small amount of smoke was generated. At t = 480 s, the amount of smoke generated greatly increased. At t = 720 s, the entire tunnel was filled with smoke. Figure 5 shows the growth of the fire. In this figure, a region in which the heat release rate exceeded 50 kW/m3 was defined as the combustion region. Although the combustion region grew with time in an upward direction, an exothermic reaction mainly occurred above the fuel where the fire broke out. Unlike the behavior of smoke shown in Figure 4, the combustion region, in which the heat release rate exhibited a large value, did not spread throughout the entire tunnel.
When a fire breaks out in a tunnel, smoke spreads at a speed that exceeds the moving speed of evacuees and permeates the tunnel. Therefore, the smoke density greatly affects the behavior of evacuees. In particular, when smoke permeates a tunnel, the walking speed of evacuees markedly decreases. Hence, it is important to understand the distribution of smoke in a tunnel. In this study, the distribution of the optical density of smoke (Cs) was visualized. In addition, the obtained results were summarized while paying attention to Cs at 0.4 1/m, at which evacuees have difficulty walking.
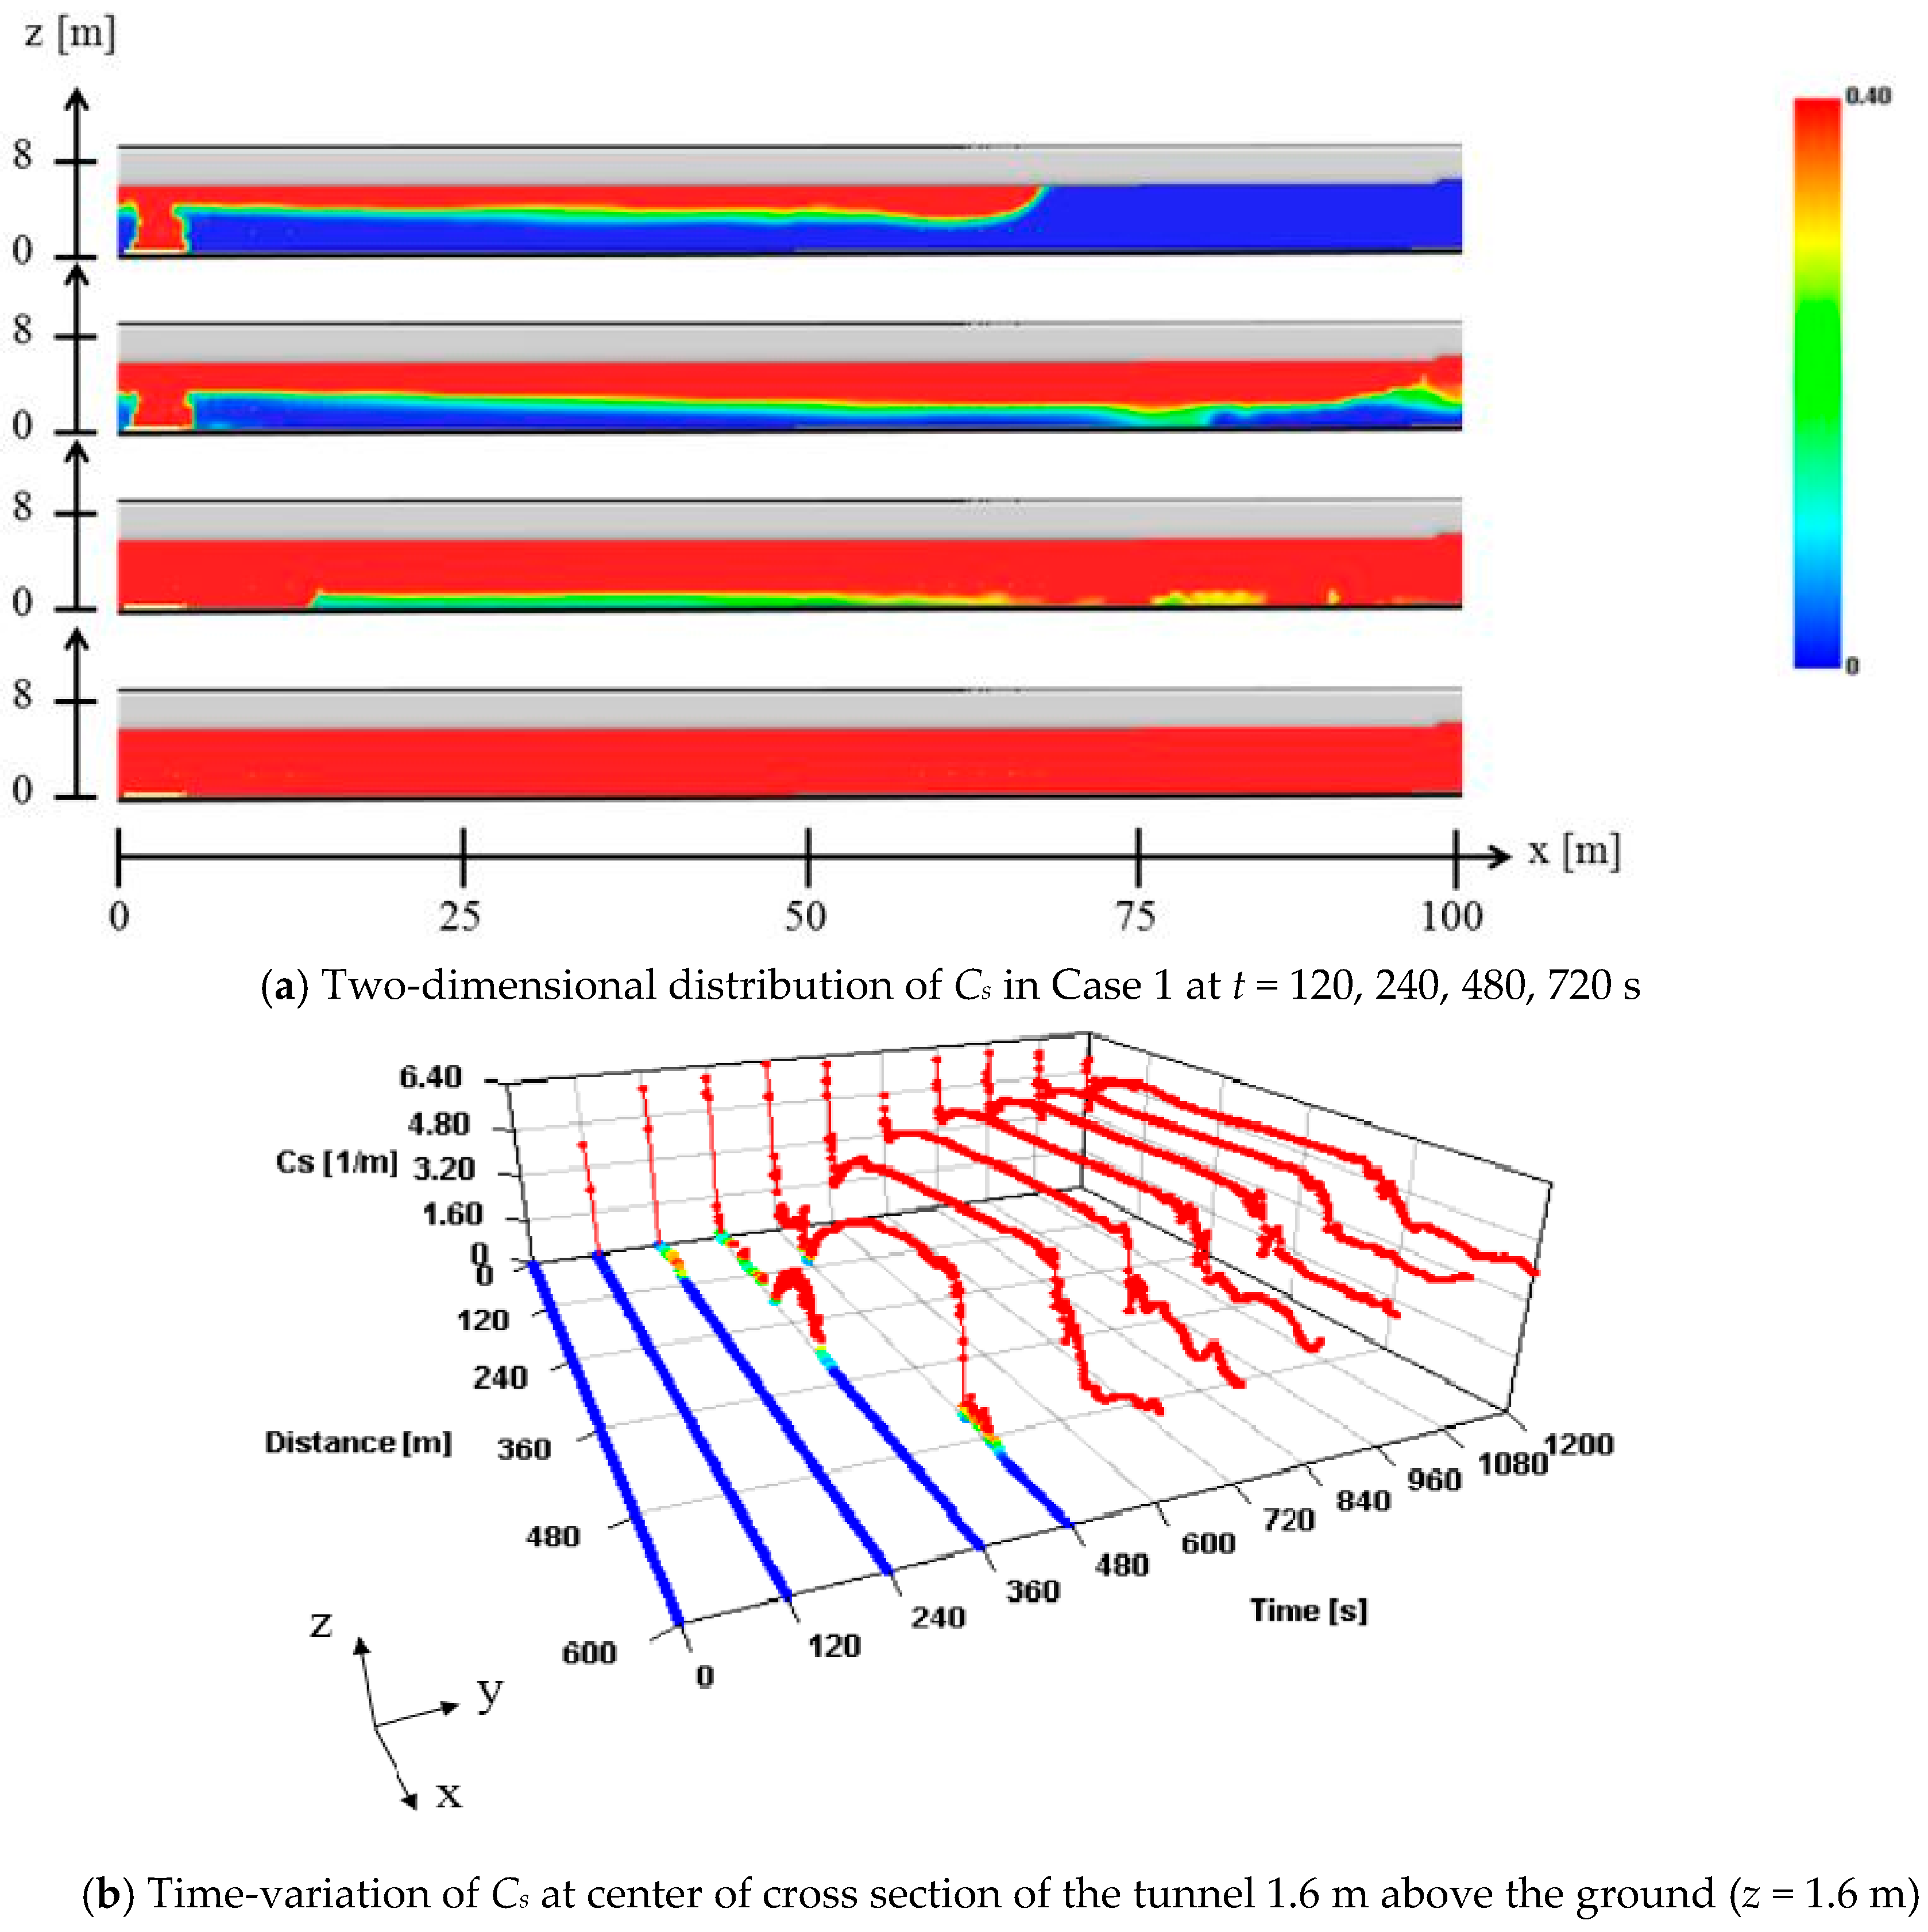
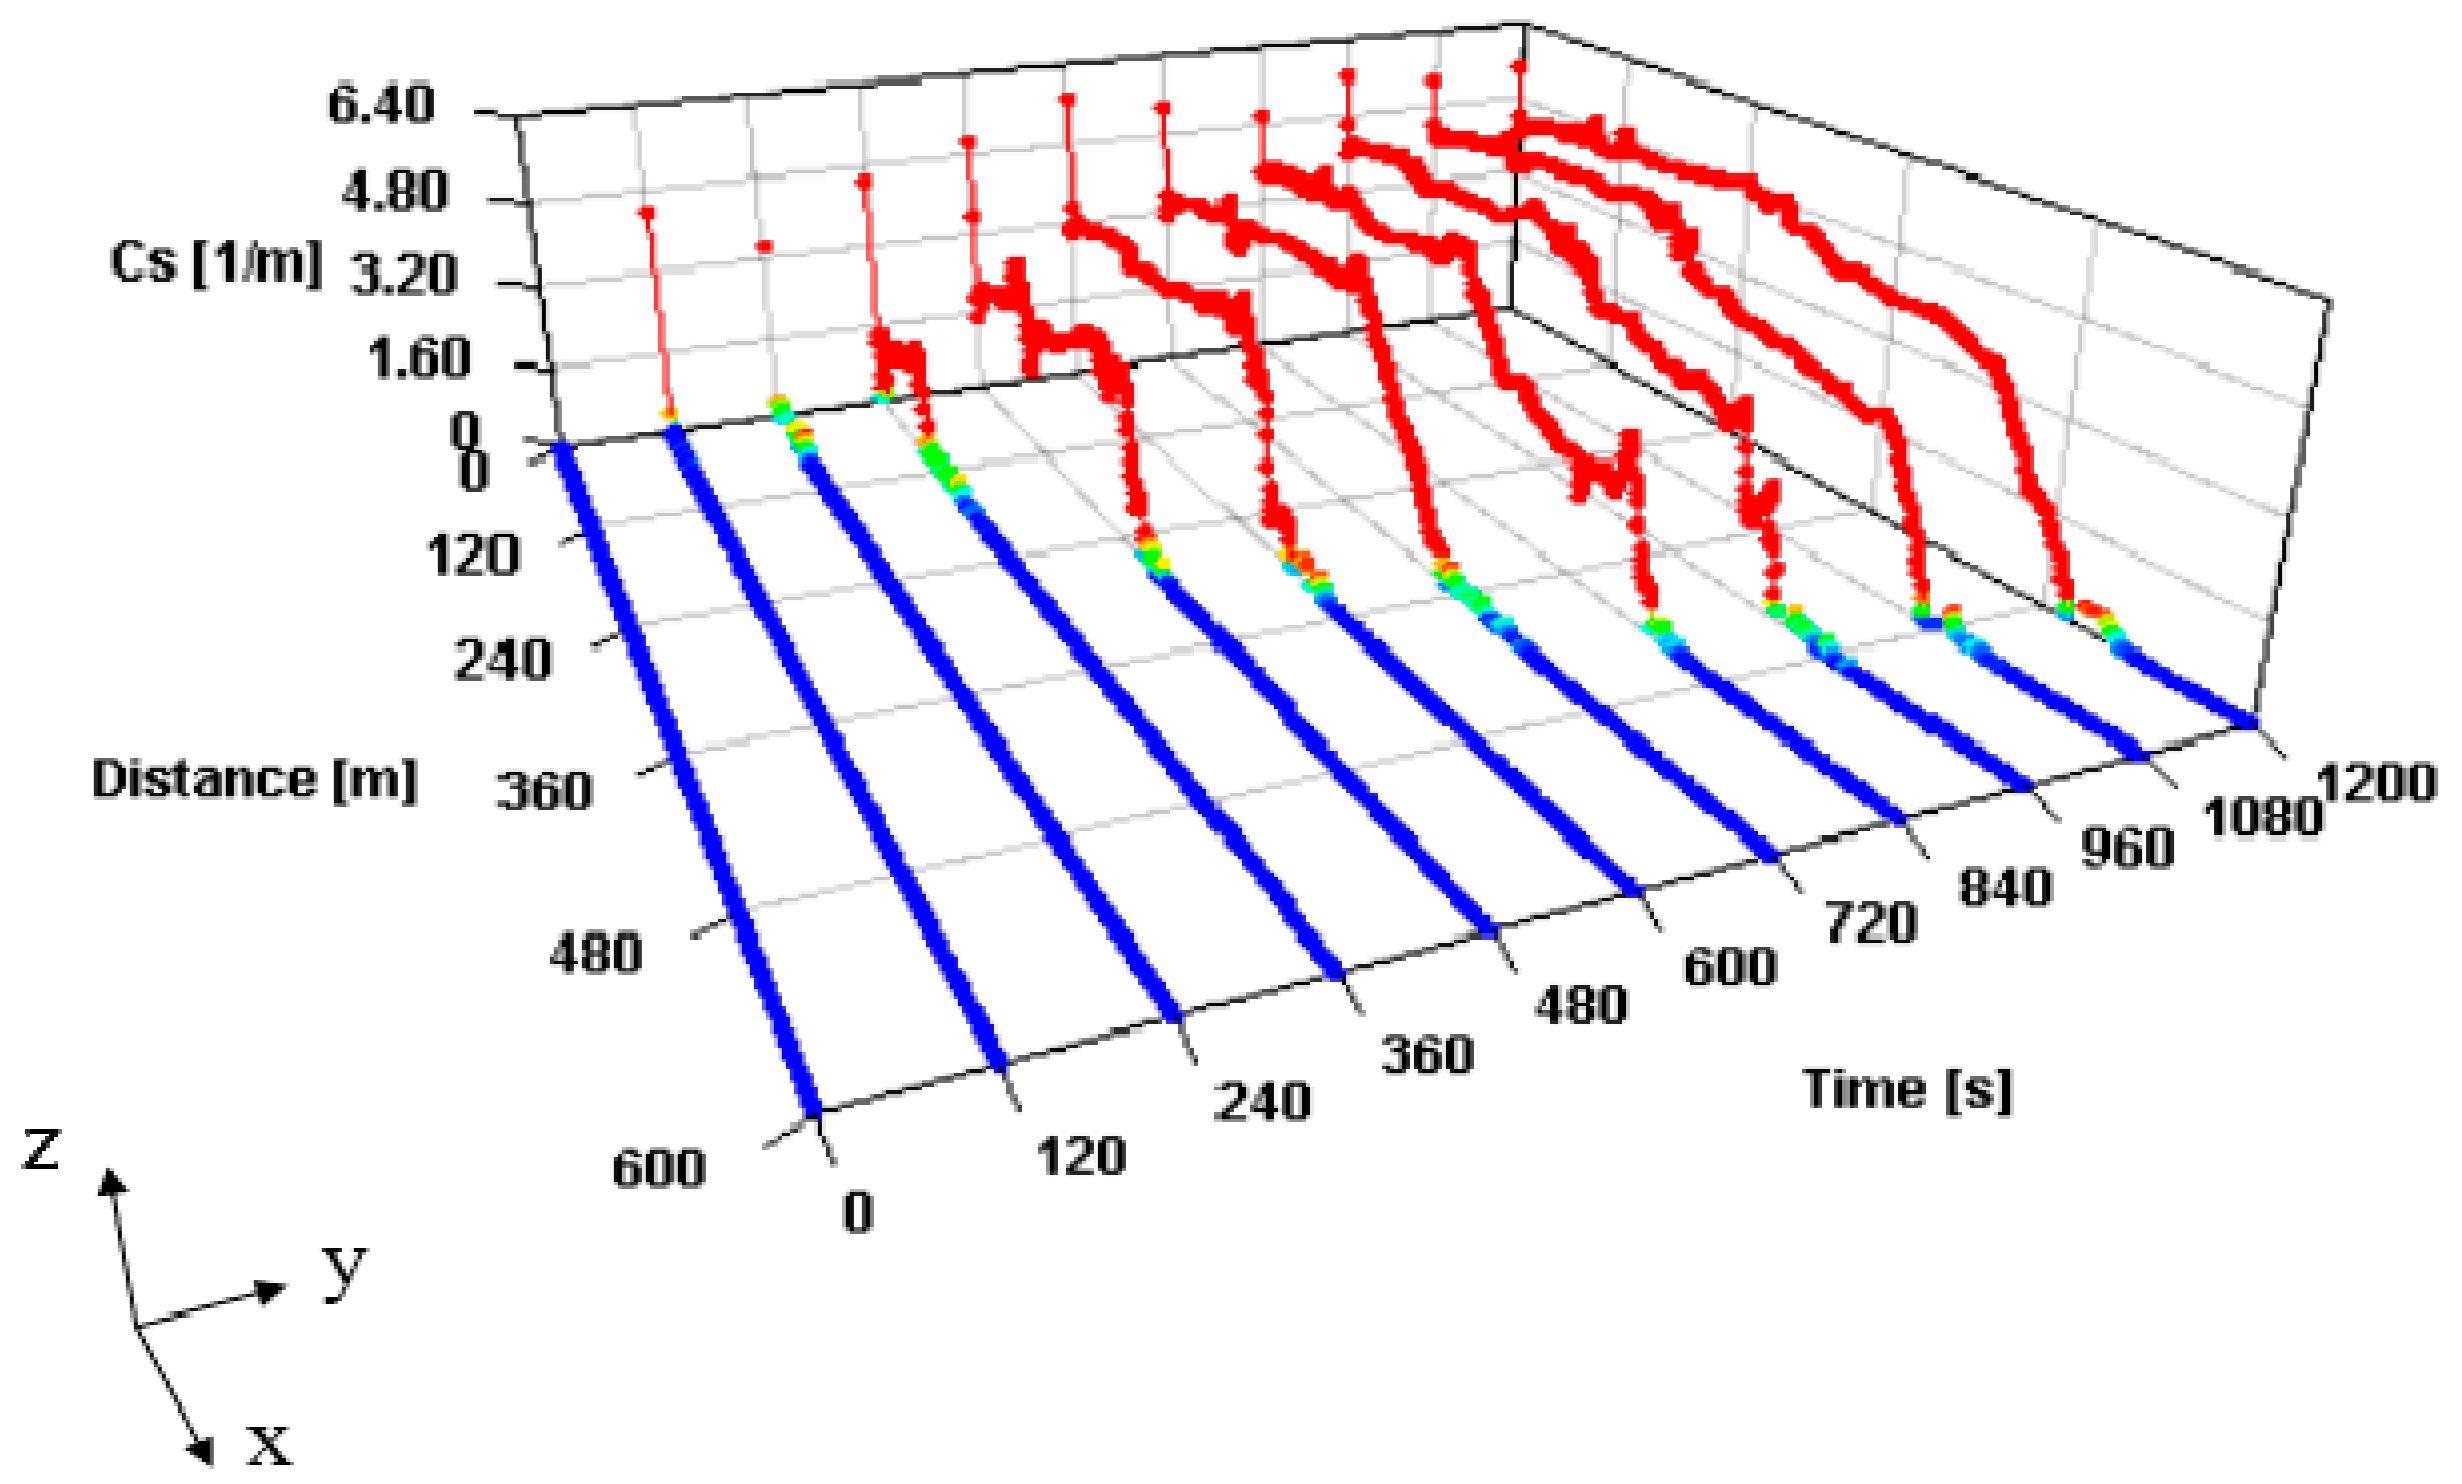
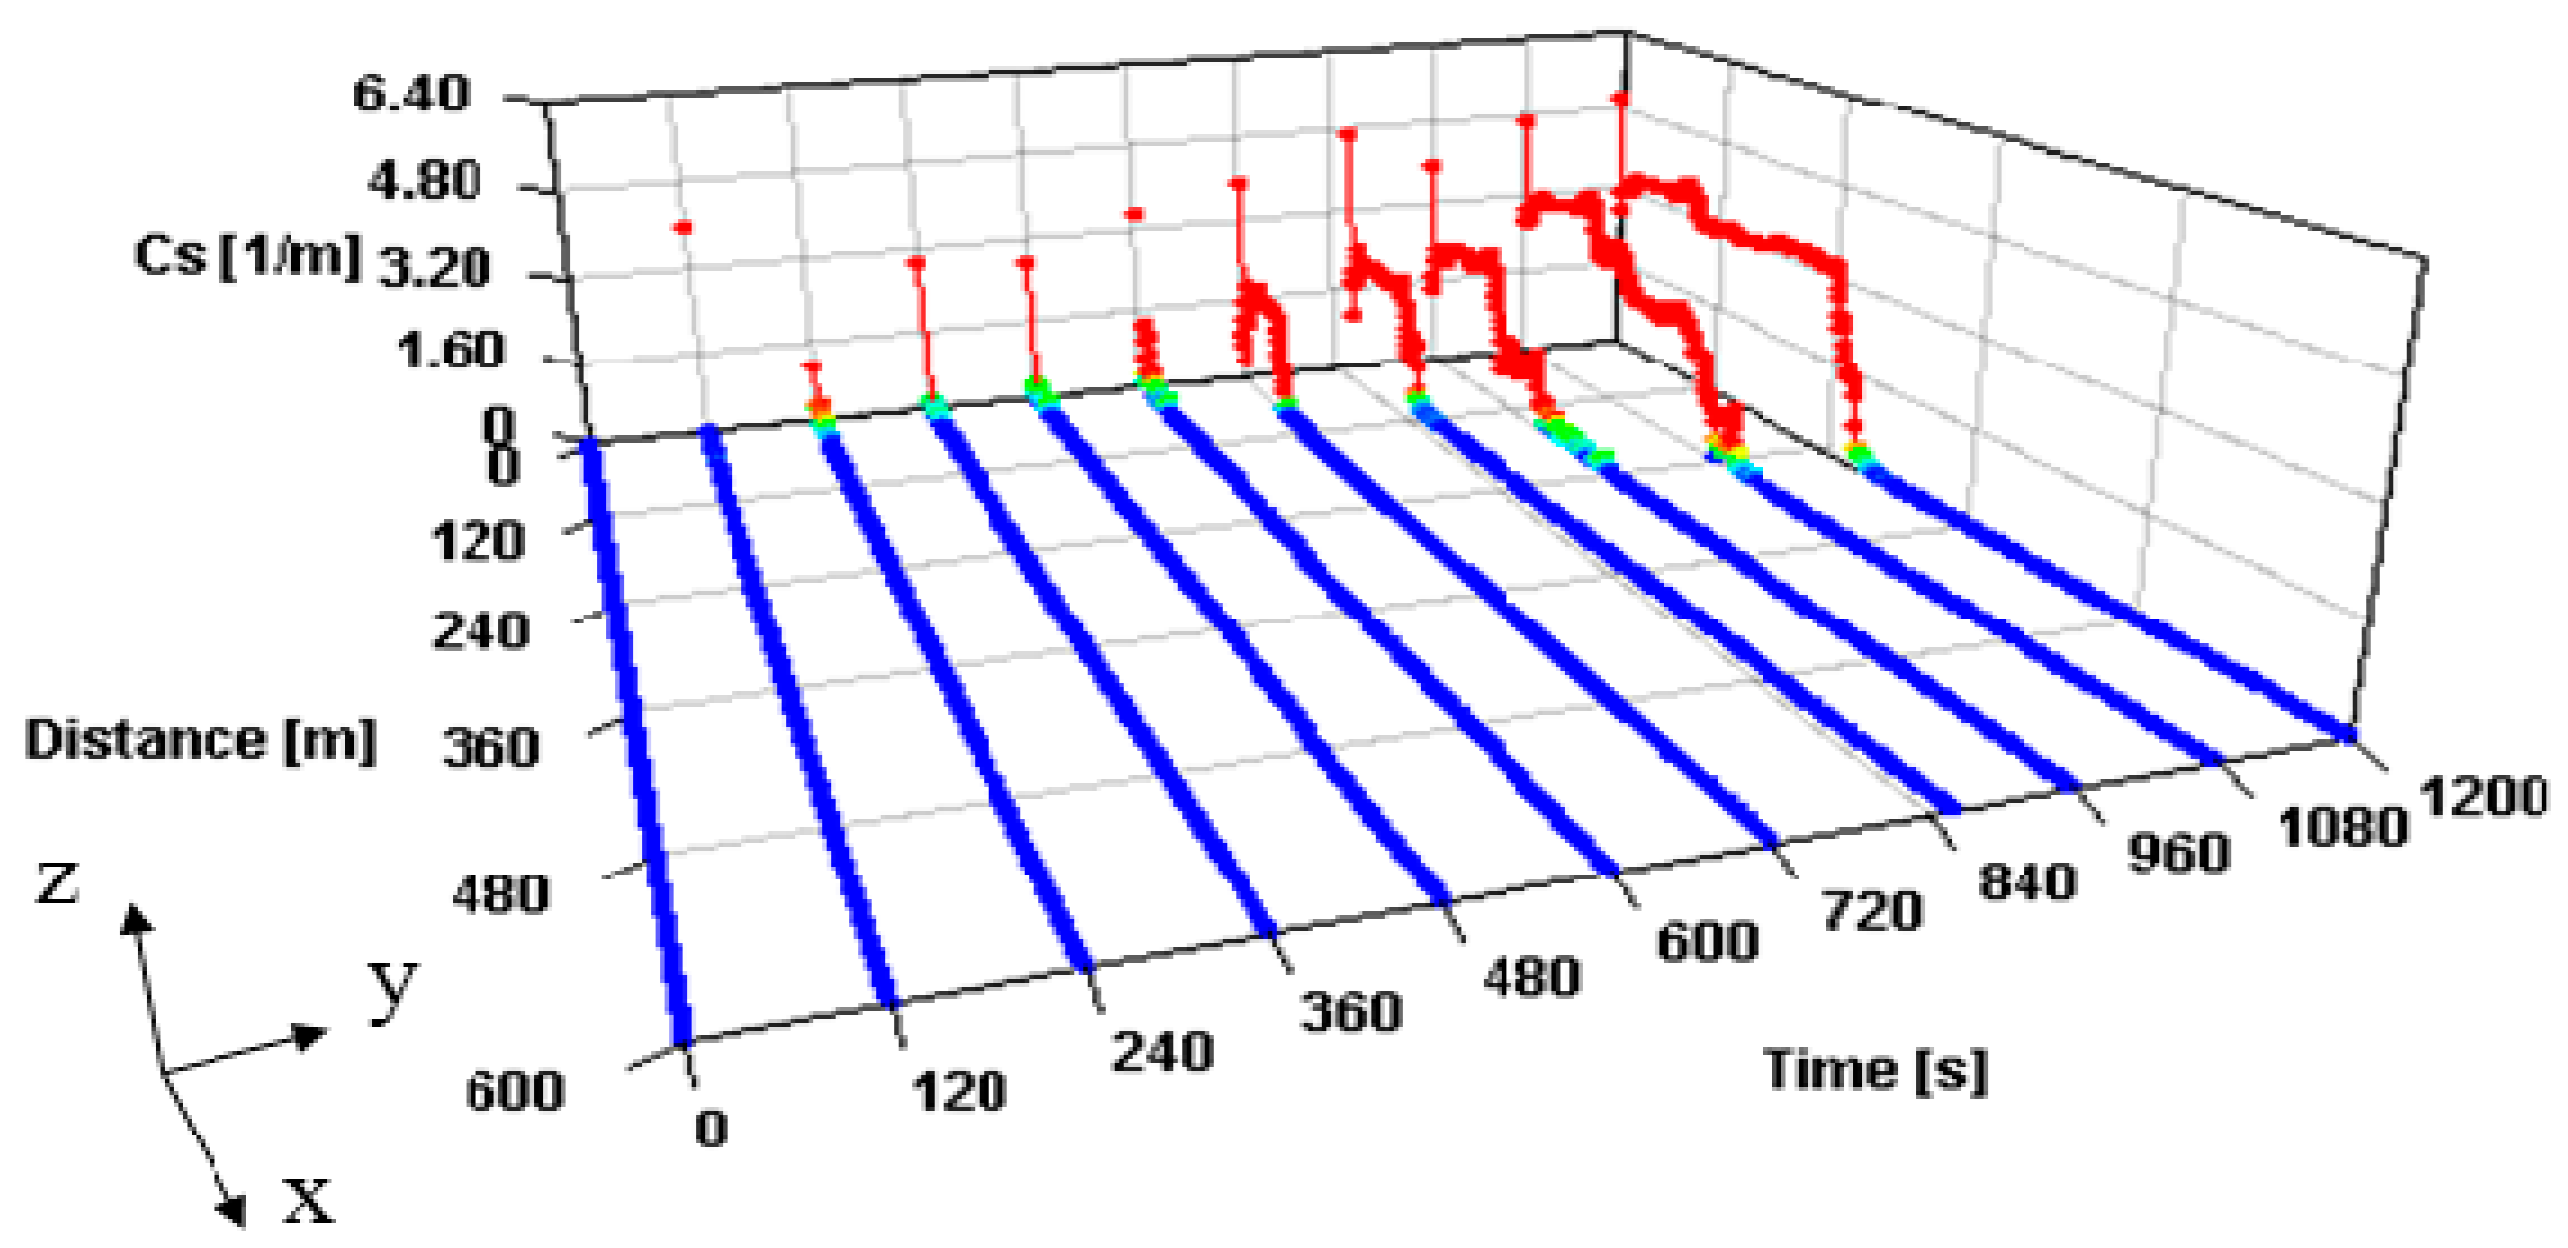
Figure 6a shows the two-dimensional distribution of Cs in Case 1, in which no ventilation was performed in the tunnel. As shown in this figure, smoke gradually spread from the location at which the fire broke out. At x = 100 m, there was the edge of the ceiling, which changed the cross section of the tunnel. Therefore, the speed increased on the left part of the tunnel. The edge increased the vorticity at that location and consequently streamed the smoke to the bottom of the tunnel. At higher average air speeds, this smoke was quickly removed downwind (see Section 3.2). Figure 6b shows the temporal development of Cs at the center of the cross section of the tunnel 1.6 m above the ground (z = 1.6 m) in Case 1. This figure indicates the temporal change in Cs from x = 0 m, where the fire broke out, to x = 600 m, where the fire exit existed. At 1.6 m above the ground, after 360 s, smoke began to fall from the ceiling. After 480 s, smoke permeated approximately half of the tunnel.
3.2. Dynamics of Tunnel Fire with Ventilation System
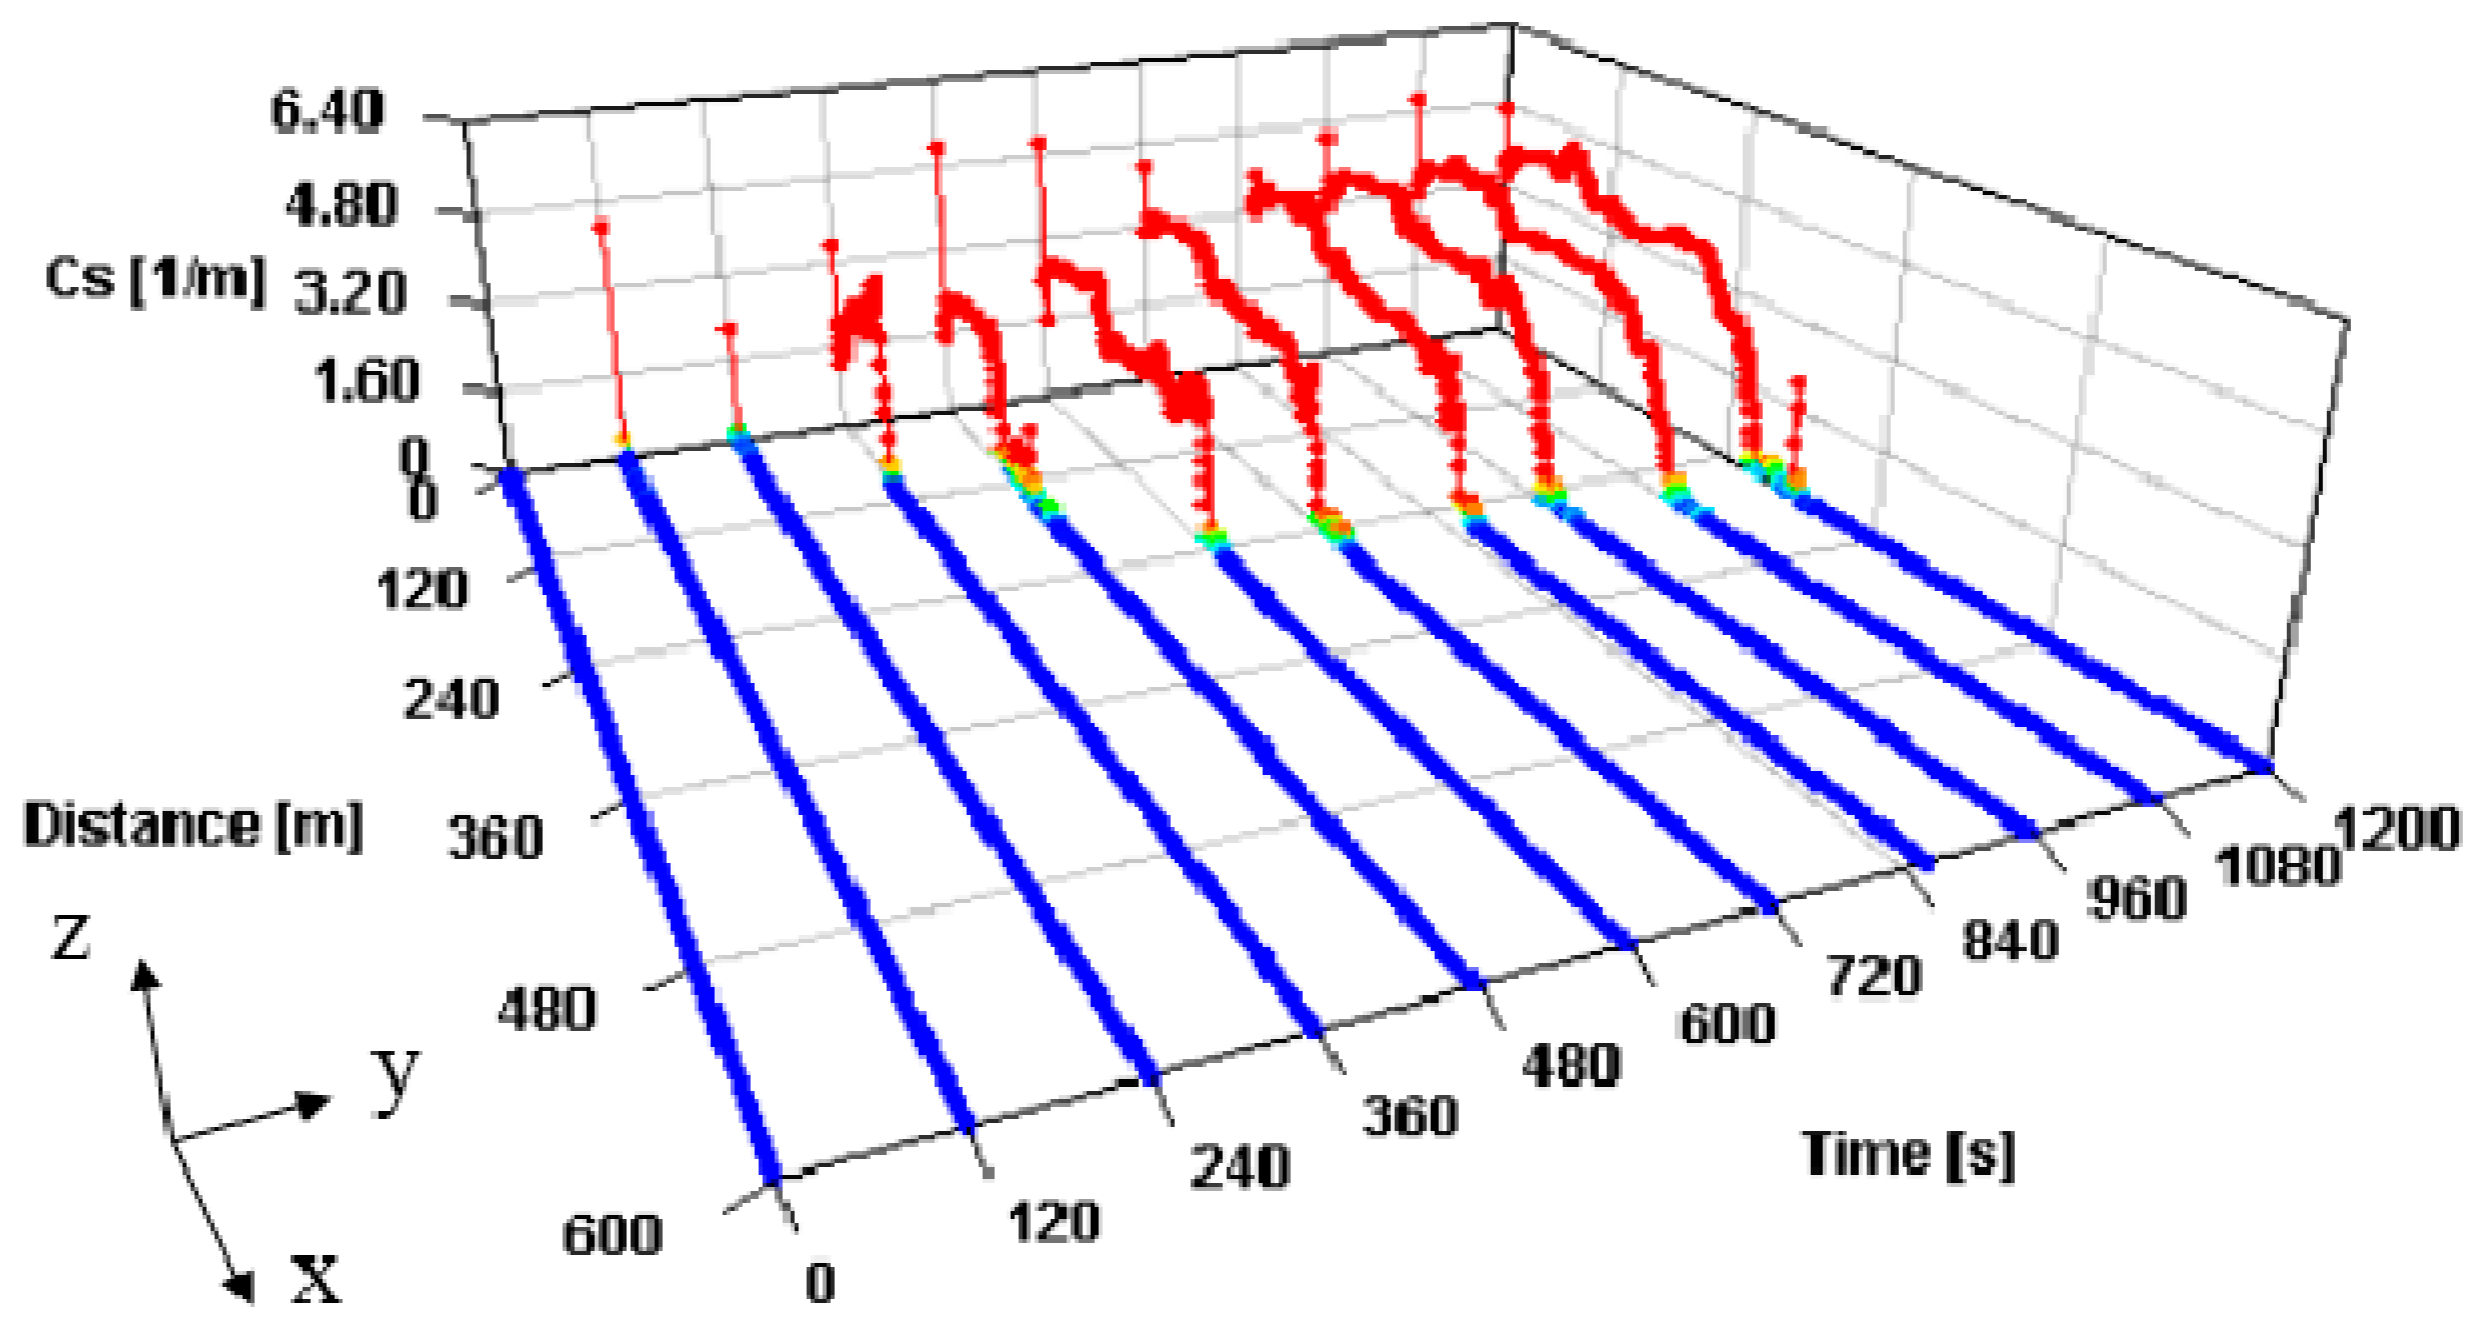
Next, the results obtained by performing ventilation are described. Figure 7 shows the two-dimensional distribution of Cs in Case 2-1, in which uniform ventilation was performed at the cross section of the tunnel. Forward smoke control, by which smoke flowed in the forward direction, began at t = 120 s. At t = 240 s, the progress of the smoke could be controlled more than in Case 1. That is, the progress of the smoke could be slowed and the calculation domain could be prevented from being filled with smoke. Figure 8 shows the two-dimensional distribution of Cs in Case 2-2, in which the wind velocity was larger than that in Case 2-1 with the same uniform ventilation. Owing to the ventilation equipment, which began to operate at t = 120 s, smoke flowed backward from t = 120 s to t = 240 s. As shown in this figure, the progress of the smoke could be controlled further by increasing the wind velocity of the ventilation equipment when compared with Figure 7 in Case 2-1.
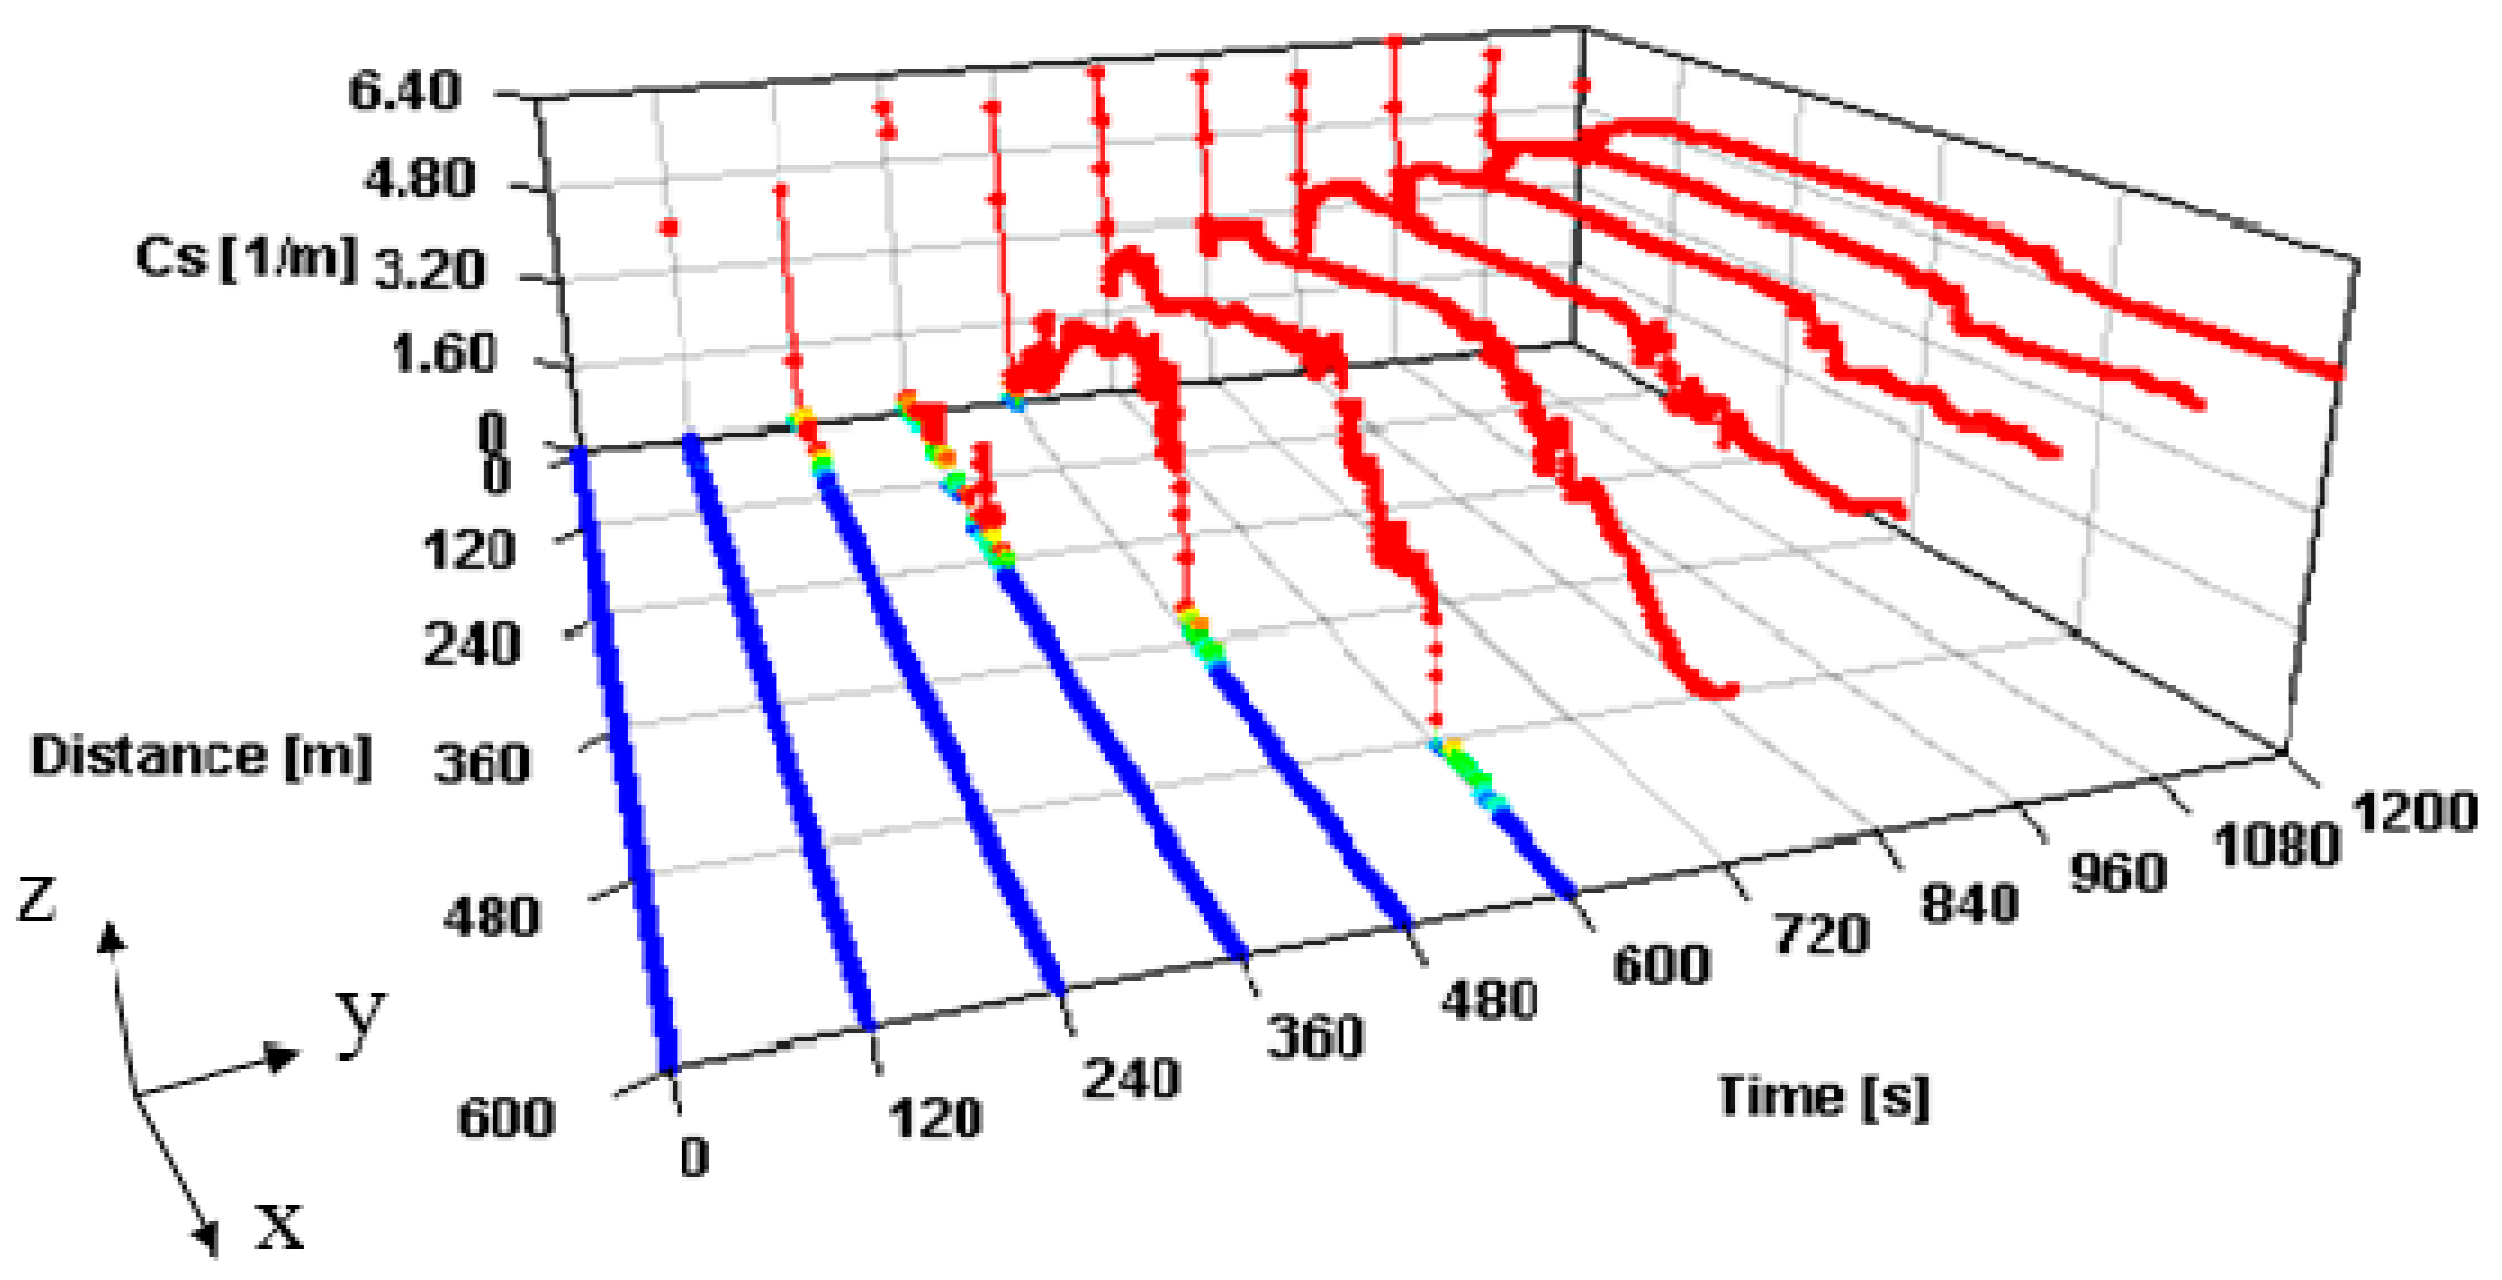
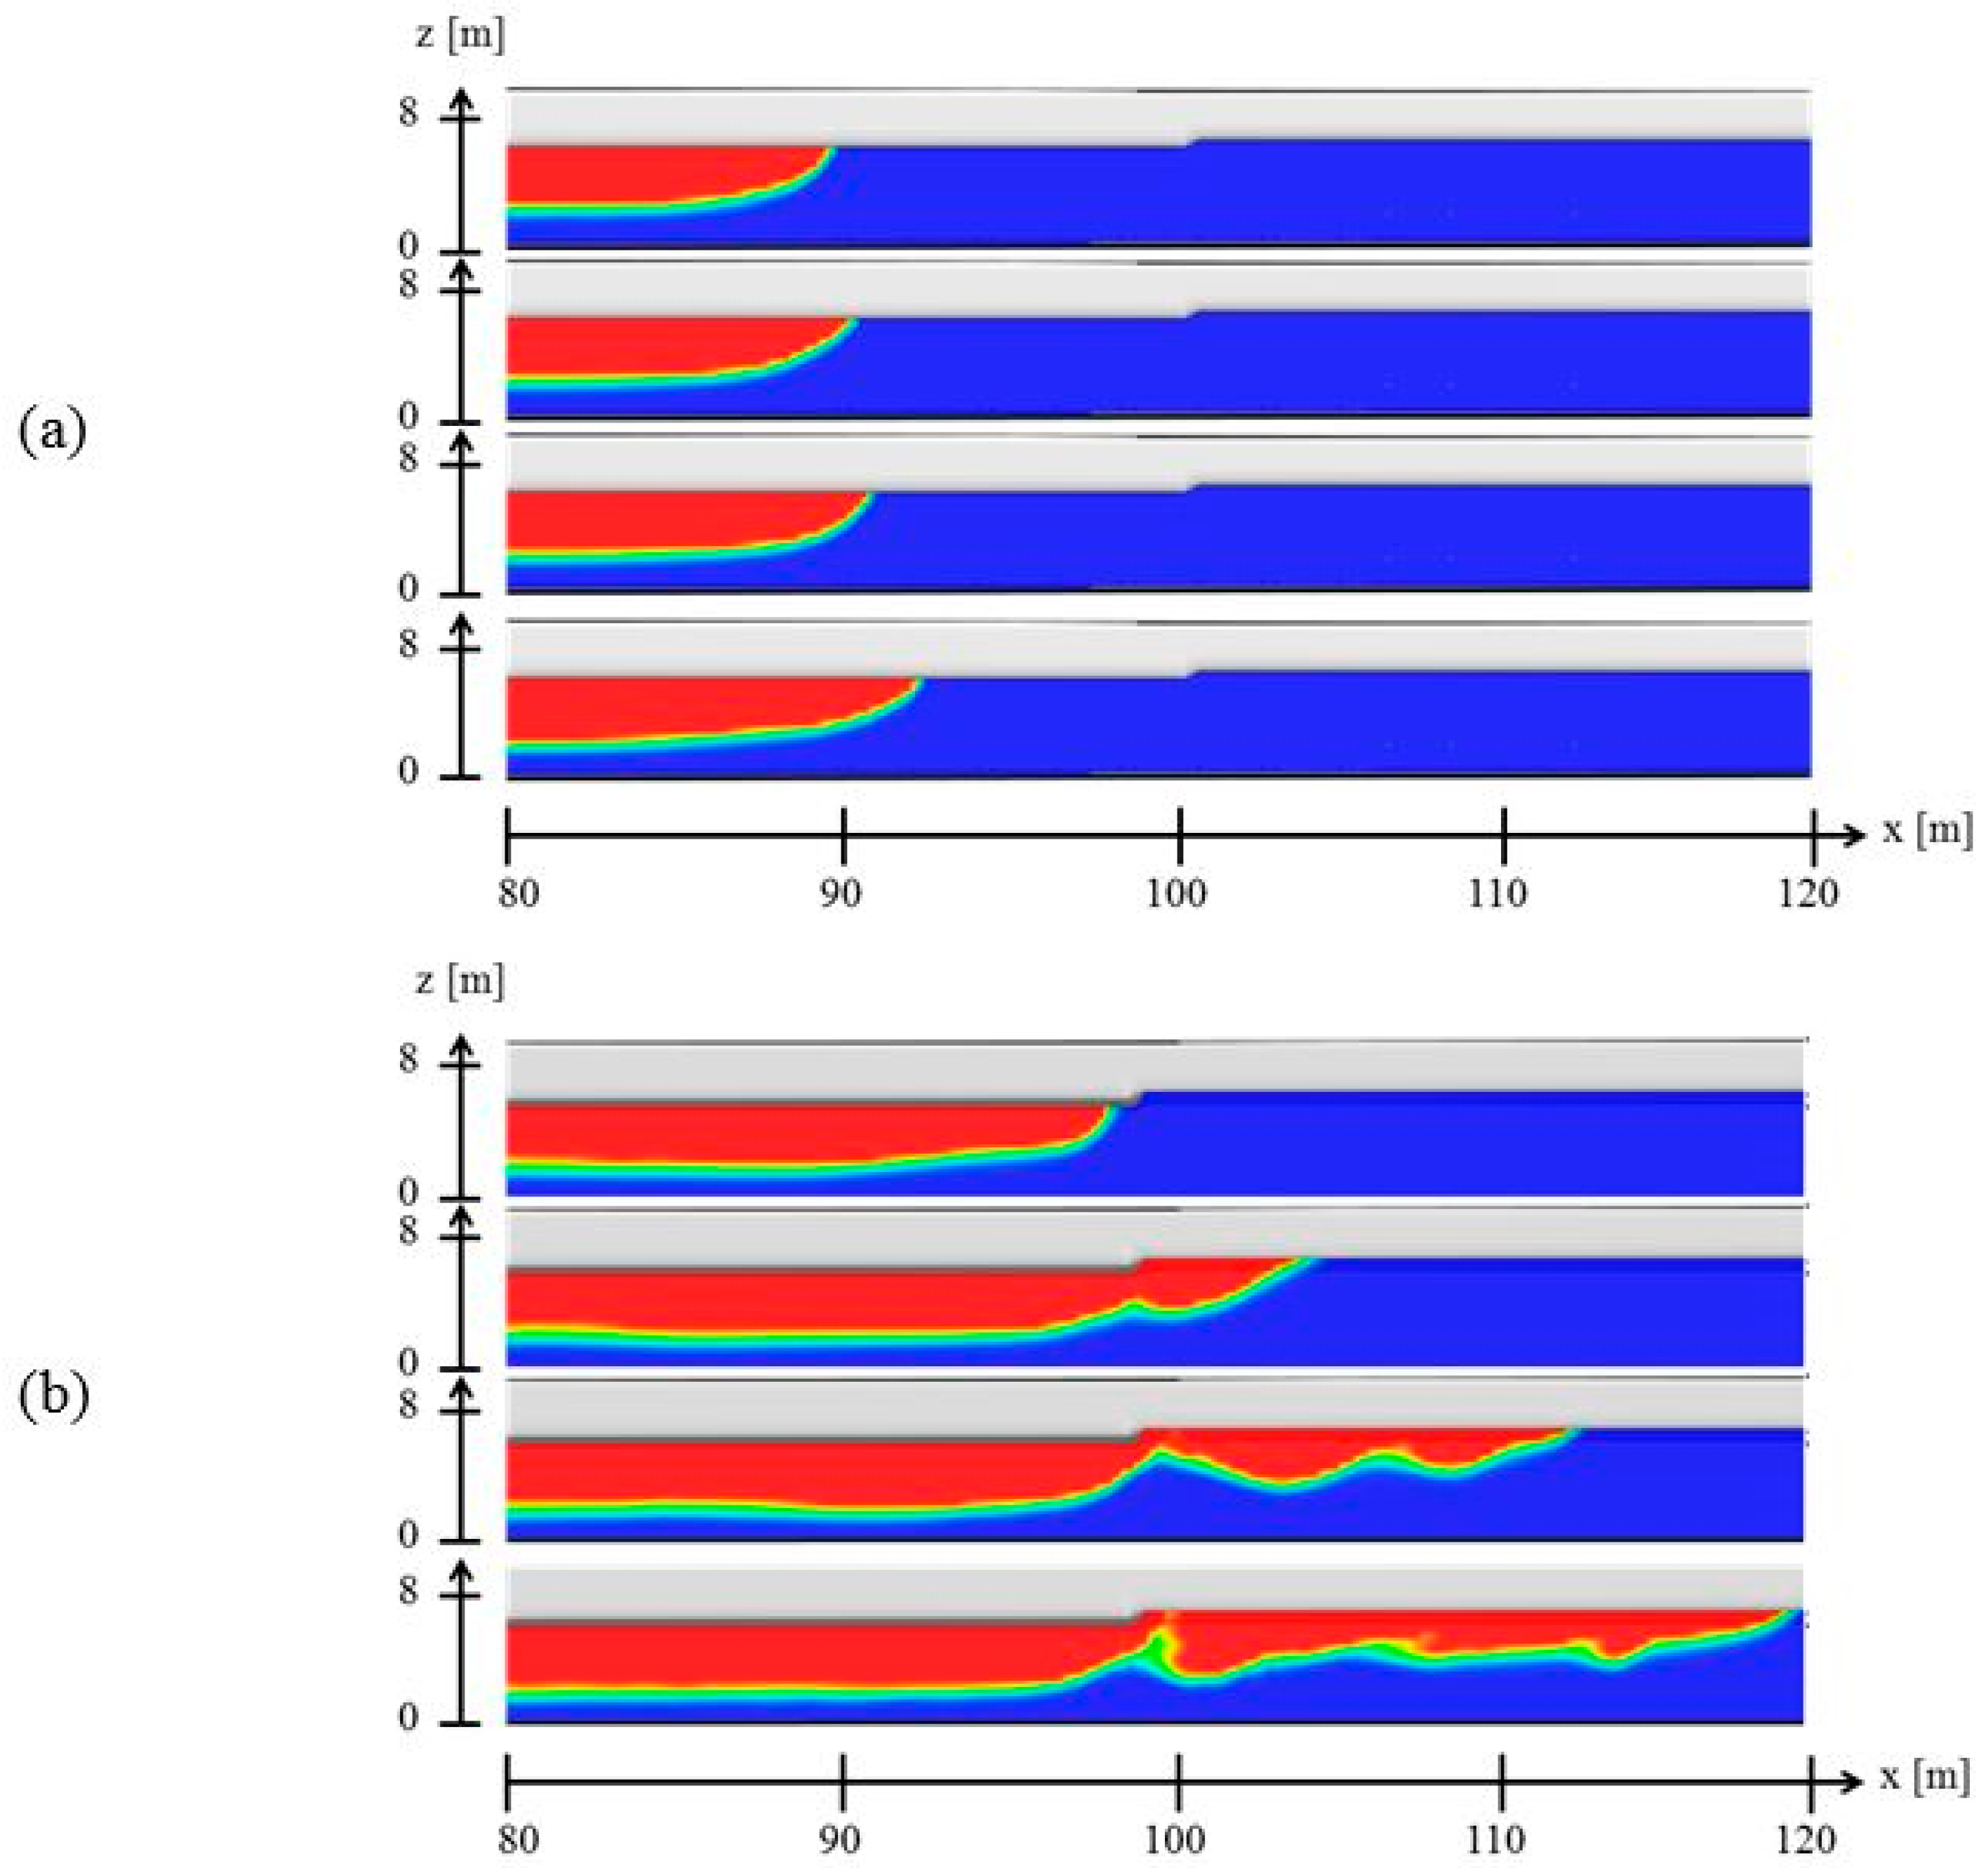
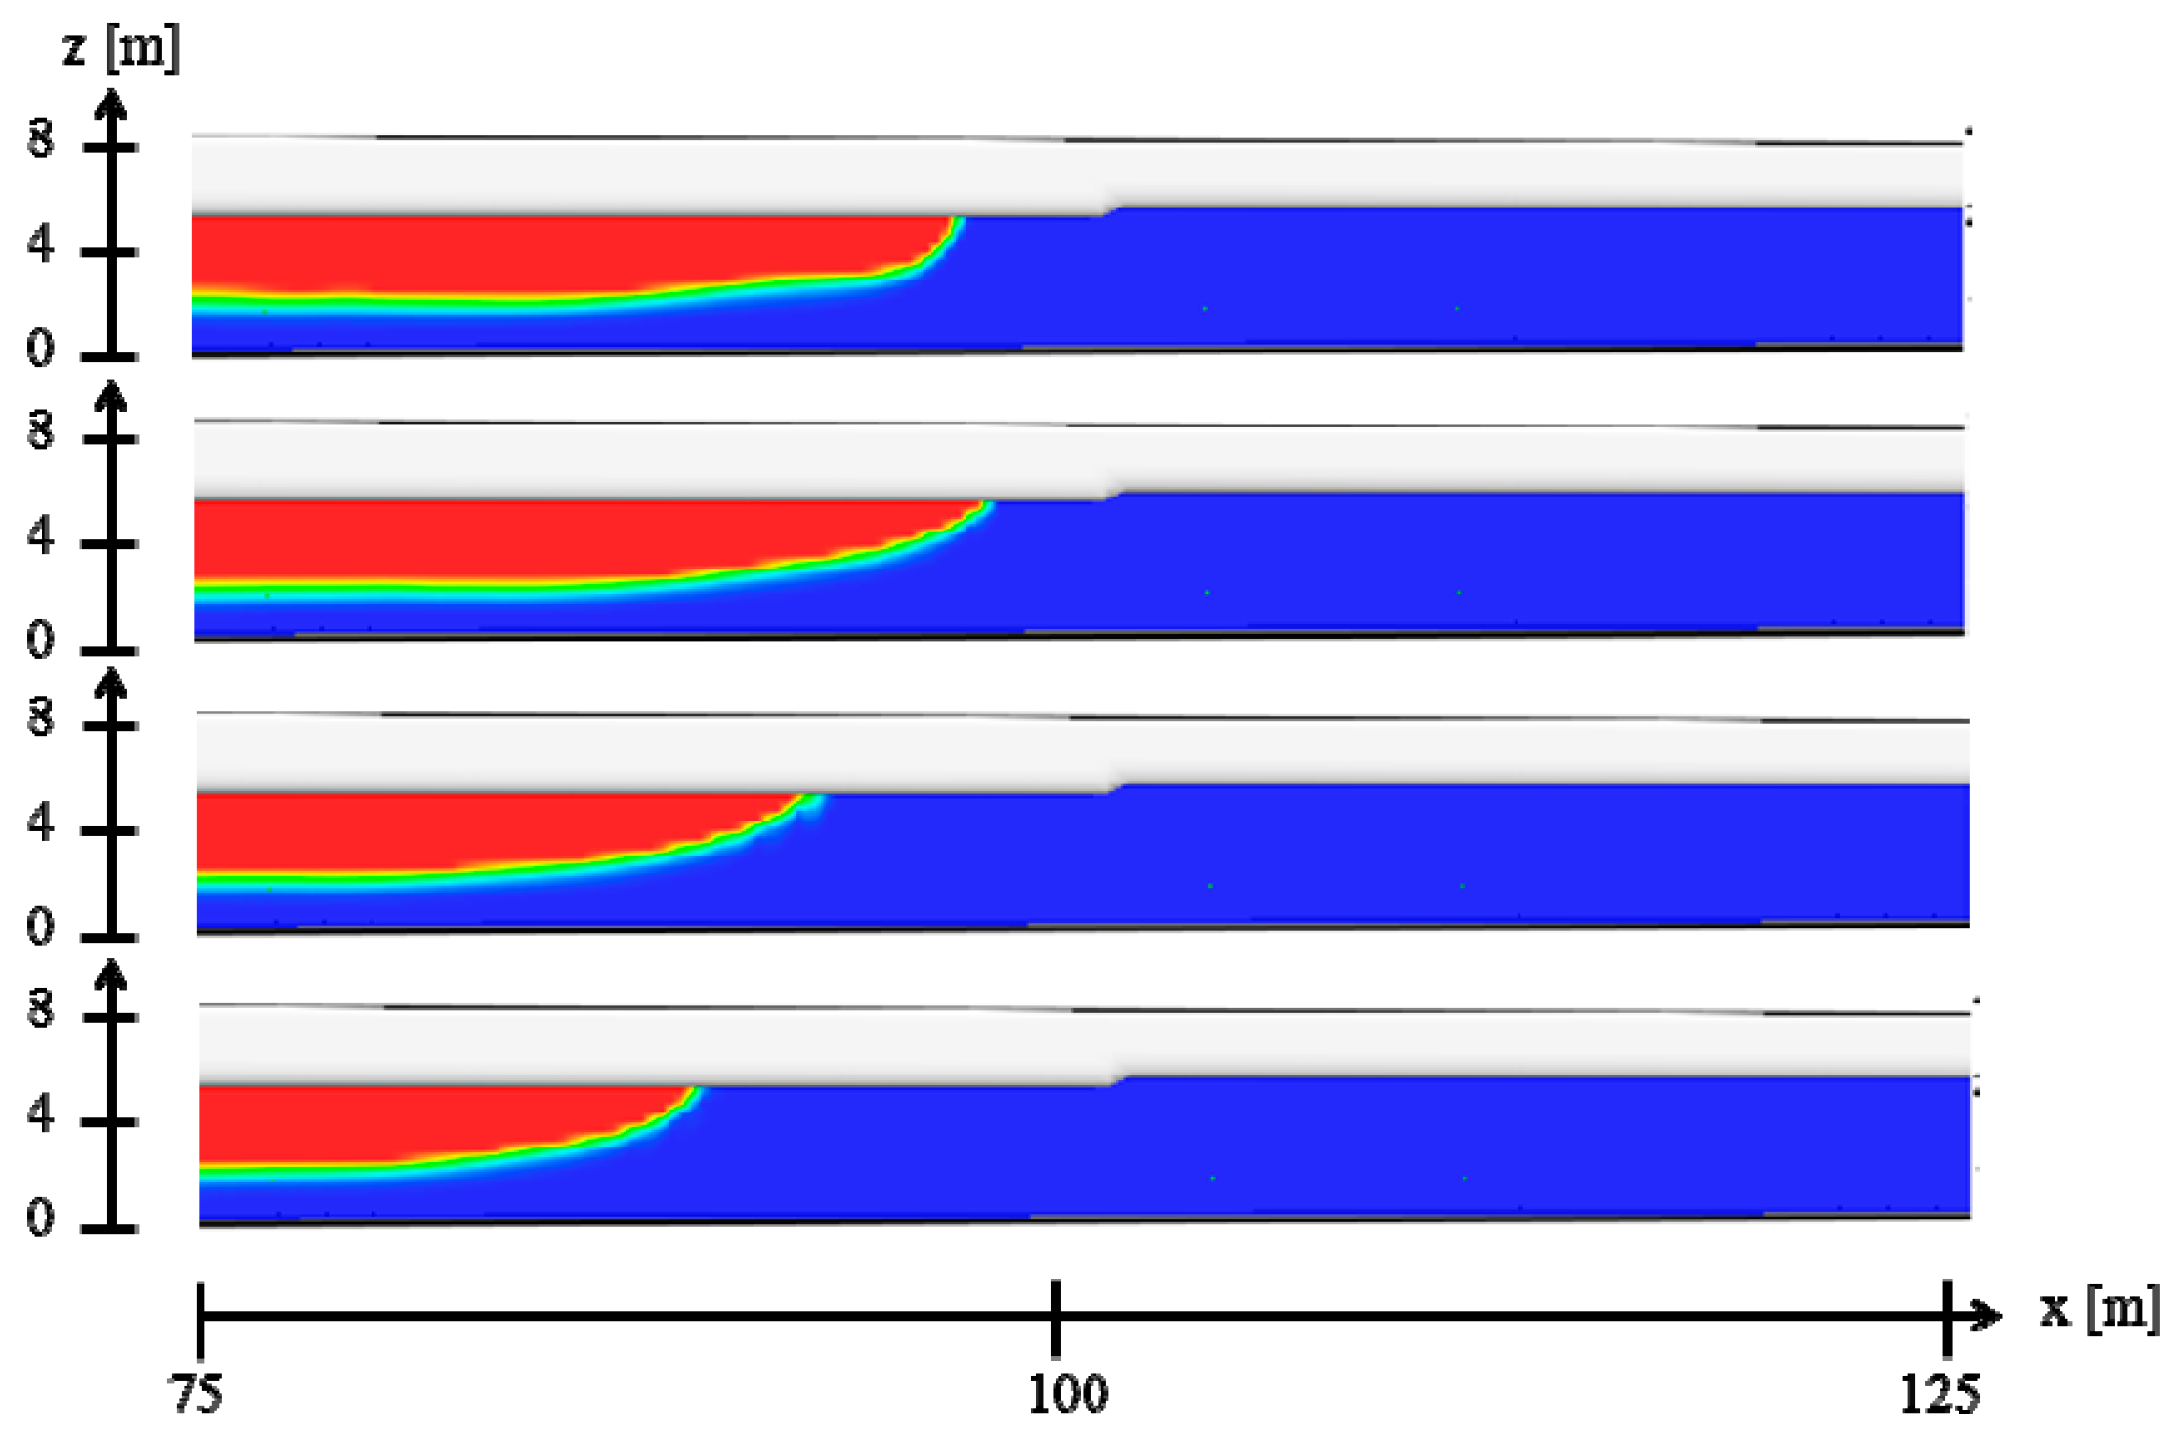
Finally, the results obtained by controlling smoke using the jet fan were examined. Figure 9 shows the temporal development of Cs in Case 3-1, in which the ventilation with jet fans was performed by using a fan velocity of 12.5 m/s. Although reduction of the forward smoke expansion was attempted, the progress of smoke could not be controlled well. Surprisingly, the time-variation of Cs for Case 3-1 was almost the same as that in Figure 6a for Case 1, in which no ventilation equipment was installed. This is probably because the wind from the jet fan lost its velocity when it collided with the edge on the ceiling; consequently, the progress of smoke could not be controlled. To confirm this, the distributions of smoke at t = 160, 180, 200 and 220 s near x = 100 m, where the edge of the ceiling existed, were compared between Cases 2-1 and 3-1. Figure 10a,b show the distributions of smoke in Cases 2-1 and 3-1, respectively. As shown in these figures, the progress of smoke was faster in Case 3-1 than in Case 2-1. This result indicated that the wind velocity from the jet fan decreased in the region with a low ceiling. Thus, the jet fan did not sufficiently control the smoke because of the edge on the ceiling.
Then, we examined Case 3-2, in which the wind velocity was increased to 25 m/s. Figure 11 shows the temporal development of Cs in Case 3-2. As shown in these figures, smoke barely progressed at any time owing to control of the smoke using the jet fan. To examine the reason for this, the distributions of smoke at t =160, 180, 200 and 220 s near x = 100 m, where the edge on the ceiling existed, were investigated. Figure 12 shows the investigation results. As can be seen, smoke did not reach the edge on the ceiling as it was controlled using the jet fan, indicating that the flow of smoke could be controlled. Therefore, in cases in which the edge exists on the ceiling of the tunnel, the wind velocity of a jet fan must be larger than a certain value.
3.3. Evacuation Simulation and Evacuation Time
Based on the results obtained using the FDS, evacuation behavior was simulated. Figure 13 shows the simulated evacuation behavior near the emergency exit in Case 1. This figure shows the evacuation behaviors of 500 evacuees near the tunnel exit 240 s after the fire broke out. Since no vehicle was placed in the tunnel in this simulation, evacuees could take the shortest route toward the exit. Since the distance between evacuees was sufficiently large, there was no bottle neck, that is, congestion of evacuees, near the exit.
Next, the effect of the number of evacuees on the evacuation time was examined. This time, the evacuation time was calculated when the number of evacuees was changed from 1 to 500 in Case 1. It was found that the evacuation time was the constant of 1260 s, even when the number of evacuees was changed. This was probably because the number of evacuees was sufficiently small compared to the tunnel size and the evacuees could therefore reach the exit without experiencing congestion. It was revealed that the evacuation time was determined by the time when the evacuee who was farthest away from the exit reached the exit. Since the evacuation began 240 s after the fire had broken out, the actual time required for the evacuation was approximately 1020 s. Since the evacuation time was longer than the time calculated based on the evacuation of approximately 600 m at a velocity of 1 m/s, it was suggested that the evacuees moved toward the exit while being trapped in smoke. The evacuation time was also obtained by allocating 500 evacuees in Cases 2-1, 2-2, 3-1 and 3-2. The evacuation times were 840, 840, 1194 and 840 s in Cases 2-1, 2-2, 3-1 and 3-2, respectively.
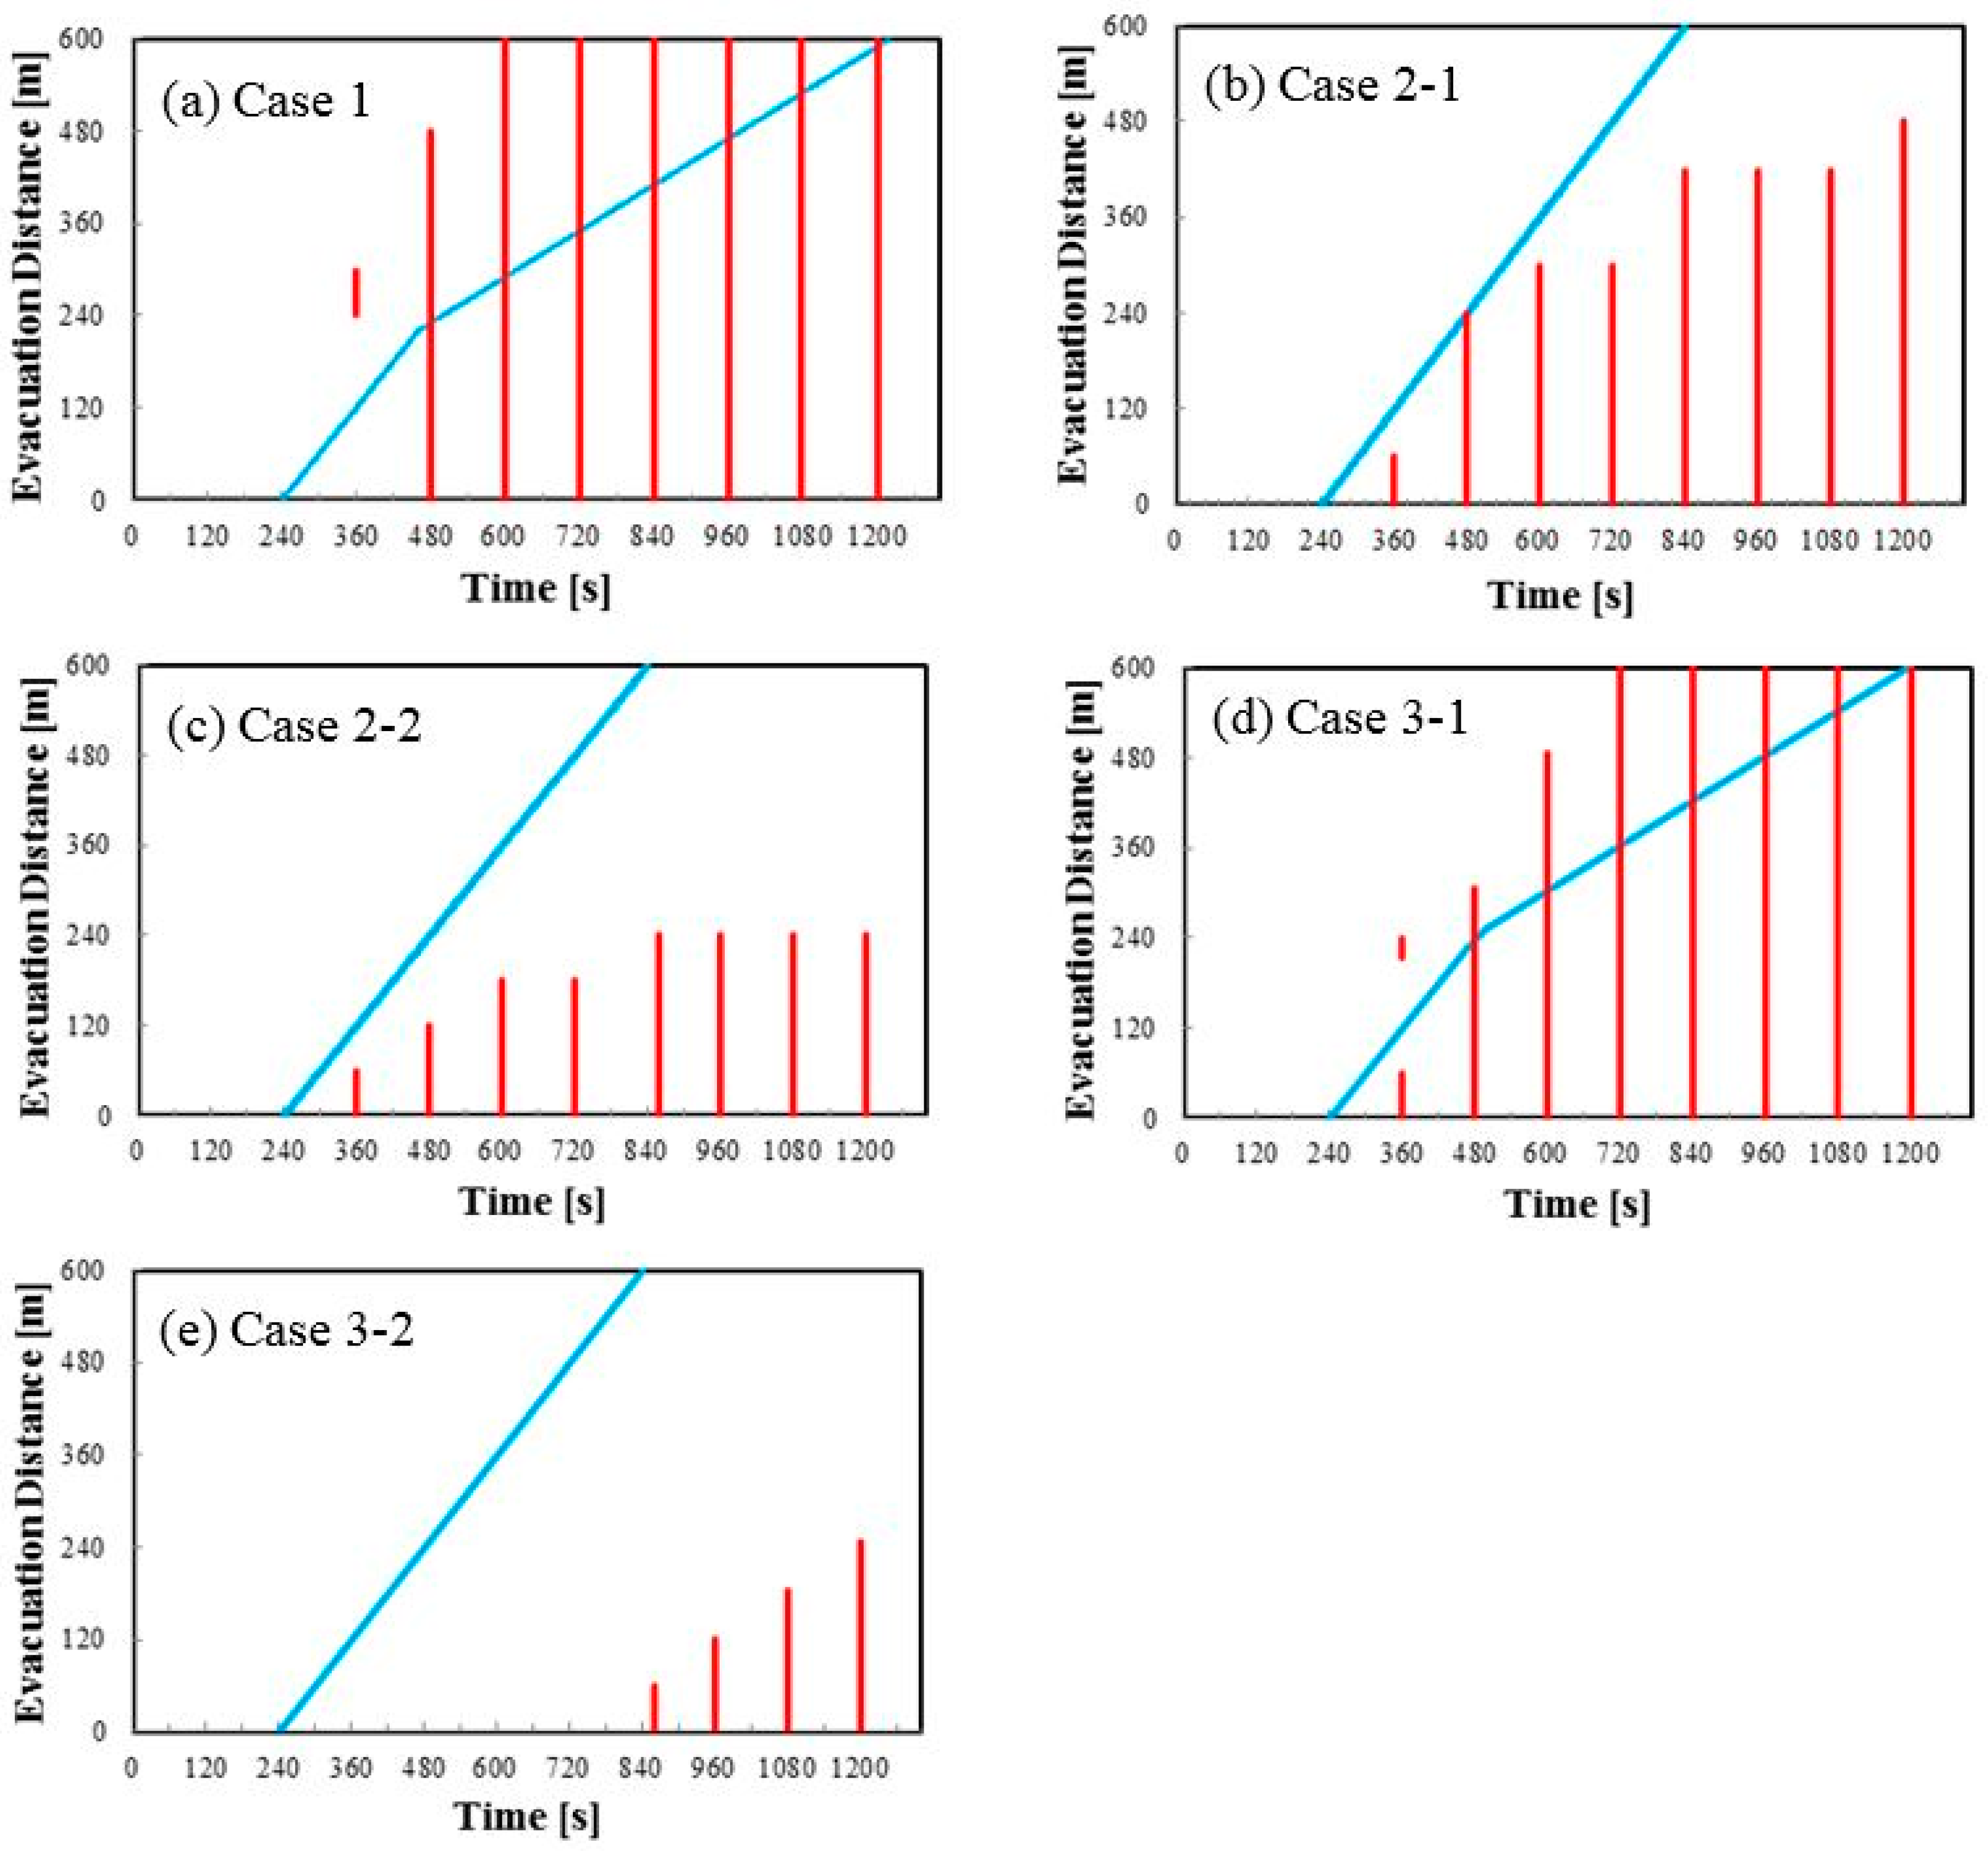
Therefore, when the number of evacuees was smaller than 500, the evacuation time was constant. Focusing on the distribution of smoke in the tunnel and the last evacuee, we discussed the evacuation from the tunnel. In Figure 14a‒e, the location of the last evacuee at every 120 s is indicated in blue and the region in which the optical density of smoke exceeded 0.4 1/m every 120 s is indicated in red for Cases 1 to 3-2, respectively. First, the results shown in Figure 14a for Case 1 were examined. Since high-temperature smoke began to fall at a place that was distant from the ignition source owing to the reduction in its temperature, the smoke progressed further than the evacuees at t = 360 s. Because of this, evacuees who began to evacuate at t = 240 s were surrounded by smoke at t = 360 s. After t = 463 s, the evacuees were covered with smoke and their evacuation velocities decreased. If the evacuee was surrounded by the smoke, it was considered to be a dangerous and inappropriate evacuation, corresponding to an unsuccessful evacuation.
Next, we examined Case 2-1, in which the wind flowed uniformly at 0.5 m/s in the tunnel. As shown in Figure 14b, since the smoke did not advance further than the evacuees, the evacuees were not covered with smoke and they were able to reach the exit. Therefore, the evacuation time was 840 s, which was the shortest among the cases. As shown in Figure 14c of Case 2-2, in which the wind flowed uniformly at 1.0 m/s in the tunnel, it was confirmed that the evacuees were not covered with smoke, with an evacuation time of 840 s.
Figure 14d shows the time history of evacuation distance in Case 3-1. As already confirmed in Figure 9, the smoke could not be controlled using the jet fan in Case 3-1 and the smoke progressed further than the evacuees at t = 360 s, similar to Case 1. Figure 14e shows the time history of the evacuation distance in Case 3-2, in which the flow velocity of the jet fan was increased to 25 m/s. As shown in this figure, since the progress of smoke could be controlled by the wind from the jet fan, the evacuees were not caught in smoke; consequently, the evacuation time was 840 s, which was also the shortest time among the cases. The evacuation of Case 3-2 as well as Cases 2-1 and 2-2 corresponds to the success of evacuation. Therefore, when an edge on the ceiling exists in a tunnel, the wind velocity of the jet fan must be large enough to prevent the smoke from spreading.
4. Conclusions
In this study, the numerical simulation of tunnel fire was conducted for assessing evacuation safety. To evaluate the ventilation system with a jet fan in the tunnel, the evacuation time in smoky conditions was discussed. The edge on the ceiling of an actual tunnel was considered, at which the installed transverse ventilation system equipped with the ventilation duct was changed to the longitudinal ventilation system with the jet fan. Although the number of evacuees varied from 1 to 500, the evacuation time was constant. Since the evacuees could reach the exit without being congested, the evacuation time was determined by the evacuee who was farthest away from the exit. In cases in which the edge on the ceiling existed at the upper part of the tunnel and ventilation in the tunnel was controlled, if the wind velocity of the jet fan was not larger than a certain value, the flow of smoke could not be controlled; consequently, the evacuation time was prolonged.
Author Contributions
Kazuhiro Yamamoto had the original idea for the study and drafted the manuscript. Yuusuke Sawaguchi was responsible for data analyses. Shinnosuke Nishiki developed and consulted on analyses. All authors read and approved the final manuscript.
Conflicts of Interest
The authors declare no conflict of interest.
References
- Seike, M.; Ejiri, Y.; Kawabata, N.; Hasegawa, M. Suggestion of estimation method of smoke generation rate by CFD simulation and fire experiments in full-scale tunnels. J. Fluid Sci. Technol. 2014, 9, 1–11. [Google Scholar] [CrossRef]
- Seike, M.; Kawabata, N.; Hasegawa, M. Experiments of evacuation speed in smoke-filled tunnel. Tunn. Undergr. Space Technol. 2016, 53, 61–67. [Google Scholar] [CrossRef]
- Thomas, P. The movement of buoyant fluid against a stream and the venting of underground fires. Fire Res. Note 1958, 351, 1–7. [Google Scholar]
- Thomas, P. The movement of smoke in horizontal passages against an air flow. Fire Res. Note 1968, 723, 1–7. [Google Scholar]
- Oka, Y.; Atkinson, G.T. Control of smoke flow in tunnel fires. Fire Saf. J. 1995, 25, 305–322. [Google Scholar] [CrossRef]
- Hwang, C.C.; Edwards, J.C. The critical ventilation velocity in tunnel fires—A computer simulation. Fire Saf. J. 2005, 40, 213–244. [Google Scholar] [CrossRef]
- Hu, L.H.; Peng, W.; Huo, R. Critical wind velocity for arresting upwind gas and smoke dispersion induced by near-wall fire in a road tunnel. Hazard. Mater. 2008, 150, 68–75. [Google Scholar] [CrossRef] [PubMed]
- Ingason, H.; Lönnermark, A. Recent achievements regarding measuring of time-heat and time-temperature development in tunnels. In Proceedings of the 1st International Symposium on Safe & Reliable Tunnels, Innovative European Achievements, Prague, Czech Republic, 4–6 February 2004; pp. 87–96. [Google Scholar]
- Li, Y.Z.; Ingason, H. Influence of Ventilation on Road Tunnel Fires with and without Water-Based Suppression Systems; SP Technical Research Institute of Sweden: Boras, Sweden, 2016; Volume 36, pp. 1–58. [Google Scholar]
- Nakahori, I.; Sakaguchi, T.; Kohl, B.; Forster, C.; Vardy, A. Risk assessment of zero-flow ventilation strategy for fires in bidirectional tunnels with longitudinal ventilation. In Proceedings of the 16th International Symposium on Aerodynamics, Ventilation and Fire in Tunnels, Seattle, WA, USA, 15–17 September 2015; BHR Group Limited: Bedfordshire, UK, 2015; pp. 501–516. [Google Scholar]
- Kawabata, N.; Wang, Q.; Yagi, H.; Kawakita, M. Study of ventilating operation during fire accident in road tunnels with large cross section. In Proceedings of the Fourth KSME-JSME Fluid Engineering Conference, Pusan, Korea, 18–21 October 1998; pp. 53–56. [Google Scholar]
- Seike, M.; Kawabata, N.; Hasegawa, M. Study about assessment of fire safety in a road tunnel by evacuee’s behavior based on smoke behavior by 3-D CFD analysis. In Proceedings of the Advanced Research Workshop Evacuation and Human Behavior in Emergency Situations, Cantabria, Spain, 21 October 2011; pp. 111–125. [Google Scholar]
- Nishiki, S. Numerical study of the effect of water mist spray in tunnel fire using FDS. In Proceedings of the 5th Japan/Taiwan/Korea Joint Seminar for Tunnel Fire and Management, Tokyo, Japan, 7 November 2013; pp. 42084–42087. [Google Scholar]
- Yamamoto, K.; Kokubo, S.; Nishinari, K. New approach for pedestrian dynamics by Real-Coded Cellular Automata (RCA). In Cellular Automata; Yacoubi, S.E., Chopard, B., Bandini, S., Eds.; Lecture Notes in Computer Science; Springer: Berlin/Heidelberg, Germany, 2006; Volume 4173, pp. 728–731. [Google Scholar]
- Yamamoto, K.; Kokubo, S.; Nishinari, K. Simulation for pedestrian dynamics by real-coded cellular automata (RCA). Physica A 2007, 379, 654–660. [Google Scholar] [CrossRef]
- Yamamoto, K.; Takeuchi, Y.; Nishiki, S. Effects of a sprinkler on evacuation dynamics in fire. Computation 2015, 3, 274–284. [Google Scholar] [CrossRef]
- FDS 5.5.3. Available online: https://pages.nist.gov/fds/ (accessed on 26 August 2013).
- Wang, H.Y.; Sahraoui, H. Mathematical modelling of pool fire burning rates in a full-scale ventilated tunnel. Fire Saf. Sci. 2014, 11, 361–375. [Google Scholar] [CrossRef]
- Zhang, M.; Song, W.; Wang, J.; Chen, Z. Accident consequence simulation analysis of pool fire in fire dike. Procedia Eng. 2014, 84, 565–577. [Google Scholar] [CrossRef]
- Ozilgen, M.; Oner, E.S. Biothermodynamics: Principles and Applications; CRC Press: Boca Raton, FL, USA, 2017; pp. 97–103. [Google Scholar]
- Ronchi, E.; Fridolf, K.; Frantzich, H.; Nilsson, D.; Walter, A.L.; Modig, H. A tunnel evacuation experiment on movement speed and exit choice in smoke. Fire Saf. J. 2017. [Google Scholar] [CrossRef]
- Rüegg, H.; Arvidsson, T. Fire safety engineering concerning evacuation time from buildings. CFPA-E 2009, 19, 1–45. [Google Scholar]
- Mulholland, G.W. The SFPE Handbook of Fire Protection Engineering; National Fire Protection Association: Quincy, MA, USA, 1995; pp. 217–227. [Google Scholar]
- Kikumoto, T.; Kawabata, N.; Maruyama, D.; Yamada, M. Characteristics of plume behavior in a small section road tunnel only for passenger cars (a study by numerical simulation). J. Jpn. Soc. Civ. Eng. 2007, 63, 448–459. [Google Scholar]
Figure 1.
Numerical domain for the tunnel fire is shown, with two cross sections of tunnel; (a) rectangular cross section of the tunnel from its left edge to 150 m (9.6 m × 5.4 m), (b) cross section of the tunnel from 150 m onward with shape of semicircular upper part.
Figure 1.
Numerical domain for the tunnel fire is shown, with two cross sections of tunnel; (a) rectangular cross section of the tunnel from its left edge to 150 m (9.6 m × 5.4 m), (b) cross section of the tunnel from 150 m onward with shape of semicircular upper part.

Figure 2.
Time-variation of the heat release rate in tunnel fire.

Figure 3.
Numerical domain for the evacuation simulation.

Figure 4.
Time-variation of smoke expansion near ignition source in fire at t = 120, 240, 480, 720 s.
Figure 4.
Time-variation of smoke expansion near ignition source in fire at t = 120, 240, 480, 720 s.

Figure 5.
Time-variation of combustion zone near ignition source in fire at t = 120, 240, 480, 720 s.
Figure 5.
Time-variation of combustion zone near ignition source in fire at t = 120, 240, 480, 720 s.

Figure 6.
Smoke region expands inside the tunnel without ventilation system in Case 1.

Figure 7.
Time-variation of Cs at center of cross section of the tunnel 1.6 m above the ground (z = 1.6 m) with uniform ventilation system in Case 2-1.
Figure 7.
Time-variation of Cs at center of cross section of the tunnel 1.6 m above the ground (z = 1.6 m) with uniform ventilation system in Case 2-1.

Figure 8.
Time-variation of Cs at center of cross section of the tunnel 1.6 m above the ground (z = 1.6 m) with uniform ventilation system in Case 2-2.
Figure 8.
Time-variation of Cs at center of cross section of the tunnel 1.6 m above the ground (z = 1.6 m) with uniform ventilation system in Case 2-2.

Figure 9.
Time-variation of Cs at center of cross section of the tunnel 1.6 m above the ground (z = 1.6 m) with uniform ventilation system in Case 3-1.
Figure 9.
Time-variation of Cs at center of cross section of the tunnel 1.6 m above the ground (z = 1.6 m) with uniform ventilation system in Case 3-1.

Figure 10.
Distributions of smoke; (a) Case 2-1, (b) Case 3-1.

Figure 11.
Time-variation of Cs at center of cross section of the tunnel 1.6 m above the ground (z = 1.6 m) with uniform ventilation system in Case 3-2.
Figure 11.
Time-variation of Cs at center of cross section of the tunnel 1.6 m above the ground (z = 1.6 m) with uniform ventilation system in Case 3-2.

Figure 12.
Distributions of smoke in Case 3-2 at t = 160, 180, 200, 220 s near x = 100 m.

Figure 13.
Evacuees’ motion and location around exit at t = 240 in Case 1.

Figure 14.
Location of last evacuee at every 120 s is indicated in blue and the region in which Cs exceeded 0.4 1/m is indicated in red.
Figure 14.
Location of last evacuee at every 120 s is indicated in blue and the region in which Cs exceeded 0.4 1/m is indicated in red.


Table 1.
Five conditions of ventilation air system.
| Case | Ventilation | Flow Velocity | Averaged Velocity |
|---|---|---|---|
| 1 | Non | 0 m/s | 0 m/s |
| 2-1 | Uniform flow | 0.5 m/s | 0.5 m/s |
| 2-2 | Uniform flow | 1.0 m/s | 1.0 m/s |
| 3-1 | Jet fan | 12.5 m/s | 0.5 m/s |
| 3-2 | Jet fan | 25.0 m/s | 1.0 m/s |
Table 2.
Scenario for evacuation assessment in tunnel fire.
| Time | Situation |
|---|---|
| −60 s | Car accident happens |
| 0 s | Fire breaks out |
| 120 s | Evacuee recognizes the fire and ventilation system starts |
| 240 s | All evacuees can get off the bus and start to walk |
© 2018 by the authors. Licensee MDPI, Basel, Switzerland. This article is an open access article distributed under the terms and conditions of the Creative Commons Attribution (CC BY) license (http://creativecommons.org/licenses/by/4.0/).
Share and Cite
MDPI and ACS Style
Yamamoto, K.; Sawaguchi, Y.; Nishiki, S. Simulation of Tunnel Fire for Evacuation Safety Assessment. Safety 2018, 4, 12. https://0-doi-org.brum.beds.ac.uk/10.3390/safety4020012
AMA Style
Yamamoto K, Sawaguchi Y, Nishiki S. Simulation of Tunnel Fire for Evacuation Safety Assessment. Safety. 2018; 4(2):12. https://0-doi-org.brum.beds.ac.uk/10.3390/safety4020012
Chicago/Turabian StyleYamamoto, Kazuhiro, Yuusuke Sawaguchi, and Shinnosuke Nishiki. 2018. "Simulation of Tunnel Fire for Evacuation Safety Assessment" Safety 4, no. 2: 12. https://0-doi-org.brum.beds.ac.uk/10.3390/safety4020012
Note that from the first issue of 2016, this journal uses article numbers instead of page numbers. See further details here.