Detection of the Species of Origin for Pork, Chicken and Beef in Meat Food Products by Real-Time PCR


Department of Food Science, Life Science Institute, University of Agricultural Sciences and Veterinary Medicine, Cluj-Napoca, Calea Mănăştur 3–5, 400372 Cluj-Napoca, Romania
*
Author to whom correspondence should be addressed.
Safety 2019, 5(4), 83; https://0-doi-org.brum.beds.ac.uk/10.3390/safety5040083
Submission received: 20 August 2019
/
Revised: 8 November 2019
/
Accepted: 11 November 2019
/
Published: 15 November 2019
Abstract
:Processed food products of animal origin raise questions related to industrial safety and human health protection. This paper aimed to optimize and validate a real-time, sensitive, and accurate PCR method for the detection and quantification of meat species in selected processed meat products: chicken sausages, beef bologna, and pork bologna. A common detection limit of 8 DNA copies was established for each sample, corresponding to 0.1% for beef and pork and 0.2% for chicken. For the limit of quantification, dilutions of 20 copies of DNA for the bovine and pig species and 50 copies of DNA for the chicken species were performed. Specificity and selectivity tests in six replicates each showed no extraneous meat species, in line with the label. Repeatability was assessed in six replicates, both quantitatively and qualitatively, by the same analyst, on the same day, and with the same equipment. The results showed that beef bologna contained 84.49% beef meat, pork bologna 92.8% pork meat, and chicken sausages 95.14% chicken meat. The reproducibility results obtained by two analysts, on different days, for each sample were very similar. The real-time PCR technique can be used as a tool in internal and public safety control to improve industrial safety and human health protection.
1. Introduction
Meat fraud in food products of animal origin raises questions related to industrial and human health safety, besides economic concerns. The identification of meat species in fresh or processed products has been performed according to techniques based on the analysis of specific meat proteins or DNA in these samples [1]. The analysis of specific meat proteins is effective for fresh meat samples but has limits for processed meat due to heat denaturation of meat proteins during product preparation [2]. For products undergoing thermal processing [3], analysis of peptide biomarkers is performed by HPLC [4,5,6]. The most common methods used for the determination of meat species are based on DNA analysis, such as polymerase chain reaction (PCR) [7]. In order to identify chicken, turkey, duck, and goose species present in the animal feed, PCR methods based on variations of the nucleotide sequences of the mitochondrial genes coding for cytB, D-loop, and rRNA 12S have been used [8]. The PCR method is also used for the identification of species in cooked food [9,10,11].
The most used PCR technique is real-time PCR due to its high sensitivity and specificity, low contamination risk, and robustness for the identification and quantification of DNA. The real-time quantitative PCR technique (qPCR) allows the direct assessment of results based on a fluorescence signal associated with the amplified target gene. The related PCR correlation methods employ interleaved fluorescent dyes such as SYBR Green [12]. The substitution of meat species [13] is a critical issue because it impacts consumers’ health and products’ trade and imports, as it is easy to conceal [11].
The labeling of food products is intended to identify the real meat species contained in the products. However, the identification of meat species in a food product may be challenging for food inspectors and analysis. Consumers need the correct labeling of food products of animal origin. There are methods for the analysis of protein and DNA, such as electrophoretic [14], chromatography [15], and immunologic techniques.
The PCR technique in the analysis of food is largely used due to its simplicity, speed, and specificity [16,17]. In addition to PCR, the most used methods in the identification of meat species are random amplification of polymorphic DNA PCR (RAPD-PCR) [18], PCR restriction fragment length polymorphism (PCR–RFLP) [19,20,21], and real-time PCR [20]. The analytical methods used are as diverse as the authentication issues that may be encountered and employ various types of equipment and techniques [22]. PCR is used in many research fields—biological, clinical, forensic, and diagnostic—and has revolutionized research in life sciences [23,24,25,26,27,28,29].
PCR has become one of the most frequently used techniques in molecular biology and it is used in applications from basic research to high-performance screening. Besides being a powerful technique, it is relatively simple and low-cost, which has allowed its universal adoption and diversity of application. The technique is used to amplify specific target DNA fragments present in small quantities of DNA or RNA (the latter after a reverse-transcription step to generate complementary DNA (cDNA)). A major advantage of PCR is that sequence targets can be amplified from a single copy of raw material, even when the sample is degraded and contaminated with inhibitors [23].
This paper is aimed at the optimization and validation of a real-time, sensitive, and accurate PCR method for the detection and quantification of meat species in selected processed meat products, precisely, chicken sausages and beef and pork bologna, in order to authenticate them, confirming the absence or presence of extraneous meat species. Food product authentication is an important issue for public and industrial safety and human health protection. This research focuses on the importance of quality control and inspection programs in the meat industry and emphasiszes the need to check labeling statements.
2. Materials and Methods
Chicken sausages, beef bologna, and pork bologna purchased in supermarkets and prepared by various romanian local producers (Caroli Foods [Caroli], Bucharest, Romania; CRISTIM 2 PRODCOM [Cris-Tim, Matache Macelaru], Bucharest, Romania) were subject to analysis in order to check the authenticity of the products and labels. Samples were taken from single chicken, beef, and pork products and were used directly for the extraction of DNA, using a DNA extraction kit (SureFood®PREP Advanced, manufactured by Congen, Berlin, Germany) according to the manufacturer’s instructions. The DNA concentration was measured using a spectrophotometer (Eppendorf, Hamburg, Germany).
In order to validate the method, the following performance parameters were validated in-house: detection limit, quantification limit, selectivity and specificity limit, reproducibility, and measurement uncertainty. Specific commercial kits were used for the three types of sample, depending on the species existing in the product: SureFood® ANIMAL QUANT Beef for beef bologna, SureFood® ANIMAL QUANT Pork for pork bologna, SureFood® ANIMAL QUANT Chicken for chicken sausages (manufactured by Congen, Berlin, Germany), according to the instructions and the work protocol provided by the manufacturer (Art. No. S1014, 2 × 50 rxn). Amplification and detection of the species were performed using real-time PCR (GeneAmp PCR System 9700, Applied Biosystems).
2.1. Sampling for the Performance of Molecular Biology Tests
The term “sample” indicates any product or material intended for laboratory examination. Regardless of the nature of the samples subjected to analysis by molecular biology techniques, sampling was performed according to the following rules: the sampled sticks or bars were sectioned longitudinally for the performance of the organoleptic test; the obtained two halves were the sample and the counter-sample; from one of the halves (middle and ends), 300–600 g were taken and sent to the laboratory in ice at 0–4 °C where they were analyzed within 36 h.
2.2. Extraction of Specific DNA Species from the Meat Products
2.2.1. Preparation of Reagents
The pre-washing buffer, which was used to eliminate salts, proteins, lipid membranes, RNA, and other residues resulting from cellular lysis, was mixed with 30 mL ethanol 70% concentration, and the mixture was kept in a tightly closed tube; then, was 42 mL ethanol 100% concentration was added, and the mixture was stirred again; finally proteinase K that eliminates proteins from the DNA, was added with 1 mL of water for PCR, and the mixtire was stirred and kept at −20 °C if not used immediately.
2.2.2. Extraction Protocol
After preheating, an aliquot of the elution buffer was introduced in the extraction tube to detach the DNA from the column and elute it in the tube located below the column, and the thermoblock was preheated at 65 °C.
Calculation of the quantity of elution buffer for 10 samples:
10 × 100 µL elution buffer + 100 µL excess volume = 1100 µL elution buffer
For the lysis process, ach sample was homogenized with a mixer and weighed 0.050 g ± 0.001 g in a storage tube (for samples with high moisture content, the sample quantity was 0.100 g ± 0.001 g). Then, 400 µL lysis buffer was added (for breaking the cell wall or cell membrane and release DNA from the cell nucleus) together with 20 µL Proteinase K, followed by vortexing and incubation at 65 °C for 30 min while stirring at 1000 rpm. For pre-filtering and setting of the optimal binding conditions, the lysed sample was spun for 1 min at 12,000 rpm, then the supernatant was transferred directly through the spin filter. The test tube with the spin filter was spun for 1 min at 12,000 rpm. After spinning, the spin filter was removed. Then, the DNA was bound to the spin filter by adding 200 µL of binding buffer on top of the filtered solution and vortexing. A binding spin filter was fastened to a 2.0 mL extraction test tube, and the complete solution was passed through the filter and incubated at room temperature for 1 min followed by spinning at 12,000 rpm for 1 min. The filtrate was removed, and the filter was fastened back to the test tube. For purification of the bound DNA, 550 µL of pre-washing buffer was added through the spin filter, followed by spinning for 1 min at 12,000 rpm. The filtrate was removed, and the filter was fastened back to the test tube. Then, 550 µL of pre-washing buffer was added through the spin filter, followed by spinning for 1 min at 12,000 rpm. The filtrate was then removed, and the filter was put back in the test tube. In order to dry the spin filter, residual ethanol was removed by spinning for 2 min at 12,000 rpm. During DNA elution through the spin filter, the spin filter was fastened to a 1.5 mL storage tube, and 100 µL of elution buffer preheated at 65 °C was added directly on the filter, followed by incubation at 65 °C for 3 min without stirring and then spinning for 1 min at 10,000 rpm. After spinning, the filter was disposed of. The extracted DNA was kept at 4 °C if analyzed within 24 h or at −20 °C if analyzed after 24 h.
2.3. Amplification and Detection by Real Time-PCR to Determine Meat Percentagse
The detection limit certified in the kit was ≤5 DNA copies (0.1% for chicken and 0.04% for beef and pork).
2.3.1. Preparation of the Reaction Mix (Reaction Mix Ref/Reaction Mix Bos, Sus, or Gallus)
In order to prepare the reaction mix, the calculation of the total number of reactions (samples and control samples) was necessary. The control samples included negative control, positive control, and extraction control. It was recommended to prepare 10% more mix than necessary. Each mix was slightly spun before use. Table 1 lists the components and quantities necessary to prepare the reaction master-mix.
2.3.2. Preparation of DNA Standards
In order to prepare the DNA standards, dilution of the DNA standard (serial dilutions of 1:10), to obtain 5 different DNA concentrations was necessary, all illustrated in Table 2 and Table 3. For dilutions, the dilution buffer was used.
Unless used immediately, standards were stored at −20 °C. Dilutions were stable for 2 months. In the case of chicken analyses, DNA extracted fro the samples was diluted 1:10 using the dilution buffer to obtain optimal fluorescence and detection within the measurement range.
2.3.3. Preparation of the Mix for Beef and Pork Real Time-PCR
The preparation of the negative control Ref/Bos/Sus involved dropping 18 µL of reaction mix Ref/Bos/Sus in the reaction tube (capillary, plate), which was closed immediately. For preparing the negative extraction control, 18 µL of reaction mix Ref was dropped in the reaction tube with 2 µL of negative extraction control, and the tube was closed immediately. The preparation of samples and standards Ref/Bos/Sus involved dropping 18 µL of reaction mix Ref/Bos/Sus + 2 µL DNA extract of samples/standards. For preparing the positive control Ref/Bos/Sus, 18 µL of reaction mix Ref/Bos/Sus were dropped in the reaction tube with 2 µL of DNA positive control. All tubes were slightly spun (up to 4000 rpm) and placed in the real time-PCR machine.
2.3.4. Preparation of the Mix for Chicken Real Time-PCR
The preparation of the negative control Ref/Gallus involved dropping 20 µL of reaction mix Ref/Gallus in a reaction tube (capillary, plate), which was closed the tube immediately. The preparation of the negative extraction control involved 20 µL of reaction mix Ref in the reaction tube with 5 µL of DNA (diluted 01:10), and the tube was closed immediately. The preparation of samples and standards Ref/Gallus involved 20 µL reaction mix Ref/Gallus + 5 µL of DNA extract of samples (diluted 1:10)/standards, while the preparation of the positive control Ref/Gallus involved 20 µL reaction mix Ref/Gallus in the reaction tube wtih 5 µL of DNA positive control. All the tubes were slightly spun (up to 4000 rpm) and placed in the real time-PCR machine. Table 4 reports the real-time PCR amplification protocol for the detection of the beef and pork species, and Table 5 that for the detection of the chicken species in food products of animal origin (chicken sausages, pork bologna, beef bologna).
2.4. Expression of the Results
The sample was considered positive if the DNA in the sample included a fluorescent amplification signal. The sample was considered negative if the DNA in the sample did not include a fluorescent amplification signal. A separate calculation was performed for the total percentage of meat (Ref) and species (Bos, Sus, or Gallus). The cycle threshold (CT) values for standards must have a constant ∆CT; ∆CT must be approximately 3.2 up to 3.6 cycles (±0.2) between two dilutions. If the standard curve indicates different values for ∆CT, a correct evaluation cannot be performed. The calculation method for the expression of the chicken, beef, or pork percentages used the values obtained for the positive control (PC) Ref and the positive control Bos/Sus/Gallus to calculate the recovery percentage and the correction factor (k):
PCRef = 503.9 and PCGallus = 505.1
R% = CPGallus × 100/CPRef = 505.1 × 100/503.9 = 100%
K = theoretical CP value/measured CP value = 100/100 = 1
The value obtained for the samples was 49,950 copies of Gallus DNA and 50,810 copies of Ref DNA. The chicken percentage in the sample was 49,950 × 100/50,810 = 98.31%. The obtained result was multiplied by the correction factor: in the given example k = 1, therefore the final result was 98.31% × 1 = 98.31% chicken. The result was expressed as percentage for the samples with meat contents higher than the quantification limit, below the quantification limit for samples with meat contents between the detection limit and the quantification limit, and non-detectable for samples with meat content below the detection limit.
Internal Control of Result Quality
In order to control contamination during extraction, a negative extraction control was performed. For amplification and detection, a negative reaction control and a positive reaction control were prepared, and the samples were processed in duplicate.
3. Results and Discussions
3.1. Selectivity and Specificity
In order to control for false negative or positive signals, tests were performed on the three samples of chicken sausage, beef bologna, and pork bologna, and their responses were tracked, using SureFood ANIMAL QUANT Beef, SureFood ANIMAL QUANT Pork, and SureFood ANIMAL QUANT Chicken. The obtained results indicated positive or negative confirmation for the presence of the three meat types in the tested samples and are given in Table 6, below.
The following equations were used:
where:
- PC = number of positive results
- NF = number of negative false results
- NC = number of negative results
- PF = number of positive false results
The results did not indicate the presence of extraneous meat species in the three products, confirming that each product contained the species marked on the label. The used primers confirmed that all samples subject to examination included enhanceable DNA. Heat-processed pork, beef, and chicken products were used to validate the PCR tests specific to each meat species. The results indicated high sensitivity for the test, which allowed the detection of 0.04% of beef and pork and 0.1% of chicken. An extensive search within the literature demonstrated that the obtained sensitivity was considerably higher than that acheived in other studies, which obtained 0.1% (weight/weight) for pork in binary mixtures of raw or heat-treated meat [2,9,11,30,31,32], 0.05% for pork in mutton. and 1% for pork in meat mixtures [2,33] using pork-specific PCR tests targeting various genes, such as the cytb, rRNA 12S, a-actin, ATPase8/ATPase6, D-loop, COI, and pituitary porcine growth hormone (PGH).
3.2. Establishment of the Limit of Detection (LOD) and of the Limit of Quantification (LOQ)
The LOD declared in the SureFood ANIMAL QUANT kit is 5 DNA copies corresponding to the concentrations of 0.1% for chicken and 0.04% for beef and pork. The analysis was performed using the species DNA extracts provided in the kit (according to Table 7), from which dilutions were prepared according to the instructions of the kit).
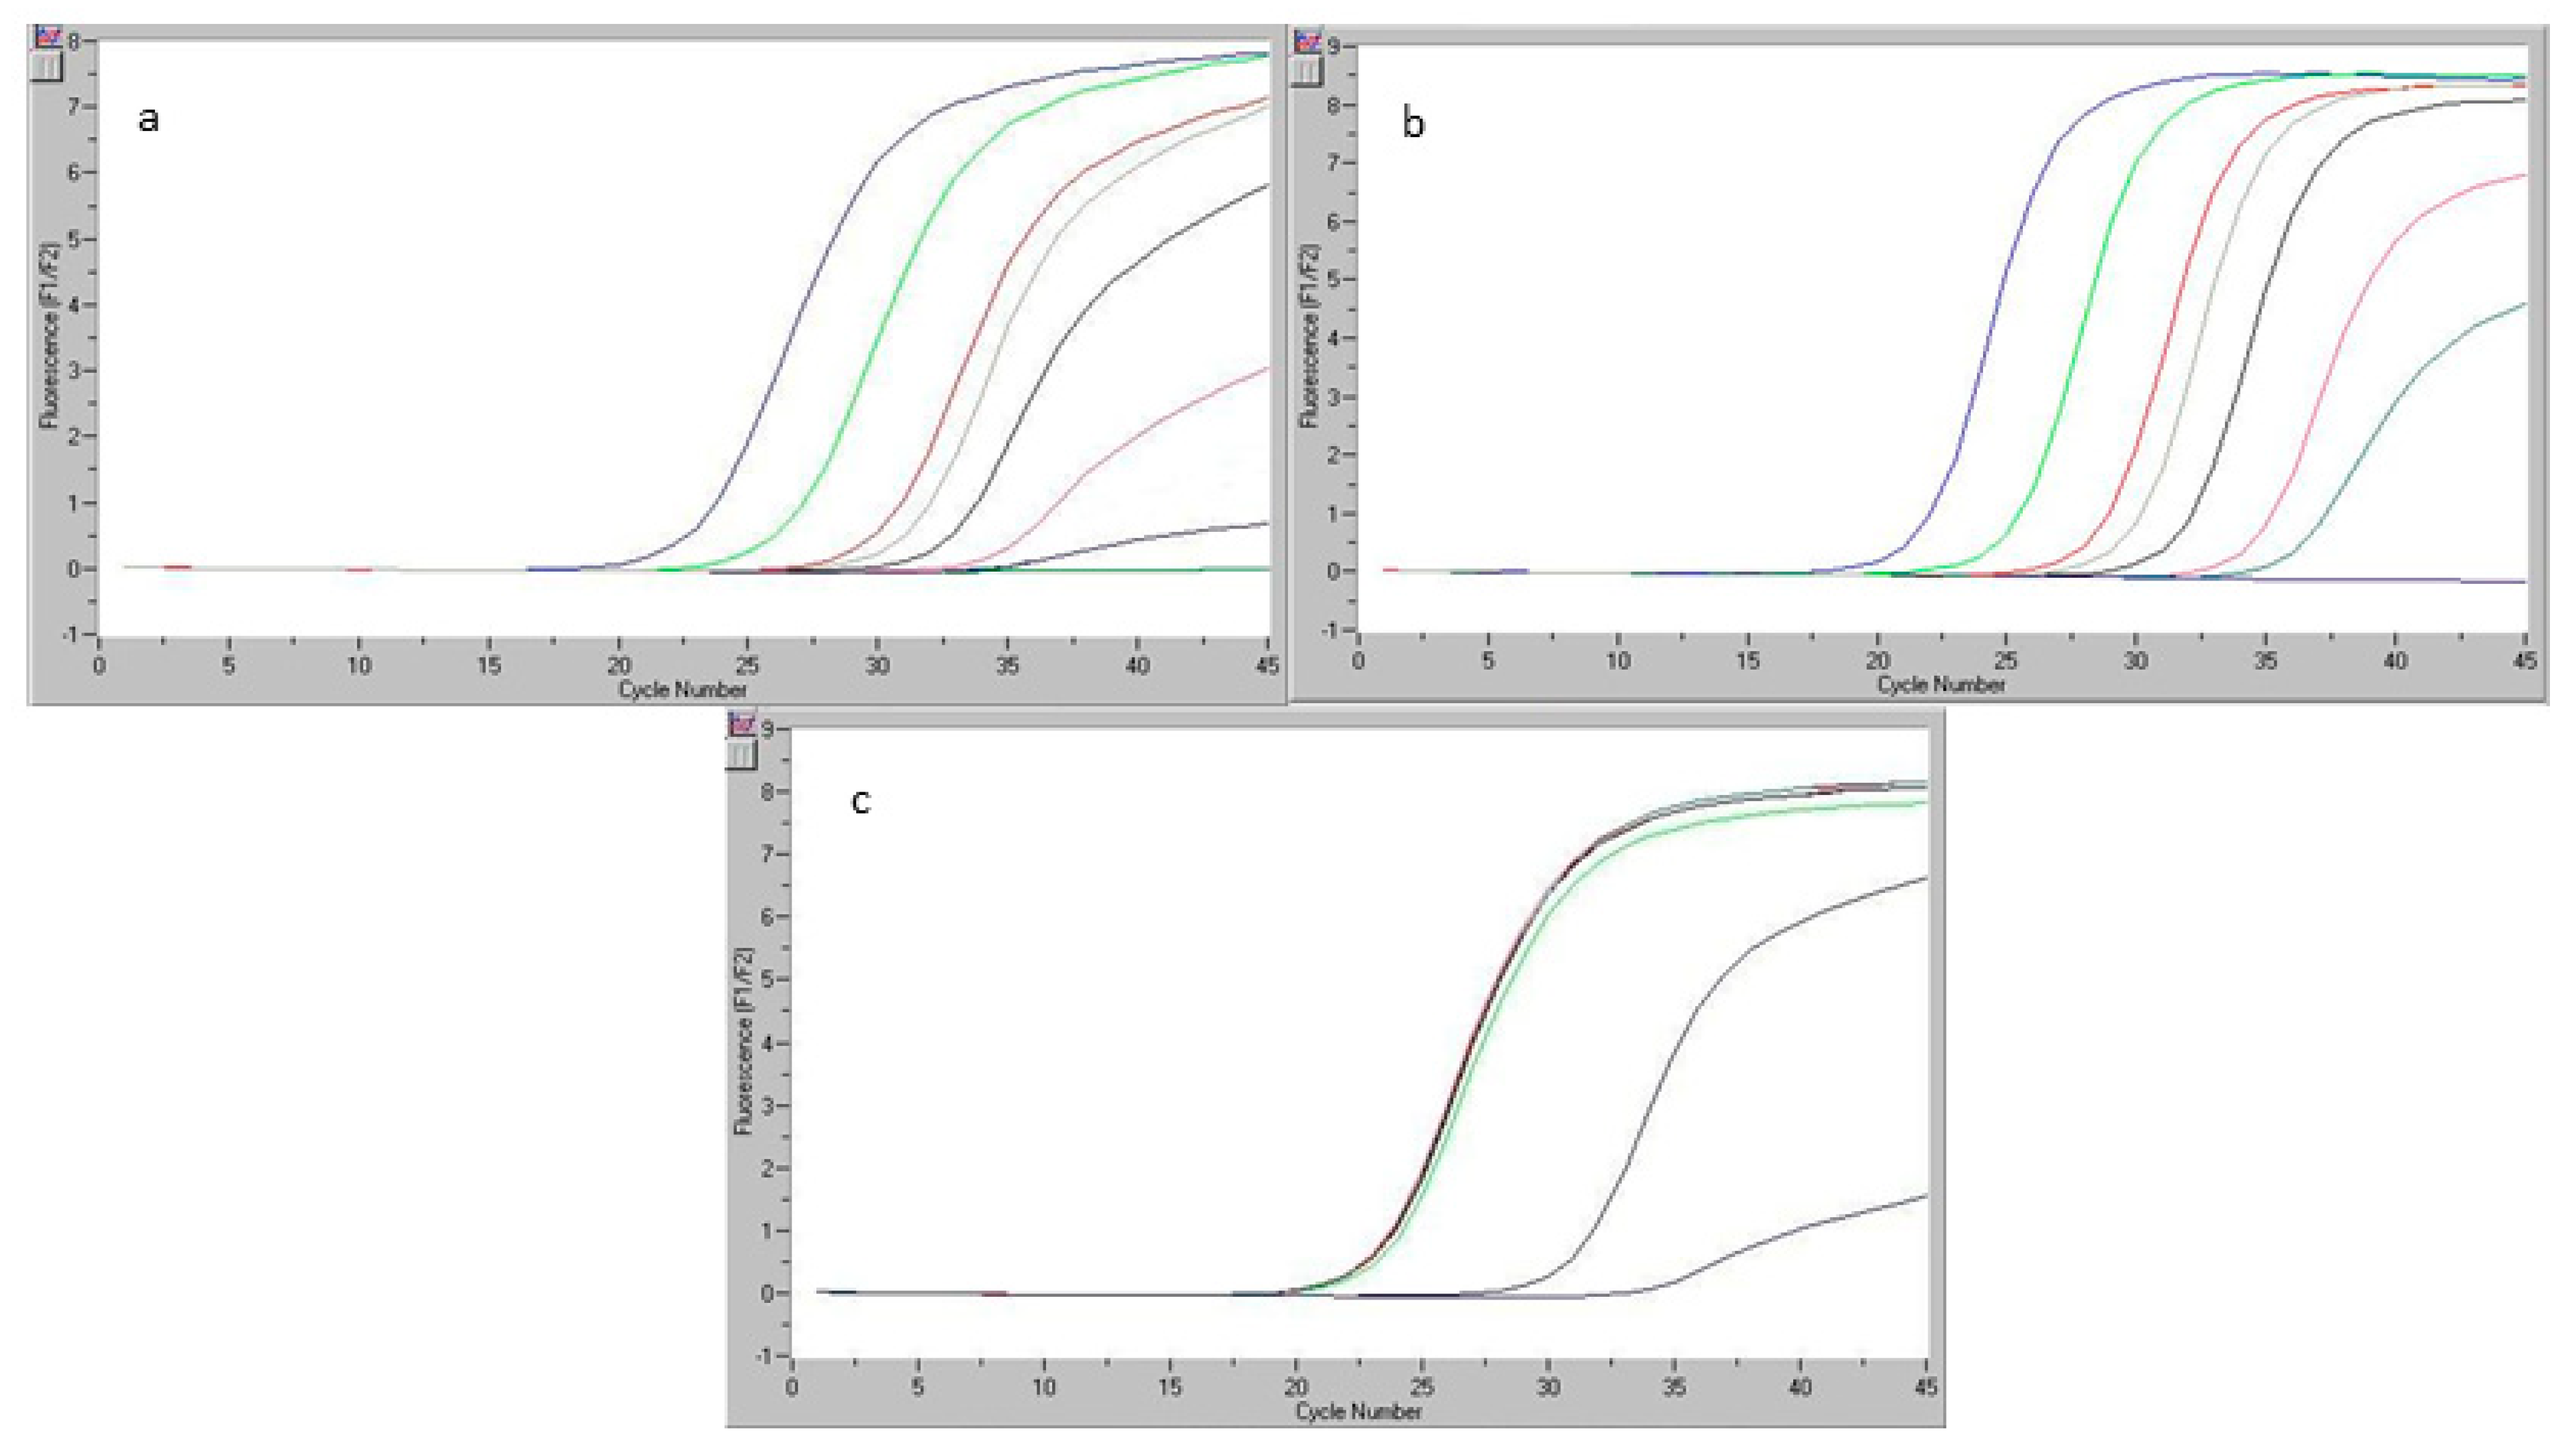
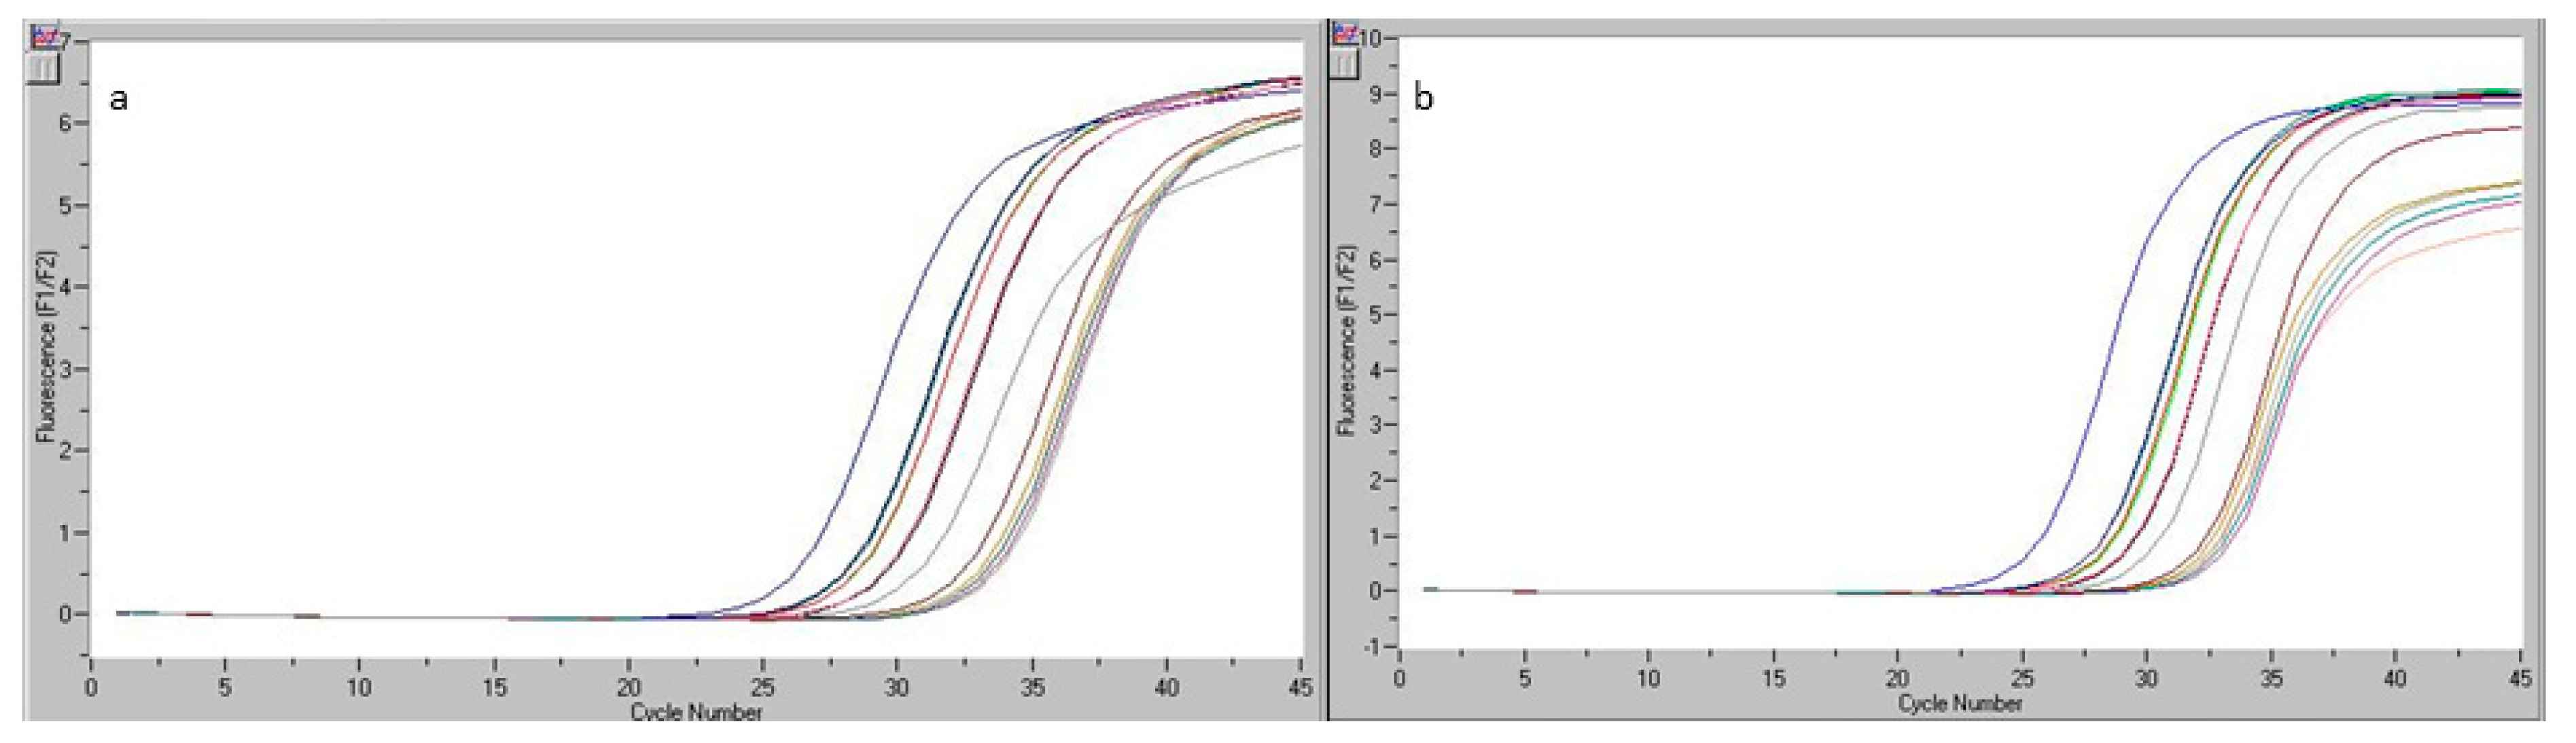
Common LOD was established for eight DNA copies (0.2% chicken and 0.1% pork and beef). LOQ = 50 DNA copies for chicken, corresponding to a percentage of 1% chicken, and 20 DNA copies for beef and pork, corresponding to a percentage of 0.2% pork and beef. The calibration curves registered by the real-time PCR equipment for beef and chicken DNA and the readings for the detection limit were determined in the repeatability study illustrated in Figure 1a,b. Figure 1c shows the calibration curve and the detection limit for pork DNA.
3.3. Repeatability
Tests were performed using samples of chicken sausages, beef bologna, and pork sausages; six determinations were carried out for each product, in reproducibility conditions (same analyst, same equipment, same method, same day). The results obtained and the statistical calculations are given in the tables and figures below.
3.3.1. Detection of the Bovine Species (Quality/Quantity)
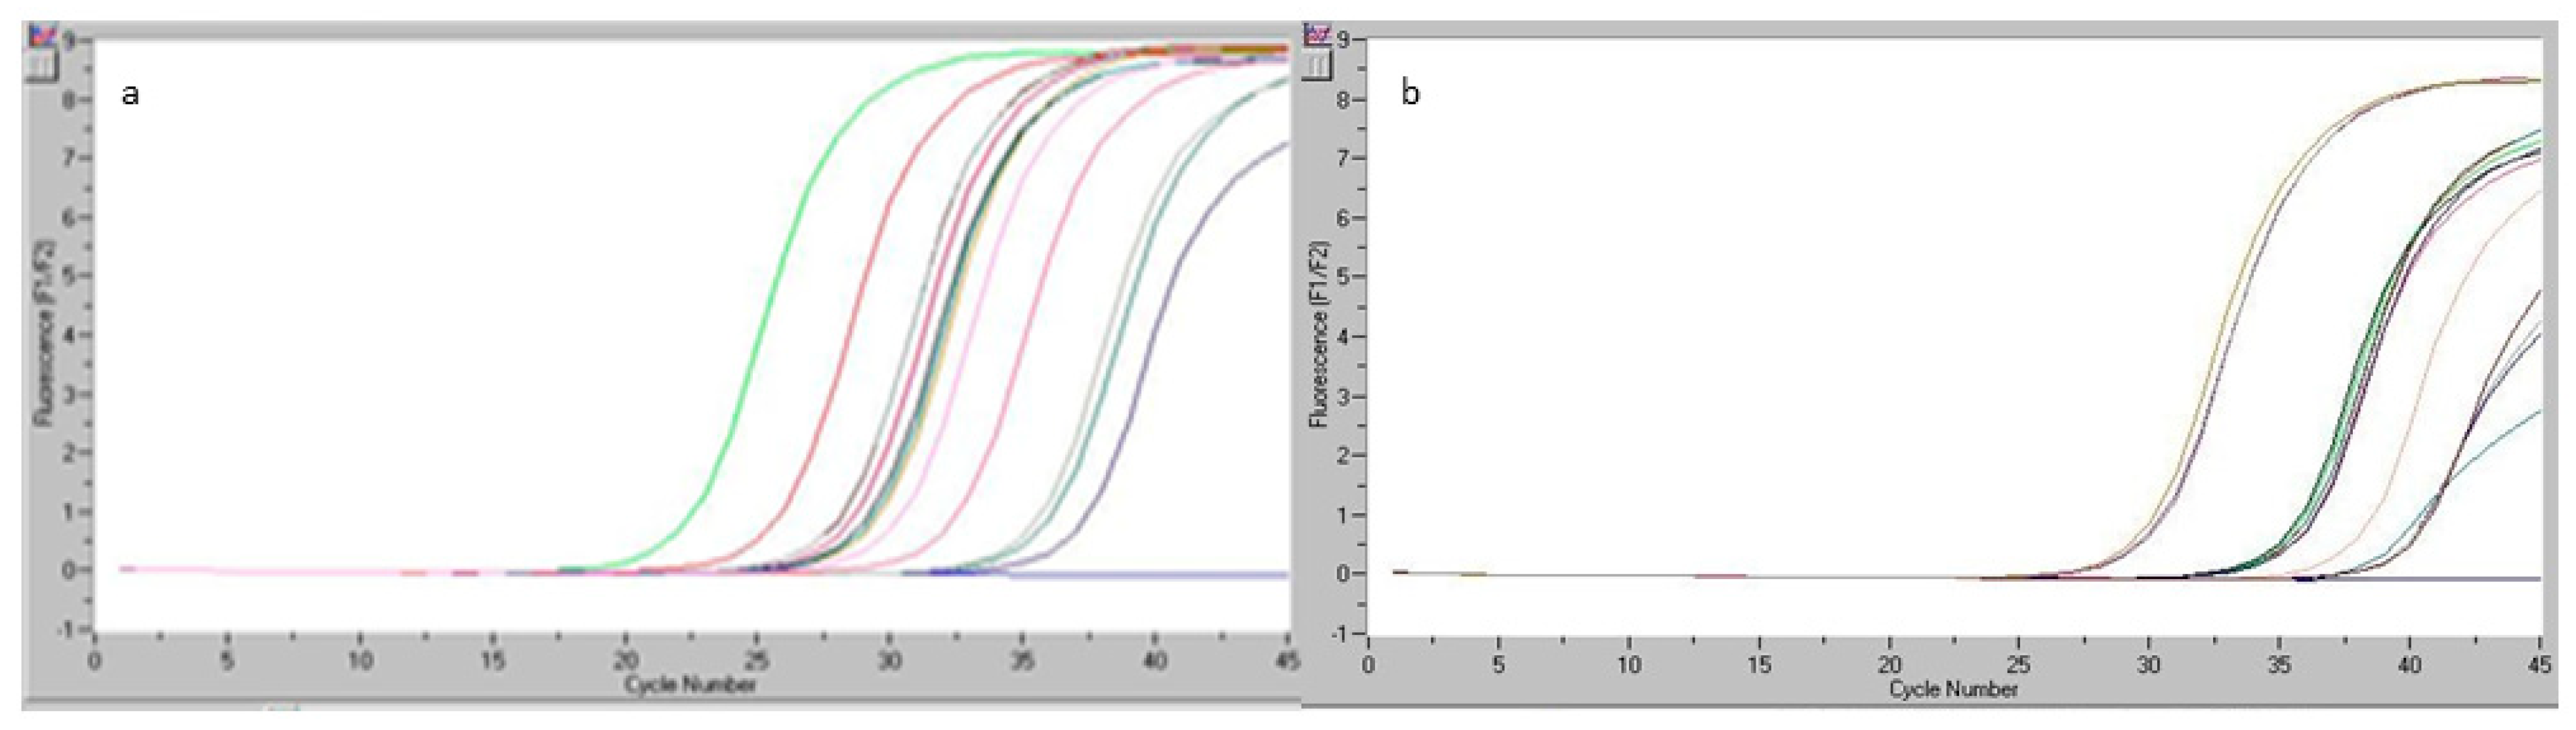
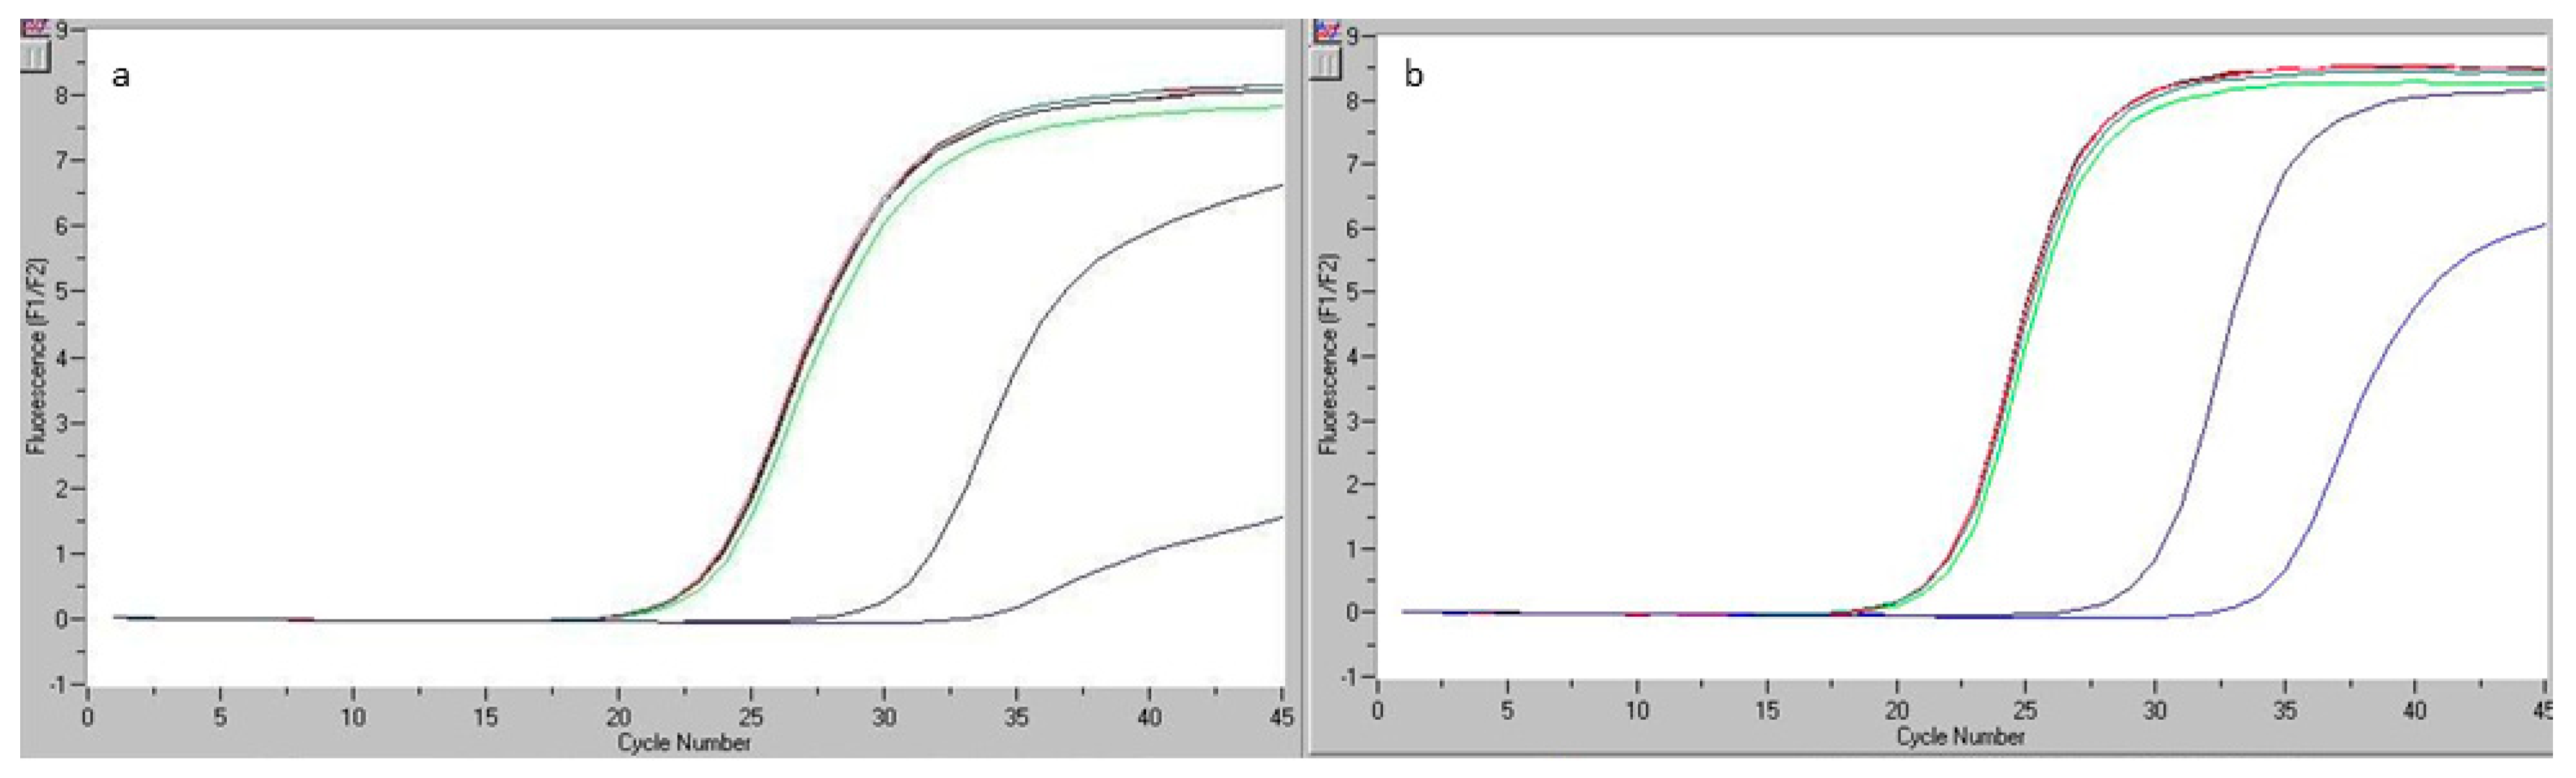
The study considered a sample labeled as beef bologna. The sample was selected considering the poor quality of such products with regard to the quantity of meat present; we determined meat content and species of origin. From this sample, six DNA aliquots were extracted and subsequently analyzed by real-time PCR. Figure 2a shows the results of the real-time PCR reaction for the six genomic DNA replicates, work standards included in the kit (S1–S5), and one genomic DNA sample specific to the gallinacean (chicken) species. The readings registered by the real-time PCR equipment for the simultaneous analysis of a set of samples of beef DNA extract in the kit (dilution S5) are given in Figure 2b.
According to the results, it can be concluded that the analyzed product contained beef and chicken. We then assessed the beef content of the product considered in this study; thus, specific calculations were performed to determine total proteins and specific bovine proteins, and the results are shown in Table 8 and Table 9.
The process included the simultaneous analysis of a set of samples of beef DNA extract provided in the kit (dilution S5). The results obtained are shown in Table 10.
The same protocol also included the analysis of DNA samples generated using minced pork and minced chicken matrix. The analysis of the data shown in Figure 2 indicated no value for the CT for the matrix represented by pork and chicken, thus confirming that the kit used for the determination of the bovine species was specific and did not misidentify other species (pork, chicken).
3.3.2. Detection of the Porcine Species (Quality/Quantity)
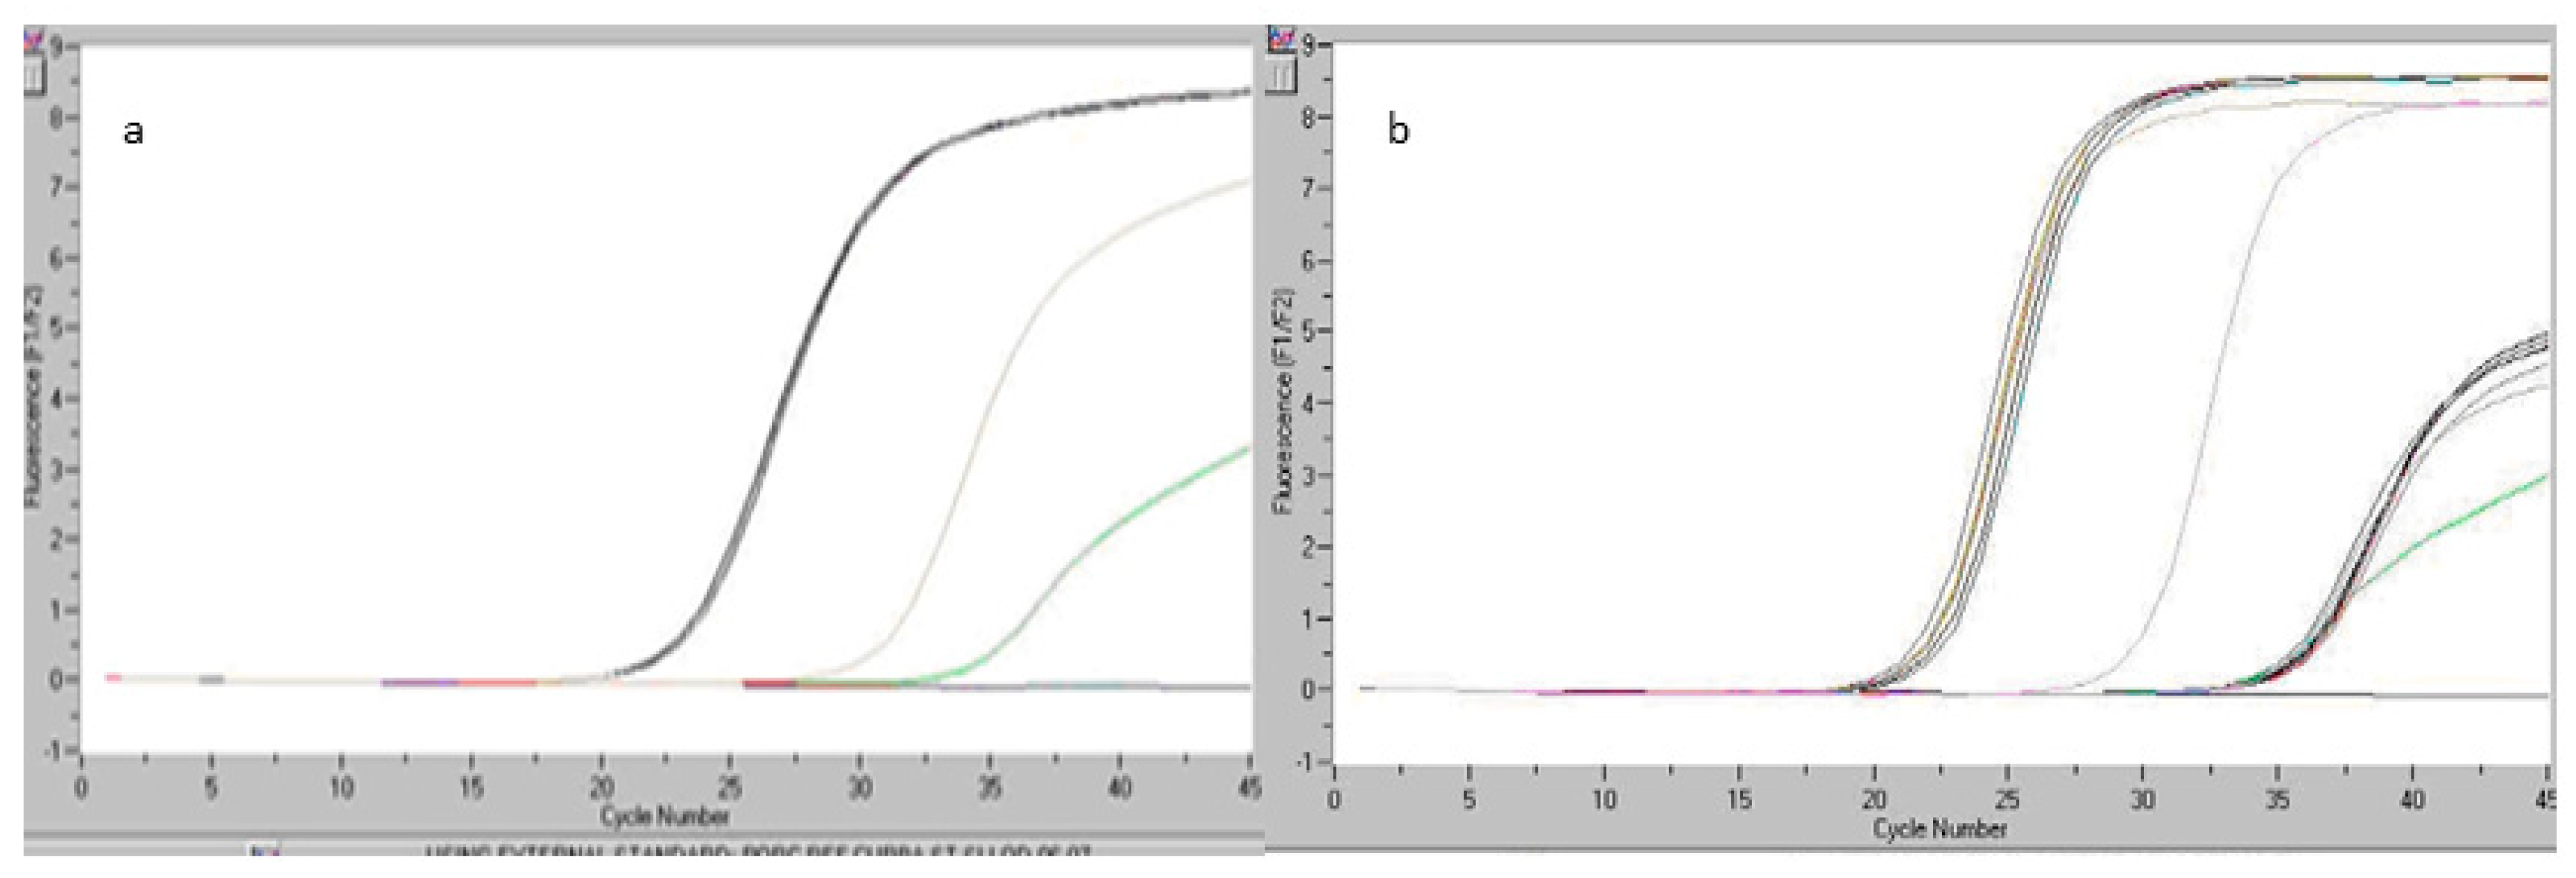
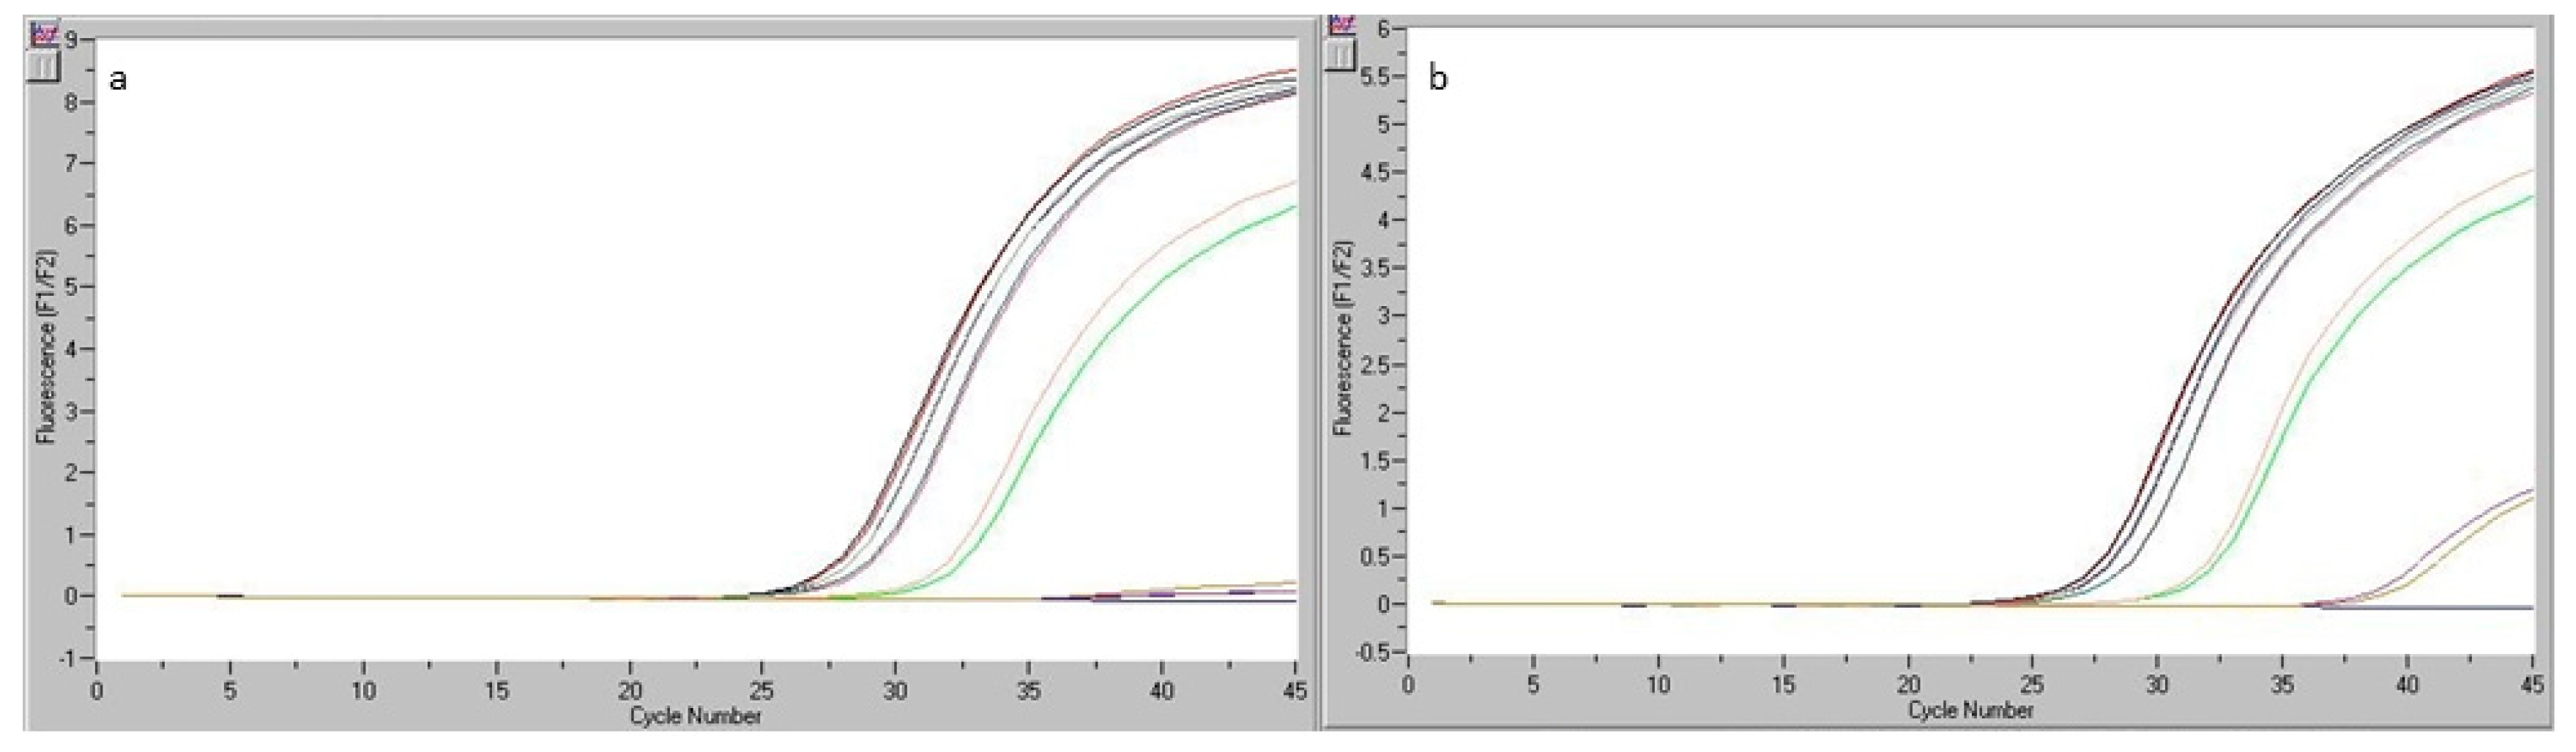
The performed study included the analysis of six DNA replicates originating from a pork sausage sample, as shown in Figure 3a, and the test reproducibility, using standard S5 (kit content), with a concentration level of 20 copies of pork genomic DNA, as shown in Figure 3b. The study monitored the specificity of the test and the origination of statistical analysis elements, which may outline the quality of the obtained results.
Following the assessment of the obtained results, it can be concluded that the analyzed product contained pork, and the results obtained for the six DNA replicates were comparable. We then determined the contents of pork in the product considered in this study, using statistical analysis. The results are shwn in Table 11 and Table 12.
We also focused on test reproducibility, using standard S5 (kit content), with a concentration level of 20 copies of pork genomic DNA. The obtained results and the application of the calculation formula provided the following concentration levels (in number of copies) for the quantity of total proteins and specific pork proteins, shiwn in Table 13.
3.3.3. Detection of the Gallinacean Species (Quality/Quantity)
On the basis of the same analysis principle, an experiment was optimized for a chicken matrix. Chicken sausage was selected as the matrix, as it may be easily adulterated and contain only a small quantity of this species and many other ingredients. This can make the meat qualitative and quantitative analysis difficult. The process included the simultaneous analysis of a set of samples represented by the chicken DNA extract in the kit (S5, represented by 50 copies). Table 14 shows the results obtained for six DNA replicates generated by extraction from the chicken sausage matrix and the five standards contained in the kit. Figure 4 illustrates the readings registered by real-time PCR.
Following the assessment of the obtained results, it was concluded that the analyzed product contained chicken, and the results obtained for the six DNA replicates were comparable. We then determined the content of chicken in the product considered in this study, using statistical analysis and the calculation formulae. The results are shown in Table 14.
The process included the simultaneous analysis of a set of samples represented by the chicken DNA extract in the kit (S5, represented by 50 copies). The results obtained are shown in Table 15.
The obtained results and the application of the calculation formula provided the following concentration levels (in number of copies) for the quantity of total proteins and chicken proteins (Table 16).
It can be concluded that real-time PCR can determine the meat quantity and species contained in a food product of animal origin.
3.4. Reproducibility
In order to make sure that the results obtained by the application of the analysis methods satisfied Regulation (EC) no. 1493/1999 [34], it was necessary to demonstrate that the results were reproducible. We thus performed laboratory analyses to this aim. The analysis included sample sets represented by chicken sausage, beef bologna, and pork bologna and was performed in two different days, using the same equipment, by two analysts (analyst 1 and analyst 2). The results obtained and the statistical calculations are shown in the tables below and their corresponding figures, as follows: for beef bologna sample Table 17, Table 18 and Figure 5; for pork bologna sample Table 19, Table 20 and Figure 6; for chicken sausage sample Table 21, Table 22 and Figure 7).
Table 23 includes a brief description of the performance parameter results for the method used to detect the species of origin (pork, chicken, and beef).
4. Conclusions
A real-time PCR analysis was successfully optimized and validated for processed meat products, allowing the detection and quantification of levels of meat up to 0.1% for pork and beef and 0.02% for chicken. The method was validated effectively using products with low meat content (chicken sausages, pork bologna, and beef bologna) confirming its correctness, accuracy, and repeatability. Following the validation of the performance parameters of the method, the three examined samples showed 100% specificity; repeatability was the highest for pork meat, followed by beef and chicken. Reproducibility was also the highest for pork, followed by beef and chicken. The quantification limit of 20 DNA copies for pork and beef corresponded to 0.2%, while that for chicken, of 50 copies, was 1%. Measurement uncertainty also was the highest for pork, followed by beef and chicken.
In all the tested samples (chicken sausages, pork bologna, and beef bologna), meat of the corresponding animal species was found, in agreement with what reported in the label, and the results obtained for the six DNA replicates were comparable. Using the real-time PCR technique, the determination of the quantity and species contained in processed food of animal origin was obtained. Real-time PCR is a fast and simple method of identifying meat species, it is very sensitive, and has an accuracy of detection of 0.1% DNA in the analyzed products. Considering that the presence of extraneous meat species in food products is one of the authenticity problems that worry the consumers, this paper demonstrates the importance of quality control and inspection programs in the meat industry, with the final aim of improving public and industrial safety and protecting human health.
Author Contributions
Conceptualization, L.-M.C., D.C.V.; Funding acquisition, D.C.V.; Investigation, L.-M.C.; Methodology, L.-M.C., D.C.V.; Software, L.-M.C.; Supervision, D.C.V.; Validation, D.C.V.; Writing—Original draft, L.-M.C.; Writing—Review & editing, D.C.V.
Funding
This research was funded by two grants from the Ministry of Research and Innovation: MCI-UEFISCDI, project no. 27/2018 CO FUND–MANUNET III-NON-ACT-2, and project no. 37 PFE-2018-2020, within PNCDI III.
Conflicts of Interest
The authors declare no conflict of interest.
References
- Nakyinsige, K.; Man, Y.B.C.; Sazili, A.Q. Halal authenticity issues in meat and meat products. Meat Sci. 2012, 91, 207–214. [Google Scholar] [CrossRef]
- Rodríguez, M.A.; García, T.; González, I.; Hernández, P.E.; Martín, R. TaqMan real-time PCR for the detection and quantitation of pork in meat mixtures. Meat Sci. 2005, 70, 113–120. [Google Scholar] [CrossRef] [PubMed]
- Vodnar, D.C.; Călinoiu, L.F.; Dulf, F.V.; Ştefănescu, B.E.; Crişan, G.; Socaciu, C. Identification of the bioactive compounds and antioxidant, antimutagenic and antimicrobial activities of thermally processed agro-industrial waste. Food Chem. 2017, 231, 131–140. [Google Scholar] [CrossRef] [PubMed]
- Montowska, M.; Alexander, M.R.; Tucker, G.A.; Barrett, D.A. Authentication of processed meat products by peptidomic analysis using rapid ambient mass spectrometry. Food Chem. 2015, 187, 297–304. [Google Scholar] [CrossRef] [PubMed]
- Sentandreu, M.Á.; Sentandreu, E. Authenticity of meat products: Tools against fraud. Food Res. Int. 2014, 60, 19–29. [Google Scholar] [CrossRef]
- Von Bargen, C.; Brockmeyer, J.; Humpf, H.-U. Meat Authentication: A New HPLC–MS/MS Based Method for the Fast and Sensitive Detection of Horse and Pork in Highly Processed Food. J. Agric. Food Chem. 2014, 62, 9428–9435. [Google Scholar] [CrossRef]
- Doosti, A.; Ghasemi Dehkordi, P.; Rahimi, E. Molecular assay to fraud identification of meat products. J. Food Sci. Technol. 2014, 51, 148–152. [Google Scholar] [CrossRef]
- Lanzilao, I.; Burgalassi, F.; Fancelli, S.; Settimelli, M.; Fani, R. Polymerase Chain Reaction-Restriction Fragment Length Polymorphism Analysis of Mitochondrial cytb Gene from Species of Dairy Interest. Available online: https://0-www-ingentaconnect-com.brum.beds.ac.uk/content/aoac/jaoac/2005/00000088/00000001/art00018 (accessed on 28 May 2019).
- Karabasanavar, N.S.; Singh, S.P.; Kumar, D.; Shebannavar, S.N. Detection of pork adulteration by highly-specific PCR assay of mitochondrial D-loop. Food Chem. 2014, 145, 530–534. [Google Scholar] [CrossRef]
- Karabasanavar, N.S.; Singh, S.P.; Kumar, D.; Shebannavar, S.N. Development and application of highly specific PCR for detection of chicken (Gallus gallus) meat adulteration. Eur. Food Res. Technol. 2013, 236, 129–134. [Google Scholar] [CrossRef]
- Kesmen, Z.; Sahin, F.; Yetim, H. PCR assay for the identification of animal species in cooked sausages. Meat Sci. 2007, 77, 649–653. [Google Scholar] [CrossRef]
- Walker, J.A.; Hughes, D.A.; Anders, B.A.; Shewale, J.; Sinha, S.K.; Batzer, M.A. Quantitative intra-short interspersed element PCR for species-specific DNA identification. Anal. Biochem. 2003, 316, 259–269. [Google Scholar] [CrossRef]
- Rao, Q.; Hsieh, Y.-H.P. Evaluation of a commercial lateral flow feed test for rapid detection of beef and sheep content in raw and cooked meats. Meat Sci. 2007, 76, 489–494. [Google Scholar] [CrossRef] [PubMed]
- Malmheden Yman, I.; Sandberg, K. Differentiation of meat from horse, donkey and their hybrids (mule/hinny) by electrophoretic separation of albumin. Meat Sci. 1987, 21, 15–23. [Google Scholar] [CrossRef]
- Armstrong, S.G.; Leach, D.N.; Wyllie, S.G. The use of HPLC protein profiles in fish species identification. Food Chem. 1992, 44, 147–155. [Google Scholar] [CrossRef]
- Kesmen, Z. A Research on the Meat Species Identification in Fresh and Processed Meat Products by Using PCR Techniques. Ph.D. Thesis, Ataturk University, Erzurum, Turkey, 2005. [Google Scholar]
- Chikuni, K.; Tabata, T.; Kosugiyama, M.; Monma, M.; Saito, M. Polymerase chain reaction assay for detection of sheep and goat meats. Meat Sci. 1994, 37, 337–345. [Google Scholar] [CrossRef]
- Martinez, I.; Malmheden Yman, I. Species identification in meat products by RAPD analysis. Food Res. Int. 1998, 31, 459–466. [Google Scholar] [CrossRef]
- Bartlett, S.E.; Davidson, W.S. FINS (forensically informative nucleotide sequencing): A procedure for identifying the animal origin of biological specimens. BioTechniques 1992, 12, 408–411. [Google Scholar]
- Brodmann, P.D.; Moor, D. Sensitive and semi-quantitative TaqManTM real-time polymerase chain reaction systems for the detection of beef (Bos taurus) and the detection of the family Mammalia in food and feed. Meat Sci. 2003, 65, 599–607. [Google Scholar] [CrossRef]
- Wolf, C.; Burgener, M.; Hübner, P.; Lüthy, J. PCR-RFLP Analysis of Mitochondrial DNA: Differentiation of Fish Species. LWT-Food Sci. Technol. 2000, 33, 144–150. [Google Scholar] [CrossRef]
- Ballin, N.Z. Authentication of meat and meat products. Meat Sci. 2010, 86, 577–587. [Google Scholar] [CrossRef]
- Sigma-Aldrich. Available online: http://www.sigmaaldrich.com/catalog/product/sigma/dntpca1?lang=en®ion=GB (accessed on 28 May 2019).
- Călinoiu, L.-F.; Ştefănescu, B.E.; Pop, I.D.; Muntean, L.; Vodnar, D.C. Chitosan Coating Applications in Probiotic Microencapsulation. Coatings 2019, 9, 194. [Google Scholar] [CrossRef]
- Călinoiu, L.F.; Cătoi, A.-F.; Vodnar, D.C. Solid-State Yeast Fermented Wheat and Oat Bran as A Route for Delivery of Antioxidants. Antioxidants 2019, 8, 372. [Google Scholar] [CrossRef] [PubMed]
- Stana, A.; Enache, A.; Vodnar, D.C.; Nastasă, C.; Benedec, D.; Ionuț, I.; Login, C.; Marc, G.; Oniga, O.; Tiperciuc, B. New Thiazolyl-triazole Schiff Bases: Synthesis and Evaluation of the Anti-Candida Potential. Molecules 2016, 21, 1595. [Google Scholar] [CrossRef] [PubMed]
- Mocan, A.; Moldovan, C.; Zengin, G.; Bender, O.; Locatelli, M.; Simirgiotis, M.; Atalay, A.; Vodnar, D.C.; Rohn, S.; Crisan, G. UHPLC-QTOF-MS analysis of bioactive constituents from two Romanian Goji (Lycium barbarum L.) berries cultivars and their antioxidant, enzyme inhibitory, and real-time cytotoxicological evaluation. Food Chem. Toxicol. 2018, 115, 414–424. [Google Scholar] [CrossRef] [PubMed]
- Vasile, C.; Rapa, M.; Stefan, M.; Stan, M.; Macavei, S.; Darie-Nita, R.N.; Barbu-Tudoran, L.; Vodnar, D.C.; Popa, E.E.; Stefan, R.; et al. New PLA/ZnO:Cu/Ag bionanocomposites for food packaging. Express Polym. Lett. 2017, 11, 531–544. [Google Scholar] [CrossRef]
- Mitrea, L.; Calinoiu, L.-F.; Precup, G.; Bindea, M.; Rusu, B.; Trif, M.; Stefanescu, B.-E.; Pop, I.-D.; Vodnar, D.-C. Isolated Microorganisms for Bioconversion of Biodiesel-Derived Glycerol Into 1,3-Propanediol. Bull. Univ. Agric. Sci. Vet. Med. Cluj-Napoca-Food Sci. Technol. 2017, 74, 43–49. [Google Scholar] [CrossRef]
- İlhak, O.İ.; Arslan, A. Identification of Meat Species by Polymerase Chain Reaction (PCR) Technique. Turk. J. Vet. Anim. Sci. 2007, 31, 159–163. [Google Scholar]
- Meyer, R.; Candrian, U.; Lüthy, J. Detection of pork in heated meat products by the polymerase chain reaction. J. AOAC Int. 1994, 77, 617–622. [Google Scholar]
- Shabani, H.; Mehdizadeh, M.; Mousavi, S.M.; Dezfouli, E.A.; Solgi, T.; Khodaverdi, M.; Rabiei, M.; Rastegar, H.; Alebouyeh, M. Halal authenticity of gelatin using species-specific PCR. Food Chem. 2015, 184, 203–206. [Google Scholar] [CrossRef]
- Murugaiah, C.; Noor, Z.M.; Mastakim, M.; Bilung, L.M.; Selamat, J.; Radu, S. Meat species identification and Halal authentication analysis using mitochondrial DNA. Meat Sci. 2009, 83, 57–61. [Google Scholar] [CrossRef]
- EUR-Lex-31999R1493-EN-EUR-Lex. Available online: https://eur-lex.europa.eu/legal-content/EN/TXT/?uri=CELEX:31999R1493 (accessed on 28 May 2019).
Figure 1.
Limit of detection (LOD) and five-point calibration curve for beef DNA (a), chicken DNA (b), pork DNA (c) (detection limit 10−3).
Figure 1.
Limit of detection (LOD) and five-point calibration curve for beef DNA (a), chicken DNA (b), pork DNA (c) (detection limit 10−3).

Figure 2.
Readings registered by real-time PCR: for the beef bologna sample analyzed during the reproducibility test (a), for the beef DNA extract from the kit (dilution S5) within the reproducibility study (b).
Figure 2.
Readings registered by real-time PCR: for the beef bologna sample analyzed during the reproducibility test (a), for the beef DNA extract from the kit (dilution S5) within the reproducibility study (b).

Figure 3.
Readings registered by real-time PCR: for the pork sausage sample analyzed during the reproducibility test (a), for the analyzed pork sausage sample and ST5 (20 copies of pork genomic DNA) within the reproducibility study (b).
Figure 3.
Readings registered by real-time PCR: for the pork sausage sample analyzed during the reproducibility test (a), for the analyzed pork sausage sample and ST5 (20 copies of pork genomic DNA) within the reproducibility study (b).

Figure 4.
Readings registered by real-time PCR: for the chicken sausage sample analyzed during the reproducibility test (a), for the analyzed chicken sausage sample and ST5 (50 copies of chicken genomic DNA) in the reproducibility study (b).
Figure 4.
Readings registered by real-time PCR: for the chicken sausage sample analyzed during the reproducibility test (a), for the analyzed chicken sausage sample and ST5 (50 copies of chicken genomic DNA) in the reproducibility study (b).

Figure 5.
Readings of real-time PCR for the beef bologna sample analyzed during the reproducibility study (Ref and Bos): results obtained by analyst 1 (a) and analyst 2 (b).
Figure 5.
Readings of real-time PCR for the beef bologna sample analyzed during the reproducibility study (Ref and Bos): results obtained by analyst 1 (a) and analyst 2 (b).

Figure 6.
Readings of real-time PCR for the pork bologna sample analyzed in the reproducibility study (Ref and Sus): determinations made by analyst 1 (a) and analyst 2 (b).
Figure 6.
Readings of real-time PCR for the pork bologna sample analyzed in the reproducibility study (Ref and Sus): determinations made by analyst 1 (a) and analyst 2 (b).

Figure 7.
Readings of real-time PCR for the chicken sausage sample analyzed during the reproducibility study (Ref and Gallus): determinations made by analyst 1 (a) and analyst 2 (b).
Figure 7.
Readings of real-time PCR for the chicken sausage sample analyzed during the reproducibility study (Ref and Gallus): determinations made by analyst 1 (a) and analyst 2 (b).


Table 1.
Components of the reaction mix, depending on the examined species, and quantities necessary for the preparation of the mix for 10 Real-Time PCR tests.
Table 1.
Components of the reaction mix, depending on the examined species, and quantities necessary for the preparation of the mix for 10 Real-Time PCR tests.
| Mix Components | Quantity/Reaction (µL) | 10 Reactions (10% Excess) |
|---|---|---|
| Reaction mix Ref/Reaction mix Bos | 18.0 | 198.0 |
| Taq Polymerase | 0.1 | 1.1 |
| Total volume | 18.1 | 199.1 |
| Reaction mix Ref/Reaction mix Sus | 18.0 | 198.0 |
| Taq Polymerase | 0.1 | 1.1 |
| Total volume | 18.1 | 199.1 |
| Reaction mix Ref/Reaction mix Gallus | 19.9 | 218.9 |
| Taq Polymerase | 0.1 | 1.1 |
| Total volume | 20 | 220.0 |
Table 2.
DNA dilutions for beef and pork.
| Standard | Dilutions | No. of Copies/µL | No. of Copies/Reaction (for the Volume of 2 µL Standard DNA Used in the Reaction) |
|---|---|---|---|
| S1 | 45 µL buffer TE + 5 µL Standard DNA | 100,000 copies | 200,000 copies |
| S2 | 45 µL buffer TE + 5 µL S1 | 10,000 copies | 20,000 copies |
| S3 | 45 µL buffer TE + 5 µL S2 | 1000 copies | 2000 copies |
| S4 | 45 µL buffer TE + 5 µL S3 | 100 copies | 200 copies |
| S5 | 45 µL buffer TE + 5 µL S4 | 10 copies | 20 copies |
Table 3.
DNA dilutions for chicken.
| Standard | Dilutions | No. Copies/µL | No. of Copies/Reaction (for the Volume of 5 µL Standard DNA Used in the Reaction) |
|---|---|---|---|
| S1 | 45 µL buffer TE + 5 µL Standard DNA | 100,000 copies | 500,000 copies |
| S2 | 45 µL buffer TE + 5 µL S1 | 10,000 copies | 50,000 copies |
| S3 | 45 µL buffer TE + 5 µL S2 | 1000 copies | 5000 copies |
| S4 | 45 µL buffer TE + 5 µL S3 | 100 copies | 500 copies |
| S5 | 45 µL buffer TE + 5 µL S4 | 10 copies | 50 copies |
Table 4.
Real-time PCR protocol for the beef and pork species with fluorescence reporter dye (FAM) and fluorescence quencher dye (TAMRA).
Table 4.
Real-time PCR protocol for the beef and pork species with fluorescence reporter dye (FAM) and fluorescence quencher dye (TAMRA).
| Settings | Blockcycler | Rotorcycler | Lightcycler |
|---|---|---|---|
| Initial denaturation (HOLD) Cycles Denaturation Annealing/Extension (CYCLE) | 5 min, 95 °C 45 10 s, 95 °C 15 s, 62 °C 30 s, 65 °C | 1 min, 95 °C 45 5 s, 95 °C 10 s, 62 °C 15 s, 65 °C | 1 min, 95 °C 45 5 s, 95 °C 10 s, 62 °C 15 s, 65 °C |
| Temperature of the transition/time ratio | Maximum | Maximum | Maximum |
| Fluorescence detector | Detection: End of extension phase Reporter: FAM Quencher: TAMRA Passive reference; none | Reporter: FAM | Channel 530/610 or F1/F2 Acquisition mode: single in extension phase |
Table 5.
Real Time-PCR protocol for the identification of chicken meat.
| Settings | Blockcycler | Lightcycler/Rotorcycler |
|---|---|---|
| Initial denaturation (HOLD) | 5 min, 95 °C | 1 min, 95 °C |
| Cycles | 45 | 45 |
| Denaturation | 15 s, 95 °C | 10 s, 95 °C |
| Annealing/Extension (CYCLE) | 30 s, 60 °C | 15 s, 60 °C |
| Temperature of the transition/time ratio | Maximum | 20 °C/s |
| Fluorescence detector | Detection: End of the extension phase Reporter: FAM Quencher: TAMRA | Channel 530/610 or F1/F2 Acquisition mode: single in the extension phase |
Table 6.
Selectivity and specificity results.
| PRODUCT | DATE | |||||
|---|---|---|---|---|---|---|
| 13.03.2018 | 14.03.2018 | 28.03.2018 | 29.03.2018 | 23.06.2018 | 27.06.2018 | |
| Chicken Detection | Chicken Detection | Beef Detection | Beef Detection | Pork Detection | Pork Detection | |
| Chicken sausage | positive | positive | negative | negative | negative | negative |
| Chicken sausage | positive | positive | negative | negative | negative | negative |
| Chicken sausage | positive | positive | negative | negative | negative | negative |
| Beef bologna | negative | negative | positive | positive | negative | negative |
| Beef bologna | negative | negative | positive | positive | negative | negative |
| Beef bologna | negative | negative | positive | positive | negative | negative |
| Pork bologna | negative | negative | negative | negative | positive | positive |
| Pork bologna | negative | negative | negative | negative | positive | positive |
| Pork bologna | negative | negative | negative | negative | positive | positive |
Table 7.
Work dilutions for DNA standards depending on the analyzed species.
| Standard | No. of Copies Certified DNA | Dilution Factor | The Determined Number of Copies | |
|---|---|---|---|---|
| Total Meat | Species | |||
| S5 beef | 20 | 1:4 | 6.53 | 5.42 |
| S5 chicken | 50 | 1:10 | 5.08 | 4.28 |
| S5 pork | 20 | 1:4 | 8.10 | 8.08 |
Table 8.
Results of the reproducibility study for the beef bologna sample.
| Product | No. of DNA Copies | Beef% | |
|---|---|---|---|
| Total Protein (Ref) | Beef Species (Bos) | ||
| Beef bologna | 4430 | 3053 | 81.32 |
| 4473 | 2890 | 76.24 | |
| 2323 | 1545 | 78.48 | |
| 2201 | 1804 | 96.72 | |
| 5580 | 3982 | 84.21 | |
| 5577 | 3995 | 84.53 | |
| Positive control | 1028 | 868.6 | R% = 84.49, K = 1.18 |
Table 9.
Statistical calculation for the establishment of standard deviation (sr), relative standard deviation (RSDr), and reproducibility limit (r).
Table 9.
Statistical calculation for the establishment of standard deviation (sr), relative standard deviation (RSDr), and reproducibility limit (r).
| Reproducibility from Serial Analysis | Replicates | Statistical Calculation | |||||||||
|---|---|---|---|---|---|---|---|---|---|---|---|
| Matrix | Data | 1 | 2 | 3 | 4 | 5 | 6 | average | sr | RSDr | r |
| beef bologna | 06.04.2018 | 81.32 | 76.24 | 78.48 | 96.72 | 84.21 | 84.53 | 83.583 | 7.197 | 0.086 | 20.150 |
Table 10.
Results obtained for the beef DNA extract provided in the kit (dilution S5).
| Reproducibility from Serial Analysis | Replicates (Beef No. of Copies) | ||||||||||
|---|---|---|---|---|---|---|---|---|---|---|---|
| Matrix | Data | Conc. level | 1 | 2 | 3 | 4 | 5 | M | Std dev | RSDr | r |
| S5 | 05.04.2018 | 20 copies | 15.98 | 22.75 | 15.60 | 16.01 | 13.57 | 16.78 | 3.485 | 0.208 | 9.757 |
Table 11.
Statistical calculation for the establishment of sr, RSDr, and r.
| Reproducibility From Serial Analysis | Replicates | Statistical Calculation | |||||||||
|---|---|---|---|---|---|---|---|---|---|---|---|
| Matrix | Data | 1 | 2 | 3 | 4 | 5 | 6 | average | sr | RSDr | r |
| pork sausages | 02.06.2018 | 23.36 | 21.44 | 21.74 | 23.51 | 23.30 | 23.30 | 22,775 | 3443 | 0.114 | 7242 |
Table 12.
Results obtained for the pork DNA extract in the kit (dilution S5).
| Reproducibility from Serial Analysis | Replicates (Beef No. of Copies) | Statistical Calculation | ||||||||||
|---|---|---|---|---|---|---|---|---|---|---|---|---|
| Matrix | Data | Conc. level | 1 | 2 | 3 | 4 | 5 | 6 | M | Std dev | RSDr | r |
| S5 | 02.06.2018 | 20 copies | 102.8 | 95.68 | 92.04 | 77.85 | 80.40 | 100.9 | 91,628 | 10.44 | 0.114 | 29.24 |
Table 13.
Results of the reproducibility study for the pork sausage sample.
| Product | No. of DNA Copies | Pork (%) | |
|---|---|---|---|
| Total Protein (Ref) | Pork Species (Sus) | ||
| Pork sausages | 142,700 | 135,900 | 102.85 |
| 172,700 | 153,000 | 95.68 | |
| 139,400 | 118,800 | 92.04 | |
| 117,700 | 84,840 | 77.85 | |
| 140,500 | 104,600 | 80.40 | |
| 139,500 | 130,400 | 100.95 | |
| Positive control | 563.6 | 523 | R% = 92.80; K = 1.08 |
Table 14.
Statistical calculation for the establishment of sr, RSDr, and r.
| Reproducibility from Serial Analysis | Replicates | Statistical Calculation | |||||||||
|---|---|---|---|---|---|---|---|---|---|---|---|
| Matrix | Data | 1 | 2 | 3 | 4 | 5 | 6 | average | sr | RSDr | r |
| Chicken sausage | 3 July 2018 | 99.0 | 97.4 | 90.7 | 99.3 | 100 | 96.8 | 97.3 | 3.556 | 0.037 | 9.95 |
Table 15.
Results obtained for the chicken DNA extract in the kit (S5 represented by 50 copies aviary genomic DNA).
Table 15.
Results obtained for the chicken DNA extract in the kit (S5 represented by 50 copies aviary genomic DNA).
| Reproducibility from Serial Analysis | Replicates (Aviary Genomic DNA, No. of Copies) | Statistical Calculation | ||||||||||
|---|---|---|---|---|---|---|---|---|---|---|---|---|
| Matrix | Data | Conc. level | 1 | 2 | 3 | 4 | 5 | 6 | average | sr | RSDr | r |
| S5 | 03 July 2018 | 50 copies | 58.1 | 54.2 | 65.13 | 66.6 | 57.78 | 73.3 | 62.563 | 7.102 | 0.114 | 19.886 |
Table 16.
Results obtained in the reproducibility study for the chicken sausage sample.
| Product | No. of DNA Copies | Chicken% | |
|---|---|---|---|
| Total Protein (Ref) | Chicken Species (Gallus) | ||
| Chicken sausage | 117,400 | 110,700 | 99.01 |
| 119,200 | 110,600 | 97.42 | |
| 61,250 | 52,930 | 90.74 | |
| 61,330 | 58,020 | 99.33 | |
| 99,540 | 95,650 | 100.90 | |
| 102,500 | 94,550 | 96.86 | |
| Positive control | 569.9 | 542.2 | R% = 95.14 K = 1.05 |
Table 17.
Results obtained in the reproducibility study for the beef bologna sample.
| Analyst/Date | Product | No. of DNA Copies | Beef% | |
|---|---|---|---|---|
| Total Protein (Ref) | Beef Species (Bos) | |||
| Analyst 1/28.04.2018 | Beef bologna | 4430 | 3053 | 81.32 |
| 4473 | 2890 | 76.24 | ||
| 2323 | 1545 | 78.48 | ||
| 2201 | 1804 | 96.72 | ||
| 5580 | 3982 | 84.21 | ||
| 5577 | 3995 | 84.53 | ||
| Positive control | 1028 | 868.6 | R% = 84.49 K = 1.18 | |
| Analyst 2/06.04.2018 | Beef bologna | 3558 | 2519 | 82.83 |
| 3624 | 2730 | 88.13 | ||
| 1724 | 1421 | 96.43 | ||
| 1833 | 1490 | 95.10 | ||
| 4985 | 3415 | 80.15 | ||
| 5200 | 3542 | 79.69 | ||
| Positive control | 887.4 | 754 | R% = 84.96 K = 1.17 | |
Table 18.
Statistical calculation for the establishment of sr, RSDr, and r.
| Analyst | Data | Beef% | |
|---|---|---|---|
| 81.32 | |||
| 76.24 | |||
| Analyst 1 | 28/03/2018 | 78.48 | |
| 96.72 | |||
| 84.21 | |||
| 84.53 | |||
| 82.83 | |||
| 88.13 | |||
| Analyst 2 | 06.04.2018 | 96.43 | |
| 95.10 | |||
| 80.15 | |||
| 79.69 | |||
| Calculations | Average | 85,319 | |
| Sr | 7.190 | ||
| RSDr | 0.084 | ||
| r | 20,132 | ||
Table 19.
Results obtained in the reproducibility study for the pork bologna sample.
| Analyst/Date | Product | No. of DNA Copies | Pork% | |
|---|---|---|---|---|
| Total Protein (Ref) | Pork Species (Sus) | |||
| Analyst 1/02.11.2018 | Pork bologna | 142,700 | 135,900 | 102.85 |
| 172,700 | 153,000 | 95.68 | ||
| 139,400 | 118,800 | 92.04 | ||
| 117,700 | 84,840 | 77.85 | ||
| 140,500 | 104,600 | 80.40 | ||
| 139,500 | 130,400 | 100.95 | ||
| Positive control | 563.6 | 523.0 | R% = 92.80 K = 1.08 | |
| Analyst 2/06.11.2018 | Pork bologna | 141,500 | 139,000 | 99.22 |
| 162,100 | 166,700 | 103.87 | ||
| 163,100 | 171,500 | 106.20 | ||
| 167,600 | 170,000 | 102.45 | ||
| 146,500 | 158,600 | 109.34 | ||
| Positive control | 567.7 | 561.0 | R% = 98.82 K = 1.01 | |
Table 20.
Statistical calculation for the establishment of sr, RSDr, and r.
| Analyst | Data | Pork Species (%) | |
|---|---|---|---|
| 102.85 | |||
| 95.68 | |||
| Analyst 1 | 02/11/2018 | 78.48 | |
| 77.85 | |||
| 80.40 | |||
| 100.95 | |||
| 99.22 | |||
| 103.87 | |||
| Analyst 2 | 06/11/2018 | 106.20 | |
| 102.45 | |||
| 109.34 | |||
| Calculations | Average | 96,117 | |
| Sr | 11,606 | ||
| RSDr | 0.121 | ||
| r | 32,497 | ||
Table 21.
Results obtained in the reproducibility study for the chicken sausage sample.
| Analyst/Date | Product | No. of DNA Copies | Chicken% | |
|---|---|---|---|---|
| Total Protein (Ref) | Chicken Species (Gallus) | |||
| Analyst 1/03.07.2018 | Chicken sausage | 117,400 | 110,700 | 99.01 |
| 119,200 | 110,600 | 97.42 | ||
| 61,250 | 52,930 | 90.74 | ||
| 61,330 | 58,020 | 99.33 | ||
| 99,540 | 95,650 | 100.90 | ||
| 102,500 | 94,550 | 96.86 | ||
| Positive control | 569.9 | 542.2 | R% = 95.14 K = 1.05 | |
| Analyst 2/04.07.2018 | Chicken sausage | 11,990 | 11,670 | 102.20 |
| 13,910 | 13,170 | 99.41 | ||
| 4778 | 4092 | 89.92 | ||
| 5296 | 5149 | 102.09 | ||
| 9293 | 9087 | 102.67 | ||
| 8909 | 8867 | 104.50 | ||
| Positive control | 689.0 | 656.8 | R% = 95.33 K = 1.05 | |
Table 22.
Statistical calculation for the establishment of sr, RSDr, and r.
| Analyst | Data | Chicken Species (%) | |
|---|---|---|---|
| 99.01 | |||
| 97.42 | |||
| Analyst 1 | 03/07/2018 | 78.48 | |
| 99.33 | |||
| 100.90 | |||
| 96.86 | |||
| 102.20 | |||
| 99.41 | |||
| Analyst 2 | 04/07/2018 | 96.43 | |
| 102.09 | |||
| 102.67 | |||
| 104.50 | |||
| Calculations | Average | 98.28 | |
| Sr | 6.714 | ||
| RSDr | 0.068 | ||
| r | 18,799 | ||
Table 23.
Performance parameters of the detection method of meat origin species.
| Performance Parameters | Unit of Measure (UM) | Performance Criterion | Value Obtained Following Validation | ||
|---|---|---|---|---|---|
| Beef% | Pork% | Chicken% | |||
| Detection limit | % | LOD declared in the SureFood ANIMAL QUANT kit is of 5 DNA copies corresponding to a concentration of 0.1% for chicken and 0.04% for beef and pork. | A common LOD of 8 DNA copies was established | ||
| 0.1% | 0.1% | 0.2% | |||
| Quantification limit | % | 20 DNA copies 0.2% | 20 DNA copies 0.2% | 50 DNA copies 1% | |
| Selectivity/specificity | % | 100 | 100 | ||
| Repeatability | % | RSDr ≤ 25 R = 2.8 × sr | 8.6 20.15 | 11.4 29.24 | 3.70 9.96 |
| Reproducibility | % | RSDR ≤ 35 R = 2.8 × sr | 8.4 20.13 | 12.1 32.49 | 6.8 18.80 |
| Measurement uncertainty | % | Calculated for a confidence range of 95%, k = 2 | 17 | 24.28 | 13.83 |
© 2019 by the authors. Licensee MDPI, Basel, Switzerland. This article is an open access article distributed under the terms and conditions of the Creative Commons Attribution (CC BY) license (http://creativecommons.org/licenses/by/4.0/).
Share and Cite
MDPI and ACS Style
Chiş, L.-M.; Vodnar, D.C. Detection of the Species of Origin for Pork, Chicken and Beef in Meat Food Products by Real-Time PCR. Safety 2019, 5, 83. https://0-doi-org.brum.beds.ac.uk/10.3390/safety5040083
AMA Style
Chiş L-M, Vodnar DC. Detection of the Species of Origin for Pork, Chicken and Beef in Meat Food Products by Real-Time PCR. Safety. 2019; 5(4):83. https://0-doi-org.brum.beds.ac.uk/10.3390/safety5040083
Chicago/Turabian StyleChiş, Lavinia-Maria, and Dan Cristian Vodnar. 2019. "Detection of the Species of Origin for Pork, Chicken and Beef in Meat Food Products by Real-Time PCR" Safety 5, no. 4: 83. https://0-doi-org.brum.beds.ac.uk/10.3390/safety5040083
Note that from the first issue of 2016, this journal uses article numbers instead of page numbers. See further details here.