Article

Road Safety Analysis of High-Risk Roads: Case Study in Baja California, México

by
Marco Montoya-Alcaraz
,
Alejandro Mungaray-Moctezuma
*,
Julio Calderón-Ramírez
,
Leonel García
and
Cynthia Martinez-Lazcano
Faculty of Engineering, Universidad Autónoma de Baja California, Mexicali 21280, Mexico
*
Author to whom correspondence should be addressed.
Submission received: 14 August 2020 / Revised: 8 September 2020 / Accepted: 19 September 2020 / Published: 9 October 2020
(This article belongs to the Special Issue Sustainable and Safe Road Design)

Abstract

:
The objective of this research is to develop a useful procedure to assess and identify risks that promote accidents by road users, with the vision of improving safety through the implementation and technical employment of operative strategies. The relevance of this proposal lies in the fact that the issue of traffic accidents is a global problem. This project is located in the mountain range of Baja California, Mexico, in the Centinela–La Rumorosa highway and integrates accidental and pavement surface condition data, geometric design performance, analysis of traffic signals, and road safety devices present on the road using geodetic techniques. It is concluded that this procedure contributes to determining risk areas that promote accidents and generate a risk reduction plan to support future decision-making that guarantees better performance for road users. Furthermore, it is highlighted that the analysis of road safety must be a permanent process for those who operate, design, and build the road system.

1. Introduction

Road safety is a priority issue for governments, mainly for humanitarian, health, and economic reasons. According to the World Health Organization (WHO), road accidents cause the death of approximately 1.3 million people annually, just fewer than 3400 fatal accidents per day, additionally, between 30 and 50 million people suffer non-fatal injuries per year [1]. It is worth mentioning that most of the victims in traffic injuries are 90% associated with low and middle-income countries [2].
This is a global concern problem considered severe and has been addressed with direct solutions that can be implemented a priori through effective interventions and that are carried out from urban and transport planning in the design of safer roads, execution of road safety audits, as well as the establishment and application of internationally harmonized laws [3,4]. An example of this corresponds to the case of European countries, where the identification and treatment of critical areas, improvement of road design and traffic regulation, reduced the number of accidents by approximately 22% [5].
There are instruments such as the Highway safety guidelines: Accident reduction and prevention developed by the Institution of Highways Transportation [6] that it is intended to identify, analyze, and treat critical points of accidents, this being one of the most effective approaches on traffic accidents prevention. Likewise, the Road Safety Audit (RSA) processes developed in the United Kingdom in the 1980s and published in 1990 by the Institution of Highways and Transportation [7,8]. Among the specific benefits that RSA provides are safer new highways, crash prevention, severity reduction, safer road networks, reduction of whole-life cost of roads, and eventual safety improvements to standards and procedures, among others [9,10]. In this sense, Wilson and Lipinski [11] carried out a RSA practice state review in international cases such as the United States, Australia, New Zealand, Ireland, and Italy. Additionally, Persia et al. [12] performed a review of the main procedures that support the authority in decision-making related to improving safety in road networks, called Road Infrastructure Safety Management (RISM). However, it is relevant to highlight that not all countries are capable of implementing these procedures, emphasizing the lack of resources, staff, knowledge, legal regulations, and data for the application of the RISM procedures.
In Mexico, traffic accidents are among the ten main causes of death. Figures from the Ministry of Health of this country reveal that in 2015, just over 16 thousand people died because of this reason, an estimated rate of 13.3 deaths per 100,000 inhabitants, only 0.1% lower than the one registered in 2014. According to the document "Road safety in the Region of the Americas" [13], Mexico ranks 23 of 31 countries in deaths caused by traffic. In accordance with the Specific Action Program for Road Safety 2013–2018 [14], deaths and disabilities caused by road accident injuries are a growing public health problem in Mexico. Therefore, road safety surveillance and monitoring are imperative, since essential information can be obtained in order to design interventions and timely decision-making. However, this is not always fulfilled or carried out comprehensively.
As a result of the foregoing, as of the year 2014, there is a project that seeks to improve planning and decision-making regarding the safety of a road section. This project is located in a mountain range of Baja California, Mexico. The objective of this research is to develop a useful procedure to assess and identify risks that promote accidents in the users of roads, with the aim of improving safety through the implementation of technical and operative strategies.

2. Background

The vast majority of previous studies on accidents’ causes identification mainly focus on three significant risk factors and from those, different safety-related areas of research have been created: (1) the human factor and vehicle conditions, (2) the influence of environmental conditions, and (3) factors related to technical design and administration problems for highways [15].
In the first one of these risk factors, The American Association of State Highway Transportation Officials (AASHTO) through the Highway Safety Manual [16] highlights human factor as the main cause of road accidents. This is because drivers can make judgment errors; present distractions or inattention, as well as tiredness; carry out several tasks at the same time; and generate deliberate violations of security devices and laws. Therefore, several authors have analyzed the influence of these factors on the severity and occurrence of the accidents and, when appropriate, created accident prevention and reduction strategies [17,18,19,20]. Furthermore, Reason et al. [21] developed the Driver Behaviour Questionnaire (DBQ) at the University of Manchester, one of the most widely used instruments to measure driver behavior related to collision risk. This instrument is attributed to a questionnaire that has been applied and adapted to suit the context of different countries; for example; Stanojević et al. [22] applied the instrument in countries in south-eastern Europe; López-de-Cózar et al. [23] adapted it to the Spanish case; Cordazzo et al. [24] analyzed the North American context and modernized it [25].
Other studies analyze the relationship between visual and cognitive problems in elderly drivers with the risk of accidents [26,27,28,29]. Likewise, some studies focus on teenagers, with traffic accidents being the main cause of death in young people and adults between the ages of 5 and 29 worldwide [15]. These results indicate that the main causes of teenage driver accidents are associated with loss of control due to speeding, visual neglect on the road, alcohol and drug use, as well as cell phone use when driving [30,31,32,33,34]. As a matter of fact, the relationship between cell phone use and accidents has become relevant by itself in the study of human factors [35,36,37,38]. Although the literature focused on the relationship between vehicle conditions and accidents is low, accident reports point out the main aspects that influence vehicle accidents, including tire wear, brake system failures, as well as exhaust system failures [39].
In the second area, environmental phenomena that can increase the probability of a vehicle accident occurring are highlighted. Malin et al. [40] carried out a research that analyzes the risk relation between road accidents and weather conditions on different types of roads. According to the results, the relative risk of accidents on roads with icy or slippery surfaces is six times higher; additionally, the driver tends to be more susceptible to an accident when driving on a highway with bad weather conditions. Previous studies have analyzed the influence of precipitation and snowfall with the increase in accident rates, due to the loss of friction generated by tires, as well as the lack of visibility [41,42,43,44,45,46]. Moreover, several authors have analyzed the relation of lighting conditions and have incorporated other factors, such as high-speed driving, bad weather conditions, among others [47,48].
In the third area, several studies have been carried out that analyze the empirical relation between road accidents and the different variables of geometric road design, such as degrees of curvature, vertical slopes, and the balance of vertical and horizontal alignments, using different statistical models [49,50,51,52].
Wang et al. [53] review factors related to motor vehicle accidents on highways, with a specific focus on traffic and highways related factors, which helped in the development of methods and policies to improve road safety. Meanwhile, the Federal Highway Administration (FHWA) has developed the Interactive Highway Safety Design Model [54]. This tool provides engineers who design roads with information on the relations between geometry and accidents, in an accessible format for designers that is viable in the evaluation process of different alternatives, considering the different geometric design variables.
On the other hand, several authors have analyzed the existing relation between pavement conditions and the frequency and severity of accidents. However, the current literature discussion has not been able to clearly determine this influence. In this context, Chen et al. [55] mention that the research in this regard is ambiguous; the impact can be positive or negative, depending on heterogeneous factors such as driver behavior. For example, drivers may behave less responsibly on roads with adequate levels of service (LOS) and more carefully on roads with low LOS. Therefore, it seems plausible that a high LOS on the pavement could exhibit any number of accidents, which is, increasing or decreasing.
In accordance with the above, the causes of traffic accidents are a matter of statistical analysis, where the risk factor, the interaction, and the combination of these determine the preventive measures required according to the objective of the managing agency, the design engineer, or decision-maker. Rivera and Mendoza [56] mention that it is possible to measure the effectiveness of safety interventions through the analysis of accidents, by ranking the effectiveness in different criteria, such as reduction of accidents, reduction of deaths, and reduction in costs, among others. For example, Justo-Silva and Ferreira [57] carried out a research that incorporates accidents costs into maintenance planning processes and pavements rehabilitation; Konovalova and Zarovnaya [58] present a mathematical model developed to determine the appropriate actions of investors and the probable benefits that can be obtained from projects associated with road safety improvements; Esenou et al. [59] and Dong et al. [60] analyze road safety and technology laws implementation effects for speed control in vehicles and their impact on fatal accidents reduction in the United States.

3. Materials and Methods

3.1. Study Area

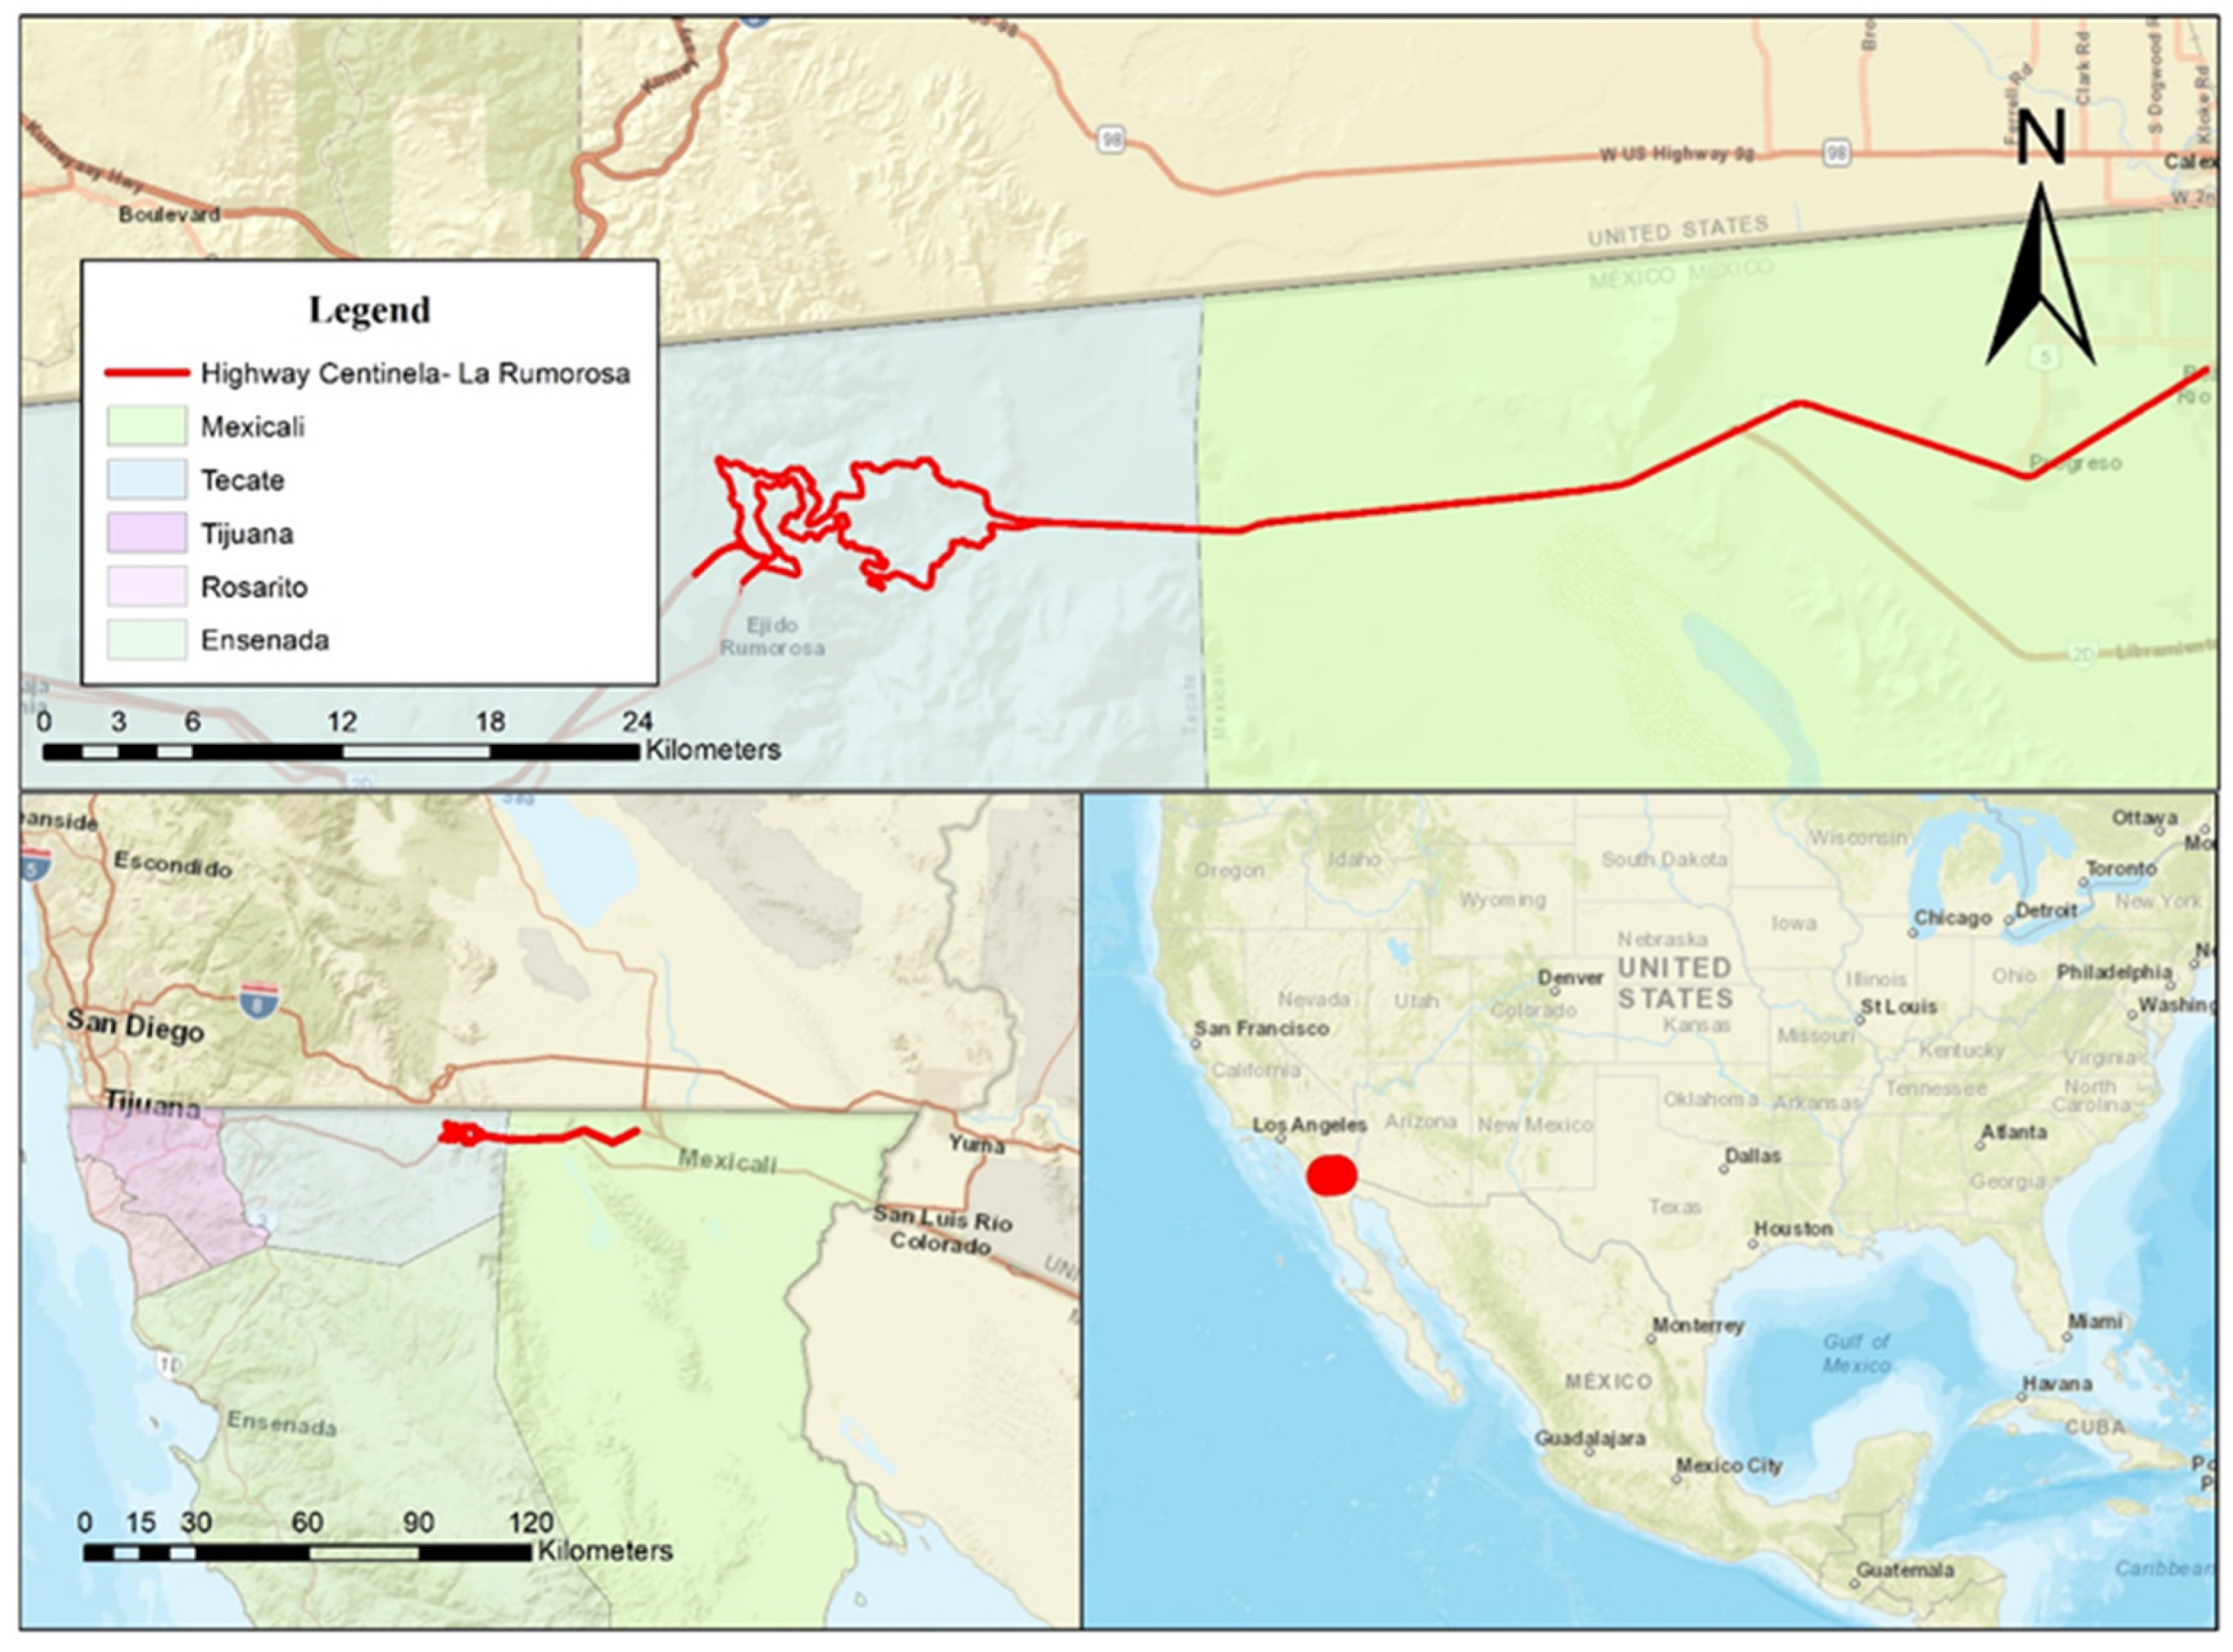
The Highway Centinela–La Rumorosa is located between the municipalities of Mexicali and Tecate in Baja California, Mexico (Figure 1) belonging to the Mexican Federal Highway no. 2 and its managed by the Investment Trust Funds Administration (FIARUM for its acronym in Spanish). With 64 kilometers in length, this road has two separate bodies with different traces and topographic conditions. From road section 0+000 to 18+000, it is considered an urban area of Mexicali, which has a flat topography and straight road sections; in the same way, this occurs with road section 18+000 to 42+000, additionally, this road has a mountainous zone with a considerable curve system from road section 42+000 to 64+000.
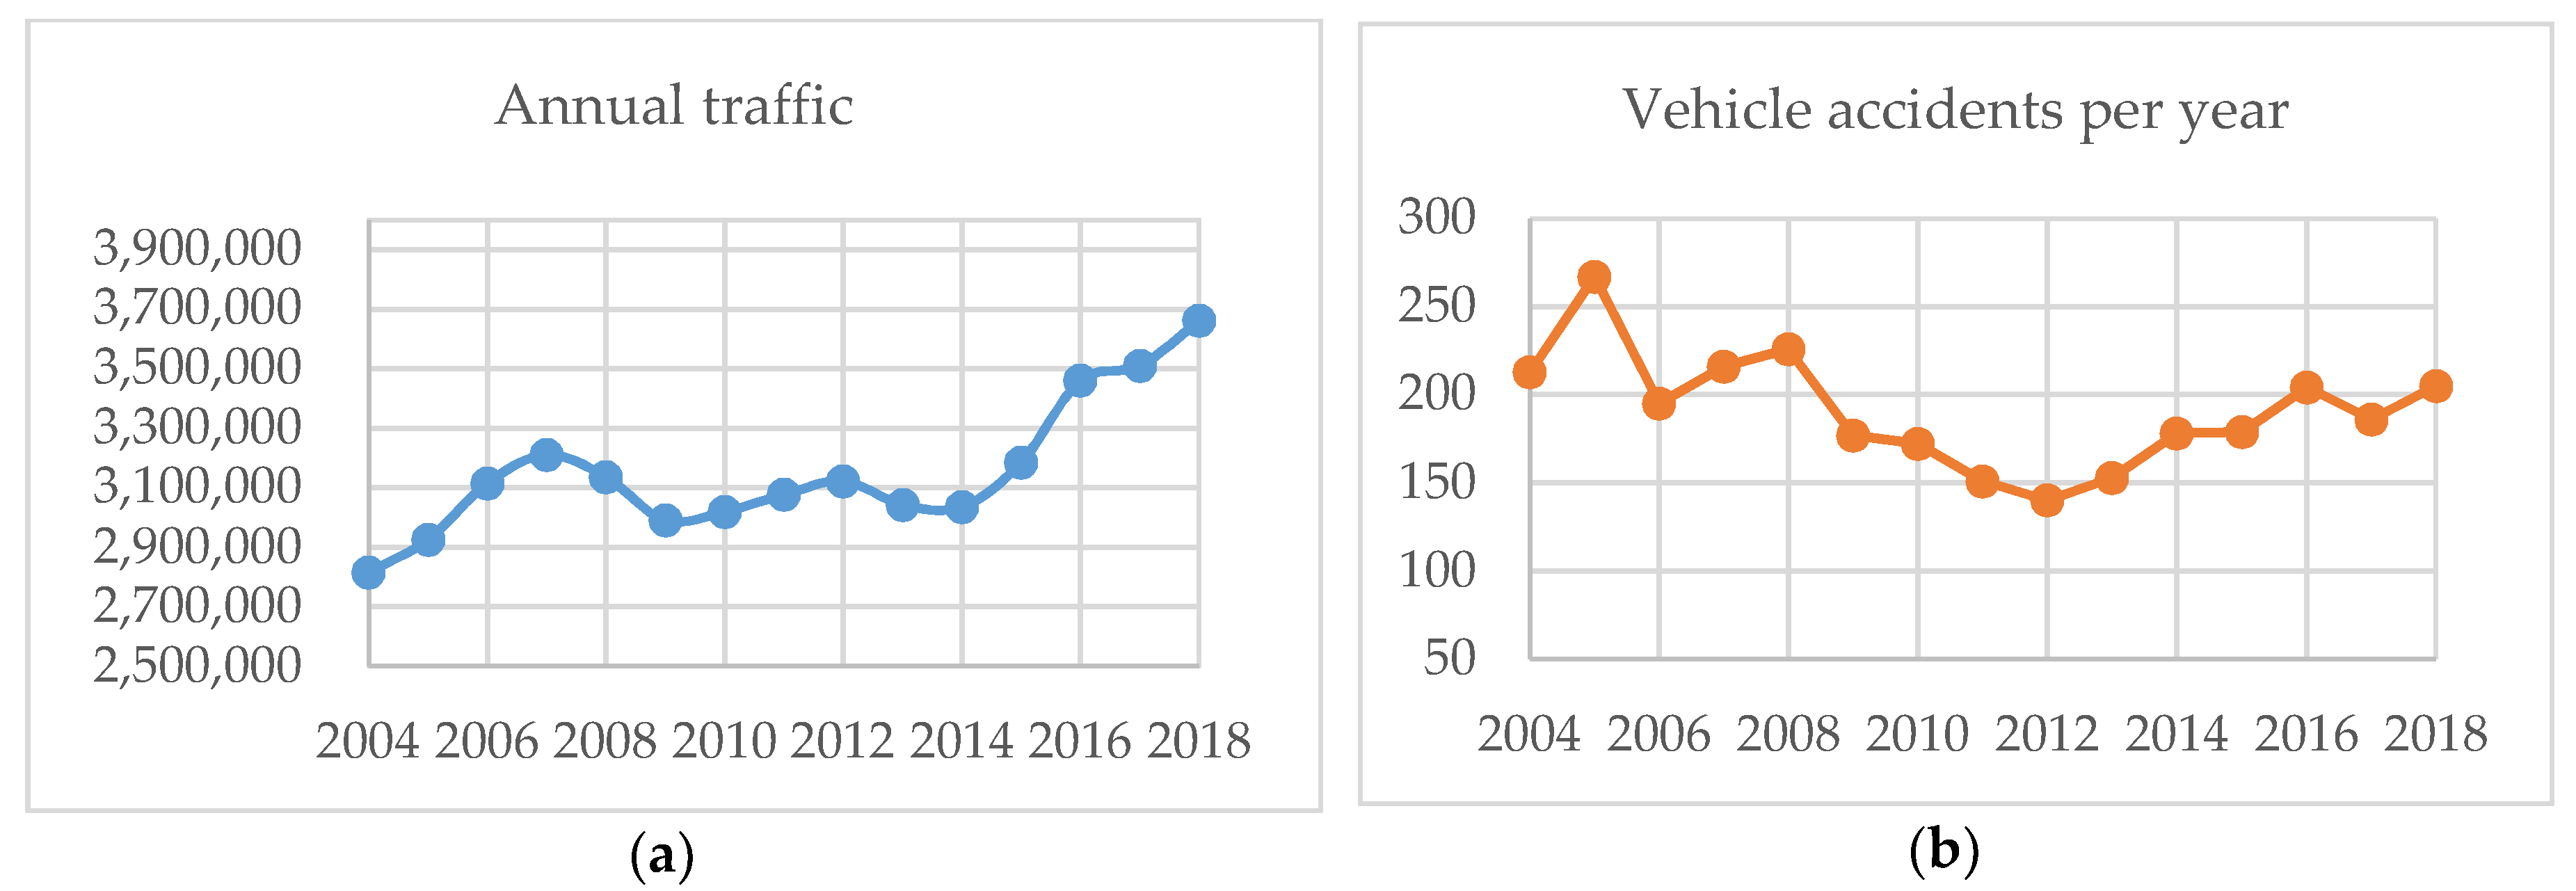
Although the section is in constant modernization, the average of road accidents that occur annually is 200. Therefore, the road is still considered one of the most dangerous in the country. It is worth mentioning that additionally to the topography and the system of curves of the highway, the climatic conditions and the environment where the section is located promote road accidents. The minimum temperatures recorded fall below −7 degrees Celsius, and the maximum temperatures exceed 54.3 degrees Celsius plus the presence of rain and snow. In addition, this road is in a seismic zone and therefore suffers structural damage and landslides in the mountainous area.

3.2. Analysis Methodology

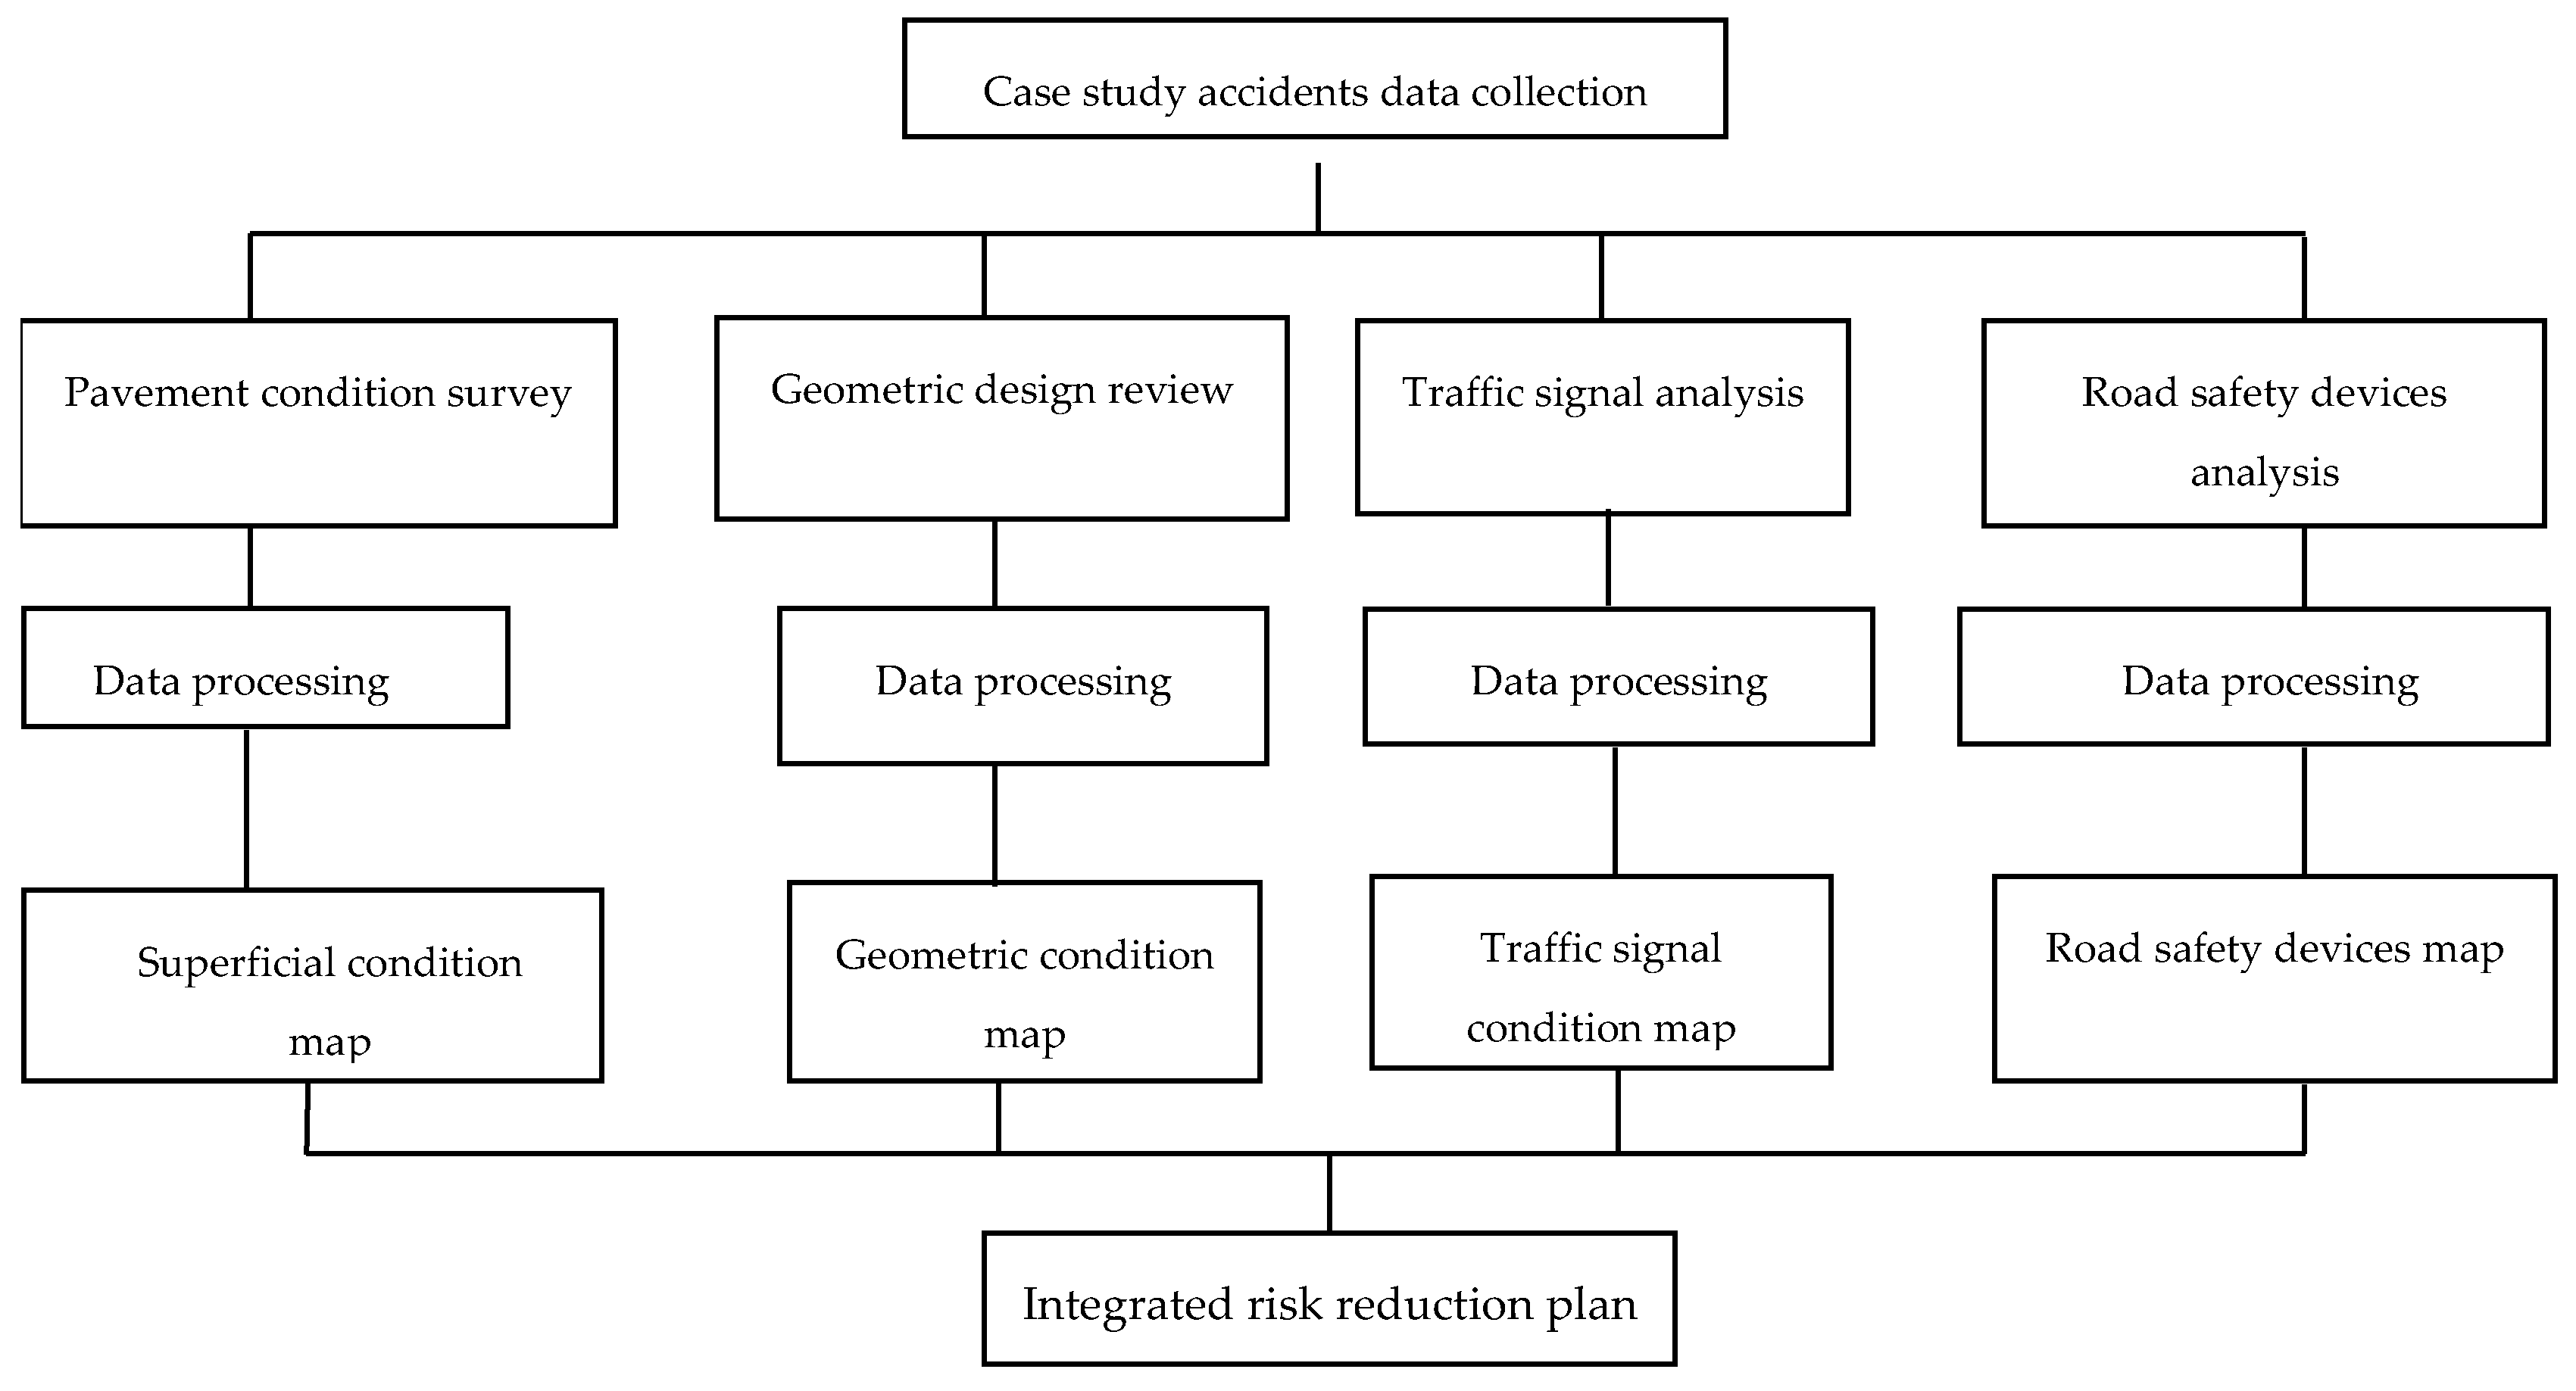
This methodology integrates representative data gathered from accidents of a case study with pavement surface condition data; the performance of the geometric design, that is, degree of curvature and inappropriate slopes; and an analysis of traffic signals and road safety devices present on the road, using geodetic techniques in order to determine risk areas that promote accidents and generate a risk reduction plan to support future decision-making that guarantees better performance for the users of this road. The structure of the model used in the current research work is presented below (Figure 2).
It is crucial to mention that this methodology is described separately in the following sections in order to, later on, carry out an integrated analysis with all the variables involved in this study. In standard practice, these analyses are carried out sporadically without a link between them or they are not carried out at all. All of the results must be integrated to achieve a better understanding of road safety and to make technical and operative proposals that promote road safety in areas that presented higher levels of risk during a period of analysis. Besides identifying the impact of the interventions that have already been carried out, the integral analysis allows knowing which one has worked, which one should continue to be applied, and which ones are not so convenient to continue to be applied due to the results delivered.

3.3. Accident Analysis

In this section, statistical information on accidents that have occurred on the Centinela–La Rumorosa highway is analyzed, obtaining data regarding the location of the accident, type of vehicle, and type of accident. With this, it is possible to statistically analyze accidents and to obtain critical accident concentration zones historically and by periods of years. This information is captured in a Geographic Information System (GIS), which allows identifying those sections with the highest degree of accidents. According to Yu et al. [61] an advantage of spatial analysis methods is that these methods can be easily applied in the network, identifying critical points and accident spatial patterns. With reference to Al-Aamri et al. [62] mention that accidents spatial analysis allows determining the influence of the road and characteristics related to traffic in the occurrence of these. That is why critical points are established from the accumulation of accidents at some point on the highway within a radius of 200 m. It is important to mention that this analysis is made from the information gathered and provided by the FIARUM agency.

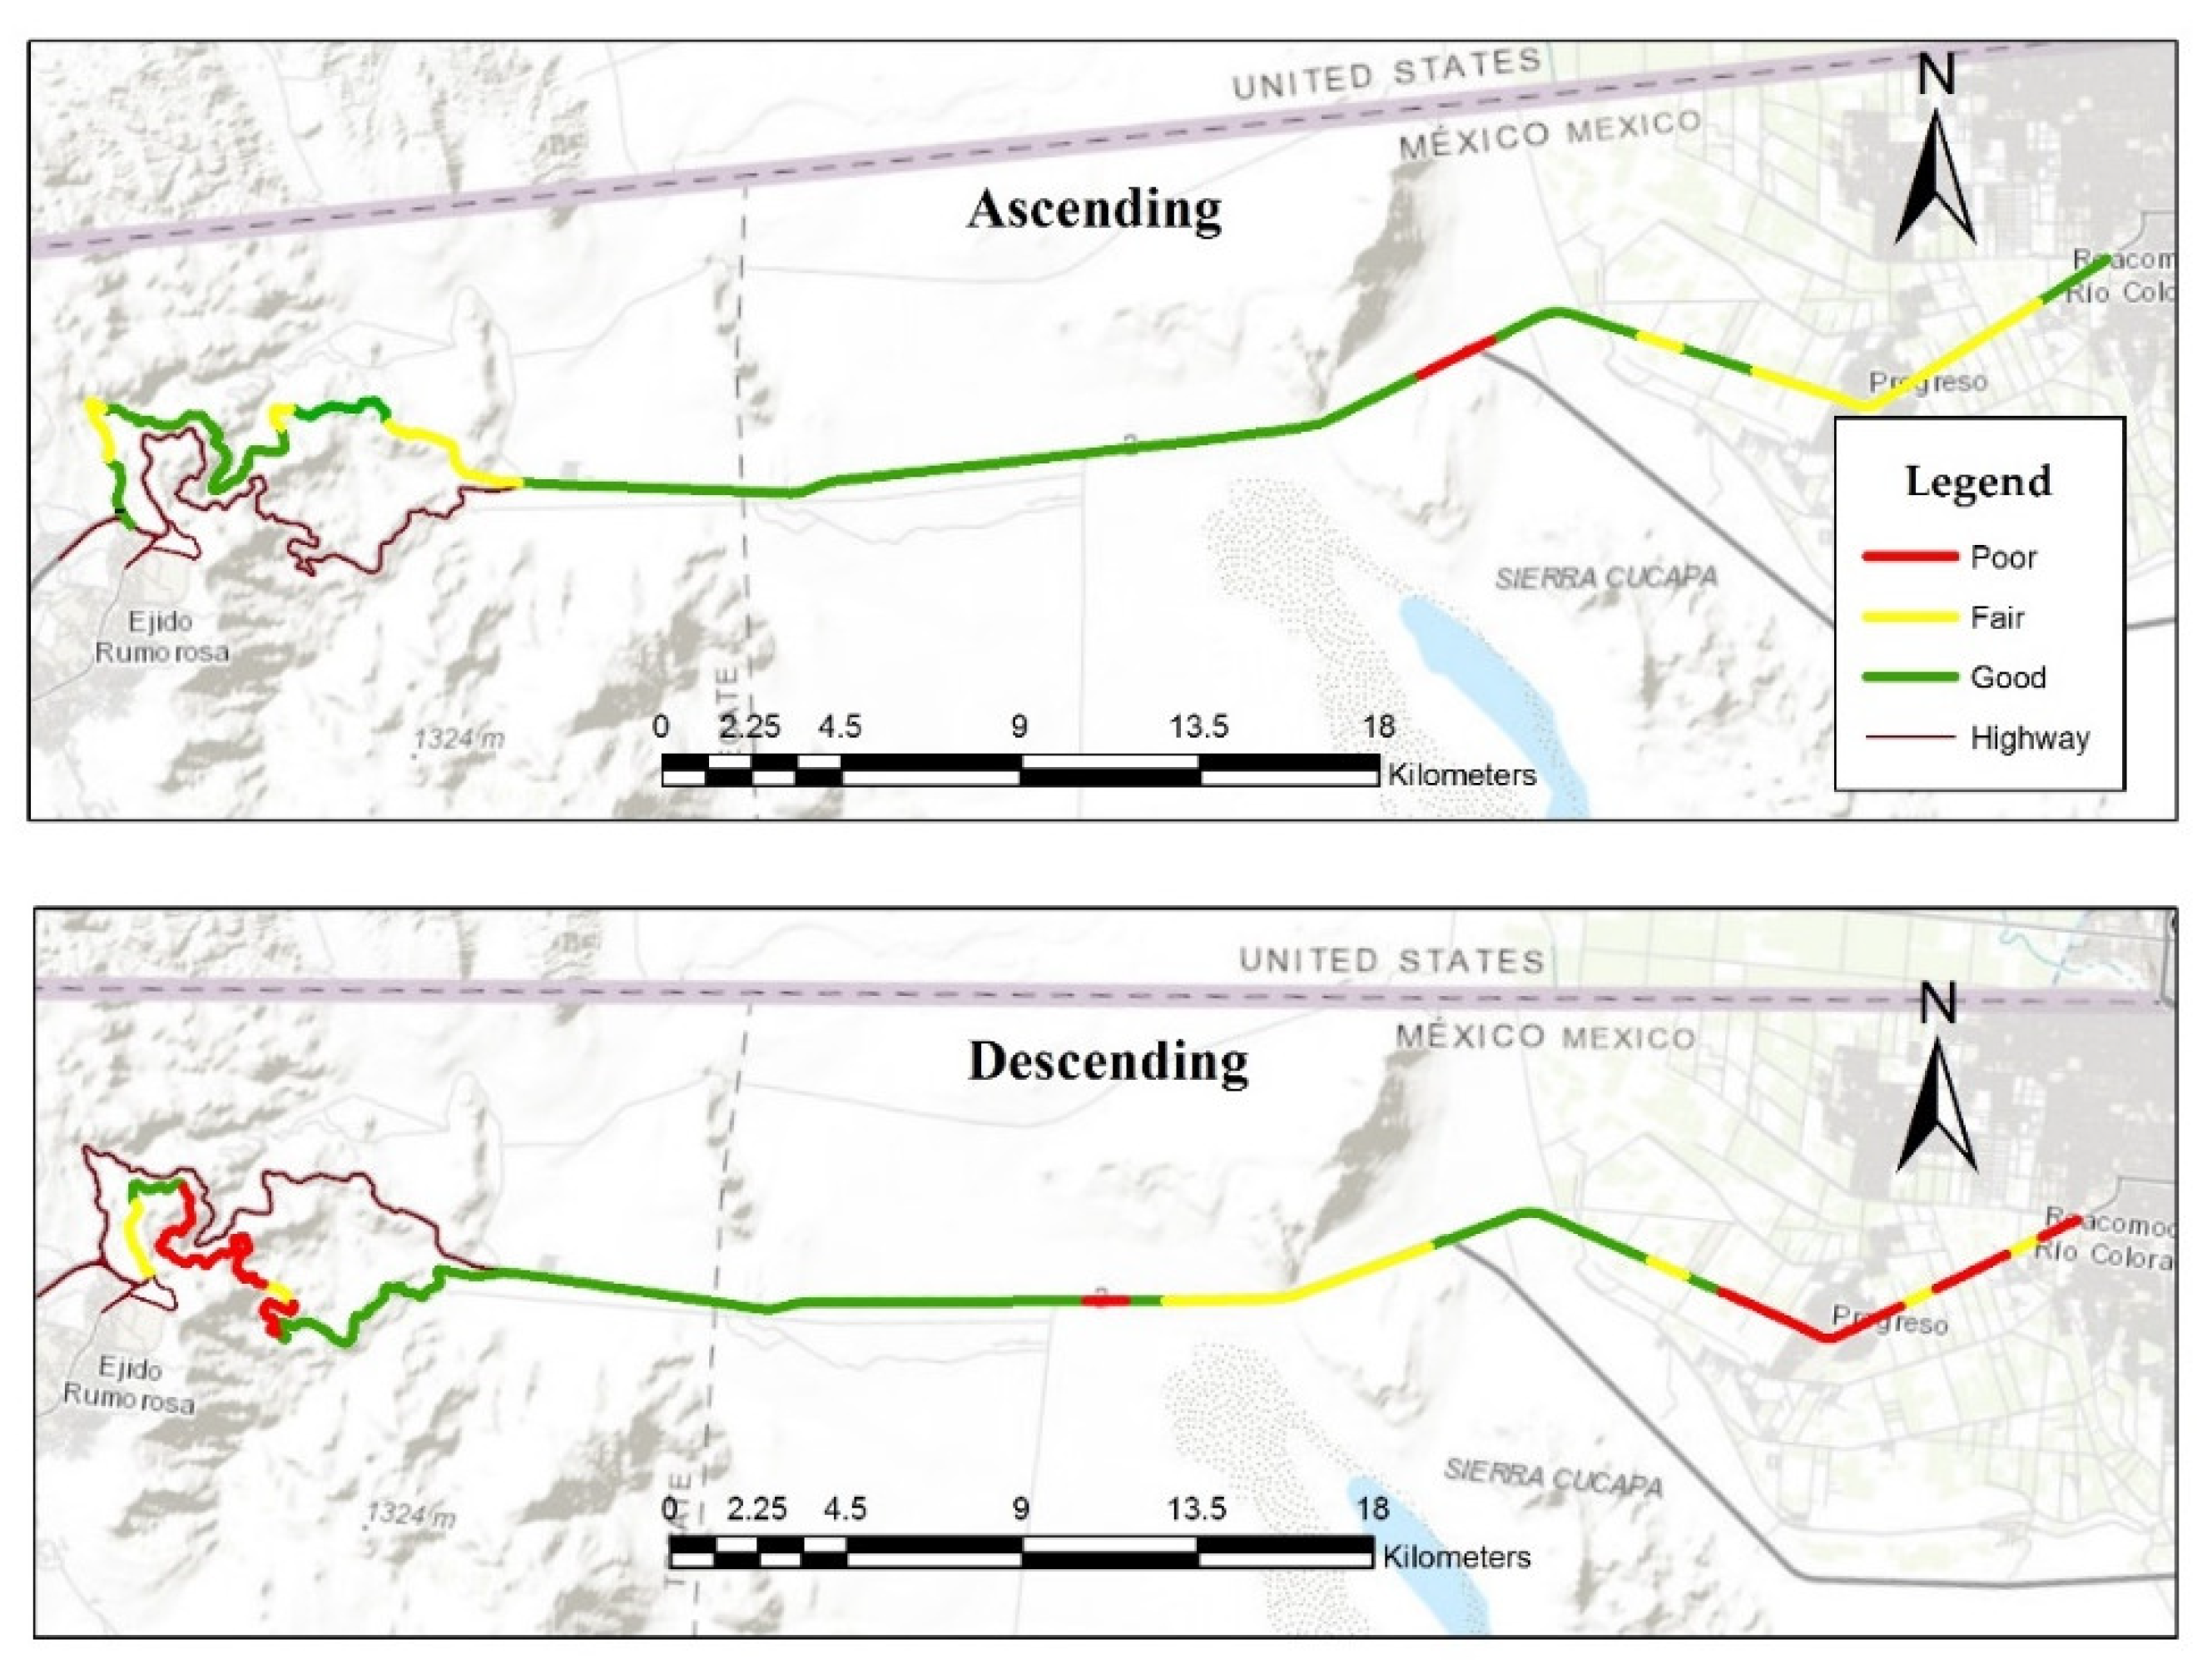
3.4. Pavement Superficial Characteristics

According to what is described in the literature review, it cannot be said that poor surface characteristics are, per se, the direct cause of accidents, but the consequences tend to worsen in certain situations where a conflict has occurred, for example, sudden braking or sudden change in vehicle direction [63]. As mentioned above, the main cause is attributed to the human factor. However, improvements in infrastructure characteristics tend to effectively influence road traffic safety. It is important to keep into account that, although accidents cannot be avoided entirely by means of preventive interventions, there is a potential to reduce the severity of these [64].
For the development of this analysis, the information obtained by Montoya et al. [65] was used, which carried out a pavement condition evaluation to obtain sustainable maintenance and rehabilitation (M&R) strategies. The authors used the criteria established by the ASHTOO and the HDM-4 program to measure pavement surface condition. Therefore, data gathered, as well as the deterioration information are classified according to these criteria (Table 1).

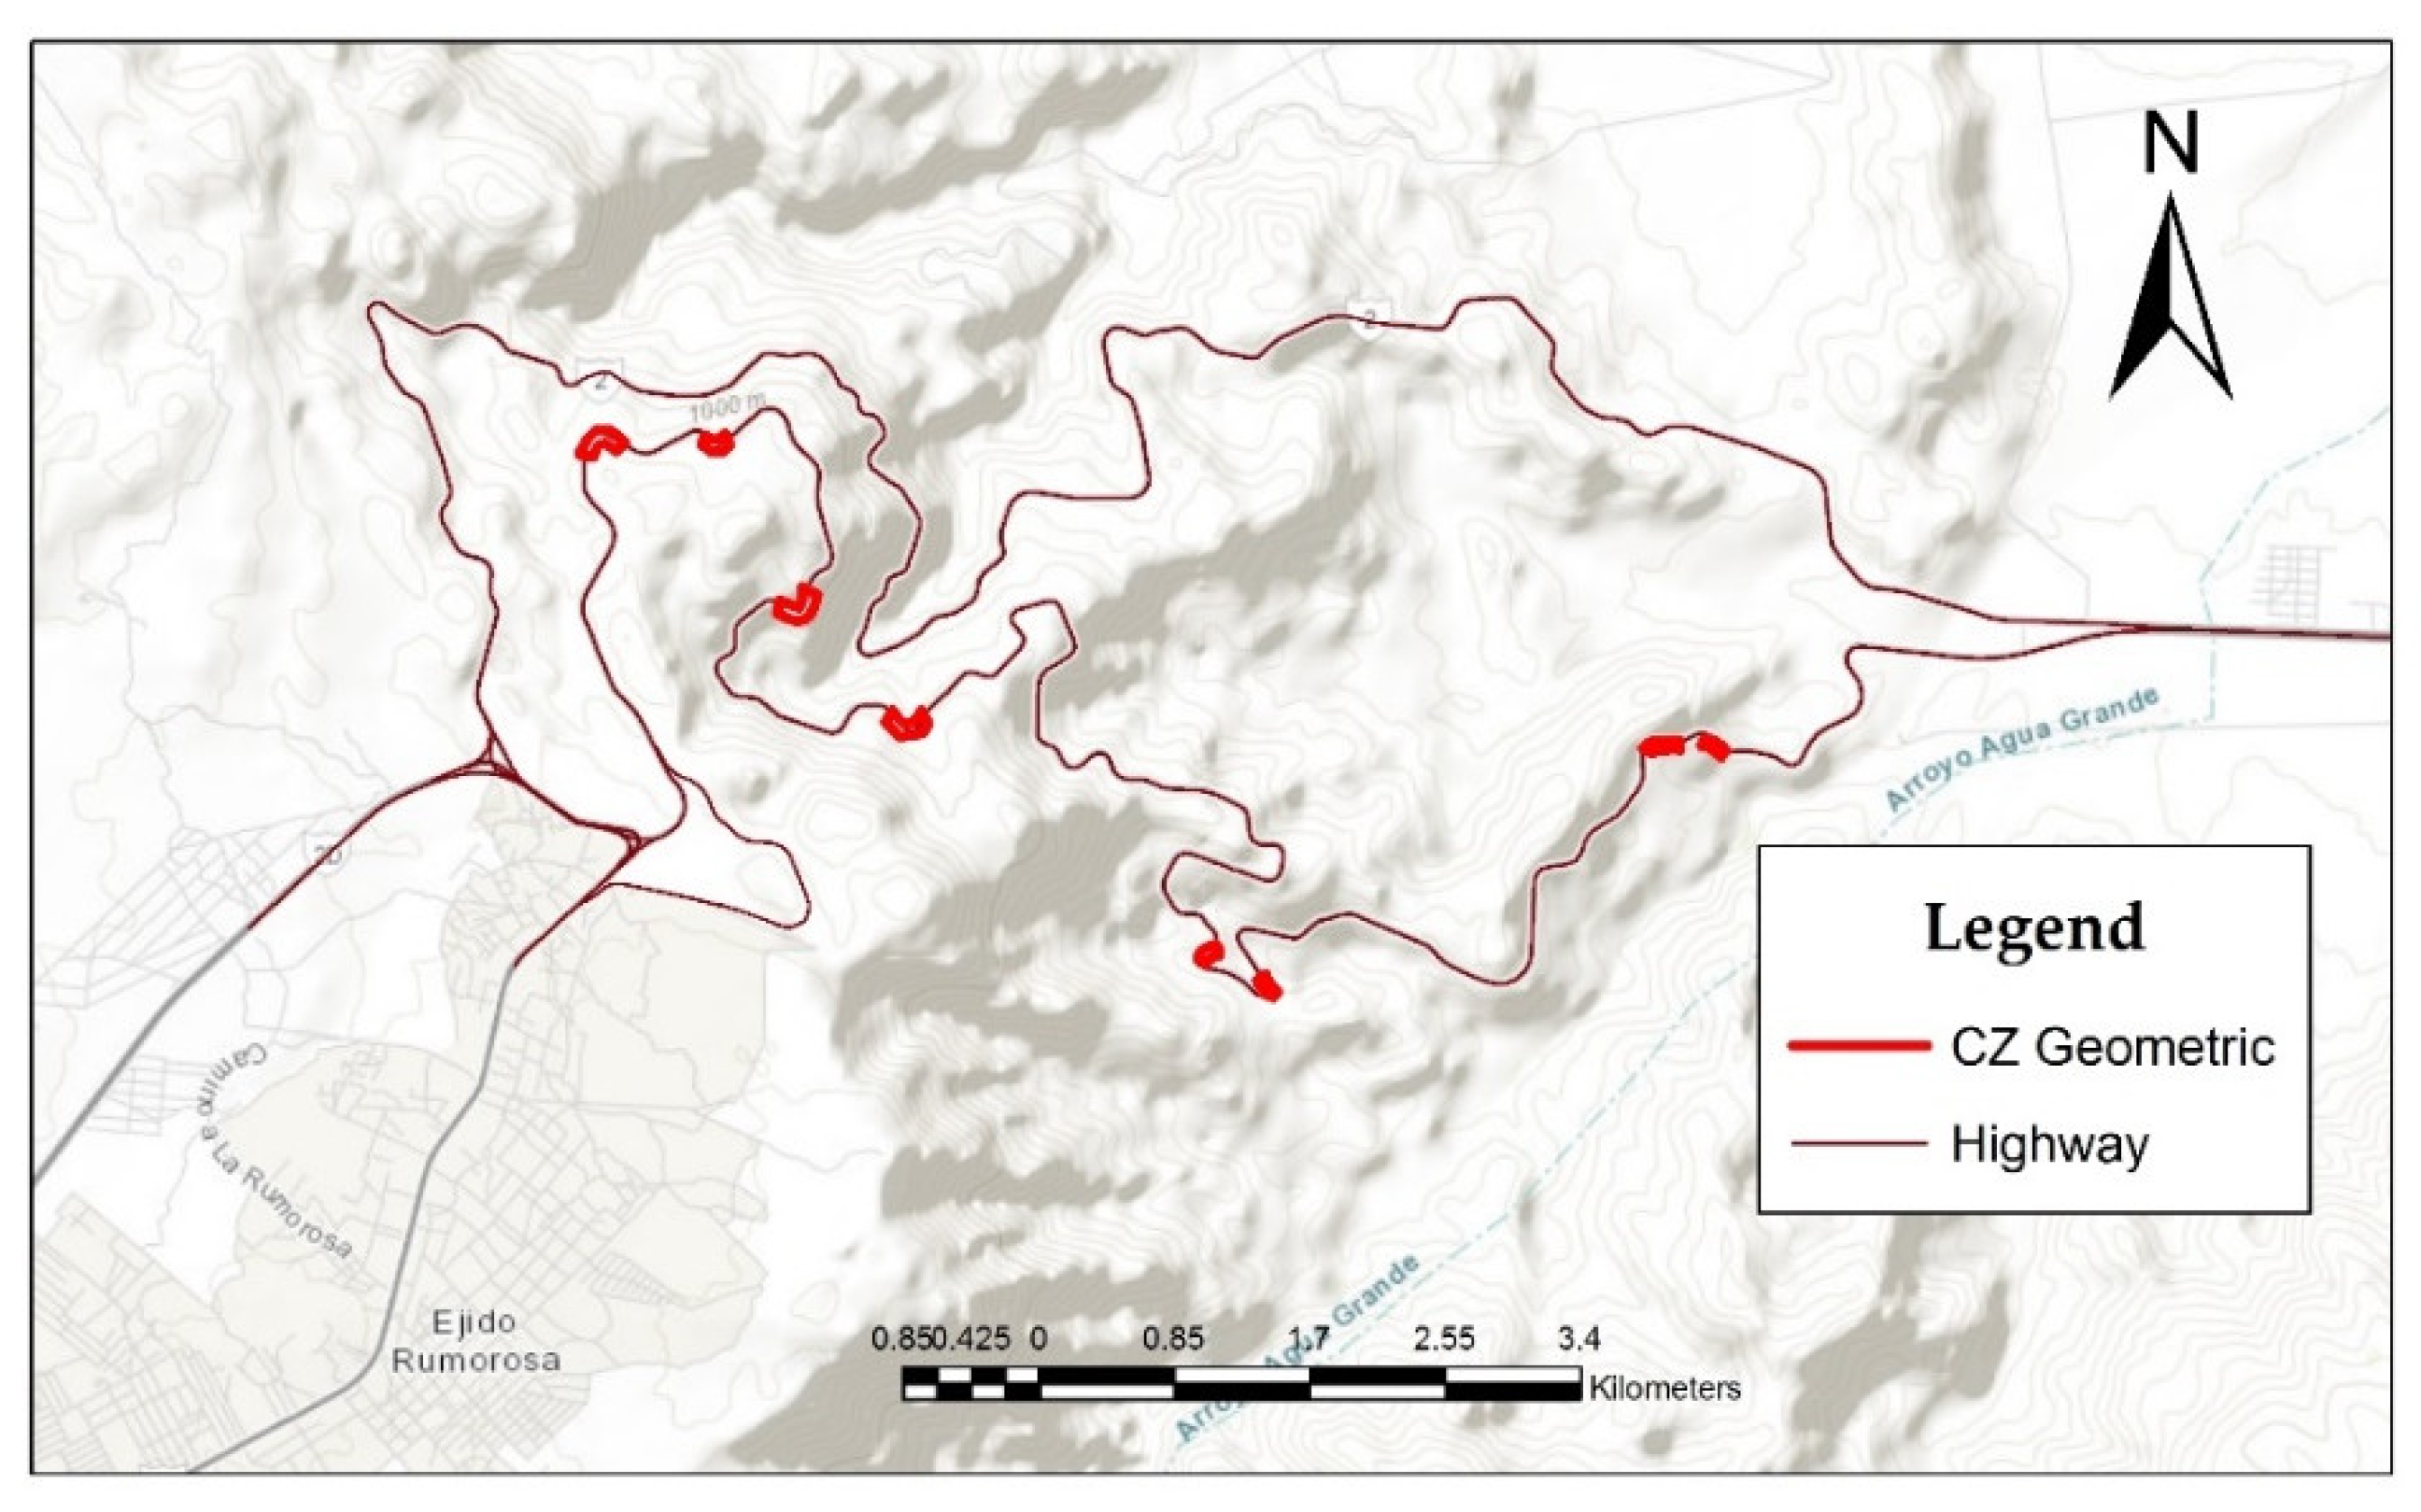
3.5. Geometric Design Review

The conventional criterion for the geometric project development is based on the use of project standards, which dimension the components of the road, separately and together, to achieve an adequate balance between the desirable attributes. Nevertheless, this cannot be done outside of the component ordering process, which depends on the creativity of the designer. For this reason, the rules are flexible, in the sense that rules only establish upper or lower limit values based on the type of road and the selection of the project speed. Within the geometric project, safety refers to the fact that elements of the road have characteristics that minimize the probability of traffic accidents occurrence. It is often said that a road is safe when the number of accidents is relatively low. It is worth mentioning that the geometric project must consider the correct horizontal and vertical alignment design since they are a key part in reducing accidents. The following information is obtained through what is described in the Road Geometric Project Manual of the Ministry of Communications and Transport (SCT for its acronym in Spanish) [66].
The horizontal alignment is the projection onto a horizontal plane of the road sub-crown axis. The elements that make up this alignment are tangents and horizontal curves. To achieve balance in road design, all geometric elements must be within practical economic conditions, designed to provide safe and continuous operation at an expected speed to be respected by drivers under normal road conditions. This can be accomplished by using design speed as an overall project control factor. Therefore, the design of curves on the road should be based on a suitable relation between design speed and curvature, as well as joint relations with lift and lateral friction. When two tangents are joined together by a curve, it is called a circular curve that can be to the left or the right. In this regard, the degree of curvature is the angle obtained by a 20 m arc and is calculated according to the following mathematical expressions.
G c 20 = 360 ° 2 π R c
G c = 1145.92 R c
where Gc is the degree of curvature, and Rc is the radius of curvature.
On the other hand, vertical alignment is the projection onto a vertical plane of the sub-crown axis development. This alignment is called the subgrade line. This is made up of tangents and vertical curves that are defined by slope and length. Table 2 shows the maximum slopes according to the speed and type of terrain on the road.
The best governing slope, being the greatest slope in the axis of a road at a given length and will be the one that, for each case, allows obtaining the lowest cost of construction, maintenance, and operation. The maximum slope is determined based on the vehicle and project speeds and depending on the type of terrain where the road is developed. Table 3 shows the governing slopes values and maximum slopes by type of terrain.
Furthermore, it is important to define the concept of over-elevation. This is the slope that the crown has towards the center of the curve to partially counteract the effect of a vehicle centrifugal force on the curves of horizontal alignment. There are practical upper limits to the degree of over-elevation possible in a horizontal curve; the limits refer to considerations about climate, ease of construction, use of the adjacent terrain, and the frequency of vehicles traveling at low speed.
Therefore, this analysis aims to identify critical areas generated from geometric alignments of the road. For this, degrees of curvature and slopes of the concerned section are analyzed and recorded in a GIS.

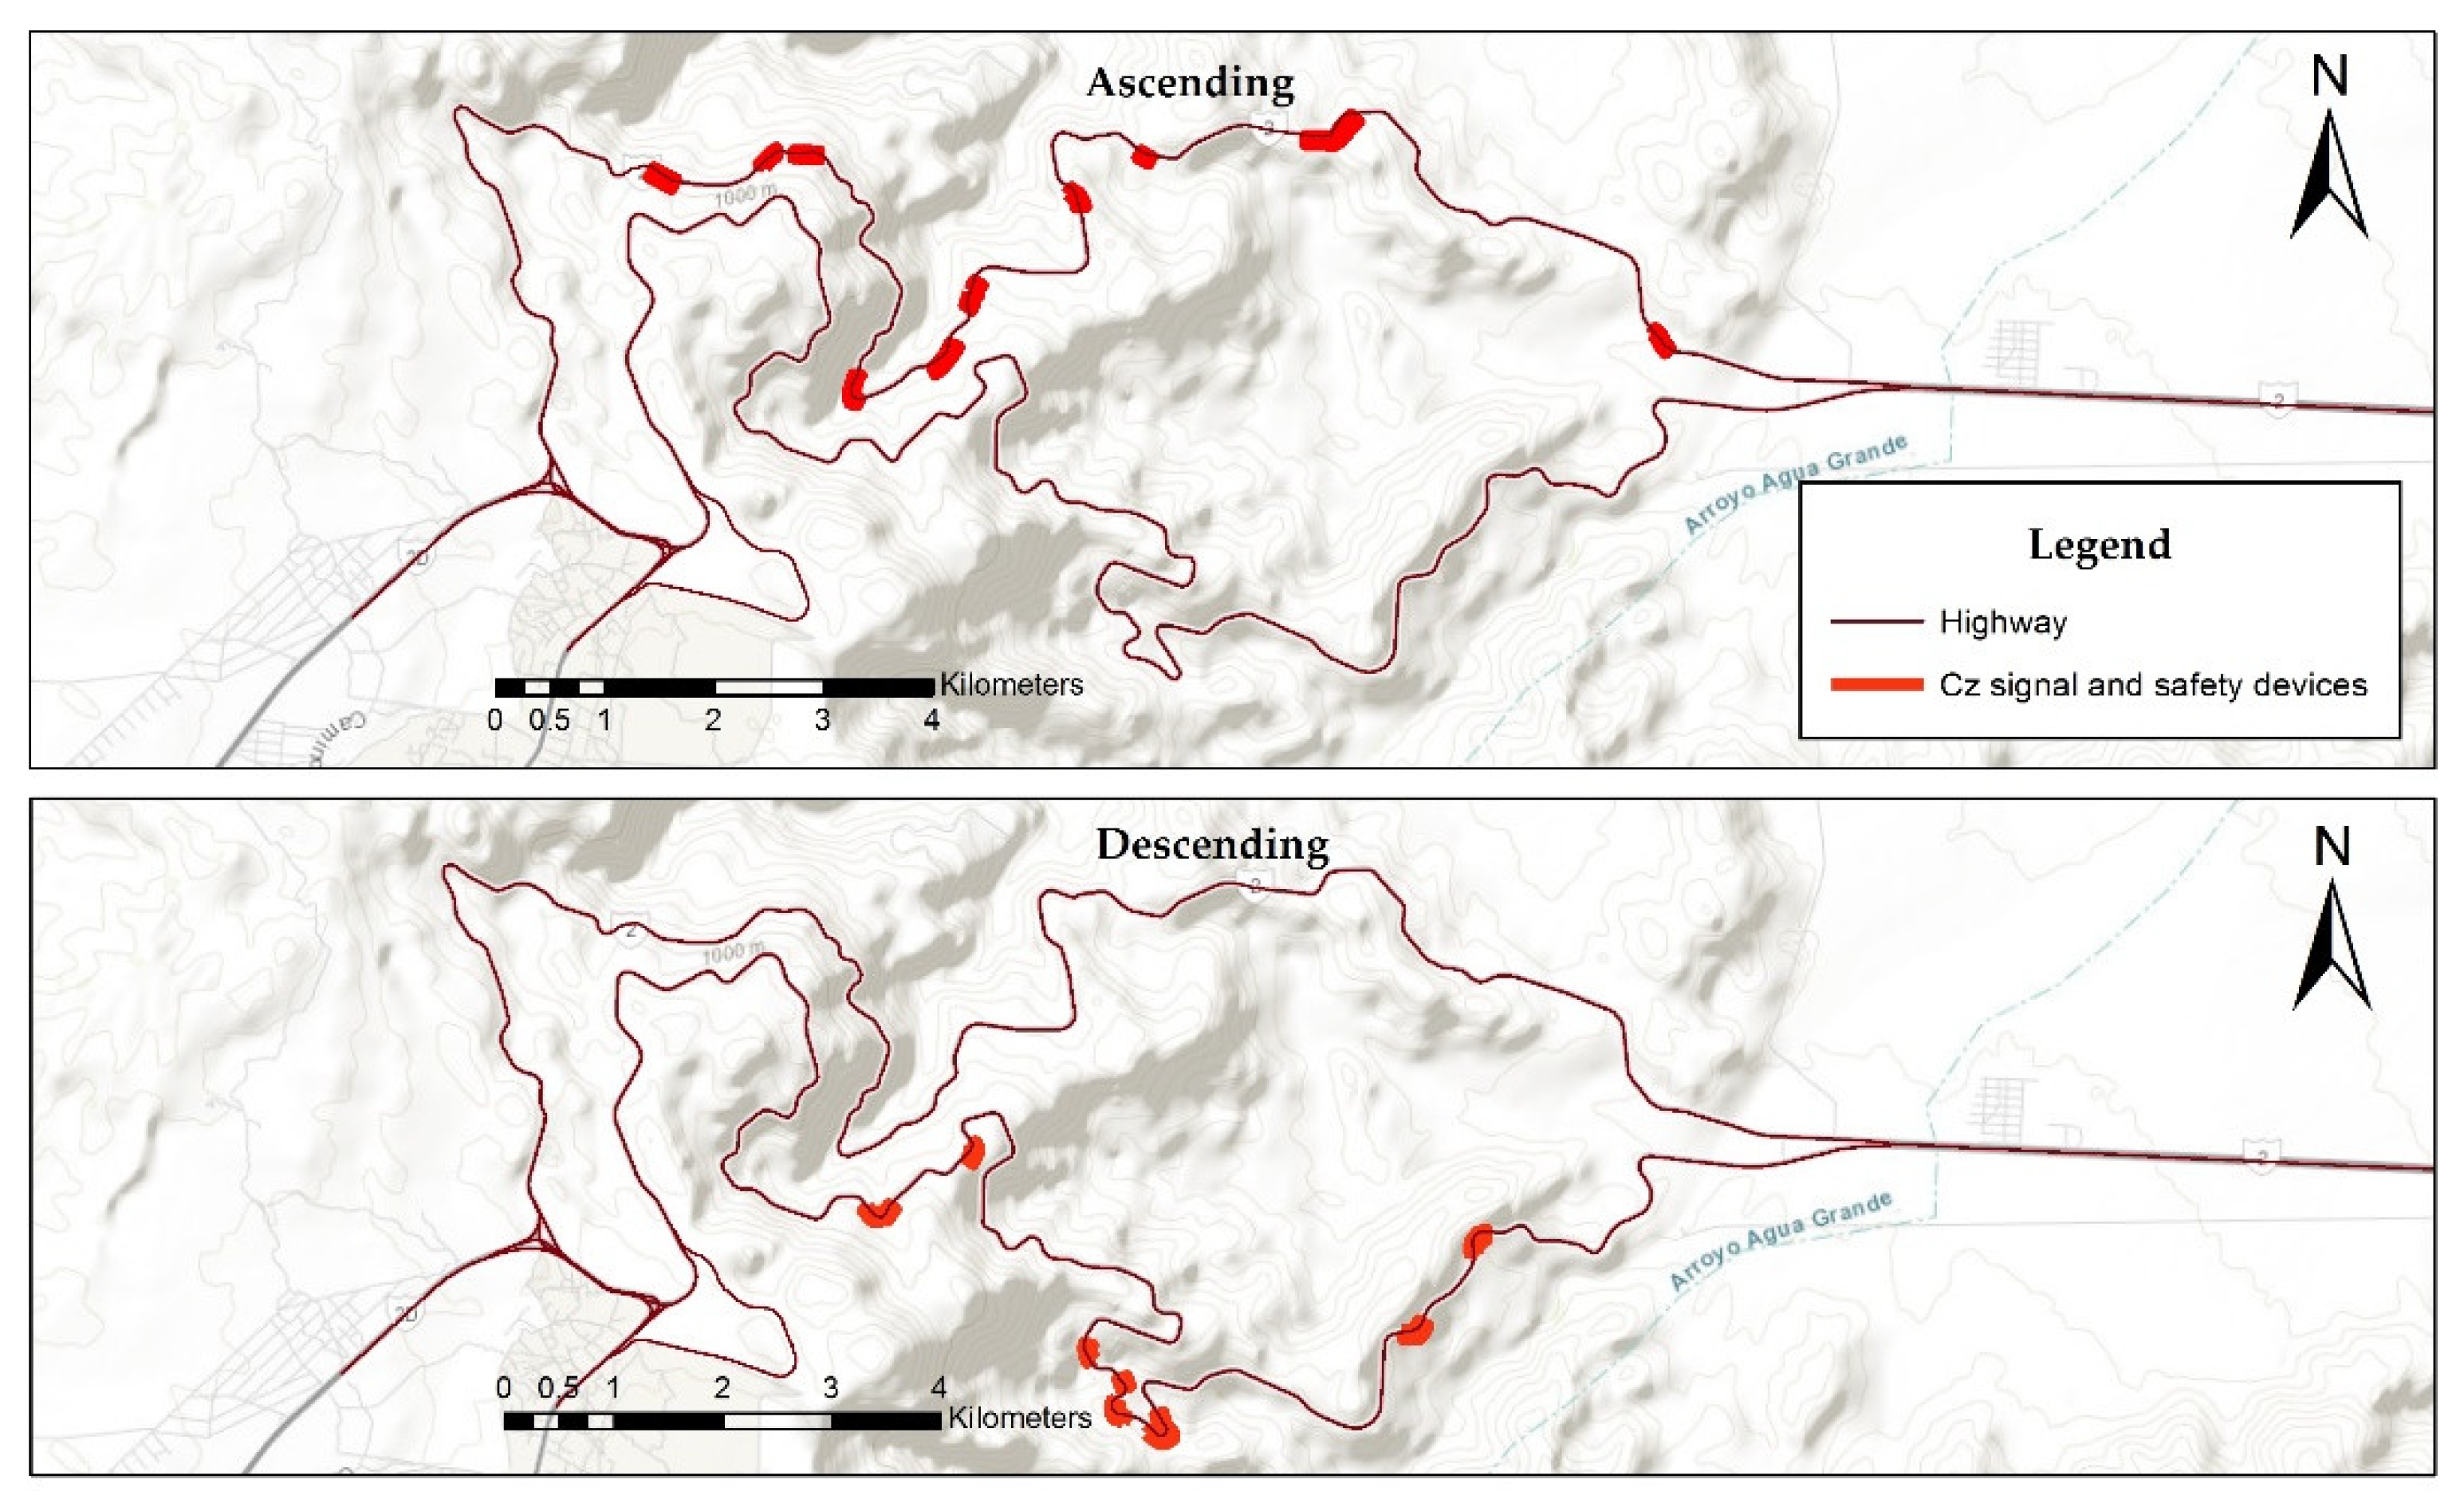
3.6. Traffic Signal and Road Safety Device Analysis

Among the physical elements that make up the road system, it is important to highlight the signage and safety devices, since the participation of these is essential for users. The set of signs and safety devices have the objective of transmitting to highway users and urban roads enough information to guide them on the place they are in and how to reach their destination, prevent prevailing conditions on the road, and regulate the traffic, in addition to contributing to user road safety during their journey [67].
In keeping with the recommendations of international organizations on road marking, the SCT has generated several documents, among which are Manuals, Technical Standards, and Official Mexican Standards. The foregoing, with the purpose that all roads in the country have standard and adequate road signs. However, in order to facilitate the application of these documents, it is necessary to have an instrument that integrates and provides consistency in the specifications used for road signs and safety devices design [67]. Road marking allows regulating road use, facilitating safe and efficient operation for users [68]. Meanwhile, road safety devices are intended to contain vehicles. As an example of this, there are speed reduction and redirection. These devices are planned according to technical criteria to achieve efficiency and reduce the severity of traffic accidents. In this regard, road safety devices are defined as all those devices that help to contain and redirect vehicles in danger of going off the road, such as preventive barriers, shock absorbers, retaining walls, and windbreaker meshes [67,69].
The signaling and security devices analysis consists of a field evaluation following compliance with the SCT regulations, mainly in what is stated in the N-PRY-CAR-10-01-001/13, N-PRY-CAR-10-01-002/13, and the N-PRY-CAR-10-01-003/13, regarding the signaling project and safety devices on roads and urban road networks, and the N.CTR.CAR.1.07.010/00 regarding signaling and security devices. In order to identify the existing areas of opportunity in terms of signaling and safety devices in the analyzed section, this analysis also allows us to detect, in a particular way, the current situation of the identified critical areas.

3.7. Integrated Risk Reduction Plan

Once the particular results are obtained, a GIS software is used to integrate data gathered from accidents, pavement surface conditions, the performance of the geometric design, the analysis of traffic signals, and the road safety devices present on the road. In this way, it is possible to observe how critical points converge with the analyzed risk factors and thus examine the characteristics of these areas. This analysis will allow planning technical and operational strategies in order to reduce the risk and accident rate of the road, in accordance with factors present in a critical point.

4. Results

4.1. Case Study Accidents Data

As mentioned above, the highway has a high accident rate, which is why it is considered high risk for inexperienced users. It is because of these conditions that highways promote accidents even more than other roads. In Figure 3, the annual traffic historical comparative that circulates on the highway and the number of accidents registered during the period 2004 to 2018 are presented.
In 2014 an analysis was made showing that the highest number of accidents occurs in the period from 1:00 p.m. to 5:00 p.m., and historically, 59% of road accidents occur in the mountainous downhill section, followed by the mountainous ascent section with 16% and flat descent with 14%, while the remaining 11% corresponds to accidents registered in the flat ascent section (Table 4).
On the other hand, the type of accident that occurs the most are rollovers, and the causes vary depending on the road section and the ascent (26%) or descent (54%) condition. The second cause of accidents refers to vehicles going off the road; in the uphill section, this represents 28% of total accidents, while in the downhill, it reaches 26% (Table 5).
Regarding the type of vehicles that get the most into accidents, in the upward section, compact sedan-type cars do so, representing 32% of accidents; the second type refers to tractor-trailers. On the other hand, in the downward section, those involved in the highest percentage of accidents are tractor-trailers or heavy vehicles with 41%; in second place are sedan-type cars (Table 6).
Among the accidents registered on the Centinela–La Rumorosa Highway, 59% of them occurred in mountainous zones on the downhill section and another 16% on the uphill section, which amounts to 75% of the total accidents. Concerning this, an approximate cost of 653,131 dollars is estimated caused by road accidents in the period from 2000 to 2018. These expenses are based on repairs made in the affected section due to an accident. However, there is not enough data to know the economic losses derived from cargo transportation, vehicle repairs, or death expenses, so this cost would be even higher. As mentioned above, the type of accident that occurs most frequently is rollovers with 54% in the downhill section, while in second place and the uphill section, another type of accident refers to going off the road with 28%. The information mentioned above reveals the areas of the highway where the highest number of accidents are concentrated annually (Figure 4).
As seen in Figure 4 and the above-mentioned information, the greatest number of accidents is concentrated in the mountainous area, specifically in the downhill section, with points that concentrate an average of 40 to 50 accidents per year. Furthermore, the area called “La Herradura” located in the downhill lane between km 51+200 and km 49+100 stands out for concentrating a large number of accidents. It is important to mention that even though the flat and straight zone of the highway registers few accidents per year, these do not have a defined occurrence pattern, so zones where three to five accidents per year occur were defined for analysis.

4.2. Highway Surface Conditions

The results from the pavement surface condition in 2014 (Figure 5), show that the most deteriorated road section is the descending one, because 28% of this section is in poor condition, mainly in the mountainous area where there are a considerable curve system and steep slopes. Likewise, the first kilometers in the urban area present the aforementioned condition. On the other hand, the ascending road section presents good conditions in 70% of its route, 29% is in fair condition and only 1% is in poor condition.

4.3. Geometric Condition

The horizontal and vertical alignments should not be considered independent in the project since these complement each other. If one of the two alignments present poorly projected parts, these negatively influence both, the rest of that alignment and the other one. Due to the above, both alignments must be analyzed considering that the goodness in the project will increase the use and safety. It is important to mention that, once the analysis was carried out, risk zones due to geometry were found in the mountainous section only, specifically in the downhill section. The foregoing because this section was a two-lane highway before the uphill section was built in 2000, so the downhill section design has inconsistencies and is inappropriate for use at present days. Meanwhile, the rest of the highway is made up of flat and straight sections. The current situation of horizontal and vertical alignment in the mountainous area of the Centinela–La Rumorosa Highway is shown below (Figure 6).

4.4. Traffic Signal and Safety Devices Condition

The results of the analysis of traffic signs and safety devices detected areas on the highway that do not comply with the regulations related to these. The areas presented below show those areas where the signs and security devices present inconsistencies or nonexistence of these in accordance with the provisions of current regulations. It is important to mention that the flat and straight area of the highway does not present the existence of critical points so that in Figure 7, only the results of the mountainous area of the highway are presented.

4.5. Integrated Risk Reduction Plan

Using the GIS software Arcgis 10.3 software, this integrates data gathered from accidents and pavement surface condition data, the performance of the geometric design, the analysis of traffic signals, and road safety devices present on the road, in order to determine risk areas that promote accidents and generate a risk reduction plan to support future decision-making that guarantees better performance for road users.
Table 7 concentrates critical points resulting from the accident analysis on the Centinela–La Rumorosa Highway, classifying the risk level according to the annual average of accidents that occur at each point, the type of terrain, the direction of the road, the location centroid ±100 m, and the risk factors present at each point.
According to Table 7, the combination of two or more risk factors leads to an increase in accidents in a critical point; the geometric design in high-risk areas is the most recurrent factor, and its presence in mountainous areas is also highlighted, where there are pronounced and inappropriate descending slopes, as expressed in the accident analysis. Another important aspect to consider is that the areas that present the highest levels of risk are those with the worst pavement conditions.
Once the relation between the critical points with the highest accident rates and the risk factors present has been analyzed, an integrated plan is drawn up that aims to reduce the risk of accidents on the highway (Table 8). This plan establishes technical and operational strategies in order to reduce the risk and accident rate of the road, in accordance with factors present in a critical point. It is important to mention that the analysis of risk factors shows the presence of these in areas with low or no accidents, which can be attended to further reduce the possibility of an accident. However, the results of this research only present strategies to attend to areas with high risk or high accident rates.
As mentioned above, Table 8 shows the integrated risk reduction plan prioritizing areas with the highest risk level. It is important to mention that since 2014 the implementation of sustainable strategies for M&R was designed on this highway, leading to the creation of an intervention plan from 2014 to 2018 and the execution of this during the already mentioned period, with the vision of improving safety and comfort for users of this highway. These results are presented by Montoya et al. [65].
The analysis of Table 8 denoted the influence of the geometric design on the accident rate of the mountainous section of the highway. However, due to the topographic limitations and the highway layout, resulting in a difficult task to modify slopes and degrees of curvature, this shows the need to propose the incorporation of another type of infrastructure and design; this could be the case of a bridge in the area called "La Herradura". Furthermore, the results of the already mentioned analysis show the need to build runaway truck ramps on the highway because the SCT regulation NOM-036-SCT2-2016 establishes that the construction of emergency braking ramps must be used, also known as escape ramps or just simply emergency ramps, on all roads that have sections with continuous and prolonged descending slopes with characteristics that can lead to fatal accidents caused by vehicles that are out of control due to mechanical failures, mainly in braking systems. This denotes the need for planning and design of these elements on the highway.
On the other hand, areas were detected where it is not possible to carry out a project to modify its design. However, the use of technology can be implemented to prevent accidents. These technologies consist of speed radars and dynamic signaling that inform drivers about phenomena or eventualities on the highway.
Another aspect important to mention is that areas with moderate risk levels were located without presenting any associated risk factor, mainly in the flat and straight area of the highway where most accidents occur as a result of driving at high speeds and going off the road. Therefore, for these cases, it is recommended to highway administrators and authorities, the enforcement of traffic laws in a stricter way towards drivers, as well as the implementation of assistive technology.

5. Discussion

The primary cause of traffic accidents is related to the human factor. However, it is possible that, by implementing effective interventions through correct urban planning and designing safer roads, implementing road safety review audits, as well as by establishing and applying international laws, this problem can be addressed. However, the already mentioned analysis is always fulfilled or carried out comprehensively. The information mentioned above is highlighted in Persia et al. [12]. In a study of 23 countries, they point out that the lack of resources and data has led to the lack of application of procedures that allow improving road safety conditions. The above-mentioned reflects on global road safety data, where high-income countries recorded a remarkable decrease in traffic fatalities in recent years, this due to safer vehicles, roads, and user behavior. In low- and middle-income countries, it is completely different. These countries account for 90% of all road deaths worldwide.
Despite the efforts to improve road safety conditions, road management agencies in developing countries have limited resources and staff, which means that these projects are not short-term implemented or are not implemented at all, so it is necessary to regularly carry out road safety audits in order to maintain a reliable and updated data, for the correct implementation of a risk reduction plan. This situation was highlighted by Speier and Campos [70] who mentioned that based on their personal experience in conducting audits, inspections, and training throughout South and Central America and Mexico, resources, staff, knowledge, legal regulations, and quality of data are some of the reasons why techniques and road safety procedures audits and inspections may not have been implemented more widely. On the other hand, this situation was also highlighted by Rodríguez and Bezerra [10], in Brazil, where these procedures are not incorporated or disseminated as a common practice. They proposed a procedure for the implementation of these types of projects.
The main limitations of this work were the lack of previous studies in Mexico, and the quality and quantity of data and official information. Mainly those related to data gathered from accidents by the highway administration agency; this is because these data omit essential information such as the influence of the human factor, the presence of environmental phenomena, and the economic consequences of accidents. Yu et al. [15] were able to identify factors that influence vehicle crash patterns using the Wisconsin transportation database, which includes 49 variables to describe the crash, driver’s condition, vehicle condition, pavement condition, environmental condition, etc. Future crash report forms collected by FIARUM should include this information.
Although this analysis should be considered the first approach to address safety in this highway, and it focuses mainly on the planning of technical and operational strategies, the results show the need to implement reinforcement laws and assisted technology. Due to what was described by Reason et al. [21], drivers deliberately violate road laws when they have the opportunity to do so.
A future improvement of this study should include the adaptation and application of the DBQ to analyze and characterize the aberrant behavior of road users, as well as the inclusion of environmental variables. In accordance with Farooq et al. [17], road management agencies must consider the criteria of driver behavior to improve their road safety situation.

6. Conclusions

In order to identify the spatial patterns resulting from accidents, the importance of GIS use is noted, and thereby, determine the areas with high accident rates, as well as the influence of the road in accidents generation and the characteristics related to traffic in the occurrence of these. Likewise, these systems are also a useful tool to analyze the interaction of risk variables in their geospatial environment.
Although the current literature discussion has not been able to clearly determine the influence of the pavement condition on the frequency and severity of accidents, it is the responsibility of highway administrators to provide a quality transport system, in other words, safe and comfortable for users.
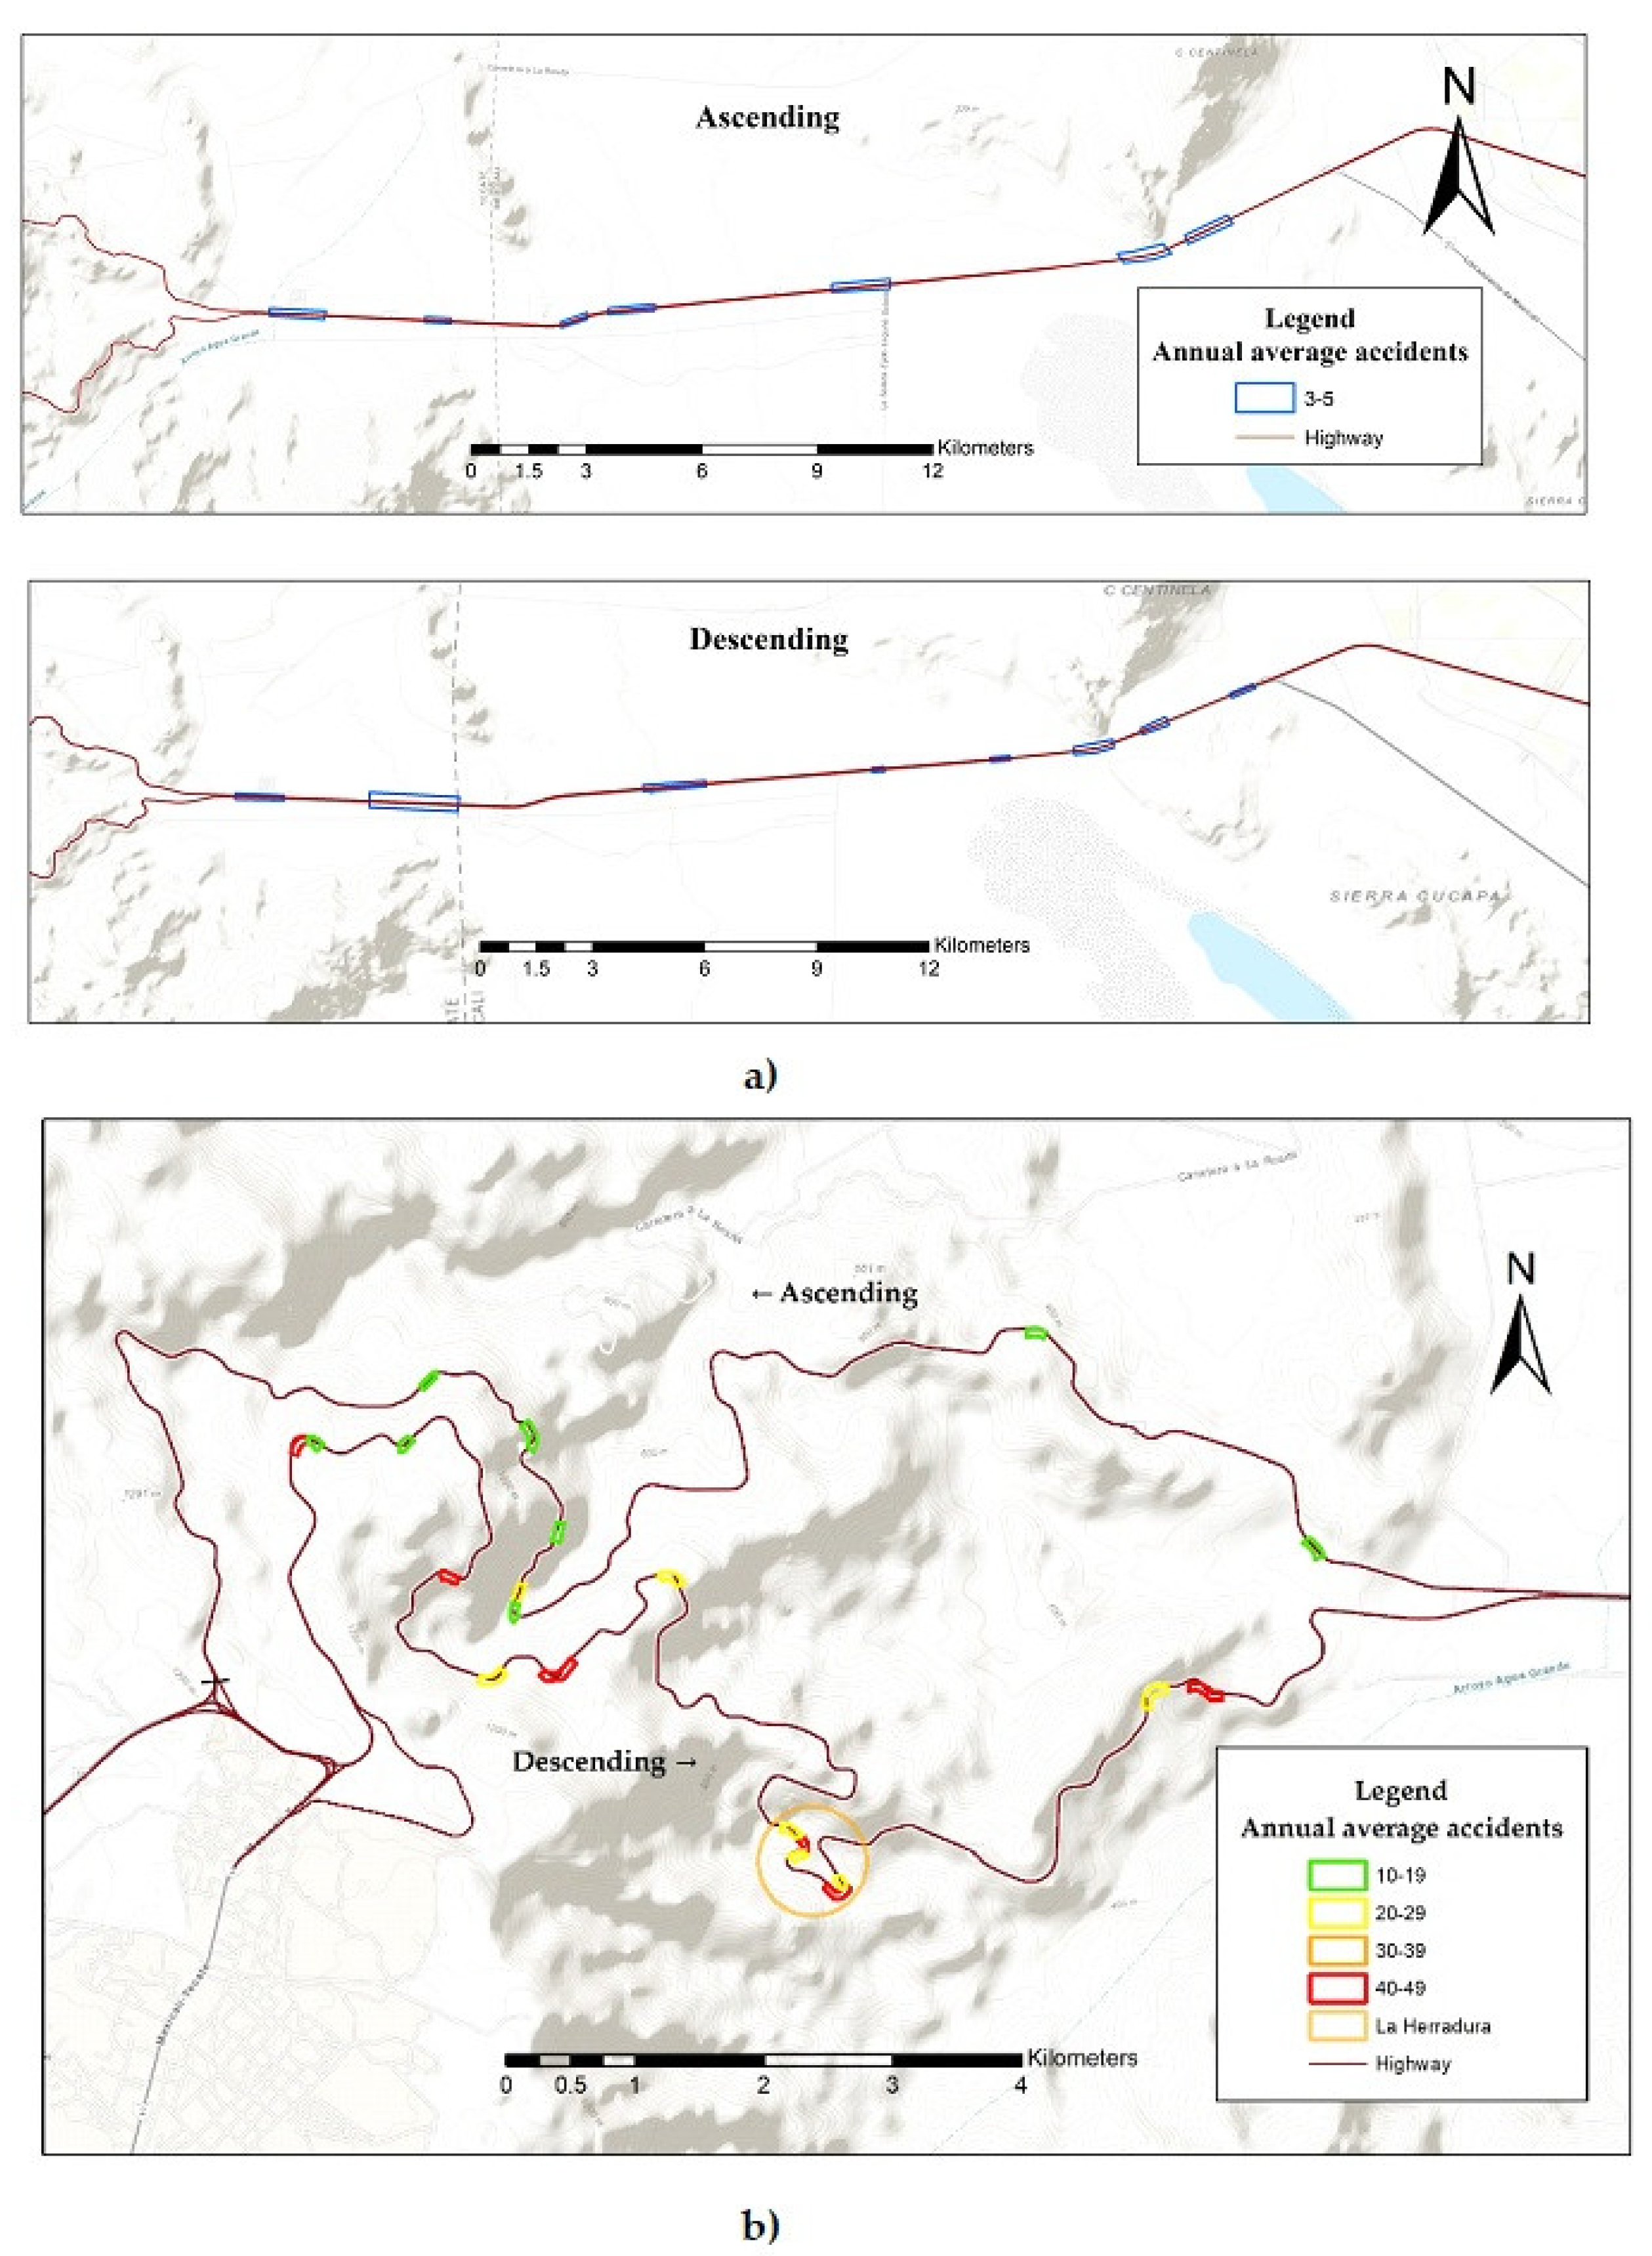
Specifically addressing the Centinela–La Rumorosa Highway and the analysis of geometric conditions carried out there, it was shown that there were severe inconsistencies in the alignments, presenting inappropriate degrees of curvature in the mountainous descent lane, showing up eight critical zones in this factor, and thus as a high degree of accidents. In accordance with the aforementioned, this section concentrated all the traffic since before being a highway, when it was one lane in each direction until the ascent section was built in 2000. The foregoing led to inconsistencies that have not been addressed due to the spatial and topographic limitations, and therefore, the need arises to propose and design a bridge that connects two points of the highway; this is a sustainable technical measure that would eliminate the system of curves in the area known as “La Herradura” in the mountainous section of the descent.
On the other hand, the analysis of signs and safety devices denotes the need to implement preventive markings in dangerous curves, as well as more speed radar technology and the implementation of safety barriers, in order to prevent accidents and reduce the severity of these. Likewise, this analysis reflects the need to plan and design runaway truck ramps at specific critical points of the descending mountainous section, since the regulations published in 2016 require the existence of these, for sections with steep slopes and high degrees of curvature, as presented in the object of study of this research.
Risk factors review on a highway makes it possible to identify points that, although not presenting high levels of accidents, show areas that can improve on safety levels by addressing deficiencies in terms of pavement condition, geometric design, signaling, and security devices.
Finally, it is concluded that this procedure contributes to determining the risk areas that induce the generation of accidents and encourages the development of a risk reduction plan to support future decision-making that guarantees better performance for road users. Likewise, it is important to emphasize that the analysis of road safety should be a permanent process for those who operate, design, and build the road system.

Author Contributions

Data curation, J.C.-R. and C.M.-L.; formal analysis, M.M.-A.; investigation, M.M.-A. and J.C.-R.; project administration, A.M.-M.; resources, J.C.-R.; software, M.M.-A. and C.M.-L.; supervision, A.M.-M.; validation, A.M.-M. and L.G.; writing—original draft, M.M.-A.; writing—review &, editing, M.M.-A., A.M.-M., and L.G. All authors have read and agreed to the published version of the manuscript.

Funding

This research received no external funding.

Acknowledgments

We sincerely appreciate the Enginieering Faculty of the Universidad Autónoma de Baja California and Fideicomiso Tramo Carretero Centinela–Rumorosa (FIARUM), for their support in this study.

Conflicts of Interest

The authors declare no conflict of interest.

References

  1. WHO. Informe Sobre la Situación Mundial de la Seguridad Vial 2015; World Health Organization: Geneva, Switzerland, 2015; pp. 1–12. [Google Scholar]
  2. Wegman, F. The future of road safety: A worldwide perspective. IATSS Res. 2017, 40, 66–71. [Google Scholar] [CrossRef] [Green Version]
  3. WHO. Global Status Report on Road safety: Time for Action; World Health Organization: Geneva, Switzerland, 2009. [Google Scholar]
  4. Amorim, M.; Ferreira, S.; Couto, A. Road safety and the urban emergency medical service (uEMS): Strategy station location. J. Transp. Health 2017, 6, 60–72. [Google Scholar] [CrossRef]
  5. Elvik, R.; Høye, A.; Vaa, T.; Sørensen, M. The Contribution of Research to Road Safety Policy-Making’, The Handbook of Road Safety Measures; Emerald Group Publishing Limited: Bingley, UK, 2009. [Google Scholar]
  6. IHT. Highway Safety guidelines: Accident Reduction and Prevention. International Edition; The Institution of Highways and Transportation: London, UK, 1990. [Google Scholar]
  7. Karantanos, M.; Vardaki, S. Road safety audit: A comparative review of current guidelines and designers’ approach. In Proceedings of the Road Safety and Simulation International Conference, Rome, Italy, 22–25 October 2013. [Google Scholar]
  8. Bank, A.D. CAREC Road Safety Engineering Manual 1: ROAD SAFETY AUDIT; Asian Development Bank: Metro Manila, Philippines, 2018; p. 65. [Google Scholar] [CrossRef]
  9. Trentacoste, M.; Boekamp, P.; Depue, L.; Lipinski, M.E.; Manning, D.; Schertz, G.; Shanafelt, J.; Werner, T.; Wilson, E. FHWA Study Tour for Road Safety Audits, PART 1-FINAL REPORT; Federal Highway Administration: Washington, DC, USA, 1997.
  10. Rodrigues, J.L.F.; Bezerra, B.S. Implementing road safety audits in Brazil. In Proceedings of the Road Safety on Four Continents, 13th International Conference, Warsaw, Poland, 5–7 October 2005. [Google Scholar]
  11. Wilson, E.; Lipinski, M. NCHRP Synthesis 336: Road Safety Audits-A Synthesis of Highway Practice; National Research Council: Washington, DC, USA, 2004. [Google Scholar]
  12. Persia, L.; Usami, D.S.; De Simone, F.; De La Beaumelle, V.F.; Yannis, G.; Laiou, A.; Han, S.; Machata, K.; Pennisi, L.; Marchesini, P. Management of road infrastructure safety. Transp. Res. Procedia 2016, 14, 3436–3445. [Google Scholar] [CrossRef] [Green Version]
  13. OPS. La Seguridad Vial en la Región de las Américas; Organización Panamericana de la Salud: Washington, DC, USA, 2016. [Google Scholar]
  14. GOB. Programa de acción Específico Seguridad Vial (2013–2018); Gobierno de México, Secretaría de Salud: Distrito Federal, Mexico, 2014. [Google Scholar]
  15. Yu, S.; Jia, Y.; Sun, D. Identifying factors that influence the patterns of road crashes using association rules: A case study from Wisconsin, United States. Sustainability 2019, 11, 1925. [Google Scholar] [CrossRef] [Green Version]
  16. AASHTO. Highway Safety Manual; AASHTO: Washington, DC, USA, 2010. [Google Scholar]
  17. Farooq, D.; Moslem, S.; Duleba, S. Evaluation of driver behavior criteria for evolution of sustainable traffic safety. Sustainability 2019, 11, 3142. [Google Scholar] [CrossRef] [Green Version]
  18. Norza-Céspedes, E.H.; Granados-León, E.L.; Useche-Hernández, S.A.; Romero-Hernández, M.; Moreno-Rodríguez, J. Componentes descriptivos y explicativos de la accidentalidad vial en Colombia: Incidencia del factor humano. Rev. Crim. 2014, 56, 157–187. [Google Scholar]
  19. Niezgoda, M.; Kamiński, T.; Kruszewski, M. Measuring driver behaviour-indicators for traffic safety. J. KONES 2012, 19, 503–511. [Google Scholar] [CrossRef]
  20. Moslem, S.; Farooq, D.; Ghorbanzadeh, O.; Blaschke, T. Application of the AHP-BWM model for evaluating driver behavior factors related to road safety: A case study for Budapest. Symmetry 2020, 12, 243. [Google Scholar] [CrossRef] [Green Version]
  21. Reason, J.; Manstead, A.; Stradling, S.; Baxter, J.; Campbell, K. Errors and violations on the roads: A real distinction? Ergonomics 1990, 33, 1315–1332. [Google Scholar] [CrossRef]
  22. Stanojević, P.; Lajunen, T.; Jovanović, D.; Sârbescu, P.; Kostadinov, S. The driver behaviour questionnaire in south-east europe countries: Bulgaria, romania and serbia. Transp. Res. Part F Traffic Psychol. Behav. 2018, 53, 24–33. [Google Scholar] [CrossRef]
  23. López-de-Cózar, E.; Molina, J.; Chisvert, M.; Sanmartín, J. Traducción y Adaptación del Driver Behaviour Questionnaire a la Población Española; Instituto Universitario de Tráfico y Seguridad Vial-Universidad de Valencia: Valencia, Spain, 2006. [Google Scholar]
  24. Cordazzo, S.T.; Scialfa, C.T.; Bubric, K.; Ross, R.J. The driver behaviour questionnaire: A north American analysis. J. Saf. Res. 2014, 50, 99–107. [Google Scholar] [CrossRef] [PubMed]
  25. Cordazzo, S.T.; Scialfa, C.T.; Ross, R.J. Modernization of the driver behaviour questionnaire. Accid. Anal. Prev. 2016, 87, 83–91. [Google Scholar] [CrossRef]
  26. Owsley, C.; Ball, K.; Sloane, M.E.; Roenker, D.L.; Bruni, J.R. Visual/cognitive correlates of vehicle accidents in older drivers. Psychol. Aging 1991, 6, 403. [Google Scholar] [CrossRef]
  27. Ball, K.; Owsley, C.; Sloane, M.E.; Roenker, D.L.; Bruni, J.R. Visual attention problems as a predictor of vehicle crashes in older drivers. Investig. Ophthalmol. Vis. Sci. 1993, 34, 3110–3123. [Google Scholar]
  28. Shimada, H.; Tsutsumimoto, K.; Lee, S.; Doi, T.; Makizako, H.; Lee, S.; Harada, K.; Hotta, R.; Bae, S.; Nakakubo, S. Driving continuity in cognitively impaired older drivers. Geriatr. Gerontol. Int. 2016, 16, 508–514. [Google Scholar] [CrossRef] [PubMed]
  29. Devlin, A.; McGillivray, J. Self-regulatory driving behaviours amongst older drivers according to cognitive status. Transp. Res. Part F: Traffic Psychol. Behav. 2016, 39, 1–9. [Google Scholar] [CrossRef]
  30. González-Iglesias, B.; Gómez-Fraguela, J.A.; Sobral, J. Potential determinants of drink driving in young adults. Traffic Inj. Prev. 2015, 16, 345–352. [Google Scholar] [CrossRef]
  31. Ferreira, A.I.; Martínez, L.F.; Guisande, M.A. Risky behavior, personality traits and road accidents among university students. Eur. J. Educ. Psychol. 2009, 2, 79–98. [Google Scholar] [CrossRef] [Green Version]
  32. Gershon, P.; Sita, K.R.; Zhu, C.; Ehsani, J.P.; Klauer, S.G.; Dingus, T.A.; Simons-Morton, B.G. Distracted driving, visual inattention, and crash risk among teenage drivers. Am. J. Prev. Med. 2019, 56, 494–500. [Google Scholar] [CrossRef]
  33. Lin, C.; Wu, D.; Liu, H.; Xia, X.; Bhattarai, N. Factor Identification and Prediction for Teen Driver Crash Severity Using Machine Learning: A Case Study. Appl. Sci. 2020, 10, 1675. [Google Scholar] [CrossRef] [Green Version]
  34. Babić, D.; Babić, D.; Cajner, H.; Sruk, A.; Fiolić, M. Effect of road markings and traffic signs presence on young driver stress level, eye movement and behaviour in night-time conditions: A driving simulator study. Safety 2020, 6, 24. [Google Scholar]
  35. WHO. Mobile Phone Use: A Growing Problem of Driver Distraction; World Health Organization: Geneva, Switzerland, 2011. [Google Scholar]
  36. Zhao, N.; Reimer, B.; Mehler, B.; D’Ambrosio, L.A.; Coughlin, J.F. Self-reported and observed risky driving behaviors among frequent and infrequent cell phone users. Accid. Anal. Prev. 2013, 61, 71–77. [Google Scholar] [CrossRef] [PubMed]
  37. Simmons, S.M.; Hicks, A.; Caird, J.K. Safety-critical event risk associated with cell phone tasks as measured in naturalistic driving studies: A systematic review and meta-analysis. Accid. Anal. Prev. 2016, 87, 161–169. [Google Scholar] [CrossRef] [PubMed]
  38. Gariazzo, C.; Stafoggia, M.; Bruzzone, S.; Pelliccioni, A.; Forastiere, F. Association between mobile phone traffic volume and road crash fatalities: A population-based case-crossover study. Accid. Anal. Prev. 2018, 115, 25–33. [Google Scholar]
  39. Youming, T.; Deliang, Z.; Xinyu, Z.; Na, L. Principal component analysis of fatal traffic accidents based on vehicle condition factors. In Proceedings of the 2018 11th International Conference on Intelligent Computation Technology and Automation (ICICTA), Changsha, China, 22–23 September 2018; pp. 315–317. [Google Scholar]
  40. Malin, F.; Norros, I.; Innamaa, S. Accident risk of road and weather conditions on different road types. Accid. Anal. Prev. 2019, 122, 181–188. [Google Scholar] [CrossRef]
  41. Zhan, Z.-Y.; Yu, Y.-M.; Chen, T.-T.; Xu, L.-J.; Ou, C.-Q. Effects of hourly precipitation and temperature on road traffic casualties in Shenzhen, China (2010–2016): A time-stratified case-crossover study. Sci. Total Environ. 2020, 720, 137482. [Google Scholar] [CrossRef]
  42. Jiang, A.-L.; Sanders, B.F.; Nguyen, P.; Hsu, K. What is the role of rainfall and flooding on motor vehicle accidents in Los Angeles? AGUFM 2018, 2018, H43J-2601. [Google Scholar]
  43. Stevens, S.E.; Schreck, C.J., III; Saha, S.; Bell, J.E.; Kunkel, K.E. Precipitation and fatal motor vehicle crashes: Continental analysis with high-resolution radar data. Bull. Am. Meteorol. Soc. 2019, 100, 1453–1461. [Google Scholar] [CrossRef]
  44. Eisenberg, D.; Warner, K.E. Effects of snowfalls on motor vehicle collisions, injuries, and fatalities. Am. J. Public Health 2005, 95, 120–124. [Google Scholar] [CrossRef]
  45. Seeherman, J.; Liu, Y. Effects of extraordinary snowfall on traffic safety. Accid. Anal. Prev. 2015, 81, 194–203. [Google Scholar] [CrossRef]
  46. Roebber, P.J.; Butt, M.R.; Reinke, S.J.; Grafenauer, T.J. Real-time forecasting of snowfall using a neural network. Weather Forecast. 2007, 22, 676–684. [Google Scholar] [CrossRef]
  47. Fountas, G.; Fonzone, A.; Gharavi, N.; Rye, T. The joint effect of weather and lighting conditions on injury severities of single-vehicle accidents. Anal. Methods Accid. Res. 2020, 27, 100124. [Google Scholar] [CrossRef]
  48. Jägerbrand, A.K.; Sjöbergh, J. Effects of weather conditions, light conditions, and road lighting on vehicle speed. SpringerPlus 2016, 5, 505. [Google Scholar]
  49. Miaou, S.-P.; Lum, H. Modeling vehicle accidents and highway geometric design relationships. Accid. Anal. Prev. 1993, 25, 689–709. [Google Scholar] [CrossRef]
  50. Milton, J.; Mannering, F. The relationship among highway geometrics, traffic-related elements and motor-vehicle accident frequencies. Transp. Res. 1998, 25, 395–413. [Google Scholar]
  51. Vayalamkuzhi, P.; Amirthalingam, V. Influence of geometric design characteristics on safety under heterogeneous traffic flow. J. Traffic Transp. Eng. 2016, 3, 559–570. [Google Scholar] [CrossRef] [Green Version]
  52. Gooch, J.P.; Gayah, V.V.; Donnell, E.T. Quantifying the safety effects of horizontal curves on two-way, two-lane rural roads. Accid. Anal. Prev. 2016, 92, 71–81. [Google Scholar] [CrossRef]
  53. Wang, C.; Quddus, M.A.; Ison, S.G. The effect of traffic and road characteristics on road safety: A review and future research direction. Saf. Sci. 2013, 57, 264–275. [Google Scholar] [CrossRef]
  54. FHWA. Interactive Highway Safety Design Model (IHSDM): Overview. Available online: https://highways.dot.gov/research/safety/interactive-highway-safety-design-model/interactive-highway-safety-design-model-ihsdm-overview (accessed on 1 February 2020).
  55. Chen, S.; Saeed, T.U.; Labi, S. Impact of road-surface condition on rural highway safety: A multivariate random parameters negative binomial approach. Anal. Methods Accid. Res. 2017, 16, 75–89. [Google Scholar] [CrossRef]
  56. Rivera Trujillo, C.; Mendoza Díaz, A. Análisis Costo-Beneficio y Costo-Efectividad de las Medidas de Seguridad Implementadas en Carreteras Mexicanas; Instituto Mexicano del Transporte: Queretaro, Mexico, 2009. [Google Scholar]
  57. Justo-Silva, R.; Ferreira, A. Pavement maintenance considering traffic accident costs. Int. J. Pavement Res. Technol. 2019, 12, 562–573. [Google Scholar] [CrossRef]
  58. Konovalova, T.; Zarovnaya, L. The assessment model for economic efficiency of traffic safety improvements. Transp. Res. Procedia 2017, 20, 311–315. [Google Scholar] [CrossRef]
  59. Eseonu, C.; Gambatese, J.; Nnaji, C. Reducing Highway Construction Fatalities through Improved Adoption of Safety Technologies; The Center for Construction Research Training: Silver Spring, MD, USA, 2018. [Google Scholar]
  60. Dong, C.; Nambisan, S.S.; Xie, K.; Clarke, D.B.; Yan, X. Analyzing the effectiveness of implemented highway safety laws for traffic safety across US states. Transp. A Transp. Sci. 2017, 13, 91–107. [Google Scholar]
  61. Yu, H.; Liu, P.; Chen, J.; Wang, H. Comparative analysis of the spatial analysis methods for hotspot identification. Accid. Anal. Prev. 2014, 66, 80–88. [Google Scholar] [CrossRef] [PubMed]
  62. Al-Aamri, A.K.; Hornby, G.; Zhang, L.-C.; Al-Maniri, A.A.; Padmadas, S.S. Mapping road traffic crash hotspots using GIS-based methods: A case study of Muscat Governorate in the Sultanate of Oman. Spat. Stat. 2020, 100458. [Google Scholar] [CrossRef]
  63. Leal, J.; Plaza, J.D.; Pérez Pérez, I.; de la Cruz, E.C. Influencia de las características superficiales de los firmes en la seguridad vial. Rutas: Rev. de la Asoc. Técnica De Carret. 2004, 100, 13–31. [Google Scholar]
  64. Pérez Pérez, I. Actuaciones para la mejora de la seguridad de la circulación vial. Vía 18 2007, 5, 28–29. [Google Scholar]
  65. Montoya-Alcaraz, M.; Mungaray-Moctezuma, A.; García, L. Sustainable Road Maintenance Planning in Developing Countries Based on Pavement Management Systems: Case Study in Baja California, México. Sustainability 2020, 12, 36. [Google Scholar] [CrossRef] [Green Version]
  66. SCT. Manual de Diseño Geométrico de Carreteras 2018; Técnicos, D.G.d.S., Ed.; Secretaría de Comunicaciones y Transportes: Mexico City, Mexico, 2018. [Google Scholar]
  67. SCT. Manual de Señalización y Dispositivos de Seguridad; Técnicos, D.G.d.S., Ed.; Secretaría de Comunicaciones y Transportes: Mexico City, Mexico, 2014. [Google Scholar]
  68. SCT. NORMA Oficial Mexicana NOM-034-SCT2-2011, Señalamiento Horizontal y Vertical de Carreteras y Vialidades Urbanas; Transportes, S.d.C.y., Ed.; Diario Oficial de la Federación México: Distrito Federal, Mexico, 2011. [Google Scholar]
  69. SCT. CRT Construcción; Secretaría de Comunicaciones y Transportes: Distrito Federal Mexico, 2000. [Google Scholar]
  70. Speier, G.; Campos, J. Road Safety Audits/Inspections: A Promise Unfulfilled. ITE J. 2020, 89, 43–49. [Google Scholar]
Figure 1. Centinela–La Rumorosa highway location.
Safety 06 00045 g001
Figure 2. Methodology flowchart.
Safety 06 00045 g002
Figure 3. Annual traffic comparative and number of accidents: (a) annual traffic in the highway 2004–2018; (b) vehicle accidents per year in the highway 2004–2018.
Safety 06 00045 g003
Figure 4. Critical zones of annual average accidents in the highway 2000–2018: (a) annual average in the flat zone; (b) annual average in mountain zone.
Safety 06 00045 g004
Figure 5. Pavement surface conditions.
Safety 06 00045 g005
Figure 6. Geometric condition in mountain zone.
Safety 06 00045 g006
Figure 7. Traffic signals and safety devices condition in mountain zone.
Safety 06 00045 g007
Table 1. Criteria for pavement conditions classification according to the degree of deterioration. Reproduced from [65].
Grade of DeteriorationCracking (%)Aggregate Shedding
(%)
No Potholes per kmEdge Break (m² per km)Average Depth of Ruts (mm)Roughness (m per km)
New000000
Good010022
Fair51001054
Poor15205100156
Bad253050300258
Table 2. Relation between maximum slope, type of terrain and project speed.
TerrainMaximum Slope (%) for Different Project Speeds (Km/h)
5060708090100110
Flat6544333
Plain7655444
Mountain9877655
Table 3. Governing and maximum slopes by type of terrain.
Highway TypeMain Slope (%)Maximum Slope (%)
TerrainTerrain
FlatPlainMountainFlatPlainMountain
D-686912
C-56578
B-45467
A-34456
Table 4. Locations of accidents.
LocationAscending MountainDescending MountainAscending FlatDescending Flat
Accidents16%59%11%14%
Table 5. Type of accidents.
Type of AccidentsCollisionFireRolloverLose TrackOther
Ascending18%12%26%28%16%
Descending12%2%54%26%6%
Table 6. Accidents for type of vehicle.
LocationBusTruckSUVMotor-HomePick UpMotorcycleCarCargo TruckNo Register
Descending1.33%5.85%12.27%0.09%12.01%1.06%25.61%41.07%0.71%
Ascending2.51%3.34%17.90%0.%15.87%2.39%31.98%25.54%0.48%
Table 7. Analysis of accident risk levels associated with risk factors 1.
Risk LevelTerrainSlopeDirectionChainage kmRisk Factors
PCGeometricTS and/or SD
Very LowFlat-Ascendant20+500Good--
Very LowFlat-Ascendant22+000Good--
Very LowFlat-Ascendant28+400Good--
Very LowFlat-Ascendant33+500Good--
Very LowFlat-Ascendant34+800Good--
Very LowFlat-Ascendant38+000Good--
Very LowFlat-Ascendant41+000Good--
LowMountainPositiveAscendant43+600Fair-X
LowMountainPositiveAscendant46+700Good--
LowMountainPositiveAscendant52+900Good-X
LowMountainPositiveAscendant53+700Good--
LowMountainPositiveAscendant54+600Good--
LowMountainPositiveAscendant55+700Good-X
MediumMountainPositiveAscendant53+100Good-X
Very LowFlat-Descendant41+500Good--
Very LowFlat-Descendant37+500Good--
Very LowFlat-Descendant31+600Good--
Very LowFlat-Descendant26+900Poor--
Very LowFlat-Descendant24+100Fair--
Very LowFlat-Descendant21+900Fair--
Very LowFlat-Descendant20+400Fair--
Very LowFlat-Descendant18+200Fair--
LowMountainNegativeDescendant61+300GoodX-
LowMountainNegativeDescendant60+500GoodX-
MediumMountainNegativeDescendant57+000Poor--
MediumMountainNegativeDescendant54+900Poor--
MediumMountainNegativeDescendant50+550Poor-X
MediumMountainNegativeDescendant50+300PoorX-
MediumMountainNegativeDescendant49+700GoodXX
MediumMountainNegativeDescendant45+550GoodXX
Very HighMountainNegativeDescendant61+500GoodX-
Very HighMountainNegativeDescendant58+600PoorX-
Very HighMountainNegativeDescendant56+350PoorXX
Very HighMountainNegativeDescendant50+400PoorXX
Very HighMountainNegativeDescendant49+750GoodXX
Very HighMountainNegativeDescendant45+000GoodX-
1 The level of risk is associated with the annual average of accidents at the critical point: Very Low (3–5), Low (10–19), Medium (20–29), High (30–39), Very High (40–49). PC is superficial pavement condition; Ts is Traffic Signals, and SD is Safety Devices.
Table 8. Integrated risk reduction plan 1.
No.Risk LevelRisk FactorRisk Reduction StrategiesDirectionChainages
1Very HighPavement CPavement M&R strategies, mill and replace 50 mm HMADescendant58+600, 56+350, 50+400
2Very HighGeometricPlanning and design of a bridge in “La Herradura” areaDescendant50+400, 49+750
3Very HighGeometricPlanning and design runaway truck rampDescendant58+600, 56+350, 50+400
4Very HighGeometricCar accident prevention technologyDescendant61+500, 45+000
5Very HighTS and/or SDImplementation of warning signal “dangeorus curve ahead” and “left curve sign”Descendant56+350, 50+400, 49+750
6Very HighTS and/or SDImplementation or extension of metal road safety barriersDescendant50+400, 49+750
7MediumPavement CPavement M&R strategies, mill and replace 50mm HMADescendant54+900, 50+550, 50+300
8MediumGeometricPlanning and design of a bridge in “La Herradura” areaDescendant50+300, 49+700
9MediumGeometricCar accident prevention technologyDescendant45+550
10MediumTS and/or SDImplementation or extension of metal road safety barriersDescendant50+550, 49+700, 45+550
11MediumTS and/or SDImplementation or extension of metal road safety barriersAscendant53+100
12LowGeometricCar accident prevention technologyDescendant61+300, 60+500
13LowTS and/or SDImplementation or extension of metal road safety barriersAscendant55+700
14LowPavement CPavement M&R strategies, Slurry sealAscendant43+600
15LowOperative and Driver behaviourEnforcement of traffic laws and Car accident prevention technologyAscendant46+600, 53+700, 54+600
16Very LowPavement CPavement M&R strategies, mill and replace 50 mm HMA and Slurry sealDescendant26+900, 24+100, 21+900, 20+400
17Very LowOperative and Driver behaviourEnforcement of traffic laws and Car accident prevention technologyDescendant41+500, 37+500, 31+600
18Very LowOperative and Driver behaviourEnforcement of traffic laws and Car accident prevention technologyAscendant20+500, 22+000, 28+400, 33+500, 34+800, 38+000, 41+000
1 Pavement C is pavement surface condition.

