Article

How Just Culture and Personal Goals Moderate the Positive Relation between Commercial Pilots’ Safety Citizenship Behavior and Voluntary Incident Reporting

by
Sebastian Sieberichs
* and
Annette Kluge
Chair of Work, Organisational & Business Psychology, Department of Psychology, Ruhr University Bochum, 44801 Bochum, Germany
*
Author to whom correspondence should be addressed.
Submission received: 12 May 2021 / Revised: 4 August 2021 / Accepted: 6 August 2021 / Published: 17 August 2021

Abstract

:
Flight safety is consistently influenced by pilots’ self-inflicted incidents in routine flight operations. For airlines, pilots’ reports on these incidents are essential input to learn from incidents (LFI) and for various safety management processes. This paper aims to explain the voluntary reporting behavior of pilots’ self-inflicted incidents from an occupational safety perspective. We investigate how the relation between pilots’ safety citizenship behavior (SCB) and reporting behavior is moderated by pilots’ fear, shame, goals, and goal-striving when reporting, as well as the influence of a just culture on the decision to report incidents. In total, 202 German commercial pilots participated in an online survey. The results showed that reporting behavior can be considered a specific form of self-intentional SCB, but should be differentiated into subtypes depending on a pilot’s unsafe acts (errors or violations) that caused the incident. Reporting behavior-specific motivational factors influenced different subtypes of reporting behavior: Just culture moderated a positive relation between SCB and reported incidents caused by violations. Moreover, depending on the subtype of reporting behavior, the relation was moderated by different types of goals in relation to the pilots. No moderating effects of fear or shame could be demonstrated. Our findings highlight the value of a just culture for encouraging goal-oriented reporting behavior in the context of LFI and safety management.

1. Introduction

“We must plant the seeds of training and just culture in order to have a harvest of safe behaviors”. This sentence opens the 2019 safety report of the International Air Transport Association (IATA) [1] (p. 2). The report thereby addresses two recent topics at a time when safety management systems (SMS) have become mandatory throughout aviation, but the mere presence of this system has not proven sufficient to ensure safe operations [2] (p. 16). In this research, we illustrate how a just culture positively influences pilots’ voluntary incident reporting behavior and how crew training can also benefit from just culture and pilots’ goals when reporting.

1.1. Learning from Incidents and Experience

Organizational members’ safe behavior is particularly important for commercial airlines, as a class of organizations whose activities have the potential to produce major accidents [3]. This potential is increased in organizations where a tension between work and safety fosters violations of regulations [4] or errors [5,6,7]. From a high reliability theory perspective, preoccupation with failure, combined with an organizational vigilance for minor incidents, is one of the main aspects for dealing with this potential [8]. In contrast to accidents, an occurrence is already considered an incident if it simply had the potential to affect safety [9]. Learning from incidents (LFI) aims to prevent future comparable occurrences by reflecting on past incidents and putting lessons learned into practice [10]. In this context, scientific literature also refers to near-misses as unplanned occurrences that did not result in damage but had the potential to do so [11]. An even more proactive view should also include a lowest possible threshold for interest in the learning potential of so-called weak signals [12,13]. In this research, we use the term “incident”, as a collective term for incidents, near-misses, or weak signals that allow airlines to learn from experiences (LFE) [10,13]. To build experience, commercial airlines use flight data analysis, various behavioral observations of pilots while working in the cockpit, findings from accident investigations, and data from reporting systems [14]. The IATA encourages airlines to use this experience, for example, to tailor evidence-based training (EBT) to the specific needs of the organization and pilots, and to use first-hand experience of pilots on “airline-critical procedures” by evaluating their incident reports [15] (p. 52).
Incident reports can also be an important prerequisite for enabling LFI, hazard identification, and risk monitoring in the context of safety management systems (SMS) [16]. An SMS is based on a formal and prescriptive approach and includes explicit and formal methods of how organizations should identify and manage risks; this includes processes for how incidents are identified and reflected upon [17]. The use of incident reports, despite their role as a lagging indicator of safety performance, can be an indication of proactive safety management in organizations [18].
Incident reporting can be viewed through various industrial and organizational psychology lenses, such as various aspects of organizational change, theories of work satisfaction, or social constructivist perspectives [19]. In reflecting reporting systems from an occupational safety perspective, scientific results from the recent years identified several work environment-related and individual-related barriers that could limit the effectiveness of reporting systems [20].
Not all incidents perceived by organizational members are actually reported e.g., [21]. Underreporting is a common issue in various high reliability areas, such as healthcare settings [22], energy supply [23], or civil aviation [24]. It has been shown that the extent of underreporting often depends on the severity of underreported event [25]. As the dark figure of unreported incidents is usually not known to airlines, the extent of fogging is difficult to quantify [13]. Therefore, underreporting is likely to result in impaired safety management practices being at risk of failing to prevent accidents at an early stage [10,26]. A review by [26] revealed inadequate reporting behavior by organizational members to be the primary reason for ineffective reporting systems in more than half of the papers they studied, thus underlining that the initial LFI phase of incident detection can be considered as a significant bottleneck of the LFI (e.g., [10]). As a result, the application of IATA’s recommendation to design evidence-based training (EBT) for pilots from the evidence of incident reports would only be based on a fraction of the incidents that had actually occurred [15]. One of the authors is a commercial pilot who is employed in the airline’s safety department, and has repeatedly experienced incidents not being reported by his colleagues; therefore, this research aims to investigate how voluntary reporting behavior can be improved at organizational and individual levels.
In this study, we intend to further explain commercial pilots’ voluntary reporting behavior of self-inflicted incidents in the context of safety citizenship behavior (SCB), while also investigating the influence of individual and environmental factors in order to enable LFI and EBT, thus reducing future incidents caused by errors and violations.

1.2. Safety Citizenship Behavior and Voluntary Reporting Behavior

For commercial airlines, legal requirements stipulate incidents that are mandatory to be reported [27]. However, incidents that might not be captured by mandatory reporting regulations also tend to contain “safety-related information which is perceived by the reporter as an actual or potential hazard to aviation safety” [27] (p. 28). These actual or potential hazards to flight safety must be reported voluntarily by pilots.
Voluntary reporting behavior can broadly be defined as extra productive work behavior that promotes organizational goals by following established rules [28]. When considering safety-related behavioral aspects, safety-related cultural and climatic constructs need to be considered, as these express the way safety is valued and help to explain the processes through which the meaning attached to safety in an organization influences safety outcomes [29] (p. 194). Safety culture can be defined as the underlying values and assumptions that guide the safety-related behavior of organizational members [29]. A just culture, mentioned at the beginning, is characterized by an atmosphere of trust and openness and is considered a cultural prerequisite for developing a reporting culture within a clearly defined framework of acceptable and unacceptable behavior that encourages the voluntary reporting of incidents [10,30,31]. As cultural characteristics are less accessible to conscious assessment, aspects of safety climate are often considered preferable, serving as a “surface feature of safety culture” [29,32] (p. 194).
Safety climate refers to “shared perceptions with regard to safety policies, procedures and practices” in an organization [29,33] (p. 143). Through sensemaking, a process of aggregating individual experiences into a collective phenomenon, a safety climate provides a framework shared by organizational members that influences motivation and behavior [34,35]. Several studies showed a strong correlation between organizational members’ positive perception of a safety climate, their safety motivation, and voluntary safety behaviors [36,37]. The work–safety tension mentioned initially can be seen as a facet of the safety climate that exerts particularly negative effects on employees’ safety behaviors, accidents, and injuries [6,7]. Safety motivation describes an “individual’s willingness to exert effort to enact safety behaviors and the valence associated with those behaviors” [37] (p. 947). The relation between safety climate and safety motivation is influenced by various individual psychological processes, such as feelings of empowerment, psychological ownership, personal engagement, and passion for meeting challenging work goals [11,29,38]. When work, especially in high-risk areas, seems meaningful to organizational members, safety behavior can be seen as an intrinsically motivated investment in self-protection [39]. Organizational members’ safe behavior can be considered a better predictable key safety outcome than the number of accidents or incidents, due to the closer proximity to the psychological factors described above [36].
Voluntary behavior that has a positive impact on the organization’s ability to function goes beyond established processes and organizational expectations, and is not directly or explicitly considered within the formal incentive system, referred to as organizational citizenship behavior (OCB) [40,41]. Voluntary safety behavior that positively impacts organizational safety levels and goes beyond safety compliance is referred to as safety citizenship behavior (SCB) and has its origins in OCB [11]. SCB is often used interchangeably with the concept of safety participation in the scientific literature, and can be divided into affiliation-oriented, prosocial-oriented SCB, which mainly refers to affective dimensions of organizational membership and change-oriented, initiative-based SCB, which is strongly related to self-efficacy [42,43,44,45].
Change-oriented SCB has been studied much less frequently than affiliated SCB in the psychological literature to date [43]. However, according to [46], further analyses of SCB could significantly improve safety in an organizational context. In this research, we will therefore address how SCB and voluntary reporting behavior are related. Here, we expect that commercial pilots who exhibit a pronounced fundamental SCB in their routine work will also exhibit a pronounced reporting behavior when they cause a self-inflicted incident. Therefore, we hypothesize that commercial pilots’ safety citizenship behavior is positively related to their voluntary reporting behavior being a specific form of change-oriented SCB on the dimension of “individual initiative” ([47]) or “initiating safety-related change (improving safety)” ([48,49,50]).
However, because studies have shown that voluntary reporting behavior appears to differ substantially depending on which factors cause an incident to be reported (e.g., [51]), we briefly describe ways of reflecting on incidents in the following section, before we formulate our first research hypothesis.

Reflecting Incidents

The overall performance of the flight crew remains the “primary contributing factor for accidents and incidents” [1] (p. 45). Particularly during critical phases of the flight, such as takeoff and landing, a limited “human consistency” [52] is often related to accidents and incidents.
When investigating accidents, however, modern perspectives, such as System-Theoretic Accident Model and Processes (STAMP), consider accidents more as failures of a complex sociotechnical system structure and, thus, as the result of uncertain interactions of various system components, in which human factors are one of many components [53]. The interactions between the different system structures and their environment implied in this view allow for a more complete understanding of the system, and thus allow for more effective safety management [54]. In addition, the consideration of system dynamics within this approach is essential to comprehend the development of more complex accidents, such as the Bhopal incident, to give one example [55,56].
When investigating incidents, less complex, linear models such as the Swiss Cheese Model are frequently used due to the usually significantly larger number of incidents [56,57]. The Human Factors Analysis and Classification System (HFACS), which is based on the Swiss Cheese Model, considers the occurrence of incidents as a linear failure in the areas of organizational influences, unsafe supervision, preconditions, and pilots’ unsafe acts [58]. The appropriateness of HFACS for incident report analysis has also been demonstrated in scientific studies [59,60]. In HFACS, pilots’ unsafe acts are divided into performance-based errors, judgment and decision-making errors, and violations. The DoD-HFACS 7.0 has established a total of 13 different subordinate categories for unsafe acts, as shown in Figure 1 [61].
As mentioned before, errors and violations as causes of incidents are also favored by a work–safety tension [4,5,7]: Work–safety tension can be understood as “the tension felt when working safely is perceived to be at odds with effectively performing one’s job” [6] (p. 1462). In addition, this tension negatively affects organizational members’ attitudes towards reporting accidents and incidents [4].
Studies by [51,62] showed that the number of incident reports differed depending on the unsafe acts that caused a given incident. Since it is usually not known how often incidents occur, but instead only the number of reports, fewer reports do not necessarily mean fewer incidents. We therefore suggest that operationalizing of “one” incident reporting behavior is not appropriate because pilots’ behavior seems to differ fundamentally in terms of what causes an incident. Our first research hypothesis is therefore:
H1: Commercial pilots’ safety citizenship behavior is positively related to their voluntary reporting behavior of self-inflicted incidents caused by:
H1a: Performance-based errors;
H1b: Decision-making errors;
H1c: Violations.
When we use the term “reporting behavior” in this research, we always use it to indicate voluntary reporting behavior of commercial pilots’ self-inflicted incidents. For improved readability, we use the term “performance-based error reporting” when referring to commercial pilots’ voluntary reporting behavior of incidents caused by performance-based errors. This wording is also used analogously for “decision-making error reporting” and “violation reporting”.
Reporting behavior differs from change-oriented SCB by the fact that a pilot must admit their own errors to initiate safety-related changes (cf. [46,48,63]). This aspect underlines that the expected positive relation between SCB and reporting behavior, like any form of work behavior, should be considered under the influence of reporting behavior-specific motivational factors [64].

1.3. Factors Influencing Reporting Behavior

For a fundamental consideration of proximal and distal factors influencing safety-related work behaviors and safety outcomes, the reader may refer to the Integrative Model of Workplace Safety (IMWS) by [36]. In this model, the safety climate and leadership are described as distal, situation-related factors, whereas personality traits and attitudes belong to person-related distal factors; these distal factors determine the degree of safety motivation, which is considered a proximal factor for safety performance, and thus also for safety participation, which is often used interchangeably with SCB in the scientific literature [29,36,42].
With respect to the reporting behavior of organizational members in hazardous organizations, the state of research is already quite extensive; an expansion has taken place in recent years, primarily via studies in the healthcare sector (cf. [65,66]). The reporting behavior of commercial pilots has been investigated through a relatively small number of studies [24,67]. Furthermore, commercial pilots are often a minority in studies with multiple employee groups [20]. For this reason, we consulted experts in the field of incident analysis on factors influencing reporting behavior in preparation for this research in the summer of 2019 (publication currently under review). Based on these findings, we outline how reporting behavior in terms of “optimal functioning at work” can be affected by individual and environmental motivational antecedents and goal-related aspects, with reference to an Integrative Motivation Framework [64] in the following section.
At an individual level, momentary states of fear and shame can be considered motivational antecedents of voluntary reporting behavior [29,64]. Fear when reporting can lead to restricted reporting behavior and is directed, for example, toward what is perceived as fear of disciplinary action, fear of an unfair performance appraisal, or individual reputation concerns [68,69]. Shame impairs reporting behavior and can even trigger concealment behavior, especially in areas perceived as risky [26,69].
At an environmental level, reporting behavior can be influenced by the prevailing reporting culture within an organization and its associated just culture [18,26,64,70]. The European Parliament defines just culture to be a “culture in which front-line operators or other persons are not punished for actions, omissions or decisions taken by them that are commensurate with their experience and training, but in which gross negligence, willful violations and destructive acts are not tolerated” [27] (p. 27). Even though just culture is generally considered a facet of organizational safety culture, commercial airlines in the European Union are required to translate the “principles” described in the definition into internal organizational rules [18,27]. The legislation on the level of the European Union intends to clearly protect the reporter from disadvantages or prosecution within the framework of a just culture [27]. In a meeting between the authors and safety experts from the Professional Association of Commercial Aircraft Pilots and Flight Engineers in Germany “Vereinigung Cockpit (VC)” during the preparation of this study, it became clear that, although these legal framework conditions apply at an EU level, they have not been integrated into national German law so far.
Like any behavior at work, reporting behavior is goal-directed and can be considered in the context of various motivational theories [64]. In this study, we consider aspects of goal choice and goal striving that pilots pursue in the context of a work–safety tension by writing a report [6,64]. Based on the results of the expert survey mentioned above, two types of goals are distinguished: change goals are characterized by giving other pilots or the organization the opportunity to learn from their own errors or to achieve safety-related improvements in the work environment [24,51]. Protection goals focus on documenting an incident to limit individual liability from self-inflicted incidents [27]. Factors that affect goal striving when reporting can be limiting from the perspective of the Theory of Planned Behavior when there is an intention to report but that intention does not translate into action (cf. [71]). One mechanism identified in this context during the expert interview was procrastination (a voluntary delay of a deliberate, important action even though the individual is aware of potentially unfavorable consequences) (cf. [72]). Pronounced procrastination behavior may result from low levels of self-efficacy, whereas high levels of self-efficacy are related to SCB [43,73].
The reporting behavior-specific individual and environmental factors derived from the mentioned preparatory study go beyond person- and situation-related factors affecting an overall “individual’s willingness to exert effort to enact safety behaviors” [37] (p. 947) in the IMWS [36]. We therefore hypothesize that voluntary reporting behavior may not be explained solely by these factors and that the individual and environmental motivational factors relating exclusively to reporting behavior outlined in this section might have an effect on the magnitude of the positive relation between fundamental SCB and reporting behavior. Our second research hypothesis is therefore:
H2: The magnitude of the positive relation between a commercial pilot’s safety citizenship behavior and their voluntary reporting behaviors depends on:
H2a: Fear;
H2b: Shame;
H2c: Just culture;
H2d: Change goals;
H2e: Protection goals;
H2f: Procrastination.
With this hypothesis, we also follow the recommendations of [42] and [64] to further investigate motivational aspects in safety-participating activities at work.

Other Planned Analyses

As stated in our hypotheses, from an occupational safety perspective, we expect a positive relation between fundamental SCB and reporting behavior, depending on a moderating influence of the variables presented, which are “at the very heart of theory testing in the social sciences” [74] (p. 255). Thus, we take up one possible perspective on reporting behavior, and it is conceivable, as discussed above, that other perspectives or motivation-based approaches unrelated to safety aspects in organizations may also be appropriate. Therefore, we will use an exploratory approach to investigate whether fundamental SCB remains the best predictor of voluntary reporting behavior, even when compared with possible direct effects of the variables in H2a to H2f. The results are intended to support future research and will not be interpreted further. Figure 2 summarizes our research agenda.

2. Materials and Methods

The methodology was a non-experimental, correlative design using a computer-based online questionnaire. The questions associated with theoretical constructs were intended to determine the differences between pilots in terms of their individual degrees of agreement with statements presented to use the data obtained to draw conclusions about underlying assumptions (cf. [75]).
We do not expect any procedural restrictions, because we expect pilots to be sufficiently familiar with computer and internet use (cf. [76]). We justify the choice of this method with positive previous experiences in comparable studies (cf. [20,24,36,51]) and the high objectivity of the procedure and evaluation (cf. [77]).

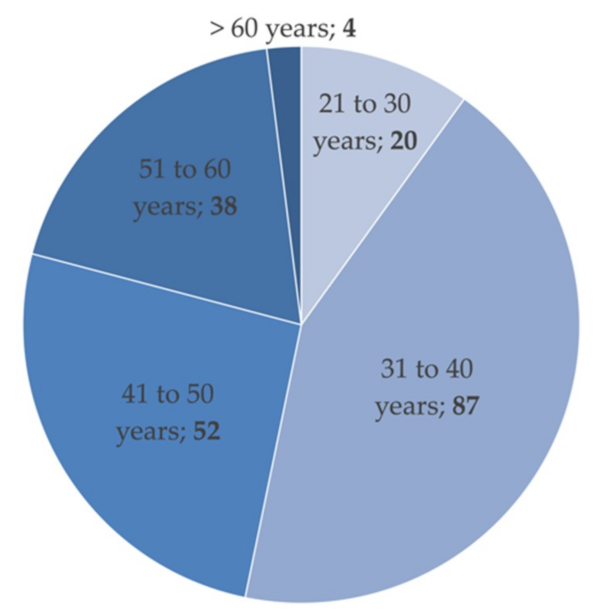
2.1. Participant Characteristics

The sample consisted of n = 202 participants, of whom 23 (11.4%) were female and 177 (87.6%) were male, while 2 did not indicate their sex. The age distribution is shown in Figure 3.
In total, 99 (49.0%) participants indicated their rank with captain, 99 (49.0%) with officer, and 4 did not specify. Moreover, 180 (88.1%) pilots indicated that they worked for a German-registered airline, 11 (5.4%) worked for an EU-registered airline, and 11 did not specify. On average, the participants were employed by their airline for about 16 years (M = 15.74, SD = 9.03). In total, 32 (15.8%) participants answered the question about an additional function in airline management with yes, 154 (76.2%) with no, and 16 (6.9%) did not want to specify. There were 30 (14.9%) participants who answered the question about an additional role as flight instructor with yes, 189 (78.7%) answered with no, and 11 (5.0%) did not want to specify. For our analyses, no inclusion and exclusion criteria or restrictions based on demographic characteristics were defined (cf. [78]).

2.2. Sampling Procedure

The participants were recruited with the support of the Professional Association of Commercial Aircraft Pilots and Flight Engineers in Germany “Vereinigung Cockpit” (VC). The study was conducted in accordance with the Declaration of Helsinki. The protocol of research project with identification code “RESEARCH SURVEY ON THE REPORTING BEHAVIOR OF PILOTS ON SELF-INFLICETED INCIDENTS” was approved by the Professional Association of Commercial Aircraft Pilots and Flight Engineers in Germany “Vereinigung Cockpit” (VC) on 19 September 2019. Approximately 10,000 potential participants were encouraged to participate in the context of a regular e-mail newsletter from the professional association on 14 October 2019. During the data collection, two reminders for participation were sent out (13 December 2019 and 6 February 2020). The data collection was completed on 21 February 2020. With n = 202 participants, the percentage of pilots participating was about two percent. Participants received no incentives for participation.

Sample Size

The required sample size was calculated using G*Power (version 3.1) for a linear multiple regression with a fixed model for R2 deviations from zero [79]. Although the effect sizes calculated in one of our pre studies [51] were in a high range, these results were unsuitable for the calculation of the expected effect sizes in this study because interaction effects usually explain less variance than main effects [80]. Therefore, we considered comparable studies with moderating effects in the context of safety citizenship behavior and safety-related constructs (cf. [81,82]). In these studies, the ΔR2 due to moderation amounted to between 5% and 8%. We used the smallest effect (ΔR2 = 0.053) found in these studies and calculated a required sample size of 199 participants (f2 = 0.056, pα < 0.05, p1-α = 0.80). The achieved sample size of n = 202 was larger than the intended sample size of n = 199.

2.3. Measures

Participants were asked to indicate their individual level of agreement with presented statements (task master). Therefore, a verbal, bipolar, end-point-named rating scale with neutral middle category was used (cf. [83]). The scale was presented from left to right and consisted of five intervals from 1 = “I strongly disagree” to 5 = “I strongly agree”; an “I do not know” category was not offered (cf. [84,85]). The scale was consistent throughout the questionnaire (cf. [86]).

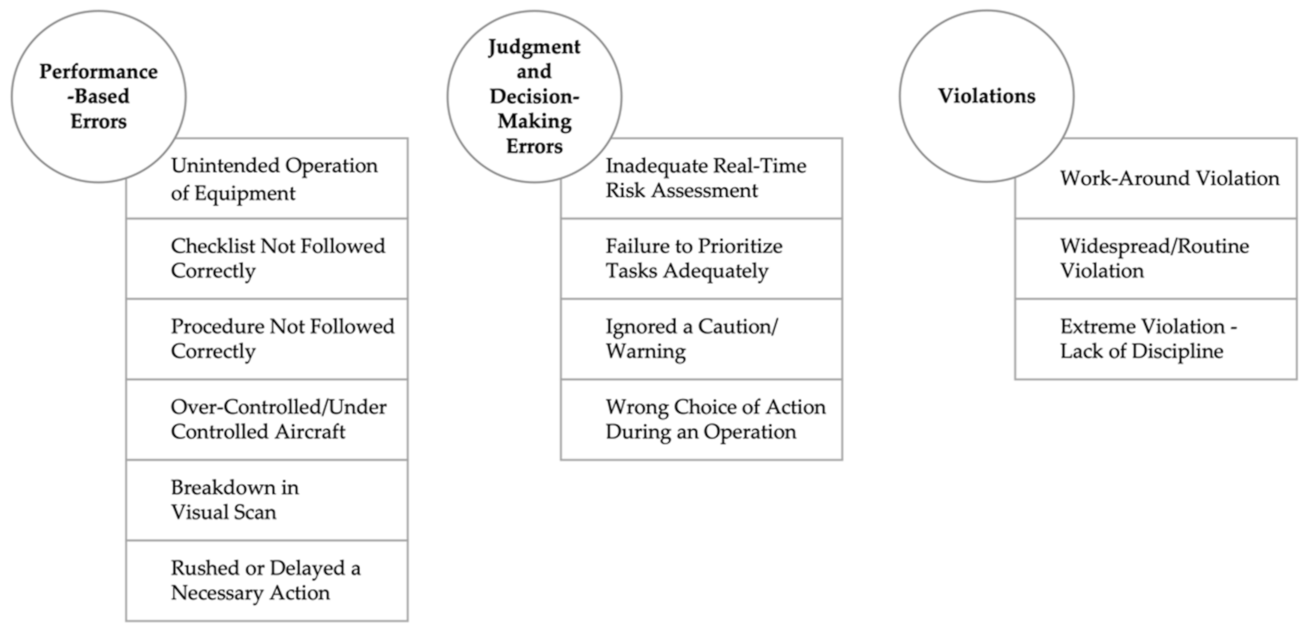
2.3.1. Outcome Variables: Reporting Behaviors

Reporting behaviors were measured using with a total of 13 hypothetical incident scenarios as item masters. The universe of items was defined by the subordinate categories of the three output variables of performance-based errors, decision-making errors, and violations included in DoD-HFACS 7.0 (cf. Figure 1) [61,87]. We used a rational construction strategy to develop one hypothetical incident scenario for each item master. The content of each scenario was derived following an evidence-based approach from an analysis of more than 2000 pilots’ voluntary reports of self-inflicted incidents, which was conducted in preparation for this research [62]. In addition, the following design rules were established in advance: The incident scenario assigned to the respective subordinate unsafe act category should correspond to a frequently described incident in this subordinate category found in the evaluated reports and, if possible, include information about contributing factors identified by [62] to be risk factors for this type of incident. Moreover, the incident scenarios should contain all information relevant for the assessment (cf. [88]), have a medium occurrence severity (cf. [51]), be comprehensible regardless of the type of aircraft flown by the pilot, and should not describe any measurable damage.
The selection of the items based on the unsafe act categories of the Dod-HFACS 7.0 and the evidence-based construction for each item described above supported a content-valid operationalization of the three subtypes of reporting behavior (cf. [75]). Considering that the association structure of the hypothetical incident scenarios with the three subtypes of reporting was already given by the HFACS systematics, no further test of construct validity was conducted (cf. [75]).
Performance-based error reporting was measured with six hypothetical incident scenario items. An example item was:
“During cruise you receive a climb-clearance to FL380. You initiate the climb using the auto flight system by selecting a vertical speed. After that, you continue reading in your magazine. A few moments later you see that the IAS has reduced significantly toward the minimum speed. You decrease your vertical speed and continue the flight without further incidents”. The internal consistency of the scale in this study was in a good range (Cronbach’s α = 0.82) [89].
Decision-making error reporting behavior was measured with four hypothetical incident scenario items. An example item was:
“During final approach, the tower reports that a wooden plank has been seen on the right edge of the runway by another aircraft. You decide to land a little left of the centerline. During landing roll, you realize that it is a larger number of wooden planks that could have caused damage if you had touched down right of the centerline. You taxi to the gate without further incidents”. The internal consistency of the scale in this study was in a questionable range (Cronbach’s α = 0.69) [89].
Violation reporting behavior was measured with three hypothetical incident scenario items. An example item was:
“During final approach you fly faster than usual to reduce the delay of your flight. Distracted by several ATC calls you miss an on-time configuration of the aircraft and reach the altitude prescribed by your airline for a stable condition with 30 knots overspeed. Together with your colleague, you perform a risk assessment and decide to continue the approach, due to the fact the missed approach would lead through an area of bad weather. You land and taxi to the gate without further incidents”. The internal consistency of the scale in this study was in a good range (Cronbach’s α = 0.80) [89].

2.3.2. Predictor Variable: Safety Citizenship Behavior

Safety citizenship behavior (SCB) was measured using the three items of the safety participation factor by [37]. We chose this scale because the items reflected most closely the fundamental aspects of SCB described above. An example item was: “I put in extra effort to improve the safety of the workplace”. The internal consistency of the scale in this study was in a good range (Cronbach’s α = 0.88) [89].

2.3.3. Moderators

To measure the constructs of fear, shame, just culture, change goals, protection goals, and procrastination, item groups with items constructed in an inductive construction strategy were used. To ensure that all aspects relevant to the construct were included in a representative and content-valid manner, the content relevant to voluntary reporting behavior was identified through the named expert interview (cf. [90]). The universe of items was defined by the construct-specific aspects described as relevant by experts (cf. [87]). When formulating the item masters, literal formulations used by the experts in the interview were used whenever possible. According to [75], the following rules were observed: The personalized statements should directly address the characteristic of interest and aimed to be as concrete and emotionally neutral as possible. When formulating the items, linguistic comprehensibility had the highest priority; we placed special emphasis on a positive formulation of the items, the use of simple terms, and a clear sentence structure. To ensure the unambiguousness of the item content, we avoided universal expressions and adapted the item content to the language level of the target group; we made sure that no item contained multiple statements and refrained from any suggestions.
Fear was measured with eight items. Example items were “When I think about reporting an unsafe act to my airline, I fear being asked unpleasant questions” and “When I think about reporting an unsafe act to my airline, I fear being fired”. The internal consistency of the scale in this study was in an excellent range (Cronbach’s α = 0.93) [89].
Shame was measured with four items. An example item was “When I commit an unsafe act, I feel ashamed”. The internal consistency of the scale in this study was in an acceptable range (Cronbach’s α = 0.74) [89].
Just culture was measured with three items. The phrasing of the items beginning with “In my airline” should reflect that these items are designed to address the organizational, not psychological, level of analysis (cf. [91]). An example item was “In my airline, the management practices just culture principles”. The internal consistency of the scale in this study was in a good range (Cronbach’s α = 0.89) [89].
Change-related goals relate to enabling a safety-related change or learning in the organization, and were measured with four items. An example item was: “By reporting an unsafe act, I can help other pilots learning from it”. The reliability of the scale in this study was in good range (Cronbach’s α = 0.81) [89].
Protection goals relate to documenting the incident to reduce individual liability concerns, and were measured with two items. An example item was: “By reporting an unsafe act, I am legally protected if the act becomes known to my airline through other sources”. Moreover, recommend using the Spearman–Brown coefficient to measure the reliability of a two-item scale [92]. The reliability of the scale in this study was in a good range (ρy1y2 = 0.83) [89].
Procrastination was measured with four items. An example item was “It happens that I keep postponing filing my report, ending up not filing it at all”. The internal consistency of the scale in this study was in a good range (Cronbach’s α = 0.84) [89].

2.4. Descriptive Items Statistics

Except for four items, item difficulty (Pi) was in a medium range (20 ≤ Pi ≤ 80) [75]. Eighteen items indicated good item discrimination (0.4 ≤ rit ≤ 0.7). The item discrimination of 13 items was below rit ≤ 0.4 and above rit ≥ 0.7 for 9 items [75]. As the items with low discrimination were not close to zero and were relevant for content-theoretical reasons, they were not removed [75]. The descriptive item statistics are summarized in Appendix A.
To assess the correlation structure between the test items and the constructs used as independent variables, we applied structure-seeking factor analytic procedures for construct validation [75,90]. Hence, a first descriptive classification of the items into the existing theoretical structure of the described constructs should provide information about the homogeneity of the test items [75]. The number of factors was set a priori to seven. Sampling adequacy was confirmed by the Kaiser–Meyer–Olkin measure (KMO = 0.837). The Bartlett’s Test of sphericity was significant (χ2 (378) = 3796.97, p < 0.001). The seven factors explained 64.51% of the total variance. The rotated factor structure reflected the theoretical structure and is presented in Appendix B.

2.5. Pretest

A multistage pretest was conducted to qualitatively test the comprehensibility of the items. In addition, we wanted to ensure that all relevant information was available for assessing the incident scenarios described (cf. [88]. In a first step, 24 participants, 15 of them pilots, completed a printed version of the questionnaire and documented encountered difficulties. After the corrections had been incorporated, a further pre-test with three pilots was conducted using “cognitive pretesting” in combination with the “think aloud method” (cf. [83]). A further pre-test using paraphrasing was carried out with another pilot. Four persons, two of them pilots, tested the final online version of the questionnaire. The pretests resulted, for example, in the rewording of items or scenario adjustments.

2.6. Procedure

Data collection was carried out with a web-based questionnaire using EvaSys software. Reasons for the choice of this software were data protection aspects, as well as optimized usability for mobile devices. All subjects gave their informed consent for inclusion before they participated in the study. After the content-related questions had been completed, participants were provided with a short debriefing text (cf. [93]). The questionnaire was in the English language; completion took between 20 and 30 min.

2.7. Analysis

IBM SPSS-Software (version 27) was used for analyses. Due to the rather large number of constructs, hypothesis testing using latent variable models was not possible with our sample size, especially given the usually small effect sizes of interaction effects (cf. [94,95]). Moreover, these models suffer from several methodological constraints when testing for interaction effects (cf. [96,97,98]).
Therefore, linear regression models were calculated.

2.7.1. Statistical Requirements and Missing Values

We assumed linear relations of variables involved after a visual inspection of the scatterplot with LOWESS smoothing [99]. The collinearity statistics were inconspicuous (Variance Inflation Factor (VIF) < 10) with the largest VIF = 2.09 (cf. [100]). The visual inspection of the standardized residuals and standardized estimated values revealed signs of heteroskedasticity, and the PP-plots of observed and expected cumulative probabilities revealed signs of violated normal distribution requirements of the residuals. Therefore, bootstrapping and heteroscedasticity-consistent standard errors were used as described above (cf. [100,101]).
Overall, 0.6% of data was missing. The MCAR test according to Little was not significant (χ2 [571] = 565.81, p = 0.55), indicating data missing completely at random (MCAR). As no variables or cases with more than 5% missing values could be detected, missing data (except demographical data) were imputed using the expectation maximization algorithm (cf. [100,102,103,104].

2.7.2. Outliers and Influential Data Points

For the evaluation of outliers, leverage values with hm > 0.045 (H1), hm > 0.015 (H2), and hm > 0.089 (further analyses), and externally studentized residuals ti > |3|, were analyzed (cf. [100]). As no input errors, misunderstandings, or boycotts could be detected, all cases were included for analysis (cf. [100]).
For the evaluation of influential data points, we considered the changes in regression coefficients (DfBETAS) and in predicted ŷ-values (DfFITS) larger than |1|, as well as Cook’s Distances with D > 0.020 (cf. [74,100]). As neither the demographic data nor the commentary field in the questionnaire suggested subpopulations or unique participants, the hypotheses were tested using the entire data set (cf. [100]). As explained above, the hypotheses were also tested by excluding influential data points. The number of excluded cases in the respective regression model is indicated by the degrees of freedom.

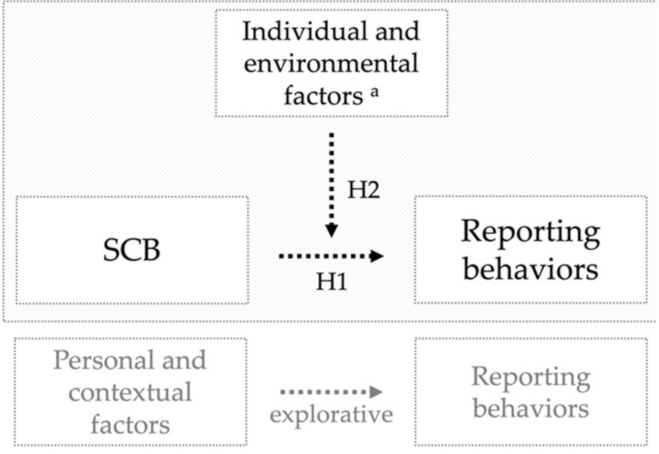
2.7.3. Hypotheses Testing

To test hypothesis one, three simple linear regression models were calculated. To test hypothesis two, moderated multiple regression involving a two-way interaction between SCB and the moderator named in the hypothesis were calculated with ordinary least squares (OLS) regression using the PROCESS 3.5 macro by [105]. The moderation was tested in 18 individual regression models because interactions with more than one moderator are difficult to interpret meaningfully (cf. [80]). Outcome variables were performance-based error reporting, decision-making error reporting, and violation reporting. All continuous variables that defined products were mean-centered to facilitate the interpretation of the regression parameters (cf. [105,106]). Bootstrapping with 5000 iterations, together with heteroscedasticity-consistent standard errors (HC3), was used to calculate confidence intervals (cf. [107,108]). To probe the interactions, the Johnson–Neyman technique was applied (cf. [109]). To assess the sensitivity of the regression results, these are additionally presented without the effect of influential data points (cf. [100,110]).
A significant interaction term in each regression model calculated with the complete dataset was defined as the criterion for acceptance or rejection of the hypotheses [106,109]. We use the semi-partial correlation of the product term (ΔR2) as an effect size measure because this value contains the portion of the variance of the outcome variable that can be explained exclusively by the interaction effect [111].
Hypotheses, which were also confirmed during the sensitivity analyses, are additionally presented visually for a simplified interpretation (cf. [112]).

2.7.4. Other Planned Analyses

To investigate whether SCB remains the best predictor for voluntary reporting behaviors when compared with possible direct effects of the predictors defined as moderators in hypothesis two, we calculated multiple linear regression models for each dependent variable. The predictors were included data driven using forward selection because the explorative approach did not contain any assumptions about the causal order or relevance (cf. [74]). The results are additionally presented without the effect of influential data points.

3. Results

The descriptive statistics and correlations for study variables are shown in Table 1. Values between 0.10 ≤ r ≤ 0.30) correspond to a weak effect, between 0.30 ≤ r ≤ 0.50) to a moderate effect, and to a strong effect for r > 0.50 [113].

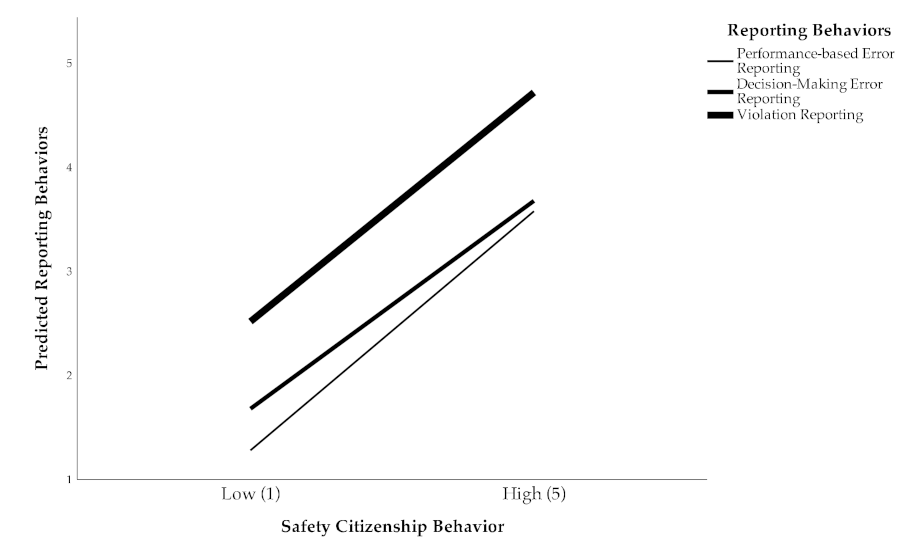
3.1. Hypotheses Testing

Hypothesis one assumed that commercial pilots’ safety citizenship behavior is positively related to their voluntary reporting behavior of self-inflicted incidents caused by performance-based Errors (H1a), decision-making errors (H1b), and violations (H1c).
This hypothesis could be accepted because SCB was shown to be a significant predictor for all subtypes of reporting behavior. The effect sizes for all three models could be considered as large (R2 > 0.25) [113]. The result was also confirmed without influential datapoints but indicating a decrease in explained variance for SCB predicting violation reporting (H1c). Table 2 shows the summary of the regression models. For simplified interpretation, the results are also shown graphically in Figure 4.
Table 1. Descriptive statistics and correlations for study variables.
VariablenMSD123456789
1.Performance-based Error Reporting a2022.900.90
2.Decision Making Error Reporting a2023.100.88.64 **
3.Violation Reporting a2024.070.95.58 **.60 **
4.SCB a2023.531.11.57 **.51 **.51 **
5.Fear a2022.061.03−.19 **−.21 **−.42 **−.27 **
6.Shame a2023.160.87−.07.04−.14−.17 *.39 **
7.Just Culture a2024.071.01.39 **.36 **.61 *.42 **−.61 **−.16 *
8.Change Goals a2024.200.70.42 **.30 **.34 **.48 **−.28 **−.23 **.49 **
9.Protection Goals a2023.121.20.11−.11.01−.02−.08.01.13.09
10.Procrastination a2022.971.07−.22 **−.20 **−.33 **−.32 **.35 **.18 **−.42 **−.33 **−.14 **
* p < 0.05. ** p < 0.01. Note. M = mean; SD = standard deviation; SCB = safety citizenship behavior; Likert-scale ranging from 1 = “I strongly disagree” to 5 = “I strongly agree”. a 1 = low expression of the measured construct, 5 = high expression of the measured construct.
Table 2. SCB predicting reporting behaviors.
H1a: Performance-Based Error Reporting aH1b: Decision-Making Error Reporting aH1c: Violation Reporting a
95% CI 95% CI 95% CI
bSEβLLULtbSEβLLULtbSEβLLULt
Constant1.28.17 .941.627.32 ***1.68.18 1.342.049.46 ***2.52.19 2.142.9013.03 ***
11.15.17 .821.486.91 ***1.71.18 1.352.079.33 **3.00.19 2.633.3715.91 ***
SCB b.46−.05.57.37.559.74 ***.40.05.51.31.508.28 ***.44.05.51.34.548.40 ***
1.48.05.62.40.5810.84 **.40.04.51.30.508.10 ***.34.05.45.24.446.79 ***
R2.32.26.26
1R2 1.38.26.20
F (df1, df2)94.79 (1, 200)68.59 (1, 200)70.48 (1, 200)
1F 1 (df1, df2)117.39 (1, 193)65.64 (1, 189)46.13 (1, 184)
** p < 0.01. *** p < 0.001. Note. b = coefficient; SE = standard error; β = standardized coefficient; CI = confidence interval; LL = lower limit; UL = upper limit; t = t-value; SCB = safety citizenship behavior. a Outcome variable, b Predictor Variable. 1 Sensitivity analyses in italics.
Hypothesis two assumed that the magnitude of the positive relation between commercial pilot’s safety citizenship behavior and their voluntary reporting behaviors depends on fear (H2a), shame (H2b), just culture (H2c), change goals (H2d), protection goals (H2e), and procrastination (H2f). The decision to accept or reject a hypothesis was based on a statistically significant interaction term between SCB and the respective moderator formulated in H2a to H2f. To provide an initial overview of which hypotheses were accepted or rejected, we summarize the interaction terms in Table 3; accepted or partially accepted hypotheses are then described in detail. As mentioned above, accepted or partially accepted hypotheses that were also supported by analyses without influential data points are presented visually in Figure 5.
H2a was rejected because no significant interaction between SCB and fear could be shown for all three subtypes of reporting behavior. The analyses without influential data points found support for accepting the hypothesis for violation reporting and confirmed a rejection of the hypothesis for performance-based error reporting and decision-making error reporting.
H2b was rejected because no significant interaction between SCB and shame could be shown for all three subtypes of reporting behavior. The analyses without influential data points confirmed this result for all subtypes of reporting behavior.
H2c was accepted for violation reporting and rejected for performance-based error reporting and decision-making error reporting. The analyses without influential data points confirmed this result for decision-making error and violation reporting, and found support for accepting the hypothesis for performance-based error reporting.
SCB (t(3, 198) = 3.83, p < 0.001, b = 0.21), just culture (t(3, 198) = 4.25, p < 0.001, b = 0.39), and the interaction between SCB and just culture (t(3, 198) = −2.51, p < 0.05, b = −0.13) significantly predicted violation reporting (F(3, 198) = 60.21, p < 0.01, R2 = 0.48). The change in R2 by the interaction term amounted to 3.32% (F(1, 198) = 6.33, p < 0.05, ΔR2 = 0.03). As a result of the Johnson–Neyman technique, the conditional effect of SCB on just culture was significant for 70.79% of all mean-centered values of just culture ≤0.72 (t(198) = 1.97, p = 0.05, 95% CI [0.00, 0.23], b = 0.11).
Table 3. Overview of interaction terms.
Performance-Based Error Reporting aDecision-Making Error Reporting aViolation Reporting a
SCB b,* moderatorSCB b,* moderatorSCB b,* moderator
95% CI 95% CI 95% CI
ModeratorbSELLULtdfpΔR2bSELLULtdfpΔR2bSELLULtdfpΔR2
H2aFear c.08.04.00.171.86198.064 .08.05−.01.171.73198.084 .11.06−.010.21.86198.065
H2a 1.06.04.01.131.79186.074 .04.04−.03.121.1186.260 .11.05.020.22.4182.016.021
H2baShame c.00.04−.09.090.05198.960 .04.05−.07.140.67198.501 −.02.09−.19.16−0.21198.835
H2b 1.05.03−.03.101.19188.234 .08.05−.01.171.69182.096 .14.09−.04.311.56182.121
H2cJust Culture c−.07.04−.16.01−1.65198.101 −.06−.05−.16.04−1.23198.218 −.13.05−.23−.03−2.52198.013.033
H2c 1.08.04−.15−.01−2.12187.036.012−.01.04−.09.06−0.33185.739 −.17.04−.25−.10−4.43182< .001.049
H2dChange Goals c−.05.05−.15.06−0.89198.374 −.16.06−.27−.05−2.85198.005.025−.26.08−.41−.12−3.55198< .001.059
H2d 1.01.05−.11.09−0.22190.823 −.12.06−.24−.012.07185.040.014−.16.06−.28−.04−2.55184.011.022
H2eProtection Goals c.08.03.01.142.19198.030.014.04.04−.04.131.09198.279 −.05.05−.15.06−0.86198.389
H2e 1.08.03.03.133.08189.002.015.06.03−.01.131.80184.074 −.01.04−.08.07−0.03182.973
H2fProcrastination c.06.03.00.121.98198.049.007.05.04−.04.131.11198.271 .11.05−.01.221.95198.052
H2f 1.04.03−.01.091.49191.137 −.01.04−.07.07−0.02186.984 .09.05−.01.181.78181.076
Note. b = coefficient; SE = standard error; CI = confidence interval; LL = lower limit; UL = upper limit; df = degrees of freedom; p = p-value (p < 0.05 in bold); ΔR2 = change in R2 due to moderation; SCB = safety citizenship behavior. a Outcome variable, b Predictor Variable, c Moderator. 1 Sensitivity analyses in italics.
Figure 5a shows the conditional effect of SCB on reporting of violations depending on just culture, shown for mean and ±1 SD values. The magnitude of the positive relation between SCB and violation reporting was decreased by lower values of just culture. Lower values of just culture also led to lower predicted values in violation reporting, independent of the SCB level. As described above, the figure may only be interpreted up to mean-centered values of just culture ≤ 0.72.
H2d was accepted for decision-making error reporting and violation reporting, and rejected for performance-based error reporting. The analyses without influential data points confirmed this result.
SCB (t(3, 198) = 5.74, p < 0.001, b = 0.34) and the interaction between SCB and change goals (t(3, 198) = −0.015, p < 0.01, b = −0.16) significantly predicted decision-making error reporting (F(3, 198) = 48.53, p < 0.01, R2 = 0.28). The effect of change goals (t(3, 198) = 0.10, p = 0.92, b = 0.01) was not significant. The R2 change R2 by the interaction term amounted to 2.50% (F(1, 198) = 8.10, p < 0.01, ΔR2 = 0.03). There were no statistical significance transition points within the observed range of the moderator found using the Johnson–Neyman technique.
Figure 5b shows the conditional effect of SCB on decision-making error reporting depending on change goals, shown for mean and ±1 SD values. The magnitude of the positive relation between SCB and decision-making error reporting increased by lower levels of change goals. For approximately average values of SCB, the predicted values of decision-making error reporting were independent of the level of change goals.
SCB (t(3, 198) = 4.23, p < 0.001, b = 0.33) and the interaction between SCB and change goals (t(3, 198) = −3.55 p < 0.01, b = −0.26) significantly predicted violation reporting (F(3, 198) = 35.82, p < 0.01, R2 = 0.33). The effect of change goals (t(3, 198) = 0.35, p = 0.72, b = 0.03) was not significant. The change in R2 by the interaction term amounted to 5.90% (F(1, 198) = 12.57, p < 0.001, ΔR2 = 0.06). As a result of the Johnson–Neyman technique, the conditional effect of SCB was significant for 65.35% of all mean-centered values of change goals ≤ 0.50 (t(198) = 1.97, p = 0.05, 95% CI [0.00, 0.41], b = 0.20).
Figure 5c shows the conditional effect of SCB on violations reporting depending on change goals, shown for mean and ±1 SD values. The effect is comparable to the effect in Figure 5b. The magnitude of the positive relation between SCB and violation reporting increased by lower levels of change goals. For approximately average values of SCB, the predicted values of violation reporting were independent of the level of change goals. As described above, the figure may only be interpreted up to mean-centered values of change goals ≤0.50.
H2e was accepted for performance-based error reporting and rejected for decision-making error reporting and violation reporting. The analyses without influential data points confirmed this result.
SCB (t(3, 198) = 10.65, p < 0.001, b = 0.46), protection goals (t(3, 198) = 2.01, p < 0.05, b = 0.09) and the interaction between SCB and protection goals (t(3, 198) = 2.19, p < 0.05, b = 0.08) significantly predicted performance-based-error reporting (F(3, 198) = 40.59, p < 0.001, R2 = 0.35). The change in R2 by the interaction term amounted to 1.39% (F(1, 198) = 4.81, p < 0.05, ΔR2 = 0.01). There were no statistical significance transition points within the observed range of the moderator found using the Johnson–Neyman technique.
Figure 5d shows the conditional effect of SCB on performance-based-error reporting depending on protection goals, shown for mean and ±1 SD values. The magnitude of the positive relation between SCB and performance-based error reporting was increased by the level of protection goals. For low levels of SCB, the predicted values of performance-based error reporting were almost independent of the level of protection goals.
H2f was accepted for performance-based error reporting and rejected for decision-making error reporting and violation reporting. The analyses without influential data points did not find support for the hypothesis.
SCB (t(3, 198) = 8.81, p < 0.001, b = 0.43) and the interaction between SCB and procrastination (t(3, 198) = 1.98 p < 0.05, b = 0.06) significantly predicted performance-based error reporting (F(3, 198) = 42.62, p < 0.01, R2 = 0.33). The effect of procrastination (t(3, 198) = −0.90, p = 0.37, b = −0.04) was not significant. The change in R2 by the interaction term amounted to 0.69% (F(1, 198) = 3.93, p < 0.05, ΔR2 = 0.01). There were no statistical significance transition points within the observed range of the moderator found using the Johnson–Neyman technique.

3.2. Other Planned Analyses

The other planned analyses indicated that SCB explained the largest proportion of variance in performance-based error reporting and decision-making error reporting, when the variables fear, shame, just culture, change goals, protection goals, and procrastination were included in the model. For explaining variance in violation reporting, results indicated that just culture appeared to be a stronger predictor than SCB.
The results showed that using non-moderated multiple regression just culture and change goals explained proportions of variance in performance-based error reporting in addition to SCB. Variance proportions of decision-making error reporting could be explained by shame, just culture, and protection goals in addition to SCB. A more detailed overview of the results is presented in Appendix C.

4. Discussion

The aim of this study was to further explain commercial pilots’ reporting behavior in the context of safety citizenship behavior (SCB), while also investigating the influence of individual and environmental factors from an organizational safety perspective.
Voluntary incident reporting is frequently discussed in relation to SCB in the scientific literature, although empirical evidence for this relationship is limited. The results of this study provided a theoretical contribution [114] by suggesting that reporting behavior may be considered a specific form of self-intentional, change-oriented SCB; commercial pilots who exhibit a pronounced fundamental SCB in their routine work are likely to exhibit a pronounced reporting behavior when they have caused a self-inflicted incident. The strength of this effect depended on the given pilot’s unsafe acts (performance-based errors; decision-making errors, and violations) that caused the incident. Therefore, our results indicated that different subtypes of incident reporting behavior should be distinguished in terms of these three causal factors. The requirement for this differentiation was also underlined when considering different motivational factors; particularly, just culture and goals when reporting were found to be reporting behavior-specific motivational factors; a moderating effect of just culture on the magnitude of the positive relation between SCB and reporting behavior could only be shown for violation reporting; and higher levels of just culture decreased the magnitude of this positive relation but resulted in the overall highest predicted values for violation reporting. In other words, the higher the level of just culture, the less relevant SCB was for predicting violation reporting. Combined, SCB, just culture, and their interaction explained nearly 50% of the variance in violation reporting. When commercial pilots pursued a higher level of change-oriented goals, this decreased the magnitude of the positive relation between SCB and decision-making error reporting and violation reporting, but led to higher predicted values up to an average level of SCB. In contrast, pilots primarily pursued protection-oriented goals when reporting performance-based errors, and a higher level of these goals increased the magnitude of the positive relation between SCB and performance-based error reporting. If pilots tended to higher levels of procrastination, this increased the magnitude of the positive relation between SCB and performance-based error reporting. However, this effect was only very weak and not stable without influential data points, and was therefore not interpreted further. Neither fear nor shame were found to be reporting behavior-specific motivational factors because they did not show a moderating effect on the magnitude of the positive relation between SCB and the different subtypes of reporting behavior in our study.
As part of the exploratory approach, SCB was found to be the strongest predictor for reporting behavior for incidents caused by errors, even when compared with direct effects of the other independent variables in this study. The result was different regarding violation reporting; for this subtype of reporting behavior, just culture appeared to be a stronger predictor than SCB. When testing models without interaction effects, shame, both types of goals, and just culture showed direct effects on different subtypes of reporting behavior.
Our research proposed to consider reporting behavior to be a specific form of self-intentional change-oriented SCB, further elaborating the state of research on safe work behaviors; our finding that reporting behavior should be interpreted in the context of its causes confirmed the research of [24,51,62]. The explained variance in decision-making error reporting was lower compared to the other two subtypes of reporting behavior, complementing the results of [62] and underlining an area that may be particularly affected by missed learning opportunities in the context of LFI. Our results showed that several motivational factors investigated by previous studies are transferable to pilots’ reporting behavior and confirmed findings from the expert survey we conducted. For example, we were able to demonstrate several beneficial effects of a positive perception of just culture on violation reporting, extending the findings of recent research (e.g., [115]) and supporting claims made by the IATA [2] to civil airlines. A key aspect of a just culture is that pilots can report without fear [2,30]. The strong negative correlation between just culture and fear shown in our study (rfear,just culture = −0.61) suggests that these two constructs are two sides of the same coin. From this viewpoint, it was surprising that, despite a significant interaction effect between SCB and just culture, no interaction effect between SCB and fear could be shown. In summary, our results concerning fear were in contrast with numerous related studies from the last 20 years (cf. [20,68,69,116,117] and the results of our expert interviews. Our findings suggested that reporting behavior, as with any form of work behavior, is goal-directed, and we expanded the field of research on reporting behavior to include a previously poorly considered aspect (cf. [64]). The goal of writing a report so that others can learn from it confirmed the research findings of [24,51] and underlined the relevance of incident reports in the context of LFI (cf. [10]). The goal of protecting oneself when reporting confirmed the research of [118], in which most participants viewed reporting as a professional obligation and a strategy to limit their individual liability. Our study also extended the state of research that these liability concerns may also include possible negative consequences by the civil aviation authority, and confirmed the VC safety experts’ assumption to that effect. The weak effect of procrastinating shown supported the findings of [119] that procrastinating appears to be a product of prior performance rather than a predictor of behavior in the future. Contrary to the findings of [26,69], shame did not affect reporting behavior; only a direct effect was shown in the exploratory analysis on decision-making error reporting. Given that inadequate decisions are often a product of inadequate teamwork skills and limited crew resource management (CRM), and pilots themselves consider these skills important, it was surprising that shame affected and even seemed to reinforce this very subtype of reporting behavior [120,121]. A summarizing view of the results underscores the relevance of a goal-oriented view of reporting behavior, for example, from the perspective of VIE-theory. In other words, pilots who pursue personal goals in reporting are likely to attribute increased valence to these goals and consider the writing of a report as instrumental to achieving these goals. Just culture results in the report, which leads to the desired outcome (change or protection) rather than a disadvantage for the pilot, and may thereby improve reporting behavior (cf. [122]).

4.1. Limitations

In the following section, we describe limitations regarding quality criteria of the measurement instrument and the overall research design (cf. [123]). Implementation objectivity may be limited by a top–down display of the scale on mobile devices that differs from the display on computer screens (cf. [124]). Consistency effects due to the fixed order of items in the questionnaire could not be prevented, and even items belonging to one construct were partially mixed. Safety-related cultural processes tend to be more implicit and less accessible to conscious perception compared to climatic processes [29]; therefore, the reliability of measuring individual perceptions of just culture may be limited. Furthermore, the individual assessment of hypothetical incident scenarios items may be biased by a different perception of severity (cf. [125]) or by the fact as to whether a pilot had already experienced a comparable incident described in the scenario. Although the use of hypothetical incident situations is an innovative approach for measuring reporting behavior, decisions made in hypothetical scenarios may not reflect decisions made in real situations (cf. [126]).
Due to the predominantly medium difficulty of the items, it may not have been possible to capture marginal areas in item expression (cf. [127]). The values for the discriminatory power of the items of the fear scale were mainly in a low range, which may be an indication of multidimensionality within this scale (cf. [75]). The internal consistency of the decision-making error reporting scale was only in a questionable range (cf. [75,89]). When construct validity was tested, the items of the just culture construct showed a factor loading with the scale of change goals; the factor loading of one item of the factor shame was <0.5 (cf. [75,100]). The practical relevance of the results might be limited by the fact that the estimation of effect sizes via R2-increase is positively biased (cf. [111]). Furthermore, using the Johnson–Neyman technique, the moderator effects were significant in two cases for only a certain range of values. The results found in the sensitivity analyses partly differed from results of the analysis of the complete data set. In addition, the guidelines for the use of thresholds are often not clearly defined, and it is up to the researcher which thresholds are chosen (cf. [100]). Basically, from a mathematical perspective, moderation is the only interaction between two variables; the distinction between predictor and moderator is permissible in the context of the study design, but ambiguous (cf. [105]). For example, Hypothesis 2c could also be interpreted in the sense that the magnitude of the positive relation between just culture and violation reporting is moderated by SCB.
Regarding limitations in the overall research design quality criteria, we want to explicitly point out to readers that the relatively low response rate of about 2% of the pilots invited to participate can be regarded as an important restriction to the external validity of the results (cf. [123]). Strictly speaking, the results only reflect the attitudes of a very small proportion of German commercial pilots. Moreover, it needs to be assumed that pilots who voluntarily complete a questionnaire which aims to “increase flight safety”, according to the email invitation of the Vereinigung Cockpit, are also more likely to voluntarily report an incident to increase flight safety than those who did not participate.
Furthermore, the results might be biased by response tendencies in terms of socially desirable response behavior of the participants. As we could not convince the European Cockpit Association to support the study, only German pilots received an invitation to participate in the study. Therefore, country-specific aspects could not be investigated, and the results can only be generalized to German pilots. As no individual token was used for participation in the web-based questionnaire, and the participation link could be forwarded without author control, the reliability of the procedure may be limited by multiple participations of the same person. An unconscious bias of the authors in the selection of the studied predictors and the determination to focus on interaction effects may result in aspects relevant to the description of reporting behavior not being considered. Moreover, the assumption of a precedence of SCB could be questioned as a prerequisite for causal inferences (cf. [100]).
Regardless of the limitations described, the strength of this study lies in its role as the consolidating, quantitative component of a method triangulation consisting of mixed methods (analysis of incident reports) and qualitative methods (expert interviews, publication in review) to answer the superordinate research question on explaining commercial pilots’ voluntary reporting behavior.

4.2. Implications for Research

This research was able to show that the different subtypes of reporting behavior can be explained by different factors, but further research is needed to explain these relationships. Self-efficacy is particularly related to change-oriented SCB [43]; in the context of our results, research could investigate the effects of self-efficacy on different subtypes of reporting behavior. Our study was only able to indicate weak signs of an effect of procrastination on reporting behavior. Further research could deepen this topic using the theory of “Theory of Planned Behavior” [71]. Moreover, research might also explore reporting behavior of violations in the context of the construct “Pro-social Rule Breaking” (cf. [128,129]). Moreover, it might seem reasonable to suggest that a work–safety tension which has been found to be a strong driver of violations [130] is also related to the reporting behavior of incidents caused by violations; further research might explore this relationship.
The age distribution of the participating pilots is unbalanced and shows a high proportion of pilots between 31 and 40 years of age. Given that this research did not investigate a possible difference in voluntary reporting behavior depending on age (presumably also reflecting seniority), we encourage future research to address this aspect. Research could review the generalization of our findings to non-German pilots or employees from other organizational contexts. To establish a holistic perspective on commercial airline incidents, further research could also address the reporting behavior of cabin crew members, technicians, and ground staff. The various direct effects shown in the exploratory evaluation may provide researchers with indications of different perspectives on reporting behavior. For example, further research could explore effects of a more diverse operationalization of just culture or investigate the non-expected effects of shame on reporting behavior.

4.3. Implications for Airlines

The results of this study provide indications on how voluntary reporting behavior can be improved at the organizational and individual levels. Airlines should encourage fundamental SCB of their pilots to improve reporting behavior indirectly. Reinforcement of change-oriented goals in reporting could involve feedback to pilots that LFI activities or EBT measures have been adjusted to meet pilots’ needs based on findings from incident reports. Airlines should bear in mind the beneficial effects of a just culture that is perceived positively by pilots and not “rest” on having written the principles into the internal organizational rules. Airlines could use a survey to collect data about pilots’ levels of their perception of just culture and personal goals when reporting to improve the airline’s assessment of pilots’ reporting behaviors; this could also support an increase in the accuracy of report-related safety performance indicators.
Reporting self-inflicted incidents encourages a pilot to admit their own errors or violations. If airlines live the principles of a just culture and pilots recognize the value of their incident reports, the seeds of the forest mentioned at the beginning can flourish, and incidents may be more effectively prevented in the future.

Author Contributions

Conceptualization, A.K. and S.S.; methodology, A.K. and S.S.; software, A.K. and S.S.; validation, A.K. and S.S.; formal analysis, S.S.; investigation, S.S.; resources, S.S.; data curation, S.S.; writing—original draft preparation, S.S.; writing—review and editing, A.K. and S.S.; visualization, S.S.; supervision, A.K.; project administration, S.S.; funding acquisition, S.S. Both authors have read and agreed to the published version of the manuscript.

Funding

This research received no external funding.

Institutional Review Board Statement

The study was conducted in accordance with the Declaration of Helsinki. The protocol of research project with identification code “RESEARCH SURVEY ON THE REPORTING BEHAVIOR OF PILOTS ON SELF-INFLICETED INCIDENTS” was approved by the Professional Association of Commercial Aircraft Pilots and Flight Engineers in Germany “Vereinigung Cockpit” (VC) on 19 September 2019.

Informed Consent Statement

Informed consent was obtained from all subjects involved in the study.

Data Availability Statement

The data presented in this study are available on request from the corresponding author. The data are not publicly available due to privacy policy of the participants.

Acknowledgments

The authors would like to thank the participating pilots for their contribution. Special thanks are given to the Professional Association of Commercial Aircraft Pilots and Flight Engineers in Germany “Vereinigung Cockpit” (VC) for their support and valuable suggestions. Further thanks go to Sebastian Brandhorst for his valuable advice.

Conflicts of Interest

The authors declare no conflict of interest.

Appendix A

Table A1. Descriptive items statistics.
ItemItem Parameters
MSDPiritα
PERF_ERROR_REPORT_013.51.455.620.82 a
PERF_ERROR_REPORT_023.41.368.59
PERF_ERROR_REPORT_034.01.252.74
PERF_ERROR_REPORT_042.41.157.35
PERF_ERROR_REPORT_052.01.265.26
PERF_ERROR_REPORT_062.21.256.29
DEC_ERROR_REPORT_012.21.154.310.69 a
DEC_ERROR_REPORT_022.61.353.40
DEC_ERROR_REPORT_034.11.244.76
DEC_ERROR_REPORT_043.51.340.63
VIOLATION_REPORT_013.41.361.610.81 a
VIOLATION_REPORT_024.21.175.80
VIOLATION_REPORT_034.61.061.89
SCB_013.31.374.570.88 a
SCB_023.71.280.68
SCB_033.61.376.65
FEAR_012.21.383.290.93 a
FEAR_021.71.283.18
FEAR_032.51.377.37
FEAR_042.01.272.24
FEAR_052.01.272.26
FEAR_061.81.272.19
FEAR_072.31.381.31
FEAR_082.11.274.27
CHANGE_GOALS_014.20.866.800.81 a
CHANGE_GOALS_023.71.164.66
CHANGE_GOALS_034.40.863.84
CHANGE_GOALS_044.60.770.89
PROCRASTINATION_013.11.375.510.84 a
PROCRASTINATION_023.01.377.50
PROCRASTINATION_033.21.462.56
PROCRASTINATION_042.61.260.40
SHAME_13.31.250.590.74 a
SHAME_23.71.163.66
SHAME_32.61.243.39
SHAME_43.11.255.51
PROTECTION_GOALS_013.01.372.500.83 b
PROTECTION_GOALS_023.31.372.57
JUST_CULTURE_014.41.079.840.89 a
JUST_CULTURE_024.11.185.77
JUST_CULTURE_033.81.273.69
Note. M = mean; SD = standard deviation; Pi = difficulty index; rit = item discrimination; α = internal consistency; SCB = safety citizenship behavior. a Cronbach’s α, b Spearman–Brown coefficient ρy1y2.

Appendix B

Table A2. Results of factor analysis.
ItemFactor
1234567
FEAR_010.801−0.1360.2250.0110.114−0.125−0.156
FEAR_020.827−0.0890.2090.0190.088−0.082−0.114
FEAR_030.686−0.2240.157−0.1850.317−0.101−0.190
FEAR_040.697−0.2480.098−0.1790.135−0.025−0.060
FEAR_050.701−0.0720.205−0.1530.0560.108−0.174
FEAR_060.7800.1510.007−0.0280.1360.150−0.078
FEAR_070.802−0.1460.063−0.1000.225−0.024−0.043
FEAR_080.785−0.0010.023−0.0050.073−0.081−0.091
CHANGE_GOALS_01−0.0620.677−0.1930.222−0.0670.1050.068
CHANGE_GOALS_02−0.0060.667−0.0270.154−0.1840.0480.090
CHANGE_GOALS_03−0.1570.678−0.1550.142−0.070−0.0320.135
CHANGE_GOALS_04−0.1600.730−0.1460.2230.011−0.0200.165
PROCASTINATION_010.218−0.0950.804−0.0710.047−0.024−0.027
PROCASTINATION_020.174−0.0940.840−0.110−0.0130.012−0.113
PROCASTINATION_030.055−0.1160.674−0.0340.159−0.085−0.119
PROCASTINATION_040.129−0.1980.578−0.226−0.028−0.092−0.049
SCB_01−0.0530.210−0.0870.737−0.110−0.0620.094
SCB_02−0.1230.219−0.1490.843−0.016−0.0340.170
SCB_03−0.1460.325−0.1720.757−0.0430.0340.018
SHAME_10.111−0.0450.002−0.0230.623−0.0060.034
SHAME_20.104−0.035−0.056−0.0480.7680.005−0.026
SHAME_30.264−0.0140.146−0.0360.4770.190−0.106
SHAME_40.210−0.2310.156−0.0490.621−0.1280.094
PROTECTION_GOALS_01−0.0020.033−0.092−0.027−0.0050.8650.059
PROTECTION_GOALS_02−0.0700.039−0.057−0.0210.0170.8100.015
JUST_CULTURE_01−0.4820.282−0.1250.1970.028−0.0180.641
JUST_CULTURE_02−0.4350.316−0.1570.2530.0160.0790.668
JUST_CULTURE_03−0.3380.281−0.3080.0980.0030.1150.592
Note. Principal axis analysis. Varimax rotation with Kaiser Normalization converged in six iterations. Factor 1 = fear, 2 = change goals, 3 = procrastination, 4 = safety citizenship behavior (SCB), 5 = shame, 6 = protection goals, 7 = just culture. Factor loadings > 0.30 in bold.

Appendix C

Table A3. Explorative non-moderated multiple regression results.
Performance-Based Error Reporting aDecision-Making Error Reporting aViolation Reporting a
95% CI 95% CI 95% CI
bSEβLLULtR2bSEβLLULtR2bSEβLLULtR2
Constant.38.32 −.241.011.21 .96.35 .271.632.76 ** 1.30.22 1.302.187.85 ***
−.37.41 1.17.43.91 .30.30 .20.891.01 1.59.23 1.142.046.99 ***
SCB b.36.05.44.25.476.62 ***.322.35.05.44.24.496.69 ***.255.27.05.31.17.475.34 ***.079
.43.05.54.33.528.52 ***.373.29.05.415.96.20.39 ***.281.27.05.35.18.365.90.107
Fear b
Shame b .15.06.15.03.272.46 *.020
.12.06.12.01.242.04.012.20.06.21.09.313.59 ***.043
Just Culture b.12.06.13.00.242.00*.028.19.06.22.08.303.28 **.026.45.06.48.34.568.23 ***.370
.27.06.32.16.384.80 ***.072.39.05.44.28.497.28 ***.319
Change Goals b.18.09.14.00.362.05 *.013
.26.08.21.10.413.24 **.031
Protection Goals b −.10.04−.14−.19−.01−2.28 *.018
.11.04.15.03.192.65 **.020
Procrastination b
R2.363.320.448
R2 1.437.395.426
F (df1, df2)37.59 *** (3, 198)23.13 *** (4, 197)80.89 *** (2, 199)
F 1 (df1, df2)36.46 *** (4, 188)39.88 *** (3, 183)69.12 *** (2, 186)
* p < 0.05. ** p < 0.01. *** p < 0.001. Note. b = coefficient; SE = standard error; β = standardized coefficient; CI = confidence interval; LL = lower limit; UL = upper limit; t = t-value; R2 = explained variance; SCB = safety citizenship behavior. a Outcome variable, b Predictor Variable. 1 Sensitivity analyses in italics.

References

  1. International Air Transport Association. Safety Report, 56th ed. 2019. Available online: https://www.iata.org/en/publications/safety-report/ (accessed on 1 February 2021).
  2. International Air Transport Association. I-ASC Whitepaper: Creating a Positive Safety Culture. Available online: https://www.iata.org/en/services/safety-flight-operations/i-asc/ (accessed on 1 February 2021).
  3. Hayes, J.; Maslen, S. Knowing stories that matter: Learning for effective safety decision-making. J. Risk Res. 2015, 18, 714–726. [Google Scholar] [CrossRef]
  4. Jiang, L.; Probst, T.M. The relationship between safety-production conflict and employee safety outcomes: Testing the impact of multiple organizational climates. Work. Stress 2015, 29, 171–189. [Google Scholar] [CrossRef]
  5. Wills, A.; Watson, B.; Biggs, H. Comparing safety climate factors as predictors of work-related driving behavior. J. Saf. Res. 2006, 37, 375–383. [Google Scholar] [CrossRef] [Green Version]
  6. Morrow, S.L.; McGonagle, A.K.; Dove-Steinkamp, M.L.; Walker, C.T.; Marmet, M.; Barnes-Farrell, J.L. Relationships between psychological safety climate facets and safety behavior in the rail industry: A dominance analysis. Accid. Anal. Prev. 2010, 42, 1460–1467. [Google Scholar] [CrossRef] [PubMed]
  7. McGonagle, A.K.; Walsh, B.M.; Kath, L.M.; Morrow, S.L. Civility norms, safety climate, and safety outcomes: A preliminary investigation. J. Occup. Health Psychol. 2014, 19, 437–452. [Google Scholar] [CrossRef]
  8. Weick, K.E.; Sutcliffe, K.M.; Obstfeld, D. Organizing for High Reliability: Processes of Collective Mindfulness. In Crisis Management; Boin, R.A., Ed.; SAGE Publications, Inc: Thousand Oaks, CA, USA, 2008; pp. 31–66. [Google Scholar]
  9. International Civil Aviation Organization. Requirements of Annex 13 ana SMS. Available online: https://www.icao.int/NACC/Documents/Meetings/2019/SMSANSP/SMSxANSP-P07.pdf (accessed on 1 February 2021).
  10. Drupsteen, L.; Guldenmund, F.W. What Is Learning? A Review of the Safety Literature to Define Learning from Incidents, Accidents and Disasters. J. Contingencies Crisis Manag. 2014, 22, 81–96. [Google Scholar] [CrossRef]
  11. Curcuruto, M.; Conchie, S.M.; Mariani, M.G.; Violante, F.S. The role of prosocial and proactive safety behaviors in predicting safety performance. Saf. Sci. 2015, 80, 317–323. [Google Scholar] [CrossRef]
  12. Brizon, A.; Wybo, J.L. The life cycle of weak signals related to safety. Int. J. Emerg. Manag. 2009, 6, 117–135. [Google Scholar] [CrossRef]
  13. Drupsteen, L.; Wybo, J.-L. Assessing propensity to learn from safety-related events. Saf. Sci. 2015, 71, 28–38. [Google Scholar] [CrossRef]
  14. Helmreich, R.L.; Klinect, J.R.; Wilhelm, J.A. (Eds.) System Safety and Threat and Error Management: The Line Operational Safety Audit (Losa); Eleventh International Symposium on Aviation Psychology: Ohio, OH, USA, 2017. [Google Scholar]
  15. International Air Transport Association. Evidence-Based Training Implementation Guide. Available online: https://www.iata.org/en/services/consulting/safety-operations/evidence-based-training/ (accessed on 1 February 2021).
  16. Drupsteen, L.; Hasle, P. Why do organizations not learn from incidents? Bottlenecks, causes and conditions for a failure to effectively learn. Accid. Anal. Prev. 2014, 72, 351–358. [Google Scholar] [CrossRef]
  17. Pariès, J.; Macchi, L.; Valot, C.; Deharvengt, S. Comparing HROs and RE in the light of safety management systems. Saf. Sci. 2019, 117, 501–511. [Google Scholar] [CrossRef]
  18. Reason, J.T. The Human Contribution: Unsafe Acts, Accidents and Heroic Recoveries; Ashgate: Aldershot, UK, 2008; ISBN 978-0-7546-7400-9. [Google Scholar]
  19. Rossignol, N.; Hommels, A. Meanings and practices of learning from incidents: A social constructivist perspective of incident reporting systems. Technol. Anal. Strateg. Manag. 2017, 29, 370–380. [Google Scholar] [CrossRef]
  20. Jausan, M.; Silva, J.; Sabatini, R. A holistic approach to evaluating the effect of safety barriers on the performance of safety reporting systems in aviation organisations. J. Air Transp. Manag. 2017, 63, 95–107. [Google Scholar] [CrossRef]
  21. Hasanspahić, N.; Frančić, V.; Vujičić, S.; Maglić, L. Reporting as a Key Element of an Effective Near-Miss Management System in Shipping. Safety 2020, 6, 53. [Google Scholar] [CrossRef]
  22. Archer, S.; Thibaut, B.I.; Dewa, L.H.; Ramtale, C.; D’Lima, D.; Simpson, A.; Murray, K.; Adam, S.; Darzi, A. Barriers and facilitators to incident reporting in mental healthcare settings: A qualitative study. J. Psychiatr. Ment. Health Nurs. 2020, 27, 211–223. [Google Scholar] [CrossRef]
  23. Maslen, S.; Hayes, J.; Wong, J.; Scott-Young, C. Witch hunts and scapegoats: An investigation into the impact of personal liability concerns on engineers’ reporting of risks. Environ. Syst. Decis. 2020, 40, 413–426. [Google Scholar] [CrossRef]
  24. Gilbey, A.; Tani, K.; Tsui, W.H.K. Outcome Knowledge and Under-reporting of Safety Concerns in Aviation. Appl. Cogn. Psychol. 2016, 30, 141–151. [Google Scholar] [CrossRef]
  25. Tani, K. Under-Reporting in Aviation: An Investigation of Factors That Affect Reporting of Safety Concerns: A Thesis Presented in Partial Fulfilment of the Requirements for the Degree of Doctorate of Philosophy in Aviation at Massey University, Manawatu, New Zealand; Massey University: Palmerston North, New Zeeland, 2010. [Google Scholar]
  26. Stemn, E.; Bofinger, C.; Cliff, D.; Hassall, M.E. Failure to learn from safety incidents: Status, challenges and opportunities. Saf. Sci. 2018, 101, 313–325. [Google Scholar] [CrossRef]
  27. European Parliament. REGULATION (EU) No 376/2014 of the European Parliament and of the Council of 3 April 2014 on the Reporting, Analysis and Follow-Up of Occurrences in Civil Aviation, Amending Regulation (EU) No 996/2010 of the European Parliament and of the Council and Repealing Directive 2003/42/EC of the European Parliament and of the Council and Commission Regulations (EC) No 1321/2007 and (EC) No 1330/2007. Off. J. Eur. Union 2014, L122, 18–43. [Google Scholar]
  28. Neuberger, O. Mikropolitik und Moral in Organisationen; UTB: Stuttgart, Germany, 2015. [Google Scholar]
  29. Griffin, M.A.; Curcuruto, M. Safety Climate in Organizations. Annu. Rev. Organ. Psychol. Organ. Behav. 2016, 3, 191–212. [Google Scholar] [CrossRef]
  30. Dekker, S. Just Culture: Restoring Trust and Accountability in Your Organization; CRC Press: Boca Raton, FL, USA, 2018. [Google Scholar]
  31. Reason, J.T. Managing the Risks of Organizational Accidents; Routledge: Abingdon, UK, 2016. [Google Scholar]
  32. Flin, R.; Mearns, K.; O’Connor, P.; Bryden, R. Measuring safety climate: Identifying the common features. Saf. Sci. 2000, 34, 177–192. [Google Scholar] [CrossRef]
  33. Zohar, D. Safety Climate: Conceptual and Measurement Issues. In Handbook of Occupational Health Psychology; Quick, J.C., Tetrick, L.E., Eds.; American Psychological Association: Worcester, MA, USA, 2011; pp. 141–164. [Google Scholar]
  34. Beus, J.M.; Jarrett, S.M.; Bergman, M.E.; Payne, S.C. Perceptual equivalence of psychological climates within groups: When agreement indices do not agree. J. Occup. Organ. Psychol. 2012, 85, 454–471. [Google Scholar] [CrossRef]
  35. González-Romá, V.; Peiró, J.M.; Tordera, N. An examination of the antecedents and moderator influences of climate strength. J. Appl. Psychol. 2002, 87, 465–473. [Google Scholar] [CrossRef] [PubMed] [Green Version]
  36. Christian, M.S.; Bradley, J.C.; Wallace, J.C.; Burke, M.J. Workplace safety: A meta-analysis of the roles of person and situation factors. J. Appl. Psychol. 2009, 94, 1103–1127. [Google Scholar] [CrossRef] [PubMed]
  37. Neal, A.; Griffin, M.A. A study of the lagged relationships among safety climate, safety motivation, safety behavior, and accidents at the individual and group levels. J. Appl. Psychol. 2006, 91, 946–953. [Google Scholar] [CrossRef] [PubMed] [Green Version]
  38. Zohar, D. Safety climate and beyond: A multi-level multi-climate framework. Saf. Sci. 2008, 46, 376–387. [Google Scholar] [CrossRef]
  39. Zohar, D.; Huang, Y.; Lee, J.; Robertson, M. A mediation model linking dispatcher leadership and work ownership with safety climate as predictors of truck driver safety performance. Accid. Anal. Prev. 2014, 62, 17–25. [Google Scholar] [CrossRef]
  40. Gyekye, S.A.; Salminen, S. Are good soldiers safety conscious? An examination of the relationship between organizational citizenship behaviors and perception of workplace safety. Soc. Behav. Personal. 2005, 33, 805–820. [Google Scholar] [CrossRef]
  41. Smith, C.A.; Organ, D.W.; Near, J.P. Organizational citizenship behavior: Its nature and antecedents. J. Appl. Psychol. 1983, 68, 653–663. [Google Scholar] [CrossRef]
  42. Conchie, S.M. Transformational leadership, intrinsic motivation, and trust: A moderated-mediated model of workplace safety. J. Occup. Health Psychol. 2013, 18, 198–210. [Google Scholar] [CrossRef] [PubMed]
  43. Curcuruto, M.; Griffin, M.A. Prosocial and proactive safety citizenship behaviour (SCB): The mediating role of affective commitment and psychological ownership. Saf. Sci. 2018, 104, 29–38. [Google Scholar] [CrossRef]
  44. Zohar, D.; Huang, Y.; Lee, J.; Robertson, M.M. Testing extrinsic and intrinsic motivation as explanatory variables for the safety climate–safety performance relationship among long-haul truck drivers. Transp. Res. Part F Traffic Psychol. Behav. 2015, 30, 84–96. [Google Scholar] [CrossRef]
  45. Morrison, K.; Phelps, C.C. Taking chage at work: Extrarole effords to initiate workplace change. Acad. Manag. J. 1999, 42, 403–419. [Google Scholar] [CrossRef]
  46. Wishart, D.; Rowland, B.; Somoray, K. Safety Citizenship Behavior: A Complementary Paradigm to Improving Safety Culture Within the Organizational Driving Setting. In Traffic Safety Culture; Ward, N.J., Watson, B., Fleming-Vogl, K., Eds.; Emerald Publishing Limited: Bingley, UK, 2019; pp. 145–171. ISBN 978-1-78714-618-1. [Google Scholar]
  47. Organ, D.W.; Podsakoff, P.M.; MacKenzie, S.B. Organizational Citizenship Behavior: Its Nature, Antecedents, and Consequences; SAGE Publications, Inc: Thousand Oaks, CA, USA, 2006; ISBN 9780761929963. [Google Scholar]
  48. Hofmann, D.A.; Morgeson, F.P.; Gerras, S.J. Climate as a moderator of the relationship between leader-member exchange and content specific citizenship: Safety climate as an exemplar. J. Appl. Psychol. 2003, 88, 170–178. [Google Scholar] [CrossRef] [PubMed] [Green Version]
  49. Neal, A.; Griffin, M.A.; Hart, P. The impact of organizational climate on safety climate and individual behavior. Saf. Sci. 2000, 34, 99–109. [Google Scholar] [CrossRef]
  50. Saracino, A.; Curcuruto, M.; Antonioni, G.; Mariani, M.G.; Guglielmi, D.; Spadoni, G. Proactivity-and-consequence-based safety incentive (PCBSI) developed with a fuzzy approach to reduce occupational accidents. Saf. Sci. 2015, 79, 175–183. [Google Scholar] [CrossRef]
  51. Sieberichs, S.; Kluge, A. Influencing Factors on Error Reporting in Aviation—A Scenario-Based Approach. In Advances in Human Aspects of Transportation; Stanton, N.A., Ed.; Springer International Publishing: Cham, Switzerland, 2018; pp. 3–14. ISBN 978-3-319-60440-4. [Google Scholar]
  52. Di Nardo, M.; Murino, T. The System Dynamics in the Human Reliability Analysis Through Cognitive Reliability and Error Analysis Method: A Case Study of an LPG Company. IRECE 2021, 12, 56. [Google Scholar] [CrossRef]
  53. Leveson, N. A new accident model for engineering safer systems. Saf. Sci. 2004, 42, 237–270. [Google Scholar] [CrossRef] [Green Version]
  54. Di Nardo, M.; Madonna, M.; Santillo, L.C. Safety Management System: A System Dynamics Approach to Manage Risks in a Process Plant. IREMOS 2016, 9, 256. [Google Scholar] [CrossRef]
  55. Di Nardo, M.; Madonna, M.; Murino, T.; Castagna, F. Modelling a Safety Management System Using System Dynamics at the Bhopal Incident. Appl. Sci. 2020, 10, 903. [Google Scholar] [CrossRef] [Green Version]
  56. Salmon, P.M.; Cornelissen, M.; Trotter, M.J. Systems-based accident analysis methods: A comparison of Accimap, HFACS, and STAMP. Saf. Sci. 2012, 50, 1158–1170. [Google Scholar] [CrossRef]
  57. Reason, J.T. The contribution of latent human failures to the breakdown of complex systems. Biol. Sci. 1990, 327, 484–485. [Google Scholar]
  58. Wiegmann, D.A.; Shappell, S.A. A Human Error Approach to Aviation Accident Analysis: The Human Factors Analysis and Classification System; Routledge: Abingdon, UK, 2017. [Google Scholar]
  59. Miranda, A.T. Using Conditional Probabilities to Understand “Human Error” in Military Aviation Mishaps. Proc. Hum. Factors Ergon. Soc. Annu. Meet. 2017, 61, 1619–1620. [Google Scholar] [CrossRef]
  60. Miranda, A.T. Understanding Human Error in Naval Aviation Mishaps. Hum. Factors J. Hum. Factors Ergon. Soc. 2018, 60, 763–777. [Google Scholar] [CrossRef]
  61. Air Force Safety Center. Department of Defense Human Factors Analysis and Classification System (dod hfacs) Version (7.0). Available online: https://www.safety.af.mil/Divisions/Human-Factors-Division/HFACS/ (accessed on 1 February 2021).
  62. Sieberichs, S.; Kluge, A. Why Learning Opportunities from Aviation Incidents Are Lacking: The Impact of Active and Latent Failures and Confidential Reporting. Aviat. Psychol. Appl. Hum. Factors 2021, 11, 33–47. [Google Scholar] [CrossRef]
  63. Brenner, P.S.; DeLamater, J. Lies, Damned Lies, and Survey Self-Reports? Identity as a Cause of Measurement Bias. Soc. Psychol. Q. 2016, 79, 333–354. [Google Scholar] [CrossRef] [PubMed] [Green Version]
  64. Van den Broeck, A.; Carpini, J.A.; Diefendorff, J.M. Work Motivation. In The Oxford Handbook of Human Motivation; Ryan, R.M., van den Broeck, A., Carpini, J.A., Diefendorff, J.M., Eds.; Oxford University Press: Oxford, UK, 2019; pp. 506–524. ISBN 9780190666453. [Google Scholar]
  65. Ridley, C.H.; Al-Hammadi, N.; Maniar, H.S.; Ben Abdallah, A.; Steinberg, A.; Bollini, M.L.; Patterson, G.A.; Henn, M.C.; Moon, M.R.; Dahl, A.B.; et al. Building a Collaborative Culture: Focus on Psychological Safety and Error Reporting. Ann. Thorac. Surg. 2021, 111, 683–689. [Google Scholar] [CrossRef]
  66. Yang, R.; Pepper, G.A.; Wang, H.; Liu, T.; Wu, D.; Jiang, Y. The mediating role of power distance and face-saving on nurses’ fear of medication error reporting: A cross-sectional survey. Int. J. Nurs. Stud. 2020, 105, 103494. [Google Scholar] [CrossRef]
  67. Haslbeck, A.; Schubert, E.; Schmidt-Moll, C. (Eds.) Pilot’s Willingness to Report Aviation Incidents. In Proceedings of the 18th International Symposium on Aviation Psychology, Dayton, OH, USA, 4–7 May 2015. [Google Scholar]
  68. Probst, T.M.; Estrada, A.X. Accident under-reporting among employees: Testing the moderating influence of psychological safety climate and supervisor enforcement of safety practices. Accid. Anal. Prev. 2010, 42, 1438–1444. [Google Scholar] [CrossRef]
  69. Zabari, M.L.; Southern, N.L. Effects of Shame and Guilt on Error Reporting Among Obstetric Clinicians. J. Obstet. Gynecol. Neonatal Nurs. 2018, 47, 468–478. [Google Scholar] [CrossRef] [Green Version]
  70. Hedlund, A.; Åteg, M.; Andersson, I.-M.; Rosén, G. Assessing motivation for work environment improvements: Internal consistency, reliability and factorial structure. J. Saf. Res. 2010, 41, 145–151. [Google Scholar] [CrossRef] [PubMed]
  71. Fogarty, G.J.; Shaw, A. Safety climate and the Theory of Planned Behavior: Towards the prediction of unsafe behavior. Accid. Anal. Prev. 2010, 42, 1455–1459. [Google Scholar] [CrossRef] [Green Version]
  72. Klingsieck, K.B. Procrastination. Eur. Psychol. 2013, 18, 24–34. [Google Scholar] [CrossRef]
  73. Haycock, L.A.; McCarthy, P.; Sky, C.L. Procrastination in college students: The role of self-efficacy and anxiety. J. Couns. Dev. 1998, 76, 317–324. [Google Scholar] [CrossRef]
  74. Cohen, J. Applied Multiple Regression, Correlation Analysis for the Behavioral Sciences, 3rd ed.; Erlbaum: Mahwah, NJ, USA, 2003; ISBN 0-8058-2223-2. [Google Scholar]
  75. Moosbrugger, H.; Kelava, A. (Eds.) Testtheorie und Fragebogenkonstruktion, 3rd ed.; Springer: Berlin/Heidelberg, Germany, 2020. [Google Scholar]
  76. Reips, U.-D. Web-Based Methods. In Handbook of Multimethod Measurement in Psychology; Eid, M., Diener, E., Eds.; American Psychological Association: Washington, DC, USA, 2006; pp. 73–85. ISBN 1-59147-318-7. [Google Scholar]
  77. Klinck, D. Computerisierte Methoden. Handbuch der Psychologischen Diagnostik. In Handbuch der Psychologischen Diagnostik; Petermann, F., Eid, M., Eds.; Hogrefe: Göttingen, Germany, 2006; pp. 226–233. [Google Scholar]
  78. American Psychological Association. Quantitative Design Reporting Standards (JARS-Quant). Available online: https://apastyle.apa.org/jars/quant-table-1.pdf (accessed on 1 February 2021).
  79. Faul, F.; Erdfelder, E.; Buchner, A.; Lang, A.-G. Statistical power analyses using G*Power 3.1: Tests for correlation and regression analyses. Behav. Res. Methods 2009, 41, 1149–1160. [Google Scholar] [CrossRef] [PubMed] [Green Version]
  80. Fritz, M.S.; Arthur, A.M. Moderator Variables. In Oxford Research Encyclopedia of Psychology; Fritz, M.S., Arthur, A.M., Eds.; Oxford University Press: Oxford, UK, 2017; ISBN 9780190236557. [Google Scholar]
  81. Wang, D.; Wang, X.; Griffin, M.A.; Wang, Z. Safety stressors, safety-specific trust, and safety citizenship behavior: A contingency perspective. Accid. Anal. Prev. 2020, 142, 105572. [Google Scholar] [CrossRef]
  82. Zohar, D.; Luria, G. Climate as a Social-Cognitive Construction of Supervisory Safety Practices: Scripts as Proxy of Behavior Patterns. J. Appl. Psychol. 2004, 89, 322–333. [Google Scholar] [CrossRef]
  83. Porst, R. Fragebogen: Ein Arbeitsbuch; Springer: Wiesbaden, Germany, 2013. [Google Scholar]
  84. Weijters, B.; Cabooter, E.; Schillewaert, N. The effect of rating scale format on response styles: The number of response categories and response category labels. Int. J. Res. Mark. 2010, 27, 236–247. [Google Scholar] [CrossRef]
  85. Dawes, J. Do Data Characteristics Change According to the Number of Scale Points Used? An Experiment Using 5-Point, 7-Point and 10-Point Scales. Int. J. Mark. Res. 2008, 50, 61–104. [Google Scholar] [CrossRef]
  86. Jonkisz, E.; Moosbrugger, H.; Brandt, H. Planung und Entwicklung von Tests und Fragebogen. In Testtheorie und Fragebogenkonstruktion; Moosbrugger, H., Kelava, A., Eds.; Springer: Berlin/Heidelberg, Germany, 2012; pp. 27–74. ISBN 978-3-642-20071-7. [Google Scholar]
  87. Borg, I.; Shye, S. Facet Theory: Form and Content (Advanced Quantitative Techniques in the Social Sciences); SAGE Publications, Inc: Thousand Oaks, CA, USA, 1995. [Google Scholar]
  88. Elson, M. Question Wording and Item Formulation. In The International Encyclopedia of Communication Research Methods; Matthes, J., Davis, C.S., Potter, R.F., Eds.; Wiley: Hoboken, NJ, USA, 2017; pp. 1–8. ISBN 9781118901762. [Google Scholar]
  89. Blanz, M. Forschungsmethoden und Statistik für die Soziale Arbeit: Grundlagen und Anwendungen, 1. Aufl.; Kohlhammer: Stuttgart, Germany, 2015; ISBN 3-17-025835-4. [Google Scholar]
  90. Wirtz, M.A. Dorsch—Lexikon der Psychologie, 19th ed.; Hogrefe: Bern, Siwtzerland, 2020; ISBN 978-3-456-85914-9. [Google Scholar]
  91. Schneider, B.; Barbera, K.M. (Eds.) The Oxford Handbook of Organizational Climate and Culture; Oxford University Press: Oxford, UK, 2014; ISBN 9780199860715. [Google Scholar]
  92. Eisinga, R.; Grotenhuis, M.T.; Pelzer, B. The reliability of a two-item scale: Pearson, Cronbach, or Spearman-Brown? Int. J. Public Health 2013, 58, 637–642. [Google Scholar] [CrossRef]
  93. Ethics Committee of the American Psychological Association. Rules and Procedures. Available online: https://www.apa.org/ethics/committee-rules-procedures-2018.pdf (accessed on 1 February 2021).
  94. Soper, D.S. A-priori Sample Size Calculator for Structural Equation Models. Available online: www.danielsoper.com/statcalc (accessed on 28 October 2020).
  95. Westland, J.C. Lower bounds on sample size in structural equation modeling. Electron. Commer. Res. Appl. 2010, 9, 476–487. [Google Scholar] [CrossRef]
  96. Jaccard, J.; Wan, C.K. Lisrel Approaches to Interaction Effects in Multiple Regression; Sage: Thousand Oaks, CA, USA, 1996; ISBN 0-8039-7179-6. [Google Scholar]
  97. Lodder, P.; Denollet, J.; Emons, W.H.M.; Nefs, G.; Pouwer, F.; Speight, J.; Wicherts, J.M. Modeling Interactions Between Latent Variables in Research on Type D Personality: A Monte Carlo Simulation and Clinical Study of Depression and Anxiety. Multivar. Behav. Res. 2019, 54, 637–665. [Google Scholar] [CrossRef] [Green Version]
  98. Moosbrugger, H.; Schermelleh-Engel, K.; Klein, A. Methodological problems of estimating latent interaction effects. Methods Psychol. Res. 1997, 2, 95–111. [Google Scholar]
  99. Cleveland, W.S.; Devlin, S.J. Locally Weighted Regression: An Approach to Regression Analysis by Local Fitting. J. Am. Stat. Assoc. 1988, 83, 596–610. [Google Scholar] [CrossRef]
  100. Eid, M.; Gollwitzer, M.; Schmitt, M. Statistik und Forschungsmethoden: Mit Online-Materialien, 4th ed.; Beltz: Weinheim, Germany, 2015; ISBN 978-3-621-28248-2. [Google Scholar]
  101. Field, A. Discovering Statistics Using IBM SPSS Statistics: And Sex and Drugs and Rock ’n’ Roll, 4th ed.; Sage: Los Angeles, CA, USA, 2013; ISBN 978-1-4462-4918-5. [Google Scholar]
  102. Dempster, A.P.; Laird, N.M.; Rubin, D. Maximum Likelihood from Incomplete Data via the EM Algorithm. J. R. Stat. Soc. 1977, 39, 1–38. [Google Scholar] [CrossRef]
  103. Graham, J.W. Missing Data Analysis: Making It Work in the Real World. Annu. Rev. Psychol. 2009, 60, 549–576. [Google Scholar] [CrossRef] [Green Version]
  104. Schafer, J.L. Multiple imputation: A primer. Stat. Methods Med Res. 1999, 8, 3–15. [Google Scholar] [CrossRef]
  105. Hayes, A.F. Introduction to Mediation, Moderation, and Conditional Process Analysis: A Regression-Based Approach, 2nd ed.; Guilford Publications: New York, NY, USA, 2017; ISBN 978-1-60918-230-4. [Google Scholar]
  106. Jose, P.E. Doing Statistical Mediation and Moderation; The Guilford Press: New York, NY, USA, 2013. [Google Scholar]
  107. Hayes, A.F.; Cai, L. Using heteroskedasticity-consistent standard error estimators in OLS regression: An introduction and software implementation. Behav. Res. Methods 2007, 39, 709–722. [Google Scholar] [CrossRef] [Green Version]
  108. Davidson, R.; MacKinnon, J.G. Estimation and Inference in Econometrics; Oxford University Press: New York, NY, USA, 1993; ISBN 0-19-506011-3. [Google Scholar]
  109. Hayes, A.F.; Matthes, J. Computational procedures for probing interactions in OLS and logistic regression: SPSS and SAS implementations. Behav. Res. Methods 2009, 41, 924–936. [Google Scholar] [CrossRef] [Green Version]
  110. Chatterjee, S.; Hadi, A.S. Sensitivity Analysis in Linear Regression; Wiley: Hoboken, NJ, USA, 2009. [Google Scholar]
  111. Jaccard, J.; Turrisi, R. Interaction Effects in Multiple Regression, 2nd ed.; SAGE Publications, Inc: Thousand Oaks, CA, USA, 2003. [Google Scholar]
  112. Aiken, L.S.; West, S.G. Multiple Regression: Testing and Interpreting Interactions; Sage: Newbury Park, CA, USA, 1991. [Google Scholar]
  113. Cohen, J. Statistical Power Analysis for the Behavioral Sciences; Routledge: Abingdon, UK, 2013. [Google Scholar]
  114. Tracy, S.J.; Hinrichs, M.M. Big Tent Criteria for Qualitative Quality. In The International Encyclopedia of Communication Research Methods; Matthes, J., Davis, C.S., Potter, R.F., Eds.; Wiley: Hoboken, NJ, USA, 2017; pp. 1–10. ISBN 9781118901762. [Google Scholar]
  115. McMurtrie, K.J.; Molesworth, B.R.C. Australian Flight Crews’ Trust in Voluntary Reporting Systems and Just Culture Policies. Aviat. Psychol. Appl. Hum. Factors 2018, 8, 11–21. [Google Scholar] [CrossRef]
  116. Pransky, G.; Snyder, T.; Dembe, A.; Himmelstein, J. Under-reporting of work-related disorders in the workplace: A case study and review of the literature. Ergonomics 1999, 42, 171–182. [Google Scholar] [CrossRef]
  117. Vincent, C.; Stanhope, N.; Crowley-Murphy, M. Reasons for not reporting adverse incidents: An empirical study. J. Eval. Clin. Pract. 1999, 5, 13–21. [Google Scholar] [CrossRef]
  118. Maslen, S.; Hayes, J. This is How we Debate: Engineers’ Use of Stories to Reason through Disaster Causation. Qual. Sociol. 2020, 43, 191–212. [Google Scholar] [CrossRef]
  119. Sitzmann, T.; Yeo, G. A Meta-Analytic Investigation of the Within-Person Self-Efficacy Domain: Is Self-Efficacy a Product of Past Performance or a Driver of Future Performance? Pers. Psychol. 2013, 66, 531–568. [Google Scholar] [CrossRef]
  120. Nergård, V.; Hatlevik, O.E.; Martinussen, M.; Lervåg, A. An Airman’s Personal Attitude: Pilots’ Point of View. Aviation 2012, 15, 101–111. [Google Scholar] [CrossRef] [Green Version]
  121. Orasanu, J.M. Flight Crew Decision- Making. In Crew Resource Management; Kanki, B.G., Helmreich, R.L., Anca, J., Eds.; Academic Press: Cambridge, MA, USA, 2010; pp. 147–180. [Google Scholar]
  122. van Eerde, W.; Thierry, H. Vroom’s expectancy models and work-related criteria: A meta-analysis. J. Appl. Psychol. 1996, 81, 575–586. [Google Scholar] [CrossRef]
  123. Krebs, D.; Menold, N. Gütekriterien Quantitativer Sozialforschung. In Handbuch Methoden der Empirischen Sozialforschung; Baur, N., Blasius, J., Eds.; Springer Fachmedien Wiesbaden: Wiesbaden, Germany, 2019; pp. 489–504. ISBN 978-3-658-21307-7. [Google Scholar]
  124. Maeda, H. Response option configuration of online administered Likert scales. Int. J. Soc. Res. Methodol. 2015, 18, 15–26. [Google Scholar] [CrossRef]
  125. Scheer, D.; Ulbig, E. Kommunikation von Risiko und Gefährdungspotenzial aus Sicht verschiedener Stakeholder; Bundesinstitut für Risikobewertung: Berlin, Germany, 2010; ISBN 3-938163-56-9. [Google Scholar]
  126. FeldmanHall, O.; Mobbs, D.; Evans, D.; Hiscox, L.; Navrady, L.; Dalgleish, T. What we say and what we do: The relationship between real and hypothetical moral choices. Cognition 2012, 123, 434–441. [Google Scholar] [CrossRef] [PubMed] [Green Version]
  127. Schmidt-Atzert, L.; Amelang, M. Psychologische Diagnostik; Springer: Berlin/Heidelberg, Germany, 2012. [Google Scholar]
  128. Dahling, J.J.; Chau, S.L.; Mayer, J.M.; Gregory, J.B. Breaking rules for the right reasons? An investigation of pro-social rule breaking. J. Organ. Behav. 2010, 33, 21–42. [Google Scholar] [CrossRef] [Green Version]
  129. Kluge, A. Arbeits und Organisationspsychologie; Kohlhammer: Stuttgart, Germany, 2021; ISBN 978-3-17-026044-3. [Google Scholar]
  130. Brandhorst, S.; Kluge, A. When the Tension Is Rising: A Simulation-Based Study on the Effects of Safety Incentive Programs and Behavior-Based Safety Management. Safety 2021, 7, 9. [Google Scholar] [CrossRef]
Figure 1. Subordinate categories of pilots’ unsafe acts according to DoD-HFACS 7.0.
Safety 07 00059 g001
Figure 2. Own illustration of the research agenda for overview purposes only. a Individual and environmental factors = fear, shame, just culture, change goals, protection goals, and procrastination.
Safety 07 00059 g002
Figure 3. Age distribution (absolute numbers) of participants within five age groups.
Safety 07 00059 g003
Figure 4. Regression slopes for SCB predicting reporting behaviors.
Safety 07 00059 g004
Figure 5. Moderation effect slopes for mean and ±1 SD values: (a) effect of SCB on violation reporting moderated by just culture; (b) effect of SCB on decision-making error reporting moderated by change goals; (c) effect of SCB on violation reporting moderated by change goals; (d) effect of SCB on performance-based error reporting moderated by protection goals.
Safety 07 00059 g005
Publisher’s Note: MDPI stays neutral with regard to jurisdictional claims in published maps and institutional affiliations.

