
Evaluation and Analysis of Whole-Body Vibration Exposure during Soil Tillage Operation

1
Department of System Design Engineering, University of Waterloo, Waterloo, ON N2L 3G1, Canada
2
Department of Mechanical Engineering, Guru Nanak Dev Engineering College, Ludhiana 141006, India
3
Department of Trenchless Technology Center, Louisiana Tech University, Ruston, LA 71272, USA
4
Department of Industrial and Production Engineering, National Institute of Technology, Jalandhar 144011, India
*
Author to whom correspondence should be addressed.
Safety 2021, 7(3), 61; https://0-doi-org.brum.beds.ac.uk/10.3390/safety7030061
Submission received: 20 July 2021
/
Revised: 17 August 2021
/
Accepted: 26 August 2021
/
Published: 30 August 2021
Abstract
:This study investigated whole-body vibration (WBV) response in real field harrowing operations at different tractor ride conditions i.e., average speed, front harrow pin angle (FHPA), and rear harrow pin distance (RHPD). Taguchi’s L27 orthogonal array was used to formulate a systematic design of experiments. WBV exposure was measured along the three translational axes to compute overall daily vibration magnitude i.e., A(8). Tractor’s seat isolation capacity was assessed in terms of Seat Effective Amplitude Transmissibility i.e., SEAT%. Raw acceleration data was analysed to obtain dominant frequencies using Fast Fourier Transform (FFT). A(8) was found to range between 0.43 to 0.87 m/s2 in the experimental trials. Seat isolation capacity was found to be poor in 89% of the experiments i.e., SEAT% > 100%. Average speed and FHPA was found to have a significant impact (p ≤ 0.05) on A(8) and SEAT%. FFT response showed a range of primary and secondary dominant peaks within a frequency range of 0.2 to 11 Hz. In conclusion, the majority of experimental trials (67%) exceeded the Directive2002/44EU recommended exposure action value (EAV) limit i.e., 0.5 m/s2. The harrowing operation was found to exhibit vibration exposure at low frequencies in the vicinity of natural frequencies of the human body and may consequently affect ride comfort.
1. Introduction
Tillage is an essential agricultural activity carried out to develop optimum soil for the sowing process. Every agricultural field passes through various primary and secondary soil tillage operations, depending on the type of harvested crop. The post-harvested fields turn out considerably hard due to the presence of clods and deep cracks, thereby making it challenging to carry out tillage activity. The ever-increasing population has raised pressure on farmers to fulfil the productivity demand. This has led farmers to use mechanized machinery aimed at decreasing the window period between two successive crops. The harrowing operation facilitates a shorter time span for the farmers in carrying out tillage on the post-harvested agricultural fields. The harrow contains several discs, which is tractor-mounted and trailed after the tractor by the drawbar system. This operation is performed by a series of rotating discs mounted on a single shaft. The discs exhibit a motion acting as a cutting tool to cultivate the hard soil. The entire operation requires the manual involvement of a tractor driver to operate the mounted machinery. However, the tractor, along with uneven field interaction, emits vibrations that transmit into the driver’s body through various contact locations i.e., tractor seat, chassis, gear lever, drat and position levers paddles, steering wheel, etc. [1,2]. It has been reported that tractor drivers are usually exposed to whole body vibration (WBV) beyond the Directive 2002/44/EU recommended exposure action value limit (EAV) i.e., 0.5 m/s2 [3]. In addition, prolonged exposure to such vibration may affect the occupational ride comfort [4]. This may be due to vibration transmission into the body at high acceleration amplitudes with frequencies near the vicinity of the human body [5,6]. This may cause various health issues related to the musculoskeletal system, mainly low back pain due to significant association between both vibration and low back pain issues among occupational drivers [7,8].
Most of the past research studies have investigated WBV exposure levels using simulators with controlled parametric conditions [9,10]. The parameters, mainly vibration amplitude [9], frequency [10], sitting postural condition [11], and seat backrest inclination [12], were studied at various levels to investigate the WBV response among the exposed body. It has been observed that limited investigations have studied WBV exposure in actual tractor-driving conditions [3,13]. In addition, these studies have primarily focused on on-road driving conditions [14], whereas only a few studies have examined off-road terrain conditions, such as tractor driving [3,7,15,16]. Most of these studies investigated WBV levels focusing only on tractors without any mounted tillage implements [7,16]. Only a few investigations have evaluated WBV levels and studied ride comfort behavior during real field soil tillage operation [3,15,17,18]. Furthermore, the vibration amplitude may either get damped or amplified, depending on the seat isolation capacity. This can be studied by computing seat effective amplitude transmissibility i.e., SEAT% response [19].
Harrowing is among commonly used secondary soil tillage operations in India. Usually, the post-harvested field goes through a harrowing operation, followed by other tillage operations performed using a rotavator, cultivator, and leveller. The harrowing operation may exhibit high amplitude WBV levels due to hard and uneven terrain conditions. These vibrations when transmitted through the various machine parts may enter the driver’s body and lead to musculoskeletal disorders. Therefore, the present study was carried out to fill the gap in the existing literature by investigating the WBV exposure levels and seat effective amplitude transmissibility in actual field harrowing operations. The impact of tractor ride parameters i.e., average speed, front harrow pin angle (FHPA), and rear harrow pin distance (RHPA) are systematically studied. It has been hypothesized that the variation ride parameters will significantly and positively affect daily exposure i.e., A(8) and SEAT%.
The present study is a step up in investigating the relative impact tractor ride parameters on the WBV exposure and seat isolation capacity during real field harrowing operations. It will provide better insight into the various dominant frequencies affecting tractor ride behaviour. The outcomes may be utilized by tractor designers and manufacturers with the aim to improve their rides and human comfort.
2. Material and Methods
The various methodological steps of the present study are as follows:
2.1. Tractor Driver
A single tractor driver participated in the study—aged 24 years, weighing 81 kg, of 1.54 m stature, and 34.15 kg/m2 body mass index (BMI). The driver belonged to a farming background with a minimum of six years of experience in tractor driving. The purpose of the study was made clear to the driver before the experimentation. The participant did not report any sensitivity or health issue towards vibration exposure. He gave his informed consent and inclusion before participation in the study. The study was conducted in accordance with the Declaration of Helsinki, and the protocol was approved by the Ethics Committee of Guru Nanak Dev Engineering College, Ludhiana (GNDEC/ME/113).
2.2. Test Field and Machinery
The present study used a post-harvested paddy agricultural field with dimensions of 162 × 85 m at Punjab Agricultural University, Ludhiana (India). This field was hard due to the presence of deep cracks and stubbles. Soil samples were collected from different field locations to test the soil texture, moisture, and compactness. The soil texture was found to be sandy clay loam with 69% sand, 23.6% clay, and 7.4% silt. Soil moisture was tested and ranged between 52.9% to 58.5% by weight. Soil compactness was tested at three varying depth levels i.e., 0–0.05 m; 0.05–0.10 m; and 0.10–0.15 m and found to be 14 kPa; 20 kPa; and 28 kPa, respectively. Apart from the paddy field, a 2-wheel drive Farmtrac 65 EPI tractor, a 2015 model with 55 hp (i.e., 32.25 kW), was used to conduct the experiment in the present study. The selected tractor was equipped with the original manufacturer’s seat. Prior to the experiments, the existing tires of the tractor were replaced with newer ones; thus, there was no wear and tear, and inflation pressure was maintained as per tractor catalogue recommendation. The tractor was mounted to an 8 × 8 disc harrow system, as shown in Figure 1.
In Figure 1, the tillage implement must be mounted with the tractor drawbar using the drawbar linkage point, as marked in the extreme front. This system has three holes in the front just at the starting location of the discs and 10 holes at the rear location. These holes have been operated manually by inserting a pin at the desired hole point to set the cutting width area of the discs. The front hole(s) pins were denoted by ‘FHPA’ and operated at standard angle settings i.e., 1.4, 1.6, and 1.8 radians, whereas the rear hole(s) and pin were denoted by ‘RHPD’ operated at a standard distance with respect to the drawbar point i.e., 2.2, 2.3, and 2.4 m. The total weight and width of the disc harrow system was 384 kg and 60 inches. In addition, the maximum working depth of the harrow was up to 18 cm.
2.3. Design of the Experiment
The present study used the Taguchi L27 orthogonal array to formulate a systemic set of experimental trials. This method required a set of input parameters (i.e., ride conditions) to be varied at defined levels, as shown in Table 1.
The orthogonal array was given input levels with respect to the three ride conditions, and it provided a total of 27 experimental trials. Each trial was replicated thrice to obtain the mean outcome response. The vibration data loggers were set to account for readings after an interval of 3–4 s during each trial. Here, the output parameters were A(8) and SEAT%, whereas A(8) refers to average exposure over an eight-hour per day, taking into account the magnitude of the vibration and how long you are exposed to it. On the other hand, SEAT% can be determined by taking the ratio of vibration response at two locations, simultaneously. Both the output parameters were analyzed in terms of signal-to-noise (S/N) ratios [20]. The S/N ratios were computed using the standard equation, aiming at minimizing the output response [21].
2.4. Instrumentation
A(8) and SEAT% response require sensors to be mounted at two difference locations i.e., at seat pan and on the floor near to the seat-base in order to obtain raw acceleration data values along the three translational axes (i.e., x-longitudinal axis, y-lateral axis, and z-vertical axis). These data values are further used to evaluate both the output parameters. In this study, an SV 38 V triaxial seat pad accelerometer was mounted at the ischial position on seat pan location, as recommended by ISO 2631-1 [4] and it was connected to an SV 106 A 6-channel human vibration monitor. Similarly, an SV 151 triaxial accelerometer was mounted at the tractor floor and connected to the SV 958 A 4-channel vibration monitor. Both the mounted sensors had a sampling rate of 6 kHz and maximum measurement error of ±0.02 m/s2. Each experimental trial was set to record vibration data for a one-minute duration. In addition, a low-pass (band limit) filter was used to obtain vibration data with minimum noise effect.
2.5. Data Analysis
The design of the experiment was performed using Minitab 17.0 statistical package to obtain S/N ratios and analysis of variance (ANOVA) response. SVAN PC++ software was used to analyse the raw acceleration response along the translational axis to obtain a weighted r.m.s. response. The raw data was further converted into .txt files and imported into MATLAB to obtain time-acceleration and Fast Fourier Transform (FFT) response.
3. Result and Discussion
The subsequent sections include whole body vibration response with respect to the three translational axes—signal-to-noise ratio analysis, relative impact of ride conditions on the outcome response, and statistical analysis and Fast Fourier Transform response.
3.1. WBV Exposure Levels
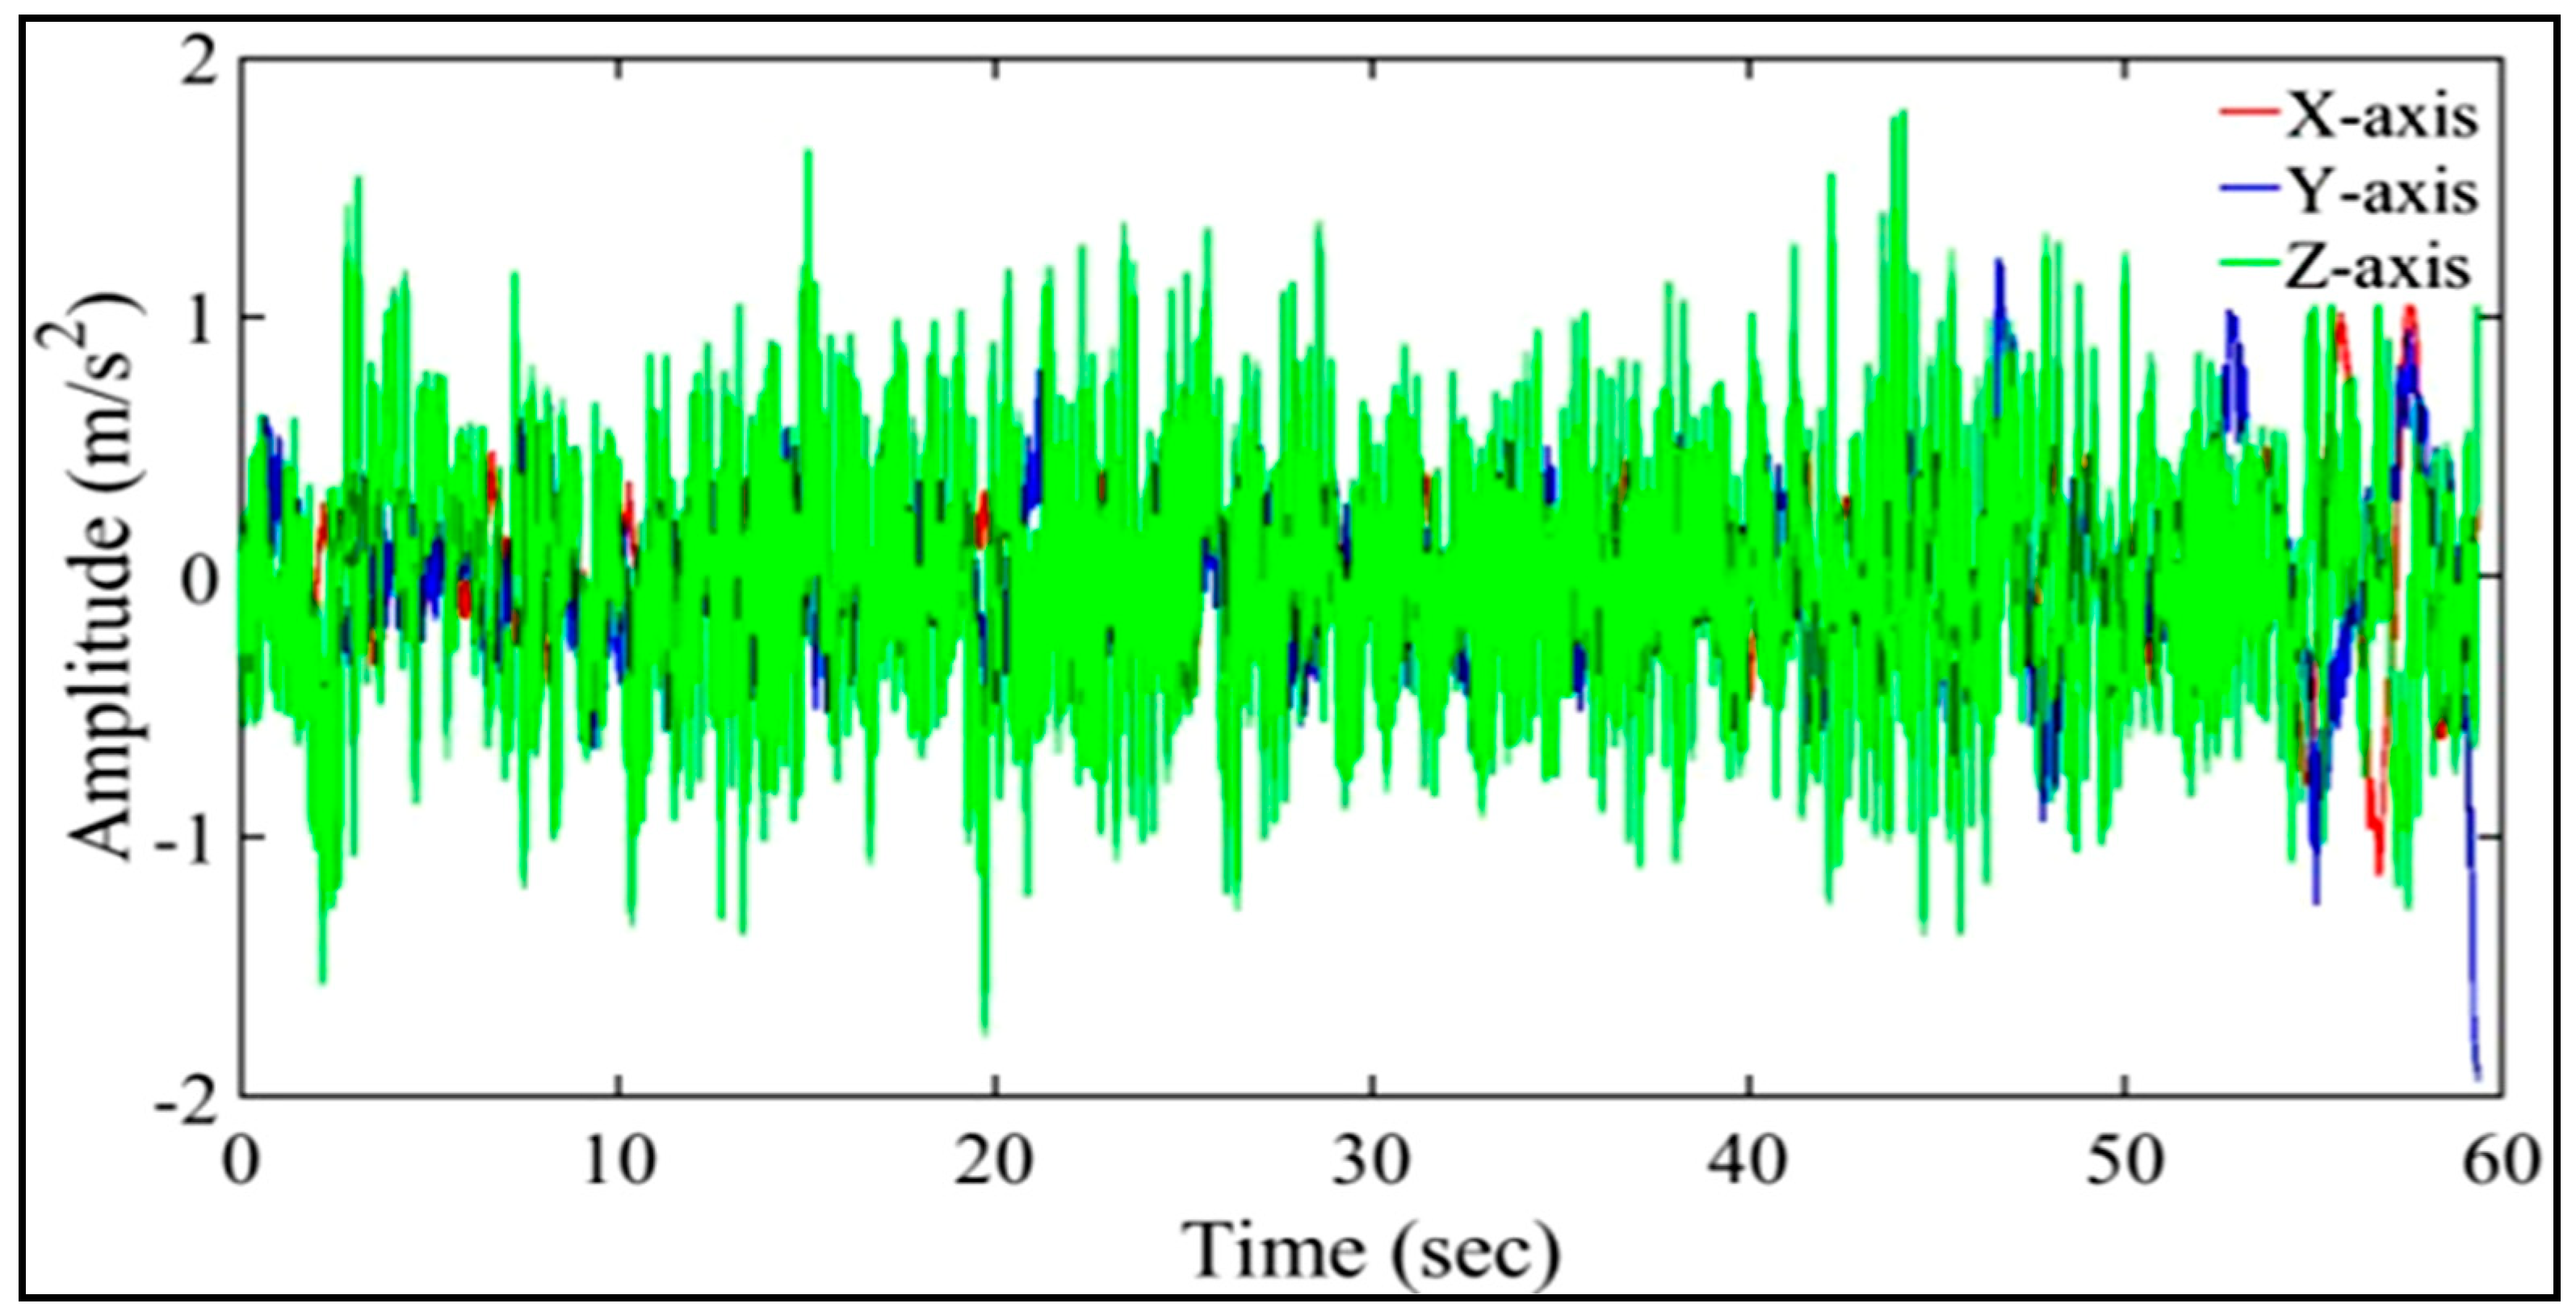
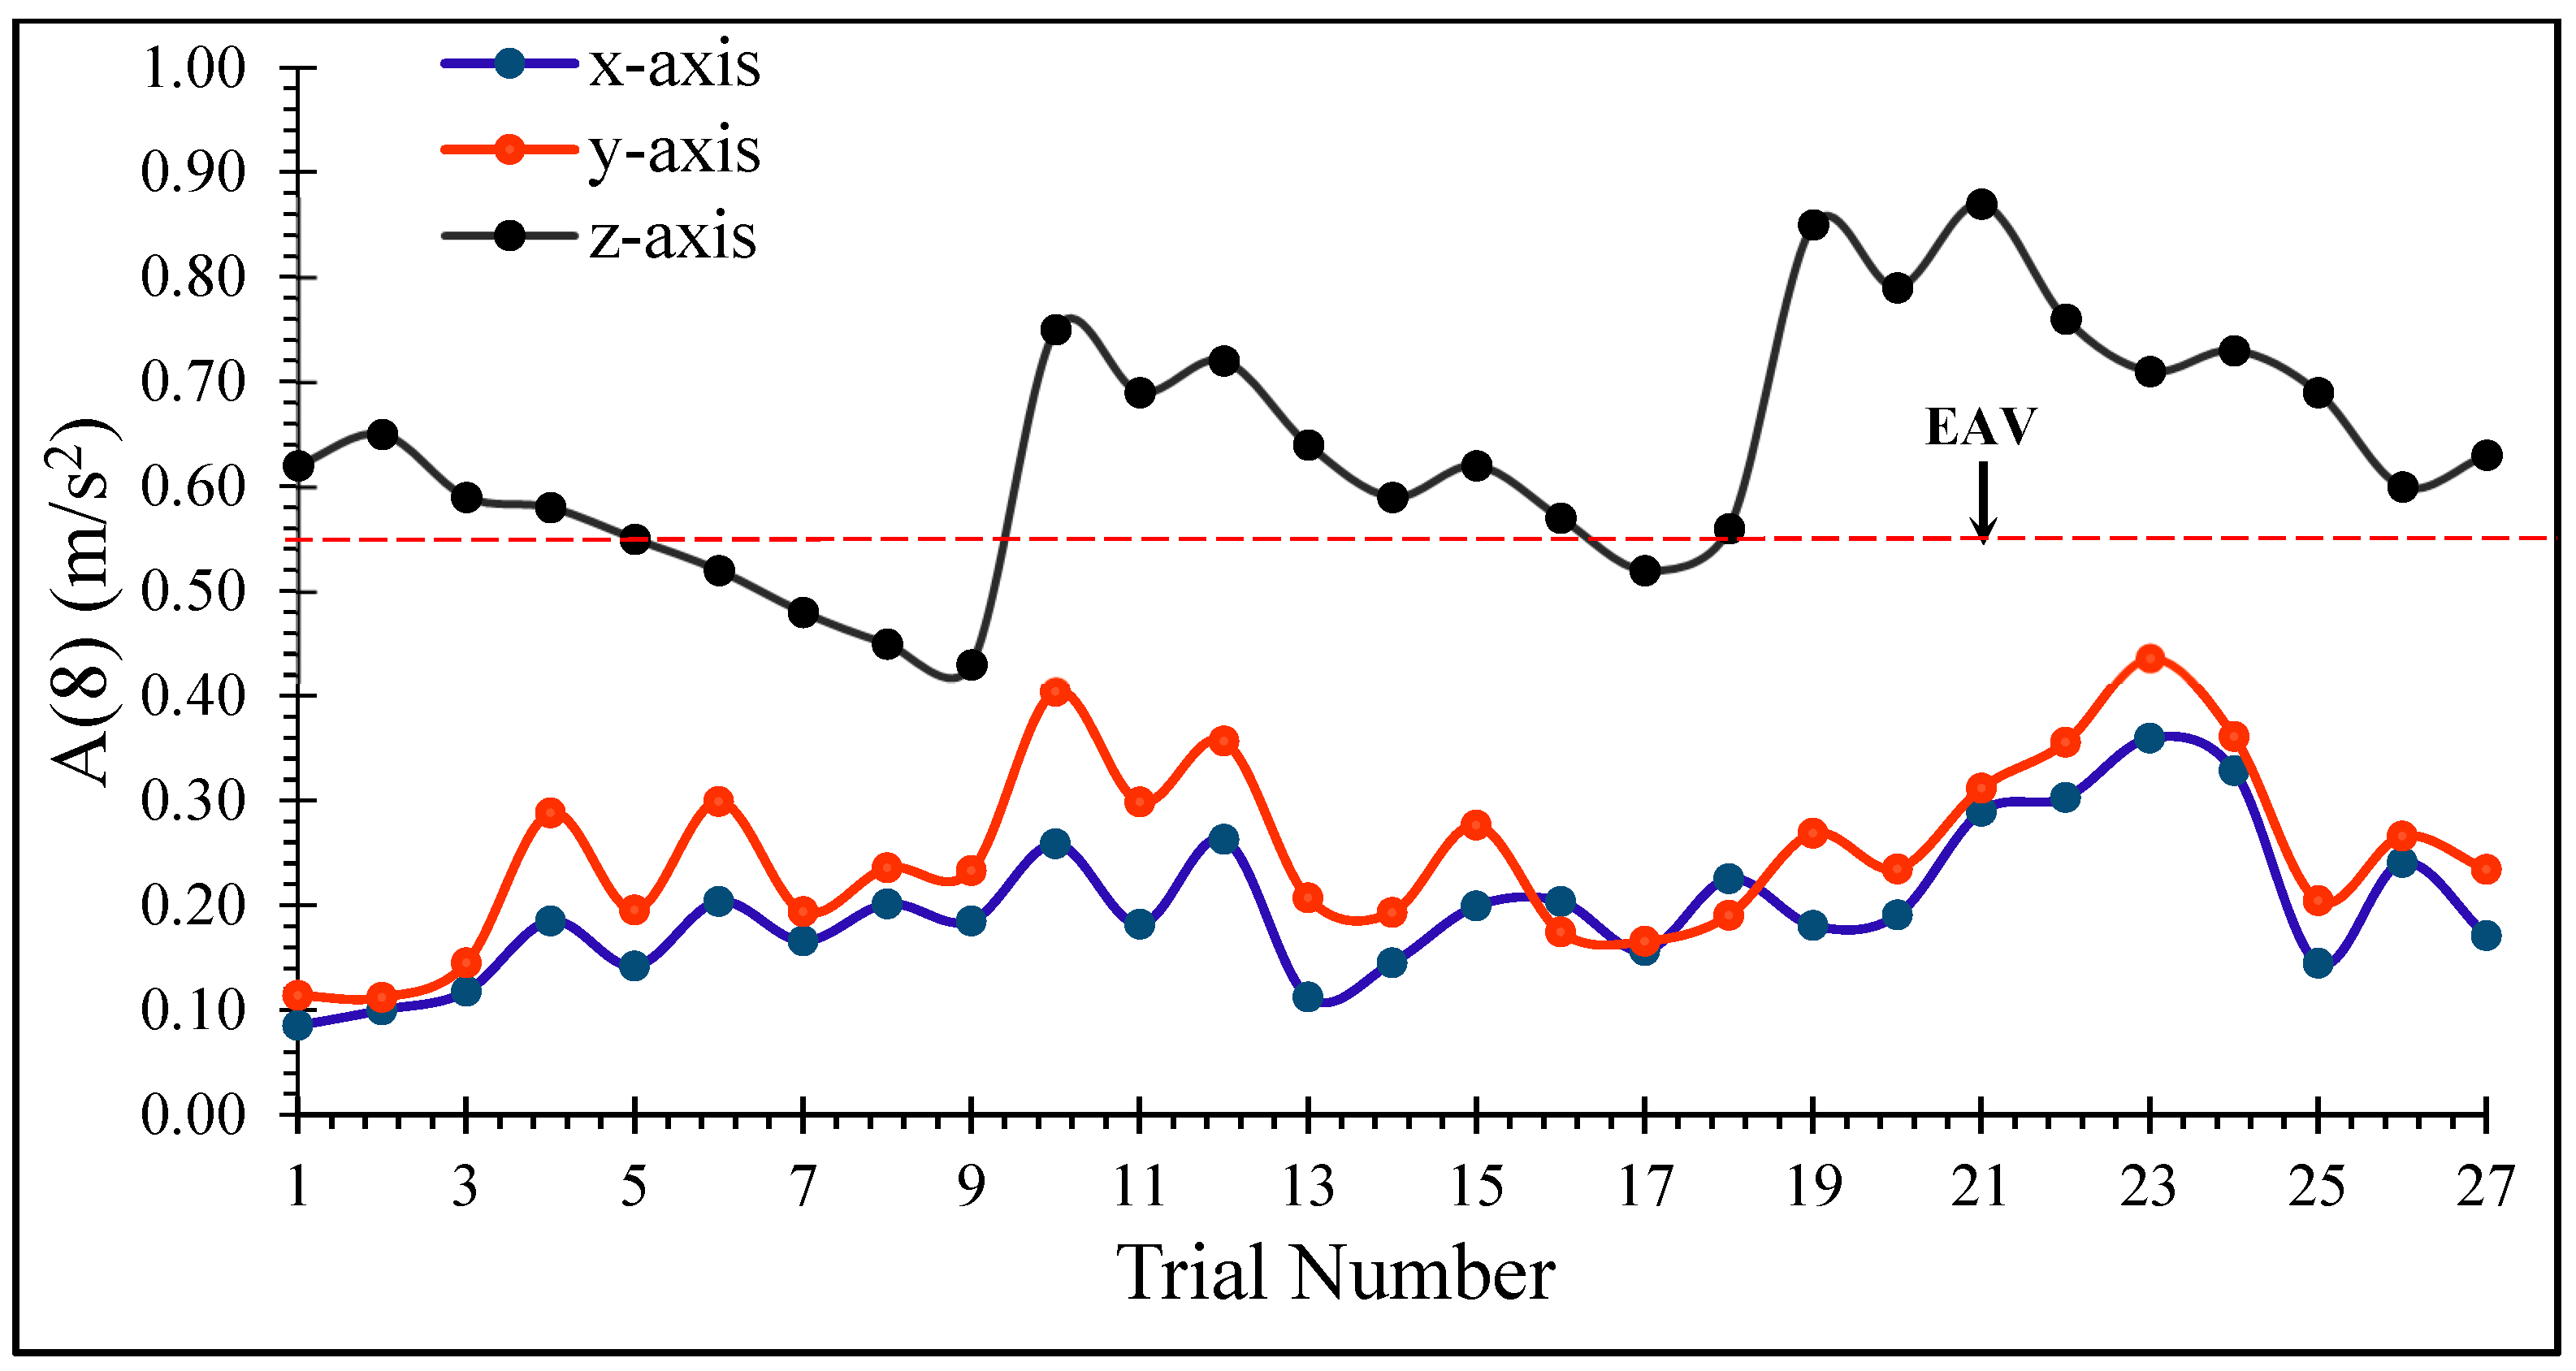
WBV levels were measured at the seat pan along the three translation axes. The WBV amplitude response with respect to the time domain of 60 s was plotted. The time and acceleration spectra can be visualized in Figure 2. There were around 90,000 raw acceleration data samples recorded in a time stretch of 60 s. Raw acceleration samples were further used to obtain Aw values with respect to the experimental design. The Aw response values were used to compute the overall daily exposure A(8) values for each experimental trial, as mentioned in Figure 3.
In Figure 2 and Figure 3, it can be observed that WBV amplitude and A(8) were dominant along the vertical (z) axis, followed by the lateral (y) axis and longitudinal (x) axis. Moreover, the WBV exposure levels were beyond the Directive 2002/44/EC recommended exposure action value (i.e., EAV > 0.5 m/s2) among majority of experimental trials (i.e., 81%). Prolonged exposure may be risky for the tractor driver by causing occupational health issues, specifically musculoskeletal disorders [22].
3.2. Signal-to-Noise Ratio Analysis
S/N ratios were computed and analyzed with respect to each experimental trial provided by the Taguchi’s L27 orthogonal array, as shown in Table 2. Each trial was replicated thrice and the mean A(8) and SEAT% response were evaluated.
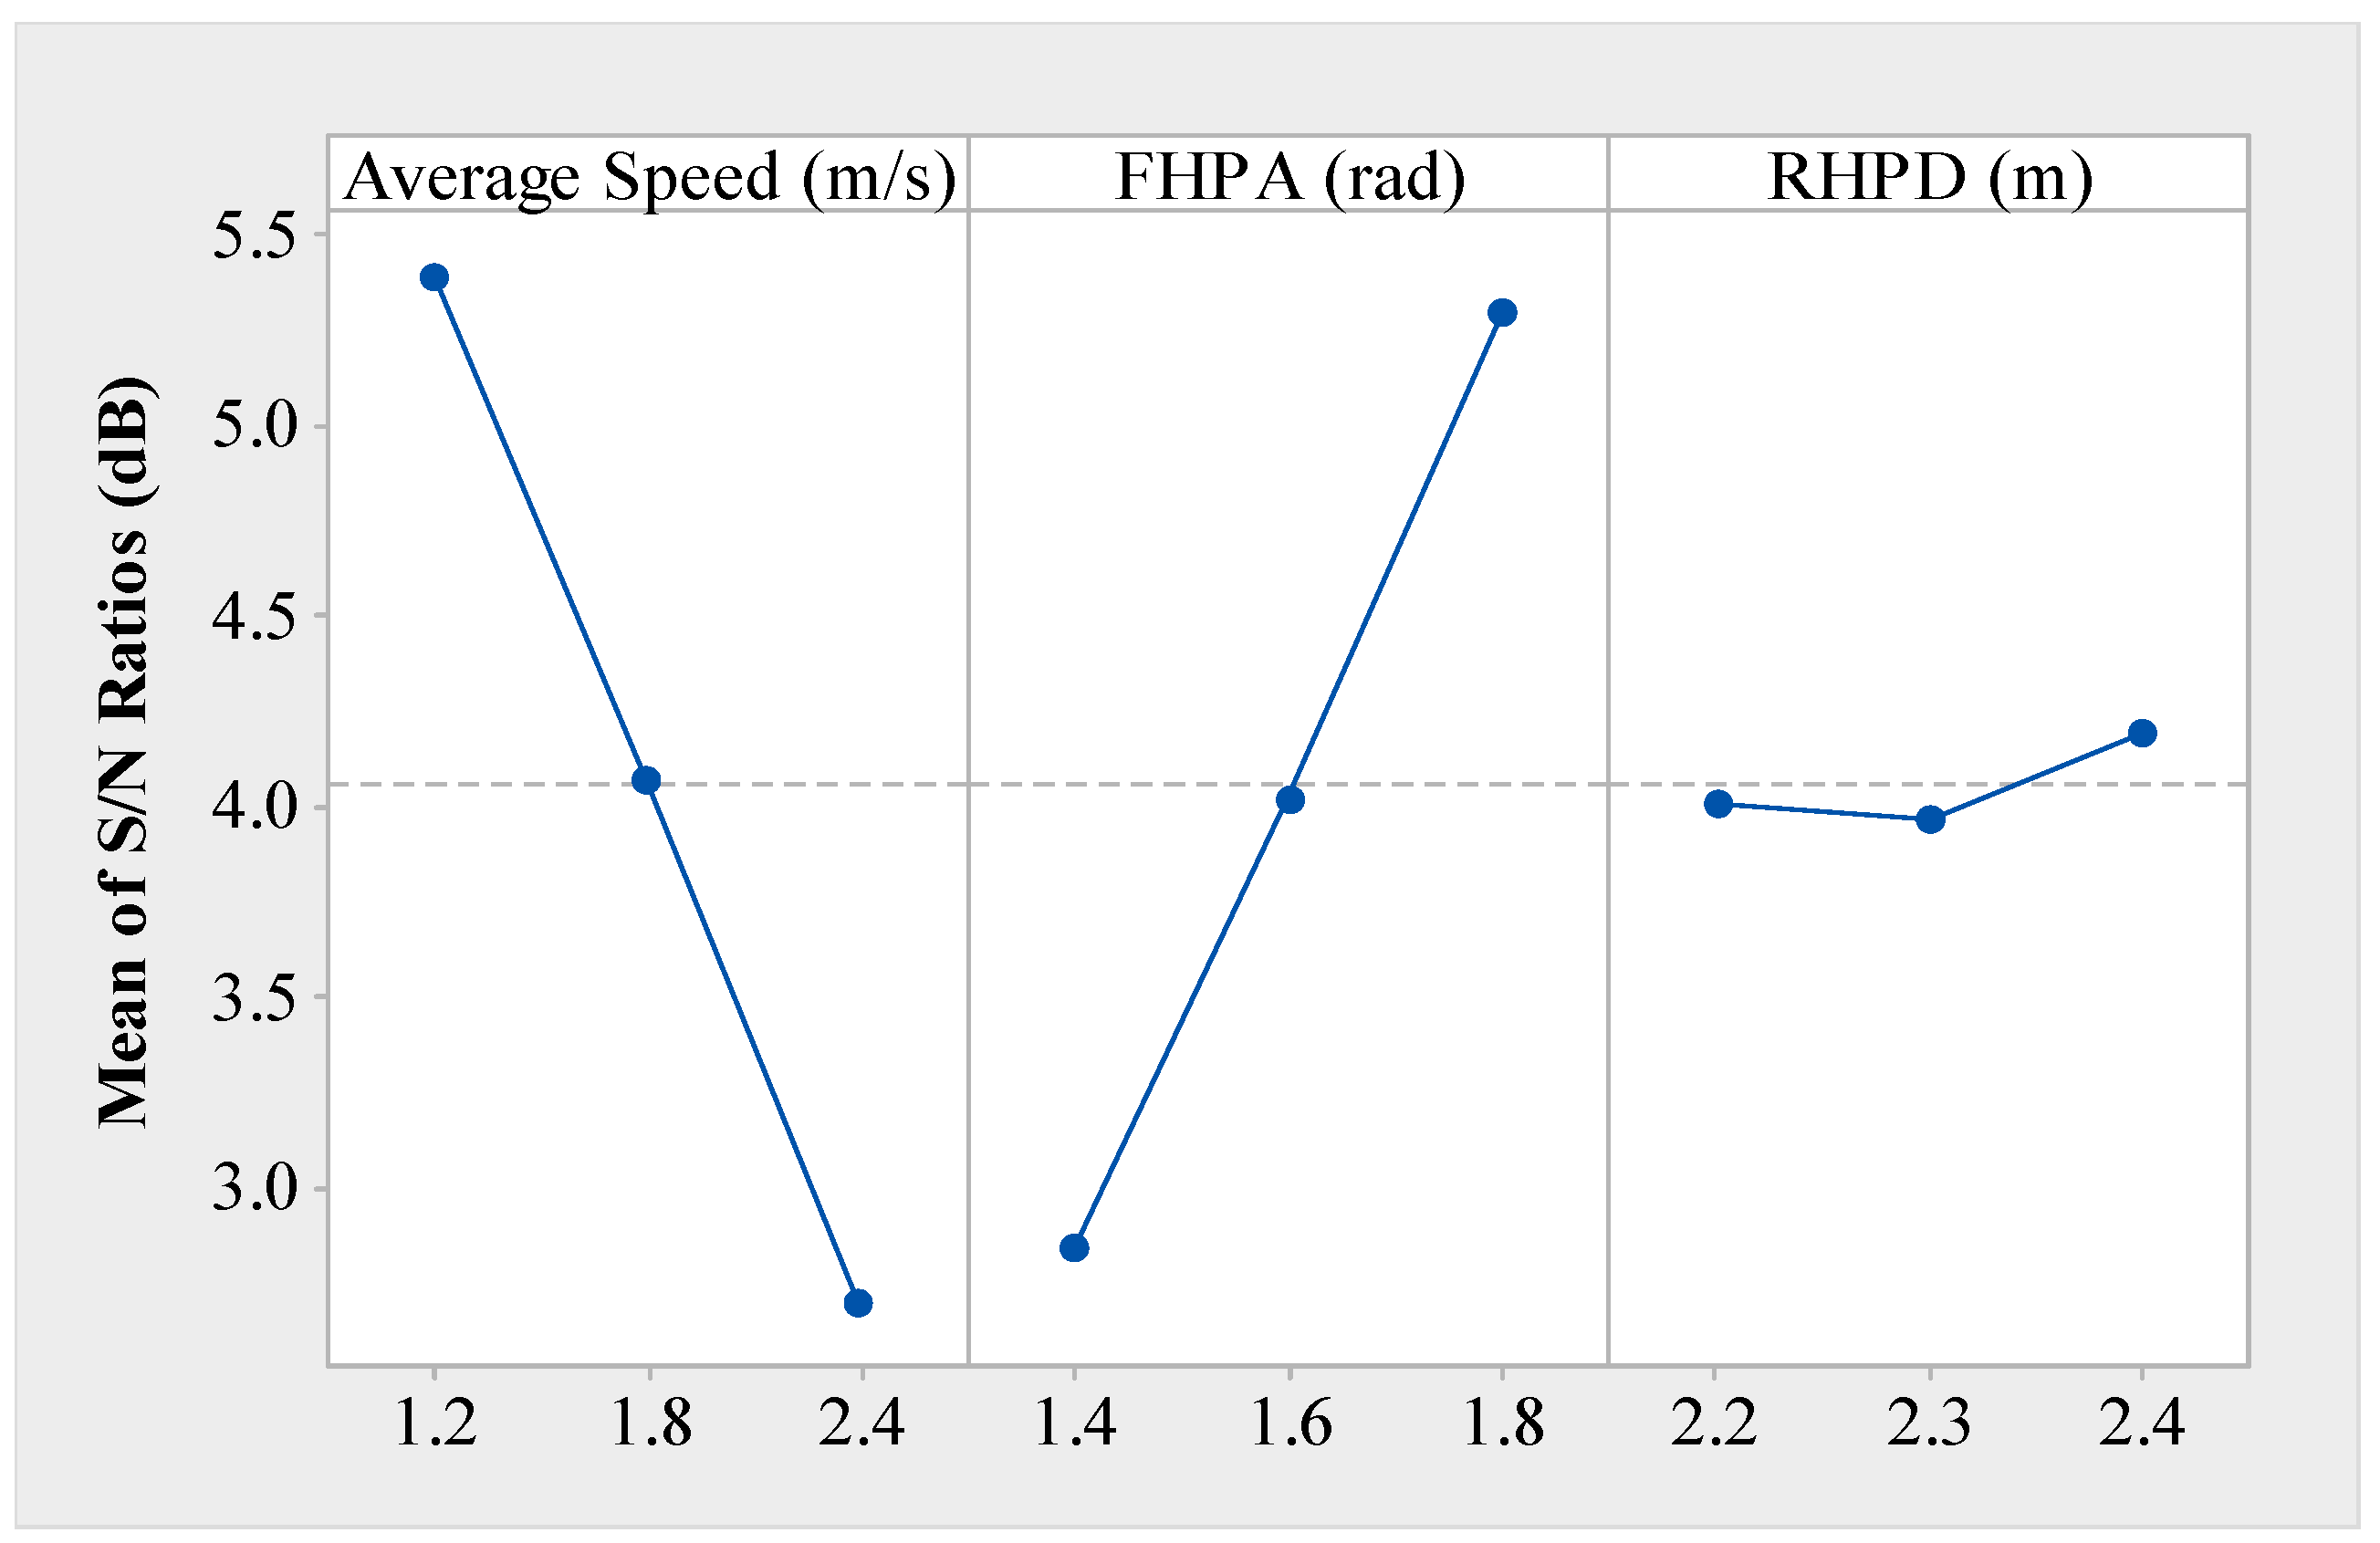
The mean A(8) and SEAT% along with S/N ratio for each experiment trial is tabulated in Table 2. A(8) and SEAT% response varied from 0.43 to 0.87 m/s2 and 91.37 to 133.08, respectively. It can be observed that the mean A(8) response among the experimental trial was 0.64 m/s2 i.e., exceeding the exposure action value (EAV) limit, as per Directive 2002/44/EC [22], whereas the mean SEAT% was found to be 108.35 i.e., vibration response was amplified while passing through the seat, thereby indicating poor seat isolation capacity [19]. The mean S/N ratio trend of A(8) with respect to varying ride conditions (i.e., average speed, FHPA, and RHPD) is shown in Figure 4. The mean S/N ratio decreases with the increase in forward average speed from 1.2 m/s to 2.4. This means that the A(8) response i.e., whole body exposure levels, have a direct relation with the increasing speed levels [7,23].
On the contrary, the S/N ratio was found to increase with the increase in FHPA from 1.4 rad to 1.8 rad i.e., A(8) has an inverse relation with the increasing FHPA. In addition, the mean S/N ratio response was found to decrease slightly with the increase in RHPD from 2.2 m to 2.3 m, and then showed drastic increase when the distance was increased from 2.3 m to 2.4 m. This means that the WBV exposure levels increased up to 2.3 m RHPD and then got damped with an increase in distance from 2.3 m to 2.4 m.
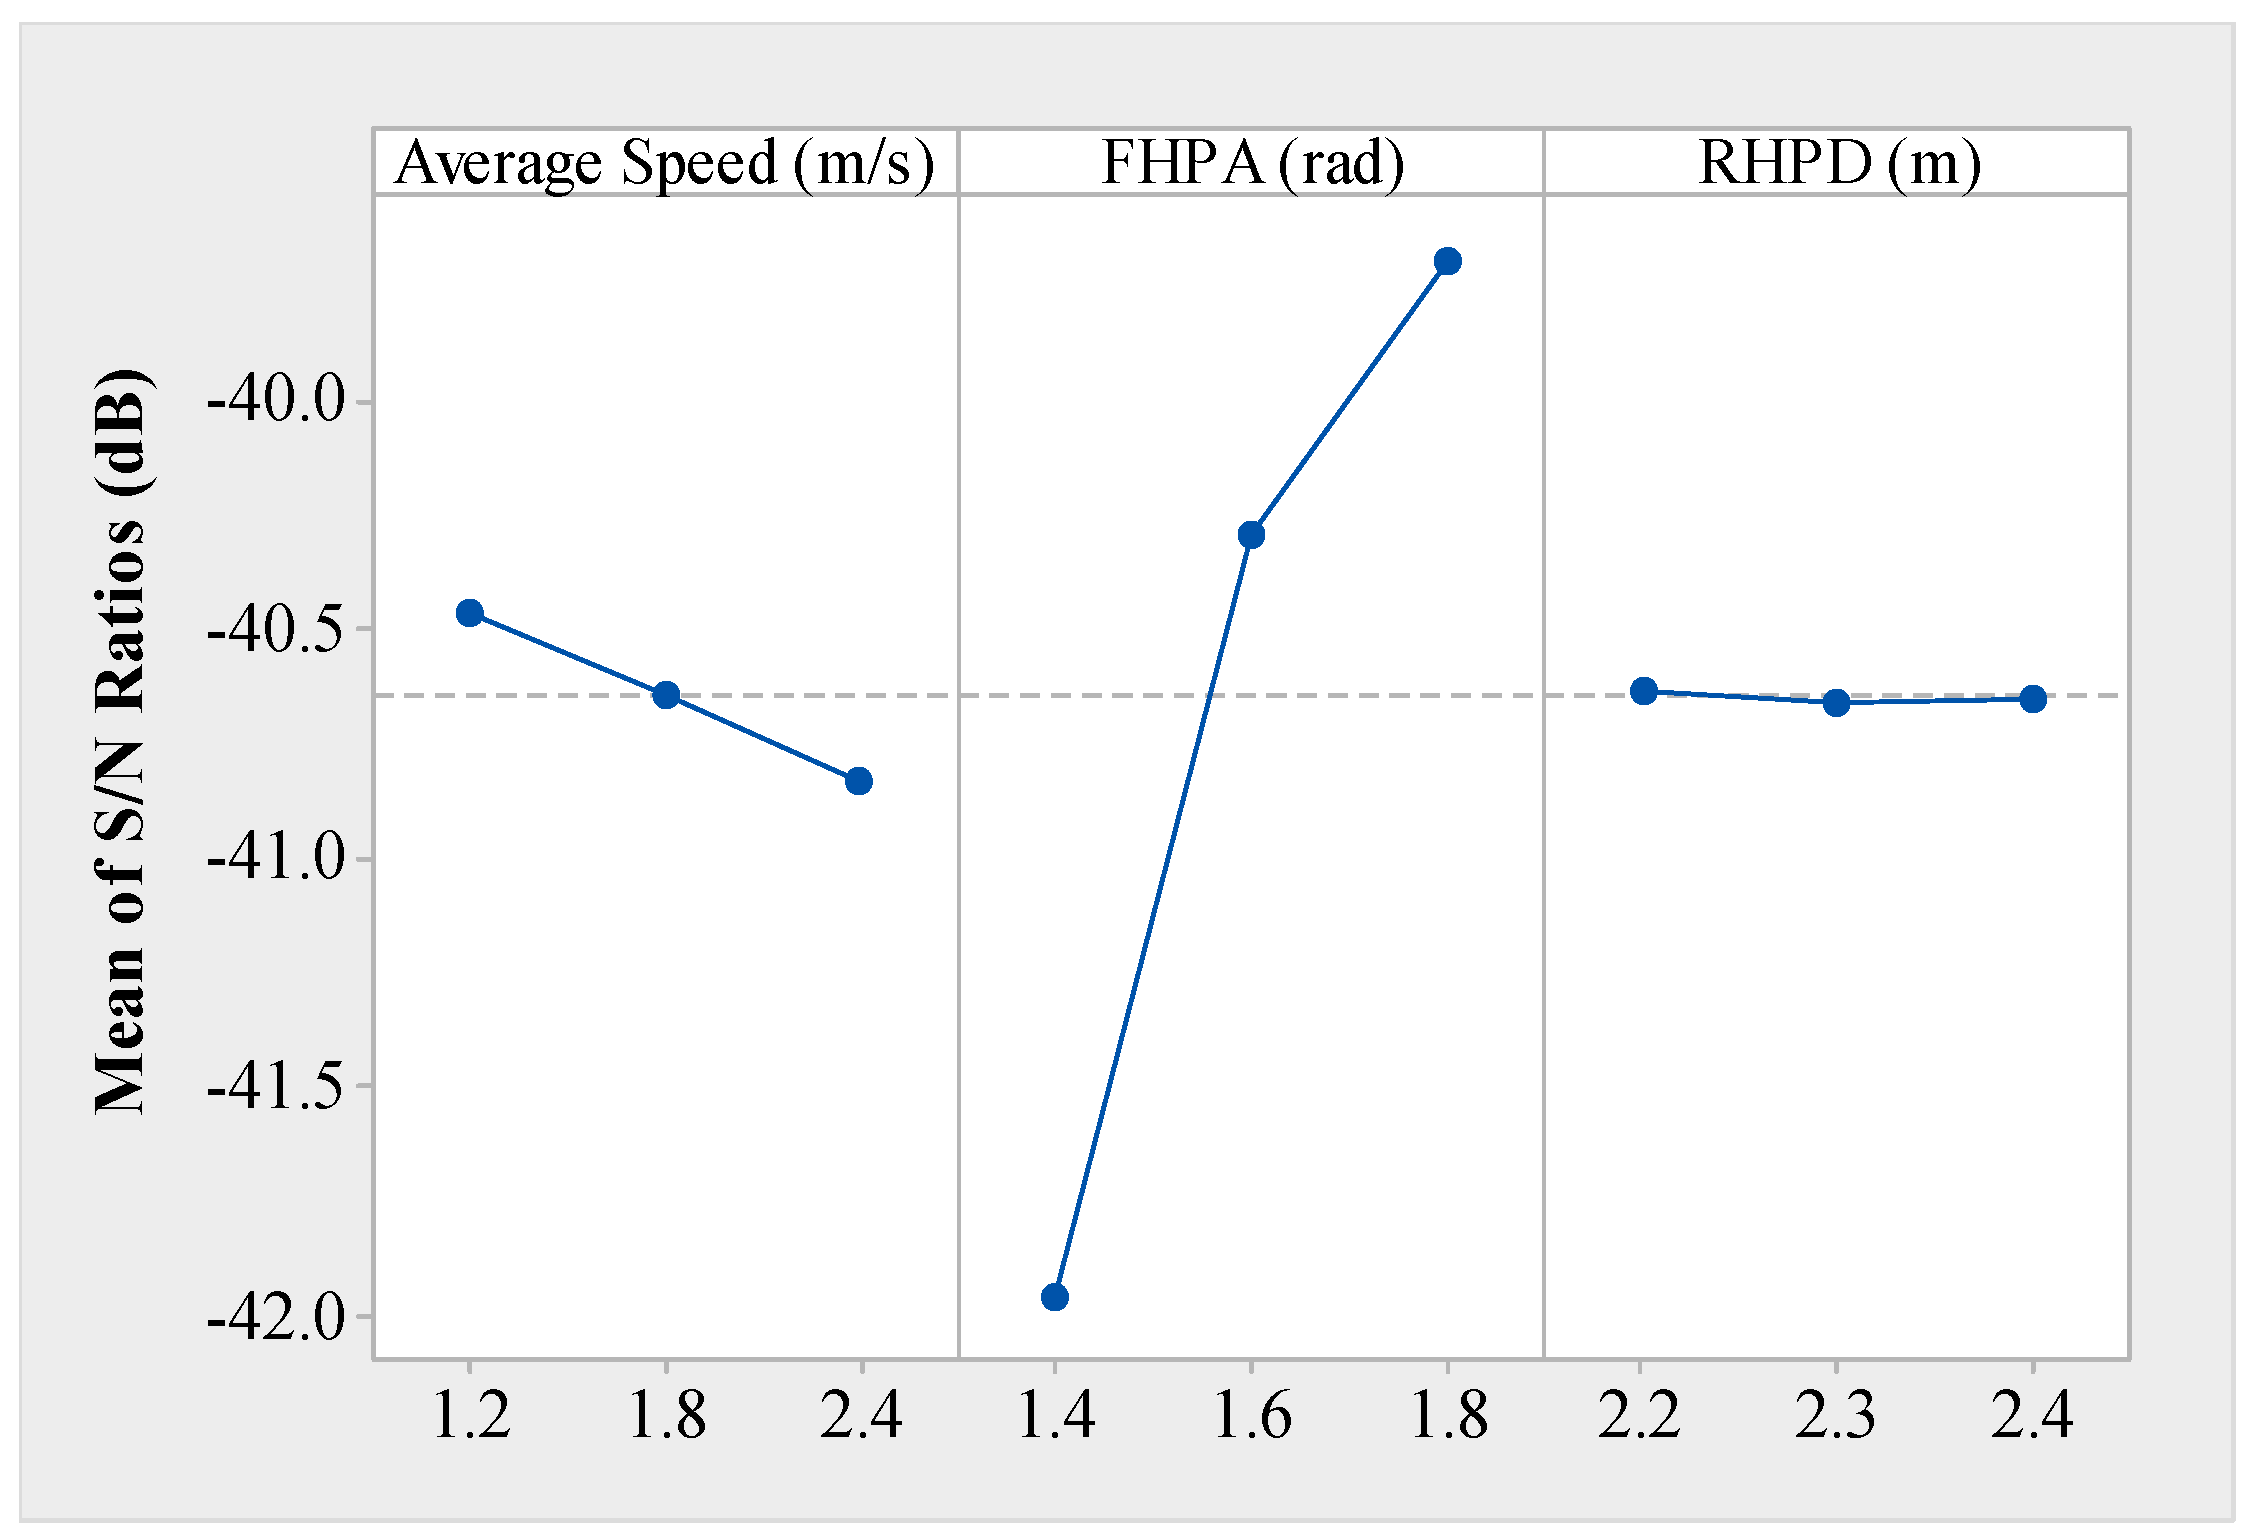
Practically, the harrowing width increases with the increase in RHPD and thereby its cutting depth also increases, as shown in Figure 4. Hence, it can be said that the increase in tillage depth was damped the WBV levels [3]. The mean S/N ratio trend for SEAT% with respect to the ride conditions has been analysed and shown in Figure 5. It can be observed that the mean S/N ratio response incessantly decreases with the increasing speed levels from 1.2 m/s to 2.4 m/s. This means that the seat isolation capacity becomes poorer with the increase in speed levels. This may be attributed to the increase in WBV levels with the increase in speed level [7], and thereby the SEAT% values increase. S/N ratio response has been shown to increase drastically with the increase in FHPA from 1.4 rad to 1.6 rad, and then it is found to increase gradually from 1.6 rad to 1.8 rad. It can be said that the SEAT% decreases with the increase in FHPA. On the other hand, the S/N ratio trend showed negligible change with respect to the change in RHPD, as shown in Figure 5.
3.3. Response Surface Methodology
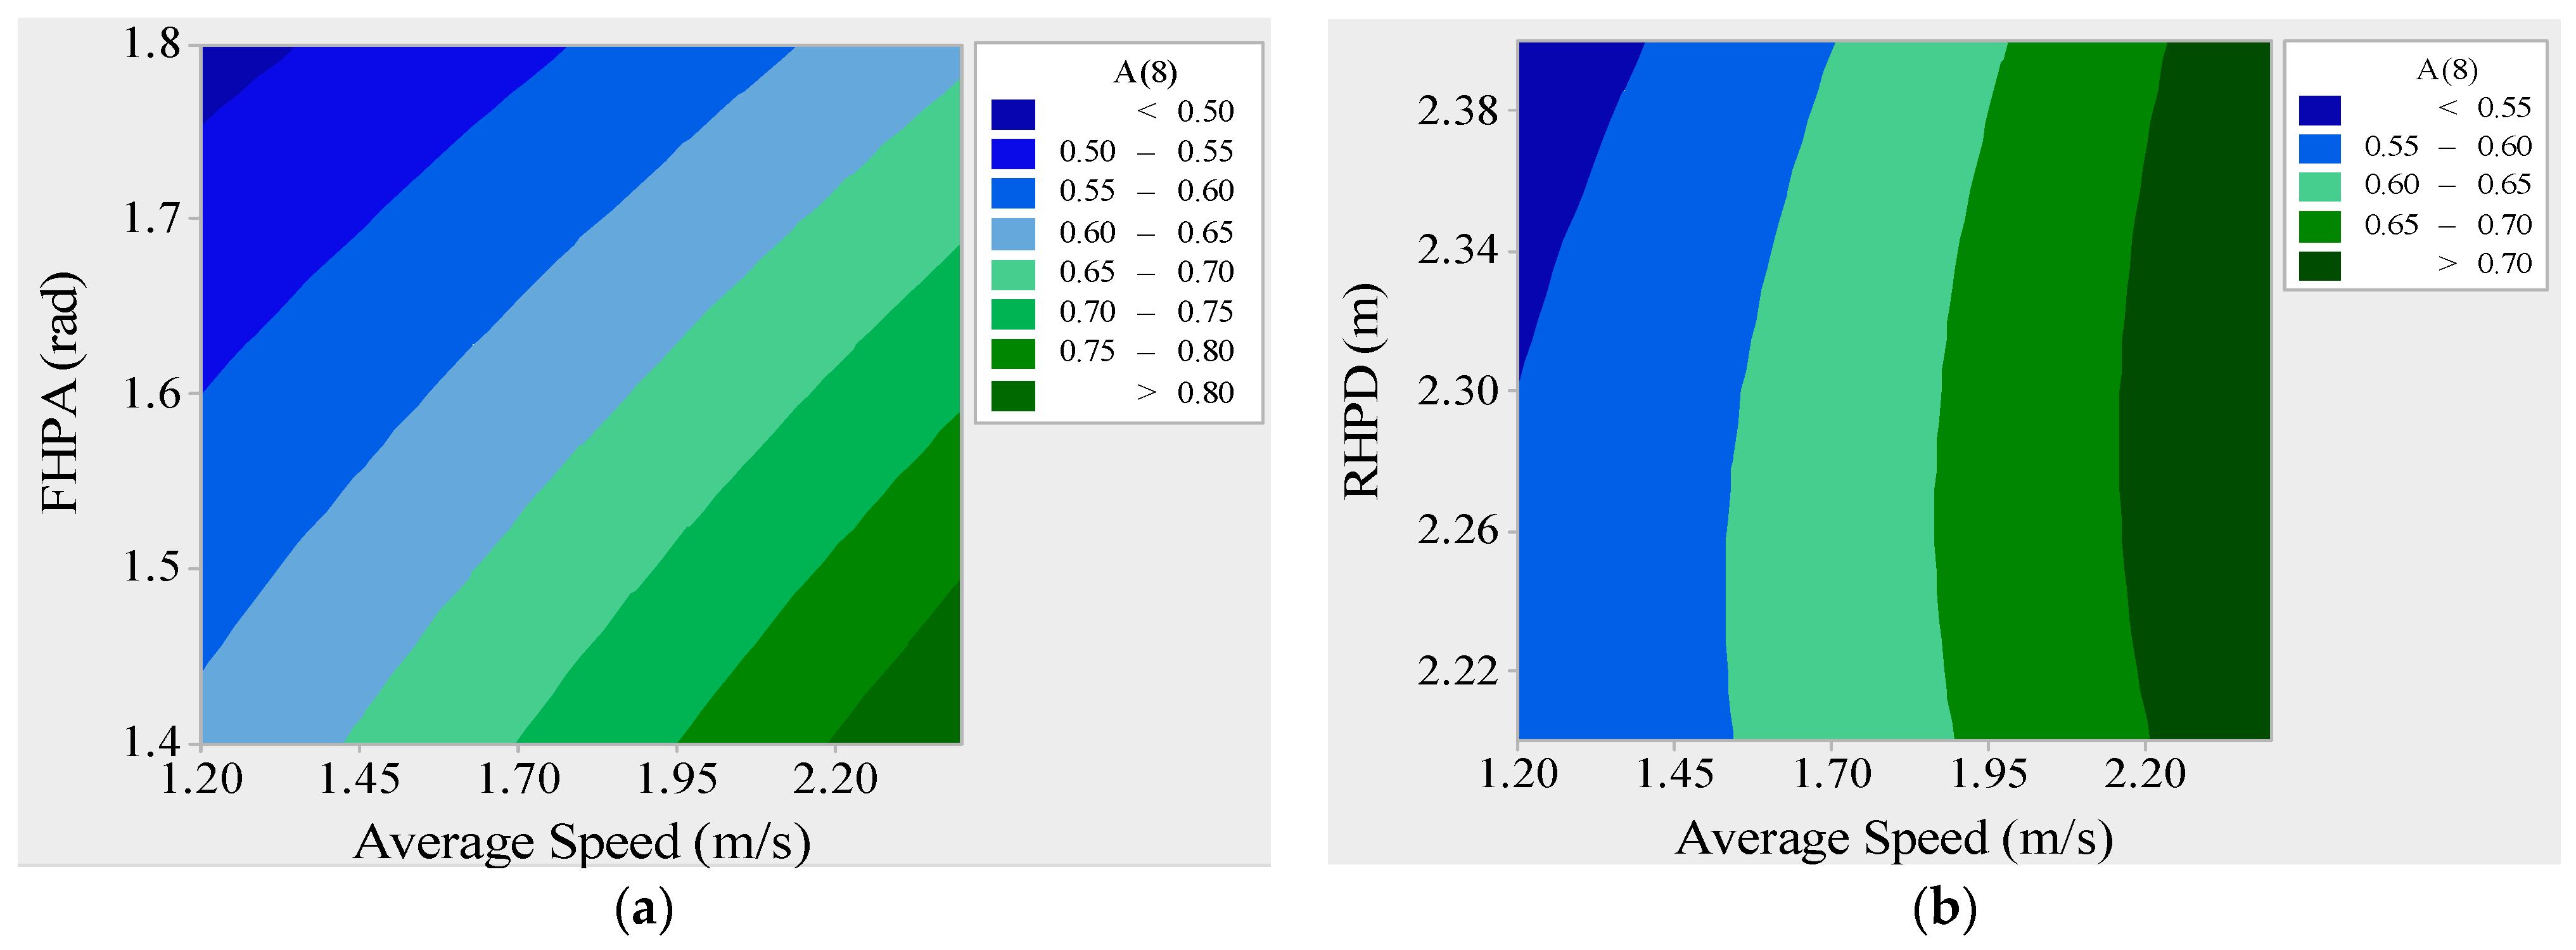
The RSM technique utilized the Taguchi’s L27 experimental design to understand the combined effect of ride conditions on the response characteristics i.e., A(8) and SEAT%. The impact of ride parameters with respect to A(8) were represented using contour plots, as shown in Figure 6a,b.
In Figure 6a, the A(8) response was relatively categorized with respect to varying ranges of average speed and FHPA. Similarly, the relative effects of various average speed and RHPD levels on the A(8) response are visualized in Figure 6b.
The study aimed at obtaining the minimum A(8) response at corresponding ride levels. In Figure 6a,b, it can be visualized that the A(8) response becomes minimum (i.e., <0.5 m/s2) at minimum average speed i.e., 1.2 m/s to 1.35 m/s and maximum FHPA i.e., 1.76 rad to 1.8 rad and RHPA i.e., 2.3 m to 2.4 m levels. Similarly, the relative effect of average speed, FHPA and RHPD on the SEAT%, was also studied and plotted in Figure 7a,b. SEAT% response was investigated along the dominant axis (i.e., vertical z-axis). The plotted area representing SEAT% more than 100 indicated poor seat isolation capacity. The contour plots provided an area representing the ride parameter ranges to obtain SEAT% at minimum level. It can be observed that the seat isolation capacity becomes maximum i.e., SEAT% < 100 at maximum FHPA i.e., 1.63 rad to 1.8 rad independent of speed levels. However, the SEAT% was found to be minimum at maximum RHPD i.e., 2.37 m to 2.40 m and at minimum speed levels i.e., 1.20 m/s to 1.32 m/s.
3.4. Analysis of Variance (ANOVA)
In order to investigate the statistical significance of ride parameters i.e., average speed, FHPA and RHPD on A(8), and SEAT%, ANOVA test (at 5% level i.e., F0.05(2,26): 3.37) was performed using sequential sum of squares, adjusted mean squares, F and p values. In addition, the percentage contribution of each parameter in affecting A(8) and SEAT% was computed [19], as shown in Table 3.
In Table 3, it was found that average speed and FHPA had a significant effect on A(8) and SEAT% at the 95% confidence level. Scarlett et al. [7] reported an increasing trend of acceleration response with the increase in forward speed. In addition, the average speed and FHPA was found to effect A(8) with 54.28% and 45.04%, respectively, whereas the RHPD had the least contribution to effect A(8) i.e., 0.47%. However, FHPA was found to be the most influential parameter for SEAT% with 97.58%. Average speed (2.39%) and RHPA (0.01%) were found to have a negligible effect on the SEAT%.
3.5. Fast Fourier Transform (FFT)
FFT analysis was carried out to obtain the dominant frequencies during the harrowing operation. Raw acceleration data at seat pan location was used to get FFT response along the translation axes for each experimental trial. During the analysis, it was observed that the FFT response spectra was similar with respect to the experimental trials. Therefore, out of the 27 trials, one trial data was selected randomly to understand the frequency spectra, as shown in Figure 8. It can be visualized that the frequency spectra showed multiple frequency peaks along the translational axes i.e., the vibration energies get changed with respect to the selected frequency range [15]. The FFT response showed that the harrowing operation causes vibration exposure at low frequencies i.e., 0.3 Hz to 11 Hz, mainly. However, the peak dominant frequency was found at 7.1 Hz and other secondary peaks within 0.2 Hz to 4.3 Hz.
4. Conclusions
Whole body vibration levels were found dominant along the vertical (z) axis, in the experimental trials. A(8) was found to be between 0.43 to 0.87 m/s2 with an average of 0.64 m/s2, which may influence health, as the levels are higher than the exposure action value i.e., 0.5 m/s2, as recommended by Directive 2002/44/EC. SEAT% response ranged between 91.37 to 133.08, which showed poor seat isolation capacity in absorbing the vibrations i.e., SEAT% > 100. Average speed and FHPA were found to be the significant parameters (p ≤ 0.05) effecting A(8) and SEAT%. The FFT response exhibited a range of predominantly low frequency between 0.3 to 14 Hz, where a frequency of 7.1 Hz was found dominant. These frequencies may influence occupational health and ride comfort due to their existence in the vicinity of natural frequencies of various human body parts [24]. This information can be useful for tractor designers and manufacturers to damp such dominant frequencies to enhance tractor rides. The present study considered ride parameters such as average speed, FHPA, and RHPD; however, the effect of tire pressure on the output parameters may also be studied in future. The number of participants may be increased to study the age-related differences on musculoskeletal health. Similar investigations may also be performed by varying terrain conditions to validate the study outcomes. In addition, vibration transmission could be investigated by measuring biodynamic responses, such as seat to head transmissibility. The study outcomes may be useful for tractor designers and manufacturers in terms of enhancing tractor ride comfort through the damping of dominant vibration exposure levels.
Author Contributions
Conceptualization, S.S.; Data curation, Y.K.; Funding acquisition, A.S. and H.S.; Investigation, A.S.; Methodology, A.S. and S.S.; Supervision, H.S.; Writing—original draft, A.S.; Writing—review & editing, S.S.; Field Experimentation, C.P.; Sensor Mounting and Data Acquition, C.P.; Data Management, C.P. All authors have read and agreed to the published version of the manuscript.
Funding
This work was supported by the All India Council of Technical Education under the Grant ‘MODROBs’ [9-23/RIFD/MODROB/Policy-1/2017-19], and The Institution of Engineers (IEI) under ‘Research and Development Scheme’ [RDDR2016067].
Institutional Review Board Statement
The study was conducted in accordance with the Declaration of Helsinki, and the protocol was approved by the Ethics Committee of Guru Nanak Dev Engineering College, Ludhiana (GNDEC/ME/113).
Informed Consent Statement
Informed consent was obtained from the subject involved in the study.
Acknowledgments
This work was supported by the All India Council of Technical Education under the Grant ‘MODROBs’ [9-23/RIFD/MODROB/Policy-1/2017-19], and The Institution of Engineers (IEI) under ‘Research and Development Scheme’ [RDDR2016067]. The authors are grateful to the Punjab Agricultural University Ludhiana (India) for the experimentation facilities. The authors would also like to thank the subject who performed the experiments.
Conflicts of Interest
One of the co-authors, Harwinder Singh, serves as the Chairman of the ethics review board which evaluated the proposal; however, according to institutional procedures, he did not participate in this particular evaluation process. The authors declare that they have no known competing financial interests or personal relationships that could have appeared to influence the work reported in this paper.
References
- Village, J.; Trask, C.; Chow, Y.; Morrison, J.; Koehoorn, M.; Teschke, K. Assessing whole body vibration exposure for use in epidemiological studies of back injuries: Measurements, observations and self-reports. Ergonomics 2012, 55, 415–424. [Google Scholar] [CrossRef]
- Park, M.-S.; Fukuda, T.; Kim, T.-G.; Maeda, S. Health Risk Evaluation of Whole-body Vibration by ISO 2631-5 and ISO 2631-1 for Operators of Agricultural Tractors and Recreational Vehicles. Ind. Health 2013, 51, 364–370. [Google Scholar] [CrossRef] [PubMed] [Green Version]
- Cutini, M.; Costa, C.; Bisaglia, C. Development of a simplified method for evaluating agricultural tractor’s operator whole body vibration. J. Terramechanics 2016, 63, 23–32. [Google Scholar] [CrossRef]
- Mechanical Vibration and Shock–Evaluation of Human Exposure to Whole-Body Vibration–Part 1: General Requirements; ISO: Geneva, Switzerland, 1997; p. 2631-1.
- Liang, C.-C.; Chiang, C.-F. Modeling of a Seated Human Body Exposed to Vertical Vibrations in Various Automotive Postures. Ind. Health 2008, 46, 125–137. [Google Scholar] [CrossRef] [PubMed] [Green Version]
- Harsha, S.; Desta, M.; Prashanth, A.; Saran, V. Measurement and bio-dynamic model development of seated human subjects exposed to low frequency vibration environment. Int. J. Veh. Noise Vib. 2014, 10, 1–24. [Google Scholar] [CrossRef] [Green Version]
- Scarlett, A.; Price, J.; Stayner, R. Whole-body vibration: Evaluation of emission and exposure levels arising from agricultural tractors. J. Terramechanics 2007, 44, 65–73. [Google Scholar] [CrossRef]
- Loutridis, S.; Gialamas, T.; Gravalos, I.; Moshou, D.; Kateris, D.; Xyradakis, P.; Tsiropoulos, Z. A study on the effect of electronic engine speed regulator on agricultural tractor ride vibration behavior. J. Terramechanics 2011, 48, 139–147. [Google Scholar] [CrossRef]
- Ciloglu, H.; Alziadeh, M.; Mohany, A.; Kishawy, H. Assessment of the whole body vibration exposure and the dynamic seat comfort in passenger aircraft. Int. J. Ind. Ergon. 2015, 45, 116–123. [Google Scholar] [CrossRef]
- Rakheja, S.; Dong, R.; Patra, S.; Boileau, P.; Marcotte, P.; Warren, C. Biodynamics of the human body under whole-body vibration: Synthesis of the reported data. Int. J. Ind. Ergon. 2010, 40, 710–732. [Google Scholar] [CrossRef] [Green Version]
- Mansfield, N.J.; Maeda, S. The apparent mass of the seated human exposed to single-axis and multi-axis whole-body vibration. J. Biomech. 2007, 40, 2543–2551. [Google Scholar] [CrossRef]
- Curran, M.; Dankaerts, W.; O’Sullivan, P.; O’Sullivan, L.; O’Sullivan, K. The effect of a backrest and seatpan inclination on sitting discomfort and trunk muscle activation in subjects with extension-related low back pain. Ergonomics 2014, 57, 733–743. [Google Scholar] [CrossRef]
- Servadio, P.; Marsili, A.; Belfiore, N. Analysis of driving seat vibrations in high forward speed tractors. Biosyst. Eng. 2007, 97, 171–180. [Google Scholar] [CrossRef]
- Kim, J.H.; Dennerlein, J.T.; Johnson, P.W. The effect of a multi-axis suspension on whole body vibration exposures and physical stress in the neck and low back in agricultural tractor applications. Appl. Ergon. 2018, 68, 80–90. [Google Scholar] [CrossRef]
- Muzammil, M.; Siddiqui, S.S.; Hasan, F. Physiological effect of vibrations on tractor drivers under variable ploughing conditions. J. Occup. Health 2004, 46, 403–409. [Google Scholar] [CrossRef] [PubMed] [Green Version]
- Tewari, V.K.; Vidhu, K.P.; Arudra, A.K.; Kumari, S. Reduction of hand transmitted and whole body vibrations experienced by tractor operators by using piezo crystal material. Agric. Eng. Int. CIGR J. 2013, 15, 209–220. [Google Scholar]
- Romano, E.; Pirozzi, M.; Ferri, M.; Calcante, A.; Oberti, R.; Vitale, E.; Rapisarda, V. The use of pressure mapping to assess the comfort of agricultural machinery seats. Int. J. Ind. Ergon. 2020, 77. [Google Scholar] [CrossRef]
- Romano, E.; Bisaglia, C.; Calcante, A.; Oberti, R.; Zani, A.; Vinnikov, D.; Marconi, A.; Vitale, E.; Bracci, M.; Rapisarda, V. Assessment of Comfort Variation among Different Types of Driving Agricultural tractors: Traditional, Satellite-Assisted and Semi-Automatic. Int. J. Environ. Res. Public Health 2020, 17, 8836. [Google Scholar] [CrossRef] [PubMed]
- Mansfield, N.J. Human Response to Vibration; CRC Press: Boca Raton, FL, USA, 2004. [Google Scholar]
- Singh, A.; Singh, L.P.; Singh, S.; Singh, H.; Chhuneja, N.K.; Singh, M. Evaluation and analysis of occupational ride comfort in rotary soil tillage operation. Measurement 2018, 131, 19–27. [Google Scholar] [CrossRef]
- Lindman, H.R. Analysis of Variance in Experimental Design; Springer Science & Business Media: Berlin/Heidelberg, Germany, 2012. [Google Scholar]
- Directive, E.U.; Provision, G.E. Directive 2002/44/EC of the European Parliament and the Council of 25 June 2002 on the minimum health and safety requirements regarding the exposure of workers to the risks arising from physical agents (vi-bration) (sixteenth individual Directive within the meaning of Article 16 (1) of Directive 89/391/EEC). Off. J. Eur. Communities 2002, 117, 6–7. [Google Scholar]
- Deboli, R.; Calvo, A.; Preti, C. Whole-body vibration: Measurement of horizontal and vertical transmissibility of an agricultural tractor seat. Int. J. Ind. Ergon. 2017, 58, 69–78. [Google Scholar] [CrossRef]
- Griffin, M.J. Discomfort from feeling vehicle vibration. Veh. Syst. Dyn. 2007, 45, 679–698. [Google Scholar] [CrossRef] [Green Version]
Figure 1.
Representation of the disc harrow system.

Figure 2.
Time domain response along the translational axes.

Figure 3.
A(8) response along the translational axes (x-axis: longitudinal direction; y-axis: lateral direction; z-axis: vertical direction; EAV: exposure action value).
Figure 3.
A(8) response along the translational axes (x-axis: longitudinal direction; y-axis: lateral direction; z-axis: vertical direction; EAV: exposure action value).

Figure 4.
Mean S/N ratio trend for A(8). (FHPA: front harrow pin angle; RHPD: rear harrow pin distance; S/N: signal to noise ratio).
Figure 4.
Mean S/N ratio trend for A(8). (FHPA: front harrow pin angle; RHPD: rear harrow pin distance; S/N: signal to noise ratio).

Figure 5.
Mean S/N ratio trend for SEAT%.

Figure 6.
Effect on A(8) with respect to (a) FHPA and average speed; (b) RHPD and average speed.

Figure 7.
Effect on SEAT% with respect to (a) FHPA and average speed; (b) RHPD and average speed.

Figure 8.
Fast Fourier response in harrowing operations.


Table 1.
Input parameters and their levels.
| Input Parameters | Levels | ||
|---|---|---|---|
| Average Speed (m/s) | 1.2 | 1.8 | 2.4 |
| FHPA (rad) | 1.4 | 1.6 | 1.8 |
| RHPD (m) | 2.2 | 2.3 | 2.4 |
Table 2.
S/N ratio response for A(8) & SEAT%.
| Trial No. | AS | FHPA | RHPD | A(8) | S/N (dB) | SEAT (%) | S/N (dB) |
|---|---|---|---|---|---|---|---|
| 1 | 1.2 | 1.4 | 2.2 | 0.62 | 4.14 | 126.47 | 41.74 |
| 2 | 1.2 | 1.4 | 2.2 | 0.65 | 122.52 | ||
| 3 | 1.2 | 1.4 | 2.2 | 0.59 | 117.70 | ||
| 4 | 1.2 | 1.6 | 2.3 | 0.58 | 5.18 | 105.31 | 40.14 |
| 5 | 1.2 | 1.6 | 2.3 | 0.55 | 101.23 | ||
| 6 | 1.2 | 1.6 | 2.3 | 0.52 | 98.42 | ||
| 7 | 1.2 | 1.8 | 2.4 | 0.48 | 6.86 | 91.37 | 39.50 |
| 8 | 1.2 | 1.8 | 2.4 | 0.45 | 97.31 | ||
| 9 | 1.2 | 1.8 | 2.4 | 0.43 | 94.47 | ||
| 10 | 1.8 | 1.4 | 2.3 | 0.75 | 2.84 | 129.34 | 41.95 |
| 11 | 1.8 | 1.4 | 2.3 | 0.69 | 125.92 | ||
| 12 | 1.8 | 1.4 | 2.3 | 0.72 | 120.24 | ||
| 13 | 1.8 | 1.6 | 2.4 | 0.64 | 4.19 | 106.37 | 40.27 |
| 14 | 1.8 | 1.6 | 2.4 | 0.59 | 102.41 | ||
| 15 | 1.8 | 1.6 | 2.4 | 0.62 | 100.67 | ||
| 16 | 1.8 | 1.8 | 2.2 | 0.57 | 5.18 | 93.48 | 39.69 |
| 17 | 1.8 | 1.8 | 2.2 | 0.52 | 99.82 | ||
| 18 | 1.8 | 1.8 | 2.2 | 0.56 | 96.24 | ||
| 19 | 2.4 | 1.4 | 2.4 | 0.85 | 1.54 | 133.08 | 42.16 |
| 20 | 2.4 | 1.4 | 2.4 | 0.79 | 128.72 | ||
| 21 | 2.4 | 1.4 | 2.4 | 0.87 | 122.81 | ||
| 22 | 2.4 | 1.6 | 2.2 | 0.76 | 2.69 | 109.14 | 40.46 |
| 23 | 2.4 | 1.6 | 2.2 | 0.71 | 105.07 | ||
| 24 | 2.4 | 1.6 | 2.2 | 0.73 | 102.04 | ||
| 25 | 2.4 | 1.8 | 2.3 | 0.69 | 3.86 | 95.48 | 39.86 |
| 26 | 2.4 | 1.8 | 2.3 | 0.60 | 101.82 | ||
| 27 | 2.4 | 1.8 | 2.3 | 0.63 | 98.11 |
Table 3.
Analysis of Variance for A(8) and SEAT% (Note: I/P: input parameters; A: average speed; B: FHPA; C: RHPD; R: residual error; T: Total; SSS: sequential sum of square; MSA: adjusted mean squares; P (%): percentage contribution); *: significant difference (p ≤ 0.05).
Table 3.
Analysis of Variance for A(8) and SEAT% (Note: I/P: input parameters; A: average speed; B: FHPA; C: RHPD; R: residual error; T: Total; SSS: sequential sum of square; MSA: adjusted mean squares; P (%): percentage contribution); *: significant difference (p ≤ 0.05).
| A(8) | I/P | SSS | MSA | F-Value | p-Value | P (%) |
| A | 10.93 | 5.47 | 270.6 | 0.004 * | 54.29 | |
| B | 9.07 | 4.54 | 224.5 | 0.004 * | 45.04 | |
| C | 0.09 | 0.05 | 2.33 | 0.301 | 0.47 | |
| R | 0.04 | 0.02 | - | - | 0.20 | |
| T | 20.14 | - | - | - | - | |
| SEAT% | I/P | SSS | SSA | F-Value | p-Value | P (%) |
| A | 0.20 | 0.10 | 83.55 | 0.01 * | 2.39 | |
| B | 8.26 | 4.13 | 3425 | 0.00 * | 97.58 | |
| C | 0.01 | 0.01 | 0.29 | 0.77 | 0.01 | |
| R | 0.01 | 0.01 | - | - | 0.03 | |
| T | - | - | - | - | - |
Publisher’s Note: MDPI stays neutral with regard to jurisdictional claims in published maps and institutional affiliations. |
© 2021 by the authors. Licensee MDPI, Basel, Switzerland. This article is an open access article distributed under the terms and conditions of the Creative Commons Attribution (CC BY) license (https://creativecommons.org/licenses/by/4.0/).
Share and Cite
MDPI and ACS Style
Singh, A.; Samuel, S.; Singh, H.; Kumar, Y.; Prakash, C. Evaluation and Analysis of Whole-Body Vibration Exposure during Soil Tillage Operation. Safety 2021, 7, 61. https://0-doi-org.brum.beds.ac.uk/10.3390/safety7030061
AMA Style
Singh A, Samuel S, Singh H, Kumar Y, Prakash C. Evaluation and Analysis of Whole-Body Vibration Exposure during Soil Tillage Operation. Safety. 2021; 7(3):61. https://0-doi-org.brum.beds.ac.uk/10.3390/safety7030061
Chicago/Turabian StyleSingh, Amandeep, Siby Samuel, Harwinder Singh, Yash Kumar, and Chander Prakash. 2021. "Evaluation and Analysis of Whole-Body Vibration Exposure during Soil Tillage Operation" Safety 7, no. 3: 61. https://0-doi-org.brum.beds.ac.uk/10.3390/safety7030061
Note that from the first issue of 2016, this journal uses article numbers instead of page numbers. See further details here.