Article

Development and Characterization of Glimepiride Novel Solid Nanodispersion for Improving Its Oral Bioavailability

1
Department of Pharmaceutics, Faculty of Pharmacy, University of Tabuk, Tabuk 71491, Saudi Arabia
2
Department of Pharmaceutics, Faculty of Pharmacy, Sinai University, Alarish, North Sinai 45511, Egypt
3
Department of Pharmaceutics, Faculty of Pharmacy, Port Said University, Port Said 42526, Egypt
4
Department of Pharmaceutics, Faculty of Pharmacy, The British University in Egypt, El-Sherouk City, Cairo 11837, Egypt
5
The Center for Drug Research and Development (CDRD), Faculty of Pharmacy, The British University in Egypt, El-Sherouk City, Cairo 11837, Egypt
*
Author to whom correspondence should be addressed.
Submission received: 3 October 2020 / Revised: 27 October 2020 / Accepted: 27 October 2020 / Published: 2 November 2020

Abstract

:
Glimepiride is an antidiabetic drug which is one of the third generation sulfonylureas. It belongs to class II, according to the BCS (Biopharmaceutical Classification System), which is characterized by low solubility and high permeability. The aim of this work was to formulate glimepiride as solid dispersion using water-soluble carriers to enhance its aqueous solubility and thus enhance its bioavailability. Nine formulations of glimepiride solid dispersion were prepared by a solvent evaporation technique using three different carriers (mannitol, polyethylene glycol 6000, and β-cyclodextrin) with three different drug carrier ratio (1:1, 1:3, and 1:6). Formulation variables were optimized using 32 full factorial design. The prepared formulations were evaluated for production yield, drug content, micromeritic properties, thermal analysis, in-vitro release, and in-vivo hypoglycemic effect. All prepared formulations showed high production yield ranged from 98.4 ± 2.8 to 99.8 ± 2.2% and high drug content in the range of 97.2 ± 3.2 to 99.6 ± 2.1%. The micromeritic properties revealed that all prepared glimepiride formulations showed good flowability. The differential scanning calorimetry study revealed the presence of the drug in the more soluble amorphous form. In accordance with the results of in vitro release study, it was found that the solubility of glimepiride was increased by increasing the drug carrier ratio, compared with the pure form of the drug. It was found that F9 showed a high and rapid reduction in blood glucose levels in diabetic rats, which indicated the success of a solid dispersion technique in improving the solubility and hence the bioavailability of glimepiride.

1. Introduction

Type II diabetes mellitus, previously known as noninsulin-dependent diabetes or adult-onset diabetes, accounts for 90–95% of all diabetes cases [1]. It encompasses individuals who have relative insulin deficiency and have peripheral insulin resistance [2]. At least initially, and often throughout their lifetime, these individuals may not need insulin treatment to survive. Indeed, diabetes requires continuous medical care with multifactorial risk-reduction strategies beyond glycemic control [3]. Since 80% of people with diabetes are treated with oral hypoglycemic agents, it is very important to establish appropriate guidelines for their selection, formulation, and use [4]. An oral antidiabetic drug is a first-line treatment for Type II diabetes [5]. Glimepiride (GM) is one of the third generation sulfonylurea oral antidiabetic drugs used in the treatment of type II diabetes mellitus [6]. GM is characterized by high hypoglycemic efficacy and low systemic toxicity [7]. It belongs to class II drugs, according to the Biopharmaceutical Classification System (BCS), characterized by low solubility and high permeability [8]. The poor water solubility of GM leads to difficultly in preparation for good oral pharmaceutical preparation, poor dissolution profile, and low bioavailability [9]. The rate and extent of oral absorption of such poor water-soluble drugs are controlled by the dissolution rate in the fluids of the gastrointestinal tract [10]. So, the present study aimed to enhance the water solubility of GM to increase the dissolution rate and hence the oral bioavailability. A lot of techniques are available to enhance the solubility of poorly water-soluble drugs [11]. These techniques include using prodrug [12], salt formation [13], crystal engineering of the drug [14], solid dispersion method using water-soluble polymer [15,16]. Solid dispersion is a well-established technique used in enhancing the aqueous solubility of poorly water-soluble drugs [17]. In this technique, the poorly water-soluble drugs are dispersed though out a water-soluble carrier such as urea, mannitol, polyethylene glycol, polyvinyl pyrrolidone, β-cyclodextrin, lactose, and hydroxyl propyl methyl cellulose [18]. The process of solid dispersion is done by melting, solvent evaporation, and spray drying methods [8,19]. Wagh et al. prepared glimepiride solid dispersion by kneading method using both poloxamer 188 and poloxamer 407 as a water-soluble polymer for improving the water solubility of GM [8]. Ning et al. prepared solid dispersion of GM by solvent evaporation technique using PVPk30 as a water-soluble carrier for enhancement of water solubility [9]. Mehta et al. prepared GM solid dispersion by solvent evaporation method using PREG6000 as a water-soluble carrier for improving oral absorption and hence the antidiabetic effect [20].
The aim of this study is to formulate GM in the form of solid dispersion to enhance its solubility and hence the dissolution rate and its oral bioavailability. The formulations of GM solid dispersion were prepared by the solvent evaporation technique using three different carriers (mannitol, polyethylene glycol (PEG) 6000, and β-cyclodextrin) with three different drug carrier ratio (1:1, 1:3, and 1:6) and optimized using 32 full factorial design. The selection of mannitol, PEG 6000, and beta-cyclodextrin was based on the results of previously published papers, which concluded that those carriers were effective for the enhancement of solubility of poorly water-soluble drugs. The prepared formulation was evaluated for the production yield, drug content, micromeritic properties, thermal analysis, and in-vitro release study to select the optimized formulation. The optimized formulation was evaluated in streptozotocin-diabetic mice for its hypoglycemic effect in comparison with the free form of GM.

2. Materials and Methods

2.1. The Materials

GM was obtained from Tabuk pharmaceutical Company (Tabuk, Saudi Arabia); PEG 6000 and β-cyclodextrin were purchased from Oxford Laboratory Chemicals (Mumbai, India). Mannitol and methanol were purchased from Sigma Aldrich Sigma Chemical Co (St. Louis, MO, USA. Other chemicals were of analytical grade and were used without further modifications. Double-distilled deionized water was used for the experiments.

2.2. The Methods

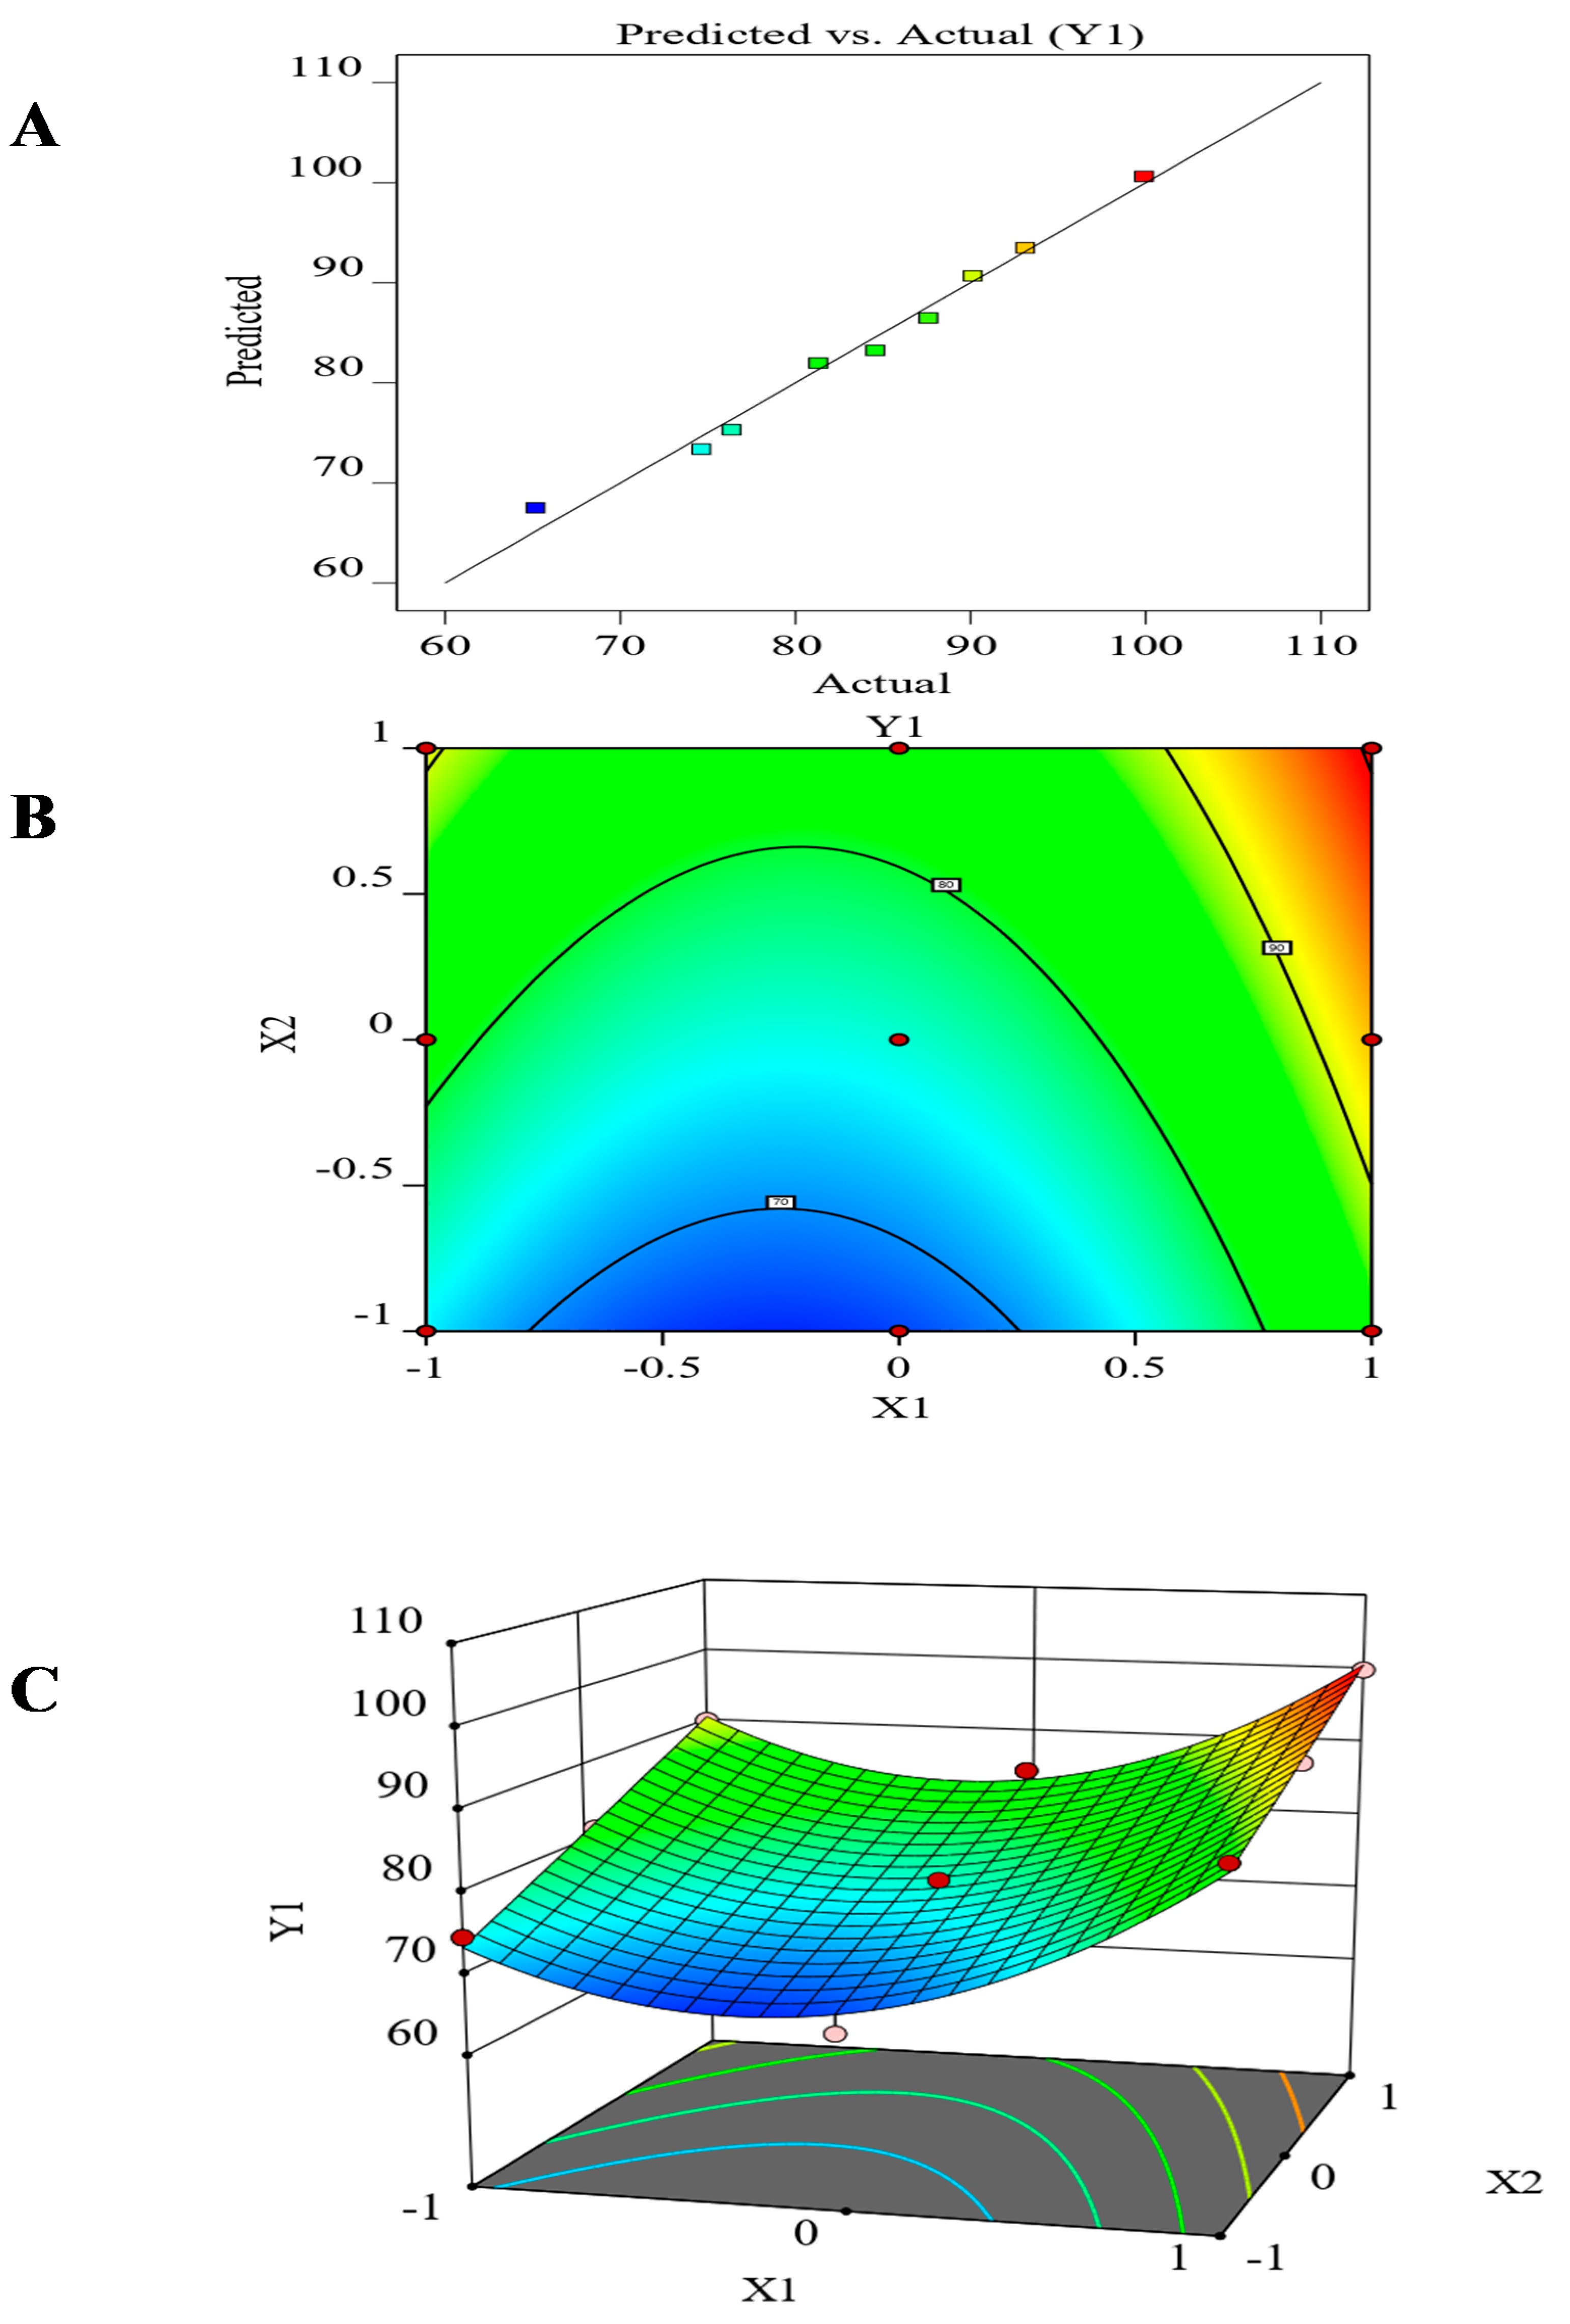
2.2.1. The Experimental Design

A (32) full factorial design was used to formulate nine formulations of GM solid dispersion (F1–F9) using the design expert software program, version 12. The factorial design was employed to study the effect of two independent variables (X1, and X2), each with three levels (+1, 0, and −1) on the dependent variable (Y1). The independent variables were the type of carrier (X1), drug carrier ratio (X2), while the dependent variable was the percentage of drug released after 1 hr (Y1). The dependent and independent variables are represented in Table 1.

2.2.2. The Preparation of GM Solid Dispersion

The solid dispersion of GM was prepared by a solvent evaporation technique [21]. The weighed amounts of GM and the carriers were dissolved in 10 mL of methanol in a round-bottomed flask. The solvent was allowed to evaporate using a Heidolph rotavap (Schwabach, Germany), rotated at 100 rpm at 25 ± 1 °C under 600 mmHg pressure until it is completely dry. Methanol was evaporated, leaving the solid dispersion of GM on the wall of a round-bottomed flask [22]. The prepared GM solid dispersions were collected and further dried in an oven at 40 °C for 24 h, then ground and kept in a desiccator over silica at 60% relative humidity at room temperature for further studies. The composition of the nine formulations of GM solid dispersion is represented in Table 2.

2.2.3. The Production Yield of GM Solid Dispersion

The production yield of all prepared formulations of GM solid dispersion was estimated by the following equation [23]:
The   production   yield   % =   weight   of   the   collected   solid   dispersion Total   weight   of   drug   and   carrier   used   × 100

2.2.4. The Drug Content Uniformity of GM Solid Dispersion

The drug content for all GM solid dispersion was calculated by dissolving an accurate weight of each formulation equivalent to 5 mg of GM in methanol. The methanolic solution of each formulation was subjected to analysis using a UV spectrophotometer (Shimadzu, Kyoto, Japan) at 228 nm after appropriate dilution [17]. The drug content for all formulation was measured through the following equation [24]:
The   drug   content   % = the   actual   drug   content the   theoretical   drug   content   × 100

2.2.5. The Determination of Micromeritic Properties of GM Solid Dispersion Powders

The flow properties of solid dispersion are important in the pharmaceutical industry, especially in the blending of powders, compression of tablets, and the filling of capsules. Several parameters were used to measure the flow properties of the prepared solid dispersion, such as the bulk density, the tapped density, the angle of repose, Carr’s index, and Hausner’s ratio.

The Bulk Density

The bulk density of GM solid dispersion formulations was determined by transferring an accurate weight of each formulation (10 g) to a graduated cylindrical measure [25]. The volume of solid dispersion was noted in the cylinder measure without any compacting, and the bulk density was calculated by the following equation [25,26]:
Bulk   density   =   Weight   of   powder / Bulk   volume

The Tapped Density

The tapped density of GM solid dispersion was determined by transferring an accurate weight of each formulation (10 g) to a graduated cylindrical measure [27]. The cylinder was tapped until no further change in volume. The tapped density was calculated by the following equation [28]:
Tapped   density   = weight   of   powder / Tapped   volume

Hausner’s Ratio

Hausner’s ratio of GM solid dispersion was determined to determine the flowability of the formulations [10]. Hausner’s ratio was calculated by the following equation [29,30]:
Hausner   ratio   = Tapped   density / Bulk   density

Carr’s Index

Carr’s index is another parameter used to predict the flowability of powder [31]. Carr’s index of the prepared GM solid dispersion was calculated by the following equation [32]:
Carr   s   index   = Tapped   density Bulk   density Tapped   density   ×   100

The Angle of Repose

The angle of repose (θ) of GM solid dispersion powders was estimated using the fixed funnel method. An accurate weight of GM solid dispersion was allowed to pass through a fixed funnel adjusted to 1 cm above the horizontal plane. The passed powder was allowed to form a pile where the apex of the pile was contacted to the end of the funnel [33]. The diameter of the pile was measured, and the angle of repose was calculated by the following equation [34]
tan   θ = h / r
where h is the height of the pile, and r is the radius of the pile base.

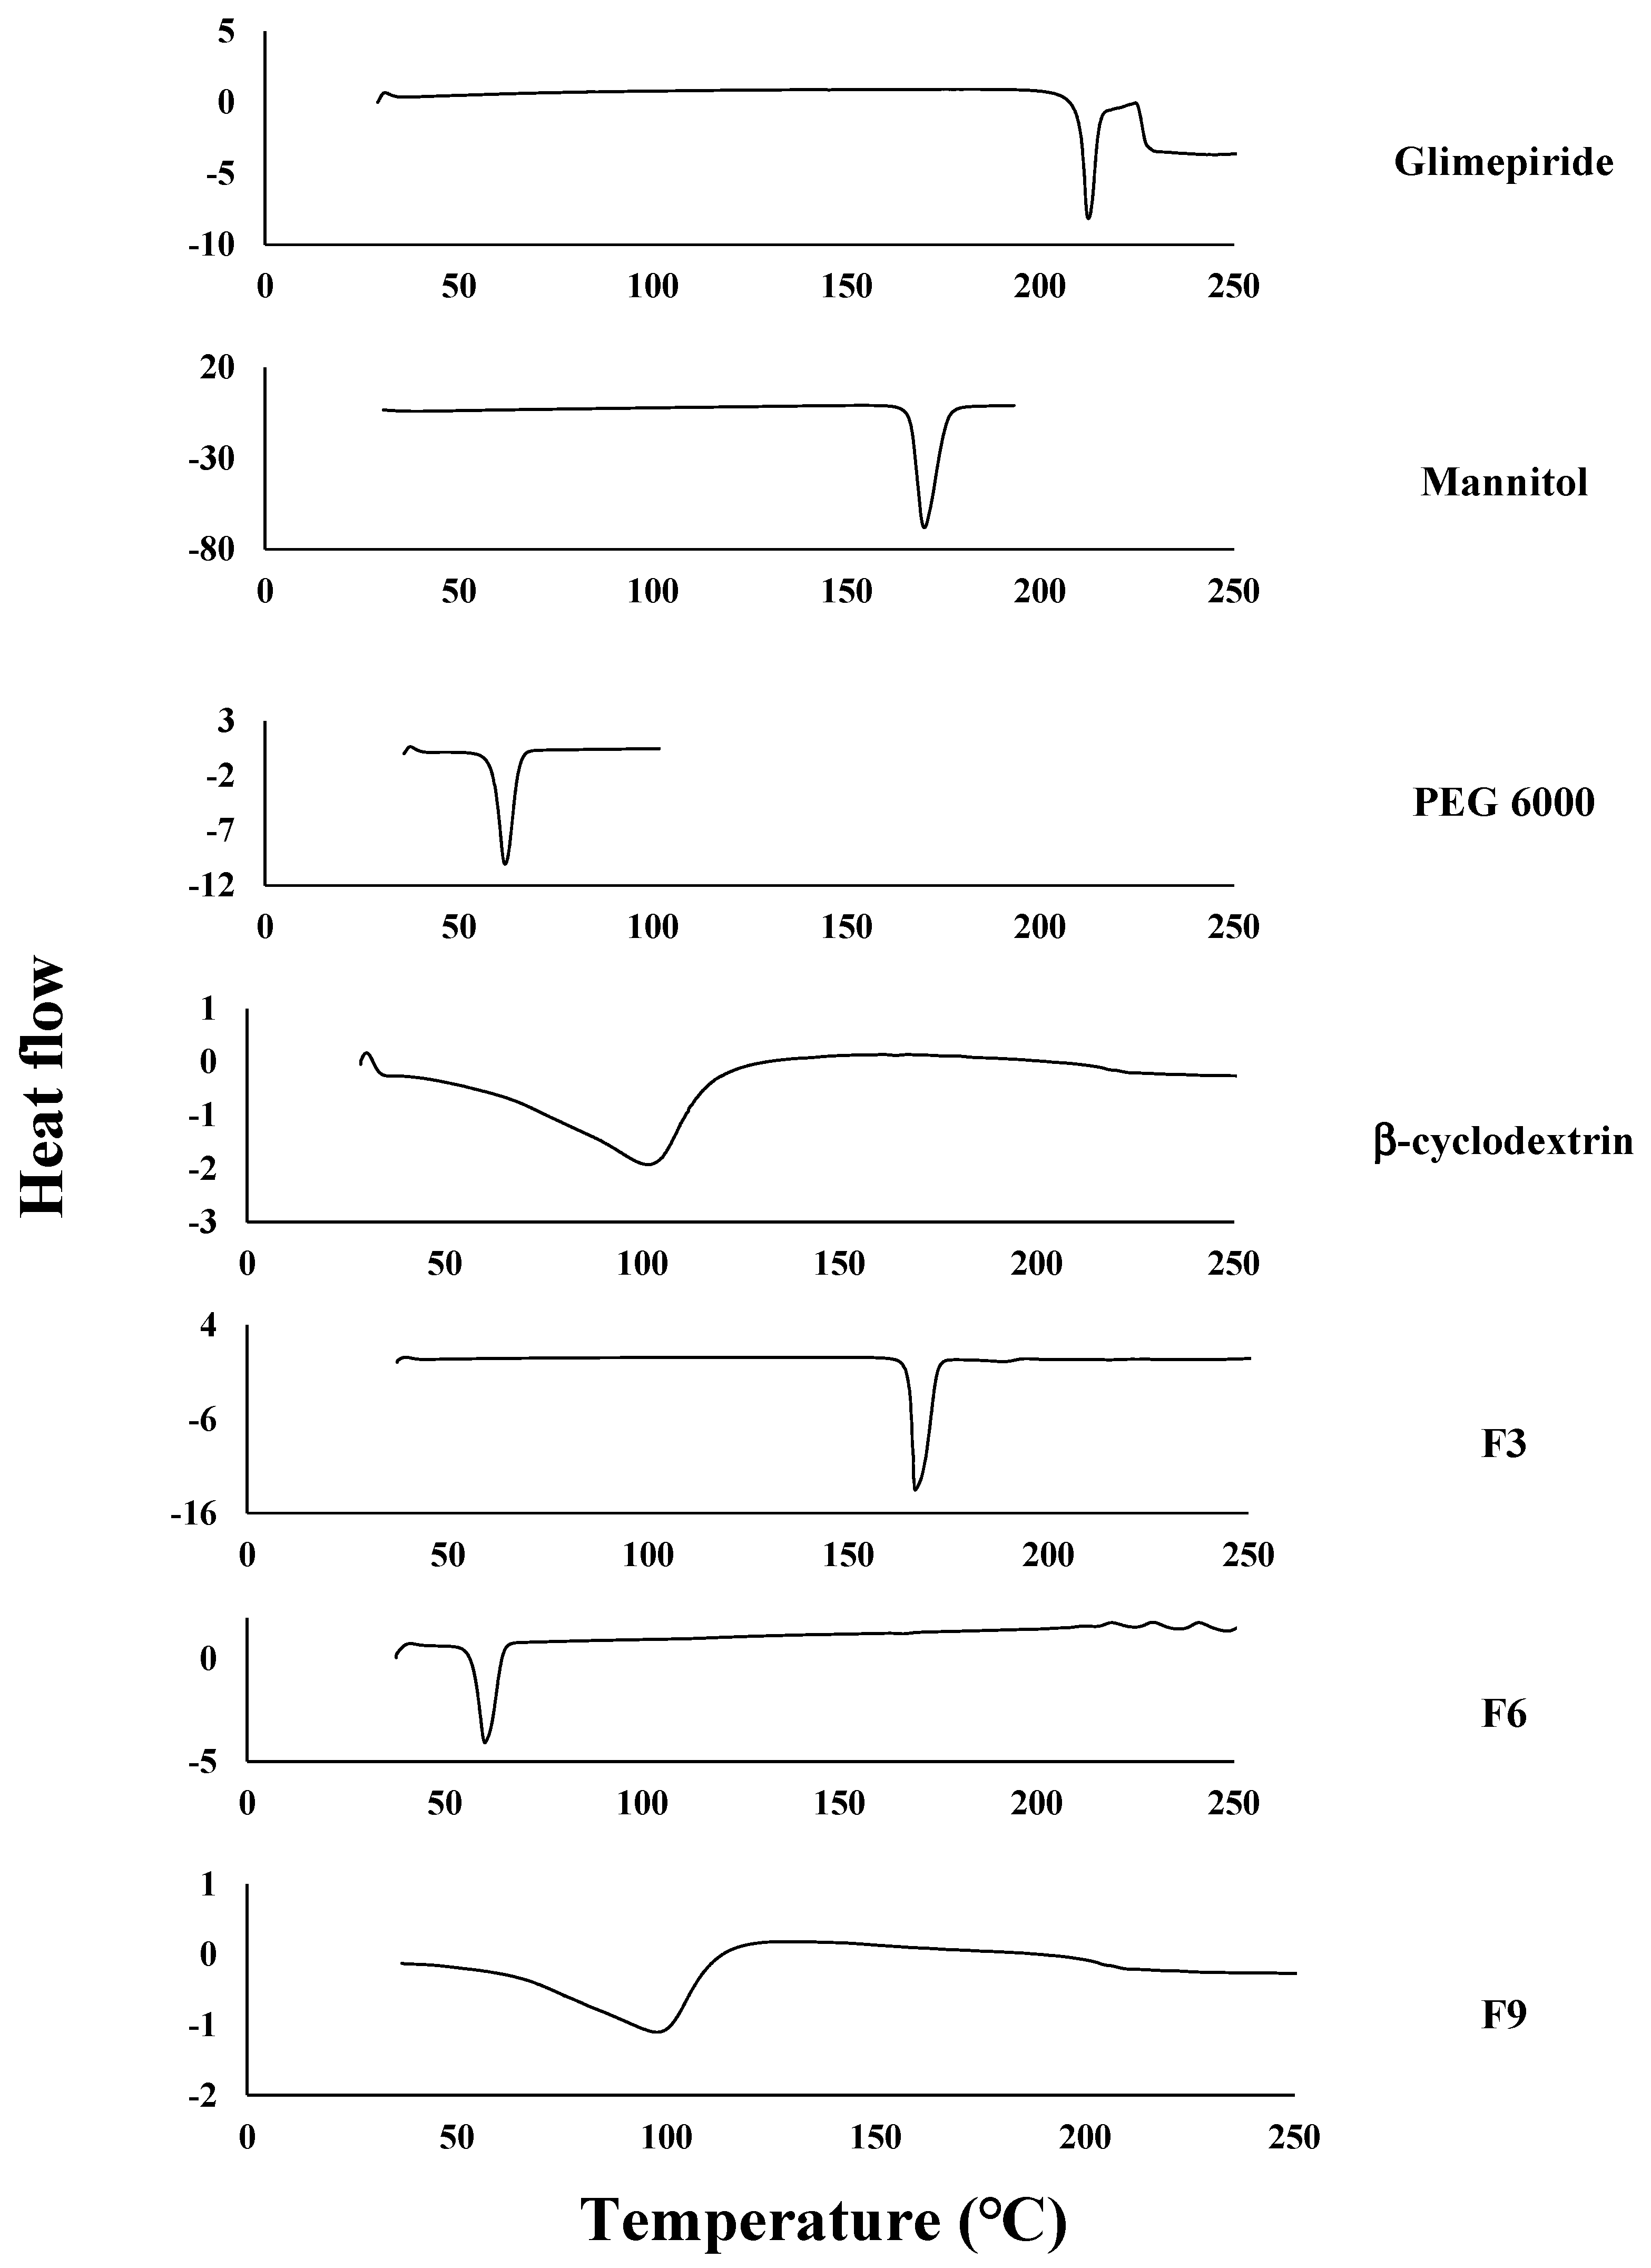
2.2.6. The Differential Scanning Calorimetry (DSC)

The thermal behavior of the pure GM powder, different carriers used (Mannitol, PEG 6000, and β-cyclodextrin), and the best three formulations: F3, F6, and F9 were determined using a differential scanning calorimeter (Shimadzu, Japan). The selected formulation F3, F6, and F9 were prepared using different carriers; Mannitol, PEG 6000, and β-cyclodextrin, respectively. These formulations were selected based on the highest drug: carrier ratio because it is expected that if there is any interaction between the drug and the carrier, it will be greater in case of a higher ratio. The measurements were done over a temperature range from 0–300 °C under nitrogen purge at 30 mL/min and a scanning rate of 10 °C/min [35,36]. The reference material used in the analysis was pure Indium (In).

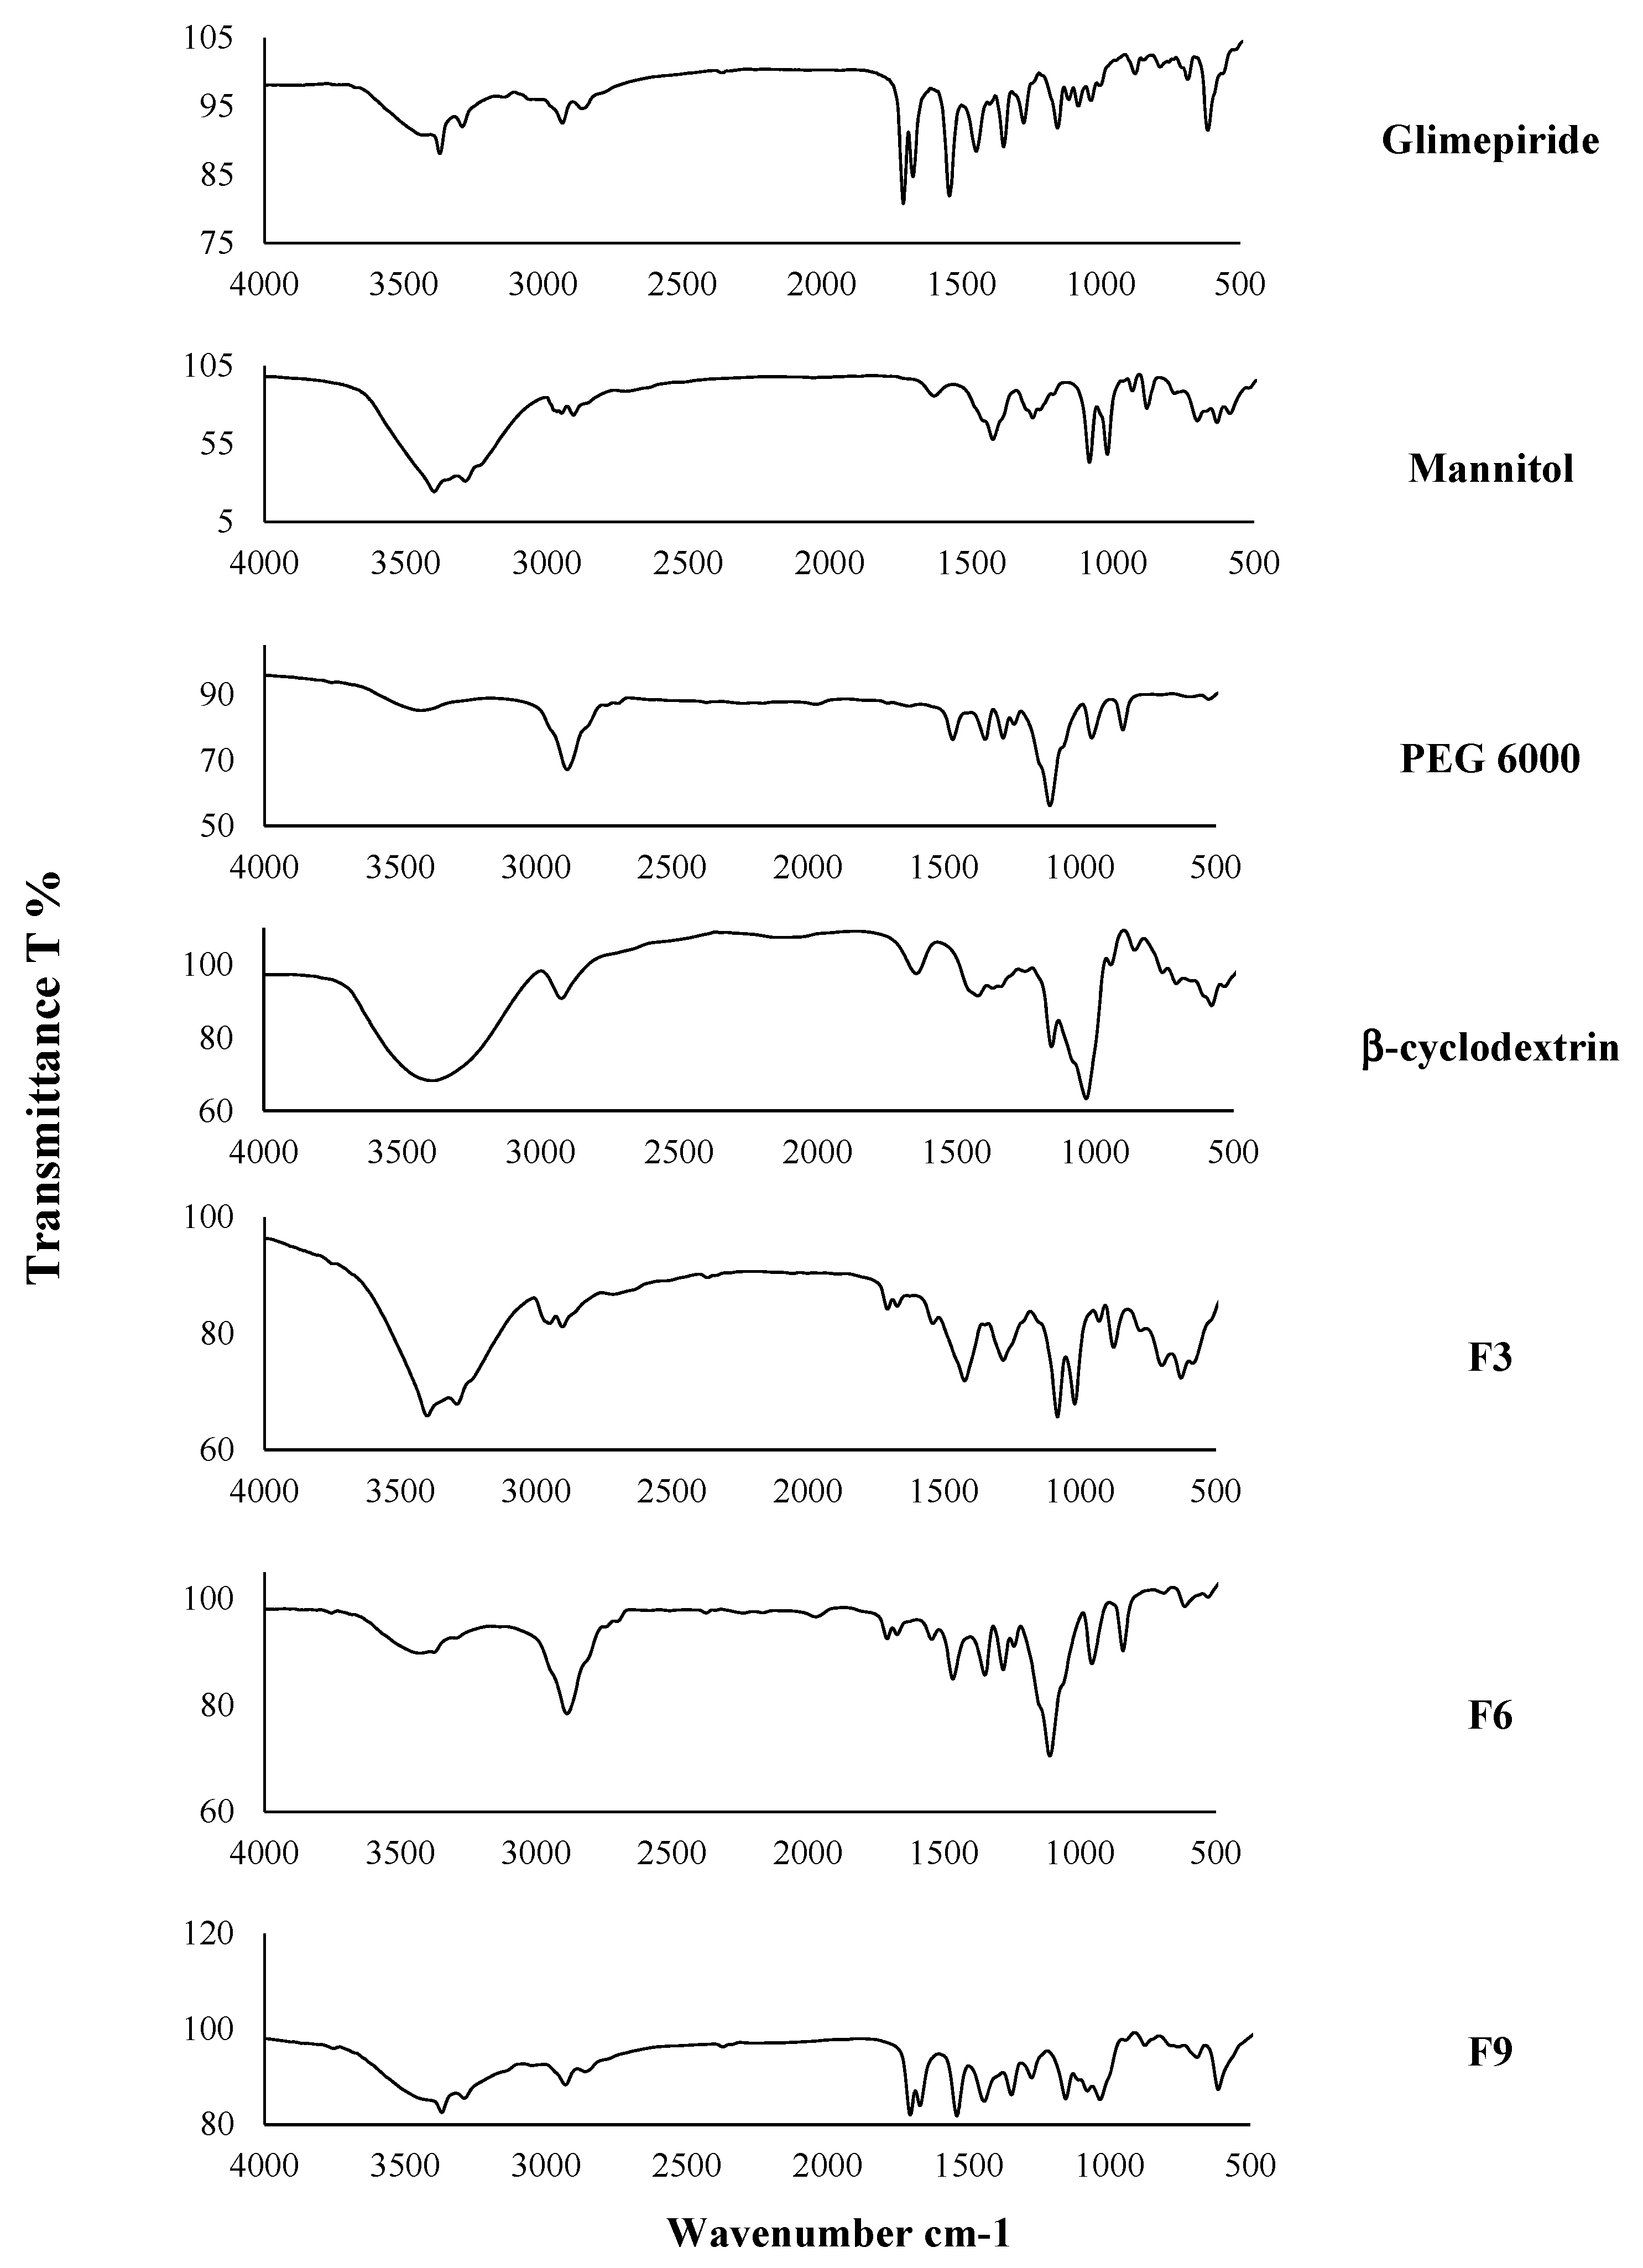
2.2.7. The Infrared Spectroscopy Analysis (IR)

The infrared spectroscopy of the pure GM and carriers (Mannitol, PEG 6000, and β-cyclodextrin), F3, F6, and F9 was determined by subjecting the samples to Fourier-Transform Infrared Spectroscopy (FT-IR) using Shimadzu 435 U-O4 IR spectrometer (Tokyo, Japan). The infrared spectroscopy was conducted to ensure the compatibility between the formulation ingredients used in the preparation of GM solid dispersion. Each sample was mixed with potassium bromide and mechanically compressed into a disc [37]. The infrared spectroscopy was measured for the disc of each sample over a wavelength scanning range of 4000 cm−1 to 400 cm−1 [38].

2.2.8. The In-Vitro Release Study of GM from Solid Dispersion

The dissolution study of GM from the prepared solid dispersion was done using an ERWEKA dissolution tester, apparatus II (Erweka, Heusenstamm, Germany). An accurate weight of GM (2 mg) and each solid dispersion formulation equivalent to 2 mg of GM was placed in 900 mL of phosphate buffer (pH 6.8) [39]. The dissolution medium was kept at a temperature of 37 ± 1 °C and a speed of 100 rpm. The samples were withdrawn at different time intervals (5, 10, 15, 20, 25, 30, 45, and 60 min) and replaced with an equivalent volume of fresh medium [40]. The withdrawn samples were filtered and analyzed spectrophotometrically using UV spectrophotometer at 228 nm [41]. The experiment was done in triplicates, and the mean and the standard deviation were measured [40]. The percentage of GM released was plotted against the time, and the data of drug release was kinetically treated to determine the best mechanism of drug release [17].

2.2.9. The Selection of Optimized Formulation of GM Solid Dispersion

The formulation ingredients were optimized to determine the optimum level of X1 and X2, which achieve the highest value of Y1 [35].

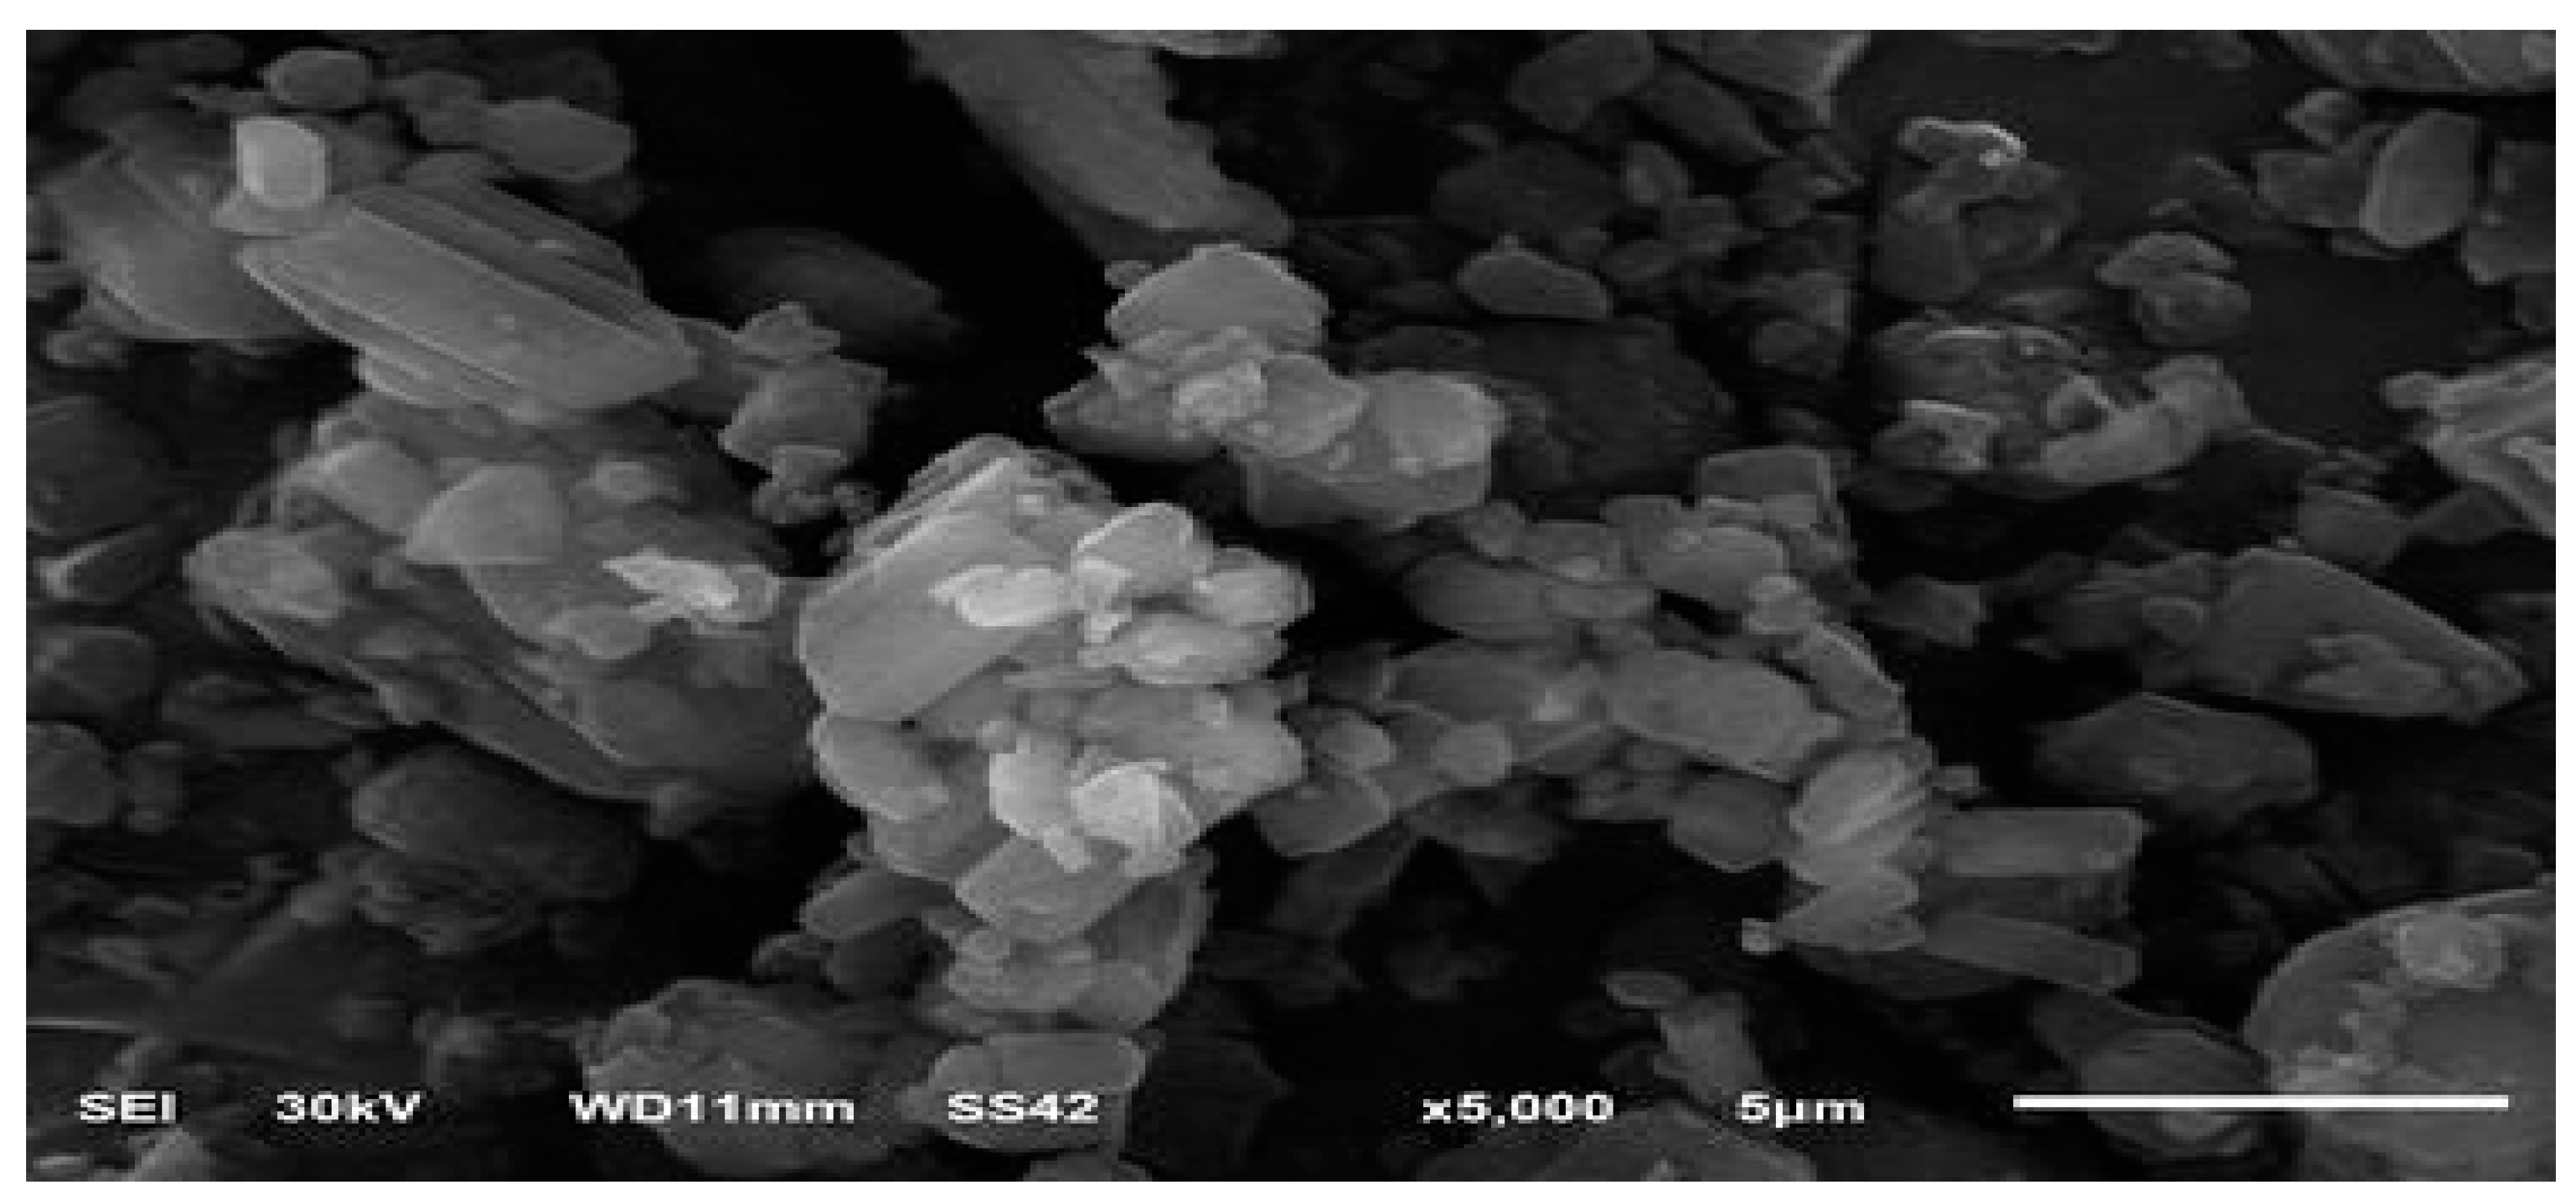
2.2.10. The scanning Electron Microscopy of the Optimized Formulation (SEM)

The morphology of the optimized formulation of GM solid dispersion was carried out using a scanning electron microscope (JEOL, Tokyo, Japan) [42]. A dried sample of optimized formulation was spread and adhered to aluminum stub and coated with a thin layer of platinum. The image was taken by SEM at 30 Kv.

2.2.11. The Pharmacological Evaluation of the Antidiabetic Effect of GM Solid Dispersion

Male Wister rats (150–180 g) were obtained from the modern veterinary office for laboratory animals (Cairo, Egypt). Groups of six rats were housed and kept under standard laboratory conditions, with the temperature at 25 ± 1 °C and relative humidity (55 ± 5%). The animals were housed in polypropylene cages, six per cage. All experimental protocols were approved by the Research Ethics Committee at the Faculty of Pharmacy, the British University in Egypt (No. EX-2006, Date 8 July 2020).
All animals were subjected to intraperitoneal injection with 50 mg⁄kg streptozotocin (STZ). The blood glucose level was measured for all rats after 72 h of injection. Rats that completed the in vivo study were selected based on the blood glucose level (>250 mg/dL) [43]. The diabetic rats were divided into three groups, each of six rats, as follows:
Group I: control group treated with oral saline.
Group II: a diabetic group treated with free GM (0.1 mg/kg; per oral).
Group III: a diabetic group treated with F9 (0.1 mg/kg; per oral).
After receiving the previous treatments, blood samples were collected from the tail vein at the end of each hour for 8 h. The collected blood samples were analyzed for the blood glucose level using a commercial glucose kit.

2.2.12. The Statistical Analysis

The results of the in vivo study were subjected to statistical analysis using one-way ANOVA followed by Bonferroni’s post-hoc analysis. The difference was considered significant at p values < 0.05.

3. Results and Discussion

Nine formulations of GM solid dispersion were designed by 32 multilevel factorial design using design expert software version 12. The factorial design was used to determine the effect of formulation variables on the dissolution profile of GM.

3.1. The Production Yield % (PY%)

Nine formulations of GM solid dispersion were successfully prepared by a solvent evaporation technique with high production yield % ranged from 98.4 ± 2.8% to 99.8 ± 2.2%, as shown in Table 3. The results were in full agreement with Sahoo et al., who have found that the production yield % of GM solid dispersion ranged between 96.5 ± 2.1% and 99.4 ± 1.2% [22].

3.2. The Drug Content %(DC%)

As represented in Table 3, the drug content for all formulation of GM solid dispersion was calculated, and it was found in the range of 96.8 ± 2.9–99.6 ± 2.1%. The high value of drug content indicated that the choice of the carriers and the method of preparation were reproducible. These results were in accordance with Sahoo et al., who prepared the GM solid dispersion using PEG 6000, PEG 10000, and Gelucire 44/14 and found that the drug content was in the range of 97.5 ± 1.2–99.5 ± 0.9% [22].

3.3. The Micromeritics Properties of GM Solid Dispersion

3.3.1. The Bulk and Tapped Density

The flow properties of the solid dispersion were investigated by measuring the bulk density and tapped density. The results of bulk and tapped density were represented in Table 4. It was found that the results of bulk and tapped density were in the range of 0.37 ± 0.05–0.54 ± 0.03 g/cm3 and 0.43 ± 0.03–0.61 ± 0.02 g/cm3, respectively. These results were in agreement with Chavan et al., who prepared nisoldipine solid dispersion using a solvent evaporation technique [44].

3.3.2. Hausner’s Ratio

The value of Hausner’s ratio was found to give an indication of the flow properties of solid dispersion. The values <1.25 indicate better flowability than values >1.25 [44]. As represented in Table 4, Hausner’s ratio of all prepared GM solid dispersion formulations was in the range of 1.11 ± 0.01 to 1.22 ± 0.02, which indicated good flowability [45].

3.3.3. Carr’s Index (the Compressibility %)

There is an inverse relationship between the compressibility percentage and the flowability of the solid dispersion [46]. As Carr’s index increased, the flowability decreased. The values from 5 to 12 indicate excellent flowability; the values from 12 to 16 exhibit good flowability; the values between 18 and 21 show fair passable flowability; the values ranged from 23 to 35 exhibit poor flowability; while the values between 33 and 38 exhibit very poor flowability [23].
For all prepared GM solid dispersion formulations, the value of Carr’s index was in the range of 9.80 ± 0.54–18.18 ± 0.47%, which indicated a good flowability as represented in Table 4. The results were in full agreement with Malviya et al., who prepared paracetamol solid dispersion [47].

3.3.4. Angle of Repose

The flowability of the solid dispersion was found to be affected by the angle of repose [48,49]. Excellent flowability was achieved when the angle of repose was less than 20°. A value of 20–30° indicates good flowability, the values between 30° and 34° exhibit passable flowability, and the values more than 34° show very poor flowability [50]. From the results represented in Table 4, it was found that all prepared GM solid dispersion exhibited angle of repose in the range of 14.26–23.44° which indicated a good flowability.

3.4. The Differential Scanning Calorimetry (DSC)

The differential scanning calorimetry (DSC) thermograms of pure GM, Mannitol, PEG 6000, β-cyclodextrin, F3, F6, and F9 were illustrated in Figure 1. It was found that the DSC thermogram of GM showed a single endothermic peak at 212.44 °C. Chaudhari et al. found that a DSC thermogram of GM showed an endothermic peak at 213 °C [21]. The DSC thermograms of Mannitol, PEG 6000, and β-cyclodextrin showed endothermic peaks at 170.16 °C, 61.96 °C, and 101.53 °C respectively. These results were in agreement with Zaini et al., who reported that Mannitol had an endothermic peak at 166.35 °C [51], Febriyenti et al. prepared Gliclazide solid dispersion systems using PEG 6000 by a solvent method and found that the DSC thermogram of PEG 6000 showed an endothermic peak at 65.14 °C [52], and Arora et al. prepared atorvastatin inclusion complex using beta-cyclodextrin and found that the DSC thermogram of beta-cyclodextrin showed a broad endothermic peak at 101.41 °C [53].
The DSC thermogram of F3, which was prepared by mannitol, showed a single endothermic peak at 166.78 °C with an absence of a GM peak. The DSC thermogram of F6, which was prepared by PEG 6000, showed a single endothermic peak at 60.23 °C with an absence of a GM peak. The DSC thermogram of F9 showed an endothermic peak at 97.73 °C with an absence of a GM peak. The disappearance of the peak of GM from the thermograms of F3, F6, and F9 showed that the drug was present in a more soluble amorphous form. These results were in full agreement with Pathak and Kaushik, who prepared a GM solid dispersion for enhancing the solubility using PEG 6000 and observed the disappearance of the endothermic peak of GM in the DSC thermogram of the prepared solid dispersion [54].

3.5. The Infrared Spectroscopy (IR)

The infrared spectra of pure GM, Mannitol, PEG 6000, β-cyclodextrin, F3, F6, and F9 were illustrated in Figure 2. The IR spectrum of GM showed characteristic N-H stretch peaks of urea at t 3370 and 3289 cm−1, peaks at 1707 and 1674 cm−1 corresponding to the carbonyl group, and peaks at 1348 and 1155 cm−1 related to the sulfonamide group. The IR spectrum of Mannitol was characterized by a peak at 3399 cm1 due to O-H stretching, a peak at 2949 cm1 due to C-H stretching, and peaks at 1082 cm1 and 1019 cm1 due to C-O stretching [55]. The IR spectrum of PEG 6000 is characterized by 3423 cm1 due to stretching O-H, peak at 2886 cm1 due to C-H stretching, and peak at 1109 cm1 due to C-O stretching [56]. The spectra of β-cyclodextrin was characterized by a broad peak due to stretching O-H at 3398 cm1, peak at 2925 cm1 due to stretching C–H., peak at 1644 cm1 due to H–O–H. while peaks at 1157 and 1030 cm1 due to vibrations of the asymmetric C–O–C and symmetric C–O–C, respectively [57].
The IR spectrum of F3, F6, and F9 showed all characteristic peaks of GM, which revealed the absence of any physical or chemical interaction between the drug and the used carriers [21]. These results were in agreement with Kiran et al., who prepared GM solid dispersion [58].

3.6. The In-Vitro Release Study of GM From Solid Dispersion

From the results of the in-vitro release, as shown in Figure 3, it was found that the release for all formulations ranged from 65.17 ± 1.64 for F4 to 99.9 ± 2.56% for F9. Also, the release from all formulation was significantly higher than the release of free drug, which indicates that the solid dispersion technique has the ability to enhance the dissolution rate of the GM. This may be attributed to the conversion of the drug into the more soluble amorphous state, and decreasing the interfacial tension between GM and the dissolution medium resulted in enhancing the wettability and the dissolution of the drug [59].

3.7. The Effect of the Formulation Factors in the In-Vitro Release (Y1)

To study the effect of independent formulation variables (X1, and X2) on the in vitro release of prepared GM solid dispersion, a multiple linear regression analysis was done using the Y1 equation:
Y 1 = + 75.31 +   5.76   X 1 +   7.87   X 2     0.795   X 1 X 2   +   12.42   X 21   +   0.0683   X 22
As shown in Figure 4, it was found that the release changed according to the type of carrier (β-cyclodextrin > Mannitol > PEG 6000). These results may be attributed to the difference in the hydrophilic effect of the carriers. Also, the release increased for each carrier by increasing the drug-carrier ratio from 1:1 to 1:6, which may be attributed to the increased wettability and surface area as the percentage of water-soluble carriers increased [59,60]. The ANOVA analysis of in-vitro drug release results, as represented in Table 5, revealed that the type of carrier (X1) and the drug: carrier ratio (X2) had a significant effect on (Y1) (p < 0.05).

In Vitro Drug Release Kinetics

The kinetic release study was done for all GM solid dispersions to determine the release behavior. The release data were analyzed with zero-order, first-order, second-order, and Higuchi diffusion models. As represented in Table 6, it was found that all release data fit first-order kinetics. These results were found to be in agreement with those obtained by Mamatha et al., who found that the release of nevirapine from prepared solid dispersion was fitted to first-order kinetics [61]. Also, Pagadala et al. found that the release of GM from prepared solid dispersion was fitted to first-order kinetics [62].

3.8. The Selection of Optimized Formulation of GM Solid Dispersion

The independent variables were optimized using Design Expert software (version 12) to determine the optimized formulation. The optimized formula was selected based on the highest drug release (Q1hr), which achieved the highest drug release. From the results, F9 was selected as the optimized formulation.

3.9. The Scanning Electron Microscopy of the Optimized Formulation (SEM)

The surface morphology of the optimized GM solid dispersion was shown in Figure 5. It was found that the optimized formulation appeared as irregular particles, which may give an indication of the dispersion of GM on the carriers in an amorphous state.

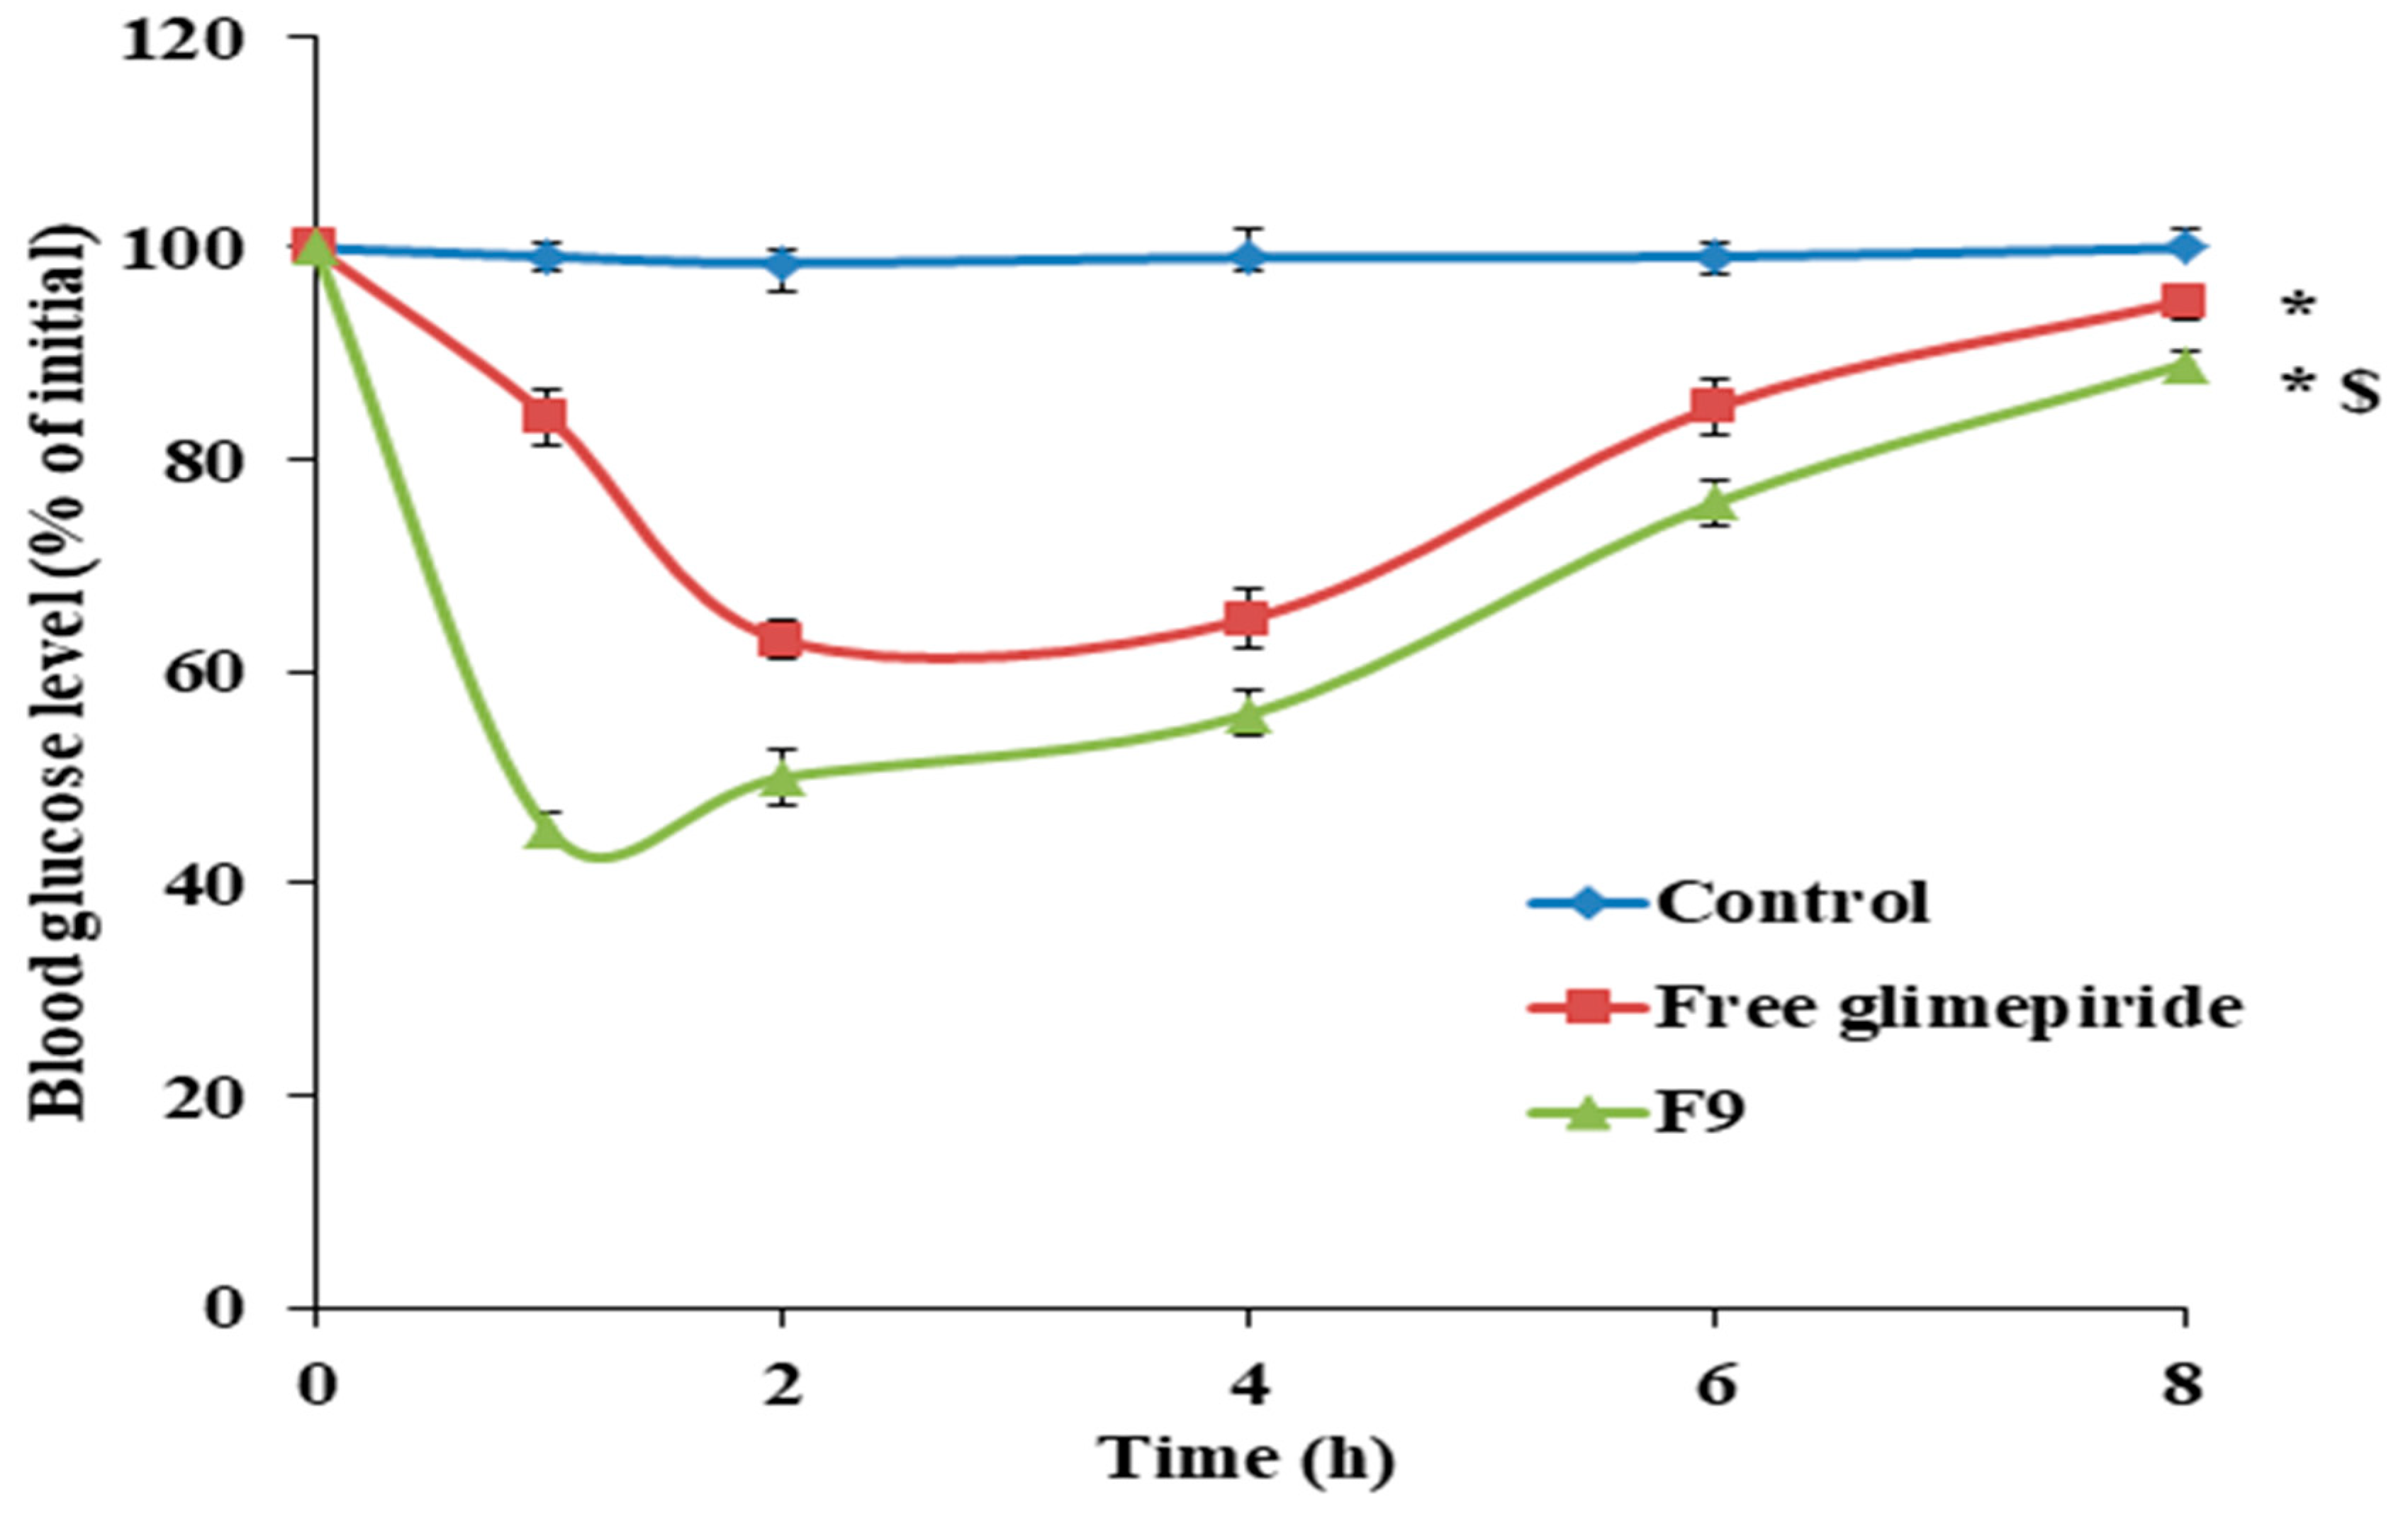
3.10. Antidiabetic Effect of GM Solid Dispersion

The antidiabetic effect of F9 was studied in comparison with free GM in STZ (Streptozotocin) diabetic rats. As shown in Figure 6, it was found that F9 showed a high and rapid reduction in blood glucose levels in diabetic rats, which indicated the success of the solid dispersion technique in improving the solubility and hence the bioavailability of GM. It was found that F9 showed a reduction in blood glucose levels to 45 ± 2.65% of the initial value after 1 h, while the free GM showed a reduction in blood glucose level to 63 ± 3.21% of the initial value after 2 h. These results may be attributed to the enhanced solubility of GM after preparation as solid dispersion using hydrophilic carriers and the presence of GM in a more soluble amorphous from. The results were in full agreement with Li et al., who prepared GM microemulsion for improving its solubility and bioavailability [63].

4. Conclusions

The solid dispersion technique was found to be useful in improving the dissolution rate of GM. The type, nature, and the ratio of the carrier used played an important role in the enhancement of the dissolution rate and hence the bioavailability of GM. It was concluded that all prepared formulations have high production yield ranged from 98.4 ± 2.8% to 99.8 ± 2.2% and high drug content in the range of 97.2 ± 3.2% to 99.6 ± 2.1%. The micromeritic properties of all prepared GM formulations showed a high flowability. The authors concluded that the used carriers were arranged according to the enhancement of solubility as follows: β-cyclodextrin > Mannitol > PEG 6000. Also, increasing the drug-carrier ratio from 1:1 to 1:6 caused an increase in the rate of GM release. The formulation of GM as a solid dispersion formulation is a potential way to improve its solubility and enhance its hypoglycemic effect.

Author Contributions

Conceptualization, M.Q., A.N., S.S., and Y.M.; methodology, M.Q., A.N., S.S., and Y.M.; software, M.Q., A.N., S.S., and Y.M.; validation, M.Q., A.N., S.S., and Y.M.; formal analysis, M.Q., A.N., S.S., and Y.M; investigation, M.Q., A.N., S.S., and Y.M.; resources, M.Q., A.N., S.S., and Y.M.; data curation, M.Q., A.N., S.S., and Y.M.; writing — original draft preparation, M.Q., A.N., S.S., and Y.M.; writing — review and editing, M.Q., A.N., S.S., and Y.M.; visualization, M.Q., A.N., S.S., and Y.M.; supervision, M.Q.; project administration, M.Q., A.N., S.S., and Y.M.; All authors have read and agreed to the published version of the manuscript.

Funding

No source of funding.

Acknowledgments

Authors wish to thank Tabuk Pharmaceutical Company (Tabuk, Saudi Arabia) for kindly providing glimepiride.

Conflicts of Interest

The authors declare no conflict of interest.

References

  1. Association, A.D. 2. Classification and diagnosis of diabetes: Standards of medical care in diabetes—2018. Diabetes Care 2018, 41, S13–S27. [Google Scholar] [CrossRef] [Green Version]
  2. Association, A.D. Diagnosis and classification of diabetes mellitus. Diabetes Care 2014, 37, S81–S90. [Google Scholar] [CrossRef] [PubMed] [Green Version]
  3. Inzucchi, S.E.; Bergenstal, R.M.; Buse, J.B.; Diamant, M.; Ferrannini, E.; Nauck, M.; Peters, A.L.; Tsapas, A.; Wender, R.; Matthews, D.R. Management of hyperglycaemia in type 2 diabetes: A patient-centered approach. Position statement of the American Diabetes Association (ADA) and the European Association for the Study of Diabetes (EASD). Diabetologia 2012, 55, 1577–1596. [Google Scholar] [CrossRef]
  4. Tanabe, M.; Motonaga, R.; Terawaki, Y.; Nomiyama, T.; Yanase, T. Prescription of oral hypoglycemic agents for patients with type 2 diabetes mellitus: A retrospective cohort study using a Japanese hospital database. J. Diabetes Investig. 2016, 8, 227–234. [Google Scholar] [CrossRef]
  5. Simpson, S.H.; Majumdar, S.R.; Tsuyuki, R.T.; Eurich, D.T.; Johnson, J.A. Dose–response relation between sulfonylurea drugs and mortality in type 2 diabetes mellitus: A population-based cohort study. Can. Med Assoc. J. 2006, 174, 169–174. [Google Scholar] [CrossRef] [Green Version]
  6. González-Ortiz, M.; Guerrero-Romero, J.F.; Violante-Ortiz, R.; Wacher-Rodarte, N.; Martínez-Abundis, E.; Aguilar-Salinas, C.; Islas-Andrade, S.; Arechavaleta-Granell, R.; González-Canudas, J.; Rodríguez-Morán, M.; et al. Efficacy of glimepiride/metformin combination versus glibenclamide/metformin in patients with uncontrolled type 2 diabetes mellitus. J. Diabetes Complicat. 2009, 23, 376–379. [Google Scholar] [CrossRef] [PubMed]
  7. Gill, B.; Kaur, T.; Kumar, S.; Gupta, G.D. Formulation and evaluation of glimepiride solid dispersion tablets. Asian J. Pharm. 2010, 4, 112–118. [Google Scholar] [CrossRef]
  8. Wagh, V.T.; Jagtap, V.A.; Shaikh, T.J.; Nandedkar, S.Y. Formulation and evaluation of glimepiride solid dispersion tablets for their solubility enhancement. J. Adv. Sci. Res. 2012, 3, 36–41. [Google Scholar]
  9. Ning, X.; Sun, J.; Han, X.; Wu, Y.; Yan, Z.; Han, J.; He, Z. Strategies to improve dissolution and oral absorption of glimepiride tablets: Solid dispersion versus micronization techniques. Drug Dev. Ind. Pharm. 2011, 37, 727–736. [Google Scholar] [CrossRef]
  10. Sharma, M.; Sharma, R.; Jain, D.K.; Saraf, A. Enhancement of oral bioavailability of poorly water soluble carvedilol by chitosan nanoparticles: Optimization and pharmacokinetic study. Int. J. Biol. Macromol. 2019, 135, 246–260. [Google Scholar] [CrossRef] [PubMed]
  11. Williams, H.D.; Trevaskis, N.L.; Charman, S.A.; Shanker, R.M.; Charman, W.N.; Pouton, C.W.; Porter, C.J.H. Strategies to address low drug solubility in discovery and development. Pharmacol. Rev. 2013, 65, 315–499. [Google Scholar] [CrossRef]
  12. Stella, V.J.; Nti-Addae, K.W. Prodrug strategies to overcome poor water solubility. Adv. Drug Deliv. Rev. 2007, 59, 677–694. [Google Scholar] [CrossRef] [PubMed]
  13. Serajuddin, A.T. Salt formation to improve drug solubility. Adv. Drug Deliv. Rev. 2007, 59, 603–616. [Google Scholar] [CrossRef] [PubMed]
  14. Blagden, N.; De Matas, M.; Gavan, P.T.; York, P. Crystal engineering of active pharmaceutical ingredients to improve solubility and dissolution rates. Adv. Drug Deliv. Rev. 2007, 59, 617–630. [Google Scholar] [CrossRef]
  15. Ting, J.M.; Porter, I.W.W.; Mecca, J.M.; Bates, F.S.; Reineke, T.M. Advances in polymer design for enhancing oral drug solubility and delivery. Bioconjug. Chem. 2018, 29, 939–952. [Google Scholar] [CrossRef]
  16. Ricarte, R.G.; Van Zee, N.J.; Li, Z.; Johnson, L.M.; Lodge, T.P.; Hillmyer, M.A. Recent advances in understanding the micro- and nanoscale phenomena of amorphous solid dispersions. Mol. Pharm. 2019, 16, 4089–4103. [Google Scholar] [CrossRef] [PubMed]
  17. Vidyadhara, S.; Babu, J.R.; Sasidhar, R.L.C.; Ramu, A.; Prasad, S.S.; Tejasree, M. Formulation and evaluation of glimepiride solid dispersions and their tablet formulations for enhanced bioavailability. Pharmanest 2011, 1, 15–20. [Google Scholar]
  18. Tran, P.; Pyo, Y.C.; Kim, D.H.; Lee, S.E.; Kim, J.K.; Park, J.S. Overview of the manufacturing methods of solid dispersion technology for improving the solubility of poorly water-soluble drugs and application to anticancer drugs. Pharmaceutics 2019, 11, 132. [Google Scholar] [CrossRef] [Green Version]
  19. Pahovnik, D.; Reven, S.; Grdadolnik, J.; Borstnar, R.; Mavri, J.; Žagar, E. Determination of the interaction between glimepiride and hyperbranched polymers in solid dispersions. J. Pharm. Sci. 2011, 100, 4700–4709. [Google Scholar] [CrossRef]
  20. Mehta, A.; Vasanti, S.; Tyagi, R.; Shukla, A. Formulation and evaluation of solid dispersions of an anti-diabetic drug. Curr. Trends Biotechnol. Pharm. 2009, 3, 76–84. [Google Scholar]
  21. Chaudhari, M.D.; Sonawane, R.O.; Zawar, L.; Nayak, S.; Bari, S.B. Solubility and dissolution enhancement of poorly water soluble glimepiride by using solid dispersion technique. Int. J. Pharm. Pharm Sci. 2012, 4, 534–539. [Google Scholar]
  22. Sahoo, A.C.; Kanungo, S.K.; Dinda, S.C.; Panda, J.; Patra, C.N. Improvement in micromeritic properties and dissolution rate of glimepiride. WJPR 2017, 6, 1545–1560. [Google Scholar] [CrossRef] [Green Version]
  23. Reginald-Opara, J.N.; Attama, A.; Ofokansi, K.; Umeyor, C.; Kenechukwu, F. Molecular interaction between glimepiride and Soluplus®-PEG 4000 hybrid based solid dispersions: Characterisation and anti-diabetic studies. Int. J. Pharm. 2015, 496, 741–750. [Google Scholar] [CrossRef] [PubMed]
  24. Reven, S.; Homar, M.; Peternel, L.; Kristl, J.; Žagar, E. Preparation and characterization of tablet formulation based on solid dispersion of glimepiride and poly(ester amide) hyperbranched polymer. Pharm. Dev. Technol. 2011, 18, 323–332. [Google Scholar] [CrossRef]
  25. Singh, A.; Sharma, P.K.; Meher, J.G.; Malviya, R. Evaluation of enhancement of solubility of paracetamol by solid dispersion technique using different polymers concentration. Asian J. Pharm. Clin. Res. 2011, 4, 117–119. [Google Scholar]
  26. Kumar, S.; Gupta, S.K.; Sharma, P.K. Dissolution rate enhancement of aceclofenac by solid dispersion technique. Asian J. Pharm. Life Sci. 2011, 2231, 4423. [Google Scholar]
  27. Dabagh, M.A.; Taghipour, B. Investigation of Solid Dispersion Technique in Improvement of Physicochemical Characteristics of Ibuprofen Powder. Iran. J. Pharm. Sci. 2007, 3, 69–76. [Google Scholar]
  28. Tran, H.T.T.; Park, J.B.; Hong, K.H.; Choi, H.G.; Han, H.K.; Lee, J.; Oh, K.T.; Lee, B.J. Preparation and characterization of pH-independent sustained release tablet containing solid dispersion granules of a poorly water-soluble drug. Int. J. Pharm. 2011, 415, 83–88. [Google Scholar] [CrossRef]
  29. Shaikh, K.; Patwekar, S.; Payghan, S.; D’Souza, J. Dissolution and stability enhancement of poorly water soluble drug-lovastatin by preparing solid dispersions. Asian J. Biomed. Pharm. Sci. 2011, 1, 24–31. [Google Scholar]
  30. Kamalakkannan, V.; Puratchikody, A.; Ramanathan, L. Development and characterization of controlled release polar lipid microparticles of candesartan cilexetil by solid dispersion. Res. Pharm. Sci. 2013, 8, 125–136. [Google Scholar]
  31. Sharma, A.; Jain, C.P.; Tanwar, Y.S. Preparation and characterization of solid dispersions of carvedilol with poloxamer 188. J. Chil. Chem. Soc. 2013, 58, 1553–1557. [Google Scholar] [CrossRef] [Green Version]
  32. Noolkar, S.B.; Jadhav, N.; Bhende, S.A.; Killedar, S.G. Solid-State Characterization and Dissolution Properties of Meloxicam–Moringa Coagulant–PVP Ternary Solid Dispersions. AAPS PharmSciTech 2013, 14, 569–577. [Google Scholar] [CrossRef] [PubMed]
  33. Patel, M.; Tekade, A.R.; Gattani, S.; Surana, S. Solubility enhancement of lovastatin by modified locust bean gum using solid dispersion techniques. AAPS PharmSciTech 2008, 9, 1262–1269. [Google Scholar] [CrossRef] [PubMed] [Green Version]
  34. Ghareeb, M.M.; Abdulrasool, A.A.; Hussein, A.A.; Noordin, M.I. Kneading technique for preparation of binary solid dispersion of meloxicam with poloxamer 188. AAPS PharmSciTech 2009, 10, 1206–1215. [Google Scholar] [CrossRef]
  35. Rajpurohit, V.S.; Rakha, P.; Goyal, S.; DUREJA, H.; Arorac, G.; Nagpal, M. Formulation And Characterization Of Solid Dispersions Of Glimepiride Through Factorial Design. Iran. J. Pharm. Sci. 2011, 7, 7–16. [Google Scholar]
  36. Qushawy, M.; Prabahar, K.; Abd-Alhaseeb, M.; Swidan, S.; Nasr, A. Preparation and evaluation of carbamazepine solid lipid nanoparticle for alleviating seizure activity in pentylenetetrazole-kindled mice. Molecules 2019, 24, 3971. [Google Scholar] [CrossRef] [Green Version]
  37. de los Santos, C.J.J.; Pérez-Martínez, J.I.; Gómez-Pantoja, M.E.; Moyano, J.R. Enhancement of albendazole dissolution properties using solid dispersions with Gelucire 50/13 and PEG 15000. J. Drug Deliv. Sci. Technol. 2017, 42, 261–272. [Google Scholar] [CrossRef]
  38. Mahapatra, A.K.; Murthy, P.N.; Patra, R.K.; Mallik, S. Dissolution rate enhancement and solid state characterization of Ritonavir-PEG 4000 solid dispersions. J. Pharm. Adv. Res. 2019, 2, 650–656. [Google Scholar]
  39. Soni, L.; Ansari, M.; Thakre, N.; Singh, A.; Bhowmick, M.; Rathi, J. Development and in-vitro evaluation of furosemide solid dispersion using different water soluble carriers. Int. J. Res. Dev. Pharm. Life Sci. 2017, 6, 2571–2575. [Google Scholar] [CrossRef]
  40. Das, S.; Mandal, P. Design, formulation, and evaluation of solid dispersion tablets of poorly water-soluble antidiabetic drug using natural polymer. Asian J. Pharm. Clin. Res. 2019, 12, 195–197. [Google Scholar] [CrossRef]
  41. Mehenni, L.; Lahiani-Skiba, M.; Ladam, G.; Hallouard, F.; Skiba, M. Preparation and characterization of spherical amorphous solid dispersion with amphotericin B. Pharmaceutics 2018, 10, 235. [Google Scholar] [CrossRef] [Green Version]
  42. Rao, M.; Mandage, Y.; Thanki, K.; Bhise, S. Dissolution improvement of simvastatin by surface solid dispersion technology. Dissolution Technol. 2010, 17, 27–34. [Google Scholar] [CrossRef]
  43. Prabahar, K.; Udhumansha, U.; Qushawy, M. Optimization of thiolated chitosan nanoparticles for the enhancement of in vivo hypoglycemic efficacy of sitagliptin in streptozotocin-induced diabetic rats. Pharmaceutics 2020, 12, 300. [Google Scholar] [CrossRef] [Green Version]
  44. Chavan, R.B.; Lodagekar, A.; Yadav, B.; Shastri, N.R. Amorphous solid dispersion of nisoldipine by solvent evaporation technique: Preparation, characterization, in vitro, in vivo evaluation, and scale up feasibility study. Drug Deliv. Transl. Res. 2020, 10, 903–918. [Google Scholar] [CrossRef]
  45. Davis, M.T.; Potter, C.B.; Walker, G.M. Downstream processing of a ternary amorphous solid dispersion: The impacts of spray drying and hot melt extrusion on powder flow, compression and dissolution. Int. J. Pharm. 2018, 544, 242–253. [Google Scholar] [CrossRef] [PubMed] [Green Version]
  46. Browne, E.; Charifou, R.; Worku, Z.A.; Babu, R.P.; Healy, A.M. Amorphous solid dispersions of ketoprofen and poly-vinyl polymers prepared via electrospraying and spray drying: A comparison of particle characteristics and performance. Int. J. Pharm. 2019, 566, 173–184. [Google Scholar] [CrossRef]
  47. Malviya, R.; Srivastava, P.; Bansal, M.; Sharma, P.K. Improvement of dissolution behavior of paracetamol using solid dispersion technique. Int. J. Pharm. Sci. Res. 2010, 1, 95–99. [Google Scholar]
  48. Mahajan, A.; Surti, N.; Koladiya, P. Solid dispersion adsorbate technique for improved dissolution and flow properties of lurasidone hydrochloride: Characterization using 32 factorial design. Drug Dev. Ind. Pharm. 2018, 44, 463–471. [Google Scholar] [CrossRef]
  49. Kaur, P.; Singh, S.K.; Garg, V.; Gulati, M.; Vaidya, Y. Optimization of spray drying process for formulation of solid dispersion containing polypeptide-k powder through quality by design approach. Powder Technol. 2015, 284, 1–11. [Google Scholar] [CrossRef]
  50. Andrade, T.C.; Martins, R.M.; Freitas, L.A.P. Granulation of indomethacin and a hydrophilic carrier by fluidized hot melt method: The drug solubility enhancement. Powder Technol. 2015, 270, 453–460. [Google Scholar] [CrossRef]
  51. Zaini, E.; Umar, S.; Nurhidayah, N. Improvement of dissolution rate of valsartan by solid dispersion system using D(-) mannitol. Asian J. Pharm. Clin. Res. 2017, 10, 288–290. [Google Scholar] [CrossRef] [Green Version]
  52. Febriyenti, F.; Rahmi, S.; Halim, A. Study of gliclazide solid dispersion systems using PVP K-30 and PEG 6000 by solvent method. J. Pharm. Bioallied Sci. 2019, 11, 262–267. [Google Scholar] [CrossRef] [PubMed]
  53. Arora, A.; Aggarwal, G.; Singh, T.G.; Singh, M.; Arora, G.; Nagpal, M. Inclusion complexes of atorvastatin calcium–sulfobutyl ether β cyclodextrin with enhanced hypolipidemic activity. J. Appl. Pharm. Sci. 2019, 9, 60–68. [Google Scholar]
  54. Kaushik, S.; Pathak, K. Solubility enhancement of glimperide: Development of solid dispersion by solvent melt method, characterization and dosage form development. Pharm. Biomed. Res. 2018, 3, 1–13. [Google Scholar] [CrossRef]
  55. Rajbanshi, K.; Bajracharya, R.; Shrestha, A.; Thapa, P. Dissolution enhancement of aceclofenac tablet by solid dispersion technique. Int. J. Pharma Sci. Res. 2014, 5, 127–139. [Google Scholar]
  56. Leonardi, D.; Barrera, M.G.; Lamas, M.C.; Salomon, C.J. Development of prednisone: Polyethylene glycol 6000 fast-release tablets from solid dispersions: Solid-state characterization, dissolution behavior, and formulation parameters. AAPS PharmSciTech 2007, 8, 221–228. [Google Scholar] [CrossRef] [Green Version]
  57. Abarca, R.L.; Rodríguez, F.J.; Guarda, A.; Galotto, M.J.; Bruna, J.E. Characterization of beta-cyclodextrin inclusion complexes containing an essential oil component. Food Chem. 2016, 196, 968–975. [Google Scholar] [CrossRef]
  58. Kiran, T.; Shastri, N.; Ramakrishna, S.; Sadanandam, M. Surface solid dispersion of glimepiride for enhancement of dissolution rate. Int. J. Pharm. Tech. Res. 2009, 1, 822–831. [Google Scholar]
  59. Alves, L.D.S.; Soares, M.F.D.L.R.; De Albuquerque, C.T.; Da Silva, É.R.; Vieira, A.C.C.; Fontes, D.A.F.; Figueirêdo, C.B.M.; Soares-Sobrinho, J.L.; Neto, P.J.R. Solid dispersion of efavirenz in PVP K-30 by conventional solvent and kneading methods. Carbohydr. Polym. 2014, 104, 166–174. [Google Scholar] [CrossRef]
  60. Ganesan, P.; Soundararajan, R.; Shanmugam, U.; Ramu, V. Development, characterization and solubility enhancement of comparative dissolution study of second generation of solid dispersions and microspheres for poorly water soluble drug. Asian J. Pharm. Sci. 2015, 10, 433–441. [Google Scholar] [CrossRef] [Green Version]
  61. Mamatha, T.; Anitha, N.; Qureshi, H.K. Development of nevirapine tablets by direct compression method using solid dispersion technique. J. Pharm. Res. 2017, 16, 72–79. [Google Scholar] [CrossRef] [Green Version]
  62. Pagadala, A. Formulation and evaluation of solid dispersion of glimepiride in to sustained release. Glob. J. Pharm. Pharm. Sci. 2016, 1, 1–5. [Google Scholar] [CrossRef]
  63. Li, H.; Pan, T.; Cui, Y.; Li, X.; Gao, J.; Yang, W.; Shen, S. Improved oral bioavailability of poorly water-soluble glimepiride by utilizing microemulsion technique. Int. J. Nanomed. 2016, 11, 3777–3788. [Google Scholar] [CrossRef] [Green Version]
Figure 1. Differential scanning calorimetry (DSC) thermograms of pure glimepiride, Mannitol, PEG 6000, β-cyclodextrin, F3, F6, and F9. PEG 6000 is polyethylene glycol 6000. F3: formulation number 3. F6: formulation number 6. F9: formulation number 9.
Scipharm 88 00052 g001
Figure 2. Infra-red spectroscopy (IR) of pure glimepiride, Mannitol, PEG 6000, β-cyclodextrin, F3, F6, and F9.
Scipharm 88 00052 g002
Figure 3. The in-vitro release study of glimepiride from all prepared solid dispersion formulations and free drug.
Scipharm 88 00052 g003
Figure 4. The effect of formulation factors (X1 and X2) in the in vitro drug release (Y1). (A) The predicted versus actual value. (B) Contour plot for drug release. (C) Surface plot for drug release. The different colored points express the actual and predicted values of in vitro release. numbers 70, 80, and 90 express the maximum value of in vitro release
Scipharm 88 00052 g004
Figure 5. Scanning electron microscopy (SEM) images of the optimized formulation of glimepiride solid dispersion (F9).
Scipharm 88 00052 g005
Figure 6. The antidiabetic activity of F9 in comparison with free glimepiride. Data were analyzed statistically using one-way ANOVA followed by Bonferroni’s post-hoc test at p < 0.05. * Versus control and $ versus free glimepiride, n = 6.
Scipharm 88 00052 g006
Table 1. Dependent and independent formulation variables and their levels according to 32 factorial design. PEG: polyethylene glycol.
Independent FactorsLow (−1)Medium (0)High (1)
X1 = Type of carrierMannitolPEG 6000β-Cyclodextrin
X2 = Drug: Carrier ratio1:11:31:6
Dependent VariablesGoal
Y1 = The drug release (%) Maximize
Table 2. Glimepiride solid dispersion formulations according to 32 factorial design.
Formulation No.Variable X1Variable X2
F1−1−1
F2−10
F3−11
F40−1
F500
F601
F71−1
F810
F911
Where +1 is the higher level, −1 is the lower level, and 0 is the medium level for the independent variables.
Table 3. Characterization of prepared glimepiride solid dispersion formulations.
Formulation No.PY %DC %
F199.5 ± 2.598.1 ± 1.5
F298.5 ± 3.197.4 ± 2.6
F399.1 ± 1.599.6 ± 2.1
F498.4 ± 2.896.8 ± 2.9
F599.8 ± 2.299.3 ±3.7
F699.2 ± 3.997.2 ± 3.2
F799.7 ± 2.198.7 ± 2.7
F898.7 ± 2.398.3 ± 2.4
F998.8 ± 3.799.5 ± 1.8
Table 4. The characterization of the glimepiride solid dispersion formulations concerning bulk density, tapped density, Hausner’s ratio, Carr’s index, and angle of repose. Values were expressed in mean ± SD (n = 3).
Formulation No.Bulk Density (g/cm3)Tapped Density (g/cm3)Hausenr’s RatioCarr’s Index (%)Angle of Repose
F10.54 ± 0.030.61 ± 0.021.13 ± 0.0311.48 ± 0.3417.45 ± 0.82
F20.46 ± 0.020.51 ± 0.011.11 ± 0.019.80 ± 0.5414.26 ± 0.91
F30.47 ± 0.020.54 ± 0.011.15 ± 0.0212.96 ± 0.6518.45 ± 0.75
F40.51 ± 0.010.57 ± 0.011.12 ± 0.0110.53 ± 0.1515.85 ± 0.64
F50.49 ± 0.030.58 ± 0.021.18 ± 0.0115.52 ± 0.9519.45 ± 0.54
F60.45 ± 0.040.55 ± 0.021.22 ± 0.0218.18 ± 0.4723.44 ± 0.63
F70.42 ± 0.030.50 ± 0.011.19 ± 0.0216.00 ± 0.4520.91 ± 0.68
F80.37 ± 0.050.43 ± 0.021.16 ± 0.0313.95 ± 0.1218.67 ± 0.42
F90.40 ± 0.040.48 ± 0.011.20 ± 0.0316.67 ± 0.3822.86 ± 0.46
Table 5. ANOVA analysis of Y1 (% of drug released after 1 hr) for the prepared glimepiride solid dispersion formulations.
SourceSum of SquaresDFMean SquareF-Ratiop-Value
Model881.075176.2142.210.0056
A-(X1)198.951198.9547.660.0062
B-(X2)371.151371.1588.900.0025
AB2.5312.530.60560.4932
A 2308.431308.4373.880.0033
B 20.009310.00930.00220.9652
Residual12.5234.17
Correlation Total893.598
Table 6. The calculated correlation coefficients for the in-vitro release of glimepiride from glimepiride solid dispersion employing different kinetic orders or systems. H-C is Hixon Crowel. B-L is baker & lonsdal.
Formula No.Correlation Coefficient (r)
ZeroFirstSecondDiffusionH-CB-L
F10.9916−0.99810.99460.99590.99710.9973
F20.9910−0.99710.98600.99270.99650.9964
F30.9893−0.99870.98840.99520.99770.9976
F40.9956−0.99750.99510.99060.99680.9964
F50.9932−0.99640.98990.98760.99560.9957
F60.9902−0.99700.98420.99330.99660.9965
F70.9856−0.99770.99680.99630.99510.9961
F80.9712−0.99270.99180.99040.98790.9877
F90.8797−0.99090.82930.94540.98810.9654
Free glimepiride0.9922−0.99300.99170.98680.99260.9722
Publisher’s Note: MDPI stays neutral with regard to jurisdictional claims in published maps and institutional affiliations.

