Article

Computer-Aided Design of Peptidomimetic Inhibitors of Falcipain-3: QSAR and Pharmacophore Models

1
Department of Physics, Ecole Normale Supérieure, University of Yaoundé I, Yaoundé CM-00237, Cameroon
2
Laboratory of Fundamental and Applied Physics, University of Abobo-Adjame (now Nangui Abrogoua), Abidjan 02 BP 801, Côte d’Ivoire
3
Department of Chemistry, Faculty of Science, University of Buea, Buea CM-00237, Cameroon
4
Institute of Pharmacy, Martin-Luther University Halle-Wittenberg, 06120 Halle, Germany
5
CEPAMOQ, Faculty of Science, University of Douala, Douala CM-00237, Cameroon
*
Authors to whom correspondence should be addressed.
Submission received: 12 July 2021 / Revised: 23 August 2021 / Accepted: 8 September 2021 / Published: 29 September 2021
(This article belongs to the Special Issue Feature Papers in Scientia Pharmaceutica)

Abstract

:
In this work, antiparasitic peptidomimetics inhibitors (PEP) of falcipain-3 (FP3) of Plasmodium falciparum (Pf) are proposed using structure-based and computer-aided molecular design. Beginning with the crystal structure of PfFP3-K11017 complex (PDB ID: 3BWK), three-dimensional (3D) models of FP3-PEPx complexes with known activities (   IC 50 exp ) were prepared by in situ modification, based on molecular mechanics and implicit solvation to compute Gibbs free energies (GFE) of inhibitor-FP3 complex formation. This resulted in a quantitative structure–activity relationships (QSAR) model based on a linear correlation between computed GFE (ΔΔGcom) and the experimentally measured   IC 50 exp . Apart from the structure-based relationship, a ligand-based quantitative pharmacophore model (PH4) of novel PEP analogues where substitutions were directed by comparative analysis of the active site interactions was derived using the proposed bound conformations of the PEPx. This provided structural information useful for the design of virtual combinatorial libraries (VL), which was virtually screened based on the 3D-QSAR PH4. The end results were predictive inhibitory activities falling within the low nanomolar concentration range.

1. Introduction

Malaria is a widespread disease, with causative agent Plasmodium falciparum (Pf), transmitted mainly by female Anopheles mosquito bites [1]. The disease has been declared a public health concern by the World Health Organization (WHO) in many developing countries [2,3]. Additionally, since the implementation of artemisinin-combined therapy (ACT) in 2006, resistance cases have been recorded [4,5,6,7]. Meanwhile, the treatment of malaria mainly depends on ACT, despite resistance to this combination. This suggests the need for industry–academia partnerships for the search of new antimalarials which act via alternative modes of action. Two strategic approaches have been suggested in the search for new remedies against malaria; one focused on eliminating the parasite or preventing its contact with potential human hosts, and a second aimed at developing efficacious drugs to treat infected patients [1]. The latter is often aimed at the inhibition of a therapeutic target, often a vital enzyme involved in the parasite’s life cycle. This often requires the search for or the design of new molecules capable of binding in a specific manner to known parasite vital enzymes.
During the last two decades, the identification of drug targets against Pf has increased tremendously [4,5,6,7], thus favouring the second approach. This is known as “rational drug design and discovery”. As an example, the parasite breaks down a large amount of haemoglobin (Hb) from human red blood cells in order to obtain the required nutrients for its growth during the blood stage [8]. This involves several proteases, known as validated drug targets in [9]. These drug targets could be divided into two major groups:
(i) those which are directly involved in the invasion and rupture of the red blood cells, and
(ii) those dedicated to the breakdown of Hb [10].
Two protease families are involved in Hb breakdown by hydrolysis. These include aspartic proteases (plasmepsins) and cysteine proteases (falcipains, FPs) [10]. One metalloprotease called falcilysin [11], and one dipeptidyl aminopeptidase [12] are also involved.
Previous studies have focused on the search for inhibitors of falcipains 2 and 3 (FP2 and FP3), respectively [13], even though FP3, shown to be expressed later in the parasite life cycle, appeared to be a more efficient haemoglobinase than FP2 [14]. This indicates that FP3 inhibition is lethal to the parasite and, therefore, constitutes an attractive target in Pf drug discovery. Several FP3 inhibitors have been identified and described in the literature, which are capable of blocking the enzyme’s activity by forming reversible or irreversible covalent bonds within the enzyme active site [12]. These inhibitors could be sub-classified into three categories: peptide-based, non-peptidic, and peptidomimetic inhibitors [15,16], although preference has been given to those known to be reversible and, hence, considered to be potentially more effective than irreversible ones [17,18]. The most promising inhibitors so far are those discovered by chemical synthesis [19,20,21,22,23,24], by molecular docking [25] and virtual screening studies [18,26,27,28,29], particularly from the peptidomimetics class of compounds.
Weldon et al. recently designed, synthesised and evaluated a series of peptidomimetic pseudo-prolyl-homophenylalanyl ketones for their inhibition of the Pf cysteine proteases FP2 and FP3 [24]. One of these compounds showed nanomolar range activities against both enzymes (i.e., 80 nM against FP2 and 60 nM against FP3 [24]. These interesting results have been improved by the presence of the crystal structures of the FP3 apo structure co-crystallised with the inhibitor within the protein data bank [30,31]. These have constituted the foundation of this work, which involves the design of PEP2 peptidomimetic analogues with the goal of identifying even more potent candidates via quantitative structure-activity relationship (QSAR) with FP3 inhibition pharmacophores. This is intended to further orientate the design of more potent non-peptidic FP3 inhibitors.
In the present work, we have built and validated a Hansch-type “complexation”FP3 inhibition QSAR models based on the in vitro activities of twelve (12) selected PEP derivatives against FP3. As a starting point, we chosethe experimental (X-ray crystal) structure of the protein-ligand complex of the enzyme and the potent inhibitor K11017 (PDB ID:3BWK) to build each selected inhibitor by in situ modifying of the native ligand. [24,30]. This consisted of computing the Gibbs free energies for the formation of the ligand-receptor complexes ( G com ) based on Molecular Mechanics Poisson-Boltzmann (MM-PB) approach for the training set molecules, followed by the correlation with the experimentally tested biological activities pIC 50 exp . The established QSAR equation was then used to predict the activities of newly designed analogues based on the initial compound scaffold. Additionally, a FP3 inhibition pharmacophore model (PH4) from the bound conformation of the training set of PEPs was used to screen the virtual library of proposed PEP analogues to identify the best candidates, which have predicted ADMET profiles within the acceptable range for 95% of known drugs.

2. Materials and Methods

Scheme 1 displays the workflow of different steps involved for the computer-aided drug design of the new peptidomimetics analogues.

2.1. Biological Activities of Compounds Included in the Training and Validation Sets

The biological activities ( IC 50 exp ) of the compounds included in training and validation sets of PEP PfFP3 inhibitors were found in the literature, covering a range of activities from 60 nM to about 47,230 nM [24]. Weldon and co-workers synthesised 22 molecules, but not all showed detected biological activities against FP3 to be included in a QSAR study (e.g., activities recorded as >50 μM would not be included in our study). Finally, 12 compounds (almost the threshold for an acceptable QSAR study) have been used in our study.

2.2. Molecular Modeling

3D models of the enzyme-inhibitor (E:I) complexes were built starting from the free enzyme (E) and the free inhibitors (I), both derived from a well -refined X-ray crystal structure (PDB ID: 3BWK) of the co-crystallised potent inhibitor K11017 (or Mu-Leu-Hph-VSPh, where VSPh: phenyl vinyl sulfone; Hph:homophenylalanyl;Mu:morpholino urea) retrieved from the PDB [32]. Chain A was employed in all computations and modellingwas carried out on the graphical user interface of Discovery Studio 2.5 [33], using a previously well described protocol [34,35,36,37,38,39,40,41,42,43,44,45,46,47,48]. Thus, the pH values were kept at 7.0, while all N- and C-terminal residues were kept neutral. All water molecules originally in the crystal structure were deleted. Finally, protonated and ionised amino acid residues were charged. Each inhibitor was built into the crystal reference structure by modifying the original K11017 inhibitor in situ. During this process, all rotatable bonds of the replacing residues underwent an exhaustive conformational search by a careful and gradual energy minimisation of each modified inhibitor within the active site residues of FP3 within 5Å of the inhibitor, leading to the identification of low-energy bound conformations of each modified inhibitor. The various low-energy structures of the E:I complexes were then carefully refined by energy minimisation of the whole complex.

2.3. Molecular Mechanics

The simulation of each inhibitor, FP3 and E:I complex were carried out by molecular mechanics (MM) as implemented in the CHARMm forcefield [49]. All MM calculations used a dielectric constant of 4 for representing dielectric shielding effects in the proteins. The optimisation (energy minimisation process) of the free enzymes E, free inhibitors I and enzyme-inhibitor complexes E:I were carried out by a gradual relaxation of the structures, beginning by adding H-atoms, then the residue side chain heavy atoms, and ending up with the relaxation of the protein backbone. A large number of the steepest descent, followed by conjugate gradient iterative cycles were employed. A convergence criterion for the average gradient was set to of 0.01 kcal · mol 1 Å 1 in each geometry optimisation procedure.

2.4. Conformational Search

The conformation of each free inhibitor was obtained from its bound conformation in the E:I complex, which had been previously obtained by the gradual relaxation to the nearest local energy minimum (see Section 2.3). Next, low energy structures of the free inhibitors were found by the quenching dynamics protocol available in the module Forcite Plus of Accelrys Materials Studio 4.4 [50]. Quench molecular dynamics performs a standard molecular dynamics calculation with an additional geometry optimisation step, in which a geometry optimisation is performed on every frame in the trajectory file. Forcite Plus calculations were carried out using Compass forcefield [49], ultra-fine quality options and nonbond cut-off distance equal to 30 Å.For each free inhibitor, 5000 steps (time step is 1 fs, total simulation time equal 5 ps) are used to run dynamics simulation at 350 K. A quench, or geometry optimisation, is performed every 25 steps. On completion of the quench dynamics calculation, 200 unique conformations are generated per inhibitor. Finally, the lowest energy conformer of each inhibitor is selected and minimised again using CHARMm forcefield of Discovery Studio. During this minimisation, the inhibitor’s dielectric constant was kept at ε = 4.

2.5. Solvation Gibbs Free Energy

The electrostatic component of solvation Gibbs free energy was computed using the DelPhi package in Discovery Studio [33]. This incorporates the effects of ionic strength by solving the nonlinear Poisson–Boltzmann equation [51,52]. This DelPhi program treats the solvent as a continuous medium of high dielectric constant ( ε 0 = 80 ) while the solute is treated as a cavity with low dielectric ( ε i = 4 ). Boundaries are linked to the solute’s molecular surface, which enclose the solute’s atomic charges. The molecular electrostatic potential and reaction field around the solute are solved by a finite difference method on a 235 × 235 × 235 cubic lattice grid for the complexes and free enzyme and 65 × 65 × 65 grid for the free inhibitors, implementing the full Coulombic boundary conditions. In both cases, two (02) subsequent focusing steps led to a similar final resolution of about 0.3 Å per grid unit at 70% filling of the grid by the solute. Physiological ionic strength of 0.145   mol · dm 3 , atomic partial charges and radii defined in the CHARMm parameter set (Biovia DS) and a probe sphere radius of 1.4   Å were used. In this implementation, the electrostatic component of the solvation Gibbs free energy was calculated as the reaction field energy [53,54,55].

2.6. Calculation of the Entropic Term

During the simulation, the vibrational entropy change which occurs as the inhibitor binds to the enzyme was computed by normal mode analysis of the inhibitor vibrations, by using a simplified method previously described by Fischer and co-workers [56,57]. This approach involves the vibrational analyses of the inhibitor bound at the active site of a “frozen” enzyme, while the low-energy conformers of the free inhibitor were computed for fully minimised structures. This was carried out using the Discover module of Materials Studio 4.4 [50] and the formula:
T S vib = TS vib I bonded TS vib I free
The method has previously provided a good approximation of the vibrational entropy change in the fully flexible system for small and relatively stiff ligands, i.e., including the degrees of freedom of the protein receptor [55,56]. In this calculation, the TS vib I free term can explain vibrational motions of the free inhibitor and the conformational flexibility of the molecule, i.e., low frequency vibrations, which correspond to collective motions of atoms with larger amplitudes (conformational changes contribute mostly to this term). The relative values of TS vib , with respect to the reference inhibitor, were used to compensate partially for the restricted flexibility of the E. In this respect, the entropy term is also recognised as an important factor for drug optimisation, even though an enthalpy contribution to binding affinity is known to be more essential [58].

2.7. Binding Affinity Calculations

It has been previously proven that the concentration of a competitive tight binding inhibitor that causes a 50% reduction in the rate of catalytic substrate conversion ( IC 50 exp ) of a reversible inhibitor depends on the enzyme-inhibition constant K i as follows:
IC 50 exp = K i + S . K i K M + E 2
where S and E are the substrate and enzyme concentrations, respectively, while K M represents the Michaelis constant [59]. The IC 50 ex value can thus be predicted from the standard Gibbs free energy (GFE) change during the enzyme:inhibitor complex formation:
G com = RT × ln K i
assuming that there is equilibrium in solution between the solvated protein (or enzyme) E aq , the solvated inhibitor I aq and the solvated protein-ligand complex E : I aq :
E aq + I aq E : I aq
the standard Gibbs free energy change in the above equilibrium (4) can be written as:
G com = G E : I G E G I
in our calculations, the exact values of standard Gibbs free energies for larger systems such as enzyme: inhibitor complexes were approximated by the derived expressions from the works of Frecer and Miertus [36,60,61]:
G E : I E MM E : I + RT TS trv E : I + G sol E : I
where E MM E : I stands for the molecular mechanics total energy of the complex (including bonding and non-bonding contributions), G sol E : I is the solvation GFE and TS trv E : I is the entropic term:
TS trv E : I = TS trans E : I + TS rot E : I + TS vib E : I
composed of a sum of contributions arising from translational, rotational and vibrational motions of the complex E:I. Assuming that the translational and rotational terms for the complex E:I and free enzyme E are approximately equal, we obtain:
G com = E MM E : I E MM E E MM I + G sol E : I G sol E G sol I + TS tran I + TS rot I TS vib E : I TS vib E TS vib I = H MM + T S tran I + T S rot I T S vib + G sol
with TS trans I and TS rot I describing the translational and rotational entropy terms of the free inhibitor, respectively, and TS vib representing the vibrational entropy change during the formation of the enzyme-inhibitor complex TS vib = TS vib I E TS vib I . By comparing between different inhibitors via relative changes in their respective complexation Gibbs free energies, with respect to a reference inhibitor, I ref (in this case PEP23), and by assuming the ideal gas behaviour for the rotational and translational motions of the inhibitors, it can be shown that:
G com = G com I G com I ref = H MM TS vib + G sol
The advantage of such an approach is that the evaluation of relative changes is preferable, since it results in the partial cancellation of errors caused by the approximate nature of the MM method. Additionally, solvent and entropic effects are included in the description.

2.8. Interaction Energy Calculations

Interaction energy values were computed using Discovery Studio 2.5 [33]. The MM interaction energy ( E int ) protocol available in this program computes the (non-bonded) van der Waals and electrostatic interactions between enzyme residues and each inhibitor. The CHARMm force field [49] was used during the calculations, with a dielectric constant set at 4. The breakdown of E int into the contributions by active site residues reveals the significance of individual interactions and permits us to carry out a comparative analysis. The approach leads to the identification of affinity values which would enhance the prediction of favourable and unfavourable PEP substitutions.

2.9. Pharmacophore (PH4) Modeling

By definition, a pharmacophore is often regarded as a set of features arranged in 3D space which are essential for a molecule to exert a certain biological activity. The perception of a pharmacophore is essential for understanding the interaction between a ligand and its receptor. The PH4 concept is based on the assumption that a set of structural features in a molecule is recognised at the receptor site and is responsible for the molecule’s biological activity. Bound conformations of inhibitors taken from E:I complexes were used to construct 3D-QSAR pharmacophore models using the Catalyst HypoGen algorithm implemented in Discovery Studio 2.5 [33]. This consisted of building a top scoring pharmacophore hypothesis from the most active inhibitor. Three stages (construction, subtraction and optimisation) are involved, meanwhile the inactive ones were used to define the excluded volumes. A maximum number of five excluded volumes and five features were selected according to the PEP scaffold and substituents, i.e., hydrophobic aliphatic (HYd), hydrophobic aromatic (HYdAr), hydrogen-bond acceptor (HBA) hydrogen-bond donor (HBD) and ring aromatic (Ar). As per the adjustable parameters in the HypoGen protocol, all were kept by default except for the uncertainty on the activity and the minimum inter-feature distance, which were set to 1.1 Å and 2.5 Å (instead of 3), respectively. These parameters were carefully chosen in order to bring the uncertainty interval of experimental activity from a wide span IC 50 exp / 3 ,   3 × IC 50 exp to a relatively narrow one IC 50 exp / 1.1 ,   1.1 × IC 50 exp . This is important because the accuracy and homogeneity of the measured inhibitory activities based on the fact that the experimental biological activities were derived from the same laboratory must be taken into account [24]. During the generation of 10 pharmacophores, 0 was set as the number of missing features and the best pharmacophore models were selected.

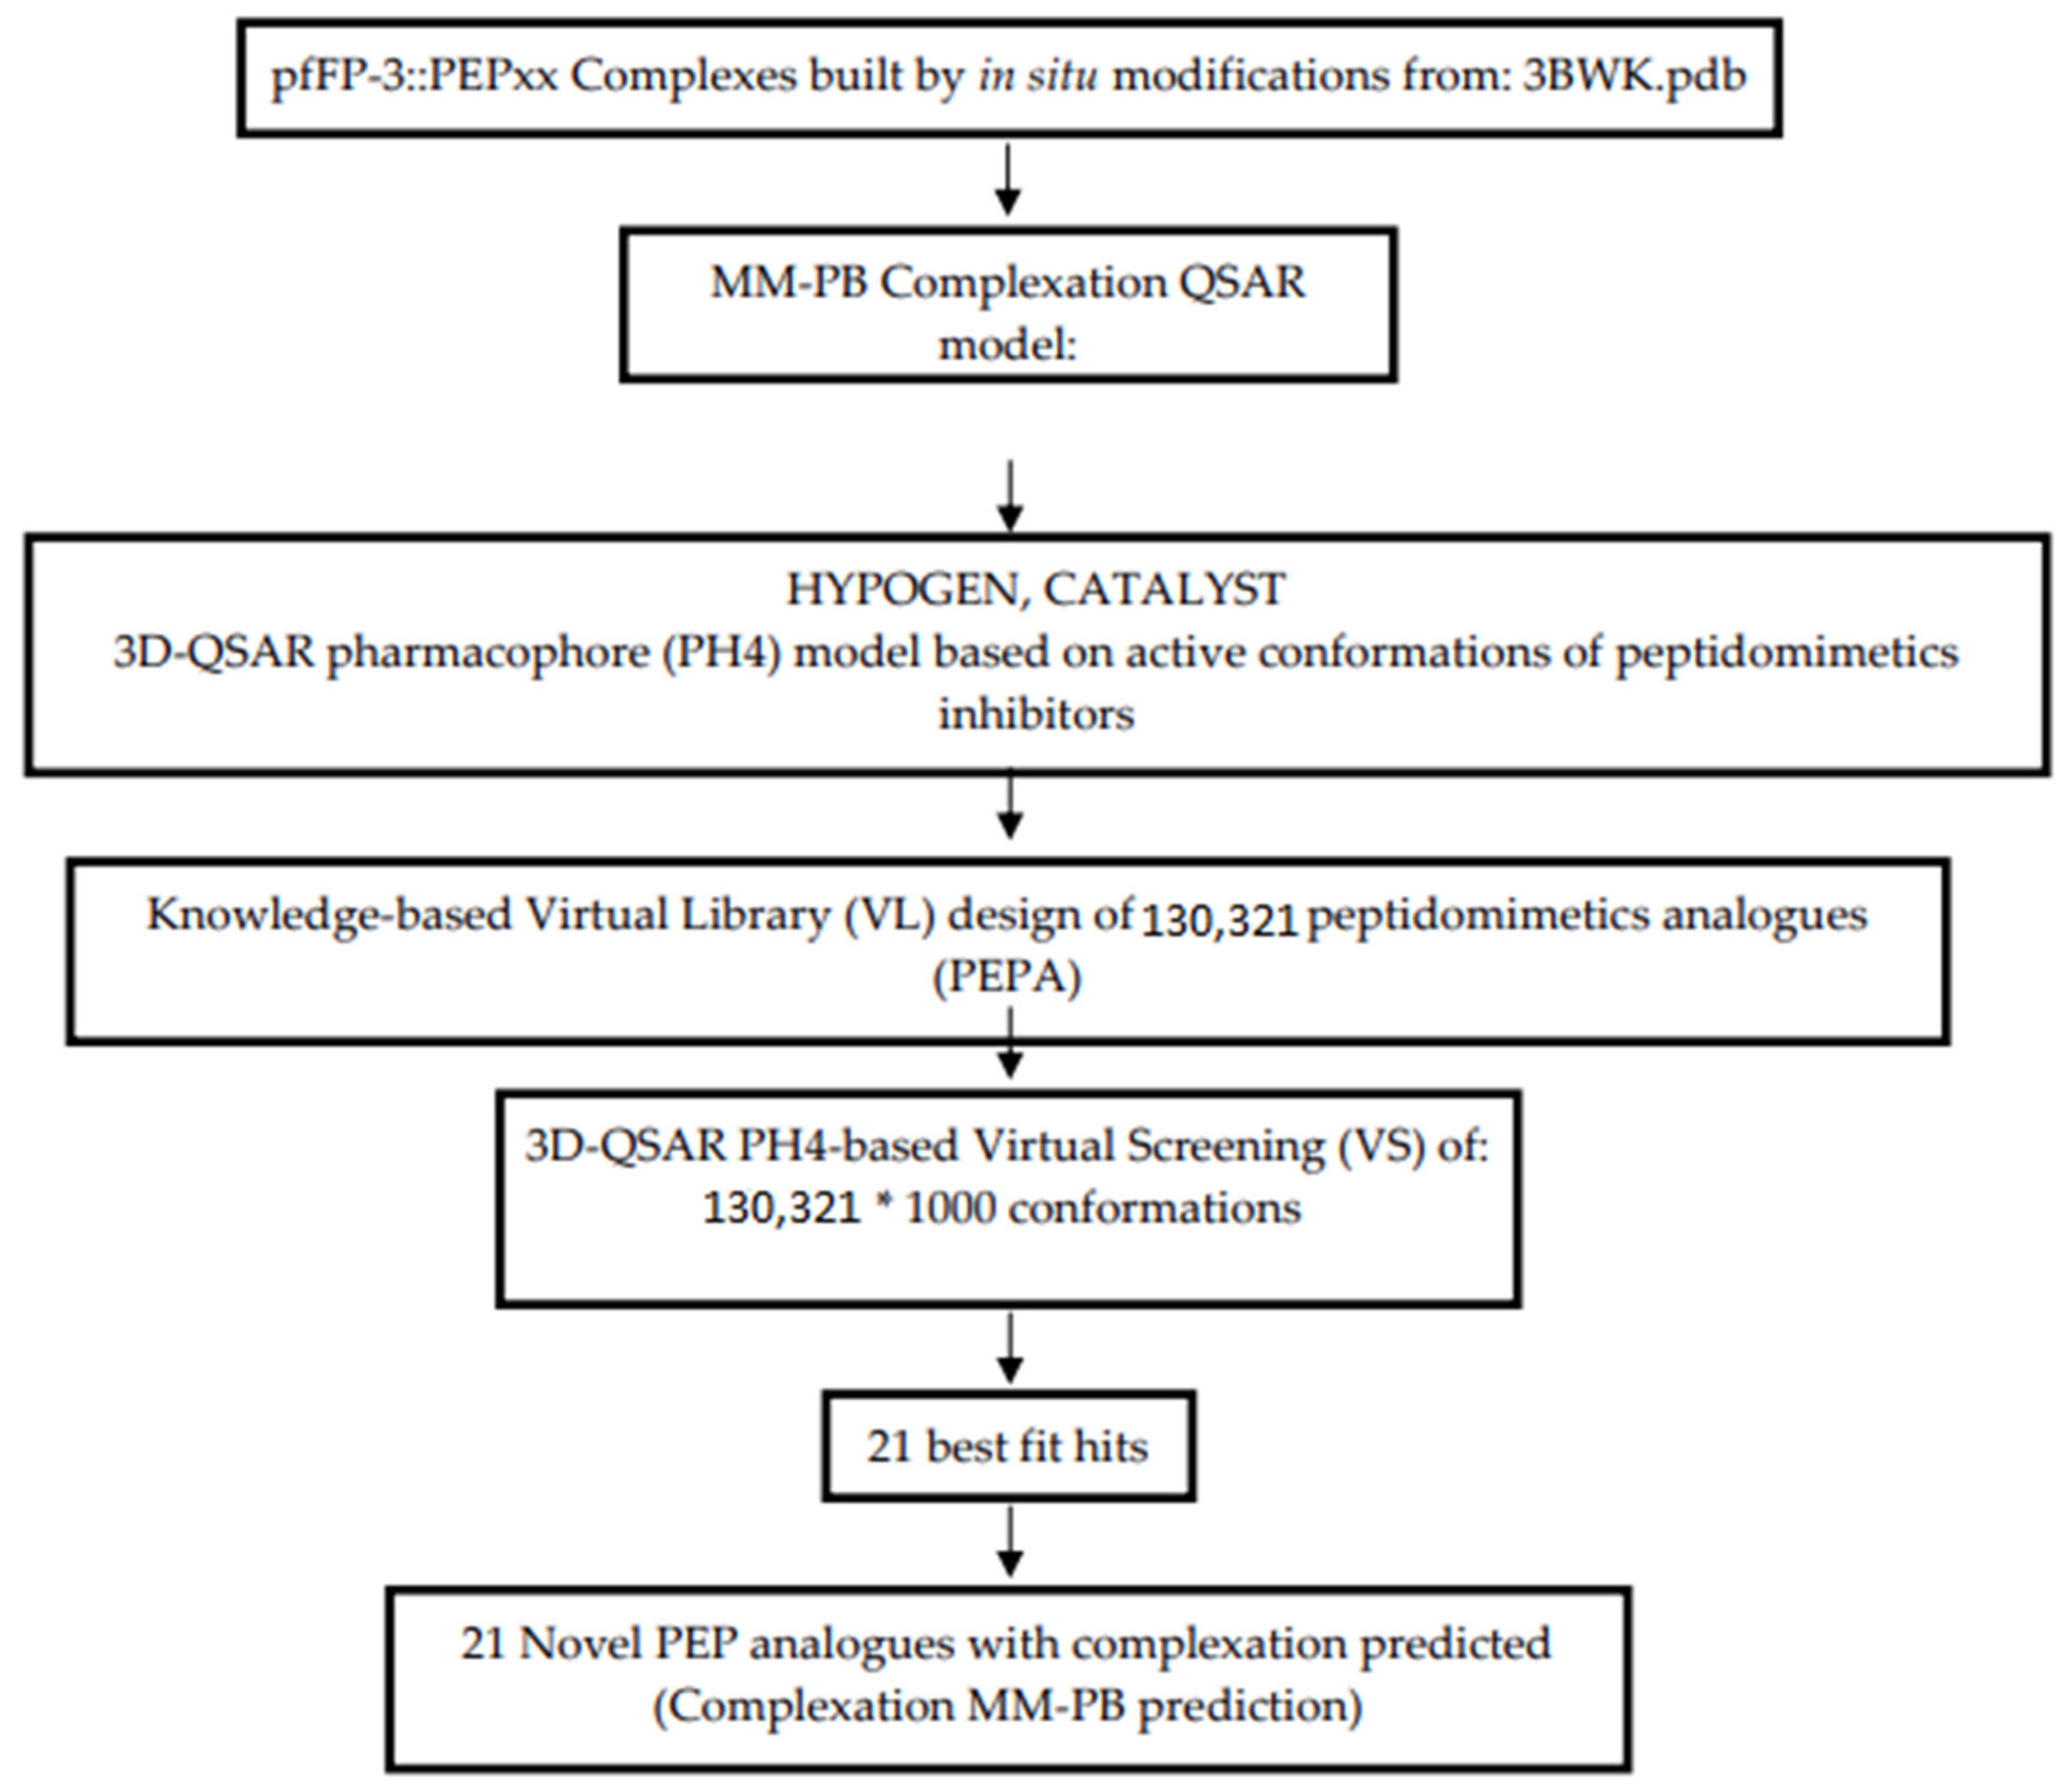
2.10. Generation of the Virtual Library

Molecular models of new analogues were generated using the Molecular Operating Environment (MOE) program [62]. This was carried out by attaching the R-groups (fragments, building blocks) onto the PEP scaffolds using the Quasar CombiDesign module of the MOE program. Chemical reagents considered in this study were taken from the directories of chemicals available from the commercial suppliers of chemicals [63]. Each analogue was built as a neutral molecule in the MOE program and its molecular geometry has been refined by the MM optimisation, implemented in the Discovery Studio 2.5 smart minimiser. Convergence criteria (energy difference of 10 4   kcal · mol 1 , root-mean-square displacement (RMSD) of 10−5 Å and a dielectric constant of 4 using the CHARMm force field were set, as described in Section 2.3.

2.11. In Silico Screening

The conformers with the best mapping on PH4 pharmacophores in each cluster was selected for virtual screening using the complexation QSAR model. For each E:I complex, the relative complexation Gibbs free energies G com was calculated. This was then used to compute the predicted activities ( pIC 50 pre ) of each of the newly designed analogues against FP3. The IC 50 pre values were then calculated using the formula IC 50 pre = 10 ( 9 pIC 50 pre ) .

3. Results and Discussion

3.1. Selection of Training and Validation (or Test) Data Sets

A data set of ten (10) FP3 inhibitors with a broad range of in vitro activities ( IC 50 exp ) , obtained from the same laboratory, with a sufficiently broad range of activities (60–47,230nM) [24] were used to generate a 3D-QSAR model. This was divided into a training set of nine (9) inhibitors used to build the QSAR model and a validation set of three (3) inhibitors for evaluating the model (Table 1 and Figure 1).

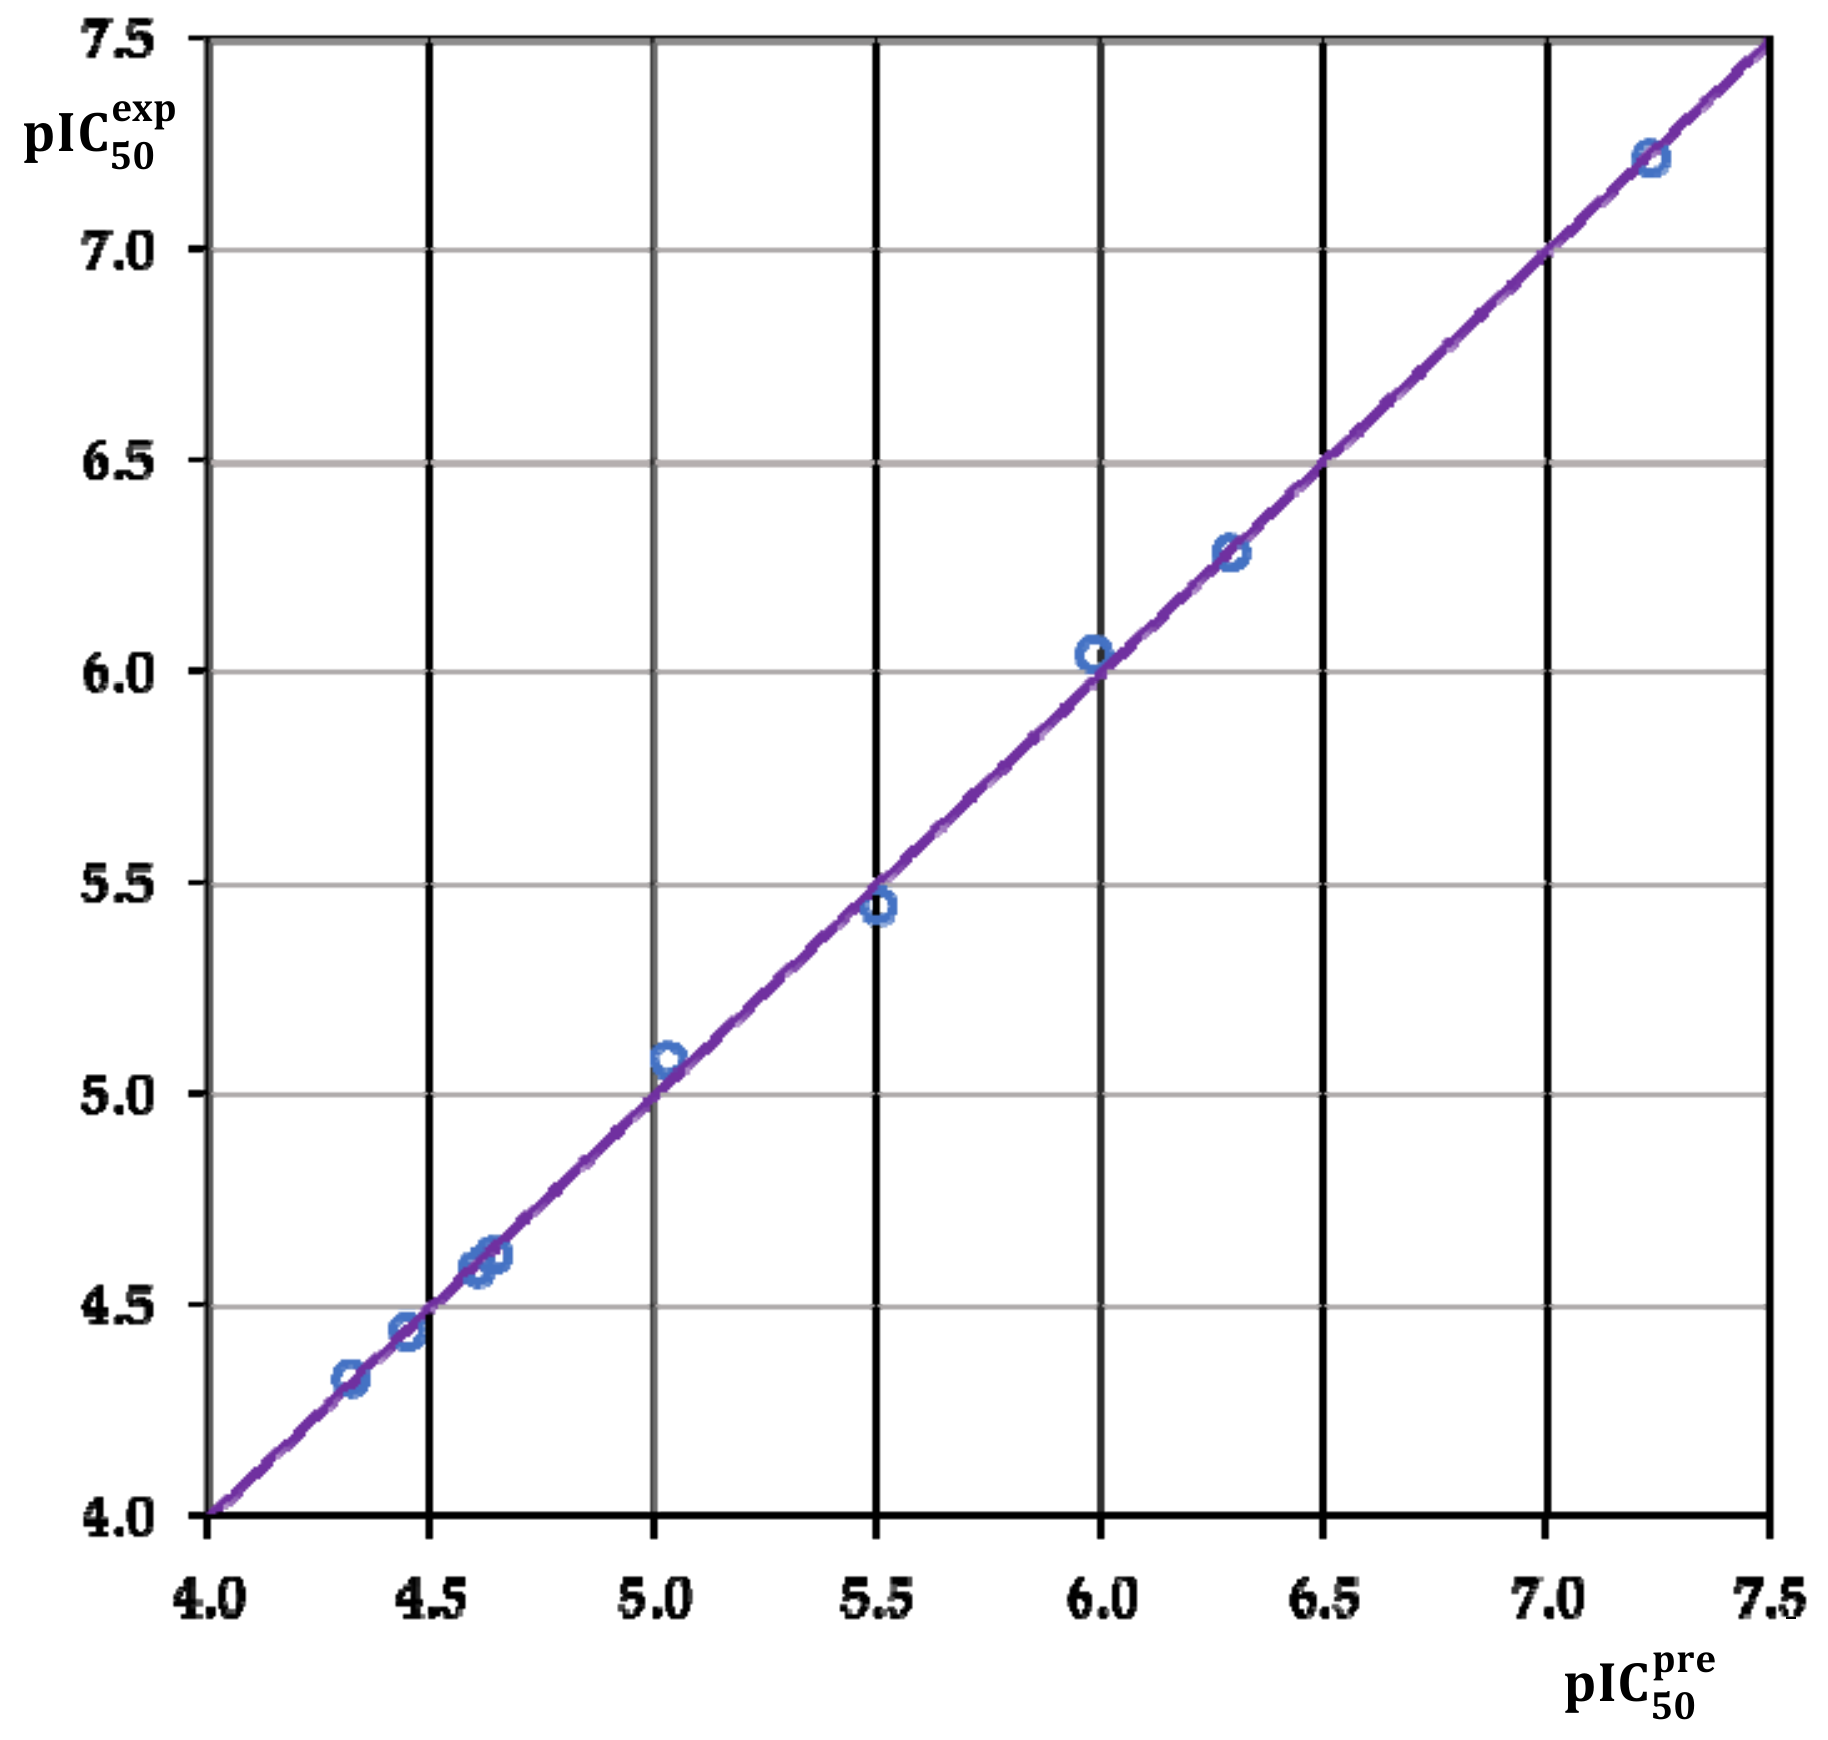
3.2. Obtained QSAR Model

The relative Gibbs free energy of the non-covalent enzyme-inhibitor (E:I) complex formation from free enzyme (E) and free inhibitor (I), shown in the Experimental Section, were computed for each FP3-PEPx prepared complex. This was carried out by modifying in situ of the inhibitor K11017 within the binding site of FP3 of the refined crystal structure, with PDB ID: 3BWK [30,31]. Table 2 provides the computed values of complexes formation GFE ( G com ) and its components (see Experimental Section). Since the G com values were computed in an approximate way, the relevance of the binding model is evaluated by correlating it with the experimental activity data ( IC 50 exp ) using linear regression; see Table 3.
For this training set, a plot of the linear correlation is shown in Figure 2 and the statistical data of the regression are provided in Table 3. For the correlation involving G com , the relatively high regression coefficient on the values, together with the statistical significance Fischer F-test, suggest that there is no chance correlation between the binding mode and the observed inhibitory potencies of the training set.
The ratio of the predicted and observed inhibition constants pIC 50 pre / pIC 50 exp for the validation set of three PEPs (not included in the training set) were closed to 1. This proves the predictive power of the QSAR model, suggesting that the regression equation (A) (Table 3), and the computed G com quantities of the newly designed PEP analogues can be used to predict their inhibitory potencies ( IC 50 pre ) against FP3, on condition that the binding modes of the designed analogues and those of the training set compounds are the same relative to the receptor site. Such an approach could reduce the required number of molecules to be synthesised in a rational drug development project quite considerably. The above procedure has been previously applied by our team in several drug design projects [34,36,38,39,40,41,42,43,44,45,46,47].

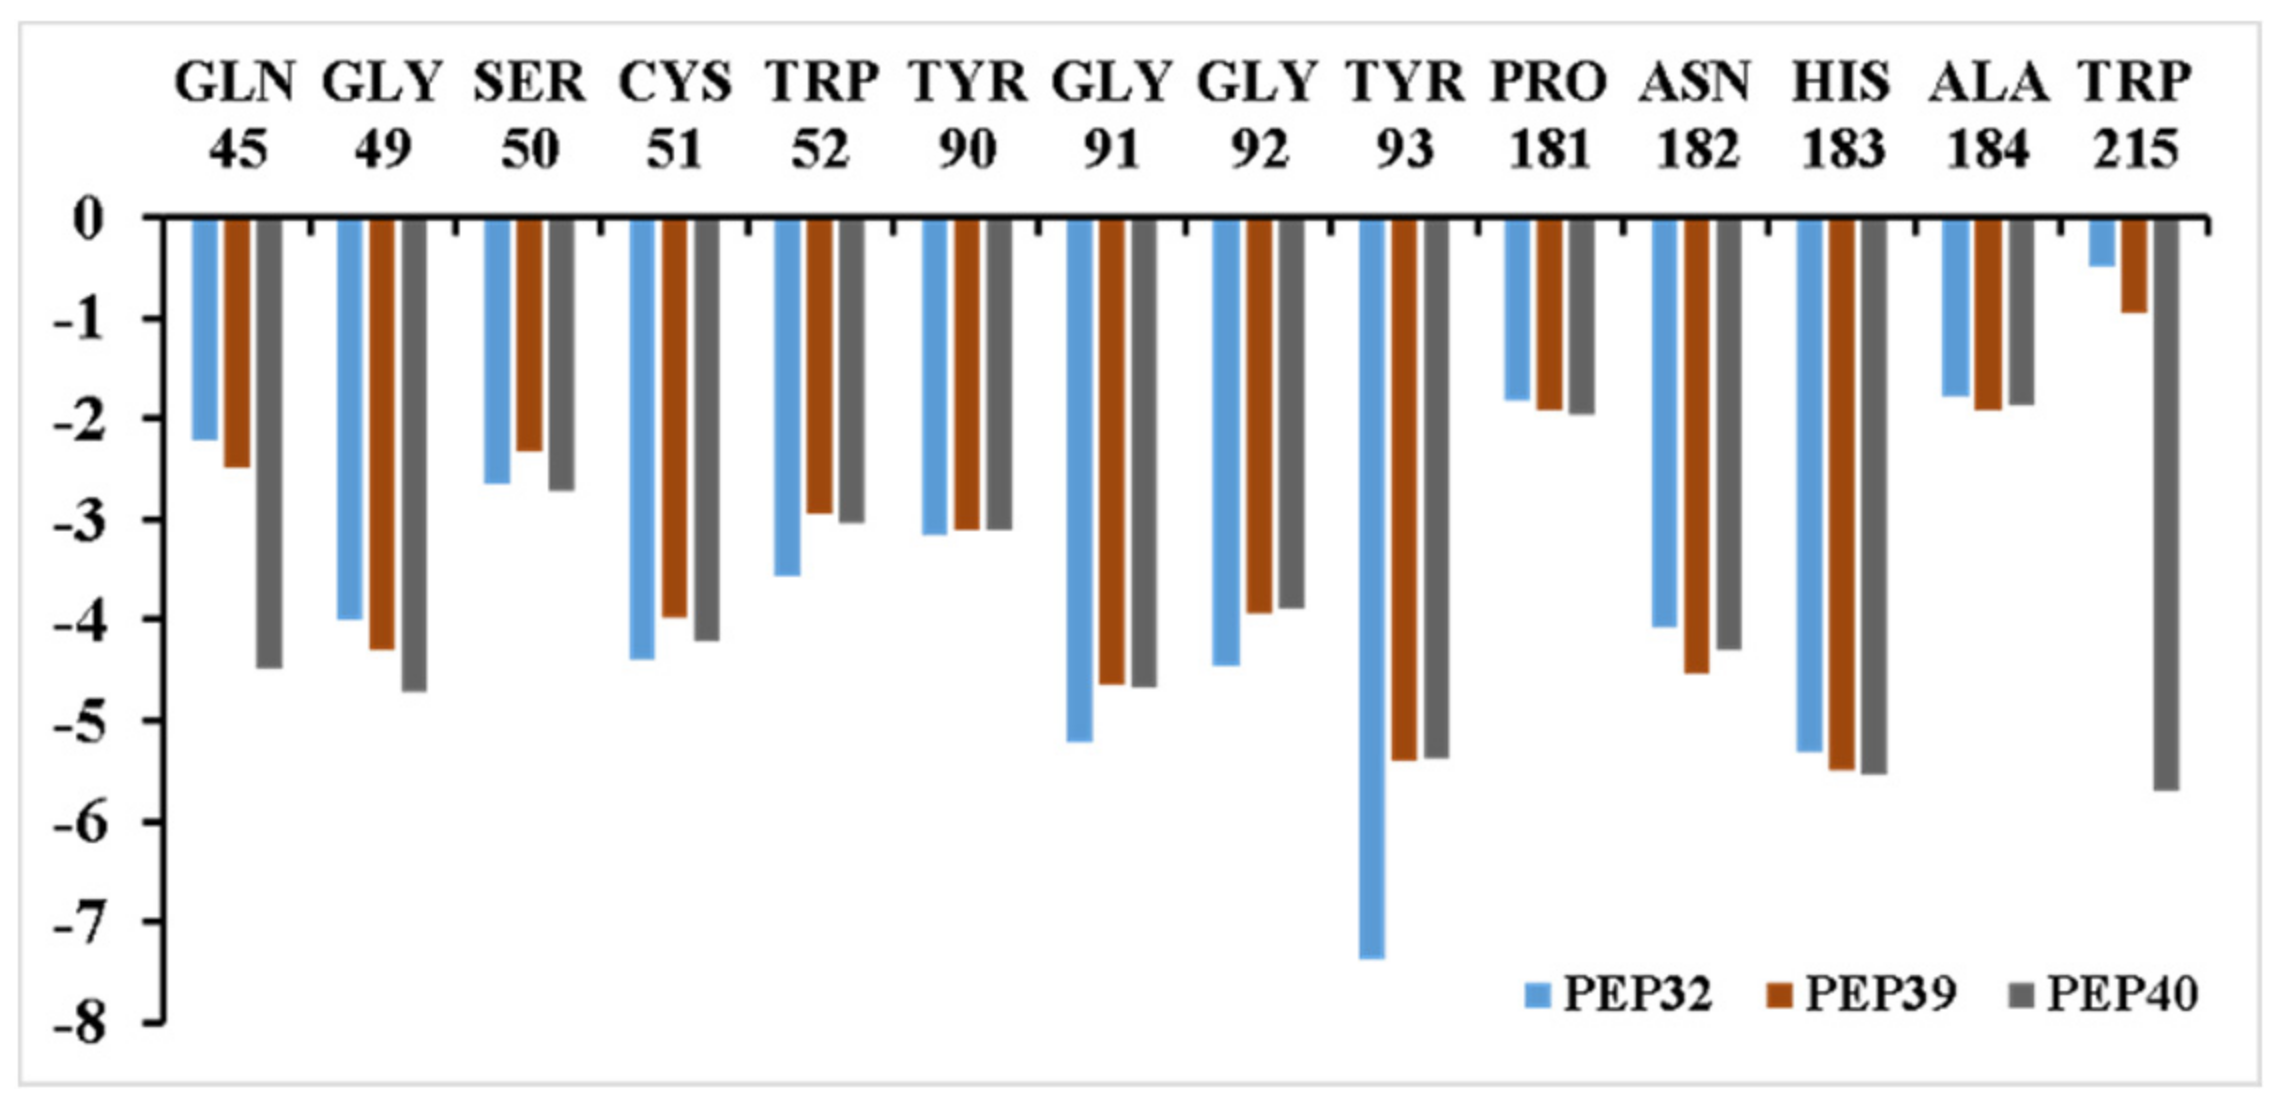
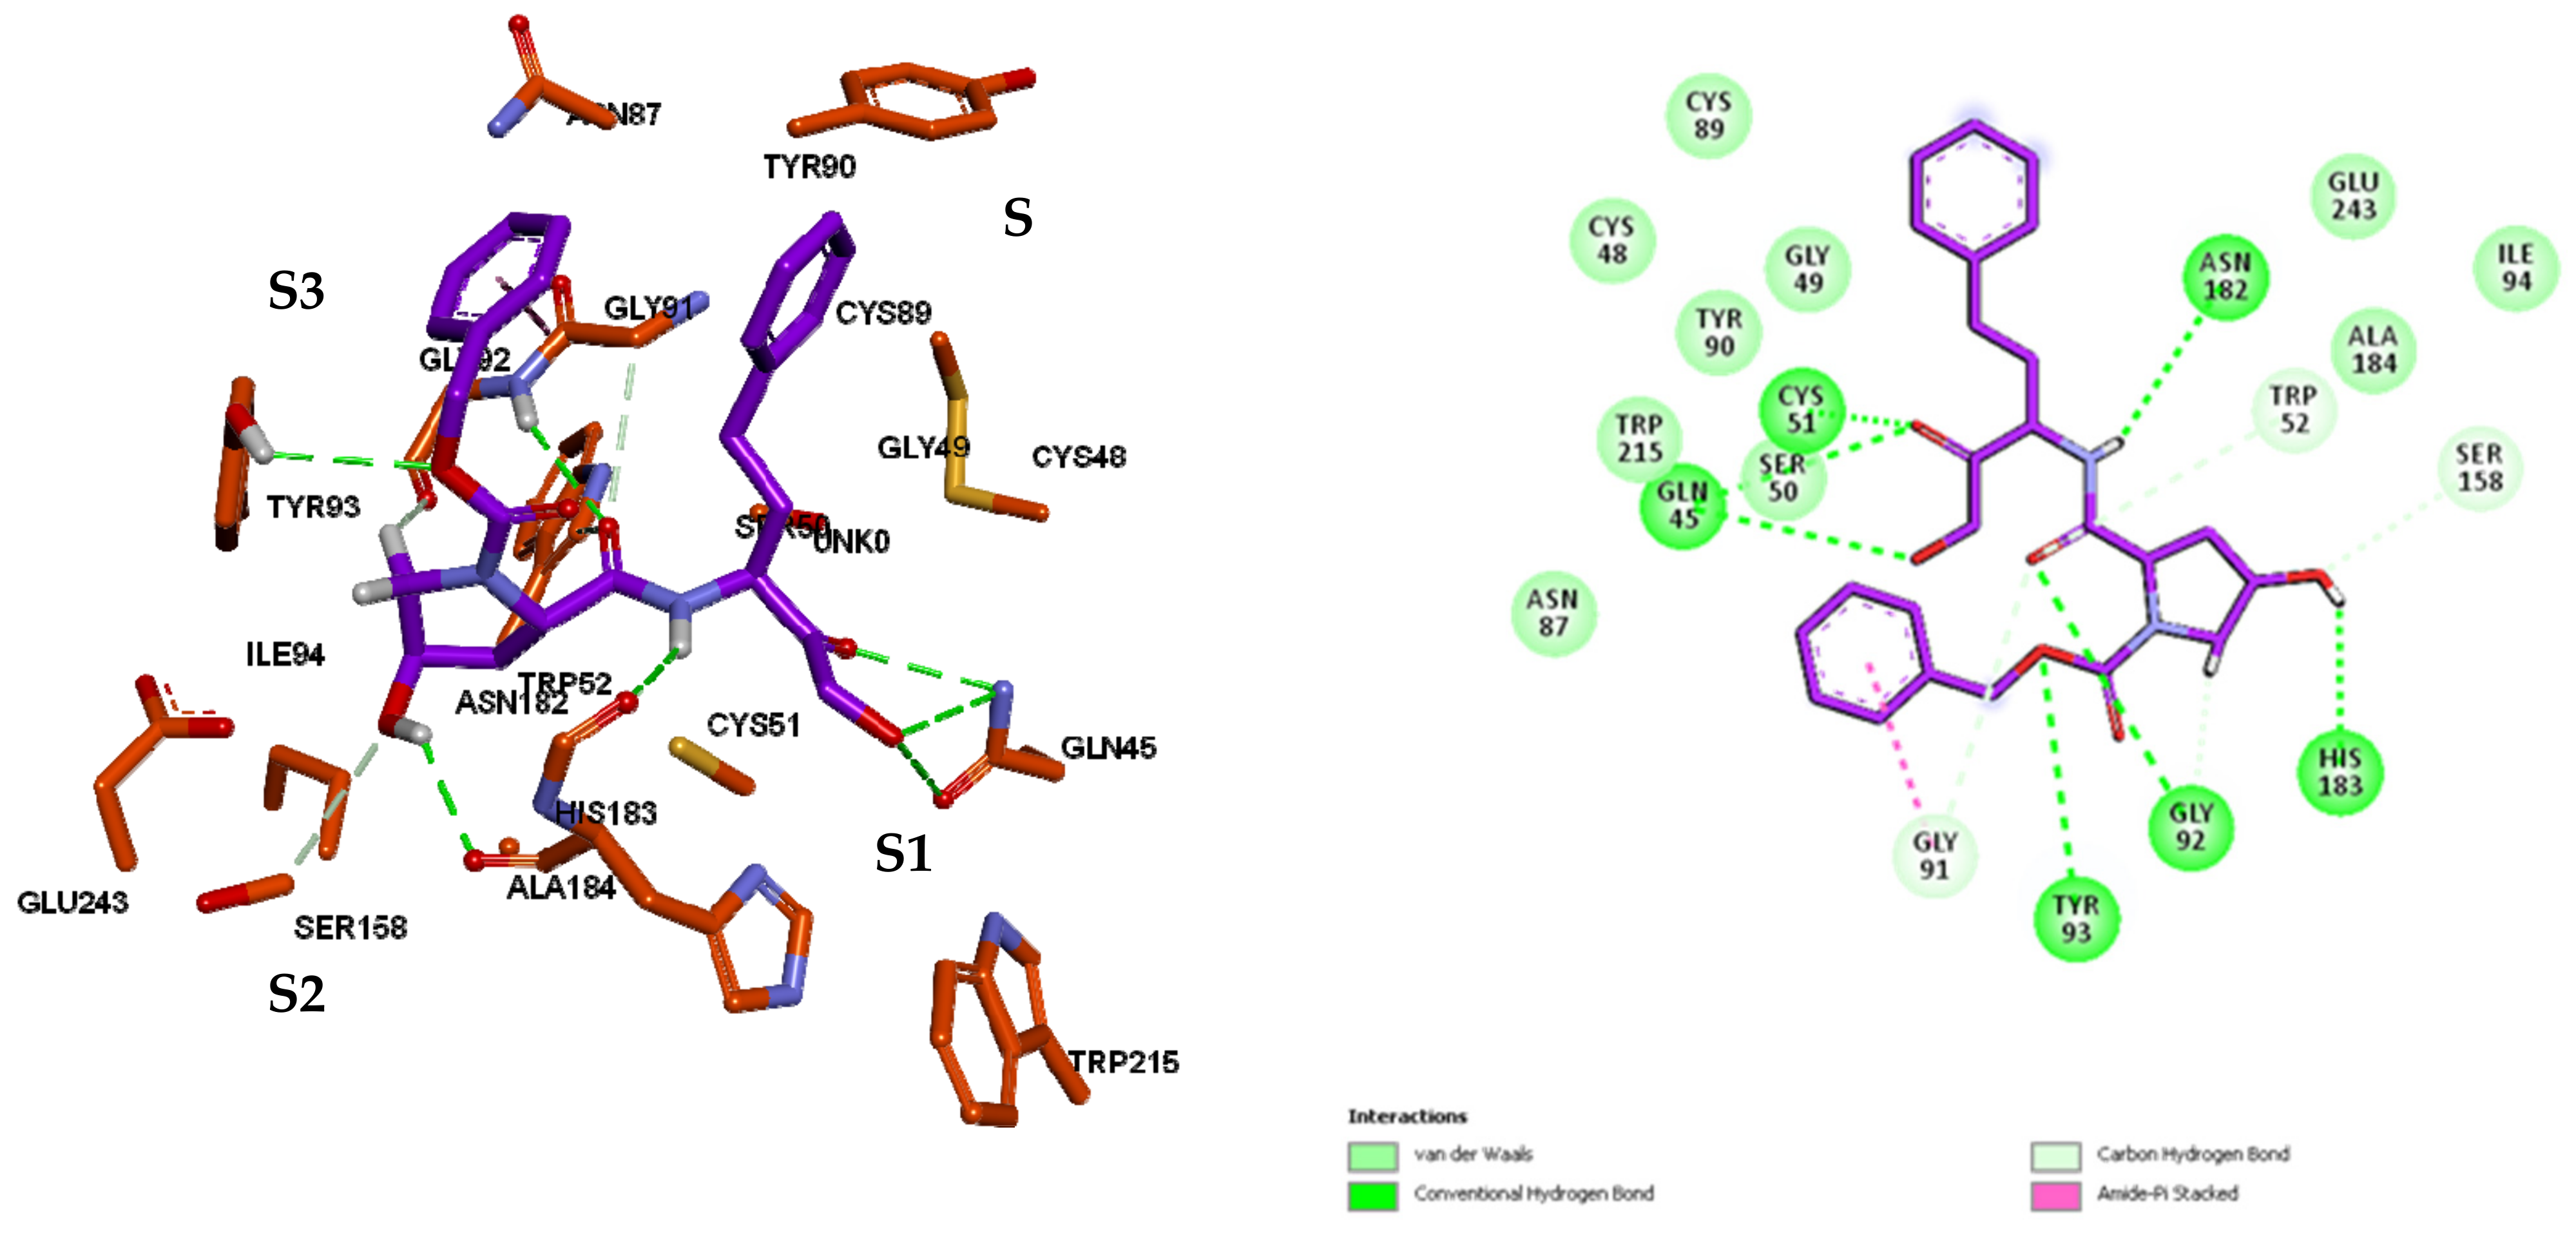
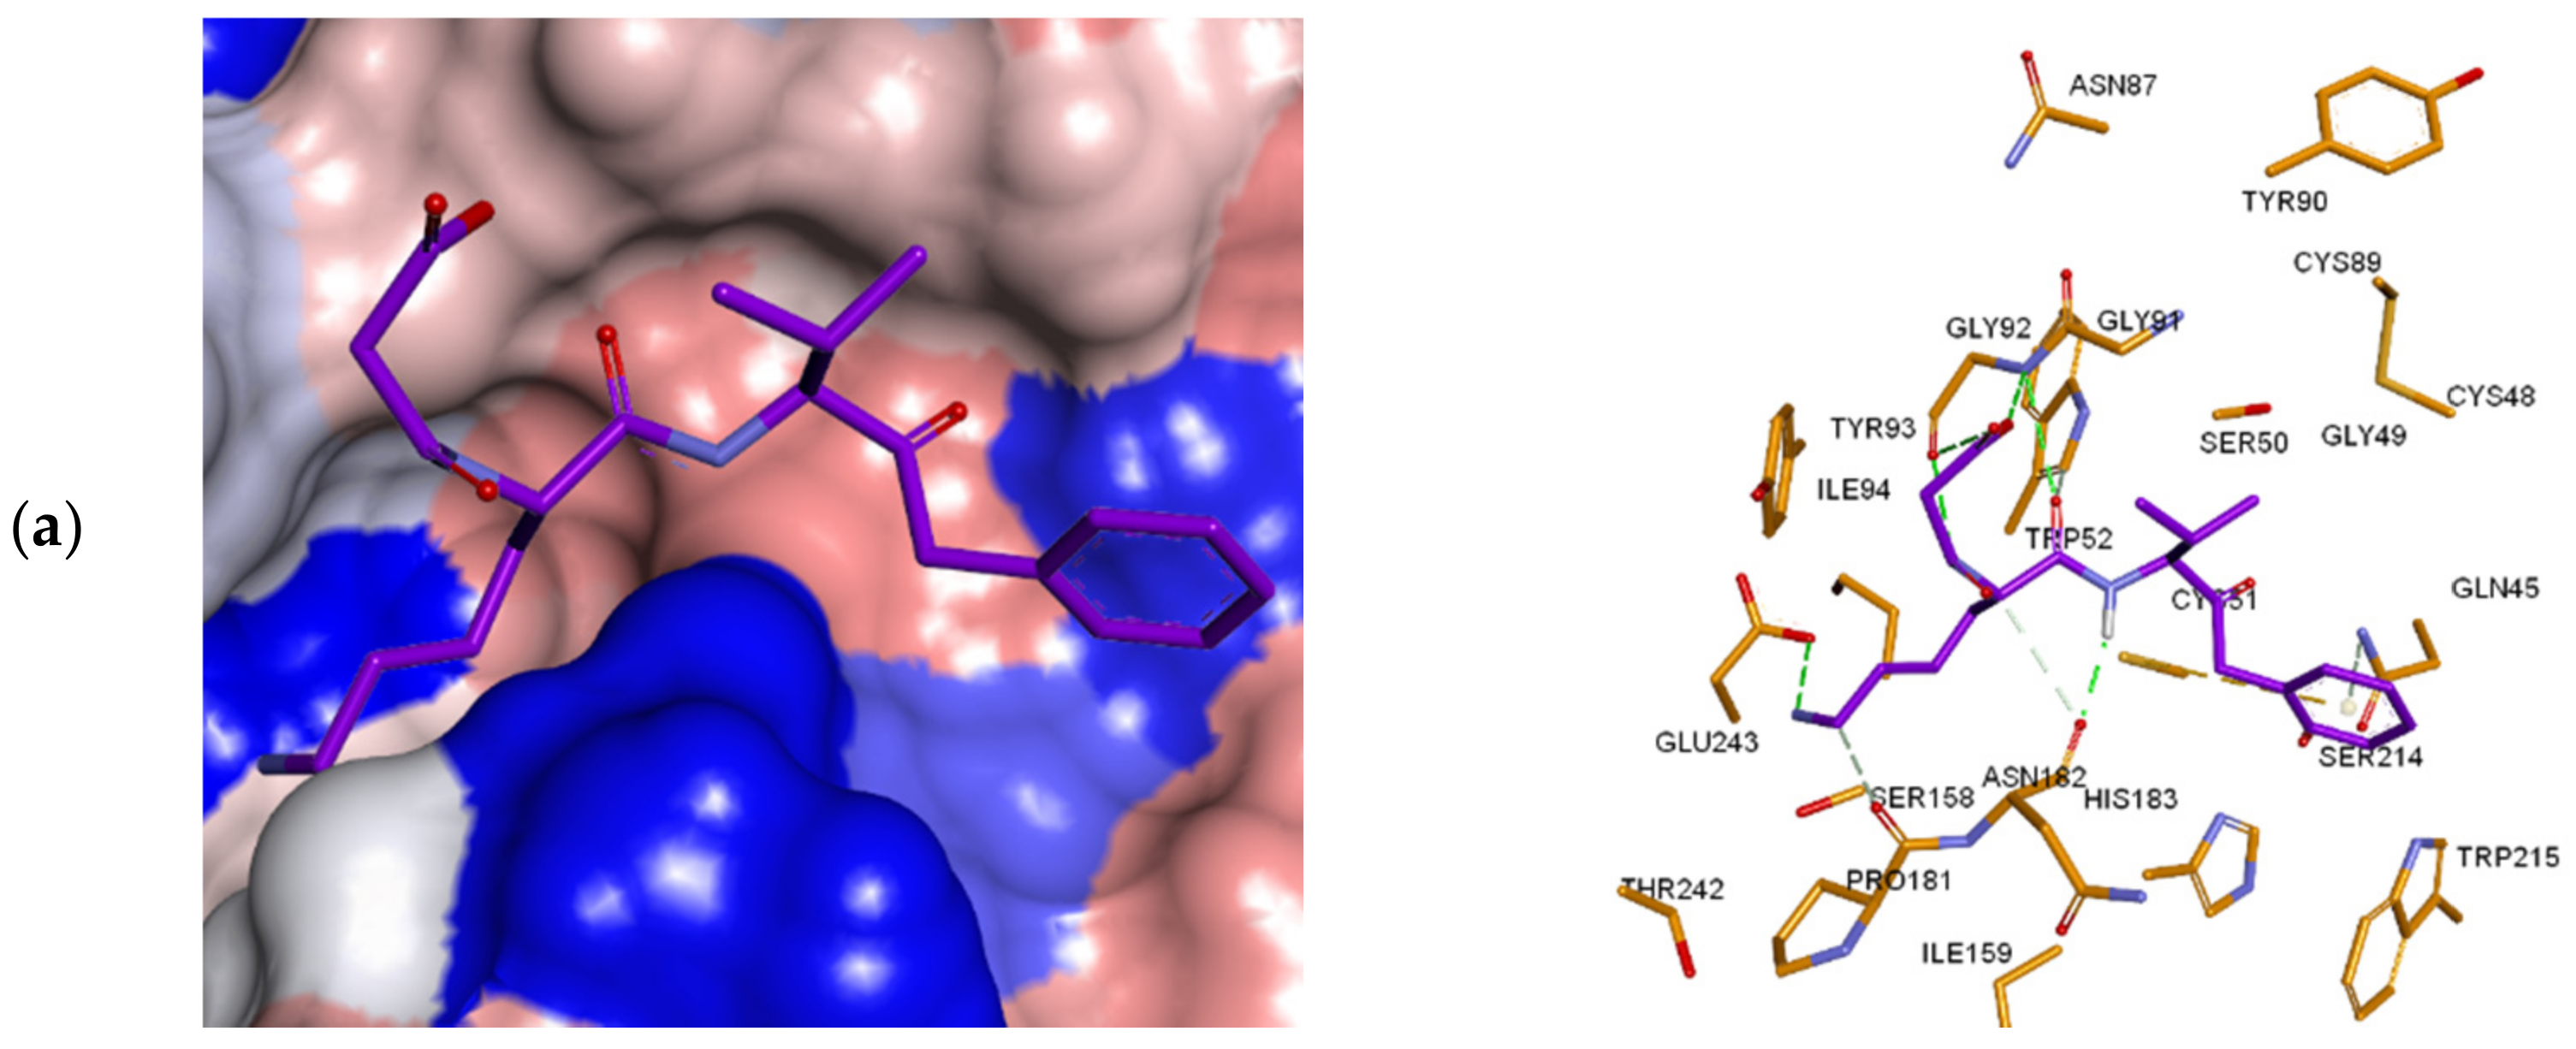
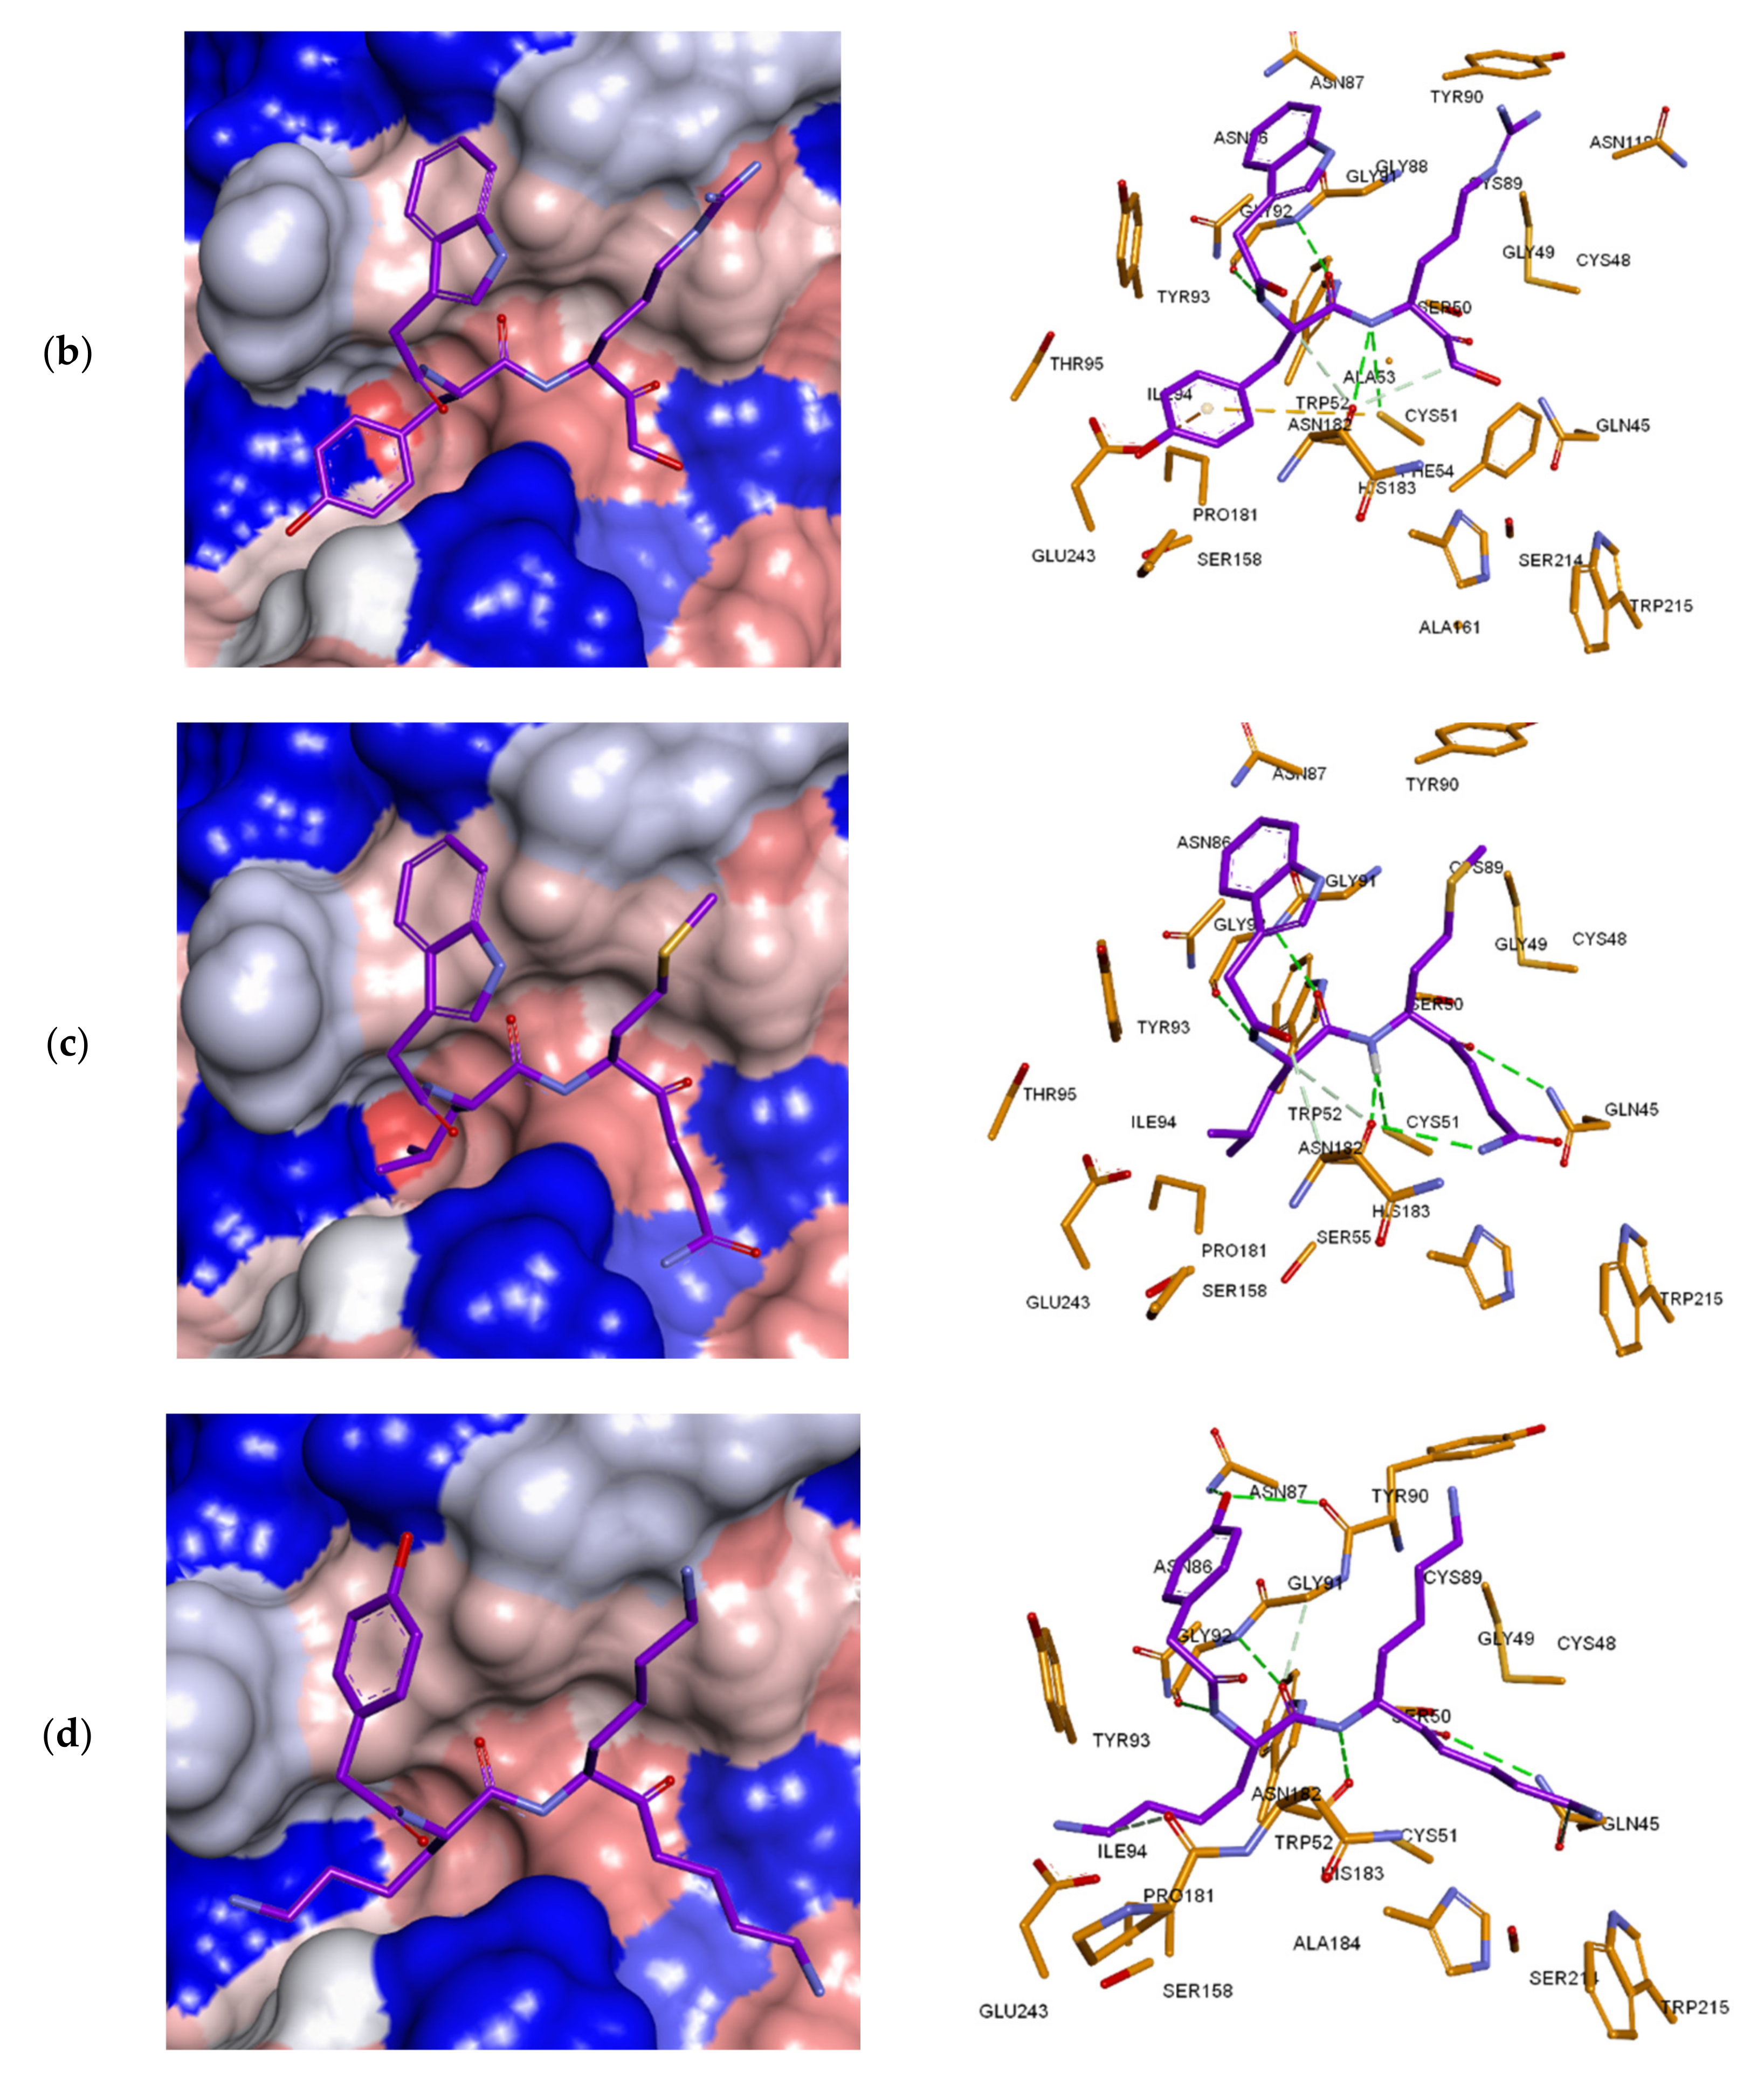
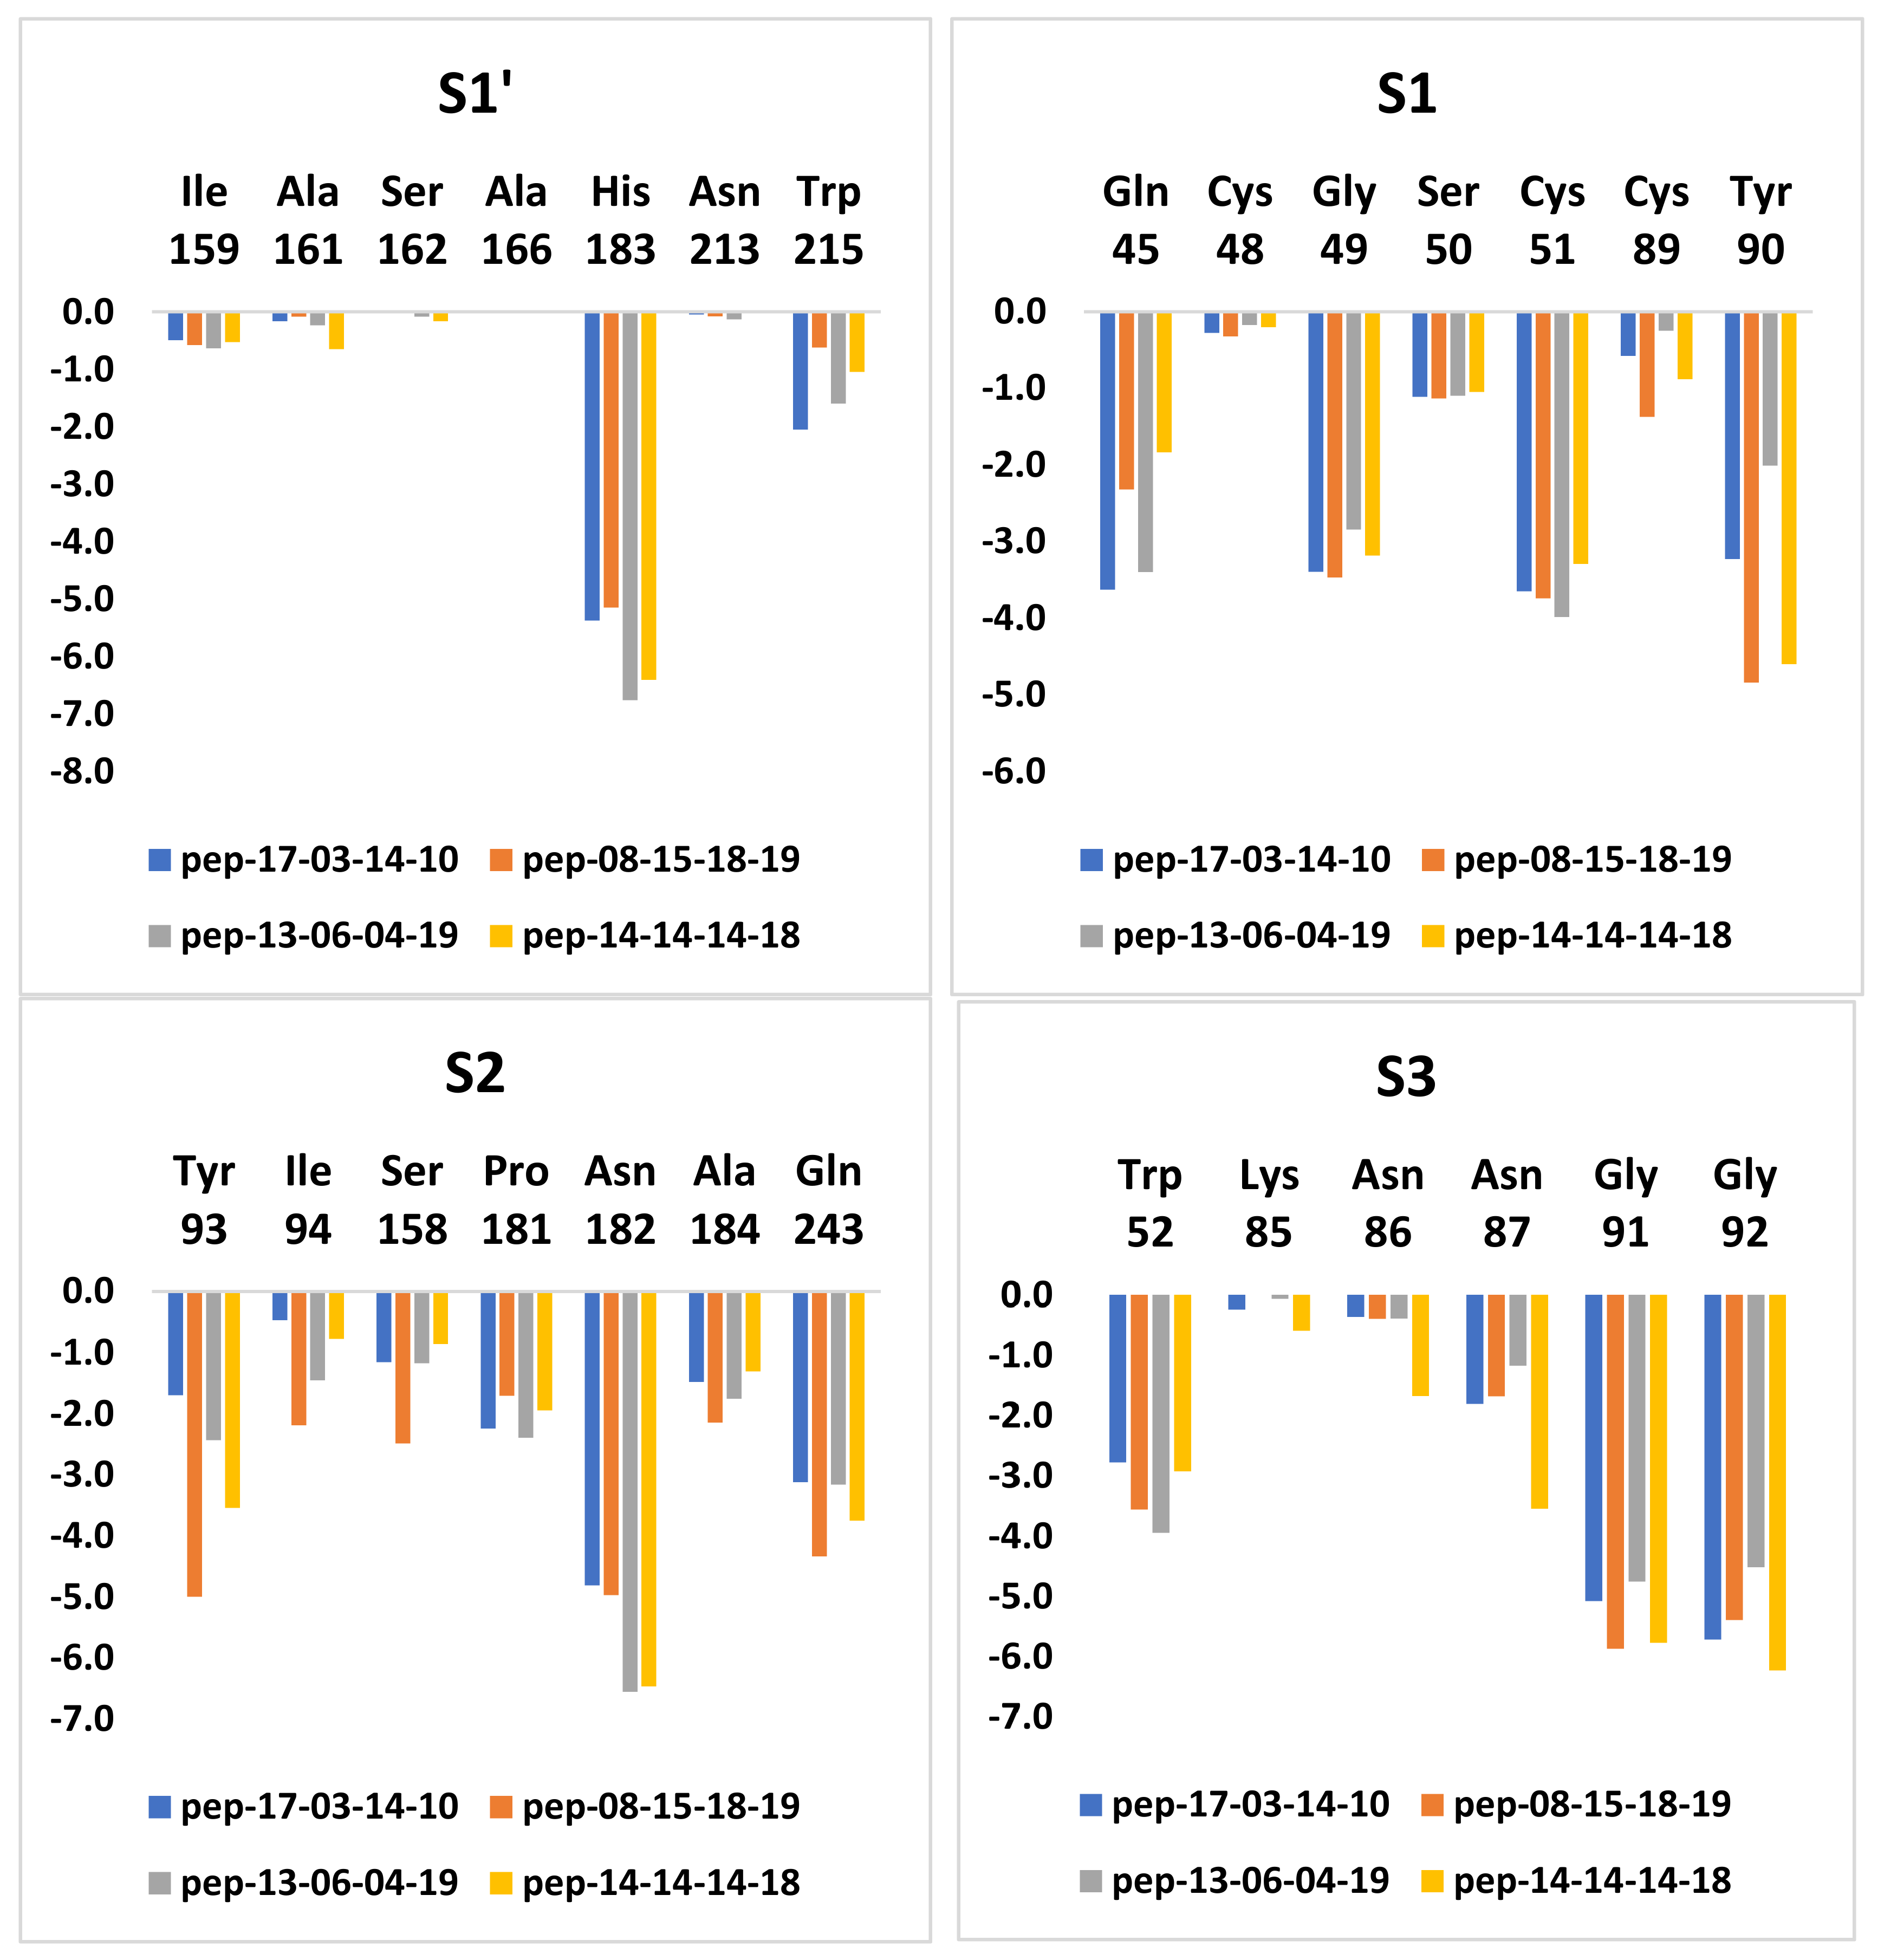
3.3. Inhibitor Binding Modes

The predicted binding mode of the best active PEP39 coming from the complexation model is illustrated in 3D depiction in Figure 3. The main interactions with the active site residues, namely the H-Bond with the catalytic residue Cys51, are in line with the docking study and WaterMap calculations [24] which, unfortunately, did not provide any statistical correlation between binding affinity and activity (results not shown). The bound conformation of PEP sheds light on the structural features for binding affinity, which are vital for the design of novel potent non-peptidic FP3 inhibitors by exploiting the S1′ to S3 pockets (Figure 4) [30]. In order to verify whether other interesting interactions not displayed have to be taken into account in the description of PEP binding mode at the FP3 active site for the rational design of new analogues, the interaction energy (IE) between each active site residue and PEPx was computed. The breakdown of the interaction energy diagram into each S1′-S3 subsite residue contribution of FP3 for PEPs, displayed in Figure 3, indicates the highest interacting residues of the overall active site of FP3. Moreover, the predicted binding mode of PEP inhibitors highlights three main favourable non-bond interactions (Figure 4): conventional hydrogen bonds with residues GLN 45, GLY 92, TYR 93, ASN 182 and HIS 183; carbon hydrogen bonds involving residues GLY 91, GLY 92 and SER 158; GLY 91 and GLY 92 are still interacting through hydrophobic amide Pi stacking; van der Waals contacts (hydrophobics) with CYS 48, GLY 49, TRP 52, ASN 87, CYS 89, ILE 94, ALA 184, GLU 243 and TRP 215.
It was observed that the IE diagrams analysis could not significantly guide the choice of the R-groups in S1’ and S2 subsites [30], when compared with the case for the design of thymine-like inhibitors of thymidine monophosphate kinase [41]. It would rather be suggested that a large and diverse combinatorial virtual library (VL) of PEPs be built and screened with our FP3 inhibition 3D-QSAR PH4, based on the complexation one descriptor QSAR model. A successful case study was the design of pyrrolidine carboxamide inhibitors of Mycobacterium tuberculosisInhA [42].

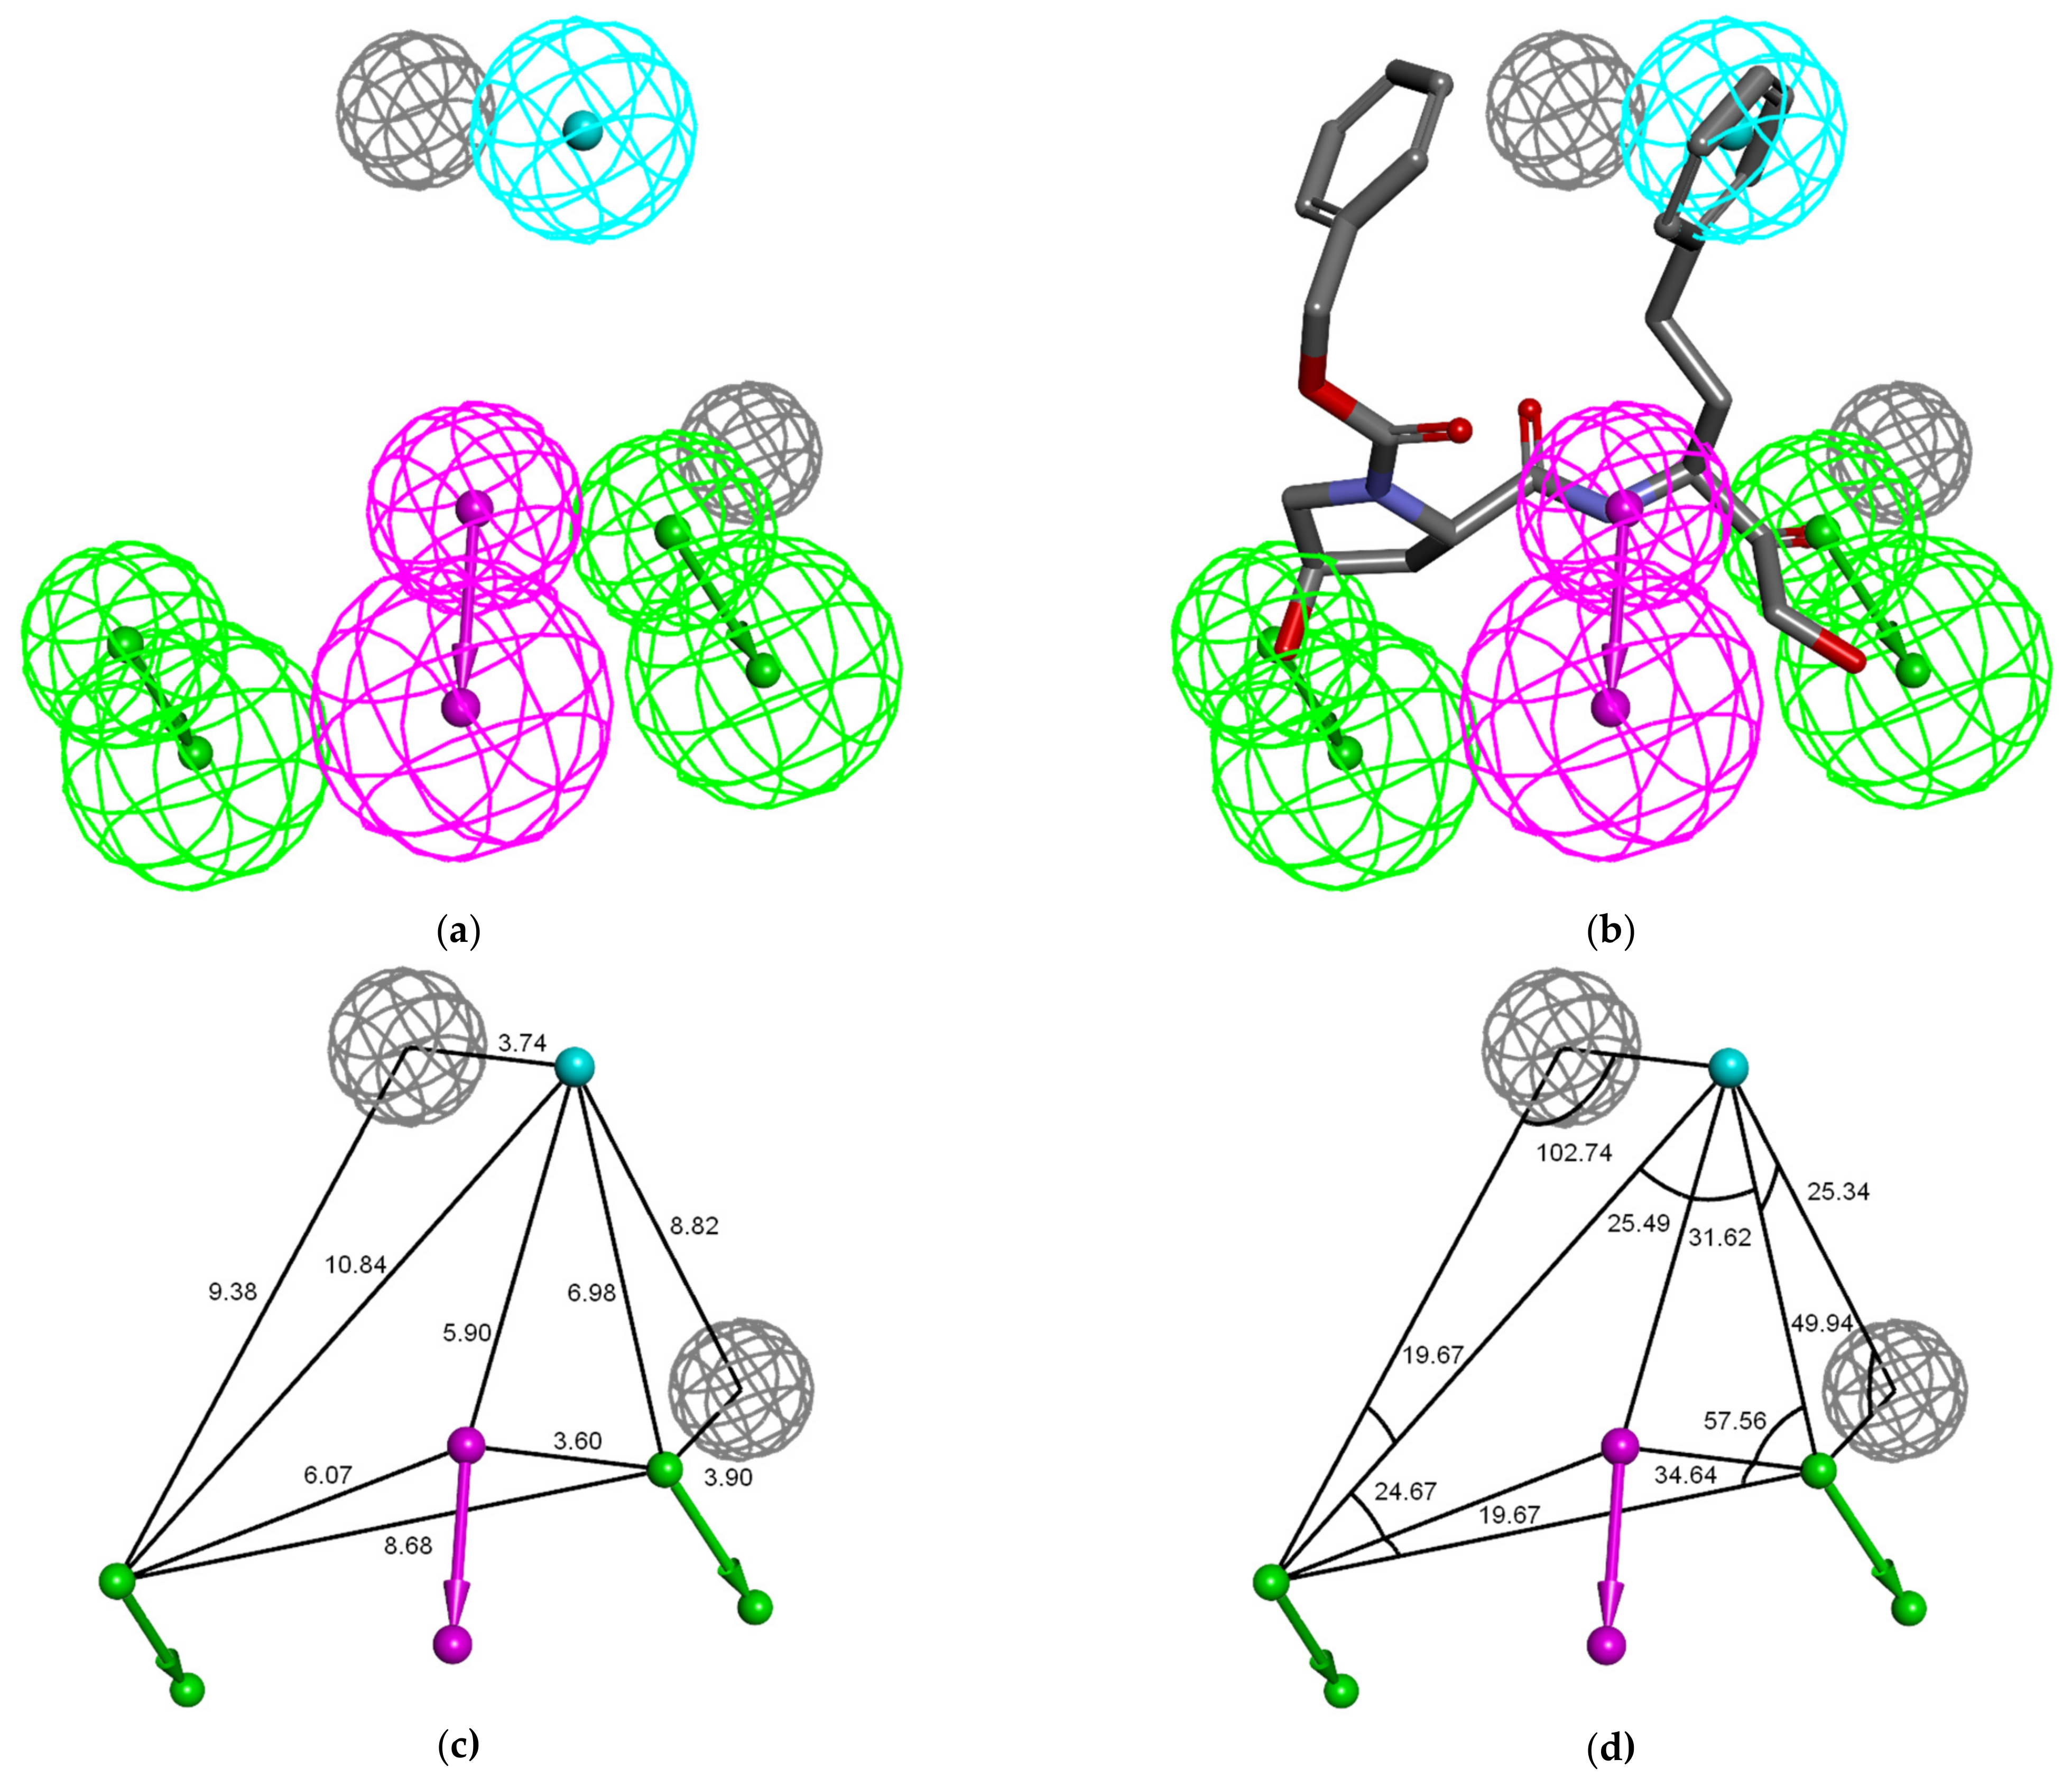
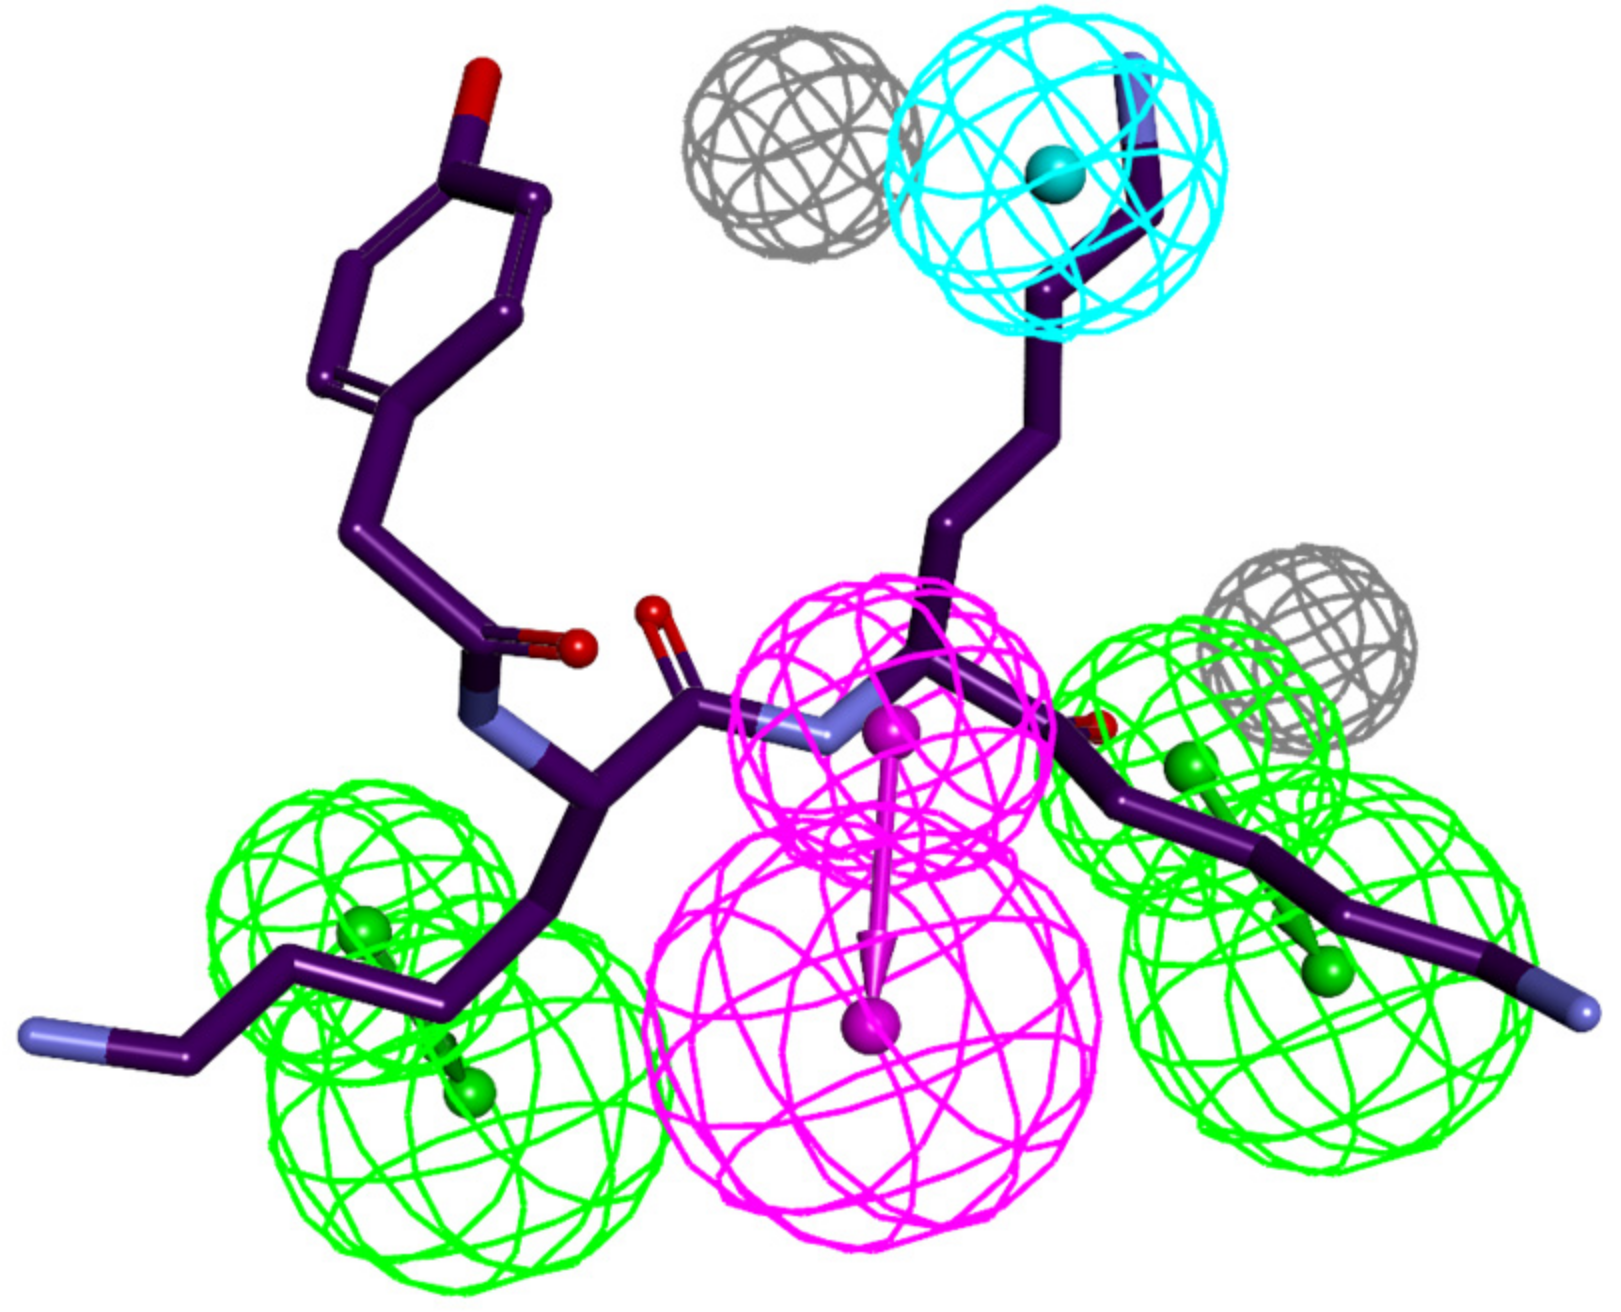
3.4. Ligand-Based 3D-QSAR PH4 Model of FP3 Inhibition

The 3D-QSAR PH4 pharmacophore generation process follows three main steps, namely the constructive, the subtractive and the optimisation steps [33]. The constructive phase of Hypo-Gen has automatically selected the most active compounds for which IC 50 exp 1.1 × 60 nM as leads. Thus, only the most active compound PEP39 ( IC 50 exp = 60 nM) was used to generate the starting PH4 features. Only those features that matched this lead were retained. In the subtractive phase, which is normally used to remove pharmacophoric features present in poorly active molecules, none of the training set compounds were found to be inactive ( IC 50 exp > 60 × 10 3.5 = 189 , 736   nM ). During the optimisation phase, the score of the pharmacophoric hypothesis is improved. Hypotheses are scored according to errors in activity estimates from regression and complexity via a simulated annealing approach. At the end, the top scoring 10 unique pharmacophoric hypotheses (Table 4) were kept, all displaying four features. The generated pharmacophore models were then assessed for their reliability based on the calculated cost parameters. The overall costs ranged from 24.13 (Hypo1) to 456.44 (Hypo10). The relatively small gap between the highest and lowest cost parameter corresponds well with the homogeneity of the generated hypotheses and the consistency of the training set. For this PH4 model, the fixed cost (21.24) is lower than the null cost (2317.26) by a difference = 2296. This difference Is a major quality indicator of the PH4 predictability ( > 70 corresponds to an excellent chance or a probability higher than 90% that the model represents a true correlation [33]). To be statistically significant, the hypotheses have to be as close as possible to the fixed cost and as far as possible from the null cost. The cost distance ∆ ≥ 1860 for the set of 10 hypotheses confirms the high quality of the pharmacophore model.
The standard indicators such as the RMSDs between the hypotheses ranged from 0.79 to 9.83 and the squared correlation coefficient (R2) falls to an interval from 0.90 to 0.99. The first PH4 hypothesis with the best RMSD and R2 was retained for further analysis. The statistical data for the set of hypotheses (costs, RMSD, R2) are listed in Table 4. The geometry of the Hypo1 pharmacophore of FP3 inhibition is displayed in Figure 5. Table 5 lists the regression equation (Table 3) for pIC 50 exp vs. pIC 50 pre estimated from Hypo1 with related indicators such as R 2 , R xv 2 , Fisher F-test, σ and α , while Figure 6 displays a plot of regression equation for pIC 50 exp   vs .   pIC 50 pre . To check the consistency of the generated pharmacophore model, we have computed the ratio of predicted and observed activities ( pIC 50 pre / ( pIC 50 exp ) for the validation set. The computed ratios are as follows: PEP26 (1.01), PEP28 (1.01), PEP36 (1.01) all of them relatively close to one, which documents the substantial predictive power of the regression for the best PH4 model.
The configuration cost (11.85 for all hypotheses) far below 17 confirms this pharmacophore as a reasonable one.
The link between the 98% significance and the number 49 scrambled runs of each hypothesis is based on the formula S = [1 − (1 + X)/Y] × 100, with X as the total number of hypotheses having a total cost lower than the original hypothesis (Hypo 1) and Y the total number of HypoGen runs (initial + random runs): X = 0 and Y = (1 + 49), hence 98% = {1 − [(1 + 0)/(49 + 1)]} × 100.
The evaluation of Hypo 1 was performed first through Fisher’s randomisation cross-validation test. The Cat-Scramble program was used to randomise the experimental activities of the training set. At 98% confidence level, each of the 49 scramble runs created 10 valid hypotheses, using the same features and parameters as in the generation of the original 10 pharmacophore hypotheses.
Among them, the cost value of Hypo1 is the lowest compared with those of the 49 randomly generated hypotheses, as we can see in Table 4, where the lowest cost of the 49 random runs is listed for each original hypothesis, and none of them was as predictive as the original hypotheses generated shown in Table 4. Thus, there is a 98% probability that the best selected hypothesis Hypo1 represents a pharmacophore model for inhibitory activity of peptidomimetics with a similar level of predictive power as the complexation QSAR model, which relies on the PEPx active conformations from 3D structures of the FP3-PEPx complexes and computed GFE of enzyme–inhibitor binding G com . Another evaluation of Hypo 1 is the mapping of the best active training set PEP39 (Figure 5) displaying the geometry of the Hypo1 pharmacophore of FP3 inhibition. The regression equation for pIC 50 exp vs. pIC 50 pre estimated from Hypo1: pIC 50 exp = 1.0002 × pIC 50 pre 0.0012   (n = 9, R 2 = 0.99, R xv 2 = 0.99, F-test = 5675.56, σ = 0.04, α > 98 %) is also plotted on Figure 5.

3.5. Library Design and ADME Focusing

In order to identify more potent PfFP3 peptidomimetics inhibitors, we have built a virtual library of new analogues inhibitors of PfFP3 based on substitutions at four positions (P1′, P1, P2 and P3) of a scaffold of a dipeptidic compound in order to better FP3 active site four pockets S1′, S1, S2 and S3 [30]. This virtual library was built from the side chains of 20 essential amino acids except the proline side chain. The 19 R-groups listed in Table 6 have been attached in positions R1 to R4 of the appropriate scaffold to provide a combinatorial library of the size: R 1 × R 2 × R 3 × R 4 = 19 4 = 130 , 321 PEPAs.
It should be noted that one of the important criteria for the design of new antimalarials, is their oral bioavailability in the context of oral delivery. Structural information provided from these peptidomimetic computational studies can guide the design of novel antimalarial inhibitors of FP3 deliverable by injection. Therefore, no ADME-based focusing step in order to remove compounds with expected poor oral bioavailability and low drug likeness was performed for the enumerated combinatorial library [64].

3.6. Screening PEPs Virtual Library Using the Obtained in Silico Model

The library of PEP analogues has been further virtually screened for molecular structures matching to the 3D-QSAR PH4 pharmacophore model Hypo1 of FP3 inhibition. During this virtual screening, 1000 conformations were generated for each analogue using the BEST algorithm of Discovery Studio 2.5. Thus 130,321,000 conformations were screened to fit the 3D-QSAR PH4 pharmacophore model Hypo1 retained in this work. From the set of 130,321,000 analogues, few thousands of PEPAs mapped to at least two features, 242 of which mapped to four features of the pharmacophore.Out of then, only the 21 best-fitting analogues (PH4 hits) have been retained and submitted to screening with help of the complexation QSAR model. Their Gibbs free energy (GFE) upon complex formation with PfFP3 has been computed along with its component and their predicted half-maximal inhibitory concentration IC 50 pre has been estimated with the correlation the equation on Table 3. The results obtained are given in Table 7. Of the 21 analogues whose inhibitory activities were predicted in Table 7, 13 showed better activities than the most active compound of the training set among them four showed even more activity: PEP-17-03-14-10 ( IC 50 pre = 0.29 nM); PEP-08-15-18-19 ( IC 50 pre = 0.19 nM); PEP-13-06-04-19 ( IC 50 pre = 0.10 nM); PEP-14-14-14-18 ( IC 50 pre = 0.07 nM).

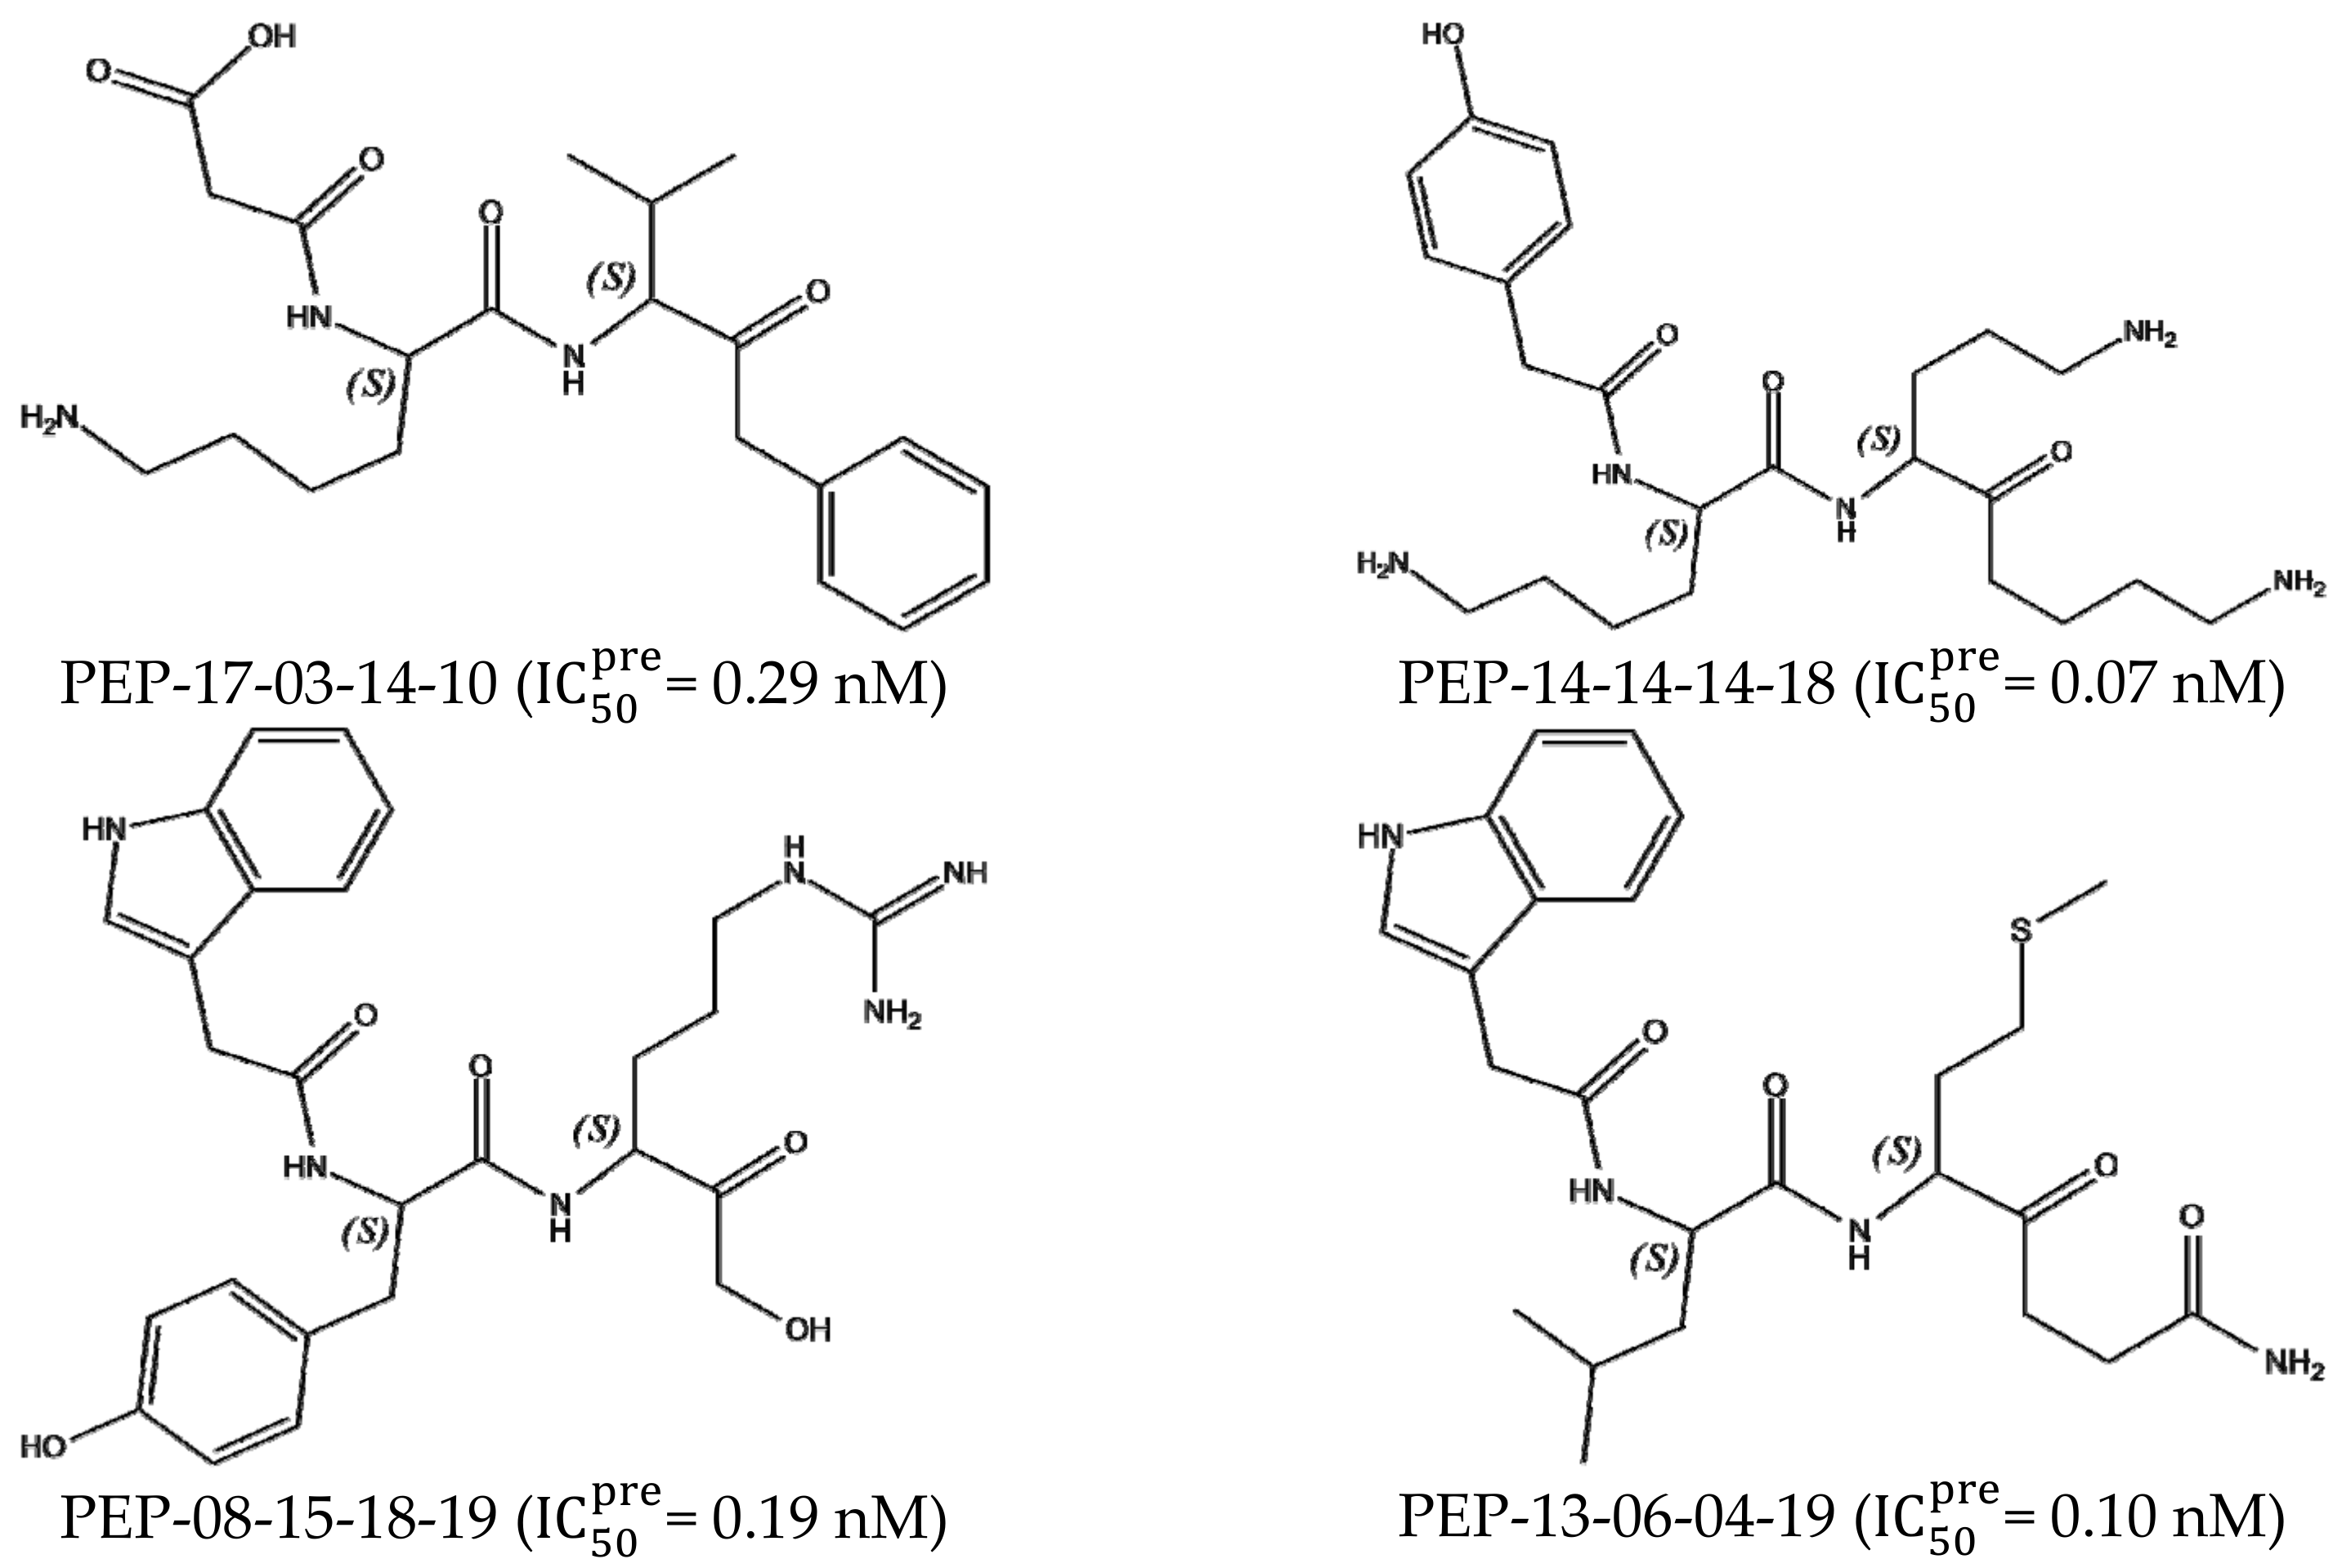
3.7. Analysis of New Inhibitors

In order to identify the substituents that make the analogues predicted to be active, we have analysed the frequency of occurrence of certain substituents chosen from Table 7, on the predicted active analogues. From the four best analogues proposed (seen chemical structure in Figure 7), the following R-groups are present 3, 4, 6, 8, 10, 13, 14, 15, 17, 18 and 19. Additionally, Figure 8 displays the best virtual hit, analogue PEP-14-14-14-18 and the least active PEP32 mapped to a PH4. Figure 9 displays a 2D schematic interaction diagram of the most potent inhibitor PEP39 and the most potent analogue design at the active site of PfFP3 as well as the Connolly surface of the active site of PfFP3.
The FP3–PEPs’ interaction energy breakdown to active site residues displayed on Figure 10 is classified according to the enzyme’s four pockets S1, S2, S3 and S1′ for the top four analogues (PEP-Top4). The interaction energy between FP3 and the most active training set compound PEP39 ( IC 50 exp = 60 nM) breakdown is presented on Figure 3 where only residues with noticeable contributions are displayed. The sum of residues’ contribution to E int for the S1 pocket is almost the same for PEP39 and PEP-Top4 as is the case for the S1′ pocket, where a slight difference of 1   kcal   mol 1 in favour of PEP-Top4 is noticed. For pocket S2 PEP-Top4 the sum of energy is lower by about 5   kcal   mol 1 compared with PEP39. The same stabilising effect of 6   kcal   mol 1 in favour of PEP-Top4 is detectable for pocket S3.

4. Conclusions

Structural information from the crystal structure of the FP3-K11017 complex has been successfully used to establish a reliable QSAR model of non-covalent PfFP3 inhibition by peptidomimetic (PEP) inhibitors. This model correlates the unique descriptor, namely the computed Gibbs free energies (GFE) upon complex formation, with observed inhibitory potencies and is able to identify a few predicted low nanomolar range inhibitors of P. falciparum. As GFE is a combined descriptor involving the enthalpic gas phase, entropic contributions and solvation free energy, a precise insight into S1’ and S3 pockets filling has been performed from the model by analysis of interactions between the enzyme active-site residues and the inhibitor. For this purpose, the breakdown of the interaction energy clearly indicated the residues involved in the affinity with the most active inhibitors. This information has helped to design an initial diversity virtual combinatorial library of new analogues to be screened by the pharmacophore models derived from the GFE QSAR. The screened library by mapping of the analogues to the PfFP3 inhibition PH4 pharmacophore permitted a library subset of 21 best virtual hits to be selected, which was further submitted to the computation of predicted PfFP3 inhibitory potencies by the formerly established complexation QSAR model. The best cross checked analogues showed predicted activities in the low nanomolar concentration range, with the most promising hits being PEP-08-15-17-19 ( IC 50 pre = 0.67 nM); PEP-10-18-18-19 ( IC 50 pre = 0.40 nM); PEP-15-04-17-03 ( IC 50 pre = 0.34 nM); PEP-17-03-14-10 ( IC 50 pre = 0.29 nM); PEP-08-15-18-19 ( IC 50 pre = 0.19 nM); PEP-13-06-04-19 ( IC 50 pre = 0.10 nM); PEP-14-14-14-18 ( IC 50 pre = 0.07 nM) against PfFP3. These four candidates are proposed for synthesis and biological screening and may lead to a discovery of novel potent peptidomimetic antimalarial.

Author Contributions

Conceptualization, F.N.-K., E.M.; methodology, B.D.B., A.E.E., B.D., M.K. and L.C.O.O. All authors have read and agreed to the published version of the manuscript.

Funding

B.D.B. thanks the African-German Network of Excellence in Science (AGNES) for granting a Mobility Grant in 2017, generously sponsored by German Federal Ministry of Education and Research and the Alexander von Humboldt Foundation, Germany.

Data Availability Statement

Not applicable.

Acknowledgments

F.N.-K. acknowledges a Georg Forster Return Fellowship from the Alexander von Humboldt Foundation, Germany. Financial support for this work is acknowledged from a ChemJets fellowship from the Ministry of Education, Youth and Sports of the Czech Republic awarded to F.N.-K.

Conflicts of Interest

The authors declare no conflict of interest.

References

  1. Bekono, B.D.; Ntie-Kang, F.; Owono Owono, L.C.; Megnassan, E. Targeting cysteine proteases from plasmodium falciparum: A general overview, rational drug design and computational approaches for drug discovery. Curr. Drug Targets 2018, 19, 501–526. [Google Scholar] [CrossRef] [PubMed]
  2. Dye, C. Global epidemiology of tuberculosis. Lancet 2006, 367, 938–940. [Google Scholar] [CrossRef]
  3. WHO. World Malaria Report; WHO: Geneva, Switzerland, 2015. [Google Scholar]
  4. Rosenthal, P.; Sijwali, P.; Singh, A.; Shenai, B. Cysteine proteases of malaria parasites: Targets for chemotherapy. Curr. Pharm. Des. 2002, 8, 1659–1672. [Google Scholar] [CrossRef] [PubMed]
  5. Yeh, I.; Altman, R. Drug targets for plasmodium falciparum: A Post-Genomic Review/Survey. Mini-Rev. Med. Chem. 2006, 6, 177–202. [Google Scholar] [CrossRef] [PubMed]
  6. White, S.W.; Zheng, J.; Zhang, Y.-M.; Rock, C.O. The structural biology of type ii fatty acid biosynthesis. Annu. Rev. Biochem. 2005, 74, 791–831. [Google Scholar] [CrossRef]
  7. Zhang, Y.-M.; Lu, Y.-J.; Rock, C.O. The reductase steps of the type II fatty acid synthase as antimicrobial targets. Lipids 2004, 39, 1055–1060. [Google Scholar] [CrossRef] [PubMed]
  8. Elliott, D.A.; McIntosh, M.T.; Hosgood, H.D.; Chen, S.; Zhang, G.; Baevova, P.; Joiner, K.A. Four distinct pathways of hemoglobin uptake in the malaria parasite plasmodium falciparum. Proc. Natl. Acad. Sci. USA 2008, 105, 2463–2468. [Google Scholar] [CrossRef] [PubMed] [Green Version]
  9. Liu, J.; Gluzman, I.Y.; Drew, M.E.; Goldberg, D.E. The role of plasmodium falciparum food vacuole plasmepsins. J. Biol. Chem. 2004, 280, 1432–1437. [Google Scholar] [CrossRef] [Green Version]
  10. Blackman, M. Proteases involved in erythrocyte invasion by the malaria parasite function and potential as chemotherapeutic targets. Curr. Drug Targets 2000, 1, 59–83. [Google Scholar] [CrossRef]
  11. Eggleson, K.K.; Duffin, K.L.; Goldberg, D.E. Identification and characterization of falcilysin, a metallopeptidase involved in hemoglobin catabolism within the malaria parasite Plasmodium falciparum. J. Biol. Chem. 1999, 274, 32411–32417. [Google Scholar] [CrossRef] [Green Version]
  12. Klemba, M.; Gluzman, I.; Goldberg, D.E. A Plasmodium falciparum dipeptidyl aminopeptidase I participates in vacuolar hemoglobin degradation. J. Biol. Chem. 2004, 279, 43000–43007. [Google Scholar] [CrossRef] [PubMed] [Green Version]
  13. Coterón, J.M.; Catterick, D.; Castro, J.; Chaparro, M.J.; Díaz, B.; Fernández, E.; Ferrer, S.; Gamo, F.J.; Gordo, M.; Gut, J.; et al. Falcipain inhibitors: Optimization studies of the 2-pyrimidinebcarbonitrile lead series†. J. Med. Chem. 2010, 53, 6129–6152. [Google Scholar] [CrossRef]
  14. Sijwali, P.S.; Koo, J.; Singh, N.; Rosenthal, P.J. Gene disruptions demonstrate independent roles for the four falcipain cysteine proteases of plasmodium falciparum. Mol. Biochem. Parasitol. 2006, 150, 96–106. [Google Scholar] [CrossRef] [PubMed]
  15. Ramjee, M.K.; Flinn, N.S.; Pemberton, T.P.; Quibell, M.; Wang, Y.; Watts, J.P. Substrate mapping and inhibitor profiling of falcipain-2, falcipain-3 and berghepain-2: Implications for peptidase anti-malarial drug discovery. Biochem. J. 2006, 399, 47–57. [Google Scholar] [CrossRef] [PubMed] [Green Version]
  16. Ang, K.K.H.; Ratnam, J.; Gut, J.; Legac, J.; Hansell, E.; Mackey, Z.B.; Skrzypczynska, K.M.; Debnath, A.; Engel, J.C.; Rosenthal, P.J.; et al. Mining a cathepsin inhibitor library for new antiparasitic drug leads. PLoS Negl. Trop. Dis. 2011, 5, e1023. [Google Scholar] [CrossRef] [PubMed] [Green Version]
  17. Chibale, K.; Musonda, C. The synthesis of parasitic cysteine protease and trypanothione reductase inhibitors. Curr. Med. Chem. 2003, 10, 1863–1889. [Google Scholar] [CrossRef] [PubMed]
  18. Desai, P.V.; Patny, A.; Gut, J.; Rosenthal, P.J.; Tekwani, B.; Srivastava, A.; Avery, M. Identification of novel parasitic cysteine protease inhibitors by use of virtual screening. 2. The available chemical directory. J. Med. Chem. 2006, 49, 1576–1584. [Google Scholar] [CrossRef]
  19. Rosenthal, P.J.; Wollish, W.S.; Palmer, J.T.; Rasnick, D. Antimalarial effects of peptide inhibitors of a plasmodium falciparum cysteine proteinase. J. Clin. Investig. 1991, 88, 1467–1472. [Google Scholar] [CrossRef] [PubMed] [Green Version]
  20. Rosenthal, P.J.; Lee, G.K.; Smith, R.E. Inhibition of a plasmodium vinckei cysteine proteinase cures murine malaria. J. Clin. Investig. 1993, 91, 1052–1056. [Google Scholar] [CrossRef] [PubMed] [Green Version]
  21. Rosenthal, P.J.; Olson, J.E.; Lee, G.K.; Palmer, J.T.; Klaus, J.L.; Rasnick, D. Antimalarial effects of vinyl sulfone cysteine proteinase inhibitors. Antimicrob. Agents Chemother. 1996, 40, 1600–1603. [Google Scholar] [CrossRef] [PubMed] [Green Version]
  22. Olson, J. Antimalarial effects in mice of orally administered peptidyl cysteine protease inhibitors. Bioorg. Med. Chem. 1999, 7, 633–638. [Google Scholar] [CrossRef]
  23. Verissimo, E.; Berry, N.; Gibbons, P.; Cristiano, M.L.S.; Rosenthal, P.J.; Gut, J.; Ward, S.A.; O’Neill, P.M. Design and synthesis of novel 2-pyridone peptidomimetic falcipain 2/3 inhibitors. Bioorg. Med. Chem. Lett. 2008, 18, 4210–4214. [Google Scholar] [CrossRef] [PubMed]
  24. Weldon, D.J.; Shah, F.; Chittiboyina, A.G.; Sheri, A.; Chada, R.R.; Gut, J.; Rosenthal, P.J.; Shivakumar, D.; Sherman, W.; Desai, P.; et al. Synthesis, biological evaluation, hydration site thermodynamics, and chemical reactivity analysis of α-keto substituted peptidomimetics for the inhibition of plasmodium falciparum. Bioorg. Med. Chem. Lett. 2014, 24, 1274–1279. [Google Scholar] [CrossRef] [PubMed]
  25. Potshangbam, A.M.; Tanneeru, K.; Reddy, B.M.; Guruprasad, L. 3D-QSAR and molecular docking studies of 2-pyrimidinecarbonitrile derivatives as inhibitors against falcipain-3. Bioorg. Med. Chem. Lett. 2011, 21, 7219–7223. [Google Scholar] [CrossRef]
  26. Desai, P.V.; Patny, A.; Sabnis, Y.; Tekwani, B.; Gut, J.; Rosenthal, P.; Srivastava, A.; Avery, M. Identification of novel parasitic cysteine protease inhibitors using virtual screening. 1. The ChemBridge Database. J. Med. Chem. 2004, 47, 6609–6615. [Google Scholar] [CrossRef] [PubMed]
  27. Shah, F.; Mukherjee, P.; Desai, P.; Avery, M. Computational approaches for the discovery of cysteine protease inhibitors against malaria and SARS. Curr. Comput. Aided-Drug Des. 2010, 6, 1–23. [Google Scholar] [CrossRef] [PubMed]
  28. Shah, F.; Mukherjee, P.; Gut, J.; Legac, J.; Rosenthal, P.J.; Tekwani, B.L.; Avery, M.A. Identification of novel malarial cysteine protease inhibitors using structure-based virtual screening of a focused cysteine protease inhibitor library. J. Chem. Inf. Modeling 2011, 51, 852–864. [Google Scholar] [CrossRef] [PubMed]
  29. Ghasemi, J.; Shiri, F.; Pirhadi, S.; Heidari, Z. Discovery of New potential antimalarial compounds using virtual screening of ZINC database. Comb. Chem. High Throughput Screen. 2015, 18, 227–234. [Google Scholar] [CrossRef]
  30. Kerr, I.D.; Lee, J.H.; Farady, C.J.; Marion, R.; Rickert, M.; Sajid, M.; Pandey, K.C.; Caffrey, C.R.; Legac, J.; Hansell, E.; et al. Vinyl sulfones as antiparasitic agents and a structural basis for drug design. J. Biol. Chem. 2009, 284, 25697–25703. [Google Scholar] [CrossRef] [Green Version]
  31. Kerr, I.D.; Lee, J.H.; Pandey, K.C.; Harrison, A.; Sajid, M.; Rosenthal, P.J.; Brinen, L.S. Structures of falcipain-2 and falcipain-3 bound to small molecule inhibitors: Implications for substrate specificity‡. J. Med. Chem. 2009, 52, 852–857. [Google Scholar] [CrossRef]
  32. Berman, H.M.; Bhat, T.N.; Bourne, P.E.; Feng, Z.; Gilliland, G.; Weissig, H.; Westbrook, J. The Protein Data Bank and the challenge of structural genomics. Nat. Struct. Biol. 2000, 7, 957–959. [Google Scholar] [CrossRef]
  33. Accelrys, version 2.5; Discovery Studio: San Diego, CA, USA, 2009.
  34. Frecer, V.; Kabeláč, M.; De Nardi, P.; Pricl, S.; Miertuš, S. Structure-based design of inhibitors of NS3 serine protease of hepatitis C virus. J. Mol. Graph. Model. 2004, 22, 209–220. [Google Scholar] [CrossRef]
  35. Frecer, V.; Jedinak, A.; Tossi, A.; Berti, F.; Benedetti, F.; Romeo, D.; Miertus, S. Structure based design of inhibitors of aspartic protease of HIV-1. Lett. Drug Des. Discov. 2005, 2, 638–646. [Google Scholar] [CrossRef]
  36. Frecer, V.; Berti, F.; Benedetti, F.; Miertus, S. Design of peptidomimetic inhibitors of aspartic protease of HIV-1 containing –PheΨPro– core and displaying favourable ADME-related properties. J. Mol. Graph. Model. 2008, 27, 376–387. [Google Scholar] [CrossRef]
  37. Frecer, V.; Seneci, P.; Miertus, S. Computer-assisted combinatorial design of bicyclic thymidine analogs as inhibitors of mycobacterium tuberculosis thymidine monophosphate kinase. J. Comput.-Aided Mol. Des. 2010, 25, 31–49. [Google Scholar] [CrossRef] [PubMed]
  38. Dali, B.; Keita, M.; Megnassan, E.; Frecer, V.; Miertus, S. Insight into selectivity of peptidomimetic inhibitors with modified statine core for Plasmepsin II of Plasmodium falciparum over human cathepsin D. Chem. Biol. Drug Des. 2012, 79, 411–430. [Google Scholar] [CrossRef]
  39. Megnassan, E.; Keita, M.; Bieri, C.; Esmel, A.; Frecer, V.; Miertus, S. Design of novel dihydroxynaphthoic acid inhibitors of Plasmodium falciparum lactate dehydrogenase. Med. Chem. 2012, 8, 970–984. [Google Scholar] [CrossRef] [PubMed]
  40. Owono Owono, L.C.; Keita, M.; Megnassan, E.; Frecer, V.; Miertus, S. Design of thymidine analogues targeting thymidilate kinase of mycobacterium tuberculosis. Tuberc. Res. Treat. 2013, 2013, 1–13. [Google Scholar] [CrossRef] [Green Version]
  41. Keita, M.; Kumar, A.; Dali, B.; Megnassan, E.; Siddiqi, M.I.; Frecer, V.; Miertus, S. Quantitative structure–activity relationships and design of thymine-like inhibitors of thymidine monophosphate kinase of mycobacterium tuberculosis with favourable pharmacokinetic profiles. RSC Adv. 2014, 4, 55853–55866. [Google Scholar] [CrossRef]
  42. Kouassi, A.; Kone, M.; Keita, M.; Esmel, A.; Megnassan, E.; N’Guessan, Y.; Frecer, V.; Miertus, S. Computer-aided design of orally bioavailable pyrrolidine carboxamide inhibitors of enoyl-acyl carrier protein reductase of mycobacterium tuberculosis with favorable pharmacokinetic profiles. Int. J. Mol. Sci. 2015, 16, 29744–29771. [Google Scholar] [CrossRef] [Green Version]
  43. Owono Owono, L.C.; Ntie-Kang, F.; Keita, M.; Megnassan, E.; Frecer, V.; Miertus, S. Virtually designed triclosan-based inhibitors of enoyl-acyl carrier protein reductase of mycobacterium tuberculosisand of Plasmodium falciparum. Mol. Inform. 2015, 34, 292–307. [Google Scholar] [CrossRef] [PubMed]
  44. Esmel, A.; Keita, M.; Eugene, M.; Toï, B.; Frecer, V.; Miertus, S. Insight into binding mode of nitrile inhibitors of Plasmodium falciparum falcipain-3, QSAR and pharmacophore models, virtual design of new analogues with favorable pharmacokinetic profiles. J. Comput. Chem. Mol. Model. 2017, 2, 103–124. [Google Scholar] [CrossRef] [Green Version]
  45. N’Guessan, A.; Megnassan, E.; Ziao, N.; Frecer, V.; N’Guessan, Y.T.; Miertus, S. Artemisinin-dipeptidyl vinyl sulfone hybrid inhibitors of plasmodium falciparum falcipain 2 with favorable pharmacokinetic profile. J. Drug Des. Dev. 2017, 1, 11–28. [Google Scholar] [CrossRef]
  46. N’Guessan, H.; Megnassan, E. In silico design of phosphonic arginine and hydroxamic acid inhibitors of Plasmodium falciparum M17 Leucyl Aminopeptidase with favorable pharmacokinetic profile. J. Drug Des. Med. Chem. 2017, 3, 98. [Google Scholar] [CrossRef] [Green Version]
  47. Kily Herve Fagnidi, Y.; Toi, B.; Megnassan, E.; Frecer, V.; Miertus, S. In silico design of plasmodium falciparum cysteine protease falcipain 2 inhibitors with favorable pharmacokinetic profile. J. Anal. Pharm. Res. 2018, 7, 298–309. [Google Scholar] [CrossRef] [Green Version]
  48. Kouman, K.C.; Keita, M.; Kre N’Guessan, R.; Owono Owono, L.C.; Megnassan, E.; Frecer, V.; Miertus, S. Structure-based design and in silico screening of virtual combinatorial library of benzamides inhibiting 2-trans enoyl-acyl carrier protein reductase of Mycobacterium tuberculosis with favorable predicted pharmacokinetic profiles. Int. J. Mol. Sci. 2019, 20, 4730. [Google Scholar] [CrossRef] [Green Version]
  49. Brooks, B.R.; Bruccoleri, R.E.; Olafson, B.D.; States, D.J.; Swaminathan, S.; Karplus, M. CHARMM: A program for macromolecular energy, minimization, and dynamics calculations. J. Comput. Chem. 1983, 4, 187–217. [Google Scholar] [CrossRef]
  50. Accelrys, version 4.4; Materials Studio: San Diego, CA, USA, 2009.
  51. Gilson, M.; Honig, B. The inclusion of electrostatic hydration energies in molecular mechanics calculations. J. Comput.-Aided Mol. Des. 1991, 5, 5–20. [Google Scholar] [CrossRef]
  52. Rocchia, W.; Sridharan, S.; Nicholls, A.; Alexov, E.; Chiabrera, A.; Honig, B. Rapid grid-based construction of the molecular surface and the use of induced surface charge to calculate reaction field energies: Applications to the molecular systems and geometric objects. J. Comput. Chem. 2001, 23, 128–137. [Google Scholar] [CrossRef]
  53. BÖTtcher, C.J.F. NON-LINEAR EFFECTS. In Theory of Electric Polarization; Elsevier: Amsterdam, The Netherlands, 1973. [Google Scholar]
  54. Miertuš, S.; Scrocco, E.; Tomasi, J. Electrostatic interaction of a solute with a continuum. A direct utilizaion of ab initio molecular potentials for the prevision of solvent effects. Chem. Phys. 1981, 55, 117–129. [Google Scholar] [CrossRef]
  55. Frecer, V.; Miertuš, S. Polarizable continuum model of solvation for biopolymers. Int. J. Quantum Chem. 1992, 42, 1449–1468. [Google Scholar] [CrossRef]
  56. Fischer, S.; Smith, J.C.; Verma, C.S. Dissecting the vibrational entropy change on protein/ligand binding:  Burial of a water molecule in bovine pancreatic trypsin inhibitor. J. Phys. Chem. B 2001, 105, 8050–8055. [Google Scholar] [CrossRef]
  57. Schwarzl, S.M.; Tschopp, T.B.; Smith, J.C.; Fischer, S. Can the calculation of ligand binding free energies be improved with continuum solvent electrostatics and an ideal-gas entropy correction? J. Comput. Chem. 2002, 23, 1143–1149. [Google Scholar] [CrossRef]
  58. Freire, E. Do enthalpy and entropy distinguish first in class from best in class? Drug Discov. Today 2008, 13, 869–874. [Google Scholar] [CrossRef] [PubMed]
  59. Copeland, R.A.; Lombardo, D.; Giannaras, J.; Decicco, C.P. Estimating KI values for tight binding inhibitors from dose-response plots. Bioorg. Med. Chem. Lett. 1995, 5, 1947–1952. [Google Scholar] [CrossRef]
  60. Frecer, V.; Miertus, S.; Tossi, A.; Romeo, D. Rational design of inhibitors for drug-resistant HIV-1 aspartic protease mutants. Drug Des. Discov. 1998, 15, 211–231. [Google Scholar]
  61. Frecer, V.; Miertus, S. Interactions of ligands with macromolecules: Rational design of specific inhibitors of aspartic protease of HIV-1. Macromol. Chem. Phys. 2002, 203, 1650–1657. [Google Scholar] [CrossRef]
  62. MOE. Molecular Operating Environment (MOE); Chemical Computing Group Inc.: Montreal, QC, Canada, 2014. [Google Scholar]
  63. Available Chemicals Directory. Available online: https://www.psds.ac.uk/acd (accessed on 12 July 2021).
  64. Lipinski, C.A.; Lombardo, F.; Dominy, B.W.; Feeney, P.J. Experimental and computational approaches to estimate solubility and permeability in drug discovery and development settings. Adv. Drug Deliv. Rev. 1997, 23, 3–25. [Google Scholar] [CrossRef]
Scheme 1. Novel peptidomimetic analogues design methodology workflow.
Scipharm 89 00044 sch001
Figure 1. Chemical structures of training and validation sets of FP3 inhibitors obtained from literature [24].
Scipharm 89 00044 g001
Figure 2. Correlation plot between pIC 50 exp and relative complexation Gibbs free energies G com of the training set of nine FP3 inhibitors.
Scipharm 89 00044 g002
Figure 3. Breakdown of interaction energy (kcal/mol) contribution between PEP32, PEP39, PEP40 and the most interacting residues of the FP3 active site.
Scipharm 89 00044 g003
Figure 4. Proposed binding mode of peptidomimetics inhibitors at the active site of FP3. Main favourable non-bond interactions depicted in 3D (left picture) and 2D (right picture) for the most active PEP39 (purple carbons atoms).
Scipharm 89 00044 g004
Figure 5. (a) Features of the Hypo1 pharmacophore of FP3 inhibition; (b) pharmacophore mapping by the most active of the training set PEP39; (c) inter-features distances in Å; (d) angles between features. Colours legend of features: hydrophobic (blue), hydrogen bond acceptor (green), hydrogen bond donor (purple), excluded volumes (grey).
Scipharm 89 00044 g005
Figure 6. Plot of estimated and experimental activity for PH4 Hypo 1.
Scipharm 89 00044 g006
Figure 7. Chemical structures towards Pf FP3 of four most potent PEP analogues.
Scipharm 89 00044 g007
Figure 8. The best virtual hit, analogue PEP-14-14-14-18 (with purple carbons atoms), mapped a PH4 Hypo 1.
Scipharm 89 00044 g008
Figure 9. Connolly surfaces (left) and 3D (right) schematic interaction diagrams of the 4 most potent analogues designed at the active site of PfFP3: (a) PEP-17-03-14-10 ( IC 50 pre = 0.29 nM); (b) PEP-08-15-18-19 ( IC 50 pre = 0.19 nM); (c) PEP-13-06-04-19 ( IC 50 pre = 0.10 nM); (d) PEP-14-14-14-18 ( IC 50 pre = 0.07 nM).
Scipharm 89 00044 g009aScipharm 89 00044 g009b
Figure 10. FP3–PEPs interaction energy breakdown for the top four ranked novel analogues.
Scipharm 89 00044 g010
Table 1. Training and validation sets of PEP inhibitors obtained from the literature [24].
Training Set [a] M W     [ b ] ( g · mol 1 ) I C 50 exp   [ c ] ( nM )
PEP23 (Ref)482.6136,360
PEP27452.56910
PEP29438.5323,900
PEP32466.5447,230
PEP34470.608220
PEP38462.5525,440
PEP39440.5060
PEP40574.75520
PEP41498.613560
Validation Set [a] M W   [b](g · mol−1) I C 50 e x p   [c](nM)
PEP26452.56540
PEP28450.5420,180
PEP36488.5911,910
[a] See Figure 1 for chemical structures of training and validation. [b] Molecular weight. [c] This is IC 50 exp expressed in nanomolar concentration [24].
Table 2. Energy contributions towards G com for a dataset of PEP analogues against FP3 complexation Gibbs free energy and its components for the training and validation set of FP3 inhibitors. and experimental activity.
T r a i n i n g   S e t   [ a ] H M M   [ b ]
k c a l · m o l 1
G s o l   [ c ]
k c a l · m o l 1
T S v i b   [ d ]
k c a l · m o l 1
G c o m   [ e ]
k c a l · m o l 1
p I C 50 e x p   [ f ]
PEP23 (Ref)0.000.000.000.004.44
PEP27−3.81−0.04-0.16−3.696.04
PEP29−0.390.131.45−1.714.62
PEP326.21−7.77-0.60−0.954.33
PEP345.97−9.92-0.51−3.445.09
PEP380.210.772.13−1.154.59
PEP39−2.070.123.98−5.927.22
PEP40−6.331.640.26−4.956.28
PEP41−3.241.160.42−2.505.45
V a l i d a t i o n
S e t   [a]
H M M   [b]
k c a l · m o l 1
G s o l [c]
k c a l · m o l 1
T S v i b   [d]
k c a l · m o l 1
G c o m   [e]
k c a l · m o l 1
R a t i o   [g]
PEP26−7.671.39−0.78−5.501.07
PEP28−4.130.61−0.41−3.121.18
PEP366.51−10.30−0.15−3.641.18
[a] For the chemical structures of the training/validation set of inhibitors see Figure 1. [b]   H MM represents the relative enthalpic contribution to the Gibbs free energy change related to the intermolecular interactions in the enzyme–inhibitor complex derived by molecular mechanics (PEP23 (Ref) is the reference inhibitor I ref ): H MM = E MM E : I x E MM I x E MM E : I ref E MM I ref 10 . [c]   G sol represents the relative solvation GFE contribution to the GFE of EI complex formation: G sol = G sol E : I x G sol I x G sol E : I ref G sol I ref 11 . [d]   TS vib represents the relative entropic contribution of the inhibitor to the GFE related to the E:I complex: TS vib = TS vib I x E TS vib I x TS vib I ref E TS vib I ref   12 . [e]   G com represents the relative GFE change related to the enzyme-inhibitor complex formation: (see Equation (9)). [f] IC 50 exp [24] represents the inhibitor concentration that causes 50% decrease in the rate of substrate conversion by FP3 measured in the enzyme assay: pIC 50 exp = log 10 IC 50 exp 10 9 . [g] This is the ratio of the predicted activity on the experimental activity, pIC 50 pre / pIC 50 exp . This ratio is close to 1, indicating the predictivity of the QSAR model.
Table 3. Statistical data of correlation between computed G com IC 50 exp of the training set. pIC 50 exp = log 10 IC 50 exp × 10 9 = 0.4794 × G com + 4.0455 .
Statistical Data of Linear Regression
Number of compounds n9
Squared   correlation   coefficient   of   regression   R 2 0.89
Leave - one - out   cross - validated   squared   correlation   Coefficient   R xv 2 0.81
Standard   error   of   the   regression   σ 0.34
Statistical significance of regression, Fisher F-test58.58
Level of statistical significance α > 95 %
Range   of   activities   of   IC 50 exp (nM)60–47,230
Table 4. Output parameters of 10 generated PH4 pharmacophoric hypotheses for FP3 inhibitors after Cat-Scramble validation procedure (49 scrambled runs for each hypothesis at the selected level of confidence of 98%).
HypothesisRMSD [a]R2 [b]Total
Costs [c]
Costs
Difference [d]
Closest
Random [e]
Hypo 10.7950.99924.132293.131.20
Hypo 22.9580.99160.642256.631.90
Hypo 33.6230.98780.352236.939.75
Hypo 44.9070.976130.372186.942.21
Hypo 55.1280.974139.892177.444.21
Hypo 65.2030.973143.712173.545.02
Hypo 75.8800.966177.492139.845.02
Hypo 87.9100.937304.232013.045.03
Hypo 99.7670.902451.681865.646.00
Hypo 109.8300.901456.441860.847.18
[a] root mean square deviation; [b] squared correlation coefficient; [c] overall cost parameter of the PH4 pharmacophore; [d] cost difference between null cost and hypothesis total cost; [e] lowest cost from 49 scrambled runs at a selected level of confidence of 98%. The fixed cost = 21.24, with RMSD = 0, the null cost = 2317.26, with RMSD = 22.65 and the configuration cost = 11.85.
Table 5. Statistical data on regression analysis of correlation for the training set between PH4 predicted activity ( pIC 50 pre ) and experimental one ( pIC 50 exp ) against FP3.   pIC 50 exp = log 10 IC 50 exp × 10 9 = 1.0002 × pIC 50 pre 0.0012   .
Statistical Data of Linear Regression
Number of compounds n9
Squared   correlation   coefficient   of   regression   R 2 0.99
Leave - one - out   cross - validated   squared   correlation   Coefficient   R xv 2 0 . 99
Standard   error   of   the   regression   σ 0.04
Statistical significance of regression, Fisher F-test5675.56
Level of statistical significance α > 98 %
Range   of   activities   of   IC 50 exp (nM)60–47,230
Table 6. R-groups (amino acid side chains) used in the design of the initial diversity library of PEP analogues. Dashed bonds indicate the attachment points of the fragments.
Scipharm 89 00044 i001
1
[Gly]
–H2
[Ala]
–CH33
[Val]
–CH(CH3)24
[Leu]
–CH2-CH(CH3)2
5
[Ile]
–C(CH3)–C2H56
[Met]
–-(CH2)2–S–CH37
[Cys]
–CH2–SH8
[Ser]
–CH2–OH
9
[Thr]
–CH(OH)-CH310
[Asp]
–CH2–COOH11
[Glu]
–(CH2)2–COOH12
[Asn]
–CH2–CONH2
13
[Gln]
–(CH2)2–CONH214
[Lys]
–(CH2)4–NH215
[Arg]
–(CH2)3–NH–C(NH)-NH216
[His]
Scipharm 89 00044 i002
17
[Phe]
Scipharm 89 00044 i00318
[Tyr]
Scipharm 89 00044 i00419
[Trp]
Scipharm 89 00044 i005
Table 7. Complexation Gibbs free energy and its components for the top 21 scoring virtually designed analogues. The analogue numbering concatenates the index of each substituent R1 to R4 numbered in Table 6.
Analogues [a] M W   [ b ] H M M   [ c ] G s o l   [ d ] T S v i b   [ e ] G c o m   [ f ] I C 50 p r e ( nM )   [ g ]
PEP23482.610.000.000.000.0036,360
PEP-14-19-04-01400.535.54−6.820.75−2.039580.30
PEP-15-04-17-01389.50−1.05−6.590.72−8.368.76
PEP-15-04-18-01405.50−4.11−1.271.32−6.6955.75
PEP-05-12-19-03428.54−5.961.251.43−6.14102.41
PEP-15-04-17-03431.58−6.25−2.272.78−11.300.34
PEP-18-05-14-03419.57−6.60−1.082.02−9.702.00
PEP-01-19-18-04435.53−5.83-2.45−1.49−6.7949.62
PEP-18-19-15-04534.66−5.78−6.88−2.56−10.101.29
PEP-17-03-14-10405.50−7.71−1.012.73−11.450.29
PEP-04-07-19-14446.62−7.684.891.27−4.071009.94
PEP-17-09-19-15506.61−12.0711.412.83−3.491906.57
PEP-04-06-05-17420.62−5.31−2.990.55−8.855.13
PEP-05-03-18-18454.57−1.58−0.740.57−2.903676.95
PEP-14-14-14-18463.63−9.46−2.400.91−12.760.07
PEP-02-15-03-19428.54−3.28−2.991.78−8.0512.35
PEP-03-08-15-19444.54−2.26−5.00−0.81−6.4572.74
PEP-08-15-17-19492.58−9.89−0.260.54−10.690.67
PEP-08-15-18-19508.58−12.300.840.38−11.830.19
PEP-09-18-18-19529.60−7.61−0.28−0.19−7.7018.29
PEP-10-18-18-19543.58−10.16−0.810.19−11.150.40
PEP-13-06-04-19474.63−10.05−1.600.76−12.420.10
[a] Designed analogues; [b] MW represents molecular mass of the inhibitor; [c] H MM represents the relative enthalpic contribution to the Gibbs free energy change related to the FP3-PEP complex formation G com ; [d] G sol represents the relative solvation Gibbs free energy contribution to G com ; [e] TS vib represents the relative entropic (vibrational) contribution to G com ; [f] G com represents the relative Gibbs free energy change related to the enzyme-inhibitor FP3-PEP complex formation (see Equation (9)); [g] IC 50 pre represents the predicted inhibition constant towards PfFP3 calculated from G com using correlation (Table 3).
Publisher’s Note: MDPI stays neutral with regard to jurisdictional claims in published maps and institutional affiliations.

