1. Introduction
The antibiotic resistance rate among Enterobacteriaceae uropathogens has recently increased remarkably, especially in the past decade. One of the most effective antibiotics appears to be fosfomycin [
1]. In terms of chemical structure, fosfomycin is a phosphoenolpyruvate analog and contains a phosphonic group and an epoxide ring [
2]. Fosfomycin trometamol is 2-amino-2-(hydroxymethyl)propane-1,3-diol; [(2R,3S)-3-methyloxiran-2-yl]phosphonic acid, with a molecular weight of 259.15 g/mol, the pKa values of strongest basic of 1.25 and −4.3 of the strongest acidic group, and high water solubility of about 47 mg/mL, and Log
p-value of −0.75. Discrepancies in the descriptions of solubilities exist for fosfomycin, regardless of its three forms of existing API substances [
3]. Molecules with similar structure and physic-chemical properties, like fosfomycin trometamol, are always the most unpleasant and problematic analytes for most applied, popular and convenient reversed-phase high-performance liquid chromatography (HPLC) analysis with a UV-absorption detector. Fosfomycin has no UV-absorbing chromophores that would enable its monitoring in UV or DAD detectors in direct measuring modes. The two acidic protons with low pH-pKa values make them almost permanently dissociated and ionize in physiological fluids, buffer and the described pH ranges of chromatographic RP columns. These were the reasons for developed and published quantification chromatographic methods with more complex, specific, complicated, expensive and less convenient detectors, like evaporative light scattering, refractive index, corona aerosol discharge, electrochemical conductivity, and finally, a mass spectral detector, which will be cited in the following text in a schedule of their chronological appearance.
According to structure and a global survey of analytical methods for fosfomycin, we had to solve two main problems in our development of the method, the first being to detect the analyte and make it “visible” or noticeable for the determination. The second goal was to enable successful and appropriate retention on the reversed-phase chromatographic column of the highly water-soluble, extremely polar, ionizing, and dissociating molecule. Having these characteristics in mind, the logical starting step would be a method-based use of the anion-exchange column, or modern HILIC column, which achieves satisfying retentivity. However, these columns are expensive, spend a long time equilibrating with a smaller number of theoretical plates compared to RP columns, and are thus less convenient, especially in the fine-tuning of peak elution. Generally, the most used and cited is an amino-propyl polar column, which is very inconvenient to use, especially frequently [
4,
5,
6,
7] in quality control laboratories and high-throughput analyses because of its sensitive physicochemical stability nature that leads to a short applicable life due to its high sensitivity to the oxidation of an amino-bonded group with oxygen dissolved in the mobile phase, thus altering the peak elution profile and reducing the retention separation properties and power, resulting in permanent column damaging, as well as its discarding and replacement.
The official pharmacopeial methods suggest the use of 250 mm × 4.6 mm, with 5 μm amino-bonded column equilibrated with 10.86 g/L sodium dihydrogen phosphate and the use of RID detector at 35 °C, flow rate 1 mL/min, equilibration 1–2 h and injection volume of 10 µL. The sample preparation is perorfmed by dissolution of standard or powder sample corresponding to 120 mg/mL fosfomycin trometamol. The recommended injection volume of 10 µL solution with a concentration 120 mg/mL transferred on the column, which is extremely inappropriate and not recommended for proper balance by thermodynamic equilibrium to achieve a separating distribution in Gaussian-shaped symmetrical peaks [
4,
5,
6,
7]. Experienced analysts of HPLC already know about the problems when working with and using a differential refractive index detector for detecting, including its extreme sensitivity to temperature, mobile phase composition, and flow rate changes and extreme low sensitivity, which is additionally complicated with the use of an amino column with long-lasting equilibrations, lower number of theoretical plates, lower reproducibility and lower stability with shorter use lifetime, is prone to frequent long drifts and “jumps” of chromatogram baseline, strong sensitivity to the presence of dissolved oxygen in its mobile phase, which converts the amino-bonded group of stationary phase to Schiff-base, followed by irreversible damage to the column. The literature survey method for quantifying fosfomycin trometamol in pharmaceutical dosage forms and other sample matrixes did not result in many published articles and works [
8,
9,
10,
11,
12,
13,
14,
15,
16,
17,
18,
19,
20,
21,
22,
23,
24,
25,
26,
27,
28,
29,
30].
Our concept from the very beginning was the employment of an alkyl-bonded reversed-phase liquid chromatography column, which is much more confidential, physic-chemically resistive and appropriate for use, including the most frequently used UV-absorbing detectors, diode array or single or multichannel UV-Vis-based construction. The main target of this research was to create a rapid, simple, accurate, selective, reproducible quantification chromatographic method for the determination of a fosfomycin trometamin solid pharmaceutical dosage form without the use of an unpleasant and low-sensitivity differential refractive index detector (RID) and a problematic, heavily equilibrated amino-bonded stationary phase-filled column. These methods are used and described in the official pharmacopoeia quantification method or modern HILIC columns with the use of a corona aerosol discharge detector (CAD), evaporative light scattering detector (ELSD), electrochemical conductometric or mass spectral (MS) detectors, which are already known to be inappropriate for routine analyses and use in quality control laboratories for high-throughput analyses. These were the reasons for choosing a universally responsive differential refratrive index detector with a highly polar NH2-column in the pharmacopoeia monographs for the determination of fosfomycin trometamol in pharmaceutical dosage forms.
3. Results
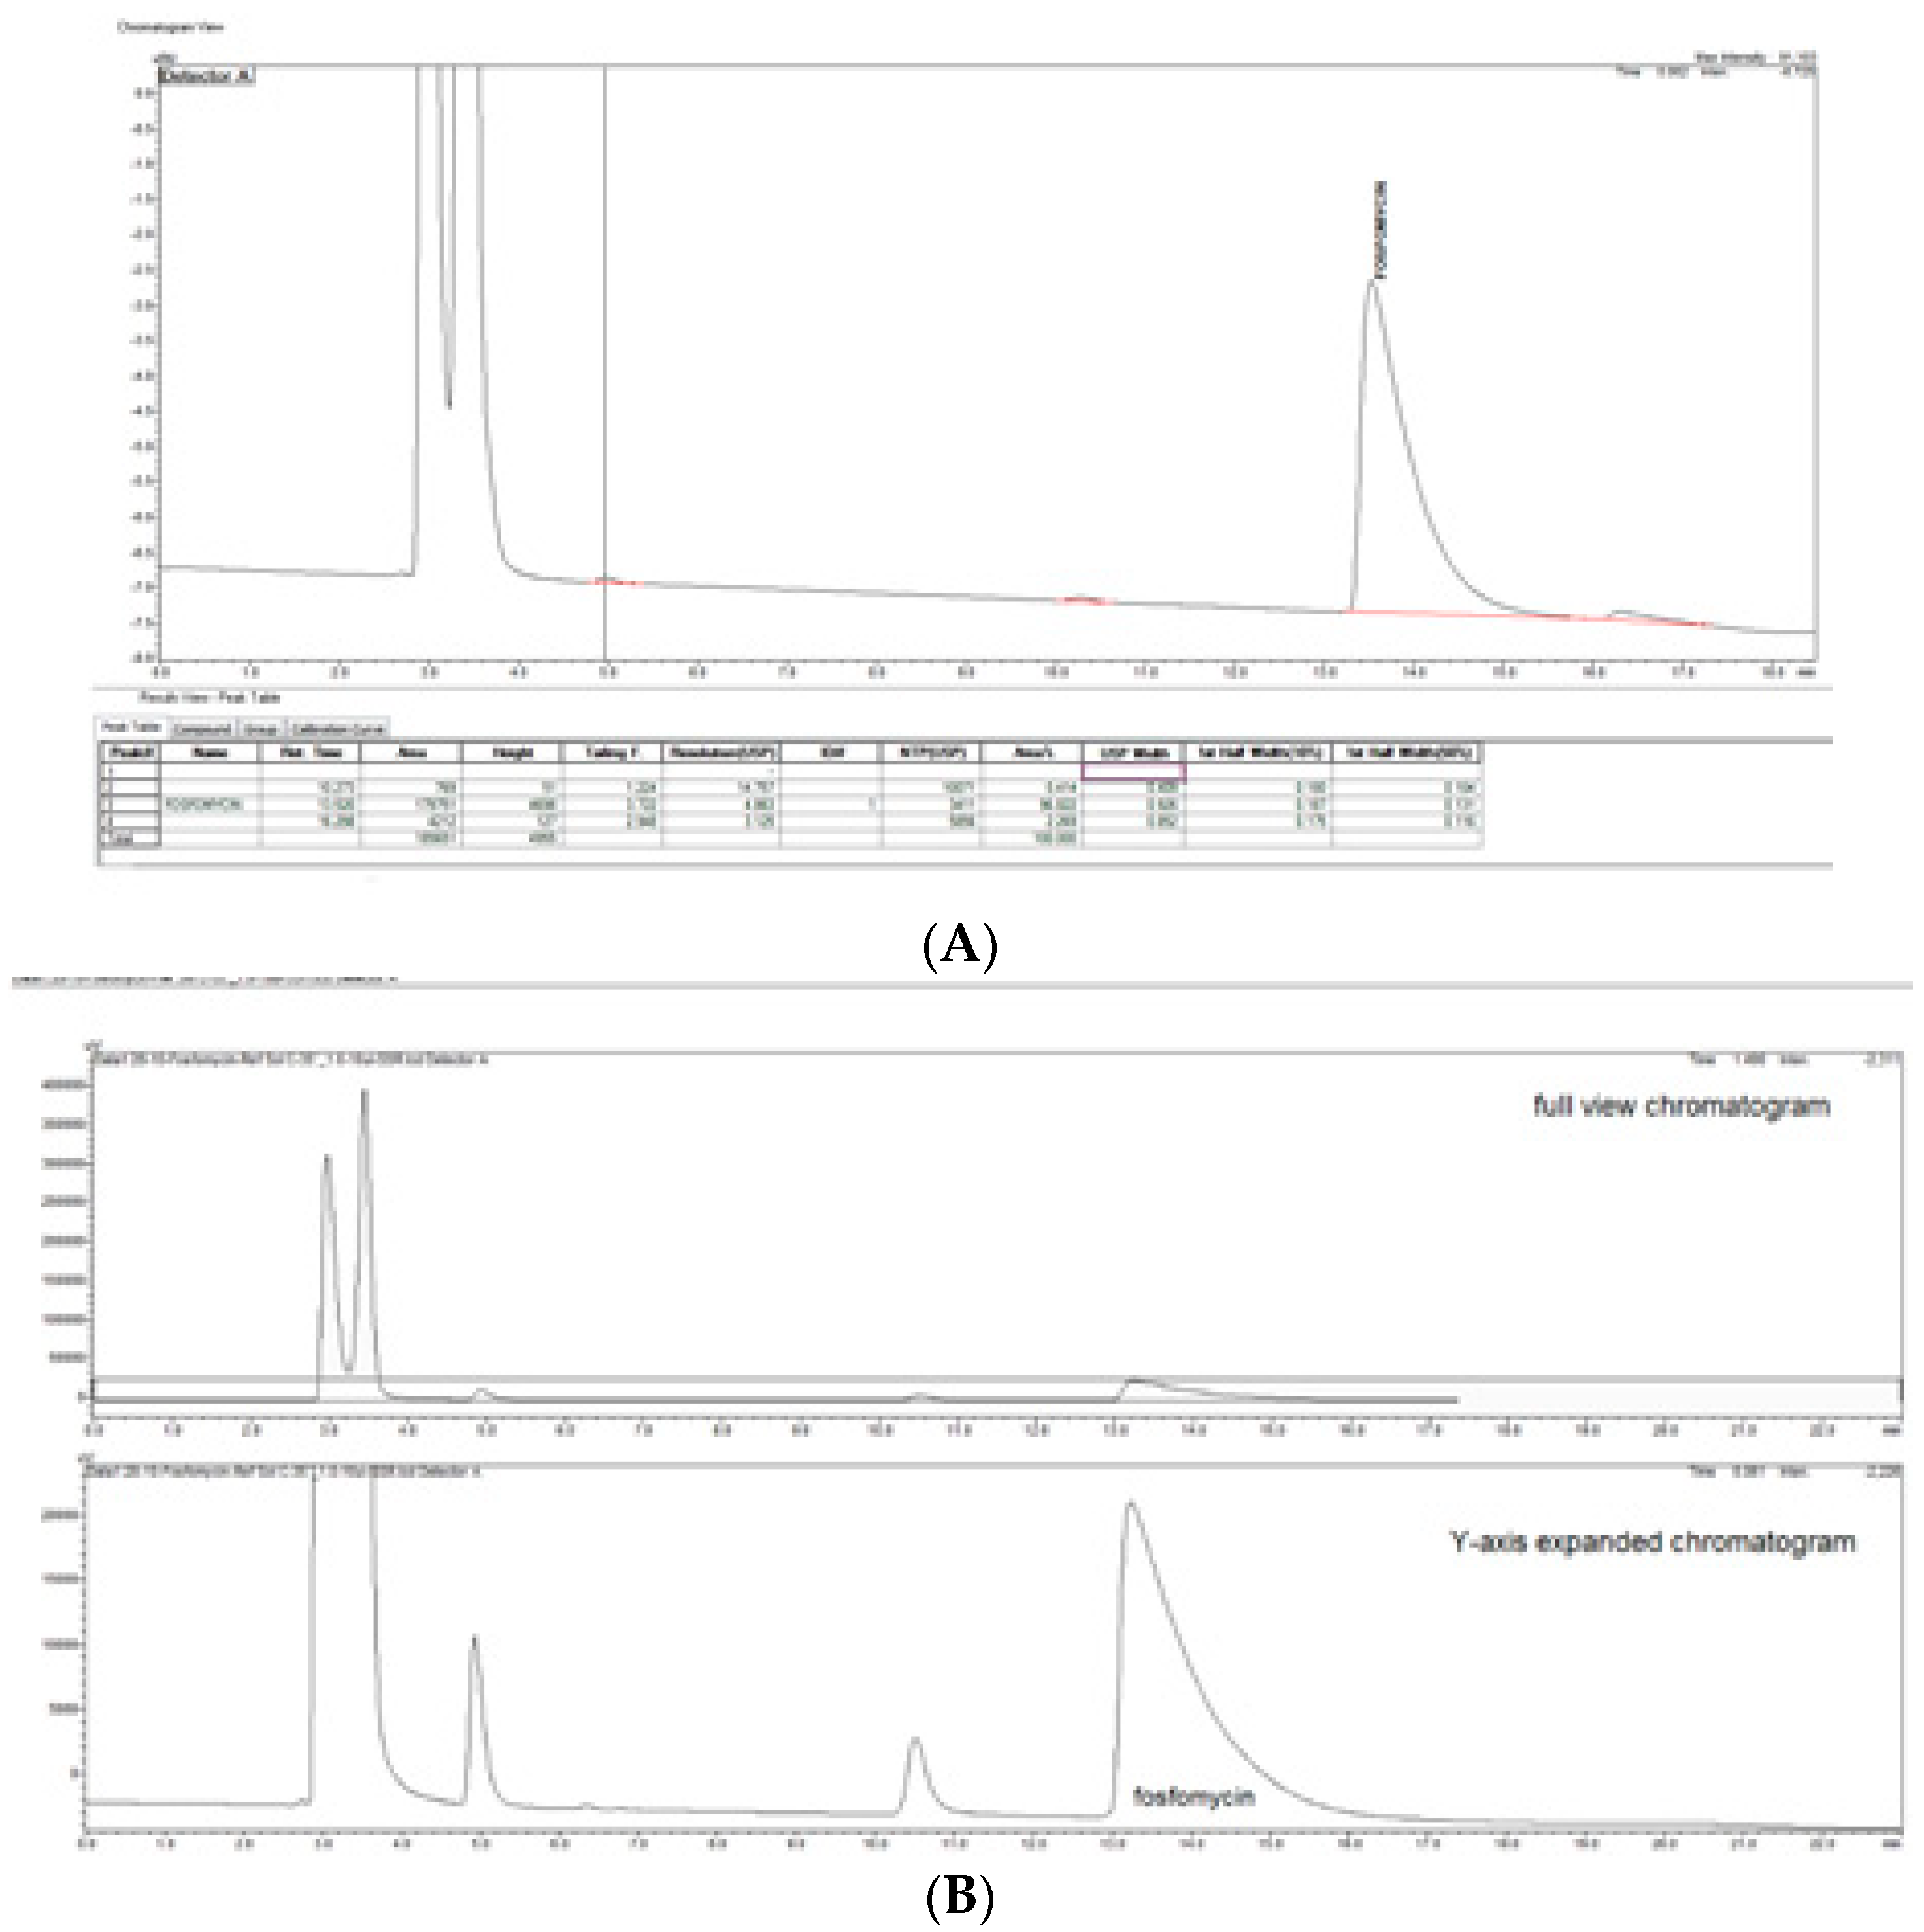
The prompt for the development of a simpler, rapid, reproducible, selective and accurate method for the quantification of fosfomycin in its trometamol form was the focus of the chromatogram obtained in our lab by implementing the official pharmacopeial PhEur, BP monograph method, with the use of a Zorbax NH
2-amino column 250 mm × 4.6 mm, 5 μm particles with 80 mM potassium phosphate untreated buffer at 1 mL/min flow rate, and the injection of 10 μL of 120 mg/mL standard fosfomycin trometamol on the column, which yielded the chromatograms presented in
Figure 1A,B.
The second noticeable feature is an enormous peak leading to an asymmetrical shape, which is caused by an extensive mass overload described by the official method, with a 10 μL injection volume with 1200 μg or 1.2 mg analyte quantity transferred on the column, which is very difficult when equilibrating the balance and results in tailing up to 6, thus inducing 40 mV peak response height. The sample solution injected on the NH2-column according to the monograph was 120 mg/mL corresponding to 120/259, 19 g/mol = 0.463 mol/L, which is an unusually high quantity of analyte on the column, in 10 μL of 120 mg/mL = 120 ug/μL × 10 = 1200 μg or 1.2 mg, which is far from the recommended thermodynamic calculated injection quantity for chromatography recommended at a balance of 1–10 μg analytes with 1 g or 1 mL of sorbent separation matrix.
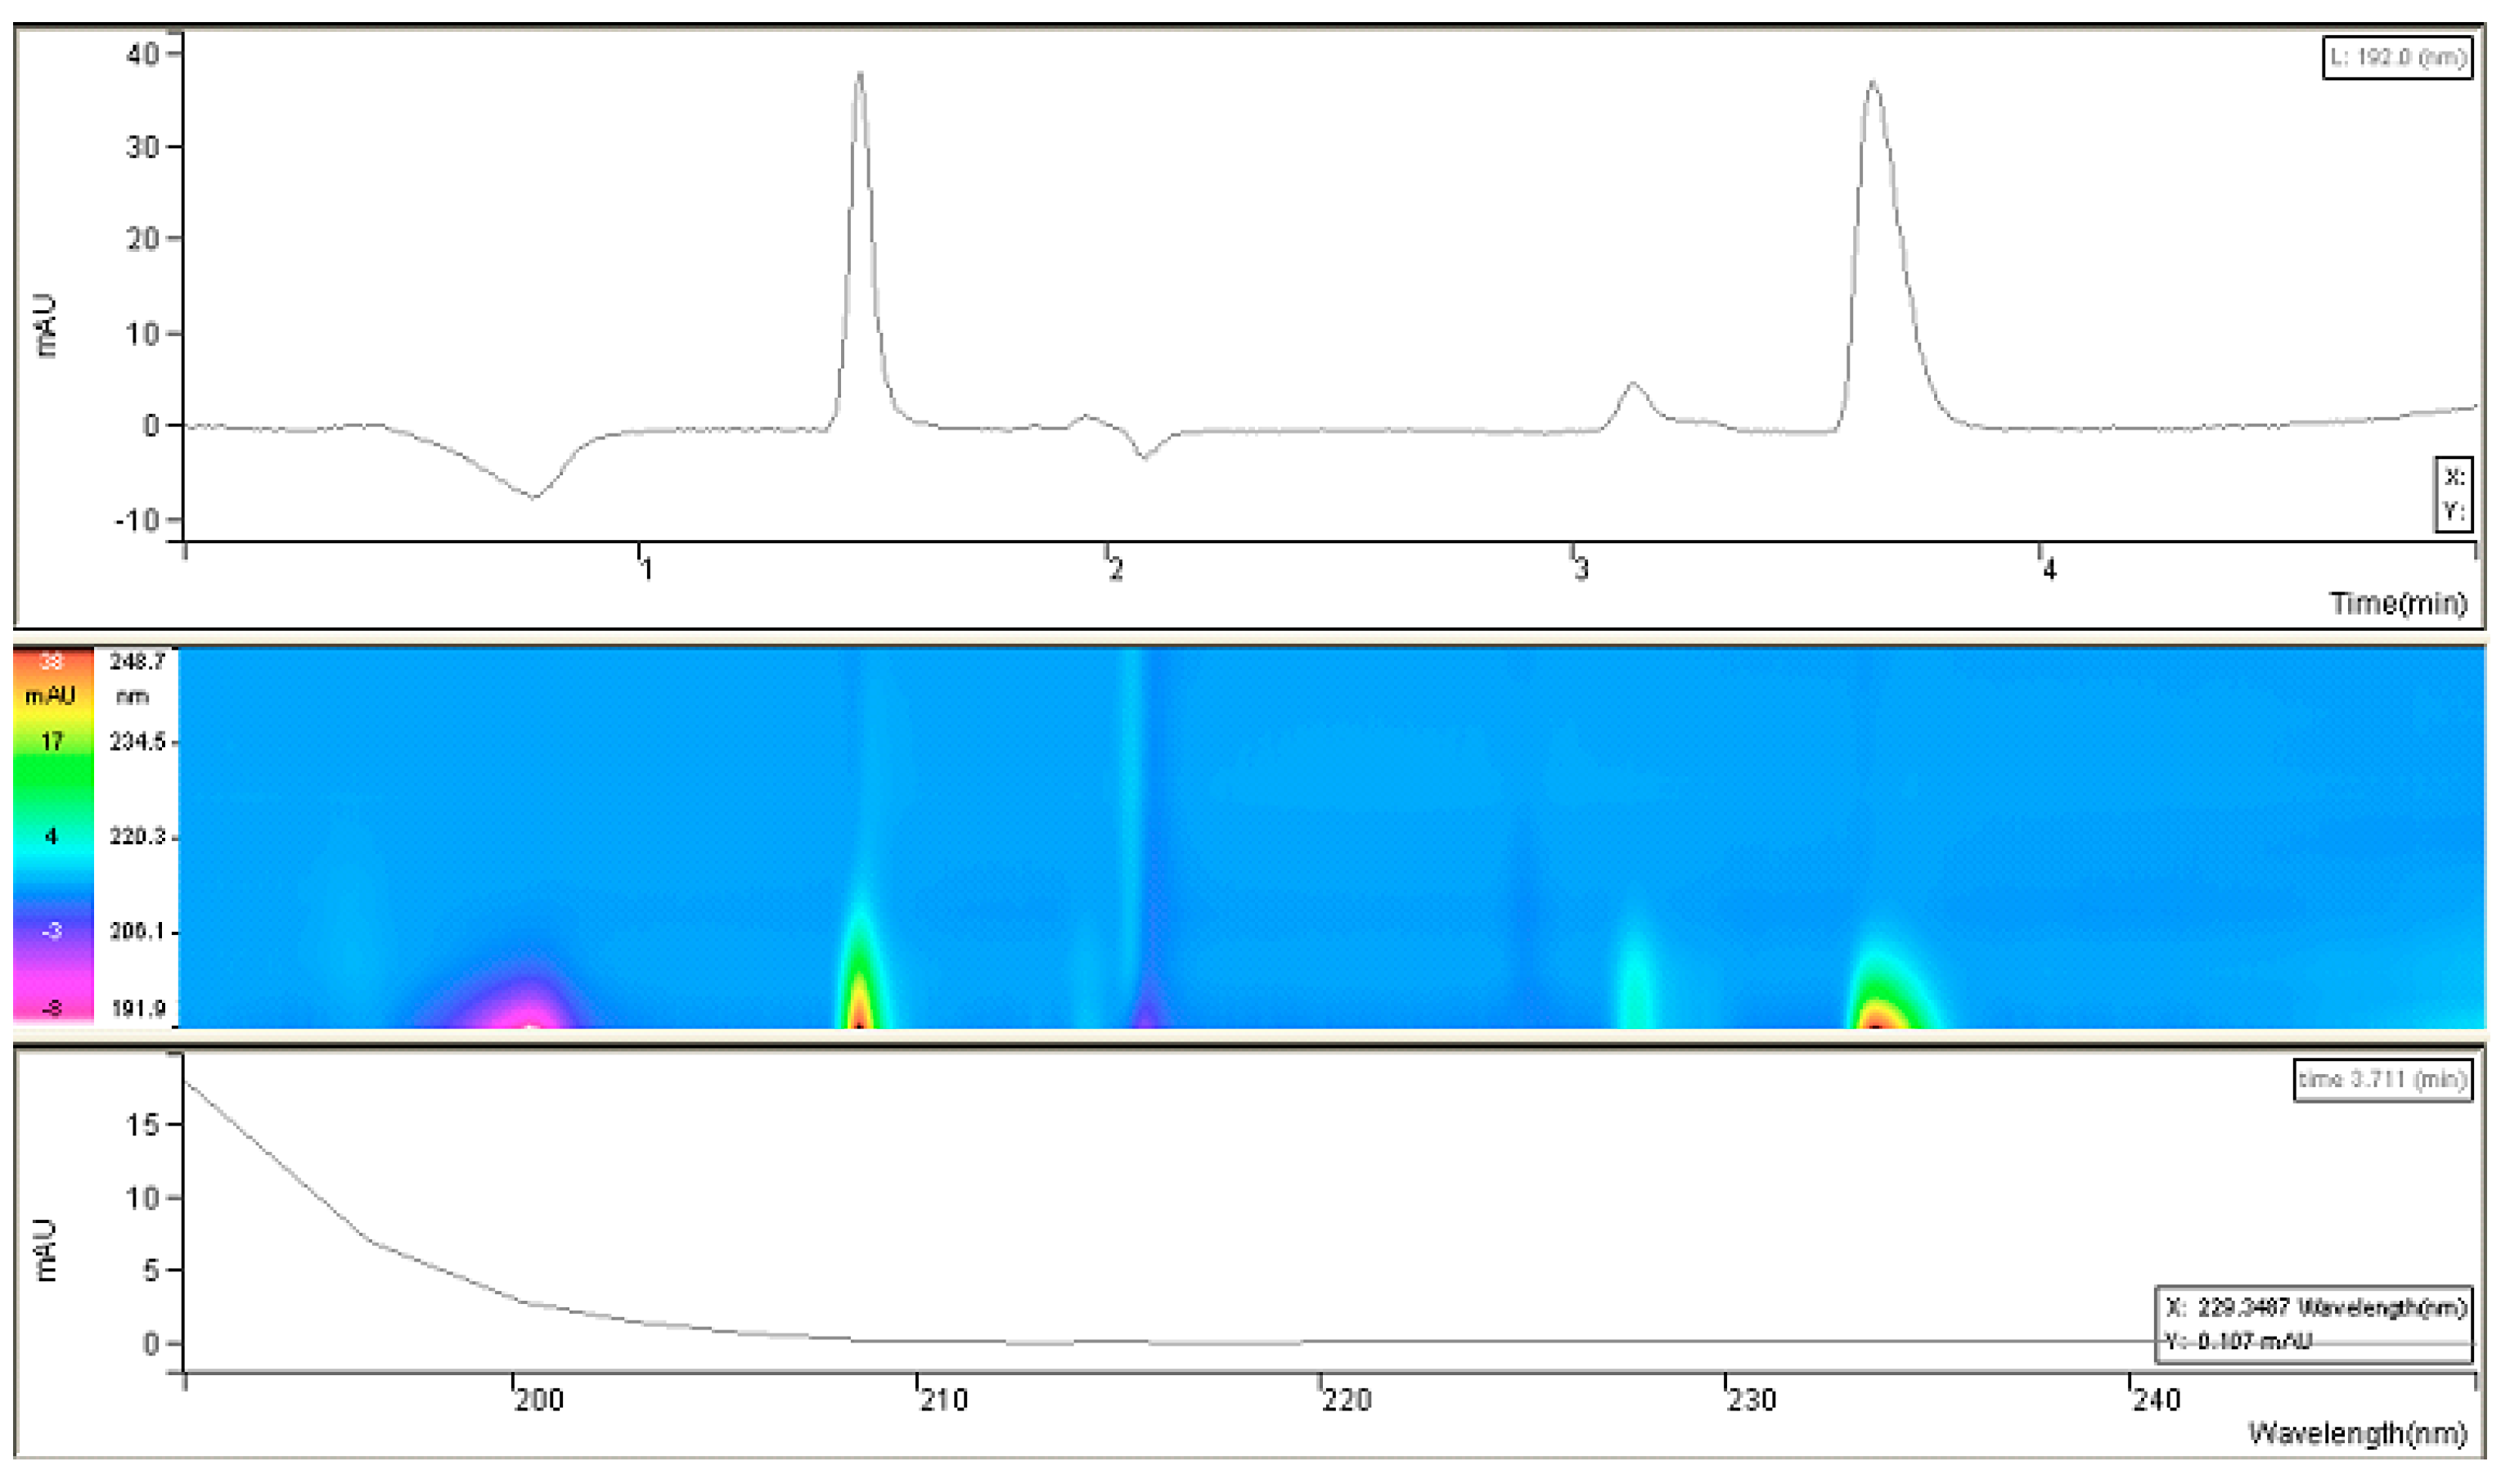
Since it was challenging to find UV-spectral data for fosfomycin trometamol and inconsistency in published articles, experimenting on our own was inevitable. As can be concluded, fosfomycin trometamol is not entirely UV-invisible in the lowest UV region below 200 nm, which prompted us to attempt this for our purposes. After collecting all required information pertaining to its chemical structure and physicochemical properties, we performed research regarding UV-absorption spectral analysis of the standard of fosfomycin trometamol and noted what type of molecule we were to analyze (and that it had a somewhat broader range than expected).
This research suggested the possibility of masking the “thinner” UV-absorption spectral characteristics of fosfomycin with some molecules with a broader range of absorption, like trometamine. This confirmed that the monitoring of the net UV-absorption spectrum of fosfomycin was possible after separation from the trometamol component and the eventual presence of impurities. These poor and overlapping UV absorption characteristics are the standard for fosfomycin in the lowest wavelength-absorbing region, which can be monitored with UV detectors in the range 190–225 nm, or better, 190–215 nm, which is usually inappropriate because of the UV-absorbing characteristics of the mobile phase constituents and buffers, and modifiers like amines and ion-pair agents. This fact limits or excludes the usage of higher UV cut-off values in organic solvents; in such cases, even the purest methanol would be problematic for use with a 210 nm value (
Figure 2).
Our primary results during the investigations concluded that a more acidic phosphate buffer composed of a mobile phase generates higher retention and selectivity in the context of following a logical conclusion for higher retention of ionogenic molecules as a result of higher ionizing suppression. Thus, a stronger interaction of fosfomycin peak on the column was enabled. These hypotheses were confirmed in
Figure 3 and
Figure 4, which clearly show increasing peaks of the fosfomycin run time with increased acidity of the mobile phase by decreasing the pH values.
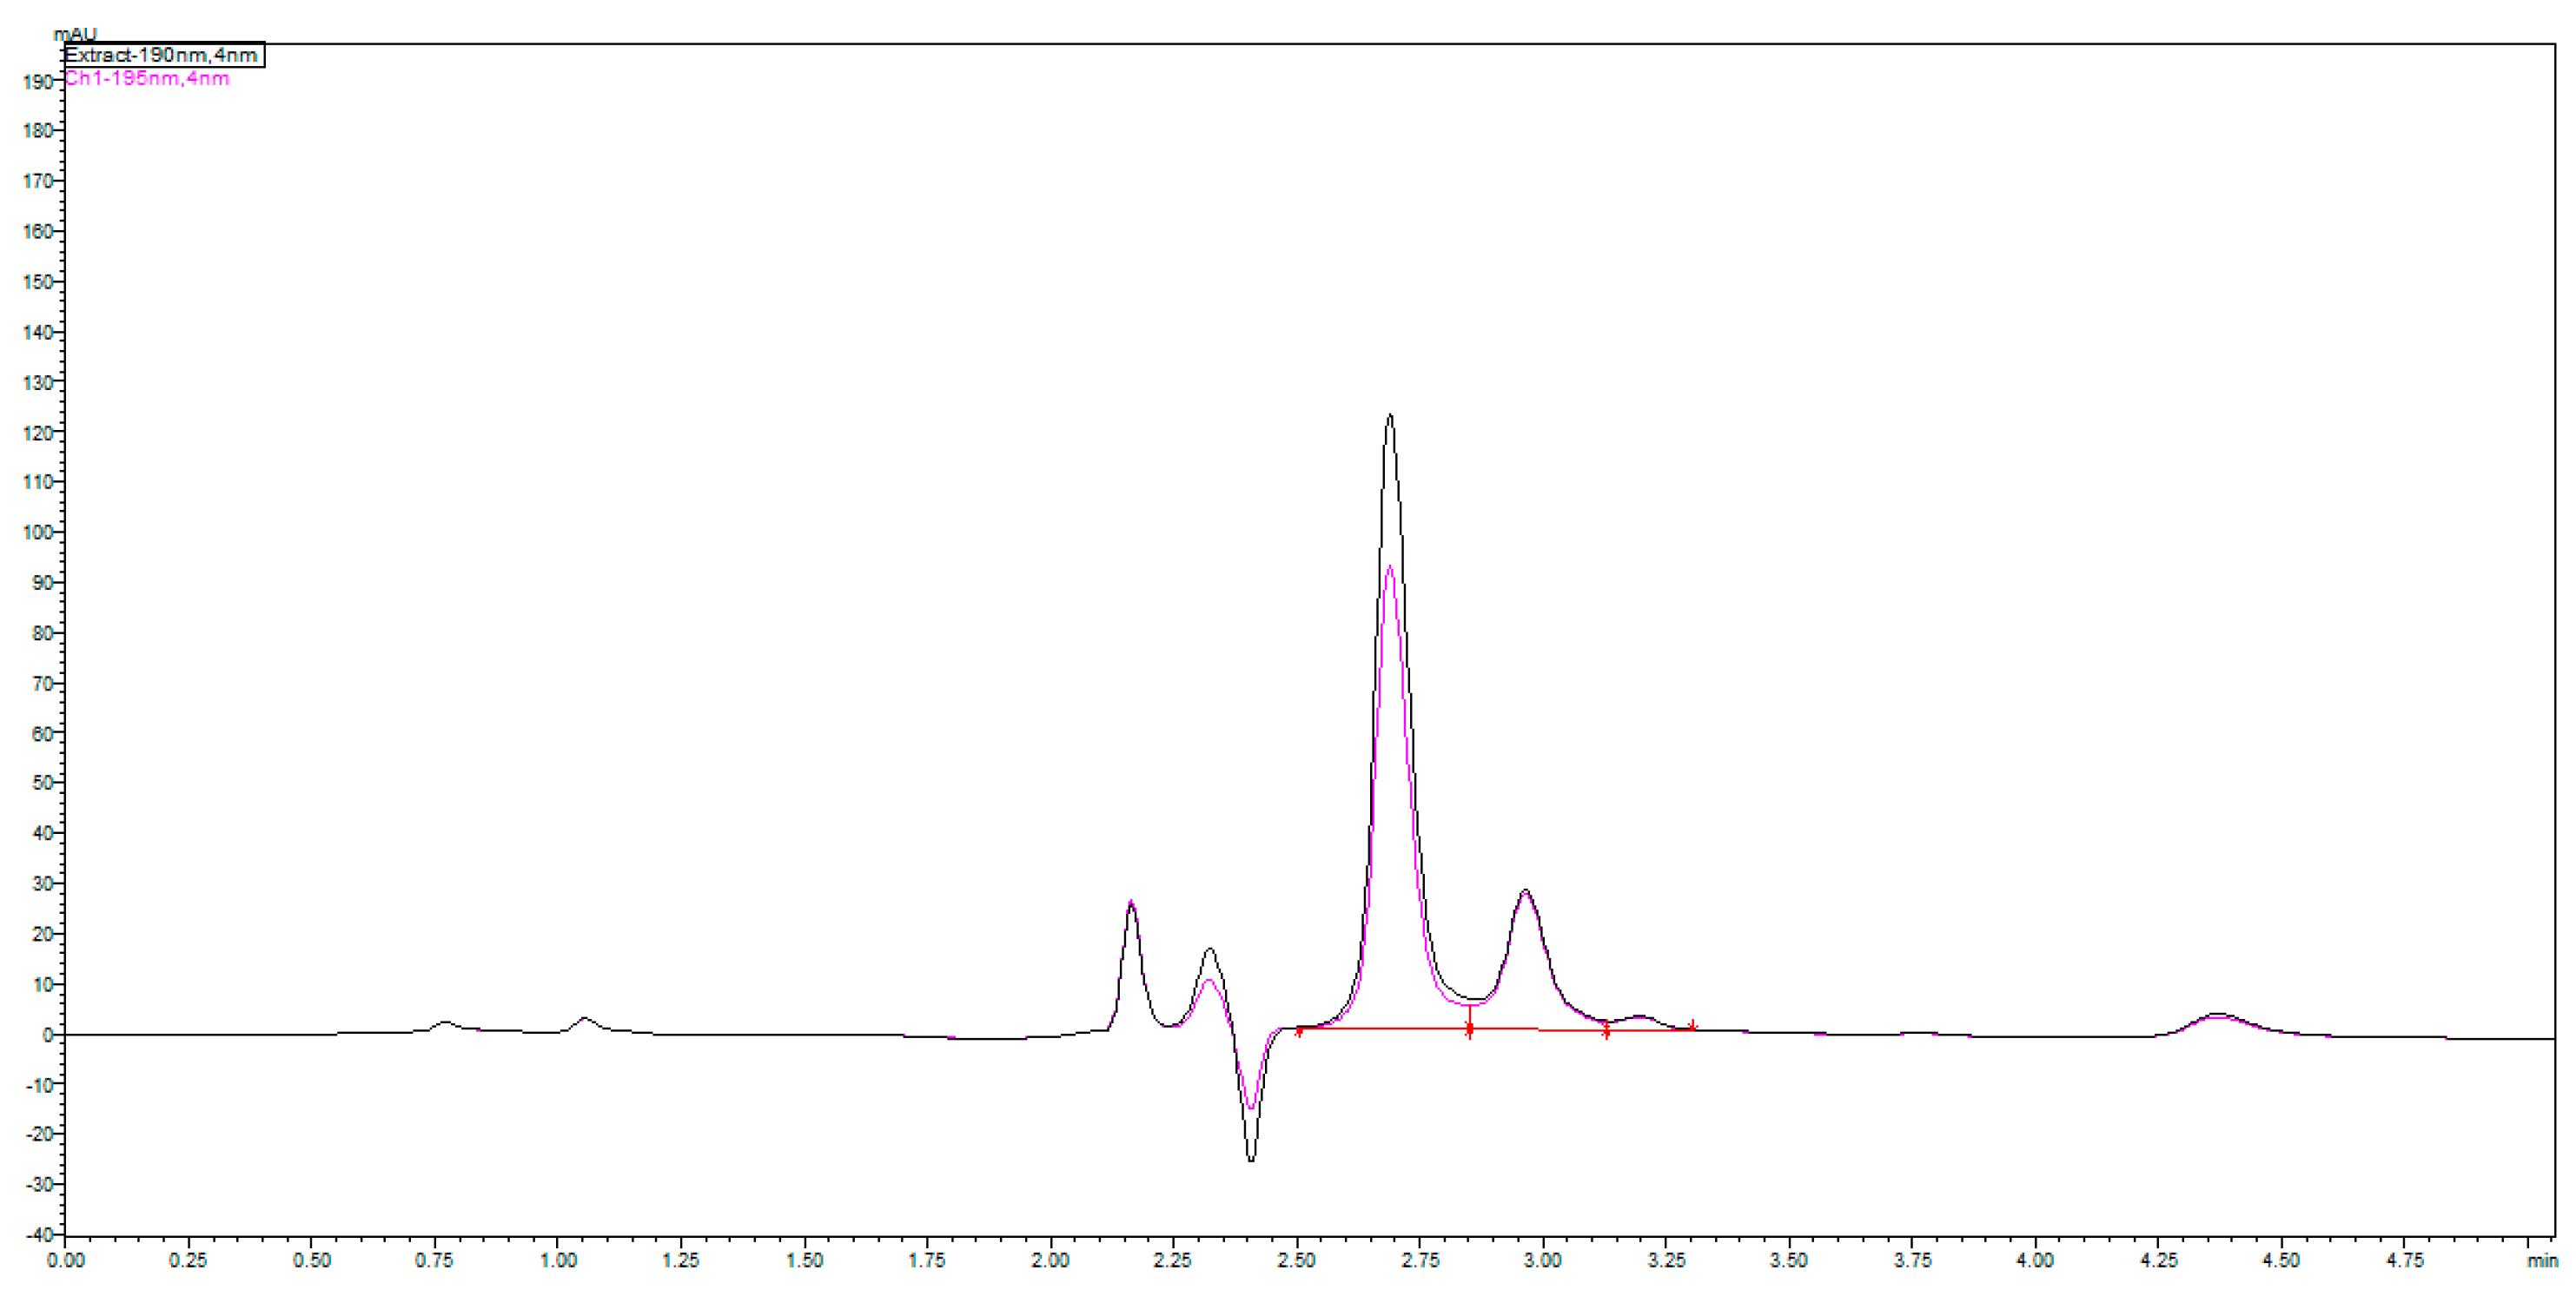
The chromatograms shown in
Figure 4 were obtained by an injection of 24 mg/mL standard on a Zorbax SB-CN 250 mm × 4.6 mm column at 192 nm and 24 and 48 mg/mL standard of fosfomycin eluting at 2.781 min. The mobile phase composed of 0.55%
w/
v KH
2PO
4 and 0.5% acetinitrile pH = 2.45, 1 mL/min flow rate, injection volume—1 and 2 μL of 24 mg/mL standard fosfomycin trometamol dissolved in the mobile phase at UV = 195 nm and 35 °C. We found that the first Zorbax SB-CN column was more reproducible than the LiChrosphere CN, regardless of the concentration of phosphate buffer 10–100 mM, or the presence of acetonitrile 0–2%
v/
v. Adding a small amount of acetonitrile was to prevent the collapse of bonded phase, which was the least pronounced in the shortest alkyl bonded phase.
In
Figure 5, we compared the influence of the buffer concentration (ionic strength) and the percentage of the added organic solvent and flow rate on the separation efficiency on a Zorbax CN-SB column with an injection of 1 μL of 13 mg/mL standard fosfomycin trometamol in the mobile phase. An improved resolution gained with a decreased flow rate is visible at expance of the run time, as expected according to the theory of chromatography. The LiChrosphere CN chromatogram is presented in
Figure 6.
In further work, we performed the testing applicability of another vendor of the LiChrospher-CN column by checking the stability of the granulate from the fosfomycin at room temperature in an opened bottle, both with a prepared and dissolved standard solution and a sample solution. The next chromatogram in
Figure 7 clearly shows the appearance of the degradation products with the reduction in the quantity of an active pharmaceutical ingredient, Fosfomycin, on the column.
The chromatogram in
Figure 8 shows much bigger co-eluent peaks even in the presence of 0.1% of propylamine for ion-pairing and peak symmetry improvement, worked on Varian ProStar 330 DAD. The presence of propylamine increased the retentions of the adjacent peaks of fosfomycin with increasing tailing as a result of enhancing the secondary interaction.
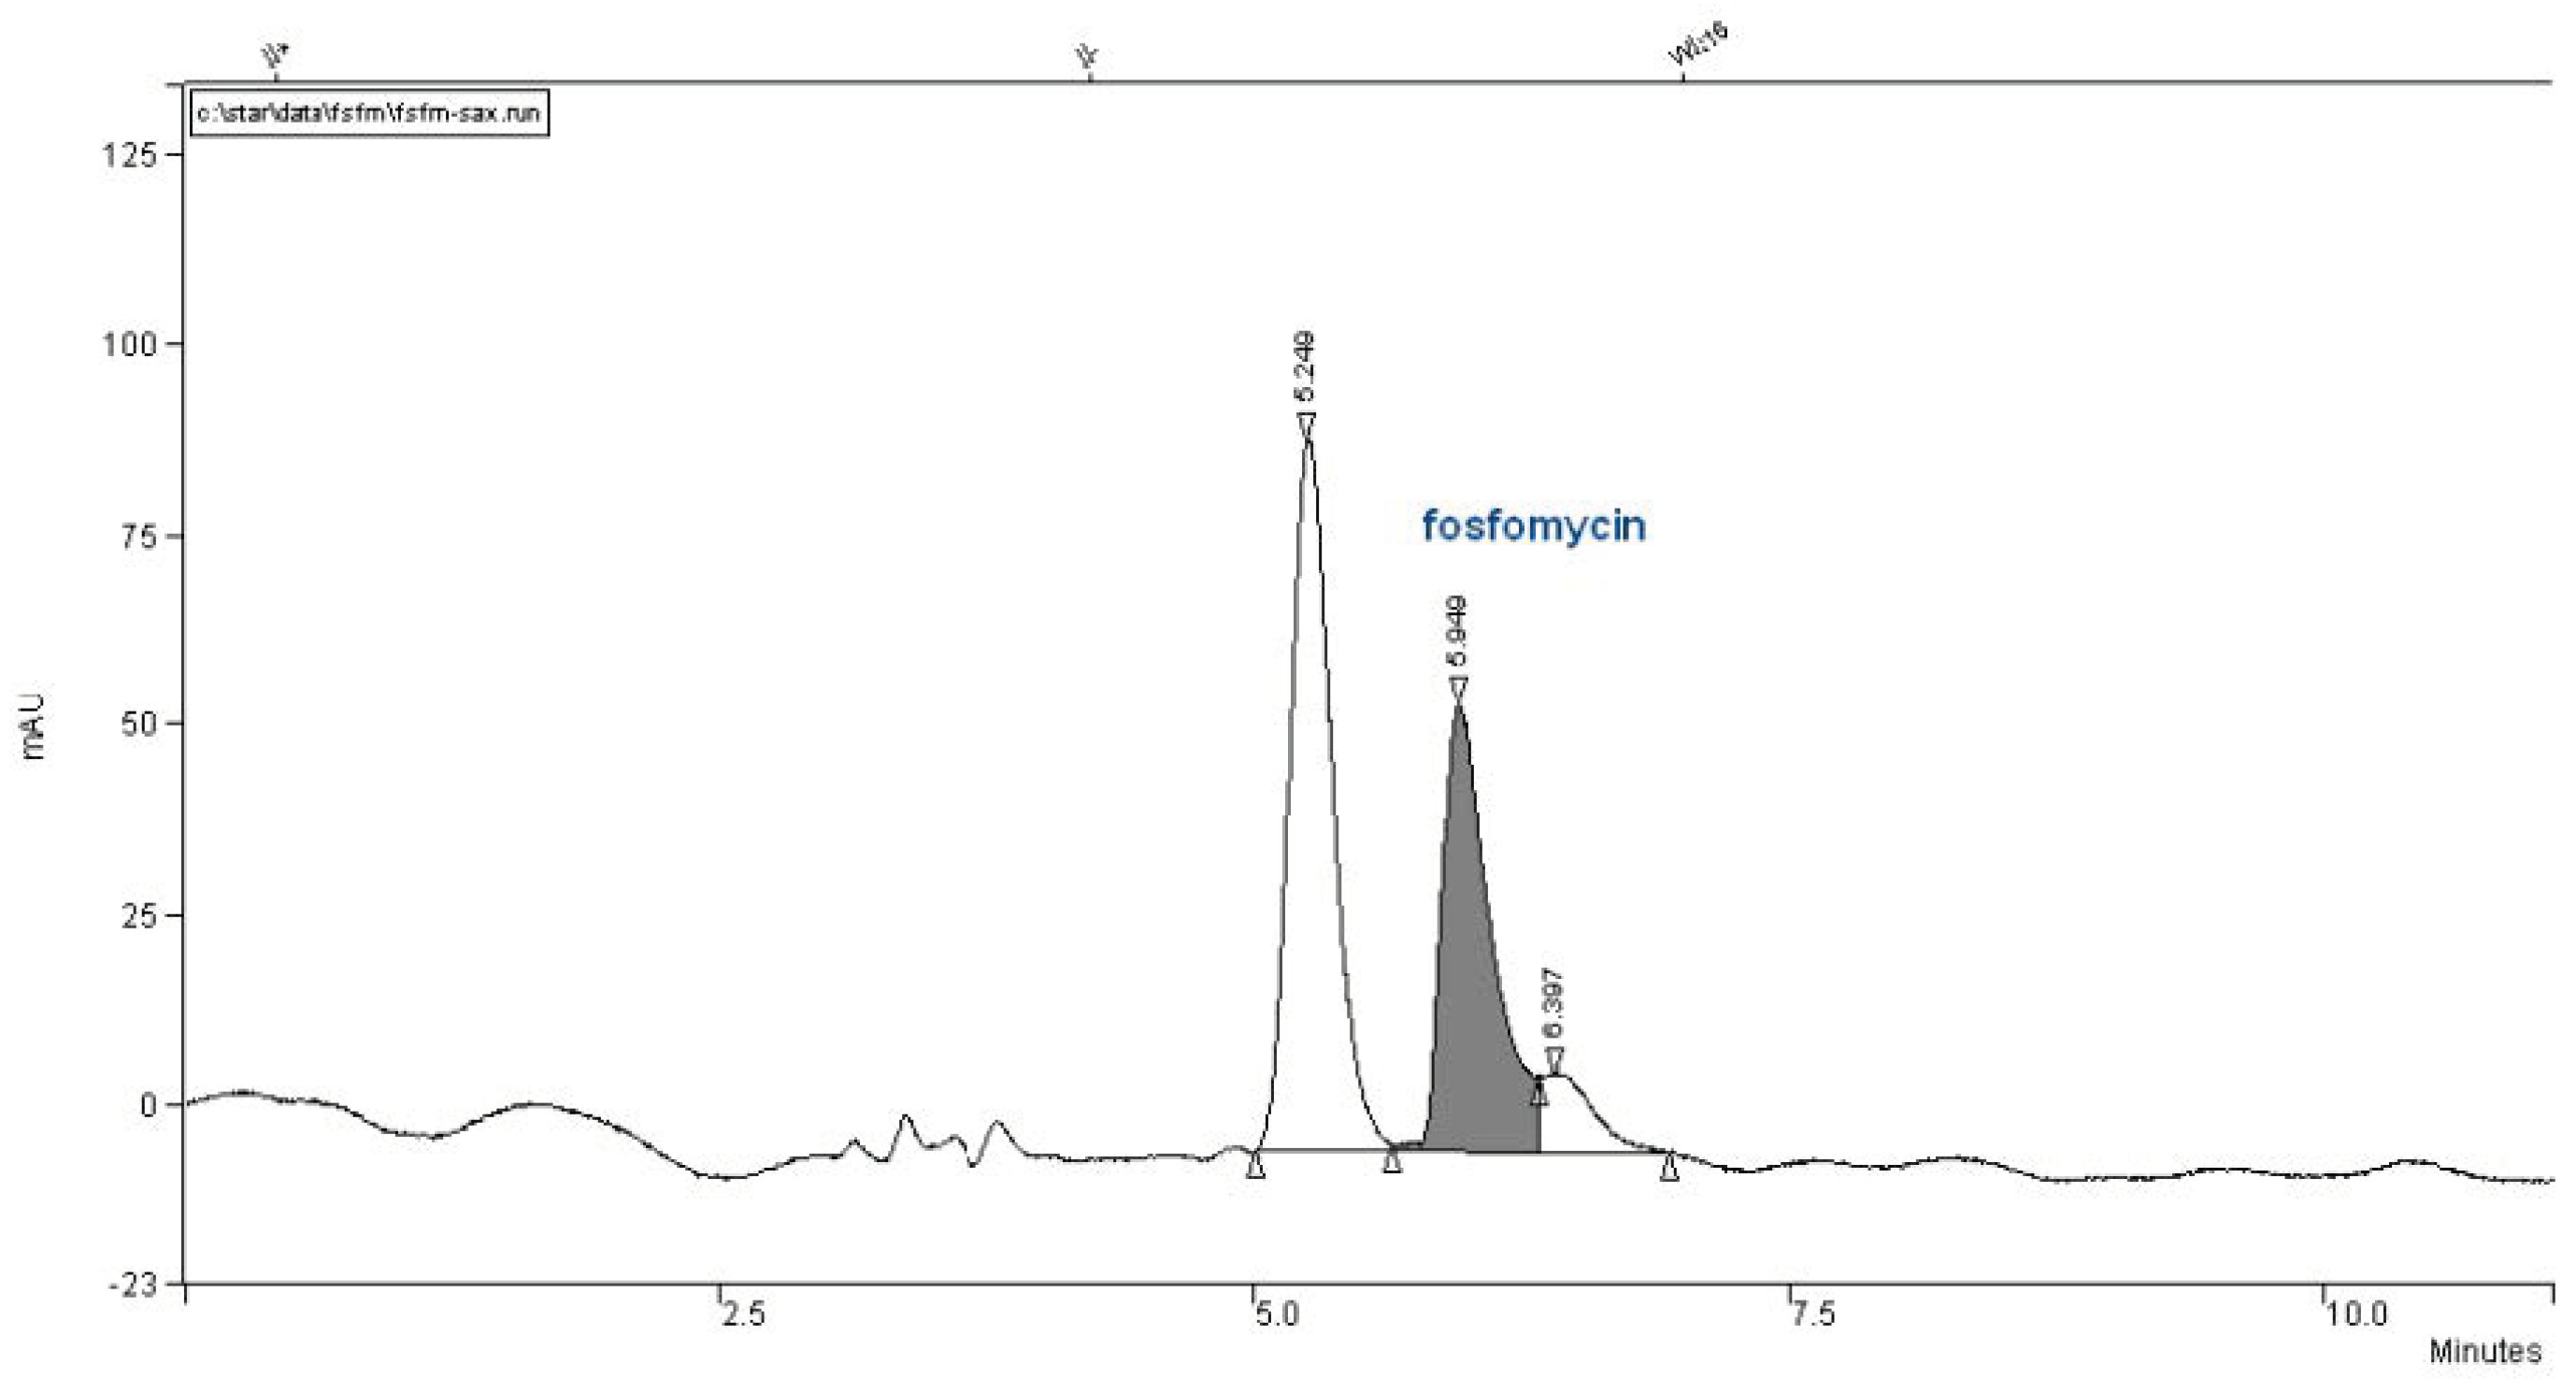
We did not have this type of column and attempted to use a Partisil SAX column with the same dimensions of 260 mm × 4.6 mm, but it was twice less effective with 10 μm particles (
Figure 9).
Compared with the described method by Liu et al. [
17], the authors cited the usage of a more powerful 5-μm particle column with the same dimensions 250 mm × 4.6 mm (product of Agilent Technologie), which achieved higher retention and sensitivity. Generally, we experienced and were reminded about the main drawbacks of ion-exchange liquid chromatography application. First of all, the equilibrations were time-consuming, sometimes in the range 50–200 column volumes, and generally accepted a lower number of theoretical plates per meter compared to reversed-phase columns. After that, fine-tuning in the peak elution positions is more complex and is governed by many factors that should be strictly controlled, like buffer salt choices with their concentrations and ionic strengths, pH, temperature and flow rate. This set was changed, as the buffer should be combined with organic solvents.
In our specific limited situation, a proper selecting and working with components, ingredients of mobile phase that must not absorb in UV-region of 190–195 nm, further additionally complicated the method’s development. The last unpleasant drawback in all ion-exchange chromatography sepataions is limiting with injection volumes/quantities of analytes, for achievement of symmetrical chromatographic peak shapes, governed by balanced Gausian thermodynamic equilibration distributions of analytes between mobile and stationary phase. In our research, we had not choice to select 5 um particle based column, but only with the strong anionexchange Whatman Partisil SAX-10 250 mm × 4.6 mm, with 10 μm particles, but even with this we i achieved interesting and applicable chromatographic separations, as shown in
Figure 10 and
Figure 11.
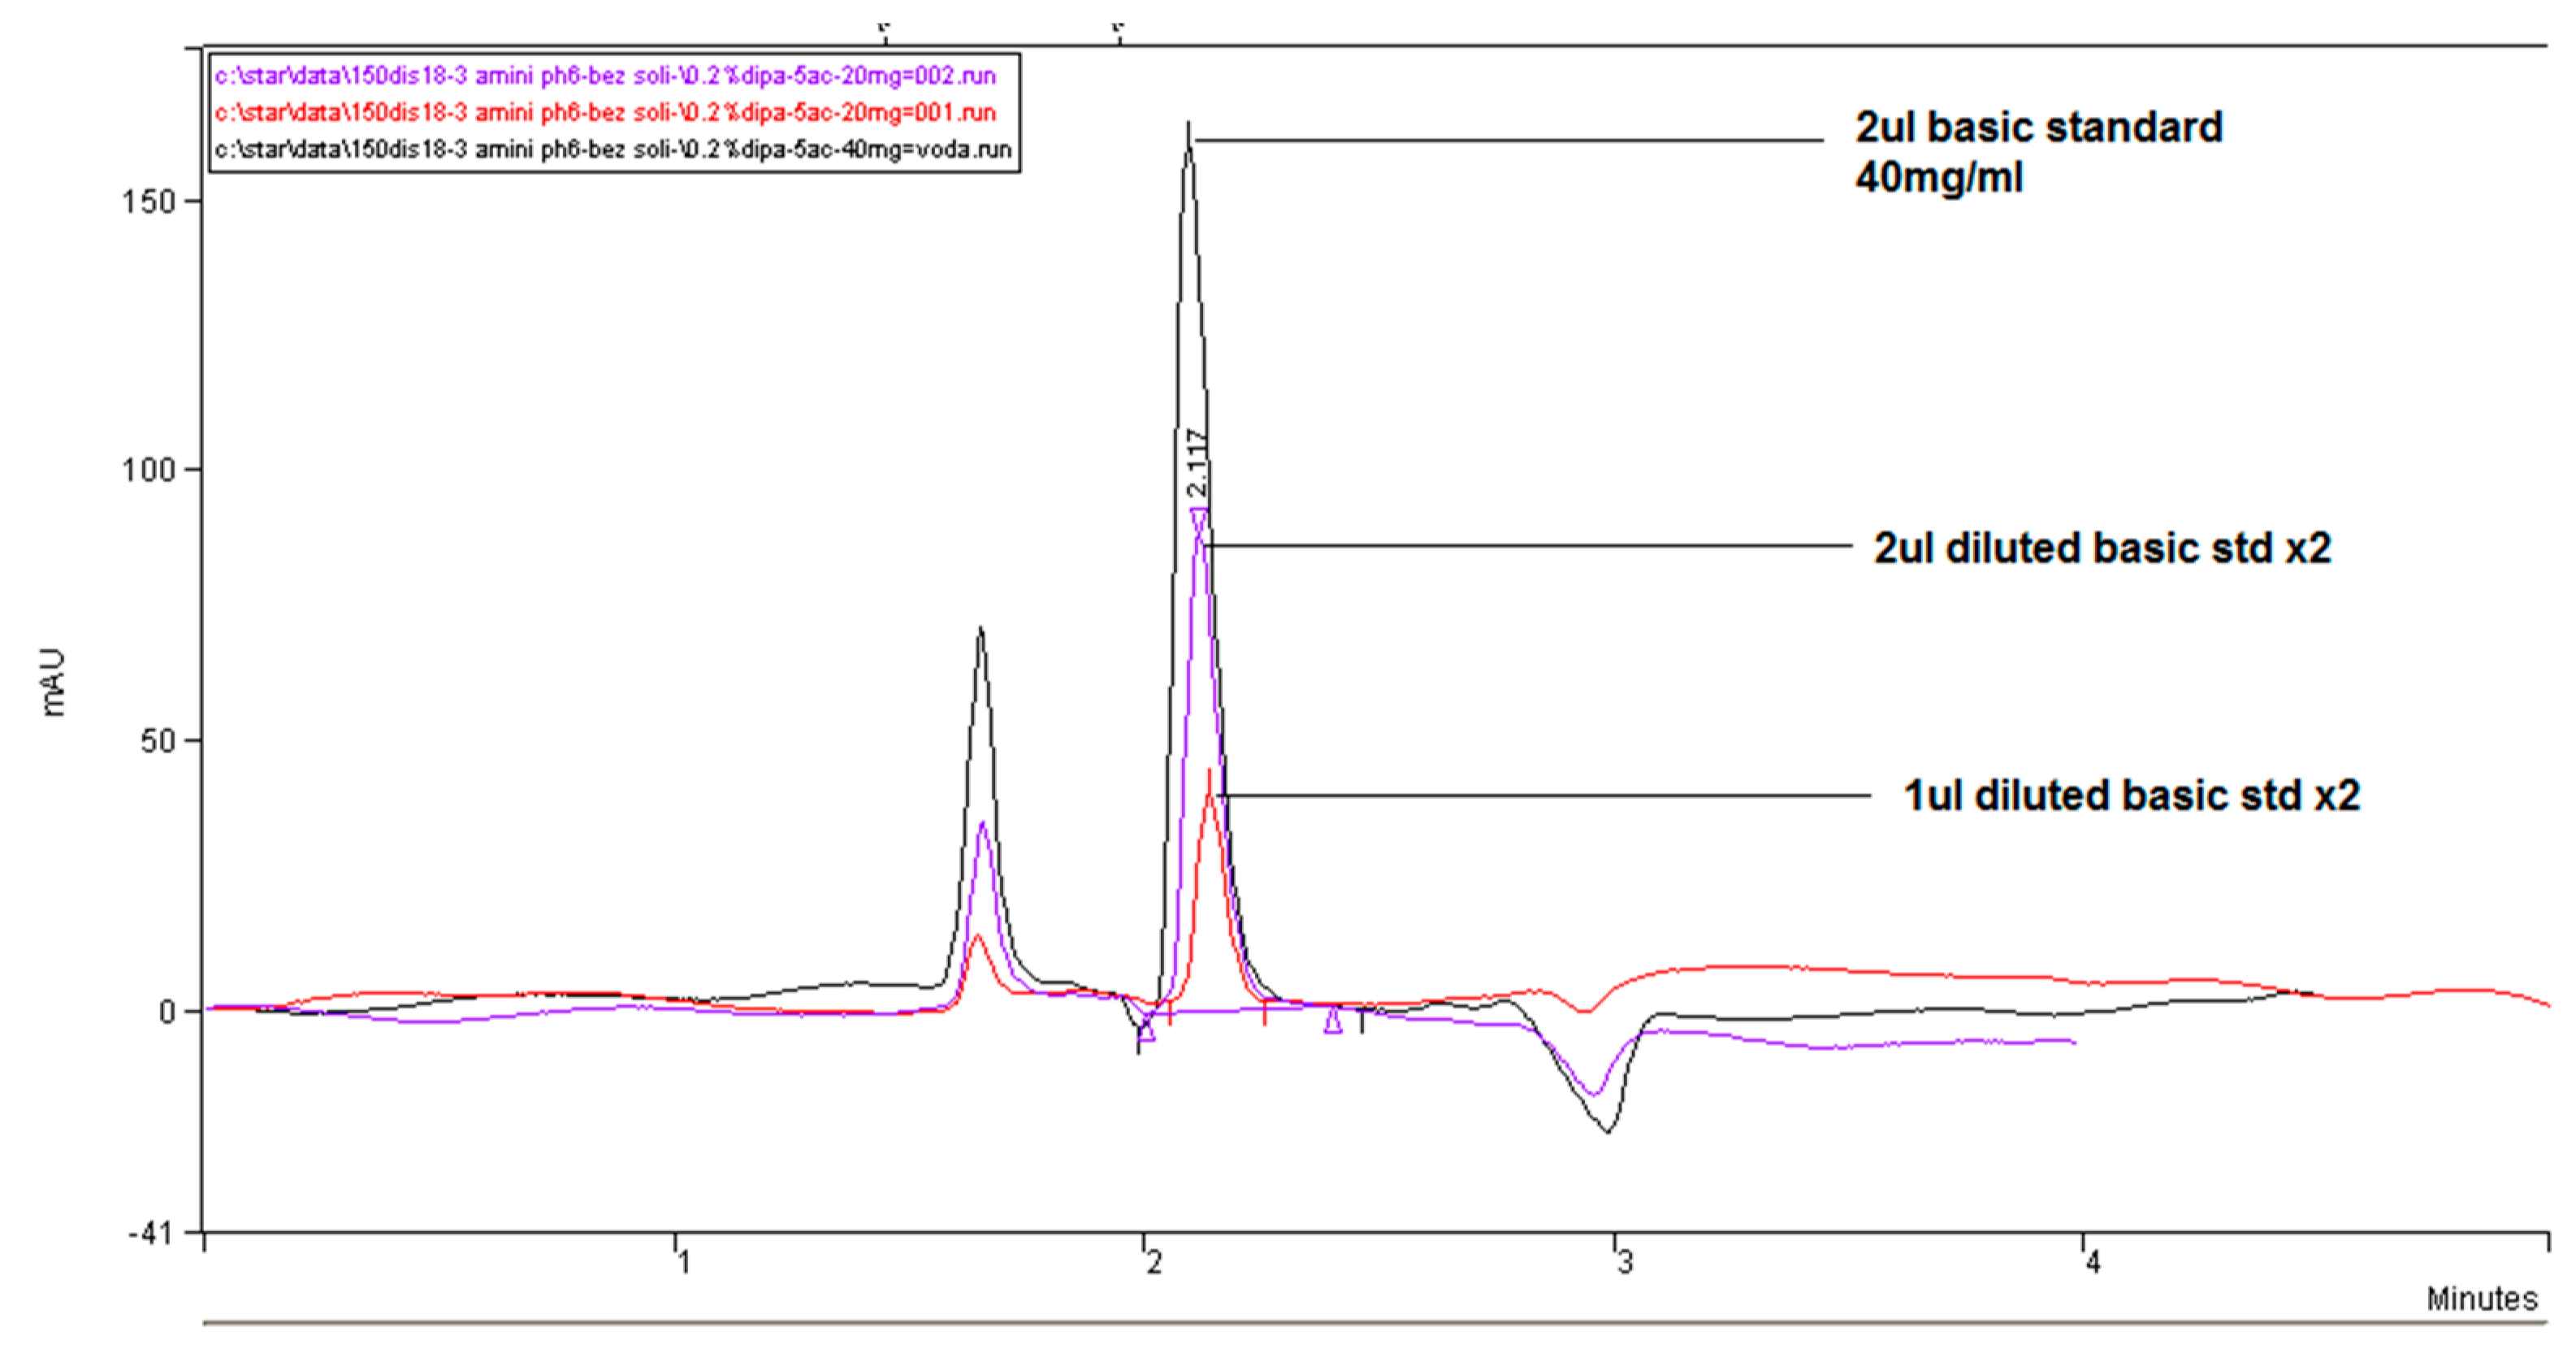
Figure 12 illustrates the chromatograms overlay for the comparison of the linear response of the method with the use of the shortest alkyl=chained diisopropylamine amino modifier as ion-pairing agents. However, as can be seen with this amine, a highly visible and symmetric peak of fosfomycin can be achieved, but with relatively low relative retention and no promising elution profile even by reducing the percentage of acetonitrile in the mobile phase, without the presence of the separated peak components. This column and mobile phase might become favorable for high throughput analysis for the quantification of fosfomycin analyte but does not hold promise for the development of the determination of related compounds or degradation products.
The method can be easily improved, re-optimized and redesigned to improve the separation power by simply replacing the column with one of a longer length of 250 mm, or a more densely packed chromatographic matrix with a higher surface area or a umol/m2 bonded phase, but at the expense of doubling the run time and longer equilibrations. The next ion-pairing amine used was hexylamine, with a very high water solubility of 12 g/L (118 mM/L) and satisfying UV transparency. The first tested chromatogram was done with a Discovery C18 150 mm × 4.6 mm, 5 μm column on Varian ProStar 330 PDA, mobile phase composed of 7 mM KH2PO4 buffer + 93% of 0.25% v/v hexylamine and pH adjusted to pH = 6.
The chromatogram in
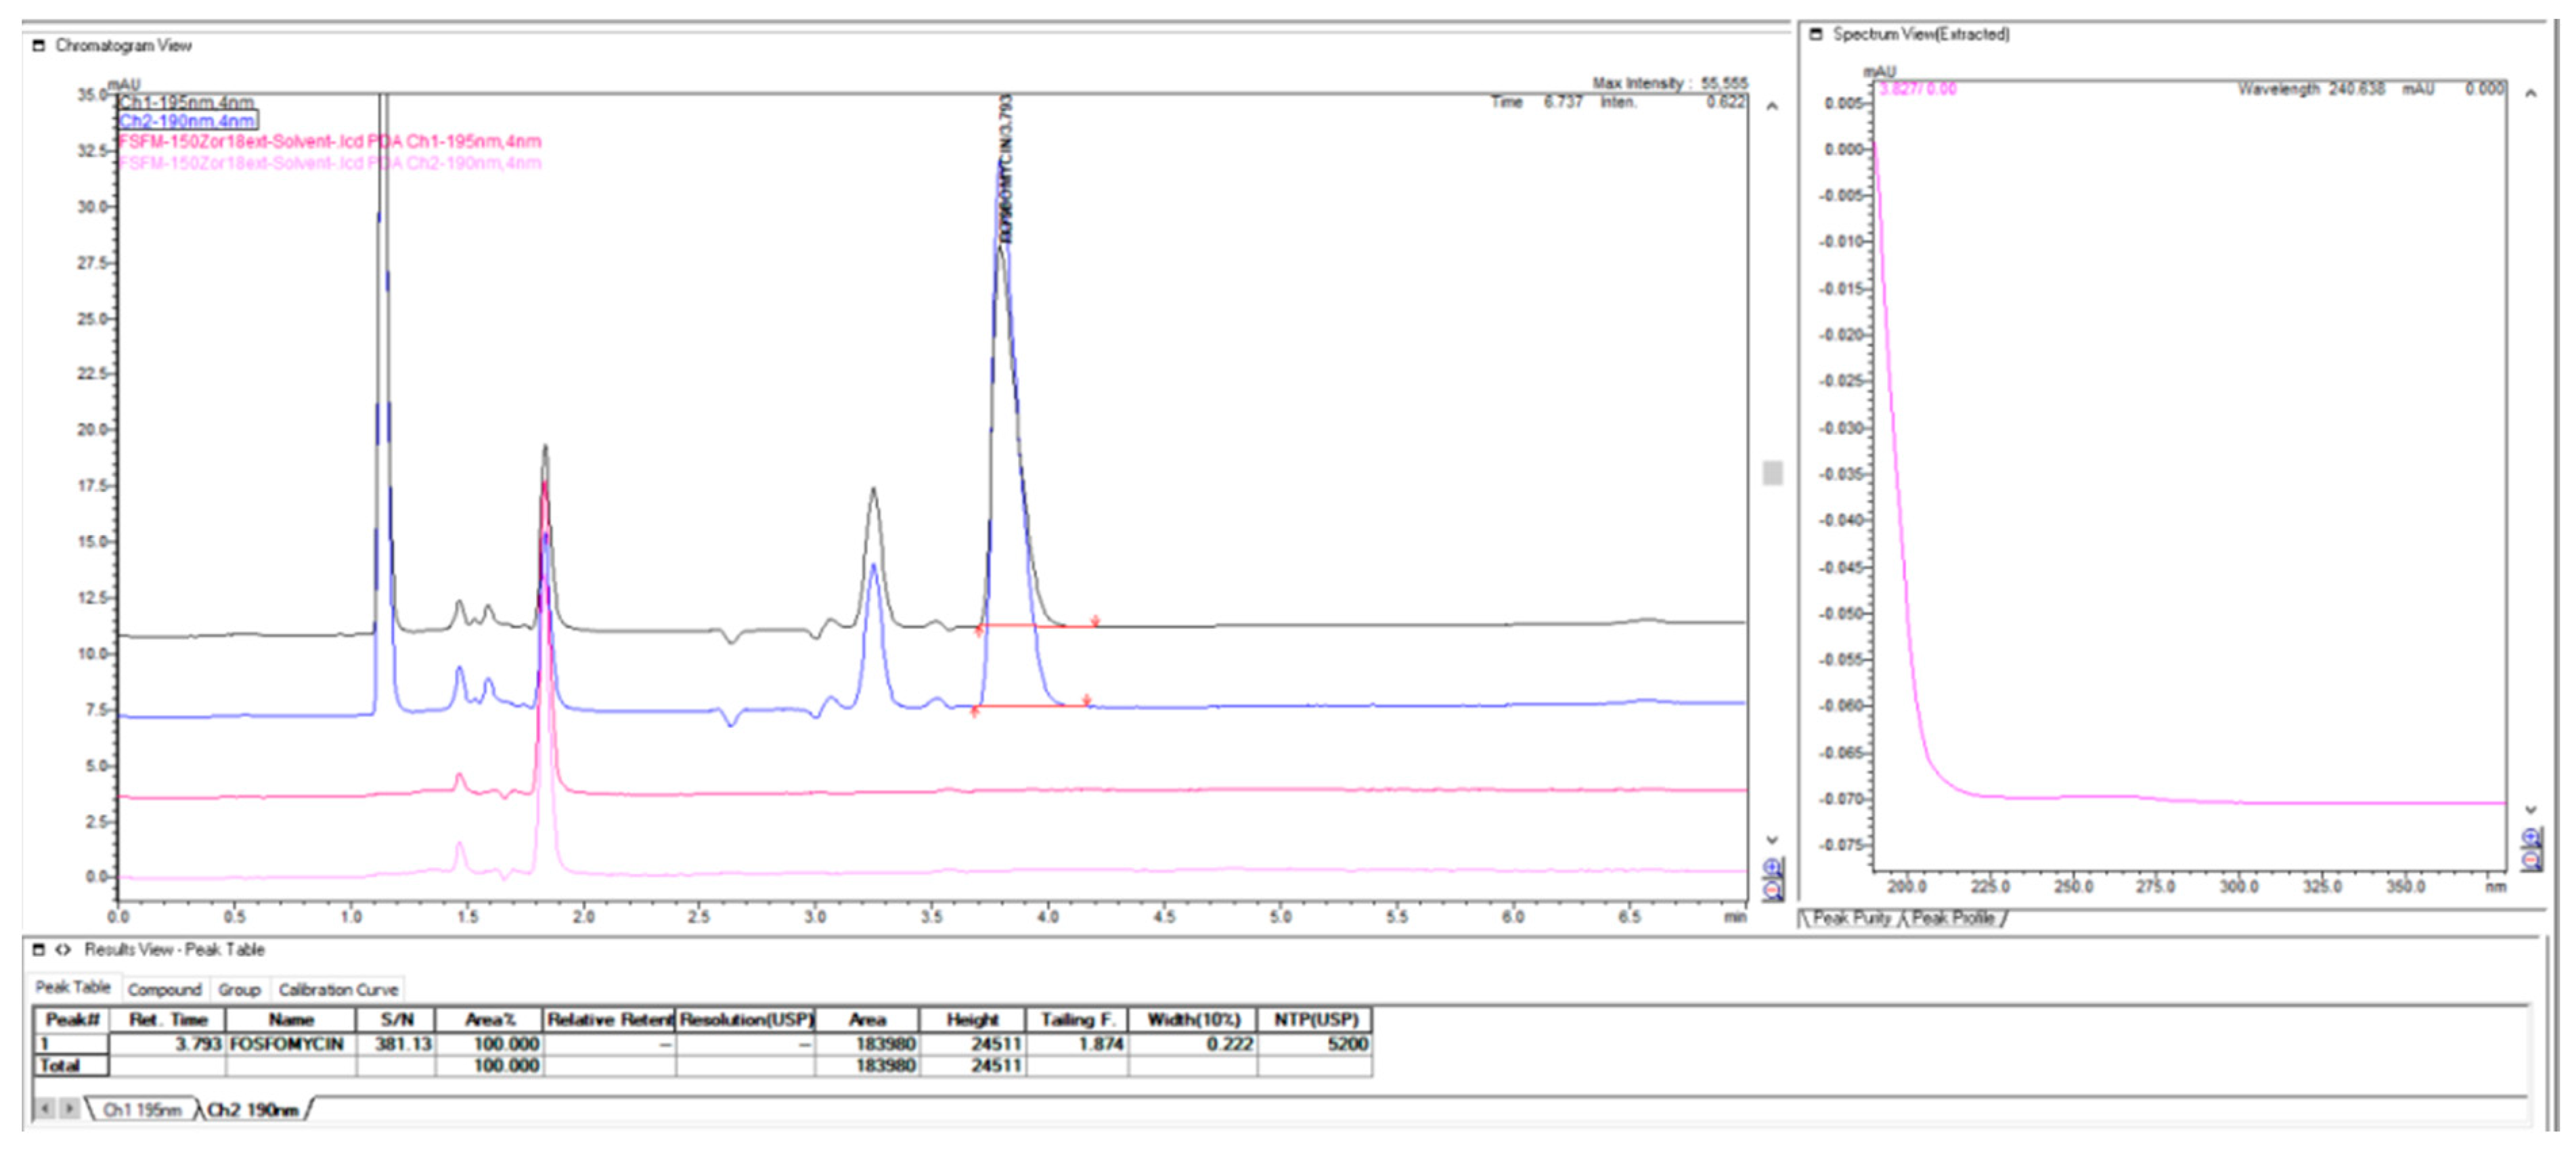
Figure 13 performed with the Discovery C
18 150 mm × 4.6 mm and 5 μm columns appear to achieve a relatively symmetric peak of fosfomycin trometamol, t5% = 1.87, and was well retained and separated from another component peak. In all reversed-phase chromatography analyses, C
18 or octadecylsilane matrix-filled columns were used to maximize the retention of fosfomycin. A comparison of 192/195 nm was used to check the differences in sensitivity in the calculating factor. If newer HPLC generation equipment was used, a 190/195 nm relation is used. However, previous generations of Varian equipment do not allow for the use of wavelengths below 192 nm for calculation and presentation—their lowest point is 190 nm. In further research activity, we performed a variety of experimental conditions, chromatographic columns with different features from different vendors, changes in the mobile phase constituents, percentages of added organics solvents, concentrations of fosfomycin analytes in solution, and even different chromatographic systems of different concepts, generations, performances and vendors.
Figure 14 illustrates the shape of the chromatogram with a slightly changed mobile phase with 1% less organic acetonitrile in the mobile phase on the same Discovery C
18 column 150 mm × 4.6 mm, 5 μm, and worked on Shimadzu Nexera LC-40 and obtained an almost identical system suitability parameters of the chromatogram, with an asymmetry Tailing Factor = 1.89, Retention time tR = 3.42, where 0.22% hexyalmine was used at pH = 6.1 with 30 mg/mL target sample of analyte concentration. These results confirmed the presumption that RP columns can efficiently balance a higher quantity of injected quantity of analyte molecules on the column. A comparison of two different mobile phases with different alkylamines and concentrations of acetonitrile mobile phase analyzed on the same Discovery C
18 150 mm × 4.6 mm column with 5 μm particles is shown in
Figure 15.
The hexylamine was checked with other combinations and equipment, and with UHPLC Dionex Ultimate, with 4-channels UV-detector without PDA spectrum analysis, and we obtained the following results at 195 nm, which is shown in
Figure 16. This method with usage of Discovery C
18 150 mm × 4.6 mm, 5 μm column in combination with hexylamine as pairing agent and here with added low molarity 7 mM phosphate buffer, showed promising chromatographic separation, even the column was too much previously exploited and weakened, with reduced retentivity and other performances, plate counts for about 15%. In all chromatographic concepts for method development, low injection volumes were presumed to reduce as possible the established equilibrium of column matrix with sample solvent, even if that sample solvent was always the mobile phase. In the lowest wavelength of a UV absorption range of 190–195 nm, a reduced injection volume significantly contributed to the reduction of fluctuations appearing of ghost peaks from the mobile phase constituents, even those of the highest purity grades. This result encouraged us to proceed with research using C
18 columns with long alkyl chain amines with different column vendors and 2-aminoheptan, which still has satisfying water solubility for mobile phase composition of about 77.2 g/L. When using a longer chained amine, one should account for lower water solubility and longer retention times when coupled to fosfomycin, and eventually, an increased percentage of the organic modifier, acetonitrile, in the mobile phase to optimize peak elution and diffusion spreading, thus reducing the sensitivity of the method.
We first applied 2-aminoheptane on an older model of a HPLC Varian ProStar 330 with PDA, and obtained the following chromatogram results of fosfomycin trometamol, in the sample concentration of 20 mg/mL and a mobile phase composed of a mixture of 10% acetonitrile and 90% of 0.23% 2-aminoheptanhe with pH = 6.1. The peak size was compared at two wavelengths—192 nm and 195 nm—without any added buffer salts, and a Discovery C
18 150 mm × 4.6 mm, 5 μm particle column was used. An interesting chromatogram appeared with a more stable and retained fosfomycin even at a higher percentage of acetonitrile, which is presented in
Figure 17. The last chromatogram concept of the mobile phase was applied on a UHPLC Shimadzu Nexera with much better characteristics, and we used a Zorbax C
18 eclipse XDB 150 mm × 4.6 mm column, which has higher efficiency with more theoretical plates, denser ligand bonding and a wider pH range of application. The results in the chromatograms are presented in
Figure 18.
As can be seen from
Figure 18, using the 2-aminoheptan at a concentration 25 mM and a pH of 5.8 yielded very good chromatogram selectivity, retention and satisfying peak symmetry in the range 1.7–1.89 depending on the injected analyte. The elution position of fosfomycin was not jeopardized and the trometamol was eluted first at the retention of about tR = 1.2 min.
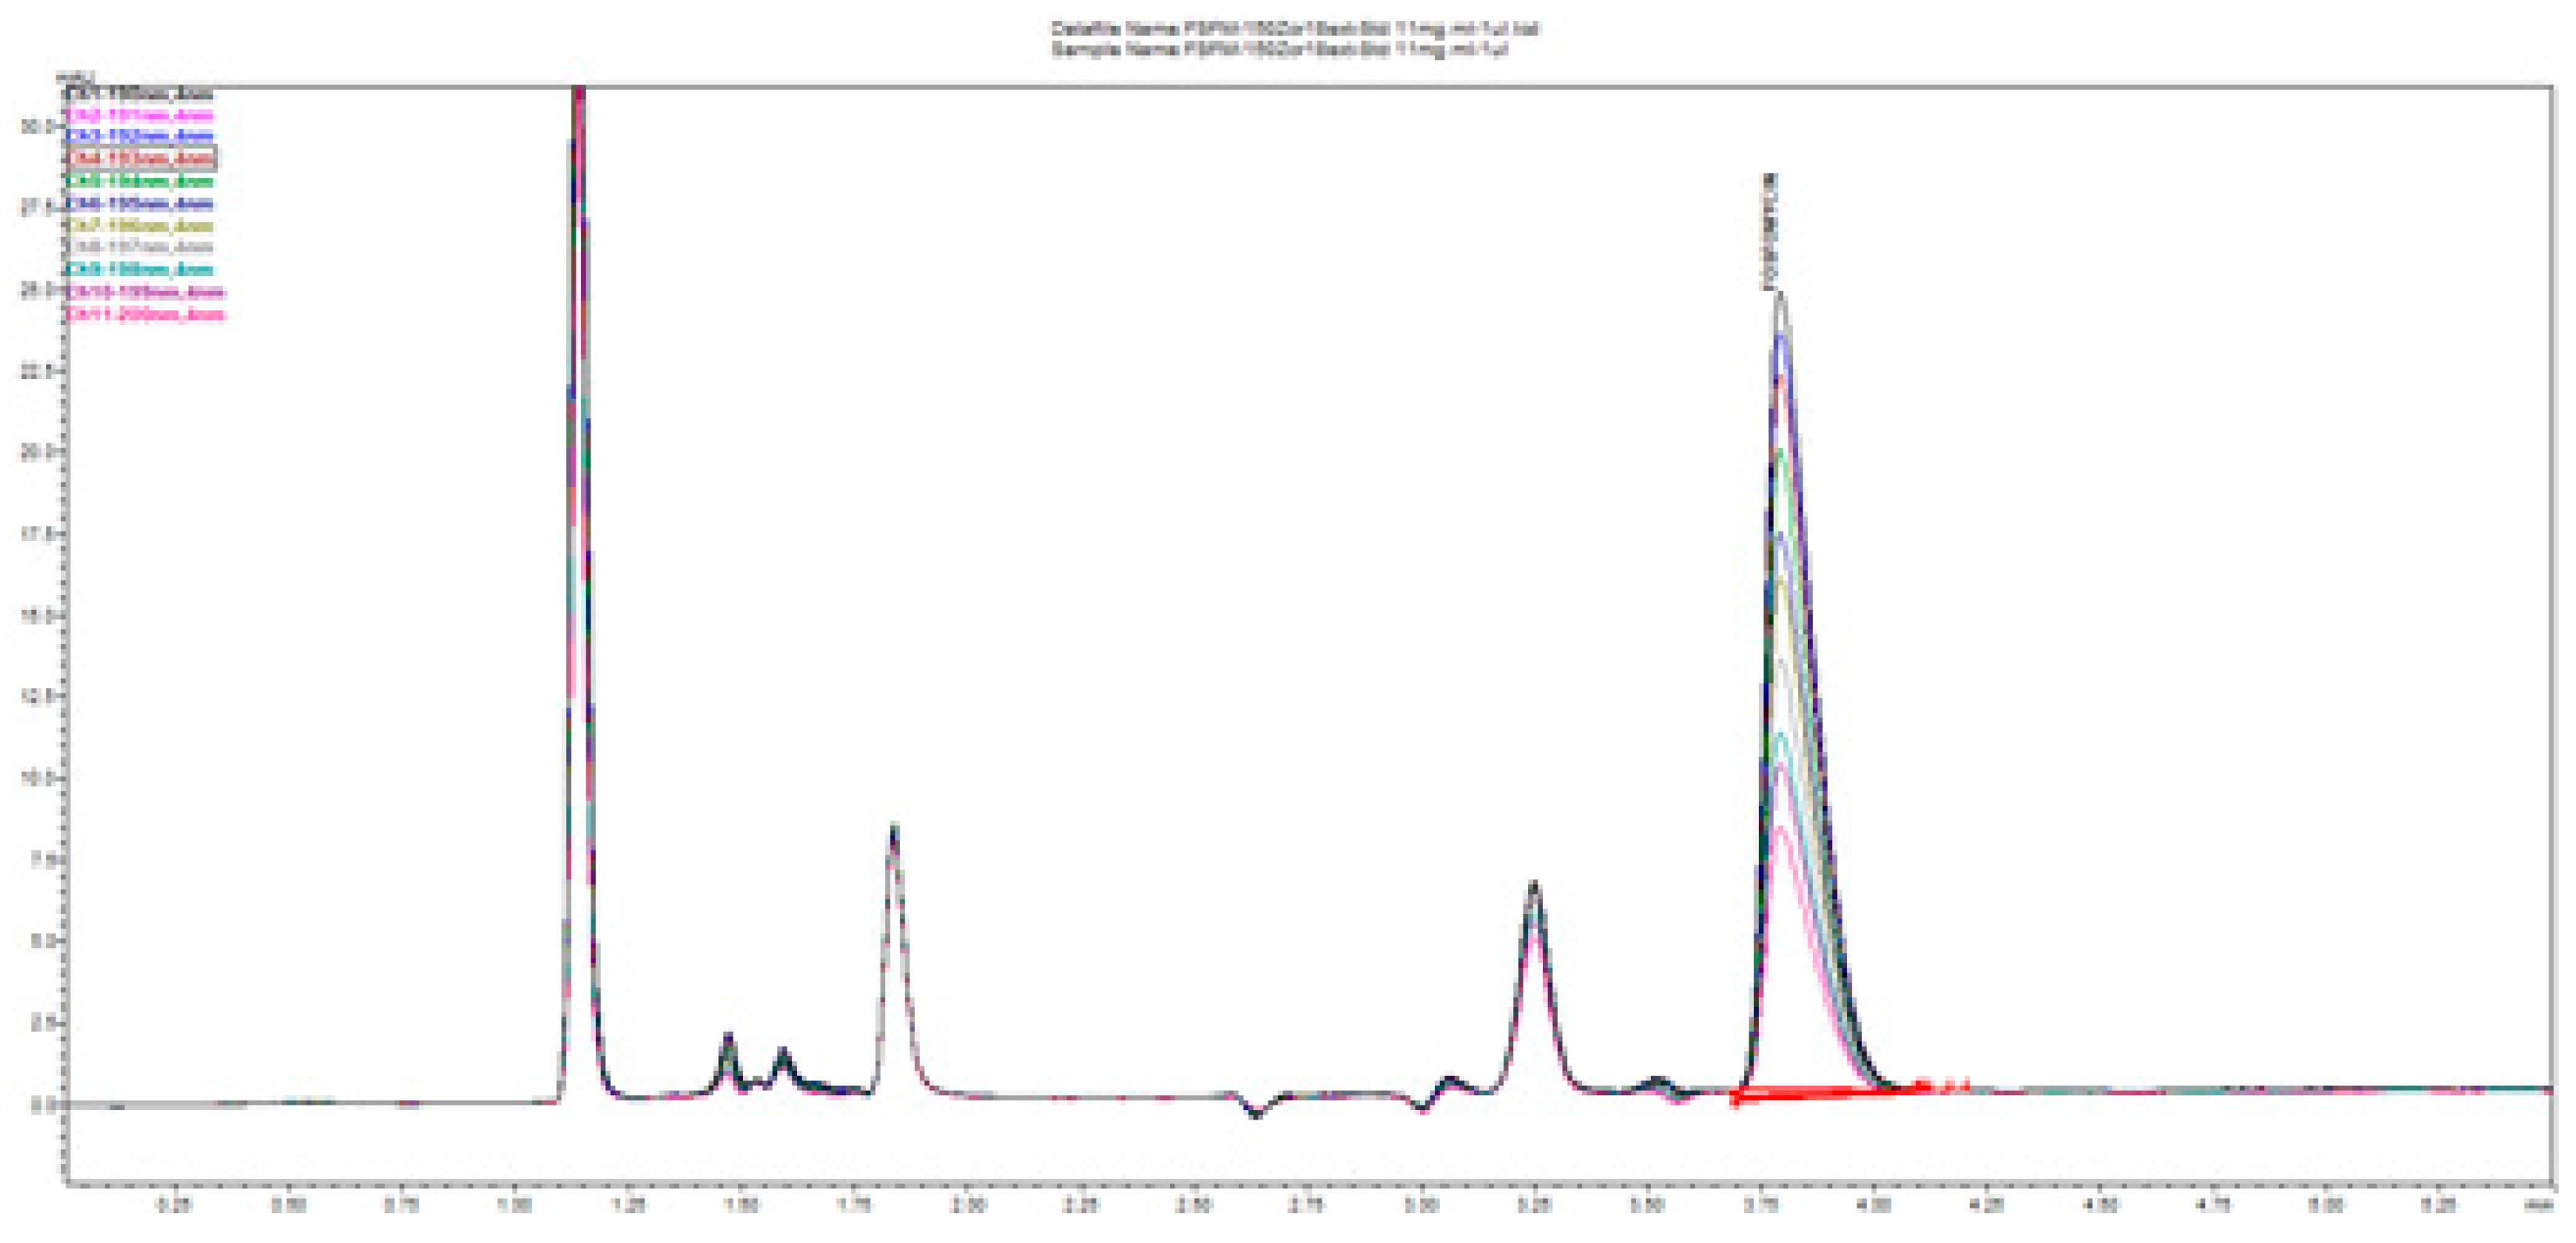
Figure 19 illustrates the change in the peak size and profile of all the peaks present on the chromatogram monitored at 11 channels with increments of 1 nm. This is a consequence of the highly dependent and distinguished change in UV absorptivity of fosfomycin in the lowest measurable range of 190–200 nm. This situation confirms the method selectivity and applicability with the usage of alkylamine as the ion-pairing agent using reversed-phase chromatography.
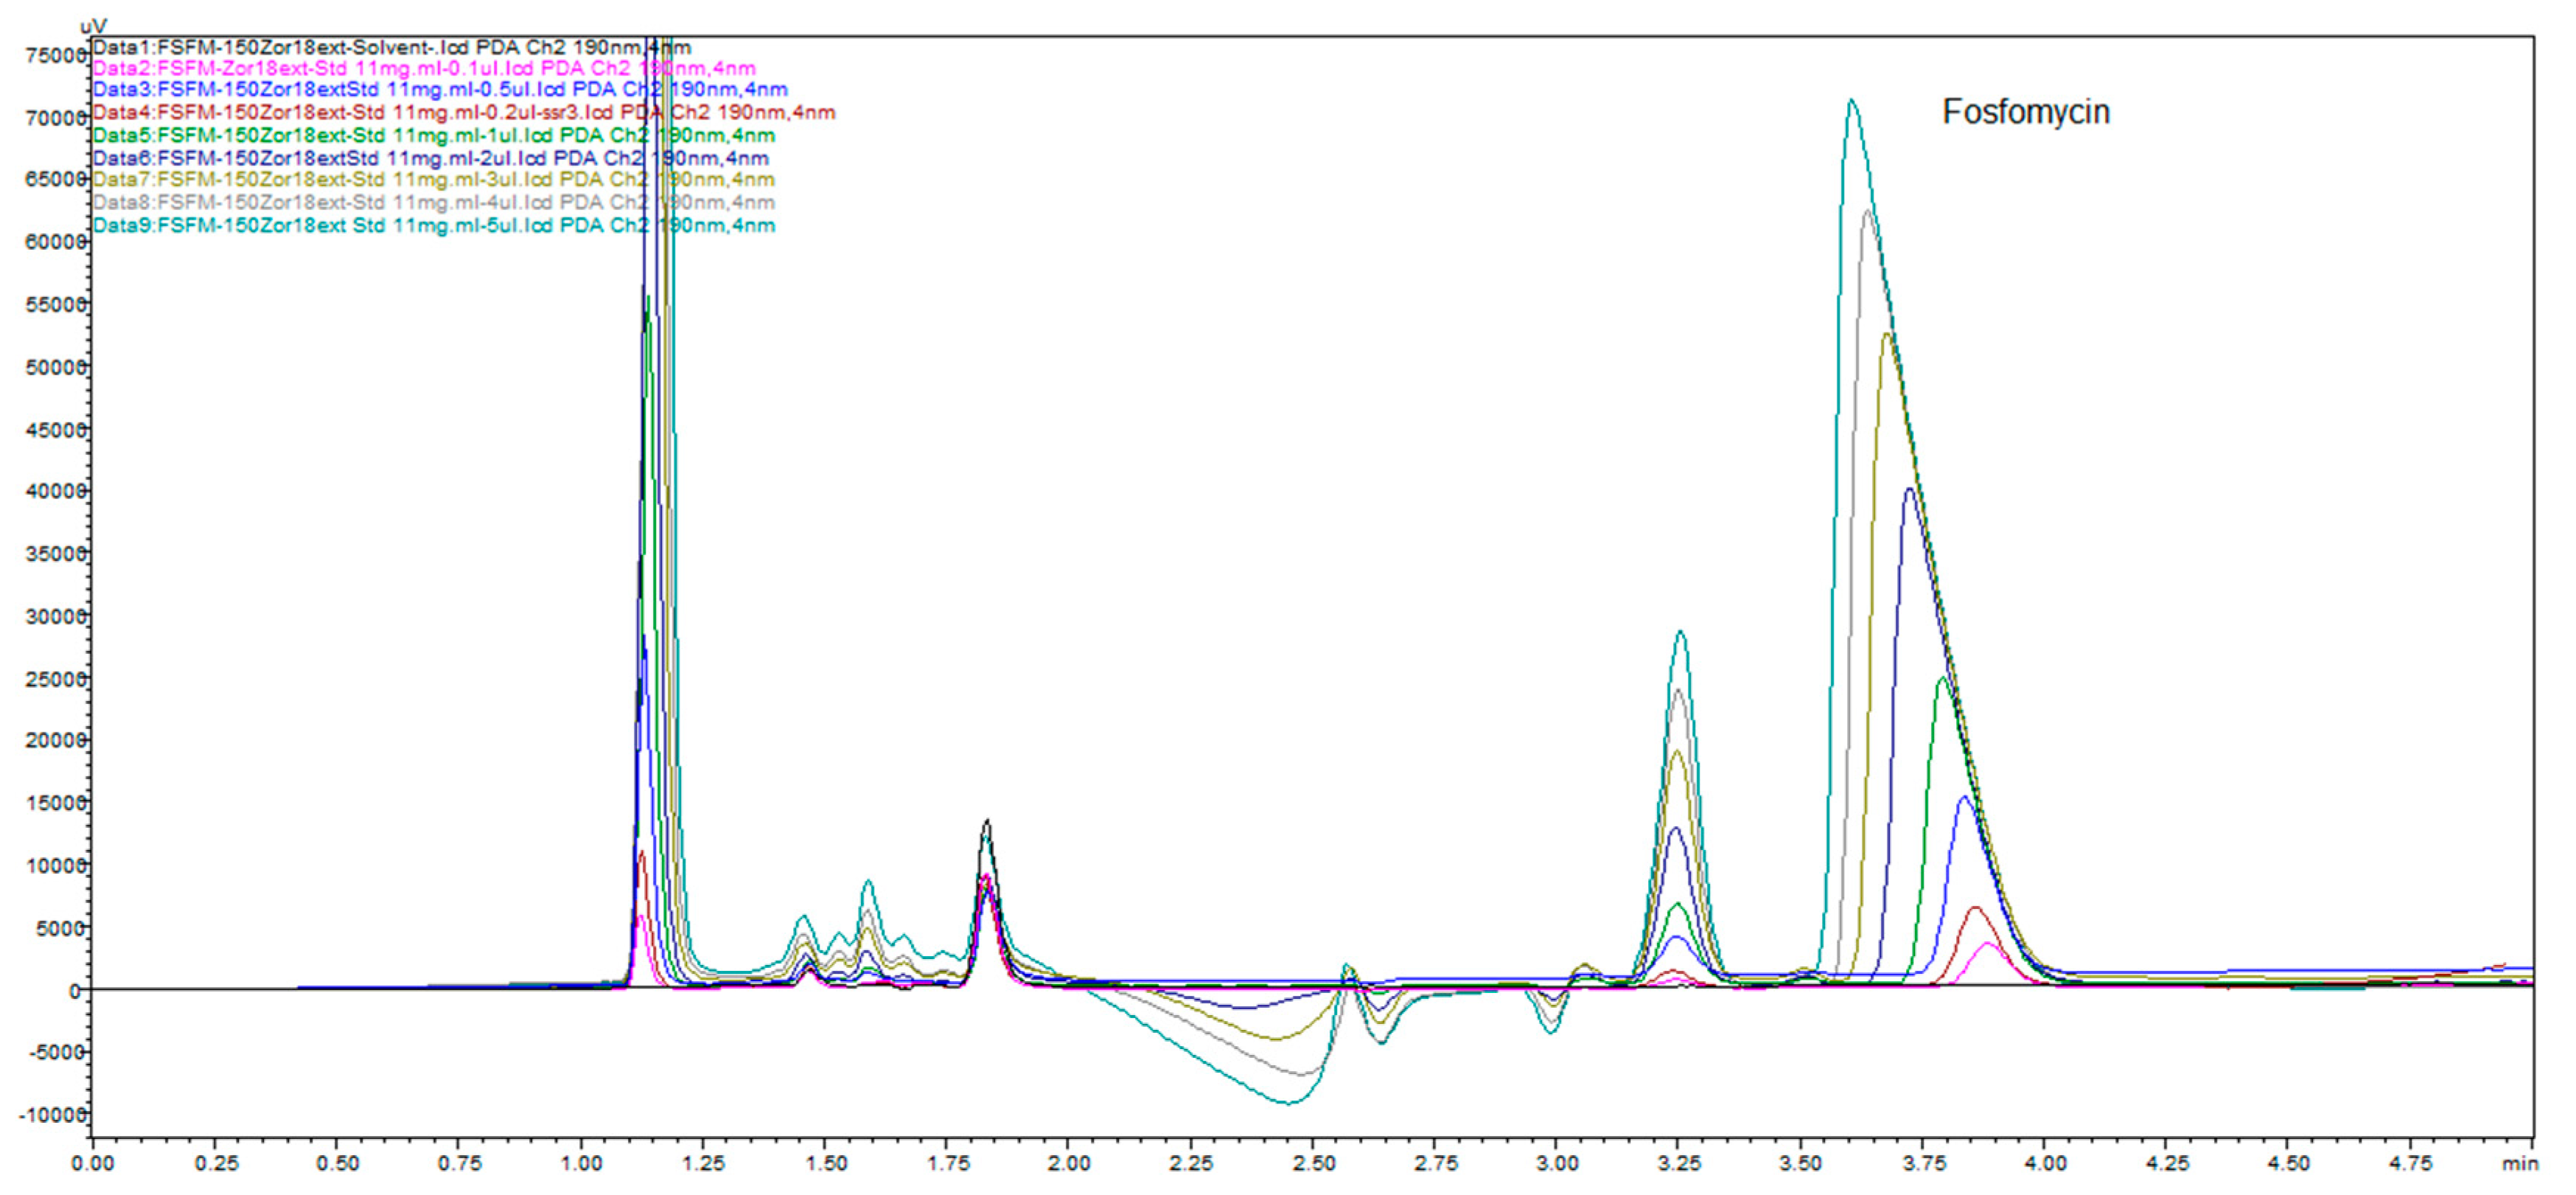
Figure 20 shows good separation and acceptable peak symmetry of all. The most sensitive peak in wavelength change is fosfomycin, as noticeable.
Figure 20 clearly presents depending on fosfomycin peak size and shape depending on the concentration of analyzed samples or dependence of analyte quantity on the column injected. This figure illustrates common phenomena in liquid chromatography by presenting a typical column mass overload situation, which is necessary in cases when an extremely low response factor analytes need to be determinated, and to achieve an adequate range of linearity and sensitivity. The remarkably visible peak spreading in leading mode is classical mass overload phenomenon, clearly explained in all HPLC handbooks and theory. The power and applicability of the method, with the use of Zorbax C
18 extended to 150 mm × 4.6 mm, 5 μm column with a mobile phase of 0.3%
v/
v 2-aminoheptane pH adjusted to 5.8 and mixed with 7% acetonitrile, showed very interesting results. We prepared samples in solvents as described in pharmacopoeias (BP, USP, EP) with a dissolution of 600 mg of fosfomycin trometamol in 5 mL mobile phase 10.6 g/L NaH
2PO4 (80 mM) for analysis with pharmacopoeial methods, standard fosfomycin trometamol, active pharmaceutical ingredient and standard subjected to forced degradation at 60 °C overnight. These prepared samples were 11x diluted with our mobile phase as described above with 2-aminoheptane and obtained the results presented in
Figure 21. Fosfomycin has a tR = 4.8 min, and seven peaks appeared, and increased after thermal incubation at 60 °C. The peak of 0.3% fosfomycin appears with S/N ratio of more than 6 and can be increased if needed.
In the next phase of our research work, we decided to employ a more powerful separating octadecylsilica column, the YNC C
18 Triart 150 mm × 4.6 mm, 3 μm, with a longer chain alkyl 2-aminoheptane as the ion-pairing agent for fosfomycin (
Figure 22). As could be expected according to theory, this column showed a narrower peak width with a higher number of theoretical plates, stronger retentivity due to the 2-aminoheptane and a higher active surface of 3 μm particles, solid peak symmetry and quantity balancing.
We also concluded that ausing alkylamine with higher molar UV absorptivity decreased the coefficient of the conversion of 190 nm/195 nm peak values for the area and for peak height. In other words, using 2-aminoheptan, or more visibly, dimethyloctylamine, the fosfomycin peak area and height discrepances were reduced, which may be a consequnce of the increase in UV absorptivity of the mobile phase as a whole, resulting in a decrease in sensitivity in distinguishing the two close wavelengths of 190 nm and 195 nm by the relatively high concentrations of the absorbing components (
Figure 23).
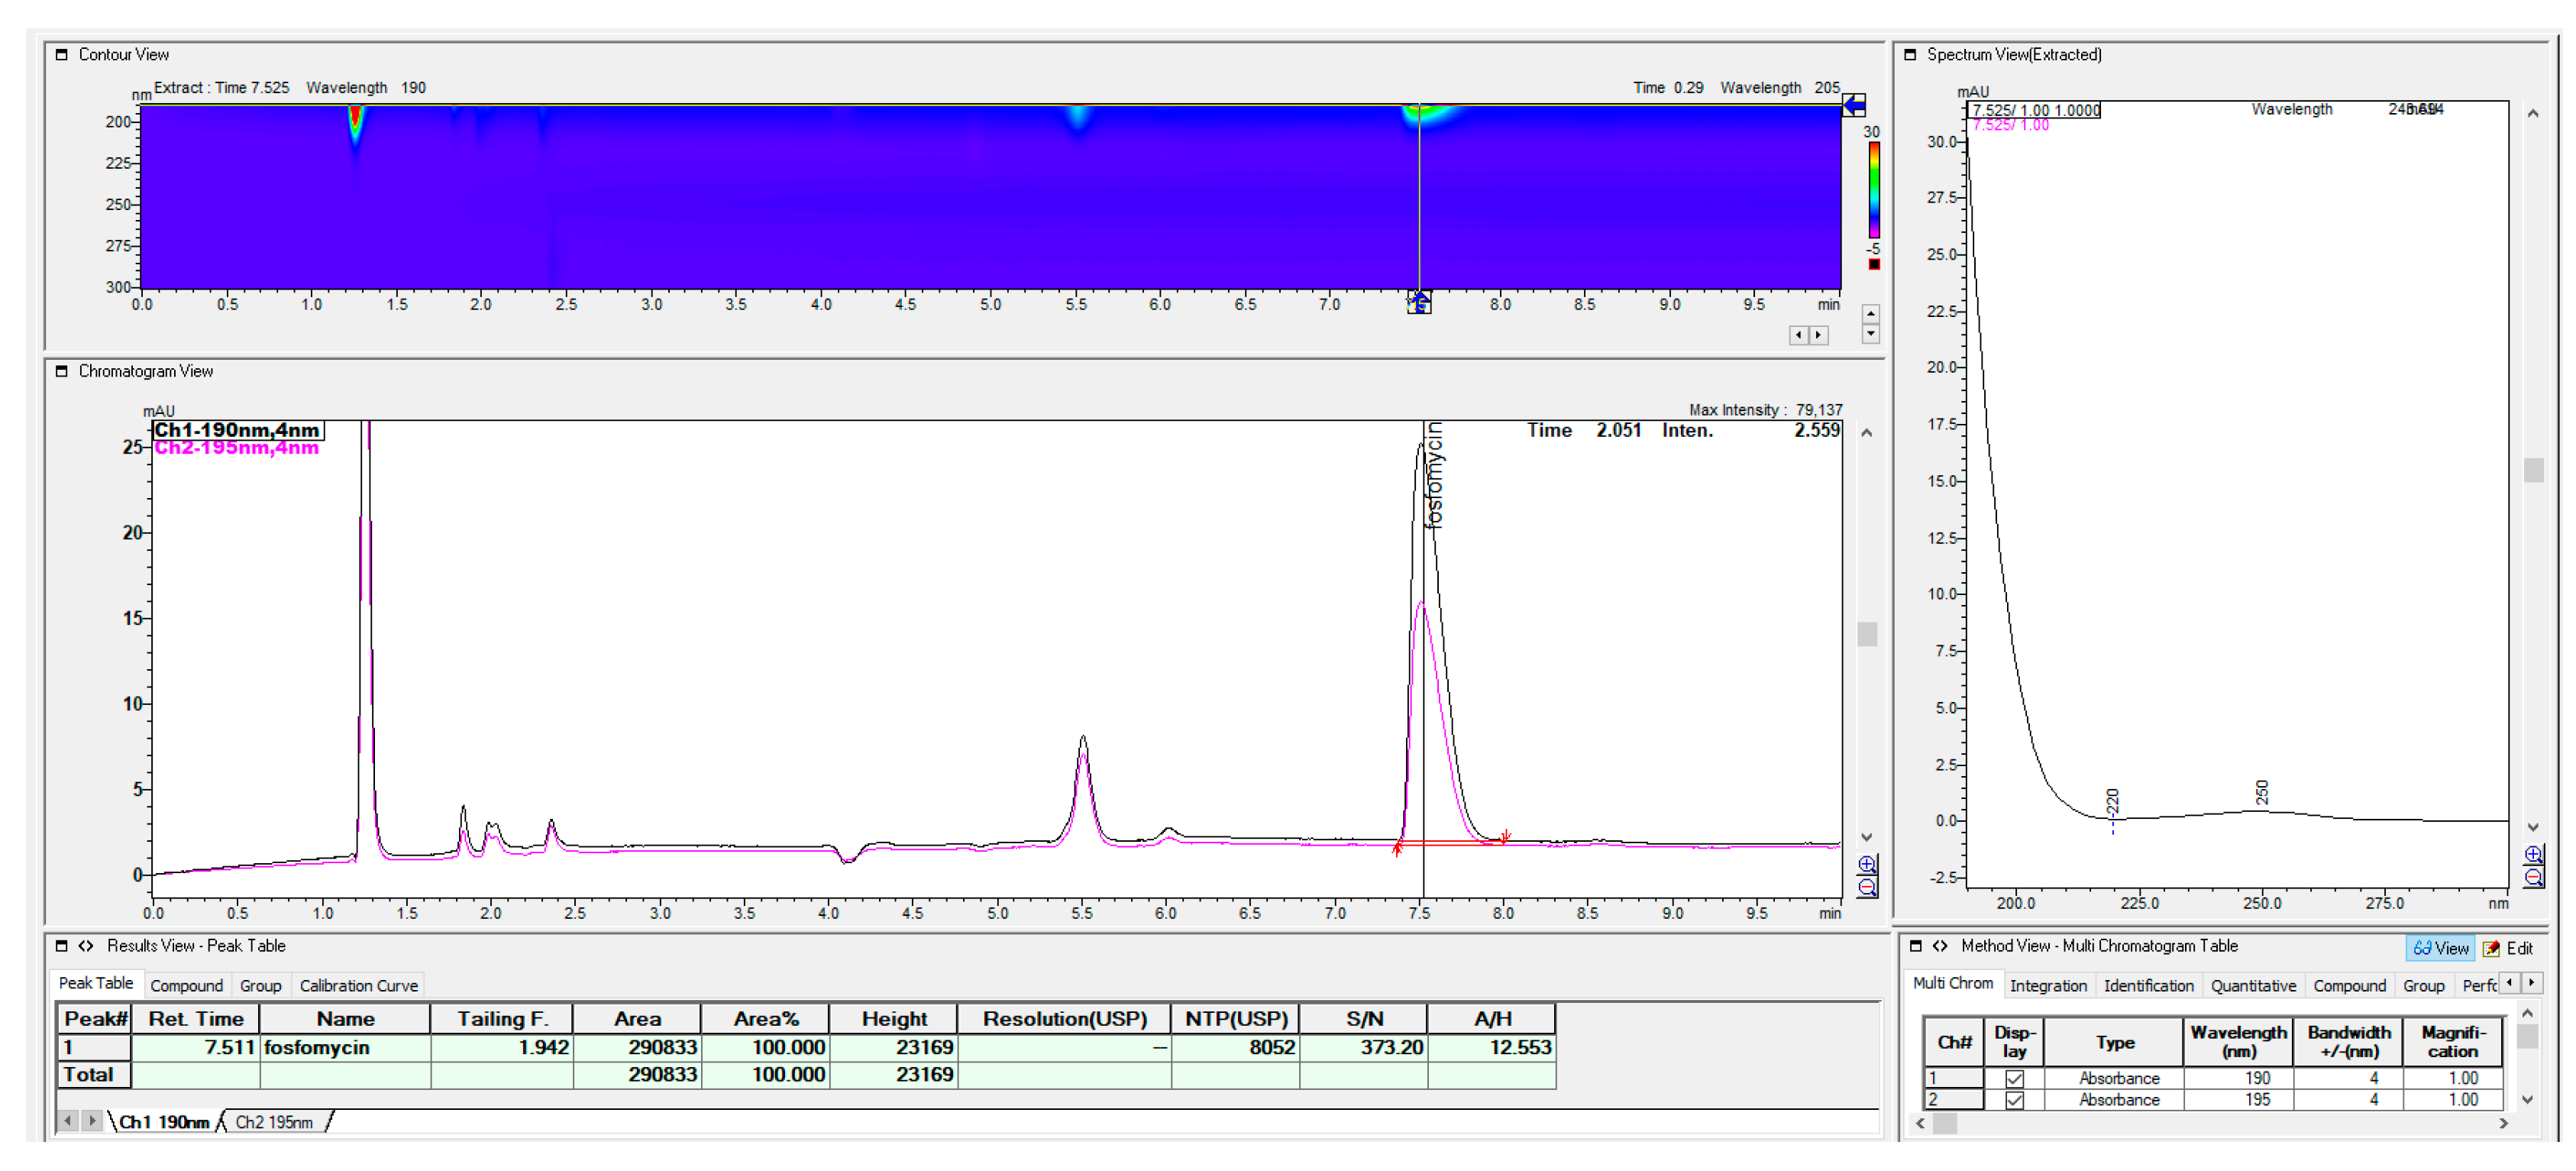
The last chromatographic column, which shows some interesting, applicable features, was the Waters C
18 Xterra MS column with 100 mm × 4.6 mm, 3.5 μm (
Figure 24). This column has a hybrid synthetic silica high octadecyl-bonded reversed-phase chromatographic matrix, highly end-capped and base-deactivated features, but with a relatively low carbon load of 15% compared with the majority of C
18 columns.
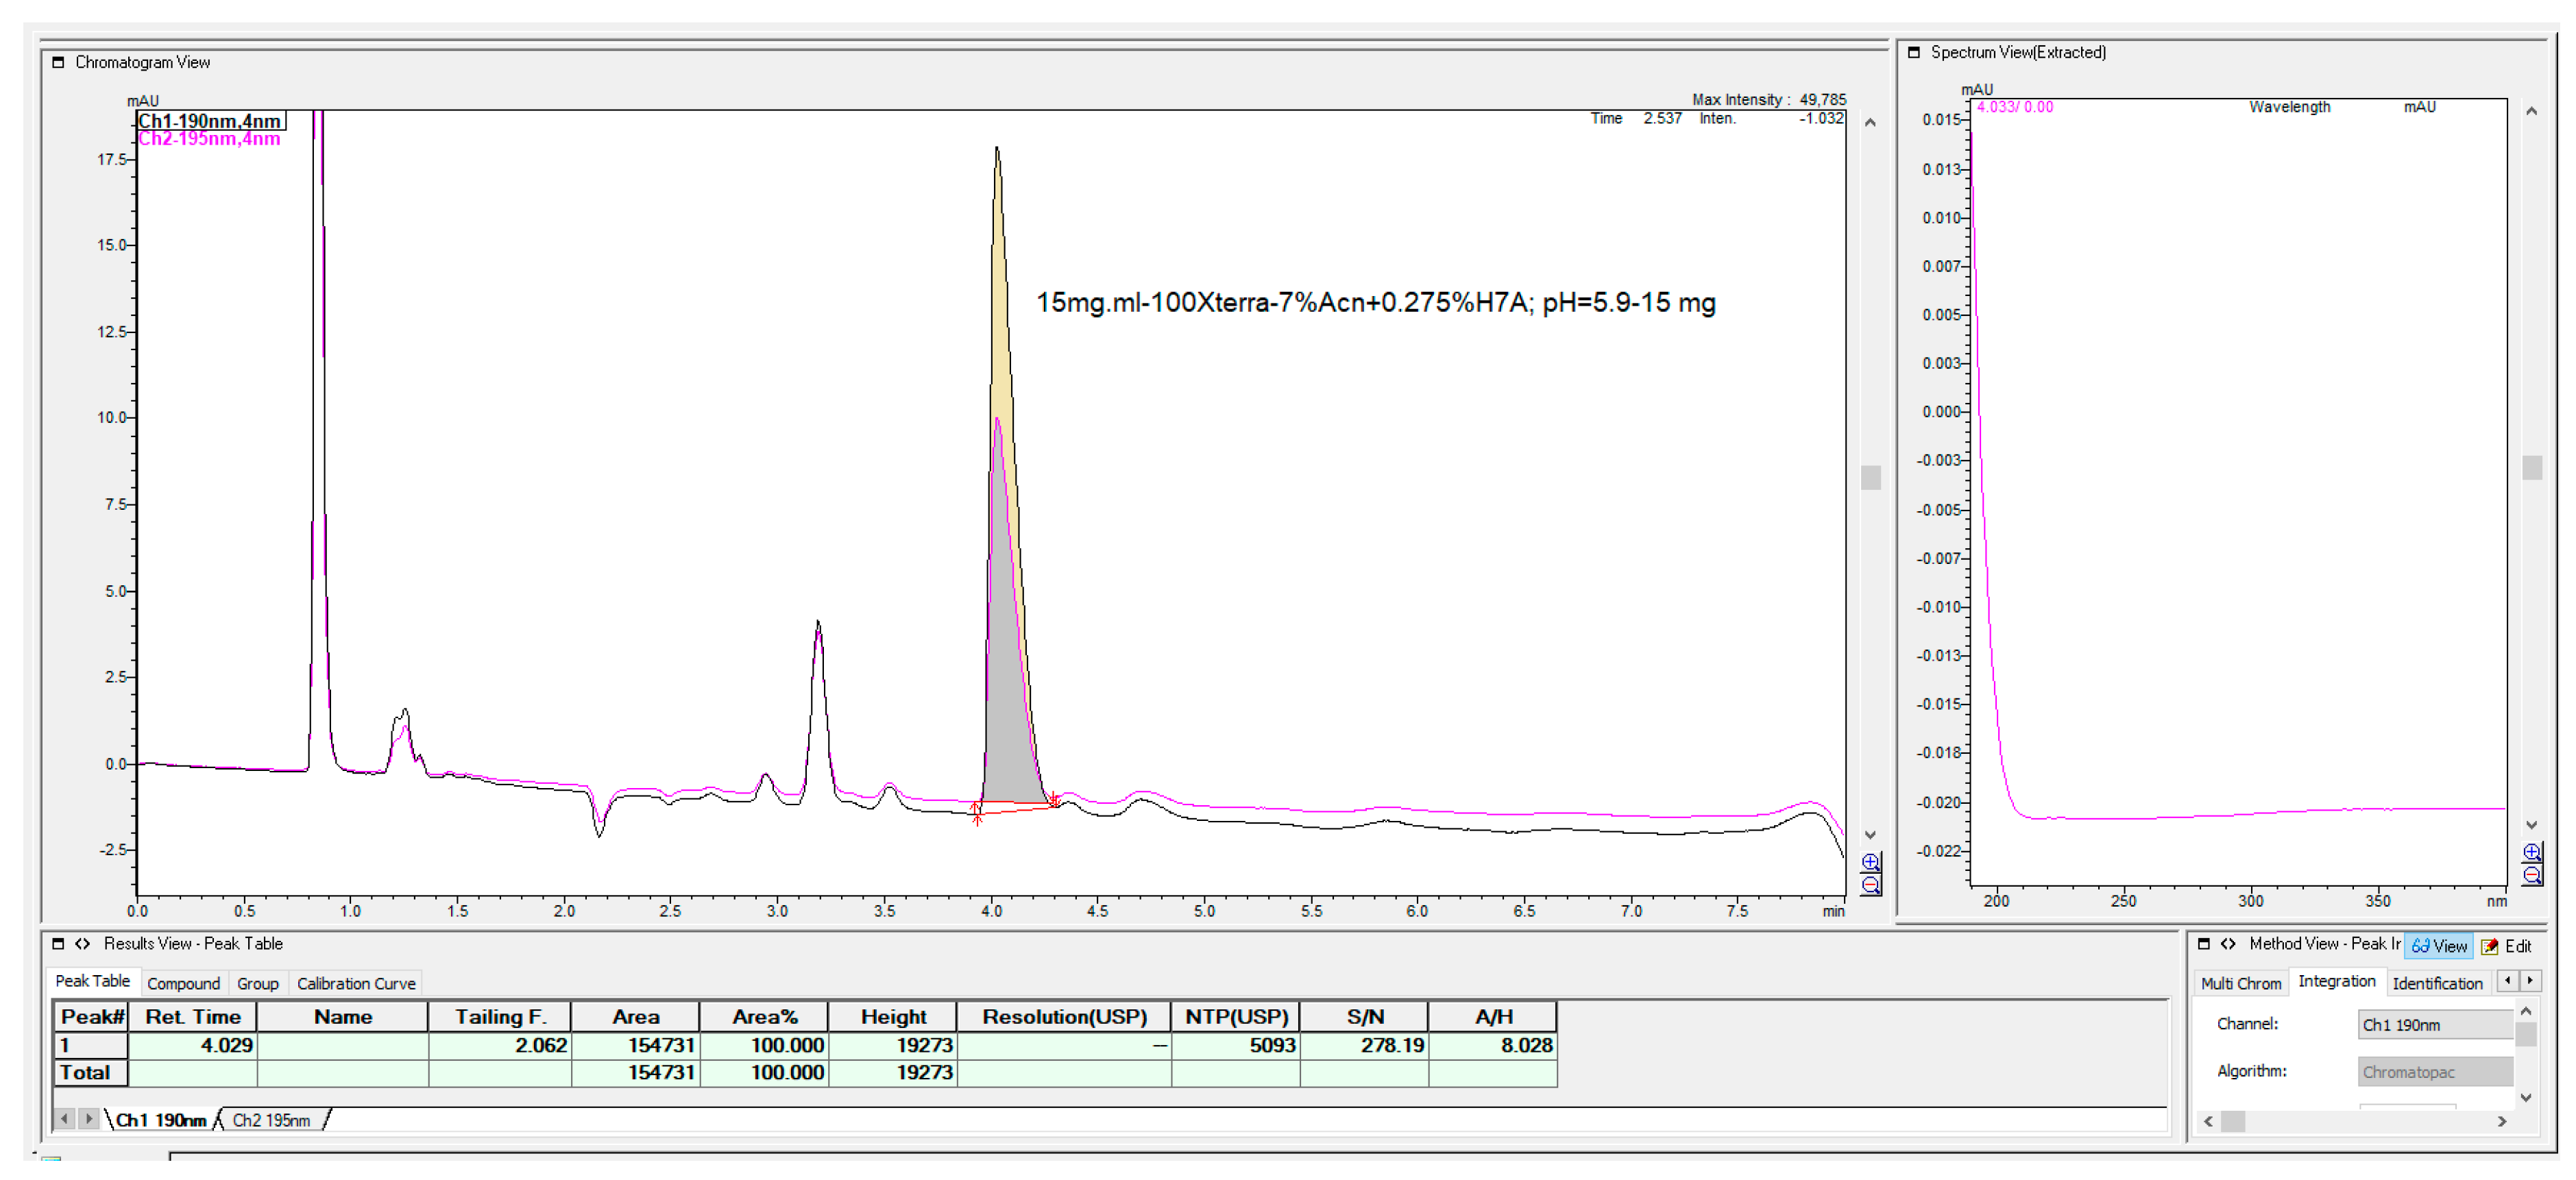
Shorter alkylamines with up to 4C atoms, due to their lower hydrophobicity and weaker interaction of the fosfomycin-amine complex with C
18 ligands of the bonded phase, can be used, but with perhaps longer, more retentive columns with more theoretical plates with significantly lower selectivity, which is reflected with a smaller number of separated peaks (
Figure 25).
4. Discussion
From a standard liquid chromatography and analytical point of view, fosfomycin trometamol is a more complicated analyte to analyze, keeping in mind that besides its molecule, a trometamol moiety group would appear as another peak on the chromatogram, which might generate additional problems. These problems with the official pharmacopoeial monograph methods with the use of NH2-column in combination with low sensitivity differential RID detector, are already mentioned and illustrated in
Figure 1A,B, with their characteristic chromatogram features. Visible peak tailing followed by baseline drifts is known and presents with time-consuming equilibrations, followed by difficulties in peak integrations during baseline drifts. These baseline problems were visible and induced even at 0.1 °C changes in temperature of eluent and detector cells, flow rate changes, or late eluting peaks. In general praxes, in the early conceptualization of UV-absorbance measuring analytical methods for the determination and quantification of an analyte in any matrix, the first step is collecting and analyzing data of the targeted molecule structures; in our case, fosfomycin trometamol and its main physicochemical properties.
Figure 2 explains the practically UV-invisible molecule due to the lack of chromophore group or double C=C bonds and a small, highly acidic epoxy-ring-based molecule with pKa values of pKa1 = −4.3 and pKa2 = 1.25, which makes it almost impossible to suppress dissociations and ionization in a nominal pH range of the RP columns to obtain a neutral molecule, which should be retained in reversed-phase-based column matrixes. If this was successful, the first inappropriate feature was overcome by employing the monitoring visibility in the lowest UV region below 190–200 nm. For this purpose, we developed a concept of the mobile phase constituents that could be used in this region with the lowest possible UV-cut off values, which limited the organic solvent choice to the use of acetonitrile as the first and unique choice of an organic solvent modifier for the reversed-phase separation of fosfomycin trometamol. For the same reasons, the use of salts other than phosphates for buffering, such as formiates, acetates and citrates, would be fully impractical because of their higher UV absorptivity. These expand the same for acids as modifier’s, no use of acetic, formic, citric, trifluoroacetic acid was used for the mobile phase composition.
Concerning the retentivity of fosfomycin trometamol on the reversed-phase column, we found very a very small amount of obscure information. Our first look at the literature involved the work of Li et al. [
18], who used cyanopropyl CN-column in the gradient mode of the elution with a methanol and acetate buffer and MS detection. This mobile phase was useless to our work because of its UV absorptivity below the 200 nm region. We performed tests with three cyano-propyl columns in reversed-phase modes, with the mobile phase composed of a phosphate buffer and tested in the range 10–100 mM. The three different CN columns from three different vendors were the LiChrosphere CN 250 mm × 4 mm, 5 μm, Zorbax SB-CN 250 mm × 4.6 mm, 5 μm and Waters SCN 250 mm × 4.6 mm, 5 μm.
As we considered, the highest retentivity was achieved by the LiChrosphere CN with highest carbon load of 6.6% even with lowest efficiency in NTP. More reproducibility and peaks with more theoretical plates were achieved with the Zorbax SB-CN column even with a lower carbon load of 4% but with more resistive pH range of 1–6. The most retentive appeared to be the Waters Spherisorb SCN, but with its highest values for peak tailing even with the lowest content of a 2.6% of carbon load of a CN-based chromatographic matrix. This column appeared to have the strongest additional interaction forces between the analyte and stationary phase ligands by enabling a broader spectrum of separation forces besides hydrophobic interactions with charge dispersive forces among the polarity differences.
As can be concluded from
Figure 5, a higher concentration of buffer salt was not essential for better separation, but increased the retention time due to the enhanced hydrophobic interaction between the molecules of fosfomycin and the cyanopropyl’s alkyl-bonded phase and acetonitrile percentage. In addition, reducing the quantity of acetonitrile in the mobile phase for preventing the bonded phase collapse was almost insignificant. A different view of the chromatogram was achieved with the highest-carbon load LiChrosphere CN column, yielding almost the same retention with a 33% lower column volume. This fact states the highest retention of fosfomycin was expressed in the relative retention toward the column’s dead volume or dead time.
Further in our work, we tested the properties and usefulness of third-mentioned vendor of cyano-column, the Waters Spherisorb SCN column, and compared them with the Agilents Zorbax SB-CN and Lichrospher CN column. This Spherisorb SCN column showed different features with a very different elution profile of the fosfomycin sample and a somewhat better resolution of the other peaks on the chromatogram in terms of the other components’ peak symmetry, which suggested a stronger secondary polar interaction of the analyte and stationary phase. The chromatogram presented in
Figure 8 was obtained with use of the third-mentioned cyano-propyl-based Waters Spherisorb SCN 250 mm × 4.6 mm, 5 μm column, and its profile is different from the previous Zorbax SB-CN and LiChropher CN columns, showing a stronger interaction with the major fosfomycin-escorting components with longer retention, even with the lower carbon content of matrix-filling and their improved selection and resolution but at the price of increased peak asymmetry, or tailing.
All cyanopropyl-column-based chromatograms confirmed their simple applicability in fosfomycin quantification. For the use for separation and determination of fosfomycin in pharmaceutical dosage forms, in combination with any UV-absorption measuring detector, the columns can be a quick, simple, comfortable and appropriate alternative to official amino columns with a differential RID refractive index detector.
To increase the retention and selectivity of fosfomycin, we proceeded further by employing another other liquid chromatography technique guided by an ion-exchange-based mechanism. The ionized state of the fosfomycin molecules in solvents is almost permanently in anionic form in the majority of recommended pH ranges in liquid chromatographic analyses. This suggests an anion-exchange chromatography should be the primary choice for HPLC method development in analyte determination. After completing the development approach with a cyanopropyl-bonded phase column, our research then focused on an anion exchange mechanism=based chromatography as a possible method for routine analysis, inspired by method of Liu et al. [
17]. He used 250 mm × 4.6 mm, 5 μm particle Zorbax SAX columns with 50 mM phosphate buffer and acetonitrile at 92.4:7.6 ratio in the mobile phase. He obtained a retention of fosfomycin of about 10 min in a wastewater pollution prepared sample with analyte in very high concentration range of 240–1440 mg/L with UV-abs detection at 200 nm.
In our collection of columns, the poorest performance involved the Partisil SAX 250 mm × 4.6 mm with 10 μm particles column. The chromatogram in
Figure 9 is very interesting and retentive, but the use of an ion-exchange chromatographic column is quite time-consuming and more complex in terms of peak fine-tuning resolutions governed by the pKa`s of the analyte, selective of buffer salt choice, concentration, pH, injection quantity of analyte, temperature, organics presence and flow rate. It is clearly estimated that an ion-exchange column cannot approach the separation power in the Number of Theoretical Plates (NTP) and confidence in the reversed-phase-based column matrixes.
However, even these featured SAX methods should not be neglected and rejected for further research and development but should achieve a more efficient anion exchange column with smaller matrix particles. This chromatogram was “scouting”-based when we were checking the sensitivity of retention of fosfomycin to percentage of acetonitrile, and that the baseline fluctuations were the result of an online mixing of components in the mobile phase with extremely low mixing chamber and worked on an older type of chromatograph, the Varian ProStar 330 PDA, which is pseudo-double-beam-constructed. The possibility of using a SAX ion-exchange column was tested on two different HPLC/UPLC systems at slightly changed concentrations of buffer in the mobile phase, as well as the concentration and quantity on column injection of analytes.
All these facts are noticeable in
Figure 10 and
Figure 11, with visible low peak efficiency, but well-separated peaks. As can be seen from the work of Liu et al. [
17], the content of organic solvents needs to be strictly and precisely controlled in ion-exchange chromatography. They state the mobile phase relationships cited with percentile decimals for composition of eluent should be 7.6% acetonitrile and 93.4% buffer to maintain stable retentions and resolutions on the chromatogram. These are essential for precision and reproducibility.
For the next phase of experiments, we investigated of possibility of HPLC to develop a simple, sensitive and accurate determination of fosfomycin in pharmaceutical dosage forms. We used classical ion-pairing reagents to create a summary neutral molecule, in our case with tetra-alkyl ammonium salts, tetramethylammonium hydroxide and tetrabutylammonium hydrogen sulfate, in different pH of the mobile phase buffers (3–7.5). These experiments did not yield satisfying retention times, peak shapes and mobile phase baselines flatness disturbances, even when changes in the concentrations of ion pairs were used and calculated with the concentration of theanalyte.
Thereafter, we proceeded to the final component: to test alkylamines with 3–9 C-atoms, primary, secondary and tertiary amines, and linear and branched chains. Interesting results were achieved with dibutylamine with less separated peaks compared with longer alkyl chain amines. The most promising results appeared to be two of them, with the use with hexylamine and 2-aminoheptan.
The most attractive, imperative, popular and challenging factor of our investigation was the possibility of the application of reversed-phase columns with UV detection, which is the most reliable and powerful liquid chromatography technique. We focused our attention on the research of Liu et al. [
17], who developed the RP-HPLC method for the determination of fosfomycin trometamol and its related compound with Phenomenex Luna C18 column 250 mm × 4.6 mm, 5 μm, but used a very specific ELSD evaporative light-scattering detector, achieving good retentions, separation and selectivity, especially in terms of the sensitivity of the method. The retention of fosfomycin was enabled with ion-pairing with long alkyl-chained octylamine in a concentration of 15 mM, which is very obscure, because published data about its water solubility is 0.192 mg/mL and might achieve oversaturating solution even in the presence of 8% acetonitrile, which should assist in increasing of octylamine water solutions solubility. The weak acidic pH of buffers mobile phase of pH = 5.2 in the cited article was adjusted by adding week, acetic acid, thus increasing the ionic strength of the medium, which contains very low soluble C8-alkylamine.
Our first idea was to investigate the possibility of the usage mechanism of ion-pairing with a long aliphatic amine to achieve the adequate retention of fosfomycin and essential modifications of the mobile phase constituents, which would be UV transparent in the lowest range of 190–200 nm. The presence of acetic acid in the mobile phase in this low UV region was practically impossible, because it would have masked and covered the signals of the peaks governed by their high cut-off value of 230 nm.
In summary, this method with HPLC-RP18-ELSD must be changed to an entirely new concept for the composition of the mobile phase. Another obscure moment is the precise definition of octylamine used in publications, which is not a precisely defined type of octylamine, be it aliphatic, branched, nonbranched, which differ in their solubility and UV spectral characteristics. The chromatogram gained with this method is very good and sensitive, but the use of ELSD is not quite routine and is the favorite HPLC detector in nominal QC laboratories, which need fast, simple, rapid high-throughput type of analysis per day. We have checked the usage of many amino-modifier’s differences in their structure, primary, secondary and tertiary N-amines, linear and branched, with different lengths of chains. We tested 10 amines: diethylamine, triethylamine, propylamine, dipropylamine, di-isopropylamine, dibutyl-amine,1- hexylamine, 1-aminoheptane, 2-aminoheptane and the most hydrophobic N′N-dimethyloctylamine.
We were previously informed about their chemical properties and considered their basic features, including solubility in water. The structures and solubility of long alkyl-amines and aliphatic u-branched linear primary octylamine were omitted from our analyses research because of very low water solubility of 0.192 mg/mL (about 2.4 mM/L), which is far from the near-stoichiometric concentrations of the used solutions of fosfomycin 0.10–55 ug/mL in our concept. We also tested the use of low-molecular, low C-atoms amines in chains, propylamine, diethylamine, triethylamine, dipropylamine, diisopropylamine and dibutylamine as well, but did not achieve satisfying chromatograms, and sufficient retention and resolution of peaks in the sample, even with the lowest composition presence of acetonitrile in mobile phase and with the use of the most retentive highest carbon load percentage, and the highest active surface C18 reversed phase columns
At the beginning of our research, we added the highly UV transparent potassium, sodium or ammonium phosphate buffering to maintain better regulation of pH acidity of the medium mobile phase, hoping this addition of salts would increase the ionic strength of buffers in the mobile phase, thus enhancing the interaction of the alkylamine–fosfomycin complex with the stationary phase. This increase in interaction would result in longer retention times for better separation and selectivity. Increasing the retention was especially important in close elution of the analyte complex in the vicinity of the void volume of the chromatogram. Our further conclusion was that the addition of phosphate-buffering salts did not contribute significantly to satisfying increments of retention, and may have influenced the solubility of the high concentrations of the ionizing molecules of the fosfomycin analyte, and considering its competition for alkylamine. Thereafter, in further research, we will omit the addition of phosphate salts as we noticed that satisfying the amines solution’s buffering capacity was adjusted to pH 5.8–6.1 with o-phosphoric acid.
The proper and adequate choice of which alkylamine was used suggested the aim of the method. In our experimental work, better flattening of the baseline was achieved with hexylamine, then 2-aminoheptan, and the worst with dimethylocylamine. All three amines can be used, preferring the shortest chain-structured hexylamine. If different selectivity should be achieved and essential, all these three types of amines, (or even four including dibutylamine), should be tried with different choices and concentrations of amines, pH of the mobile phase, column temperature, flow rate, percentage of acetonitrile. Of separate importance was the testing and selection of the best C18 column. As a general conclusion about, the suggested type of C18 column involves the powerful and longer column of 250–150 mm in length, with the highest carbon load content, highest active surfaces, base deactivated and end-capped column for proper retention, separation and the most symmetrical peak of fosfomycin. A bigger column with a more balanced matrix yielded high concentrations of fosfomycin.
As can be seen from
Figure 24, this column enabled the rapid determination of fosfomycin, which was well-retained and separated from all other peaks, with the possibility of fine-tuning the elution time.
It should be pointed out that fosfomycin is an analyte that, with these RP concepts of the mobile phase and ion paired with alkylamines, does not obey the rule of the 10% volumetric change of content in the mobile phase, which changes the retention of the analyte of capacity factor k` for value 2–3. The peak of fosfomycin is more sensitive, even to the smaller changes in the organic percentage (2–5%) in the mobile phase when paired with alkylamines. It was estimated that the change of 7-C atoms 2-aminoheptan with 6 C-atoms hexylamine could not enable the satisfying appropriate retention of fosfomycin in the presence at 0.28% v/v, even in lowering the organic acetonitrile content up to 1.5% when the short 100 mm × 4.6 mm 3 μm C18 Waters C18 MS Xterra column was used. Reducing the organic acetonitrile to less than 1%, when working with C18 columns is very impractical because of the bonded phase collapse in almost pure hydrophilic water solutions. The reversible collapse of C18 bonded ligands on a silica stationary phase of an almost fully hydrated eluent is very unpleasant and thus loses the retentivity and reproducibility of the method. For a mobile phase with 100% of a water solution, special reversed-phase column matrixes are manufactured and labelled as an aqua or polar-embedded column.
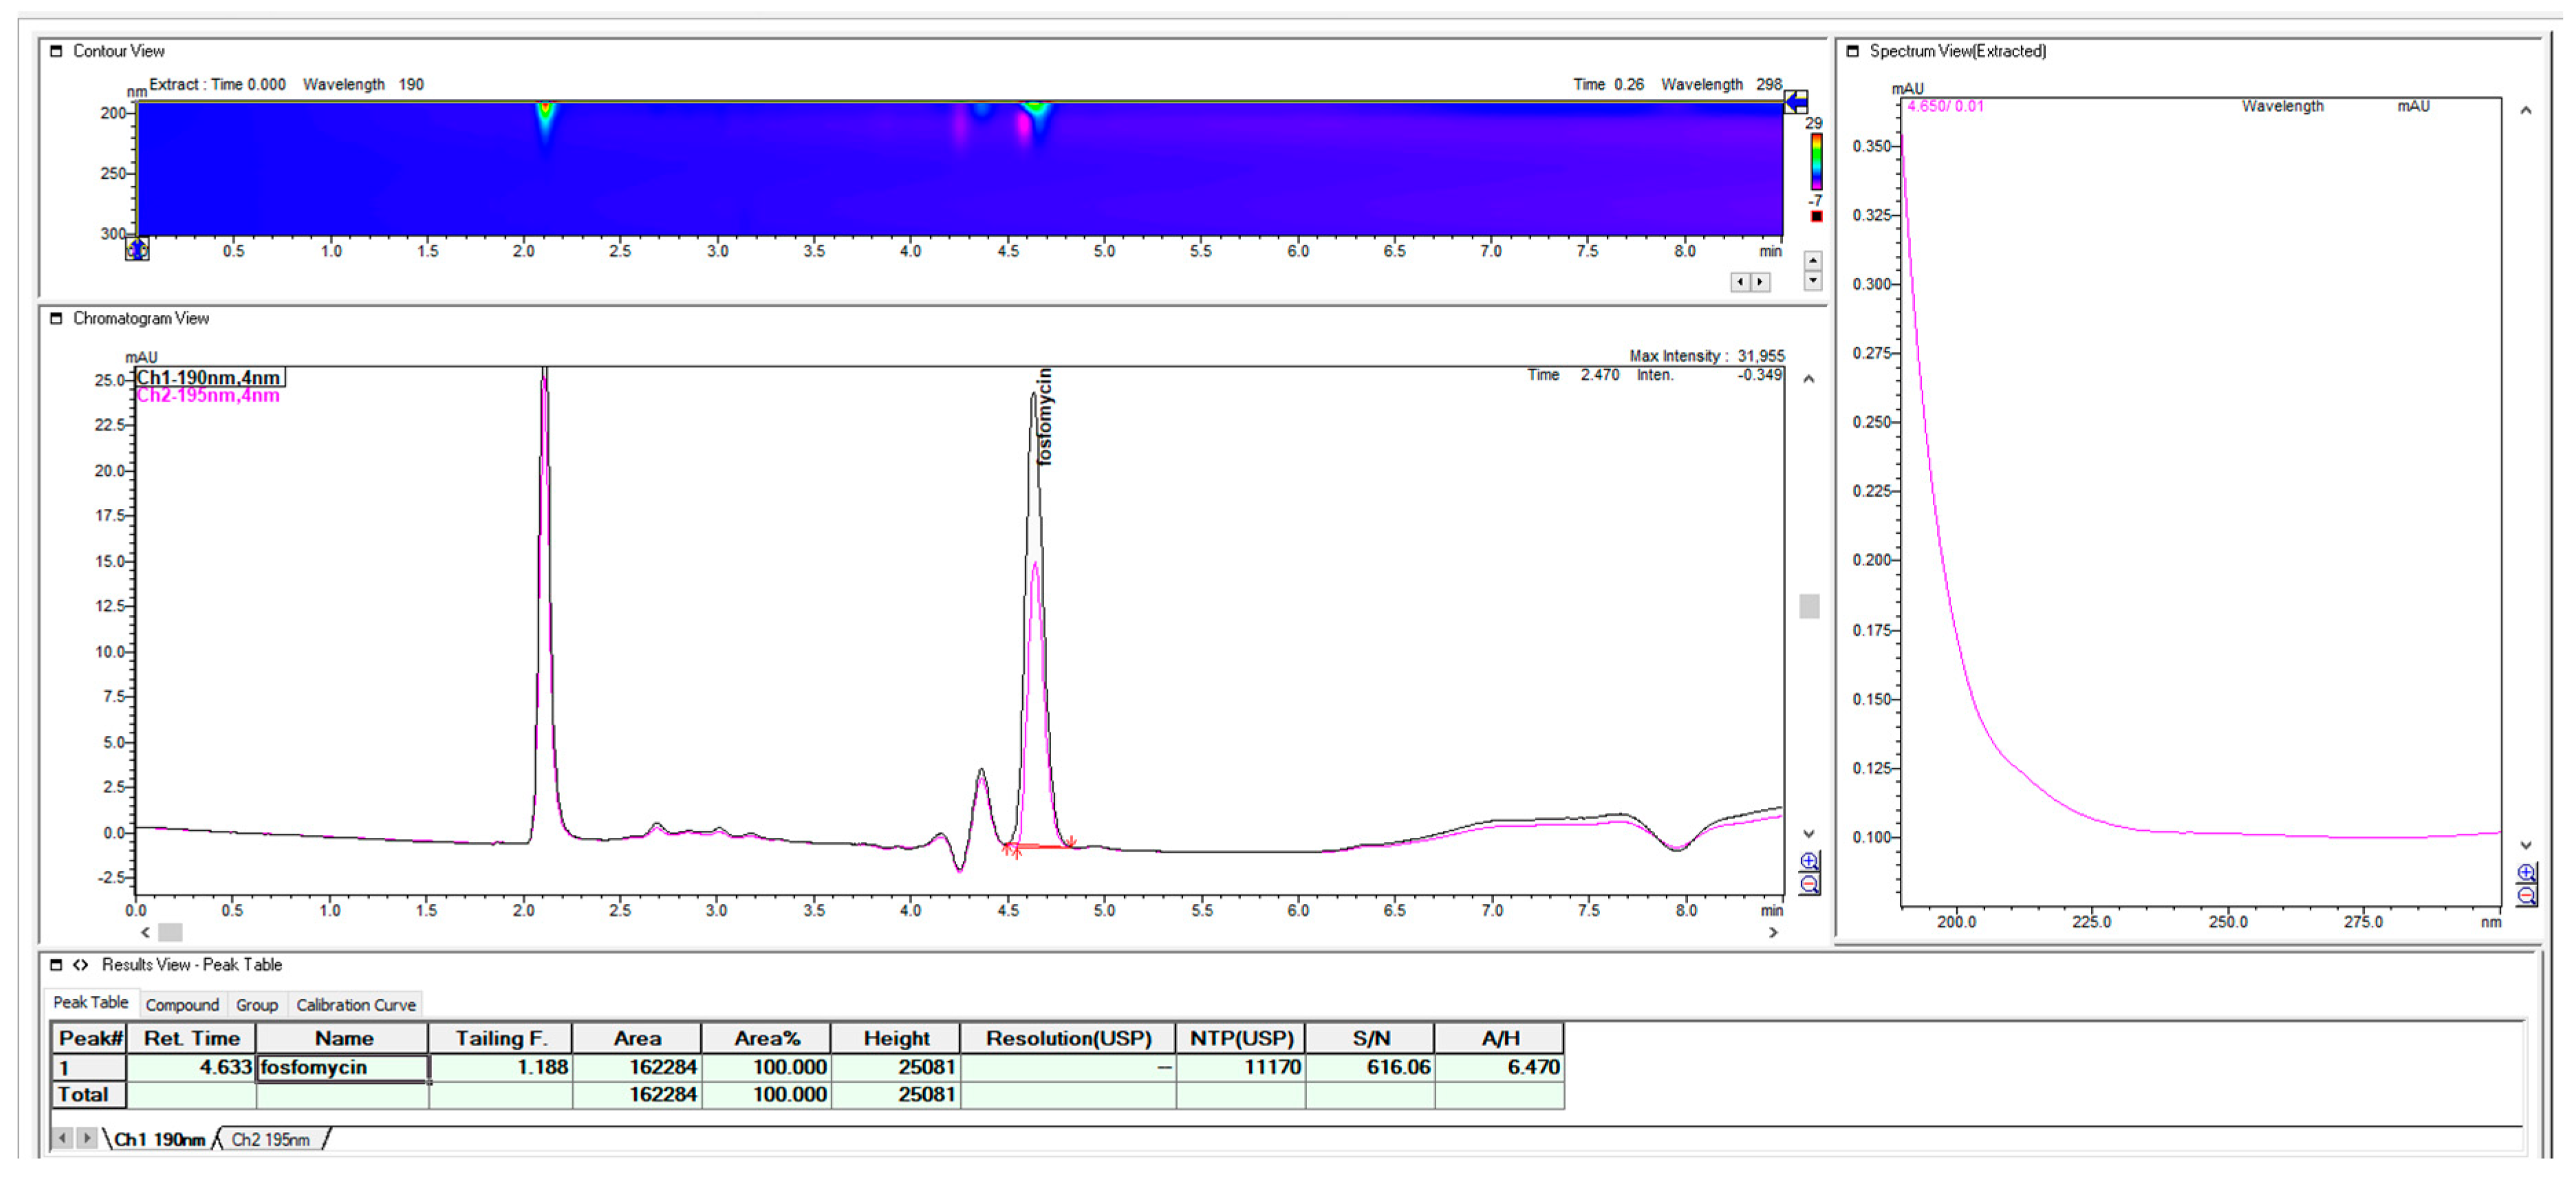
Since the use of the shorter alkyl-chain hexylamin showed close unsatisfying retention in terms of the void volume on the short C18 Xterra MS 100 mm × 4.6 mm 3 μm column, even in the presence of 1.5% acetonitrile, the replacement of the amine ion-pair with heptyl-amine generated appropriate retentions and selectivity for the fosfomycin peak in the same 100 mm column, as one solution. As a second solution for close elution to void volume, we used this first choice of hexylamine with a long Waters C18 MS Xterra 250 mm × 4.6 mm 5 μm particle column with a larger chromatographic matrix to better balance the mass transfer and distribution of the analyte between the mobile and stationary phases. Using a 250 mm × 4.6 mm column with hexylamine enables the appropriate satisfying retention of fosfomycin of about tR = 4.63 with an adequate resolution and method run time, so the 2-aminoheptane option as more hydrophobic pairing amine was not tested. If we compared it with the 100 mm column, the use of hexylamine was pointless because of its unsatisfactory retention and resolution. A much better suggestion was to use 2- aminoheptane, as can be seen in
Figure 25.
As a final research conclusion, the goal was for the appearance of a symmetrical fosfomycin peak shape, which was achieved when the working target concentration was reduced to 12–15 mg/mL and the injected quantity on the column was 12–15 μg or less. Thus, columns can easily achieve a LOQ of 0.06 mg/mL at 195 nm, a LOD 0.013 mg/mL, and was validated in the range of 1.5–55 mg/mL of fosfomycin trometamol.
Shorter amines with 3–5 C atoms have faster equilibration and better UV absorption transparency and might be preferred for rapid content determination of fosfomycin, but with longer or more efficient chromatographic columns.
The general comparison of the Polar and RP column separations is shown in
Supplementary Figures S1 and S2 as brief direct views. The method response linearity calculated with four different columns and mobile phase, Zorbax SB-Cn 250 mm × 4.6 5 μm, Discovery C18 150 mm × 4.6 mm 5 μm, Zorbax C18-xdb 150 mm × 4.6 5 μm, and YMC C-18 Triart 150 mm × 4. mm 3 μm, in concentration ranges of 1.5–55 mg/mL fosfomycin trometamol, with statistical calculations for each calibration curve at two different wavelengths (
Supplementary Figures S3–S6).


 ,
, 


