Article

Extraction of Natural Pigments from Gardenia Jasminoides J.Ellis Fruit Pulp Using CO2-Expanded Liquids and Direct Sonication

1
Department of Chemical Engineering, Faculty of Engineering, Fukuoka University, 8-19-1 Nanakuma Jonan-ku, Fukuoka 814-0180, Japan
2
Research Institute of Composite Materials, Fukuoka University, 8-19-1, Nanakuma Jonan-ku, Fukuoka 814-0180, Japan
*
Author to whom correspondence should be addressed.
Submission received: 4 December 2020 / Revised: 21 December 2020 / Accepted: 21 December 2020 / Published: 24 December 2020

Abstract

:
In this work, a carbon dioxide-expanded liquid (CXL) extraction system was used with or without direct sonication for the extraction of highly polar natural pigments (crocin-1 and crocin-2) from Gardenia jasminoides Ellis fruit pulp. The effects of different parameters, including modifiers (ethanol, water, aqueous ethanol), temperature (5–25 °C), pressure (8–14 MPa), and sonication time (0–200 s) on extraction concentrations were examined using the CXL system. Aqueous ethanol (50% or 80%, v/v) was selected for the CXL system as a modifier due to its efficiency. The best conditions for extraction were found at 25 °C and 10 MPa. The CXE 80% extraction system with direct sonication extracted a significantly higher amount of crocin-1 and crocin-2, 13.63 ± 0.5 and 0.51 ± 0.05 μg/mL, respectively, compared to conventional solid–liquid methanol extraction (10.43 ± 0.3 and 0.37 ± 0.02 μg/mL, respectively). Under these conditions, a water-rich phase, an ethanol-rich phase, and a CO2-rich gas phase coexisted in the high-pressure cell in the CXE 80% extraction system, which was vigorously disrupted by the addition of sonication, resulting in a compressed aqueous ethanol phase and an aqueous ethanol-modified CO2-rich phase, and may have a positive influence on extraction.

1. Introduction

Natural pigments extracted from natural resources (plants, minerals, insects, microorganisms such as algae, cyanobacteria, fungi, etc.) are less toxic, less polluting, and noncarcinogenic and tend to have potential positive health effects [1,2,3,4]. Natural pigments are therefore now a market demand for use in foods and cosmetics over synthesized natural-identical pigments due to the rising awareness of harmful and undesirable risks related to chemically modified synthetic pigments.
Crocins are among the plant-based, water-soluble, natural yellow pigments, derived from C–20 mono or di-glycosyl esters of crocetin (crocin-2 and crocin-1, respectively). Crocins, mostly present in the stigmas of saffron (Crocus sativus L) and the fruits of gardenia (Gardenia jasminoides J.Ellis), are responsible for their color [5]. At present, the global extraction of crocins is mostly dependent on saffron, which is the most expensive spice, and the production is labor-intensive and time-consuming. Alternatively, gardenia, an evergreen shrub belonging to the family Rubiaceae, commonly grows wild or horticulturally and is native to many Asian countries such as Vietnam, southern China, Korea, Japan, Myanmar, India, and Bangladesh. Therefore, it is more attractive economically for the extraction of crocin. Crocins from gardenia fruits have long been used as natural yellow dyes in food coloring, especially in Japan and China, receiving government approval in both countries for use as a food additive [6,7]. Due to their powerful antioxidant ability and capacity to absorb free radicals [8], crocins are also widely used in the treatment of inflammatory [9,10] and cardiovascular [11] diseases, suppression of growth of cancer cells [12], diabetes treatment [13], and in the prevention of Alzheimer’s disease [14]. However, with so much potential, very little research has been conducted to find an effective extraction method.
The common methods of extracting crocin from gardenia fruits are heat extraction [15] and solid–liquid extraction (SLE) [8]. In the heat extraction method, diffusivity increases with increasing temperature, giving faster mass transfer; however, decomposition at higher extraction temperatures limits its application for thermally unstable compounds. On the other hand, SLE can be performed at room temperature using organic solvents such as methanol, diethyl ether, or acetone; however, the diffusion rate is slow, and it takes a long time for completion. Solutions have been reported to speed up the diffusion rate by using a homogenator [15] or ultrasound-assisted extraction [16]; however, the amount of organic solvent used in these extraction processes is quite significant, and proper safety protocols should be followed because of their negative effects on the quality of the extracted compounds as well as on human health and the environment. Therefore, it is necessary to develop an environmentally friendly extraction technology using generally recognized as safe (GRAS) substances.
Carbon dioxide (CO2), an alternative to organic solvents, is unique because its solvency power can be changed by changing its physical condition to liquid or supercritical simply by adjusting the temperature and pressure during extraction. Supercritical carbon dioxide (ScCO2) typically replaces nonpolar solvents such as hexane or toluene in terms of solubility, but has a gas-like viscosity, liquid-like density, and around a hundred times faster diffusivity than organic solvents, reducing the amount of solvent used. However, it operates at a much higher temperature and is not suitable for thermally unstable compounds such as crocins (which degrade at 60 °C and above) [17,18]. Instead, liquid CO2 can be an interesting substitute for ScCO2 and operates similarly to ScCO2 extraction, except its diffusivity is greater [19] and, operating at lower temperature, it can maintain most thermally unstable compounds in plant materials. Furthermore, the affinity of nonpolar liquid CO2 can be diverted to polar components such as crocins by adding a small amount of entrainer (co-solvent or modifier), such as water, ethanol, or aqueous ethanol. In this case, instead of adding an entrainer to the CO2 upstream (as co-solvent), compressed liquid CO2 is added to the entrainer (as modifier), which is well known as CO2-expanded liquid (CXL), used for various applications, including extraction, reaction, and separation [19,20,21,22,23]. Unlike ScCO2, a gas phase may exist in the CXL system in addition to the CO2-expanded liquid phase; therefore, density change with pressure is negligible. As a result, excess solvent power sensitivity with the change of operation pressure can be avoided. Additionally, the application of direct sonication to the high-pressure CO2 system has been well documented for the extraction [24] or production of high-yielding liposomes [25]. Direct sonication of the water/CO2 two-phase system caused rapid physical mixing between the water and CO2 phases, including micro-phase separation and cavitation, which may speed up the mass transfer at lower frequencies, typically 20 kHz [24,25].
Therefore, the objective of this work was to develop a green extraction method based on the use of CO2-expanded liquids (CXLs) with or without direct sonication to enhance the concentrations of crocin-1 and crocin-2 from gardenia fruit pulp powder. To do so, the effects of different solvents (ethanol and water, and methanol as a control), the modifier concentration (aqueous ethanol 30, 50, or 80% v/v), and the extraction time (10–120 min) on extraction were examined. Finally, parameters concerning CXL extraction included modifiers (ethanol, water, and aqueous ethanol 50 or 80% v/v), temperature (5–25 °C), and pressure (8–14 MPa) with or without direct sonication and the effect of sonication time (25–200 s) were evaluated. The efficacy of direct sonication was evaluated using scanning electron microscopy (SEM). The influence of each factor was analyzed by a single factor experiment.

2. Materials and Methods

2.1. Materials and Chemicals

Dried gardenia fruits (native to China) were purchased from S & B Foods Co., Ltd., Tokyo, Japan. The skins were peeled off and the fruit pulp was powdered (average particle size, 75.4 μm) with a 6750 Freezer/Mill (SPEX CertiPrep Co. Ltd., Metuchen, NJ, USA). Crocin-1 and crocin-2 (both >98%; ChemFaces Biochemical Co., Ltd., Wuhan, China) were used as references. HPLC-grade methanol (>99.7 wt%) and analytical-grade ethanol (>99.5 wt%) were purchased from Wako Pure Chemical Industries Ltd., Osaka, Japan, and used as received. High-purity CO2 (>99%) was supplied by Fukuoka Sanso Co. Ltd., Fukuoka, Japan.

2.2. Conventional Solid–Liquid Extraction (SLE)

To compare the effects of different solvents on the extraction concentration, conventional SLE was performed using the solvents methanol, ethanol (99.5%), and water as described elsewhere [26]. In brief, gardenia fruit pulp milled powder (10 mg) and solvent (10 mL) were loaded into a screw bottle (30 mL) and sealed. The extraction was carried out by stirring with a magnetic stirrer for 1 h at 25 °C and atmospheric pressure. The extract was filtered using a polytetrafluoroethylene (PTFE) membrane filter (0.45 μm) and analyzed by HPLC-UV for quantitative determination of crocin-1 and crocin-2. The effects of different concentrations of ethanol at 0−100% (v/v) were also evaluated with or without sonication to extract crocins from gardenia fruit pulp powder using the conventional SLE method at 25 °C and atmospheric pressure. In the extraction experiments with sonication, irradiation was performed for 125 s at a constant amplitude of 20% using a titanium ultrasound horn driven by electrical signals from a 20 kHz ultrasound processor (VC-505, Sonic and Materials, Inc., Suffolk, UK) with a maximum power capability of 500 W. Sampling was performed after 1 h and analyzed by HPLC-UV.
To characterize the solvent extraction behavior at different time points of extraction of crocin-1 and crocin-2 from the fruit pulp of gardenia, a time-dependent extraction assay was performed using 80% aqueous ethanol solution (80:20 v/v ethanol:water) as the solvent at 25 °C and atmospheric pressure. Sampling was performed at 10, 20, 30, 60, and 120 min after starting the extraction and analyzed by HPLC-UV.

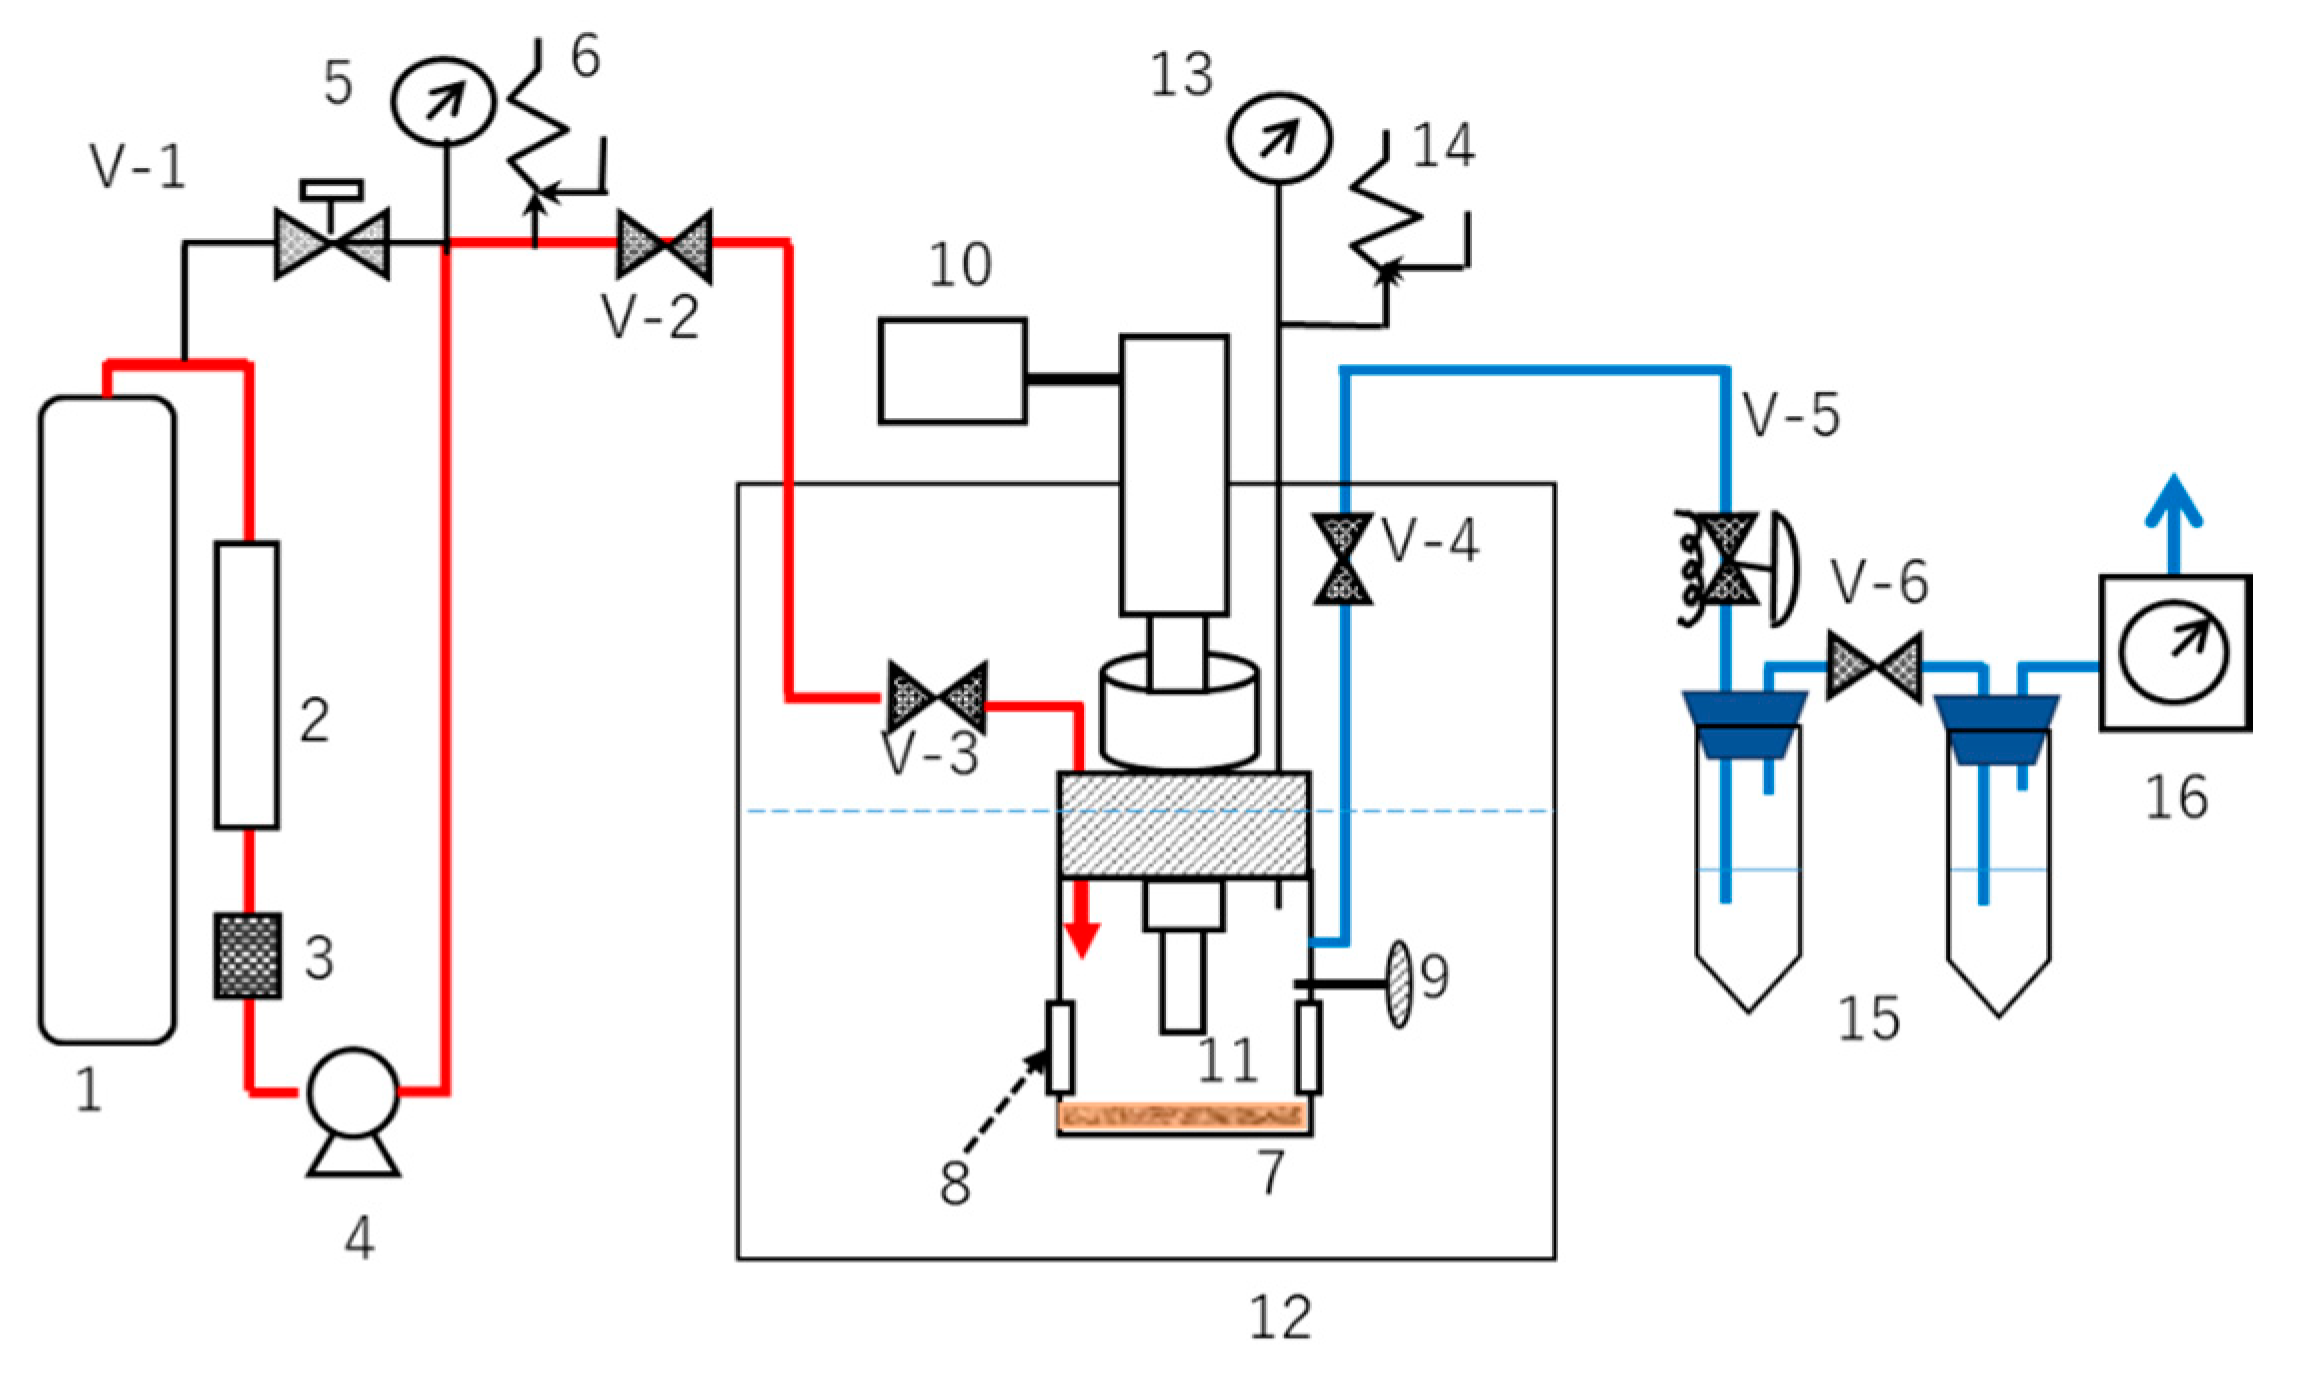
2.3. CO2-Expanded Liquids (CXLs) Extraction with or without Direct Sonication

Liquid CO2 extraction apparatus (Super-200, JASCO Co., Ltd., Tokyo, Japan) described previously was used for the CXL extraction system [24,25]. The equipment setup for system is shown in Figure 1. Gardenia fruit pulp milled powder (10 mg) and 10 mL of the modifier, ethanol or water, or 50 to 80% of aqueous ethanol solution were placed in the high-pressure extractor (150 cc, 34 mm id 165 mm long; Toyo Koatsu Co., Ltd., Hiroshima, Japan) equipped with a titanium ultrasound horn driven by electrical signals from a 20 kHz ultrasound processor (VC-505, Sonic and Materials, Inc., Suffolk, UK) with a maximum power capability of 500 W. The loaded extractor was then immersed in a water bath to maintain the desired extraction temperature (5, 20, and 25 °C) controlled within ±0.1 °C. The temperature of the extraction cell was measured from a thermocouple located inside the cell. Liquid CO2 was pumped into the extraction cell using an HPLC pump equipped with a cooler (SCF-GET, JASCO, Tokyo, Japan) to reach the desired extraction pressure (8, 10, and 14 MPa) at a constant flow rate of 10 mL/min. Under these conditions, the CO2-expanded liquid phase coexists with the gas phase in the high-pressure cell. A cooling unit was used to maintain the CO2 in its liquid state. A backpressure regulator (880-81, JASCO, Tokyo, Japan) was installed at the outlet of the extraction cell to control the desired pressure within ±0.3 MPa. In the extraction experiment with direct sonication, ultrasound irradiation was applied directly to the pressurized extractor for 25 to 200 s at a constant amplitude of 20% (max. 40%) after reaching the desired extraction pressure.
Ultrasonic irradiation during the extraction experiment was performed at a constant amplitude of 12.2 μm (amplitude control was set to 20%). Constant amplitude was supplied by the ultrasonic processor by automatically adjusting the power supply. The ultrasonic processor was capable of conducting safe treatment of temperature-sensitive samples at high intensity and provided mixing by repeatedly allowing the sample to settle back under the probe after each burst using an independent on/off pulsar (ON: 5 s, OFF: 10 s). After the extraction process was completed, the CO2 was vented to the atmosphere through a gas flow meter (Alexander Wright and Co. Ltd., Thornaby, UK), which was used to verify the amount of CO2 used in the experiment. The contents of the high-pressure cell and trap (liquid and solid) were collected and filtered through a PTFE membrane filter (0.45 μm) to obtain a liquid extract. The resulting liquid extract was analyzed by HPLC-UV for quantitative determination of crocin-1 and crocin-2. The structure and morphology of the gardenia fruit pulp milled powder and the residues after extraction were analyzed using a scanning electron microscope (SEM; JEOL JSM6060, Tokyo, Japan).

2.4. Conventional Ultrasound-Assisted Extraction (UAE)

Conventional ultrasound-assisted extraction (UAE) was performed as described by Wang et al. [16]. In brief, 10 mg of milled gardenia fruit pulp powder was mixed in 10 mL of solvent (distilled water or ethanol or methanol) and loaded into a screw bottle (30 mL). The experimental setup was placed in an ultrasonic washer (SU-3T, Sibata Scientific Technology Ltd., Tokyo, Japan). Ultrasonication was conducted at 34 kHz and 40 W for 30 min. The temperature of water inside the ultrasonic washer was controlled to a target value (40 °C) by using a water circulation system (CCN-1000, GL Science Inc., Tokyo, Japan). The resulting liquid extract was filtered through a PTFE membrane filter (0.45 μm) and analyzed by HPLC-UV for quantitative determination of crocin-1 and crocin-2.

2.5. Analytical Procedures

2.5.1. High-Performance Liquid Chromatography (HPLC) Analysis

Qualitative and quantitative analyses of the liquid extract were conducted by HPLC-UV using a method modified from [27]. HPLC-UV analysis was performed under the following conditions: TSK-GEL (Tosoh Co., Tokyo, Japan) ODS-80Ts column (250 mm × 4.6 mm), column oven set at constant 40 °C, UV detector (875-UV, JASCO, Tokyo, Japan) wavelength set at 438 nm. Methanol and 0.1% acetic acid were used as phases. Table 1 shows the gradient profile of methanol. The total mobile phase flow rate was set at 1.0 mL/min.

2.5.2. Analytical Method Validation

The method was validated according to the International Conference on Harmonisation (ICH) guidelines in terms of linearity, limit of detection (LOD), limit of quantification (LOQ), and precision. The LOD and LOQ for the tested compounds were determined by the signal-to-noise (S/N) ratio. The intra-day and inter-day precision were evaluated by repeated injection. The intra-day experiment was obtained by 3 replicates for a day, and the inter-day was determined by 3 injections for 3 days for the peak area. Precision was expressed as relative standard deviation (RSD, %) according to Equation (1). The results obtained by testing various parameters during the validation of the analytical method are given in Table 2.
% RSD = Standard deviation of peak area/Average of peak area × 100

2.5.3. Standard Solutions and Calibration Curve

The standard stock solutions of crocin-1 and crocin-2 were prepared with 80% ethanol at a final concentration of 300 μg/mL. Standard solutions of crocin-1 at concentrations of 2.25, 4.5, 9.0, 18.0, and 36.0 μg/mL and crocin-2 at concentrations of 0.125, 0.25, 0.5, 1.0, and 2.0 μg/mL were prepared by diluting the stock solutions with 80% ethanol. The calibration curve was prepared over a concentration range of 2.25–36.0 μg/mL for crocin-1 and 0.125–2.0 μg/mL for crocin-2 with 5 concentration levels. Linearity for crocins was plotted using linear regression of the peak area versus concentration. The coefficient of correlation (R2) was used to judge linearity. The extraction concentrations of crocin-1 and crocin-2 were calculated according to Equation (2):
Extraction concentration = y/m − c
where y is the peak area of crocin-1 and crocin-2 determined by HPLC-UV, m is the slope of the calibration curve, and c is the intercept of the regression line with the y-axis.

2.6. Statistical Analysis

All analyses were performed in triplicates. The data were analyzed by one-way analysis of variance (ANOVA) accompanied by Tukey’s post-hoc test. The level of significance was set at p < 0.05.

3. Results and Discussion

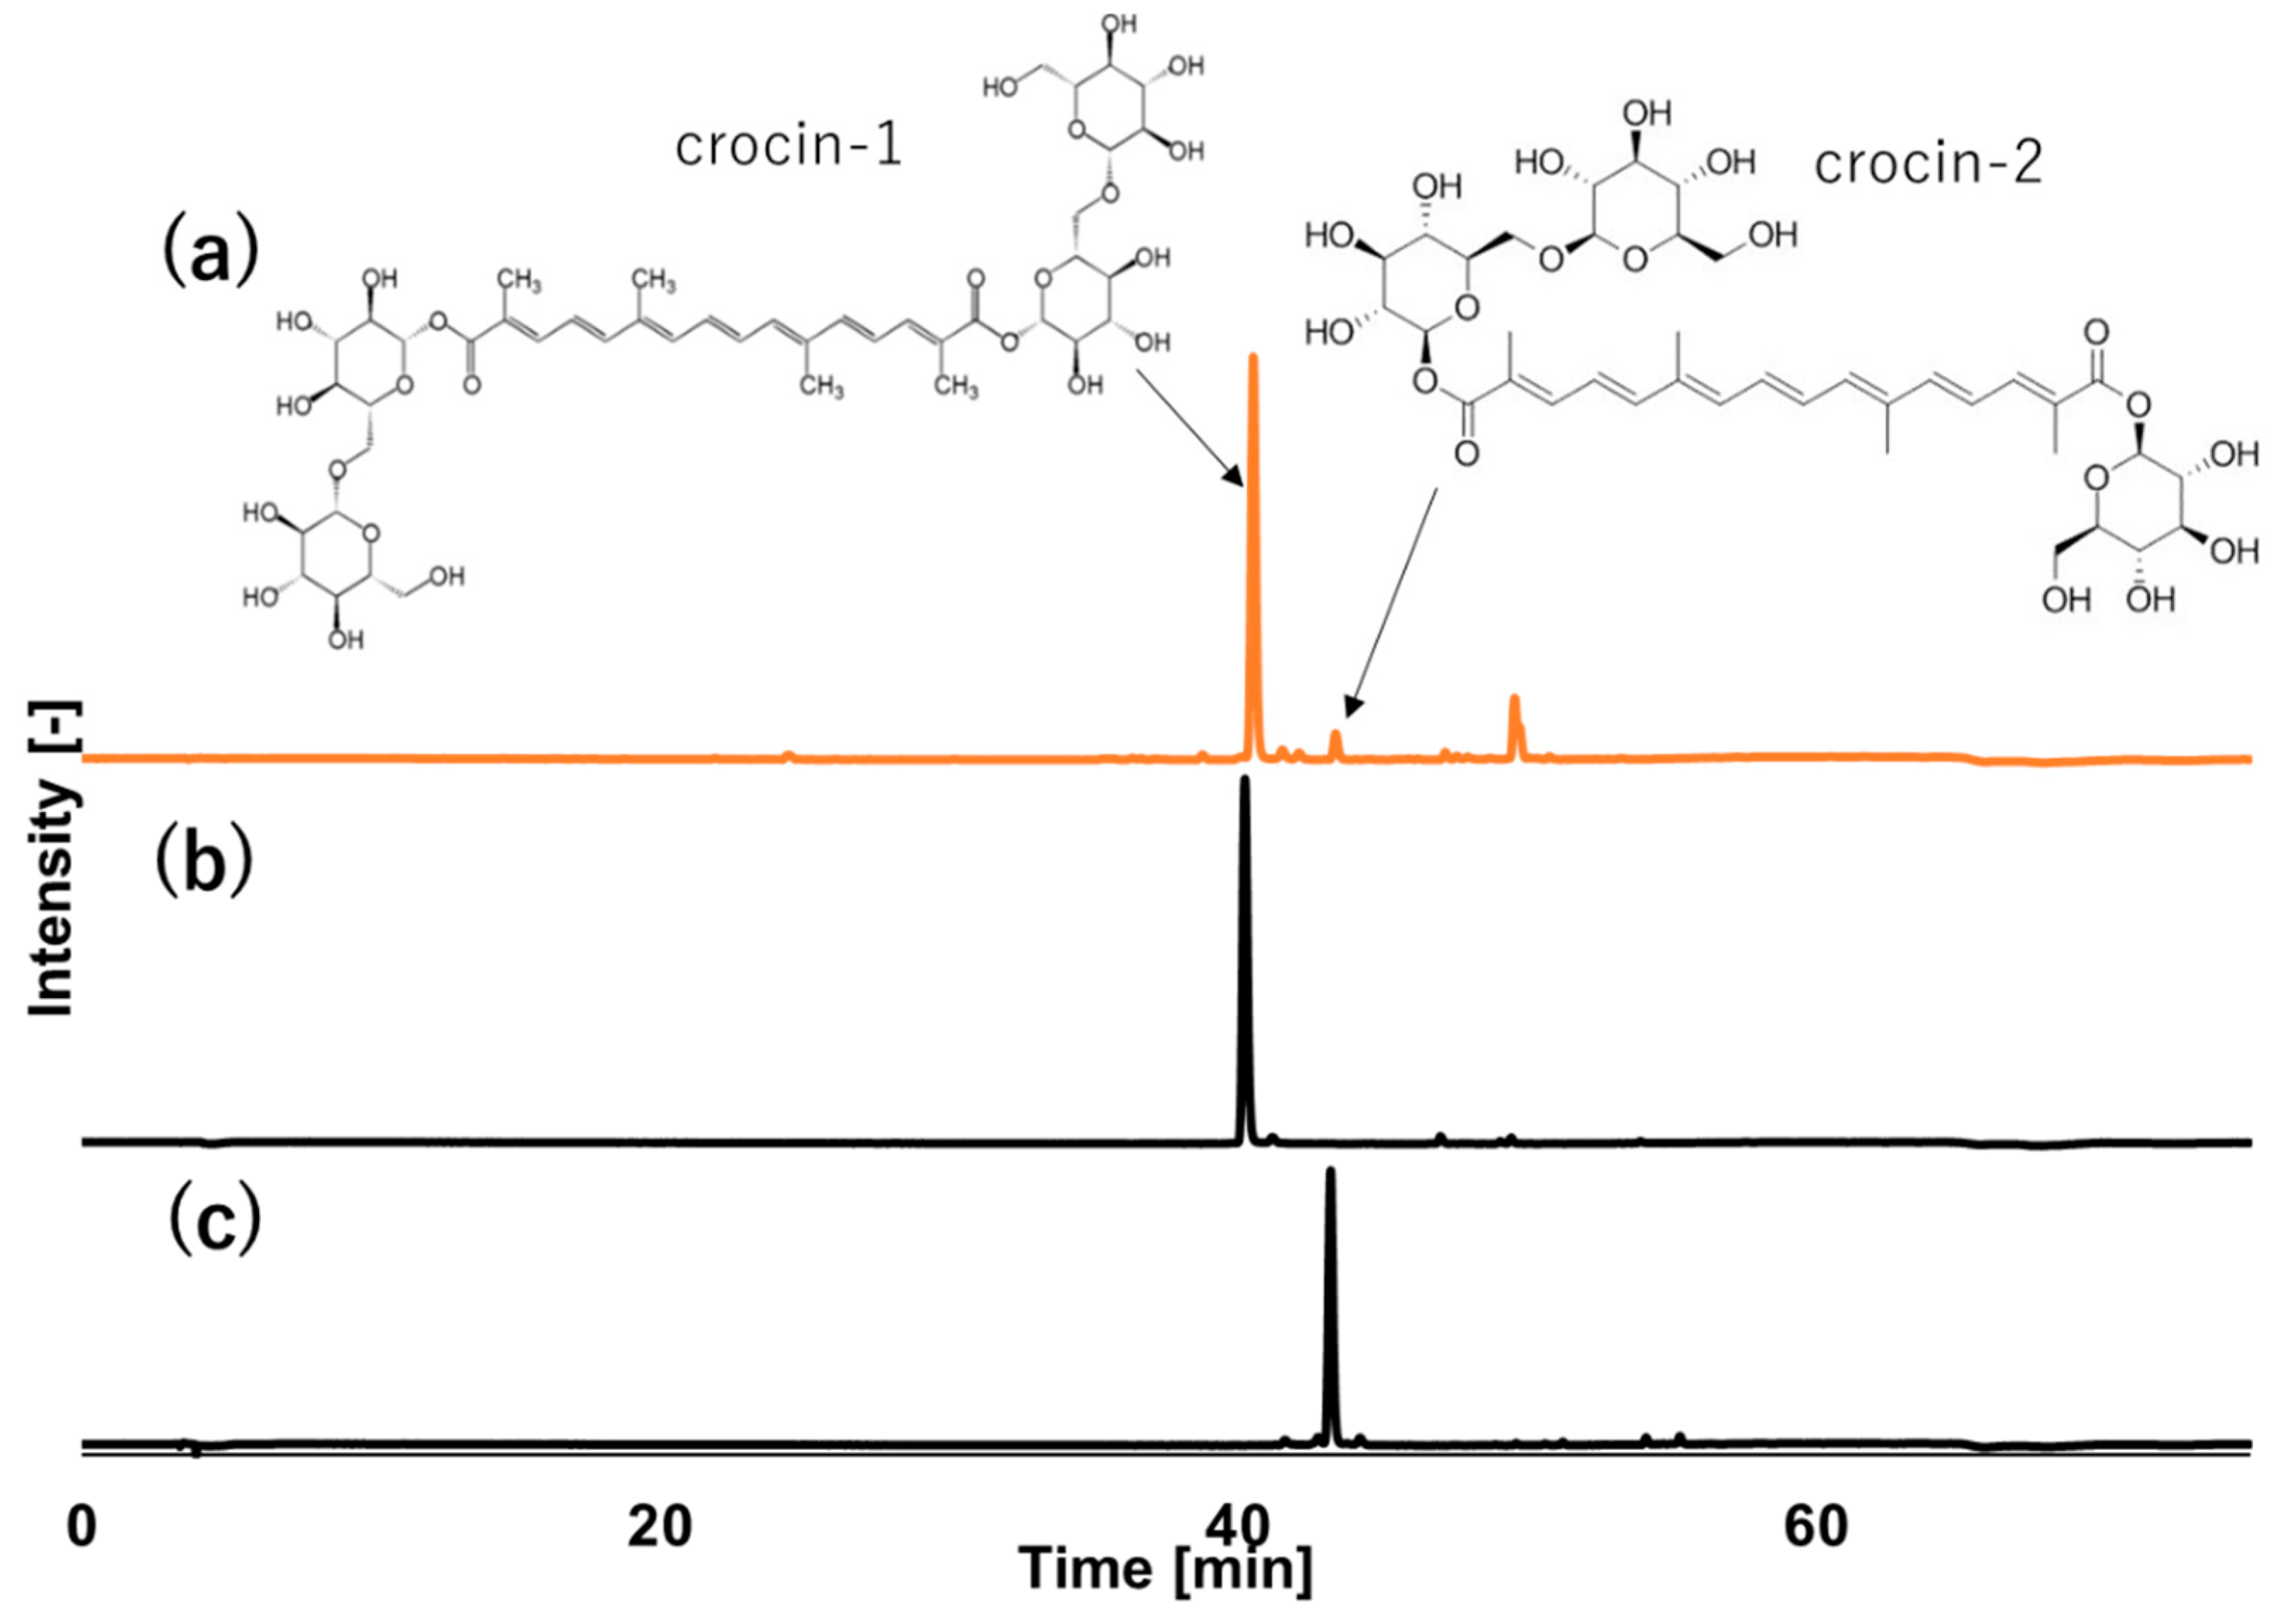
3.1. HPLC-UV Profile

Chromatograms of the extracts of gardenia fruit pulp and crocin-1 and crocin-2 standards were determined using HPLC-UV analysis. The calibration curve was constructed with crocin concentration versus peak area for crocin-1 (y = 2E + 08x, R2 = 0.9995, linear range: 2.25–36 μg/mL) and crocin-2 (y = 4E + 08x, R2 = 0.9997, linear range: 0.125–2 μg/mL). Peaks were identified by comparing their HPLC-UV retention time with the targeted compounds, as shown in Figure 2.
A typical HPLC-UV chromatogram of CO2-expanded ethanol (CXE80%) with direct sonication extraction at 25 °C and 10 MPa from gardenia fruit pulp was recorded at 438 nm (Figure 2a). Standard crocin-1 and crocin-2 chromayograms (Figure 2b,c, respectively) confirmed the peaks appearing at 40.23 and 43.20 min, respectively (Figure 2a).

3.2. Conventional Solid–Liquid Extraction (SLE)

For the selection of modifiers for the CO2-expanded liquid (CXL) extraction system following SLE, such as the effects of different solvents (water, ethanol, and methanol), ethanol concentration (aqueous ethanol 30, 50, or 80% v/v), and time (10–120 min) on extraction, concentrations were pre-examined.

3.2.1. Effect of Solvents on Extraction Concentration

In this study, conventional solid–liquid extraction (SLE) was carried out using three types of solvents (water, ethanol, and methanol as control) to extract the highest concentrations of crocins from gardenia fruit pulp powder. As shown in Figure 3a, methanol extraction was found to be the highest for crocin-1 and crocin-2 (10.43 ± 0.3 and 0.37 ± 0.02 μg/mL, respectively) followed by water extraction (6.93 ± 0.3 and 0.22 ± 0.002 μg/mL, respectively), whereas extraction with pure ethanol showed the lowest values. This may be because methanol has a higher dielectric constant than ethanol, which enabled us to extract more polar compounds. However, because ethanol is safer for human consumption, it was chosen for subsequent experiments.

3.2.2. Effect of Ethanol Concentration on the Extraction

The composition of the mixture of ethanol/water and the solid–liquid ratio of plant material are important, because the concentration in the solvent increases until saturation in the conventional SLE system. The results of the effect of different concentrations of ethanol at 0−100% (v/v) with or without sonication are presented in Figure 3b. The concentrations of crocin-1 and crocin-2 were dramatically increased by the addition of water to ethanol (30, 50, or 80% aqueous ethanol) (Figure 3b). However, the highest concentrations were achieved with 50 and 80% aqueous ethanol for crocin-1 (9.76 ± 0.5 and 9.49 ± 0.2 μg/mL, respectively) and crocin-2 (0.40 ± 0.02 and 0.31 ± 0.01 μg/mL, respectively). On the other hand, no significant changes in concentrations were found with sonication. This may be because of the short time application (125 s) of sonication, which is insufficient to induce a significant response. Crocins are generally large molecules (molecular weight of crocin-1 and crocin-2 is 977 and 814.42 g/mol, respectively) that combine two polar heads of gentiobiosyl esters with a non-polar C20 carbon chain. Due to their amphiphilic structure, the addition of water to ethanol increases the dielectric constant and the solubility and enables greater concentrations for both crocin-1 and crocin-2. Aqueous ethanol is also known as a better solvent than pure ethanol for the extraction of green pigment [23,28]. Therefore, in the subsequent experiment, 80% aqueous ethanol (80:20 v/v ethanol:water) was chosen to see the effects of extraction time on concentration.

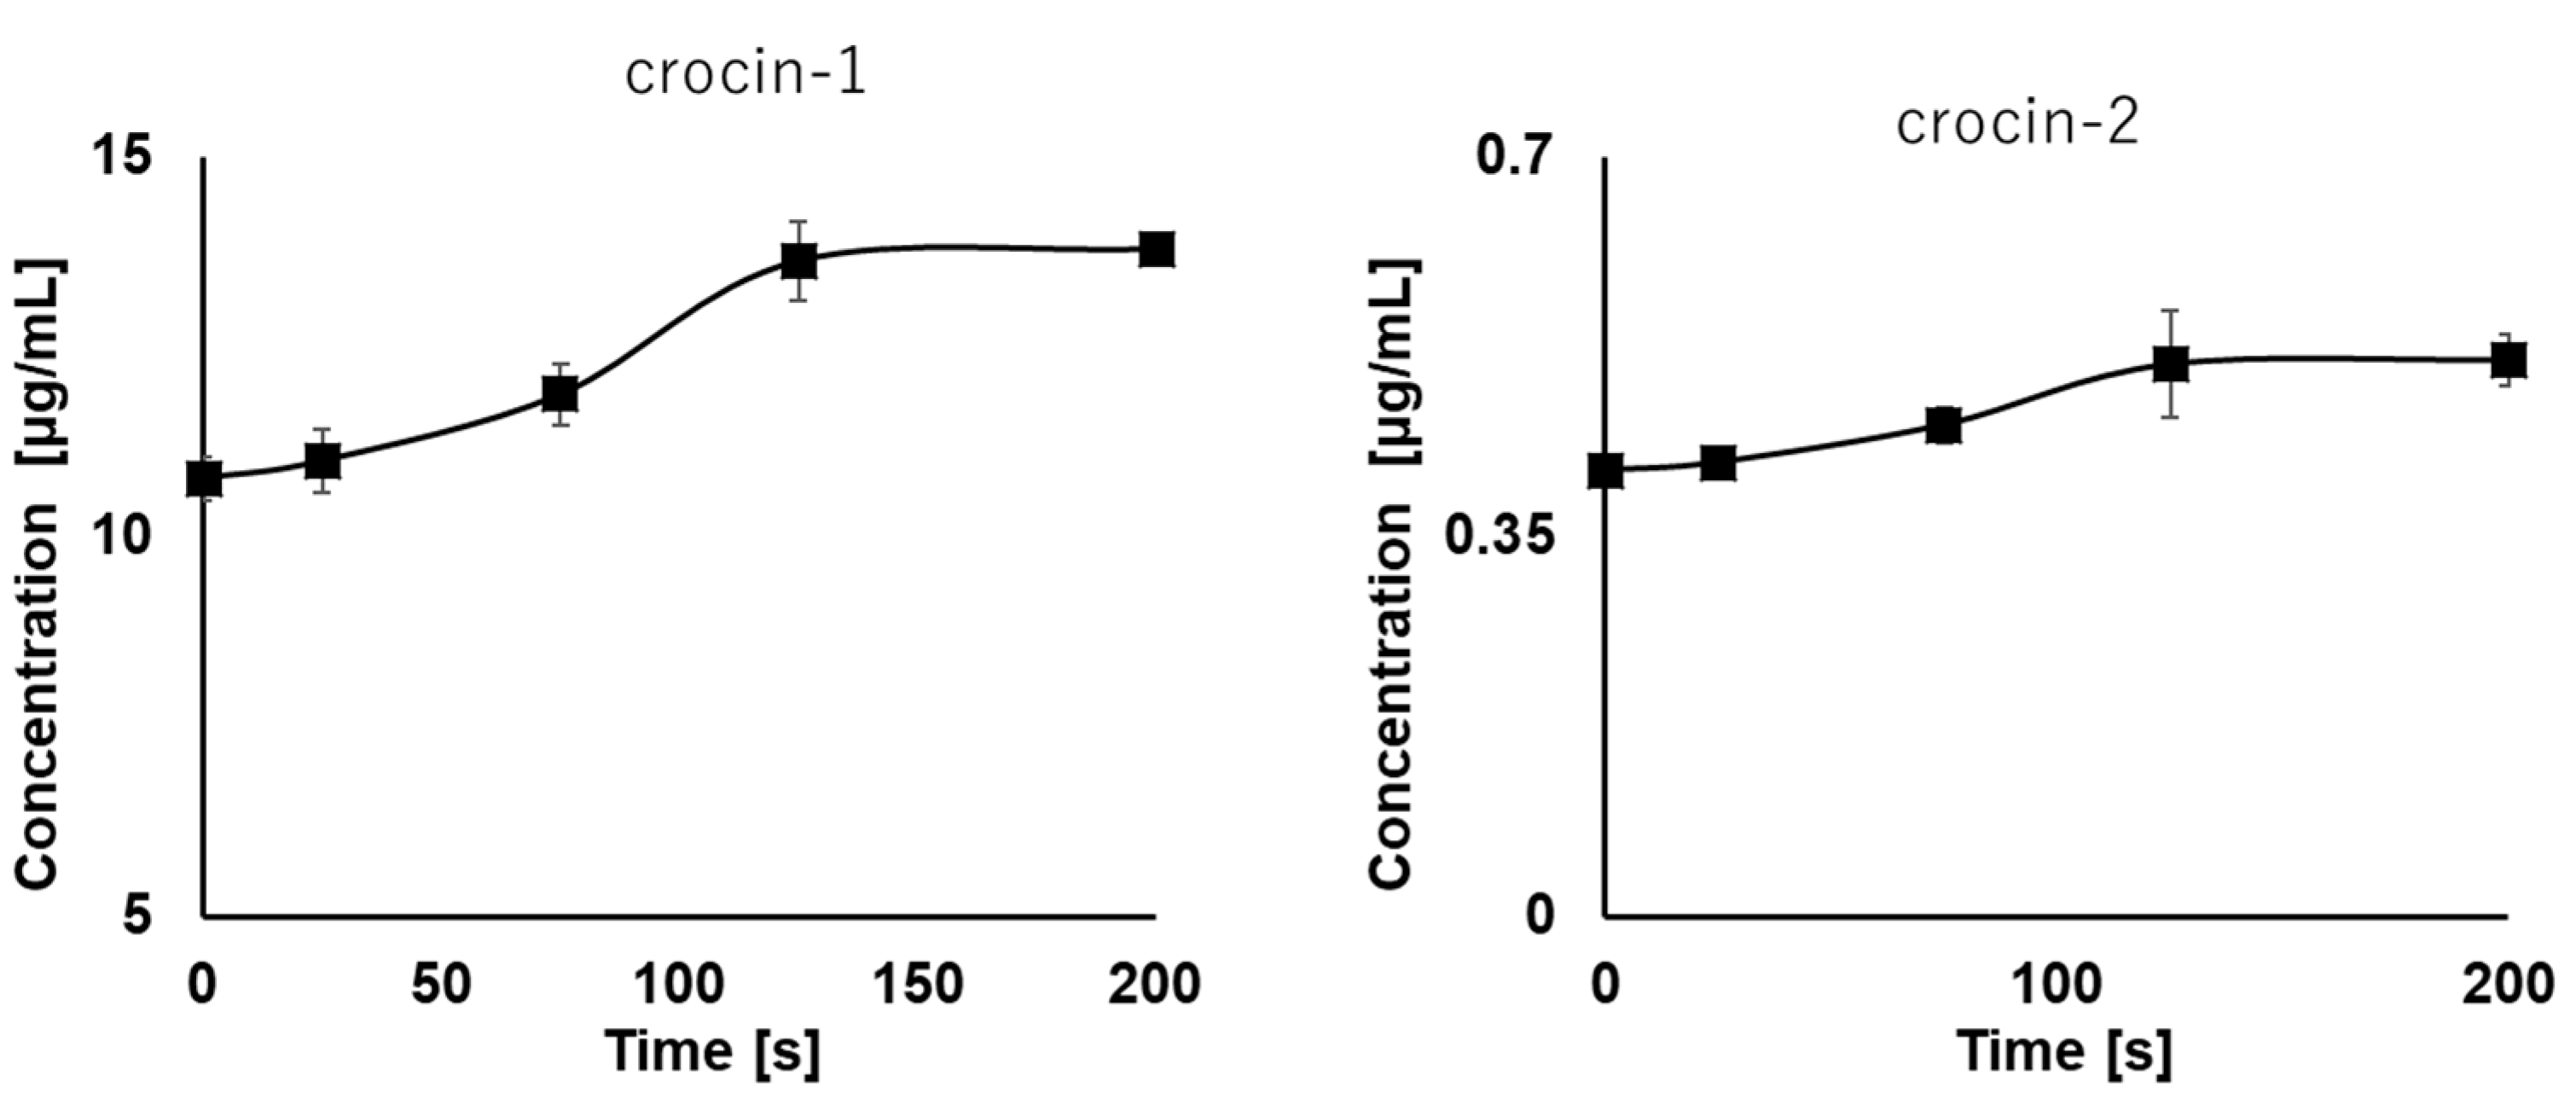
3.2.3. Effect of Extraction Time on the Concentration

To obtain maximum concentrations of crocin-1 and crocin-2, a time-dependent extraction experiment was performed using a conventional SLE system with aqueous ethanol (80% v/v) of gardenia fruits at 25 °C under atmospheric pressure, as shown in Figure 3c. The mass of extracts of crocin-1 and crocin-2 generally increased over 0–60 min and were then saturated to concentrations of approximately 9.84 and 0.35 μg/mL, respectively. Therefore, the appropriate extraction time was set at 60 min for the following experiments.

3.3. CO2-Expanded Liquid (CXL) Extraction System

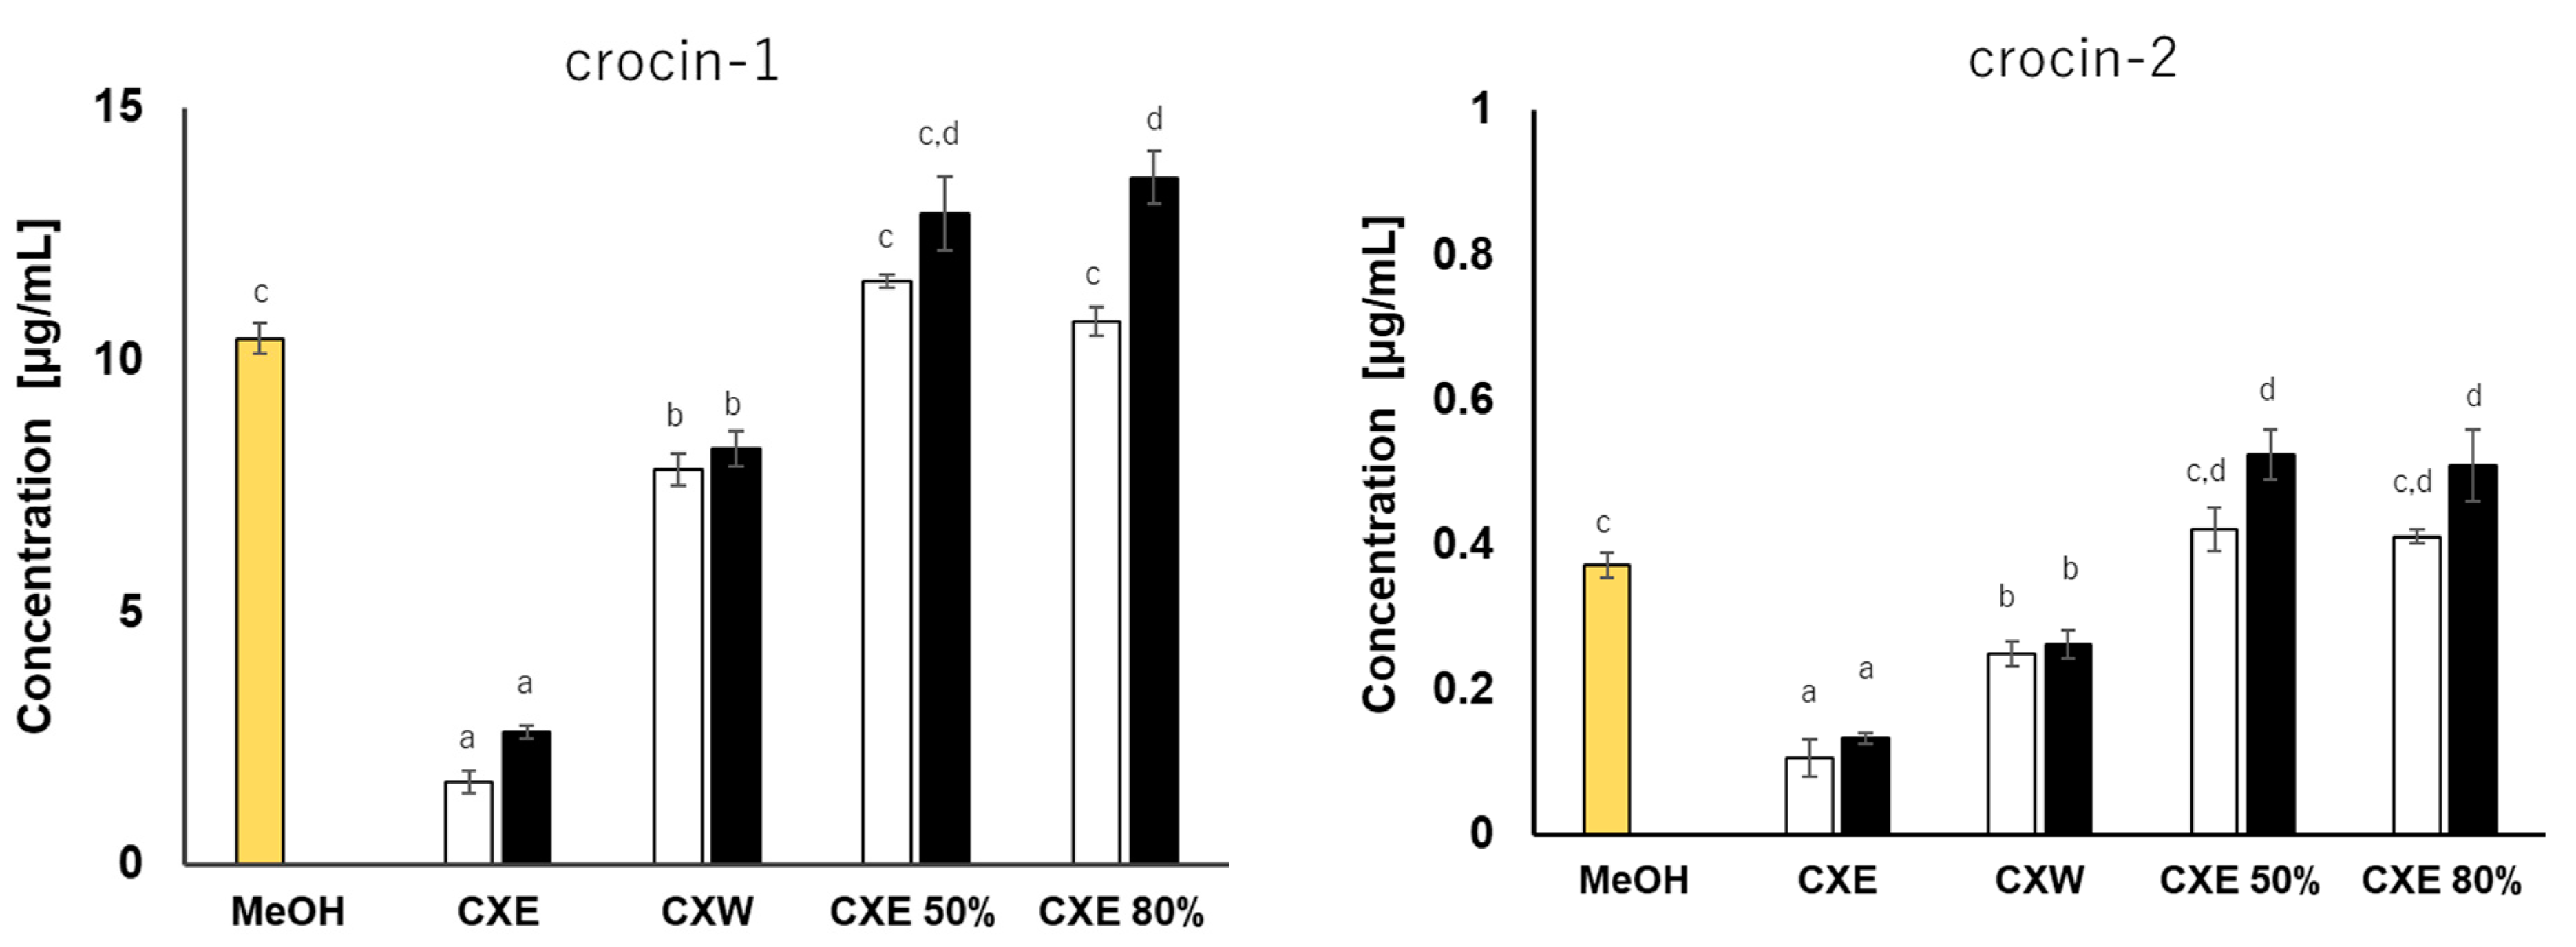
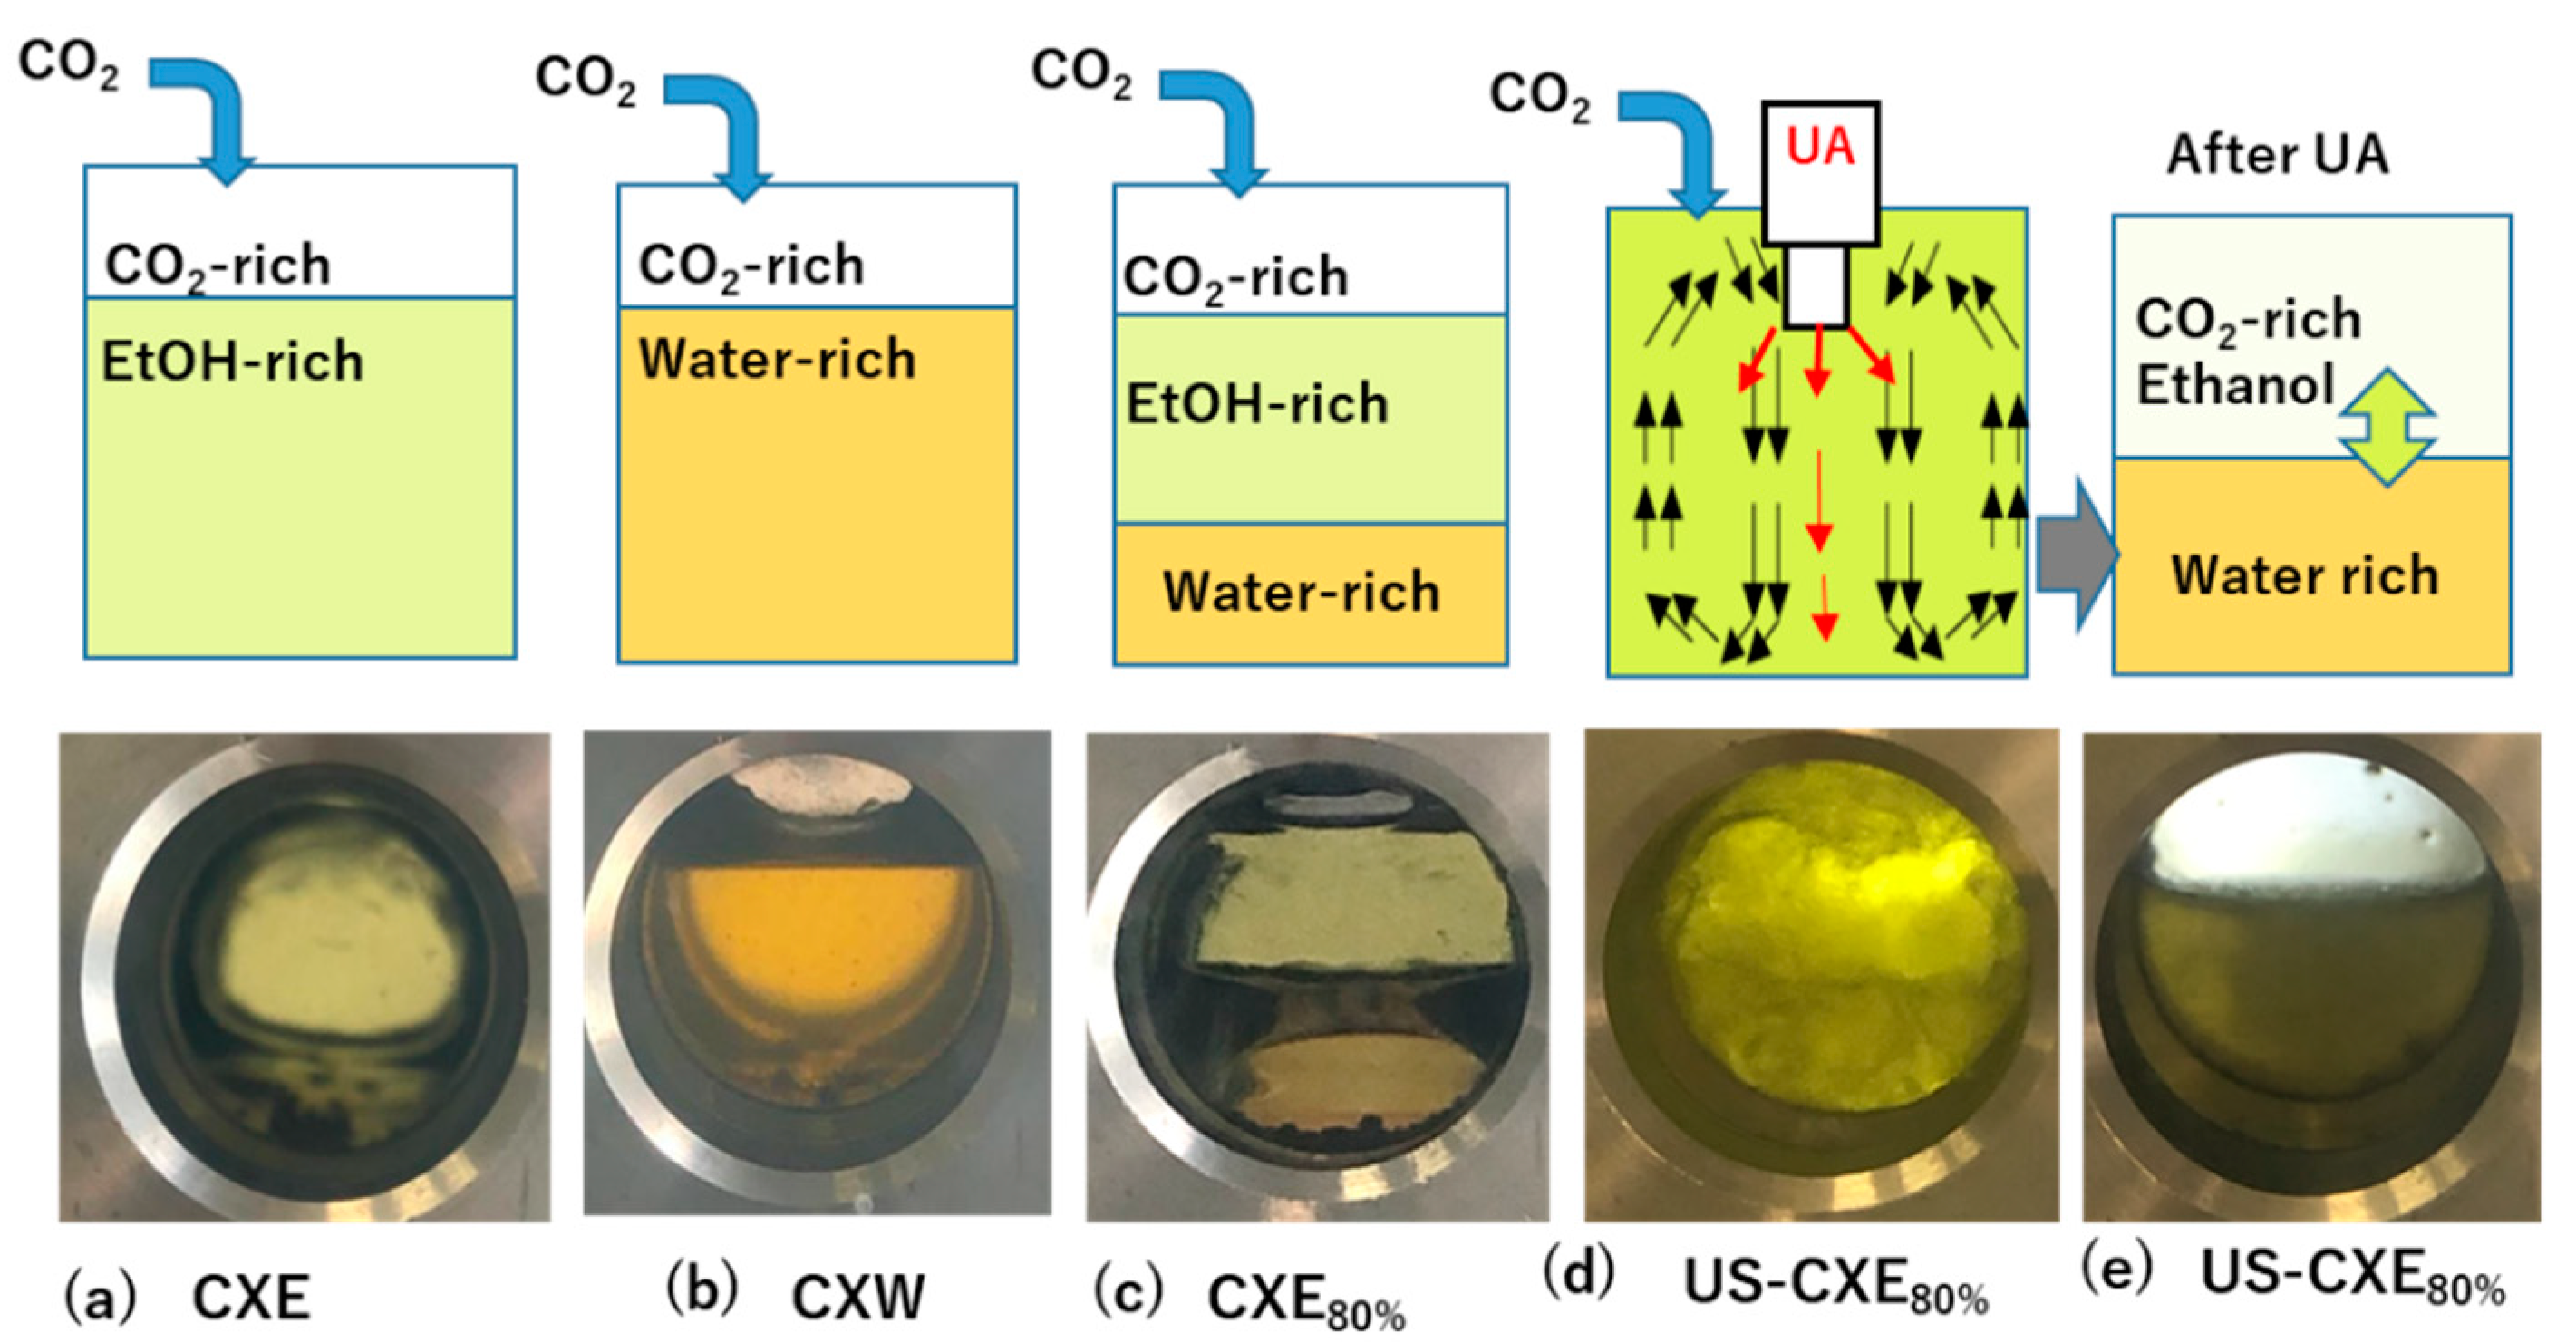
3.3.1. Effect of Modifiers on Extraction Concentration with or without Direct Sonication

The effects of different modifiers—pure ethanol (CXE) or water (CXW), or 50 or 80% of aqueous ethanol solution (CXE50% and CXE80%, respectively)—on the extraction concentration of crocin-1 and crocin-2 in the CXL extraction system was tested at 25 °C and 10 MPa and compared with the conventional SLE using methanol, as shown Figure 4. A comparison between extraction conditions and concentrations using different methods is summarized in Table 3. Crocins are polar compounds, therefore liquid CO2 sole extraction was not executed. The results show that the extraction concentrations were greatly affected by changing the modifiers.
The effect of the modifier on the extraction concentration followed the order: CXE80% > CXE50% > CXW > pure CXE (Figure 4). The highest concentration was obtained using CO2-expanded aqueous ethanol solution CXE50% (11.57 ± 0.12 and 0.42 ± 0.03 μg/mL for crocin-1 and crocin-2, respectively) or CXE80% (10.77 ± 0.29 and 0.41 ± 0.01μg/mL for crocin-1 and crocin-2, respectively), whereas CO2-expanded pure ethanol (CXE) was the lowest (1.64 ± 0.23 and 0.11 ± 0.03 μg/mL for crocin-1 and crocin-2, respectively; p > 0.01). This result is in agreement with the extraction of chlorophyll, where mixtures of CO2 and aqueous ethanol were much more effective than mixtures containing only pure ethanol [28]. In the case of the conventional UAE system according to Wang et al. [16], using ethanol or methanol as solvent, no significant enhancement was observed. However, the concentrations of crocin-1 and crocin-2 were significantly increased with the addition of direct sonication (DS) in CXE50% + DS (12.91 ± 0.75 and 0.52 ± 0.03 μg/mL for crocin-1 and crocin-2, respectively; p < 0.05) or CXE 80% + DS (13.63 ± 0.52 and 0.51 ± 0.05 μg/mL for crocin-1 and crocin-2, respectively; p < 0.05) extraction system (Figure 4, Table 3).

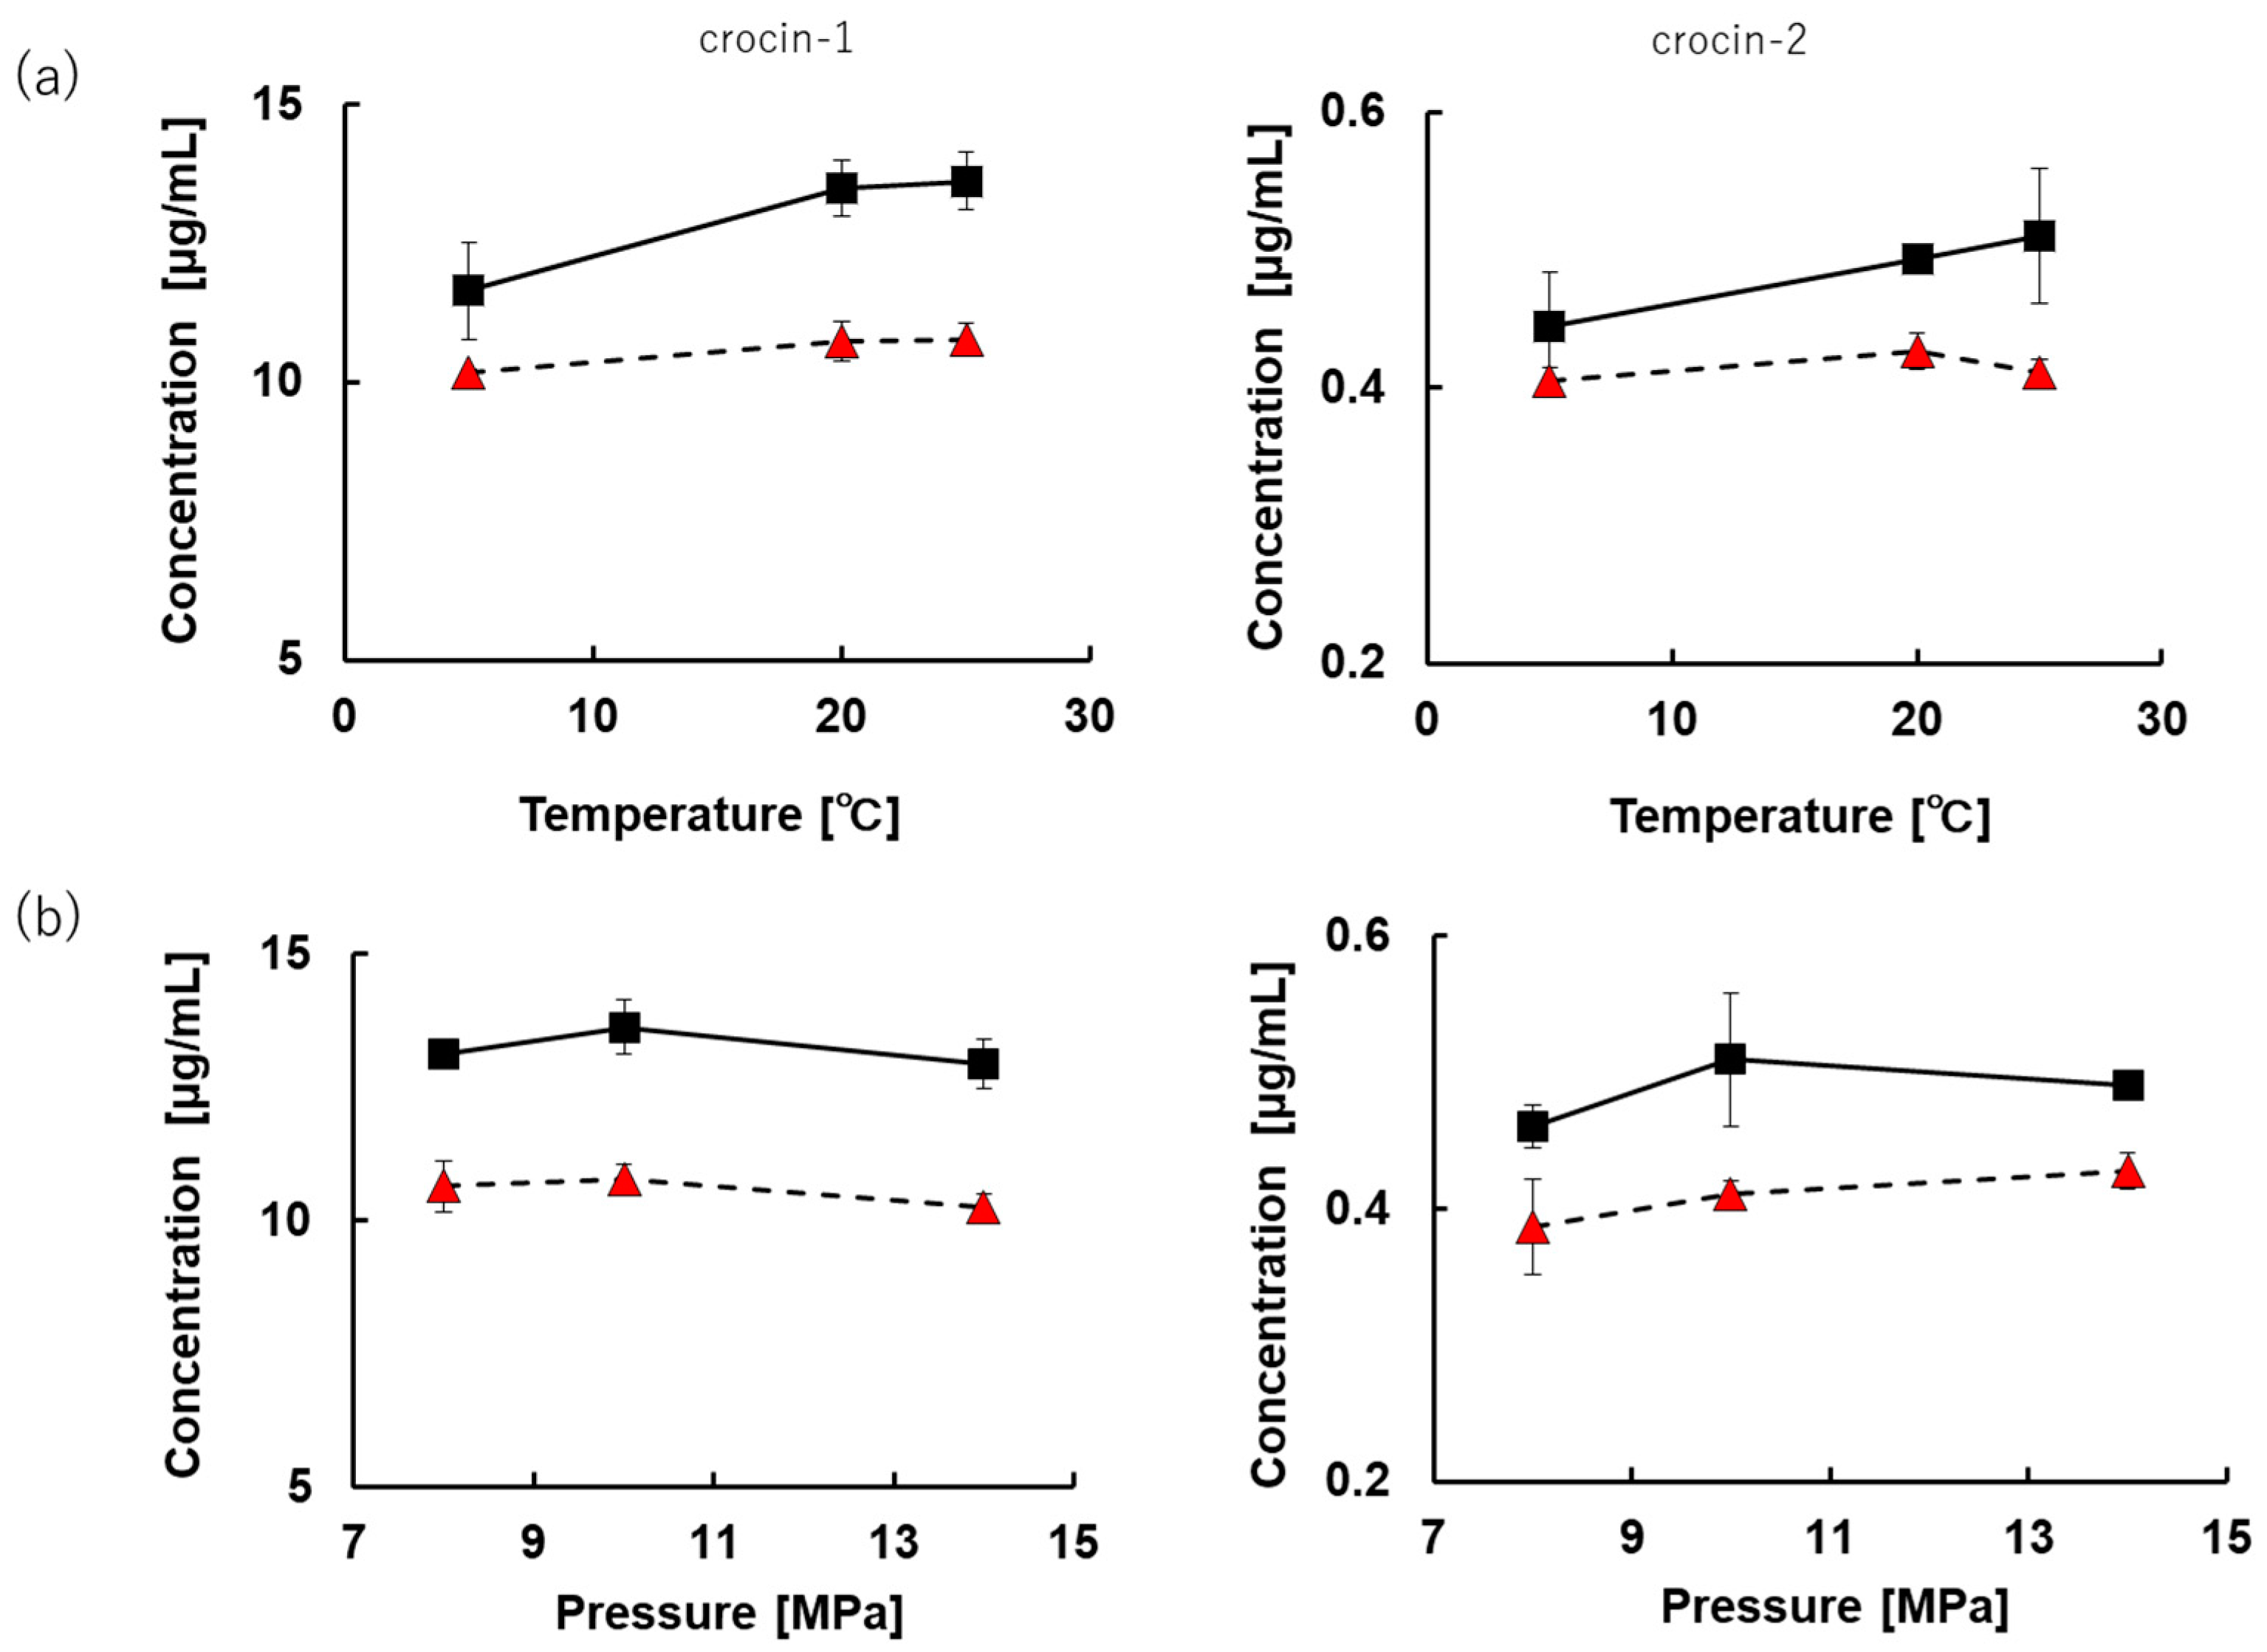
3.3.2. Effects of Temperature and Pressure on Extraction Concentration in CXE80% System with or without Direct Sonication

The effects of temperature on the concentration of crocin-1 and crocin-2 extracted at various temperatures (5, 20, and 25 °C) at constant pressure (10 MPa) in the CXE80% system with and without direct sonication are shown in Figure 5a. As shown in Figure 5a, the extraction concentration of both crocin-1 and crocin-2 increased from 10.18 ± 0.1 and 0.41 ± 0.01 μg/mL to 10.78 ± 0.29 and 0.43 ± 0.01 μg/mL, respectively, by increasing temperature from 5 to 25 °C in the CXE80% extraction system without direct sonication. This may be attributed to the reduced viscosity of liquid CO2, and thereby increased solubility of the target components. It is well known that increasing temperature decreases the surface tension between the solvent, solute, and matrix, reduces viscosity, and facilitates better solvent penetration into the matrix, which together improves the extraction concentration [22].
The effect of pressure on the extraction concentration of crocin-1 and crocin-2 extracted at pressure ranging from 8 to 14 MPa at a constant temperature (25 °C) in the CXE80% system with and without direct sonication is shown in Figure 5b. As shown in Figure 5b, no significant increases were found in the extraction concentrations of crocin-1 and crocin-2 with increasing pressure. Generally, increasing pressure increases the density of a CXL extraction system, and it is more likely to be increased in solubility. However, as previously observed [24,26], the density of liquid CO2 under these conditions is very similar (density of CO2 at 8, 10, and 14 MPa at 25 °C is 777, 818, and 867 kg/m3, respectively), suggesting that these pressure levels have little effect on liquid CO2 solubility.
As shown in Figure 5a,b, the extraction concentrations of crocin-1 and crocin-2 were greatly affected by the addition of direct ultrasound in the CXE80% system regardless of temperature and pressure. This is because adding direct sonication to the system facilitates microstreaming and cavitation, breaking the cell membranes and allowing more solvent to penetrate, followed by better contact between the solvent and solute and improved mass transfer, resulting in a high extraction concentration [26,29]. Similar effects of sonication have been previously confirmed [24].

3.3.3. Effect of Sonication Time on Extraction Concentration in CXE80% System

The concentrations of crocin-1 and crocin-2 were gradually increased with increasing sonication time in the CXE80% system at 25 °C and 10 MPa (Figure 6) and saturated at 125 s. As described above, increasing the sonication time of the system may facilitate more microstreaming and cavitation to break more cell membranes, resulting in better contact and interactions of solvents to wash out the plant materials [26,29]. From this result, therefore, it is considered that 125 s of direct sonication in CXL can produce a sufficient extraction effect, with the advantages of reduced extraction time and increased extract concentration.
Figure 7 shows a comparison of the cell morphology of gardenia pulp powder before and after extraction with or without sonication in different extraction methods. There were no significant morphological changes in shape and structure observed in untreated material (Figure 7a) or material treated with aqueous ethanol 80% (Figure 7b). However, wrinkles and swelling of cell walls were observed in the samples treated in the CXE80% system (Figure 7c). Furthermore, significant morphological changes in shape and structure after the addition of direct sonication (125 s) to the CXE80% system caused cell rupture and clearance of cell contents, leaving a smooth surface area (Figure 7d). These structural changes confirm the extraction of cell contents and may facilitate the enhancement of diffusion, resulting in higher extraction concentrations in CXE80% with a direct sonication extraction system.

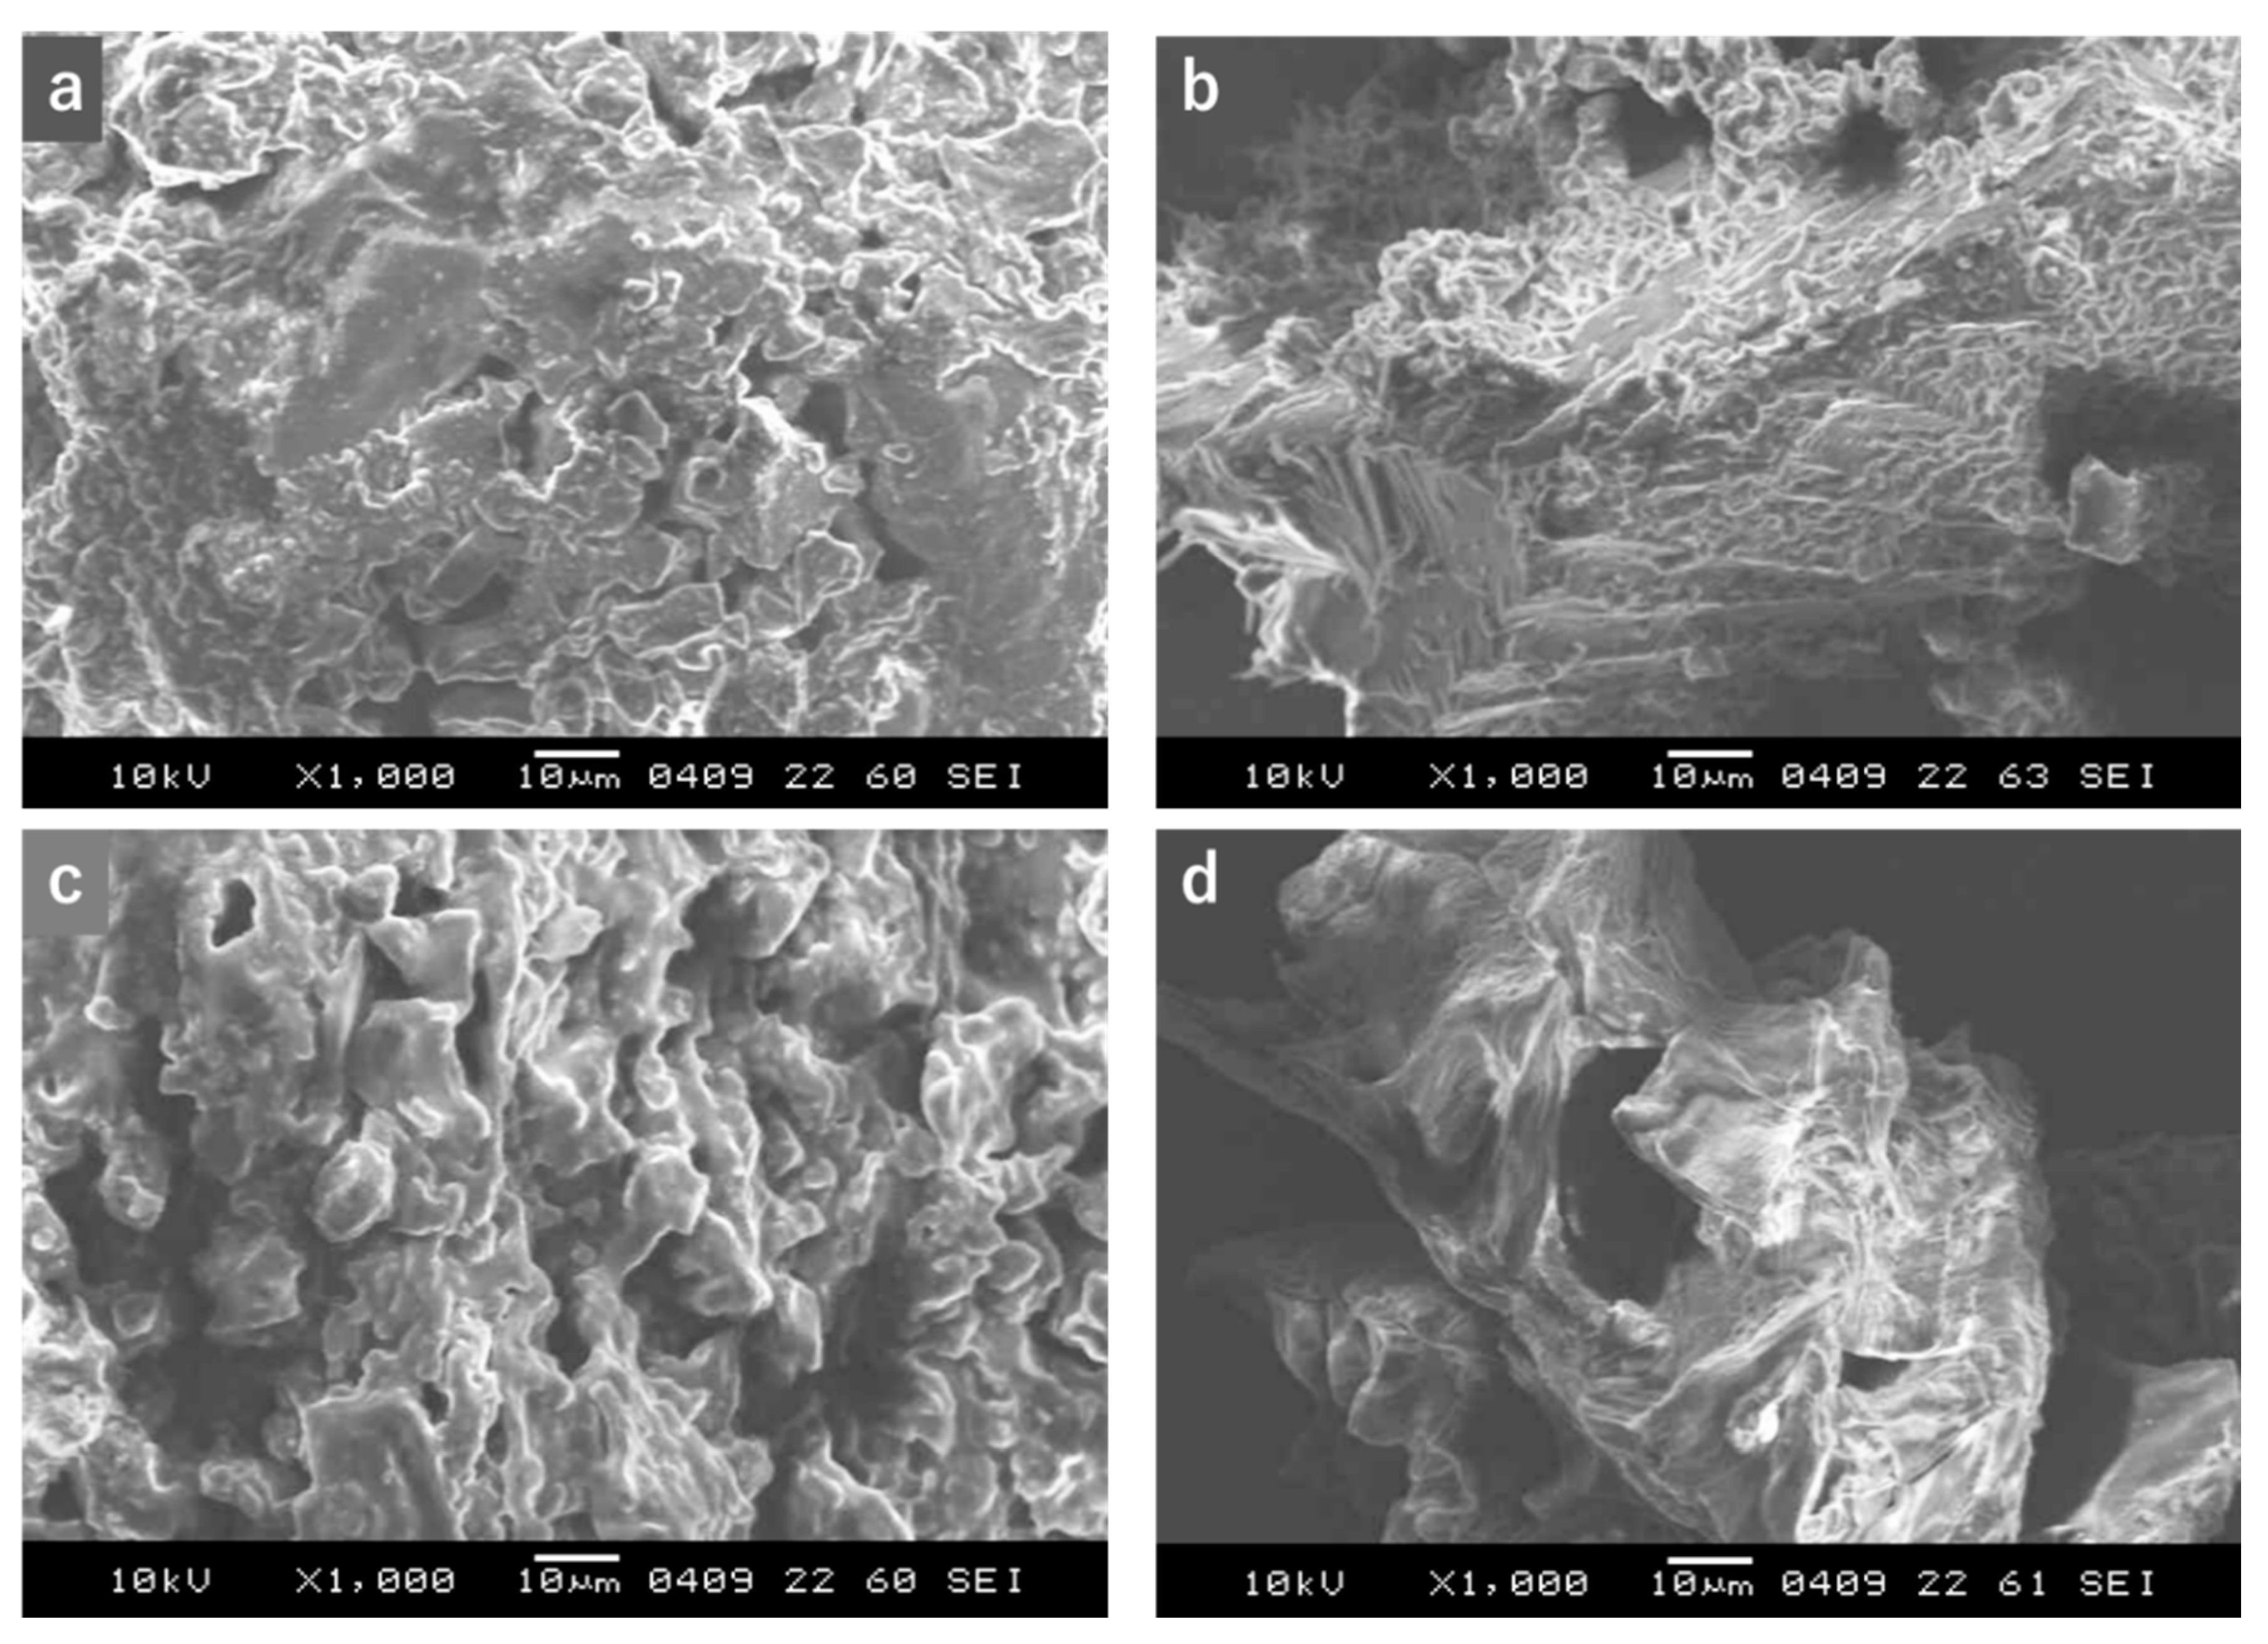
3.4. Proposed Mechanism of Extraction in CXL Extraction System with or without Direct Sonication

Although the mechanisms of extraction in the CXL extraction system using different modifiers and their effects on extraction efficiency are not completely understood, it is clear that the extraction concentrations in the system were greatly affected by the addition of CO2 to the modifiers, which may be related to different phase behavior and polarity. The visual observation of the phase behavior upon expanding CO2 in different modifiers is shown in Figure 8. As shown in Figure 8a, in the CXE extraction system, it was observed that ethanol expanded well with the addition of CO2. It is known that CO2 dissolves in pure ethanol and decreases the dielectric constant and polarity of ethanol [30], which may explain the cause of poor crocin concentration when using pure ethanol as a modifier (Figure 4). In the CXW system, it was found that the water phase did not expand well with addition of CO2 (Figure 8b). This was expected, because CO2 is poorly soluble in water, and it resulted in a greater concentration of crocins than in CXE. CO2-saturated water may alter the polarity of the interphase region of CO2-water, therefore there was increased solubility of the target compounds and a higher concentration than with pure ethanol. This result also agreed with the study of Nerome et al., who showed that water with ScCO2 is superior to methanol as a modifier for the extraction of crocin [31]. Interestingly, as shown in Figure 8c, the addition of CO2 to the aqueous ethanol CXE80% system split the aqueous ethanol into distinct two liquid phases, which can be defined, according to Jessop et al. [30], as a water-rich and an ethanol-rich phase in addition to the CO2-rich gas phase. This may turn the process into a three-phase rather than a two-phase system and allow more CO2 to diffuse through the matrix and transport more target materials to the aqueous ethanol solution, which may be the reason for the enhanced concentration of crocins (Figure 4 and Figure 7c). However, as shown in Figure 8d,e, adding direct sonication to the CXE80% system, three phases were disrupted with vigorous mixing, and interestingly, only two phases could be observed, a compressed aqueous-ethanol and an aqueous ethanol-modified CO2-rich phase (Figure 8e). We assume that vigorous mixing with direct sonication may cause micro-phase separation [25], leading to the dispersion of ethanol micelles between aqueous and CO2-rich phases, with a resulting increase in surface area of the extraction. Ethanol is more soluble in CO2 than in water, therefore we presume that more micelles of ethanol dissolved in the CO2-rich phase than in the water-rich phase, resulting in two visible phases, as shown in Figure 8e. Besides, sonication produces cavitation bubbles, which induce shockwaves to damage the cell matrix. Therefore, altogether, direct sonication may enhance the mass transfer of target materials, providing the highest concentration with the CXE80% system than any other method (Figure 4 and Table 3).

4. Conclusions

Natural pigment components (crocin-1 and crocin-2) from gardenia fruit pulp were extracted in a CO2 expanded liquid (CXL) extraction system using modifiers of ethanol, water, aqueous ethanol (CXE50% or 80%, v/v), and direct sonication. The parameters temperature, pressure, and sonication time were optimized using a combination of single-factor experiments. The optimal temperature and pressure were 25 °C and 10 MPa. The extraction concentrations of crocin-1 and crocin-2 were higher using direct sonication (125 s, 20% amplitude) in the liquid CO2-expanded aqueous ethanol (80%, v/v) system than without sonication. In summary, in order for the extraction system to be fast and efficient, the addition of direct sonication to CO2-expanded aqueous ethanol (80%) is the most influential factor in the extraction concentration of polar compounds.

Author Contributions

Conceptualization, T.S., T.M.A. and K.M.; data curation, H.S.; formal analysis, H.S.; funding acquisition, K.M.; investigation, H.S.; methodology, H.S.; project administration, K.M.; resources, H.S., K.O. and S.T.; software, H.S.; supervision, K.M.; validation, H.S., K.O. and S.T.; visualization, H.S.; writing—original draft, H.S.; writing—review and editing, T.S., T.M.A. and K.M. All authors have read and agreed to the published version of the manuscript.

Funding

This work was funded by JSPS KAKENHI Grant Number 17K06899.

Institutional Review Board Statement

Not applicable.

Informed Consent Statement

Not applicable.

Data Availability Statement

No new data were created or analyzed in this study. Data sharing is not applicable to this article.

Conflicts of Interest

The authors declare no conflict of interest.

References

  1. Hong, I.K.; Jeon, H.; Lee, S.B. Extraction of natural dye from Gardenia and chromaticity analysis according to chi parameter. J. Ind. Eng. Chem. 2015, 24, 326–332. [Google Scholar] [CrossRef]
  2. Yen, H.-W.; Yang, S.-C.; Chen, C.-H.; Jesisca; Chang, J.-S. Supercritical fluid extraction of valuable compounds from microalgal biomass. Bioresour. Technol. 2015, 184, 291–296. [Google Scholar] [CrossRef] [PubMed]
  3. Sinha, K.; Saha, P.D.; Datta, S. Extraction of natural dye from petals of flame of forest (Butea monosperma) flower: Process optimization using response surface methodology (RSM). Dye. Pigment. 2012, 94, 212–216. [Google Scholar] [CrossRef]
  4. Ali, S.; Hussain, T.; Nawaz, R. Optimization of alkaline extraction of natural dye from Henna leaves and its dyeing on cotton by exhaust method. J. Clean. Prod. 2009, 17, 61–66. [Google Scholar] [CrossRef]
  5. Carmona, M.; Zalacain, A.; Sánchez, A.M.; Novella, J.L.; Alonso, G.L. Crocetin esters, picrocrocin and its related compounds present in Crocus sativus stigmas and Gardenia jasminoides fruits. Tentative identification of seven new compounds by LC-ESI-MS. J. Agric. Food Chem. 2006, 54, 973–979. [Google Scholar] [CrossRef]
  6. Yamada, S.; Oshima, H.; Saito, I.; Hayakawa, J. Adoption of crocetin as an indicator compound for detection of gardenia yellow in food products (Analysis of natural coloring matters in food V). J. Food Hyg. Soc. Jpn. 1996, 37, 372–377. [Google Scholar] [CrossRef] [Green Version]
  7. Yang, W.; Wang, J.; Li, X.; Du, Z. A new method research for determination of natural pigment crocin yellow in foods by solid-phase extraction ultrahigh pressure liquid chromatography. J. Chromatogr. A 2011, 1218, 1423–1428. [Google Scholar] [CrossRef]
  8. Chen, Y.; Zhang, H.; Tian, X.; Zhao, C.; Cai, L.; Liu, Y.; Jia, L.; Yin, H.-X.; Chen, C. Antioxidant potential of crocins and ethanol extracts of Gardenia jasminoides ELLIS and Crocus sativus L.: A relationship investigation between antioxidant activity and crocin contents. Food Chem. 2008, 109, 484–492. [Google Scholar] [CrossRef]
  9. Nam, K.N.; Park, Y.-M.; Jung, H.-J.; Lee, J.Y.; Min, B.D.; Park, S.-U.; Jung, W.-S.; Cho, K.-H.; Park, J.-H.; Kang, I.; et al. Anti-inflammatory effects of crocin and crocetin in rat brain microglial cells. Eur. J. Pharmacol. 2010, 648, 110–116. [Google Scholar] [CrossRef]
  10. Koo, H.-J.; Lim, K.-H.; Jung, H.-J.; Park, E.-H. Anti-inflammatory evaluation of gardenia extract, geniposide and genipin. J. Ethnopharmacol. 2006, 103, 496–500. [Google Scholar] [CrossRef]
  11. He, S.-Y.; Qian, Z.-Y.; Tang, F.-T.; Wen, N.; Xu, G.-L.; Sheng, L. Effect of crocin on experimental atherosclerosis in quails and its mechanisms. Life Sci. 2005, 77, 907–921. [Google Scholar] [CrossRef] [PubMed]
  12. Aung, H.H.; Wang, C.Z.; Ni, M.; Fishbein, A.; Mehendale, S.R.; Xie, J.T.; Shoyama, A.Y.; Yuan, C.S. Crocin from crocus sativus possesses significant anti-proliferation effects on human colorectal cancer cells. Exp. Oncol. 2007, 29, 175–180. [Google Scholar] [PubMed]
  13. Yorgun, M.A. Effects of crocin on diabetic maculopathy: A placebo-controlled randomized clinical trial. Am. J. Ophthalmol. 2019, 204, 141–142. [Google Scholar] [CrossRef] [PubMed]
  14. Ebrahim-Habibi, M.-B.; Amininasad, M.; Ebrahim-Habibi, A.; Sabbghian, M.; Nemat-Gorgani, M. Fibrillation of α-lactalbumin: Effect of crocin and safranal, two natural small molecules from crocus sativus. Biopolymers 2010, 93, 854–865. [Google Scholar] [CrossRef] [PubMed]
  15. Zhu, X.; Mang, Y.; Shen, F.; Xie, J.; Su, W. Homogenate extraction of gardenia yellow pigment from Gardenia Jasminoides ellis fruit using response surface methodology. J. Food Sci. Technol. 2014, 51, 1575–1581. [Google Scholar] [CrossRef] [PubMed] [Green Version]
  16. Wang, X.; Dong, S.; Chen, F. Ultrasonic-assisted extraction of gardenia yellow from fructus Gardeniae. Adv. Mat. Res. 2012, 396, 1075–1078. [Google Scholar] [CrossRef]
  17. Budisa, N.; Schulze-Makuch, D. Supercritical carbon dioxide and its potential as a life-sustaining solvent in a planetary environment. Life 2014, 4, 331–340. [Google Scholar] [CrossRef] [PubMed] [Green Version]
  18. Karasu, S.; Bayram, Y.; Ozkan, K.; Sagdic, O. Extraction optimization crocin pigments of saffron (crocus sativus) using response surface methodology and determination stability of crocin microcapsules. J. Food Meas. Charact. 2019, 13, 1515–1523. [Google Scholar] [CrossRef]
  19. del Pilar Sánchez-Camargoa, A.; Mendiolab, J.A.; Ibáñez, E. Gas expanded-liquids. In Supercritical and Other High-Pressure Solvent Systems: For Extraction, Reaction and Material Processing; Hunt, A.J., Attard, T.M., Eds.; Royal Society of Chemistry: London, UK, 2018; pp. 512–529. [Google Scholar]
  20. Rodríguez-Pérez, C.; Mendiola, J.A.; Quirantes-Piné, R.; Ibáñez, E.; Segura-Carretero, A. Green downstream processing using supercritical carbon dioxide: CO2-expanded ethanol and pressurized hot water extractions for recovering bioactive compounds from Moringa oleifera leaves. J. Supercrit. Fluids 2016, 116, 90–100. [Google Scholar] [CrossRef]
  21. Paudel, A.; Jessop, M.J.; Stubbins, S.H.; Champagne, P.; Jessop, P.G. Extraction of lipids from microalgae using CO2-expanded methanol and liquid CO2. Bioresour. Technol. 2015, 184, 286–290. [Google Scholar] [CrossRef]
  22. Al-Hamimi, S.; Mayoral, A.A.; Cunico, L.P.; Charlotta Turner, C. Carbon dioxide expanded ethanol extraction: Solubility and extraction kinetics of α-pinene and cis-verbenol. Anal. Chem. 2016, 88, 4336–4345. [Google Scholar] [CrossRef] [PubMed] [Green Version]
  23. del-Valle, J.M.; Martín, Á.; Cocero, M.J.; de la Fuente, J.C.; de la Cruz-Quiroz, R. Supercritical CO2 extraction of solids using aqueous ethanol as static modifier is a two-step mass transfer process. J. Supercrit. Fluids 2019, 143, 179–190. [Google Scholar] [CrossRef]
  24. Kawamura, H.; Mishima, K.; Sharmin, T.; Ito, S.; Kawakami, R.; Kato, T.; Misumi, M.; Suetsugu, T.; Orii, H.; Kawano, H.; et al. Ultrasonically enhanced extraction of luteolin and apigenin from the leaves of Perilla frutescens (L.) Britt. using liquid carbon dioxide and ethanol. Ultrason. Sonochem. 2016, 29, 19–26. [Google Scholar] [CrossRef] [PubMed]
  25. Tokunaga, S.; Tashiro, H.; Ono, K.; Sharmin, T.; Kato, T.; Irie, K.; Mishima, K.; Satho, T.; Aida, T.M.; Mishima, K. Rapid production of liposomes using high pressure carbon dioxide and direct ultrasonication. J. Supercrit. Fluids 2020, 160, 104782. [Google Scholar] [CrossRef]
  26. Mishima, K.; Kawakami, R.; Yokota, H.; Harada, T.; Kato, T.; Kawamura, H.; Matsuyama, K.; Mustofa, S.; Hasanah, F.; Siregar, Y.D.I.; et al. Extraction of Luteolin and Apigenin from leaves of Perilla frutescens (L.) Britt. with Liquid Carbon Dioxide. Solvent Extr. Res. Dev. Jpn. 2014, 21, 55–63. [Google Scholar] [CrossRef] [Green Version]
  27. Cristea, D.; Bareau, I.; Vilarem, G. Identification and quantitative HPLC analysis of the main flavonoids present in weld (Reseda luteola L.). Dye. Pigm. 2003, 57, 267–272. [Google Scholar] [CrossRef]
  28. Hojnik, M.; Škerget, M.; Knez, Ž. Isolation of chlorophylls from stinging nettle (Urticadioica L.). Sep. Purif. Technol. 2007, 57, 37–46. [Google Scholar] [CrossRef]
  29. Chemat, F.; Zill-e-Huma; KamranKhan, M. Applications of ultrasound in food technology: Processing, preservation and extraction. Ultrason. Sonochem. 2011, 18, 813–835. [Google Scholar] [CrossRef]
  30. Jessop, P.G.; Subramaniam, B. Gas-expanded liquids. Chem. Rev. 2007, 107, 2666–2694. [Google Scholar] [CrossRef]
  31. Nerome, H.; Ito, M.; Machmudah, S.; Wahyudiono; Kanda, H.; Goto, M. Extraction of phytochemicals from saffron by supercritical carbondioxide with water and methanol as entrainer. J. Supercrit. Fluids 2016, 107, 377–383. [Google Scholar] [CrossRef]
Figure 1. Schematic diagram of CO2-expanded liquid (CXL) extraction apparatus. (1) CO2 cylinder; (2) cooling unit; (3) filter; (4) pump; (5) pressure gauge; (6) safety valve; (7) high-pressure cell; (8) quartz glass window; (9) thermometer; (10) ultrasonic processor; (11) ultrasonic horn; (12) water bath; (13) pressure gauge; (14) safety valve; (15) cold traps; (16) gas flow meter; (V-1, V-5) back pressure regulators; and (V-2, V-6) stop valves.
Separations 08 00001 g001
Figure 2. HPLC-UV chromatograms of (a) extracted substances from gardenia fruit pulp using liquid CO2, 80% ethanol, and ultrasound at 25 °C and 10 MPa; (b) standard sample of crocin-1; (c) standard sample of crocin-2.
Separations 08 00001 g002
Figure 3. Extraction concentrations of crocin-1 and crocin-2 from gardenia fruit pulp using conventional solid–liquid extraction (SLE): (a) effect of different solvents on extraction concentration; (b) effect of ethanol concentration on extraction concentration at 25 °C under atmospheric pressure with (■) or without (■) direct sonication (125 s, 20% amplitude). Error bars represent means ± SE (n = 3). Letters on top of the columns represent significant differences among methods at the 0.05 level. (c) Effect of extraction time on extraction concentration of crocin-1 and crocin-2 in conventional SLE system using 80% ethanol at 25 °C under atmospheric pressure.
Separations 08 00001 g003
Figure 4. Effect of different modifiers on extraction concentration of crocin-1 and crocin-2 in CO2-expanded liquid (CXL) extraction system with (■) or without (□) direct sonication (125 s, 20% amplitude) at 25 °C and 10 MPa. Error bars represent means ± SE (n = 3). Letters on top of the columns represent significant differences among methods at the 0.05 level.
Separations 08 00001 g004
Figure 5. Effects of (a) temperature and (b) pressure on extraction concentration of crocin-1 and crocin-2 from gardenia fruit pulp in CXE80% extraction system at 25 °C and 10 MPa obtained with (■) and without (▲) ultrasound (amplitude 20%, 125 s). Error bars represent means ± SE (n = 3).
Separations 08 00001 g005
Figure 6. Effect of sonication time on extraction concentration of crocin-1 and crocin-2 in CXE80% extraction system with direct sonication (125 s, 20% amplitude) at 25 °C and 10 MPa. Error bars represent means ± SE (n = 3).
Separations 08 00001 g006
Figure 7. SEM 1000 images of (a) raw gardenia fruit pulp powder; (b) sample after SLE using 80% ethanol; (c) sample after CXE80% extraction; (d) sample after CXE80% extraction with direct sonication.
Separations 08 00001 g007
Figure 8. Phase behavior observed upon addition of CO2 (25 °C 10 MPa) to different modifiers: (a) ethanol in CXE extraction system; (b) water in CXW extraction system; (c) 80% ethanol in CXE80% extraction system; (d) CXE80% extraction system during ultrasonication assistance (UA); (e) CXE80% extraction system after UA. Schematic diagrams above visual observations depict them as EtOH-rich or water- and CO2-rich conditions.
Separations 08 00001 g008
Table 1. Time course of methanol gradient for HPLC-UV analysis.
Time (min)Methanol (vol%)
05
2540
4060
5090
6090
655
755
Table 2. Validation parameters. RSD, relative standard deviation.
ParameterCrocin-1Crocin-2
LinearityConcentration range of crocin-1 standards (μg/mL)2.25–36.00.125–2.0
Correlation coefficient of linearity equation0.99950.9997
Intercept of linearity equation17439−8999.8
Slope of linearity equation2.0 × 1084.0 × 108
Limit of detection (μg/mL)0.340.01
Limit of quantification (μg/mL)1.130.04
PrecisionIntra-day (RSD, % of peak area, n = 3)
Day 12.741.84
Day 22.750.53
Day 31.091.52
Inter-day (RSD, % of peak area n = 3)3.471.05
Table 3. Extraction conditions and concentrations using different methods.
Extraction MethodsExtraction ConditionsConcentration
SolventModifierT
(°C)
P
(MPa)
t
(min)
US ampl.
(%)
Crocin-1
(μg/mL)
Crocin-2
(μg/mL)
Solid–liquidMethanol-250.160-b 10.43 ± 0.31c 0.37 ± 0.02
Ethanol-250.160-a 0.76 ± 0.17a 0.08 ± 0.01
Water-250.160-b 6.93 ± 0.21b 0.22 ± 0.002
Con. UAEMethanol-400.140-b 12.08 ± 0.35a 0.46 ± 0.02
Ethanol-400.140-a 3.36 ± 0.31c 0.17 ± 0.01
Water-400.140-b 10.22 ± 0.35c 0.33 ± 0.01
CXLsLiquid CO2Ethanol251060-a 1.64 ± 0.23a 0.11 ± 0.03
Liquid CO2Water251060-b 7.84 ± 0.32b,c 0.25 ± 0.02
Liquid CO250% Ethanol251060-b,c 11.57 ± 0.12c,d 0.42 ± 0.03
Liquid CO280% Ethanol251060-b,c 10.77 ± 0.29c,d 0.41 ± 0.01
CXLs + DSLiquid CO2Ethanol25106020%a 2.63 ± 0.13a 0.13 ± 0.01
Liquid CO2Water25106020%b 8.25 ± 0.34b 0.26 ± 0.02
Liquid CO250% Ethanol25106020%b,c,d 12.91 ± 0.75d 0.52 ± 0.03
Liquid CO280% Ethanol25106020%d 13.63 ± 0.52d,e 0.51 ± 0.05
Mean values in the same column with different letters are significantly different at p < 0.05. Con. UAE, conventional ultrasonic-assisted extraction; CXLs, carbon dioxide expanded liquids; DS, direct sonication; US ampl., ultrasonication amplitude.
Publisher’s Note: MDPI stays neutral with regard to jurisdictional claims in published maps and institutional affiliations.

