Article

Chromatographic Profiling with Machine Learning Discriminates the Maturity Grades of Nicotiana tabacum L. Leaves

1
Yunnan Academy of Tobacco Agricultural Sciences, Kunming 650021, China
2
College of Chemistry and Chemical Engineering, Central South University, Changsha 410083, China
*
Authors to whom correspondence should be addressed.
Yi Chen and Miao Tian contributed equally.
Submission received: 28 December 2020 / Revised: 8 January 2021 / Accepted: 13 January 2021 / Published: 19 January 2021
(This article belongs to the Special Issue Chromatographic Analysis of Biological Samples)

Abstract

:
Nicotiana tabacum L. (NTL) is an important agricultural and economical crop. Its maturity is one of the key factors affecting its quality. Traditionally, maturity is discriminated visually by humans, which is subjective and empirical. In this study, we concentrated on detecting as many compounds as possible in NTL leaves from different maturity grades using ultra-performance liquid chromatography ion trap time-of-flight mass spectrometry (UPLC-IT-TOF/MS). Then, the low-dimensional embedding of LC-MS dataset by t-distributed stochastic neighbor embedding (t-SNE) clearly showed the separation of the leaves from different maturity grades. The discriminant models between different maturity grades were established using orthogonal partial least squares discriminant analysis (OPLS-DA). The quality metrics of the models are R2Y = 0.939 and Q2 = 0.742 (unripe and ripe), R2Y = 0.900 and Q2 = 0.847 (overripe and ripe), and R2Y = 0.972 and Q2 = 0.930 (overripe and unripe). The differential metabolites were screened by their variable importance in projection (VIP) and p-Values. The existing tandem mass spectrometry library of plant metabolites, the user-defined library of structures, and MS-FINDER were combined to identify these metabolites. A total of 49 compounds were identified, including 12 amines, 14 lipids, 10 phenols, and 13 others. The results can be used to discriminate the maturity grades of the leaves and ensure their quality.

1. Introduction

Nicotiana tabacum L. (NTL) is a Solanaceae plant with important economic significance. Maturity of the NTL leaves is the primary factor for grading, which is an important index to measure the quality [1]. If the maturity grade of the leaves can be determined accurately and the right time for harvesting can be chosen precisely, the field loss rate and curing loss rate of the leaves can be reduced significantly. Studies have indicated that the ripe leaves have fully developed leaves, loose tissue structure, coordinated chemical components, and rich aroma substances [2]. At present, the maturity grade of the leaves generally was distinguished visually by the experts, which is highly subjective and empirical. Hence, it is important and necessary to study the differences in metabolites of the leaves from different maturity grades.
Metabolomics is playing an important role in the study of the metabolic process to reveal the essence of life’s activities [3]. Metabolomics mainly studies small molecular metabolites (molecular weight < 1000) produced by various metabolic pathways. So far, several methods have been established for untargeted metabolomic analysis of plant extracts, including gas chromatography coupled to mass spectrometry (GC-MS) [4], capillary electrophoresis mass spectrometry (CE-MS) [5], and liquid chromatography mass spectrometry (LC-MS) [6]. GC-MS is suitable for the analysis of thermally stable volatile compounds, which were involved in primary metabolism [7]. CE-MS is suitable for separation of polar compounds and charged compounds [8]. LC-MS is a versatile tool for metabolite profiling of plants owing to its effective separation and sensitive detection abilities, and it was used to analyze many semi-polar compounds, including secondary metabolites such as alkaloids, phenolic acids, flavonoids, glucosinolates, ployamines, and their derivatives [7,8,9,10,11,12]. A detailed protocol for large-scale untargeted metabolomic analysis of plant using LC-MS had been proposed [7]. There were also studies on the application of metabolomics in NTL [13,14,15]. The metabolic profiles of the NTL leaves from different geographic sources were systematically studied [16]. Some differential metabolites related to the planting area and climatic factors were screened out [17,18].
Simultaneous separation and detection of metabolites using LC-MS will generate complex datasets, which requires preprocessing of the data before statistical analysis for multiple samples. To preprocess the metabolomic dataset effectively, several preprocessing tools had been developed for LC-MS, such as MetAlign [19], MZmine [20], and XCMS [21]. All these tools are freely available including their source code [22]. MetAlign is a powerful tool for preprocessing of LC-MS experimental data, including automatic format conversion, baseline correction, peak detection, and alignment of up to 1000 data files [19]. MZmine supports several stages of data preprocessing, including spectral filtering, peak detection, alignment, and normalization [20,23]. XCMS is the most common preprocessing tool in the metabolomics. It combines peak detection and retention time alignment, groups the peaks, and generates the peak table for further statistical analysis [21,24]. With the peak table, the samples can be visualized and classified. t-distributed stochastic neighbor embedding (t-SNE) is a nonlinear dimensionality reduction method, which can embed the high-dimensional data into two or three dimensions for visualization. Compared with principal component analysis (PCA) [25], t-SNE is a more advanced and effective method [26]. The classification between samples is based on the existence of some differential metabolites, so it is necessary to build the discriminant models using the machine learning methods and find these differential metabolites. Orthogonal partial least squares discriminant analysis (OPLS-DA) extends the supervised partial least squares discriminant analysis (PLS-DA) by integrating the orthogonal signal correction [27]. Compared with PLS-DA, OPLS-DA can separate informative variation from orthogonal variation to improve the interpretability of models [28]. The differential metabolites can be screened through the variable importance in projection (VIP) of the OPLS-DA model. At present, the identification of metabolites is mainly through the search of several spectral databases, including METLIN [29], LIPID MAPS [30], and MassBank [31]. However, the identification of the metabolites in plant is still challenging because of the large number of unknown metabolites. The annotation of a large number of unknown metabolites is considered to be one of the most difficult problems in metabolomics [32].
In this study, we have developed a method to analyze and identify the metabolites in flue-cured NTL leaves. The schematic diagram of this method was depicted in Scheme 1. Metabolomic analysis was performed on the leaves from three different maturity grades using UPLC-IT-TOF/MS. Rich chemical information in the leaves were extracted from an LC-MS dataset by data preprocessing and statistical analysis methods. In order to achieve the relatively accurate identification, we built the user-defined structure library and took advantage of MS-FINDER to identify differential metabolites. The results of the identification of differential metabolites can be used to distinguish the maturity stages of leaves and ensure their quality. In addition, the self-built library can be used for the identification of Solanaceae metabolites in the future.

2. Materials and Methods

2.1. Materials and Reagents

Forty-five samples from different maturity grades were provided by Yunnan Academy of Tobacco Agricultural Sciences (Kunming, China). These NTL leaves were picked and waved in the conventional harvest period for middle leaves in the local area, to ensure the equilibrium and consistency of NTL leaves maturity and quality with moderate density. These NTL leaves were flue-cured in a local bulk curing barn. The flue-curing was performed by the most common curing mode in the region (Figure 1). Additionally, 100 to 120 NTL leaves were weaved in each rod, and a total of three layers were set; in each layer, there were 150 to170 rods.
Cured NTL leaves were used for metabolic profiling analyses, including 15 unripe samples, 15 ripe samples, and 15 overripe samples. The detailed information of NTL leaves of different maturity stages is shown in Table 1.
Acetonitrile (ACN) (HPLC gradient grade, ≥99.9%), methanol (MeOH) (HPLC gradient grade, ≥99.9%), and formic acid (FA) (HPLC gradient grade, ≥98%) were purchased from Merck (Darmstadt, Germany). Purified water was purchased from Wahaha Company (Guangzhou, China).

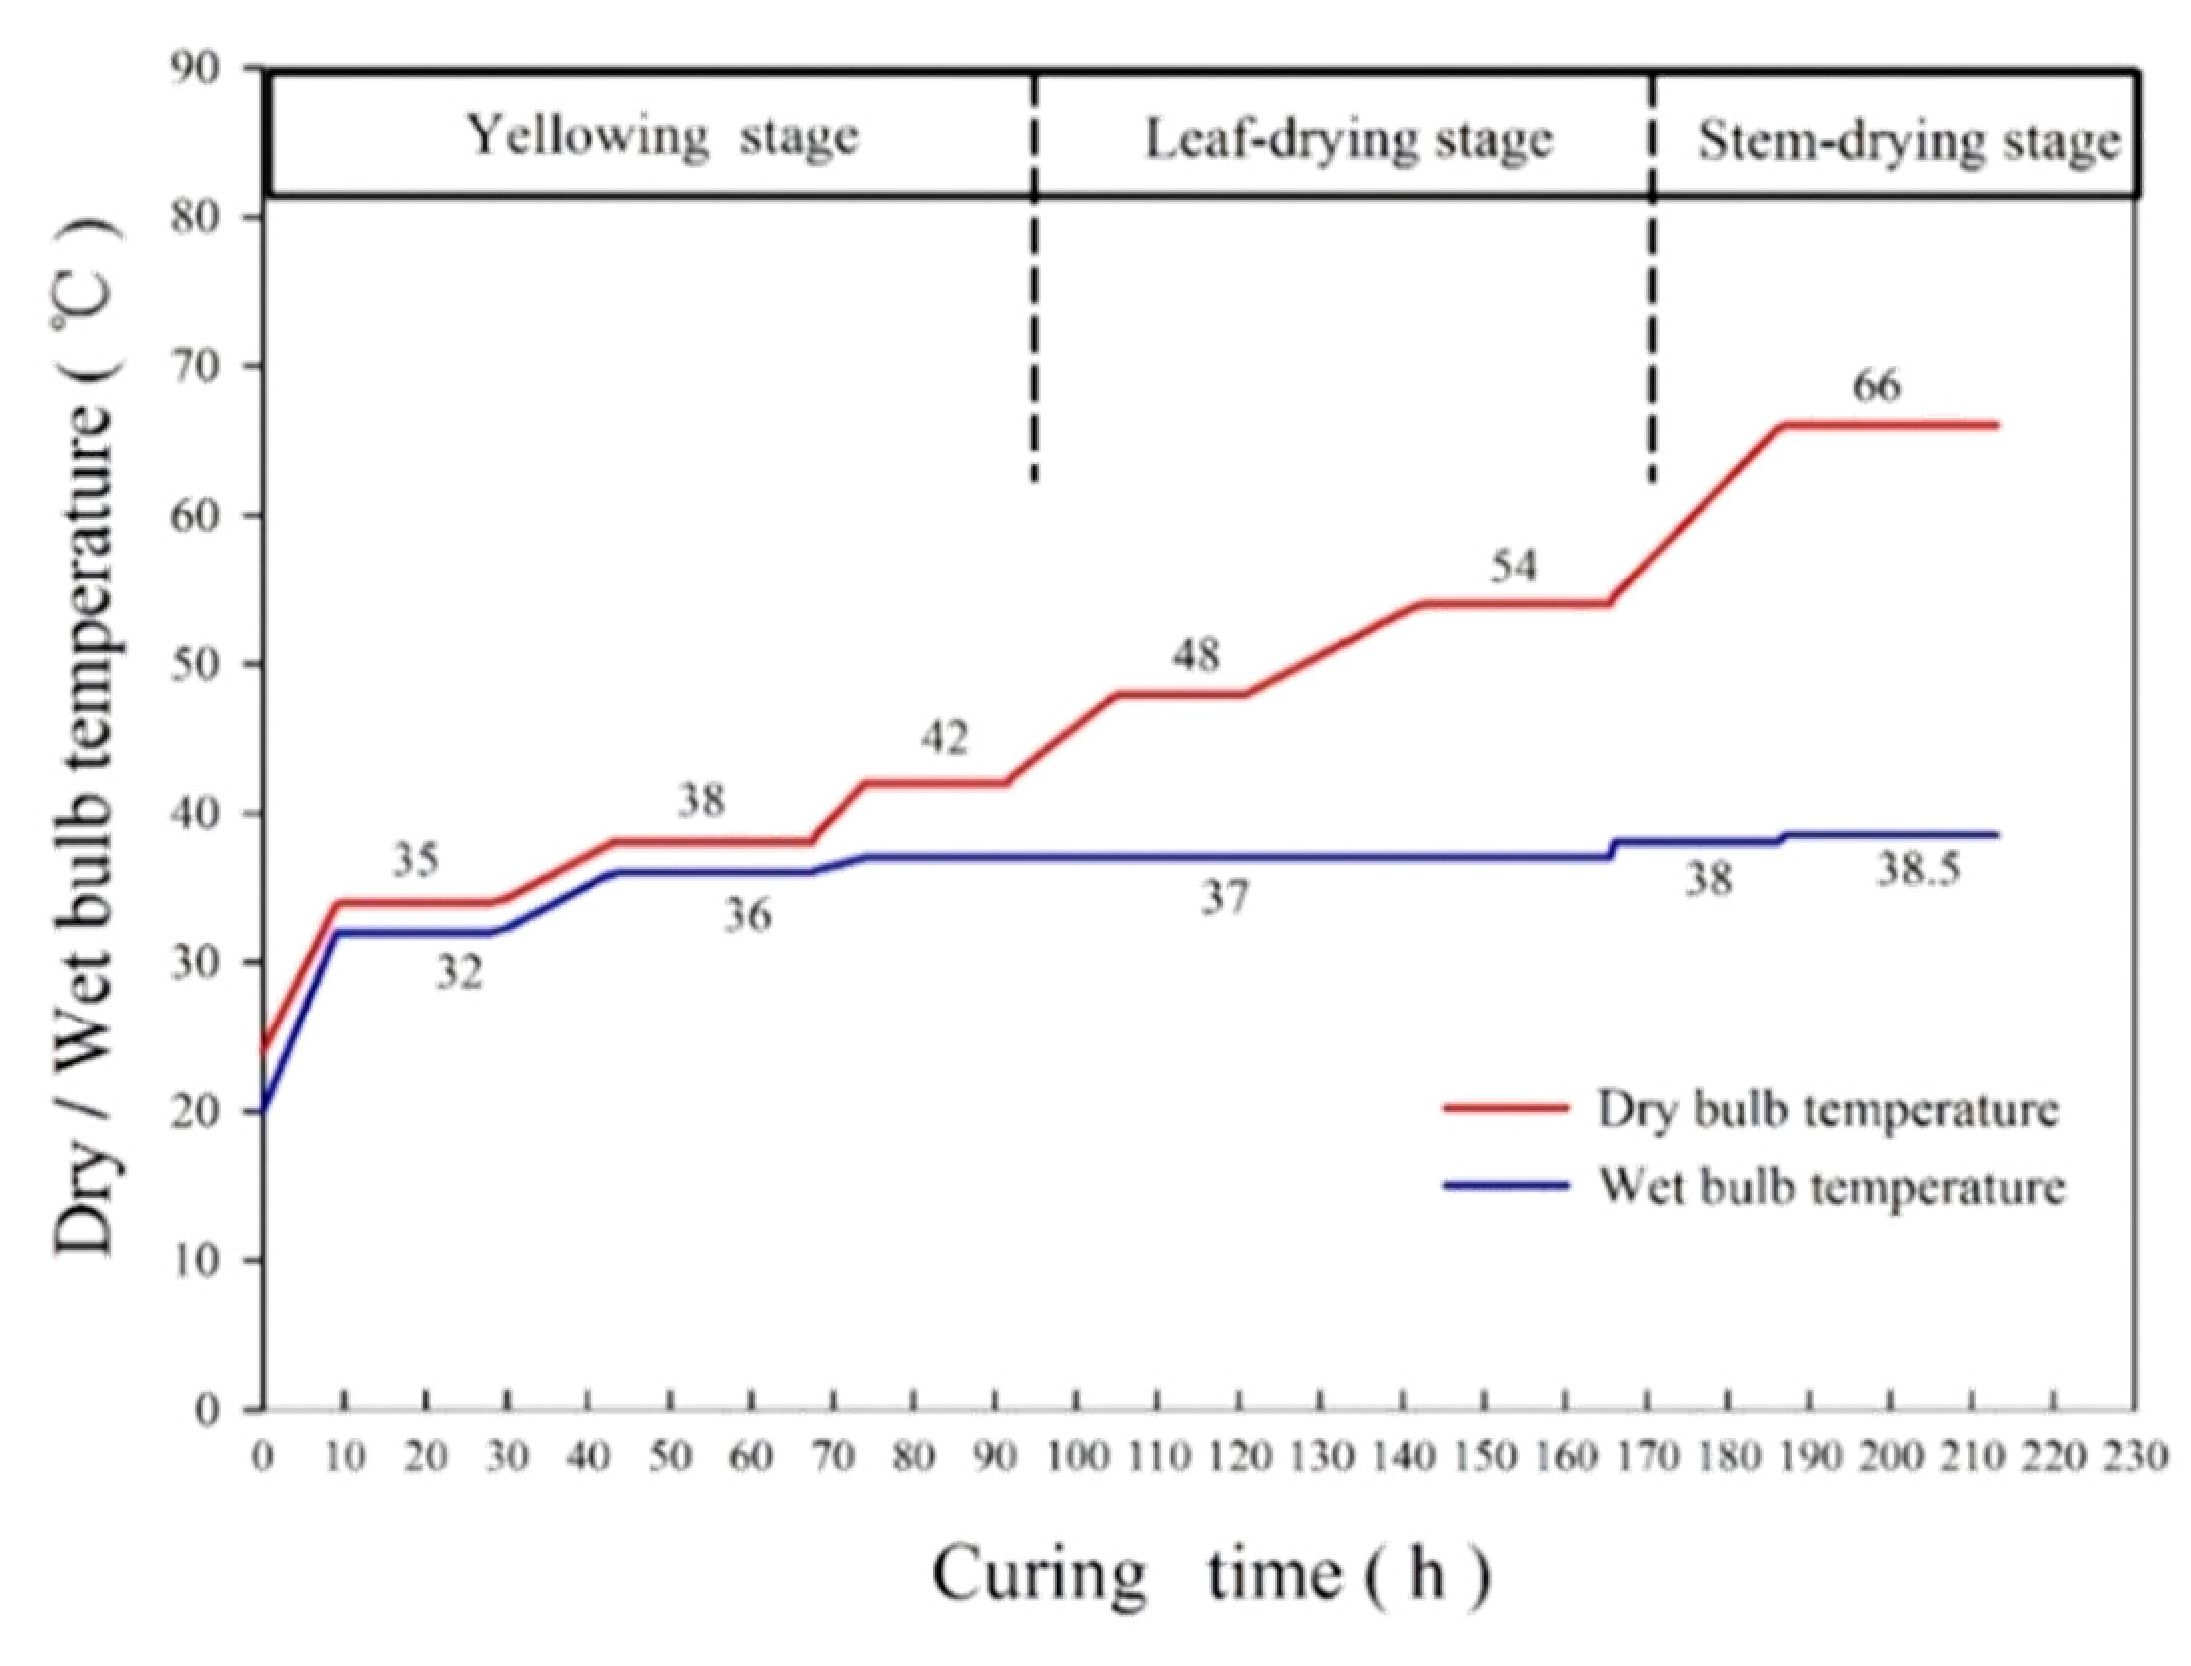
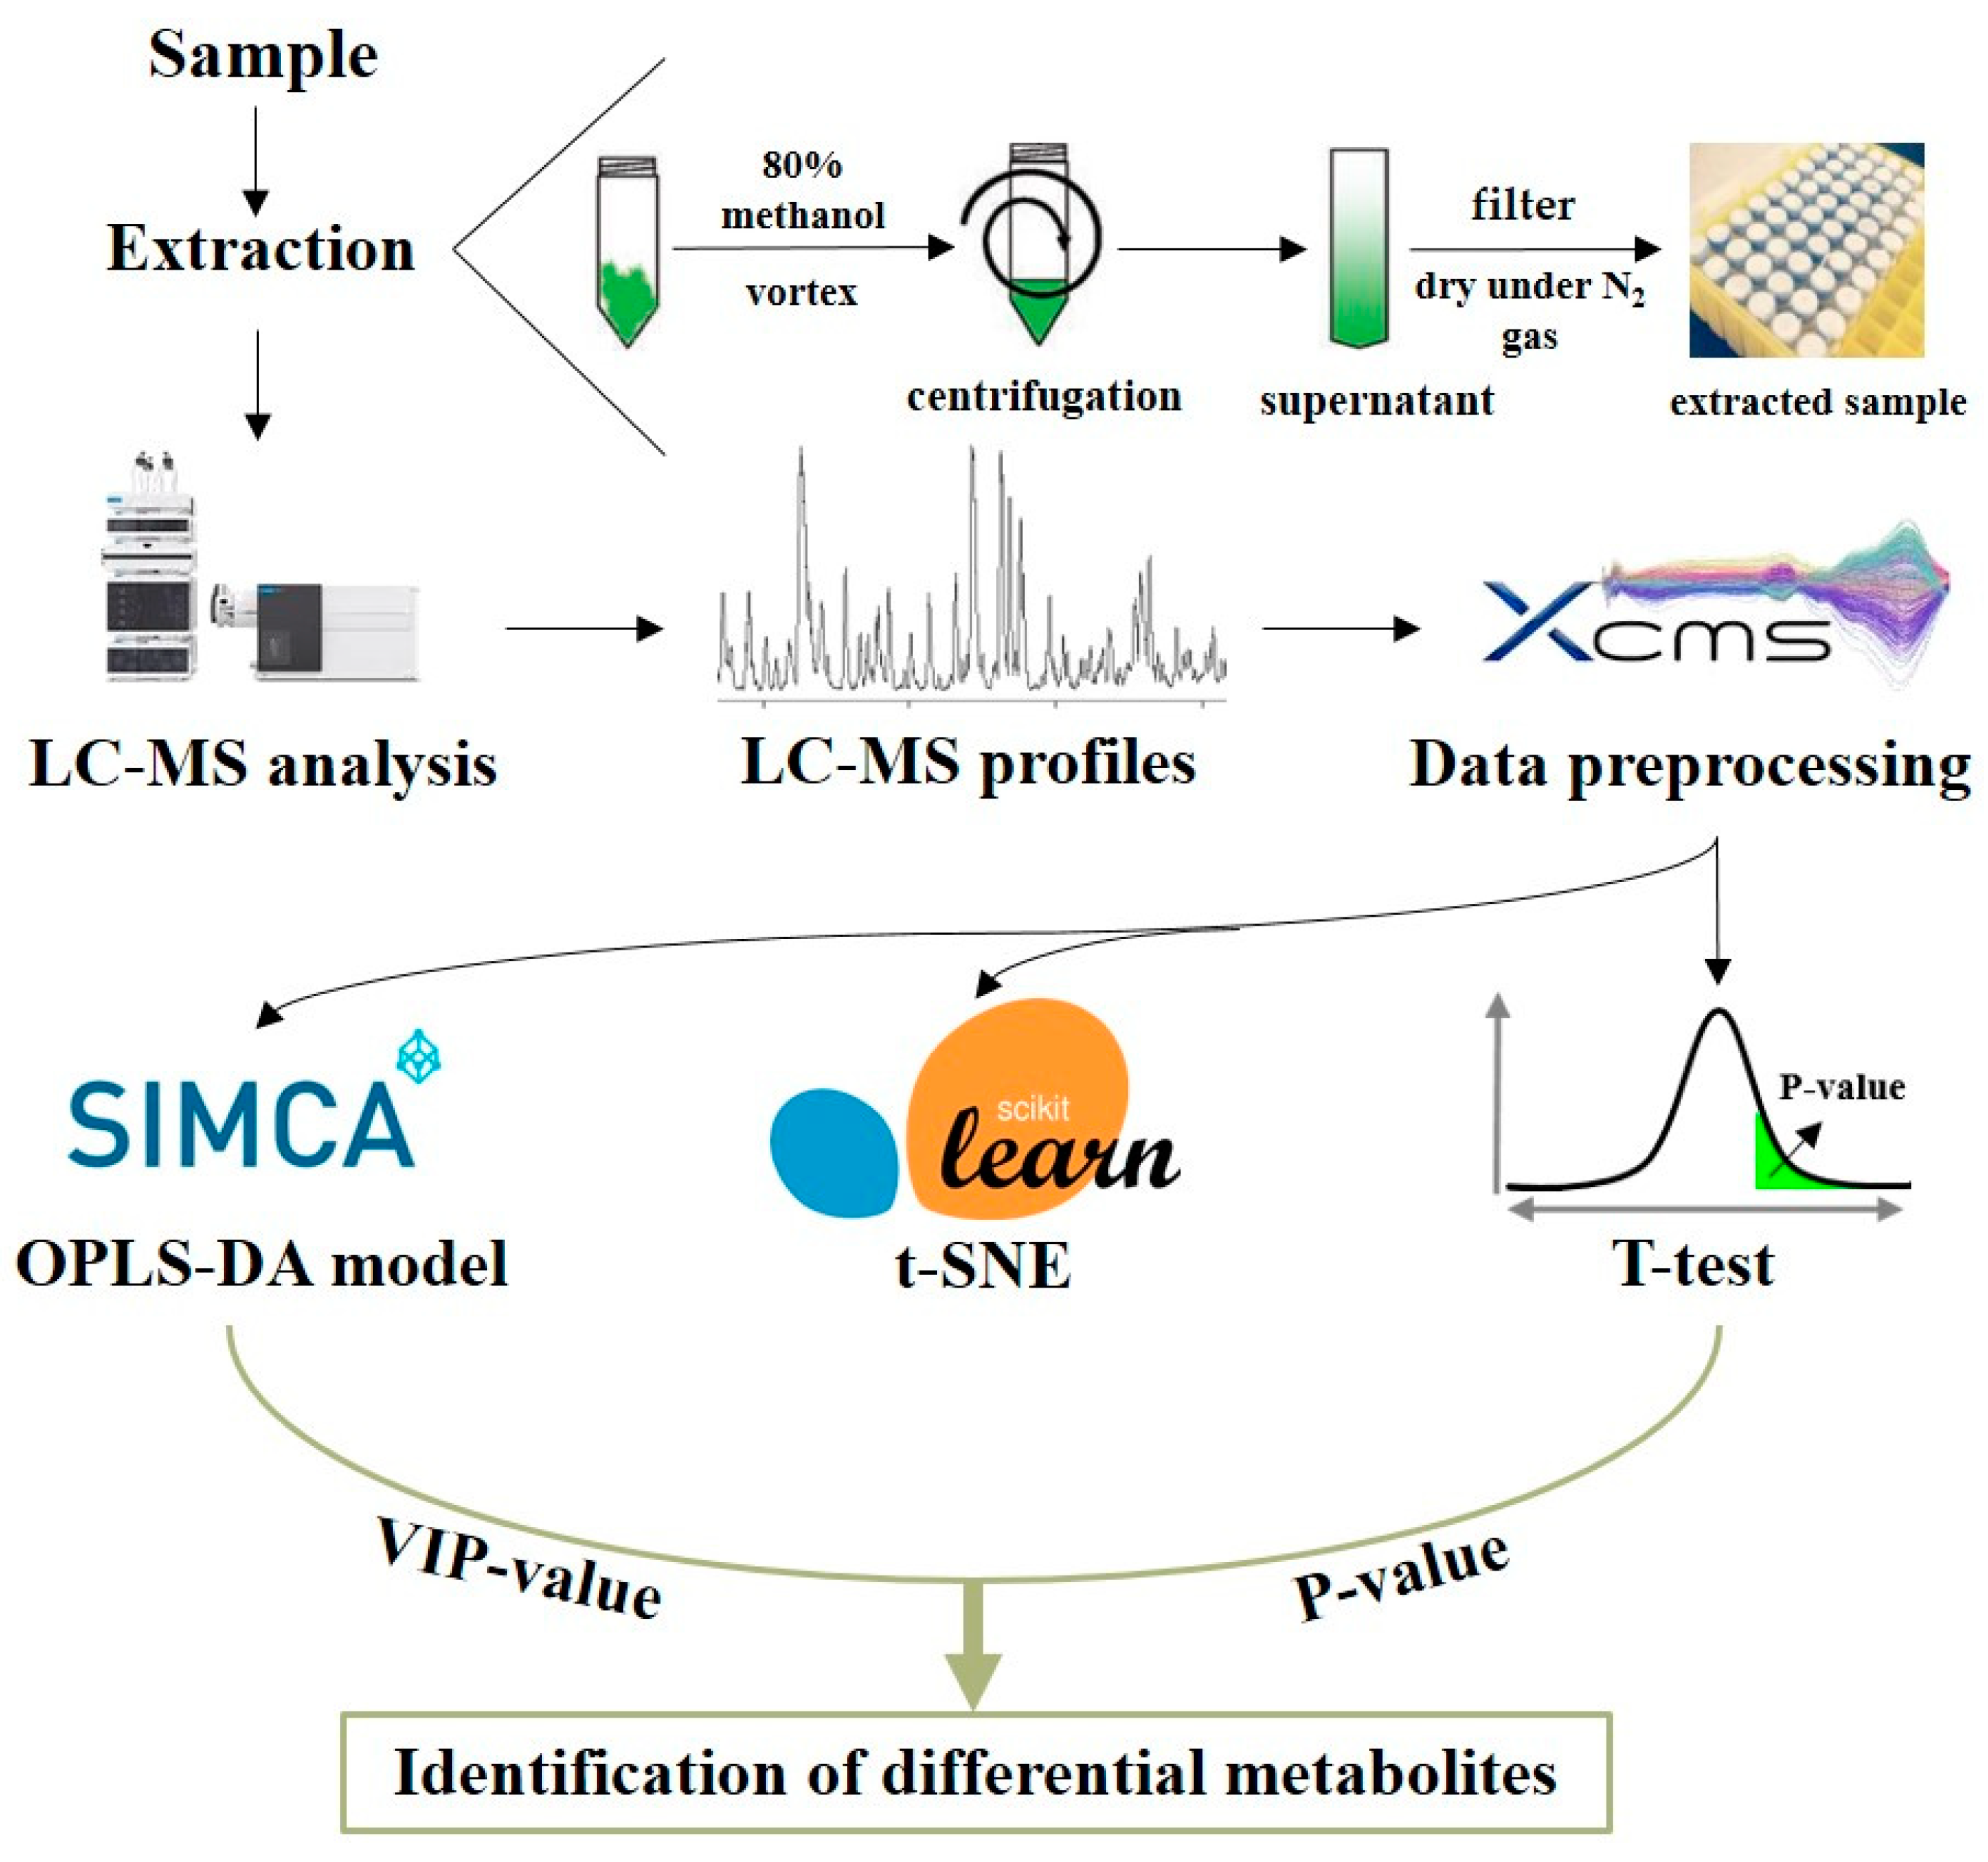
2.2. Sample Preparation

The NTL leaves were ground to powder and filtered through a 40-mesh sieve. A total of 100 milligrams powdered sample was transferred to a 2 mL Eppendorf tube, and then 1 mL of aqueous methanol solution was added to the tube. Samples were vortexed for 20 s, sonicated for 30 min, and centrifuged at 4 °C for 10 min at 16,000 g. After centrifugation, the supernatant was obtained and passed through a syringe filter (0.22 μm pore size). Then, the solvent was evaporated under a stream of N2 gas at room temperature. The dried sample was resolved in 300 μL extraction solvent before LC-MS analysis.
In addition, quality control (QC) samples were prepared by mixing equal amounts of all the analyzed samples and were added at the beginning of the sequence to equilibrate the system and every nine samples to further monitor the stability of the analysis [16].

2.3. LC-MS Analysis

The sample was analyzed with a LC-30AD UPLC system (Shimadzu, Tokyo, Japan) coupled with an IT-TOF MS (Shimadzu, Tokyo, Japan). The LC-MS system was controlled by the LCMS solution 3.70 software (Shimadzu, Tokyo, Japan).
The injection volume was 2 μL, and the column temperature was set to 40 °C. The ultra-performance liquid chromatography column was ACQUITY UPLC BEH C18 (100 nm × 2.1 mm, 1.7 μm, Waters Corporation, Milford, MA, USA). The mobile phase was constituted by acetonitrile acidified with 0.1% formic acid (eluent A) and water acidified with 0.1% formic acid (eluent B). The gradient elution program was at a constant flow rate of 0.3 mL/min of 95–90% B over 0.01–10.0 min, 90–80% B over 10.0–20.0 min, 80–65% B over 20.0–30.0 min, held constant at 65–58% B over 30.0–33.0 min, 58–50% B over 33.0–35.0 min, 50–20% B over 35.0–40.0 min, and a final wash at 20–0% B over 40.0–48.0 min. The total elution time was 48 min.
The mass spectrometer was operated within the m/z range of 50–1000 for MS1 and automatic multiple stage fragmentation scan modes for MS/MS spectra. The CDL temperature was set to 200 °C, and the heating block temperature was set to 200 °C, the nebulizing gas (N2) flow rate was 1.5 L/min, the drying gas (N2) pressure was set to 100 kPa, ion trap pressure was set to 1.8 × 10⁻⁵ kPa, and the ion accumulation time was 60.0 ms. Detector voltage was set at 1.62 kV. RP vacuum degree was set to 85.0–92.0 Pa, IT vacuum degree was set to 1.8 × 10⁻² Pa, TOF vacuum degree was set to 1.3 × 10⁻⁴ Pa. Collision energy was set at 50%.

2.4. Data Preprocessing

Raw data were exported in mzData format by LCMS Solution-Browser (Shimadzu, Tokyo, Japan). Prior to preprocessing, the exported data were converted to mzML files, and centroided using OpenMS [33]. Then, the mzML files were read into R terminal (version = 4.0.2) using the MSnbase package (version = 2.15.8), and the LC-MS data were preprocessed using xcms package (version = 3.11.3) [21]. The preprocessing consisted of chromatographic peak detection, peak alignment, and correspondence between different samples. A list of metabolic features with mass, retention time, and abundance were obtained. The alignment results followed the “80% rule” [34]. Replacement of the missing value and data normalization were performed by Metaboanalyst R (version = 2.0.2) [35], and peak table with label and category were exported for further analysis.

2.5. Machine Learning Models of Maturity Grades

Peak table were further processed by SIMCA-P (version 14.1, Umetrics AB, Umea, Sweden) for multivariate data analysis [36]. PCA was employed to reduce dimensionality and evaluate data quality. The t-SNE was employed to visualize the leaves from different maturity grades. A detailed description of the t-SNE method is described in Method S1. The OPLS-DA models were built to predict the maturity grades of the leaves. The detail of the OPLS-DA method is described in Method S2. The differential features were screened out by variable importance in projection (VIP) values of >1. Meanwhile, variables with significant differences (Probability, p < 0.05) of t-test were selected between different grades. The p value is the probability. When p < 0.05, it indicates a significant difference. Hierarchical cluster analysis (HCA) was performed on differential metabolites of different maturity grades by the heatmap package in R (version = 4.0.2) programming language.

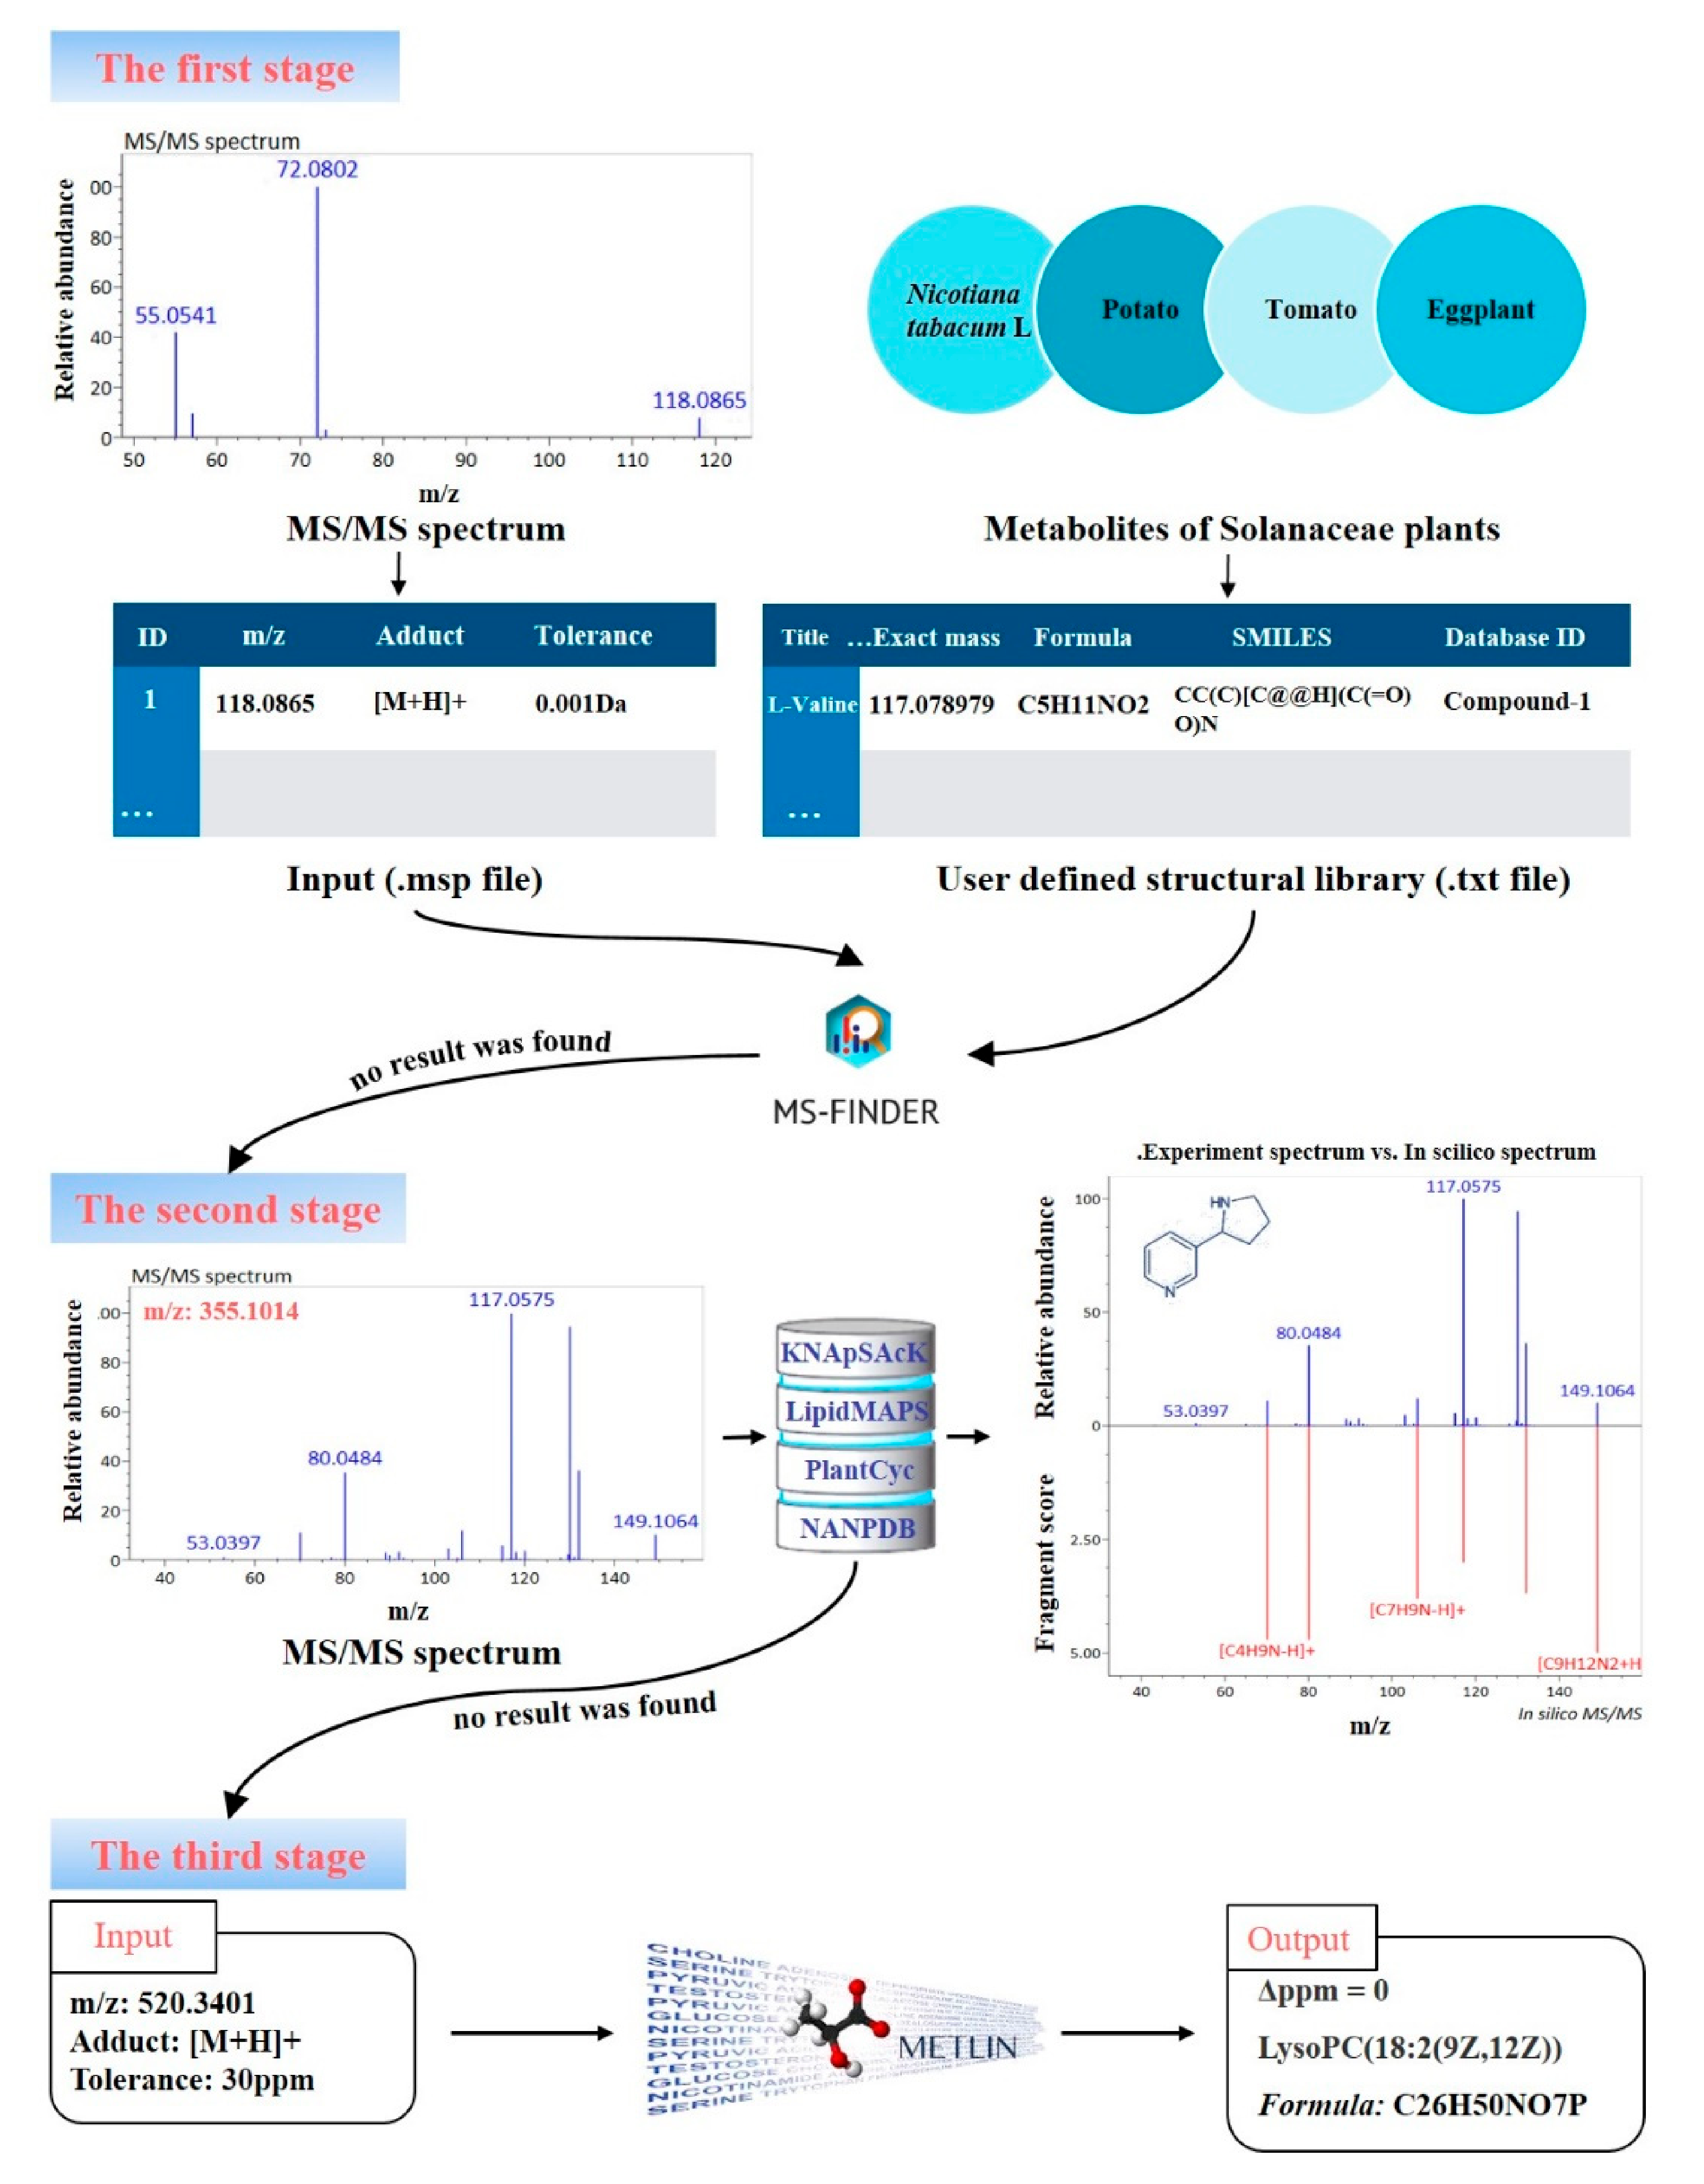
2.6. Identification of Metabolites

The features were selected as potential differential features based on the values of VIP > 1.0 and p < 0.05. Since the coverage of metabolites for MS/MS library was not comprehensive enough, the searching results of the library were not accurate and often required further verification. The same plant family or closely related families had chemical substances of the same or similar structures. Based on the articles on metabolomic studies of Solanaceae plants [1,9,15,16,17,37,38,39,40,41,42,43,44,45,46,47,48,49,50,51,52,53,54,55,56], the user-defined library of plant metabolites was established. MS-FINDER was used as the identification tool of metabolites. Tandem mass spectra of differential metabolites were stored in MSP format. Then, it was imported into MS-FINDER [57] for identification. The existing library of plant metabolites and the user-defined library were combined together to identify these differential metabolites. The details of MS-FINDER software are described in Method S3. The detailed information of the user-defined library is listed in Table S5.
In this study, the differential metabolites were identified by a procedure consisting of three stages (Figure 2). At the first stage, metabolites were identified by comparing MS/MS information of features with in silico MS/MS spectrum predicted from the molecular structures in the user-defined library. At the second stage, MS/MS information of features was matched with that of predicted/reported fragments from some local databases in MS-FINDER, for example the PlantCyc, LIPID MAPS, and KNApSAcK. At the third stage, metabolites were putatively identified by comparing the accurate m/z value of the feature with the metabolites in METLIN for features, and the candidate with the lowest difference in parts per million was selected.

3. Results

3.1. Development of the Analytical Method

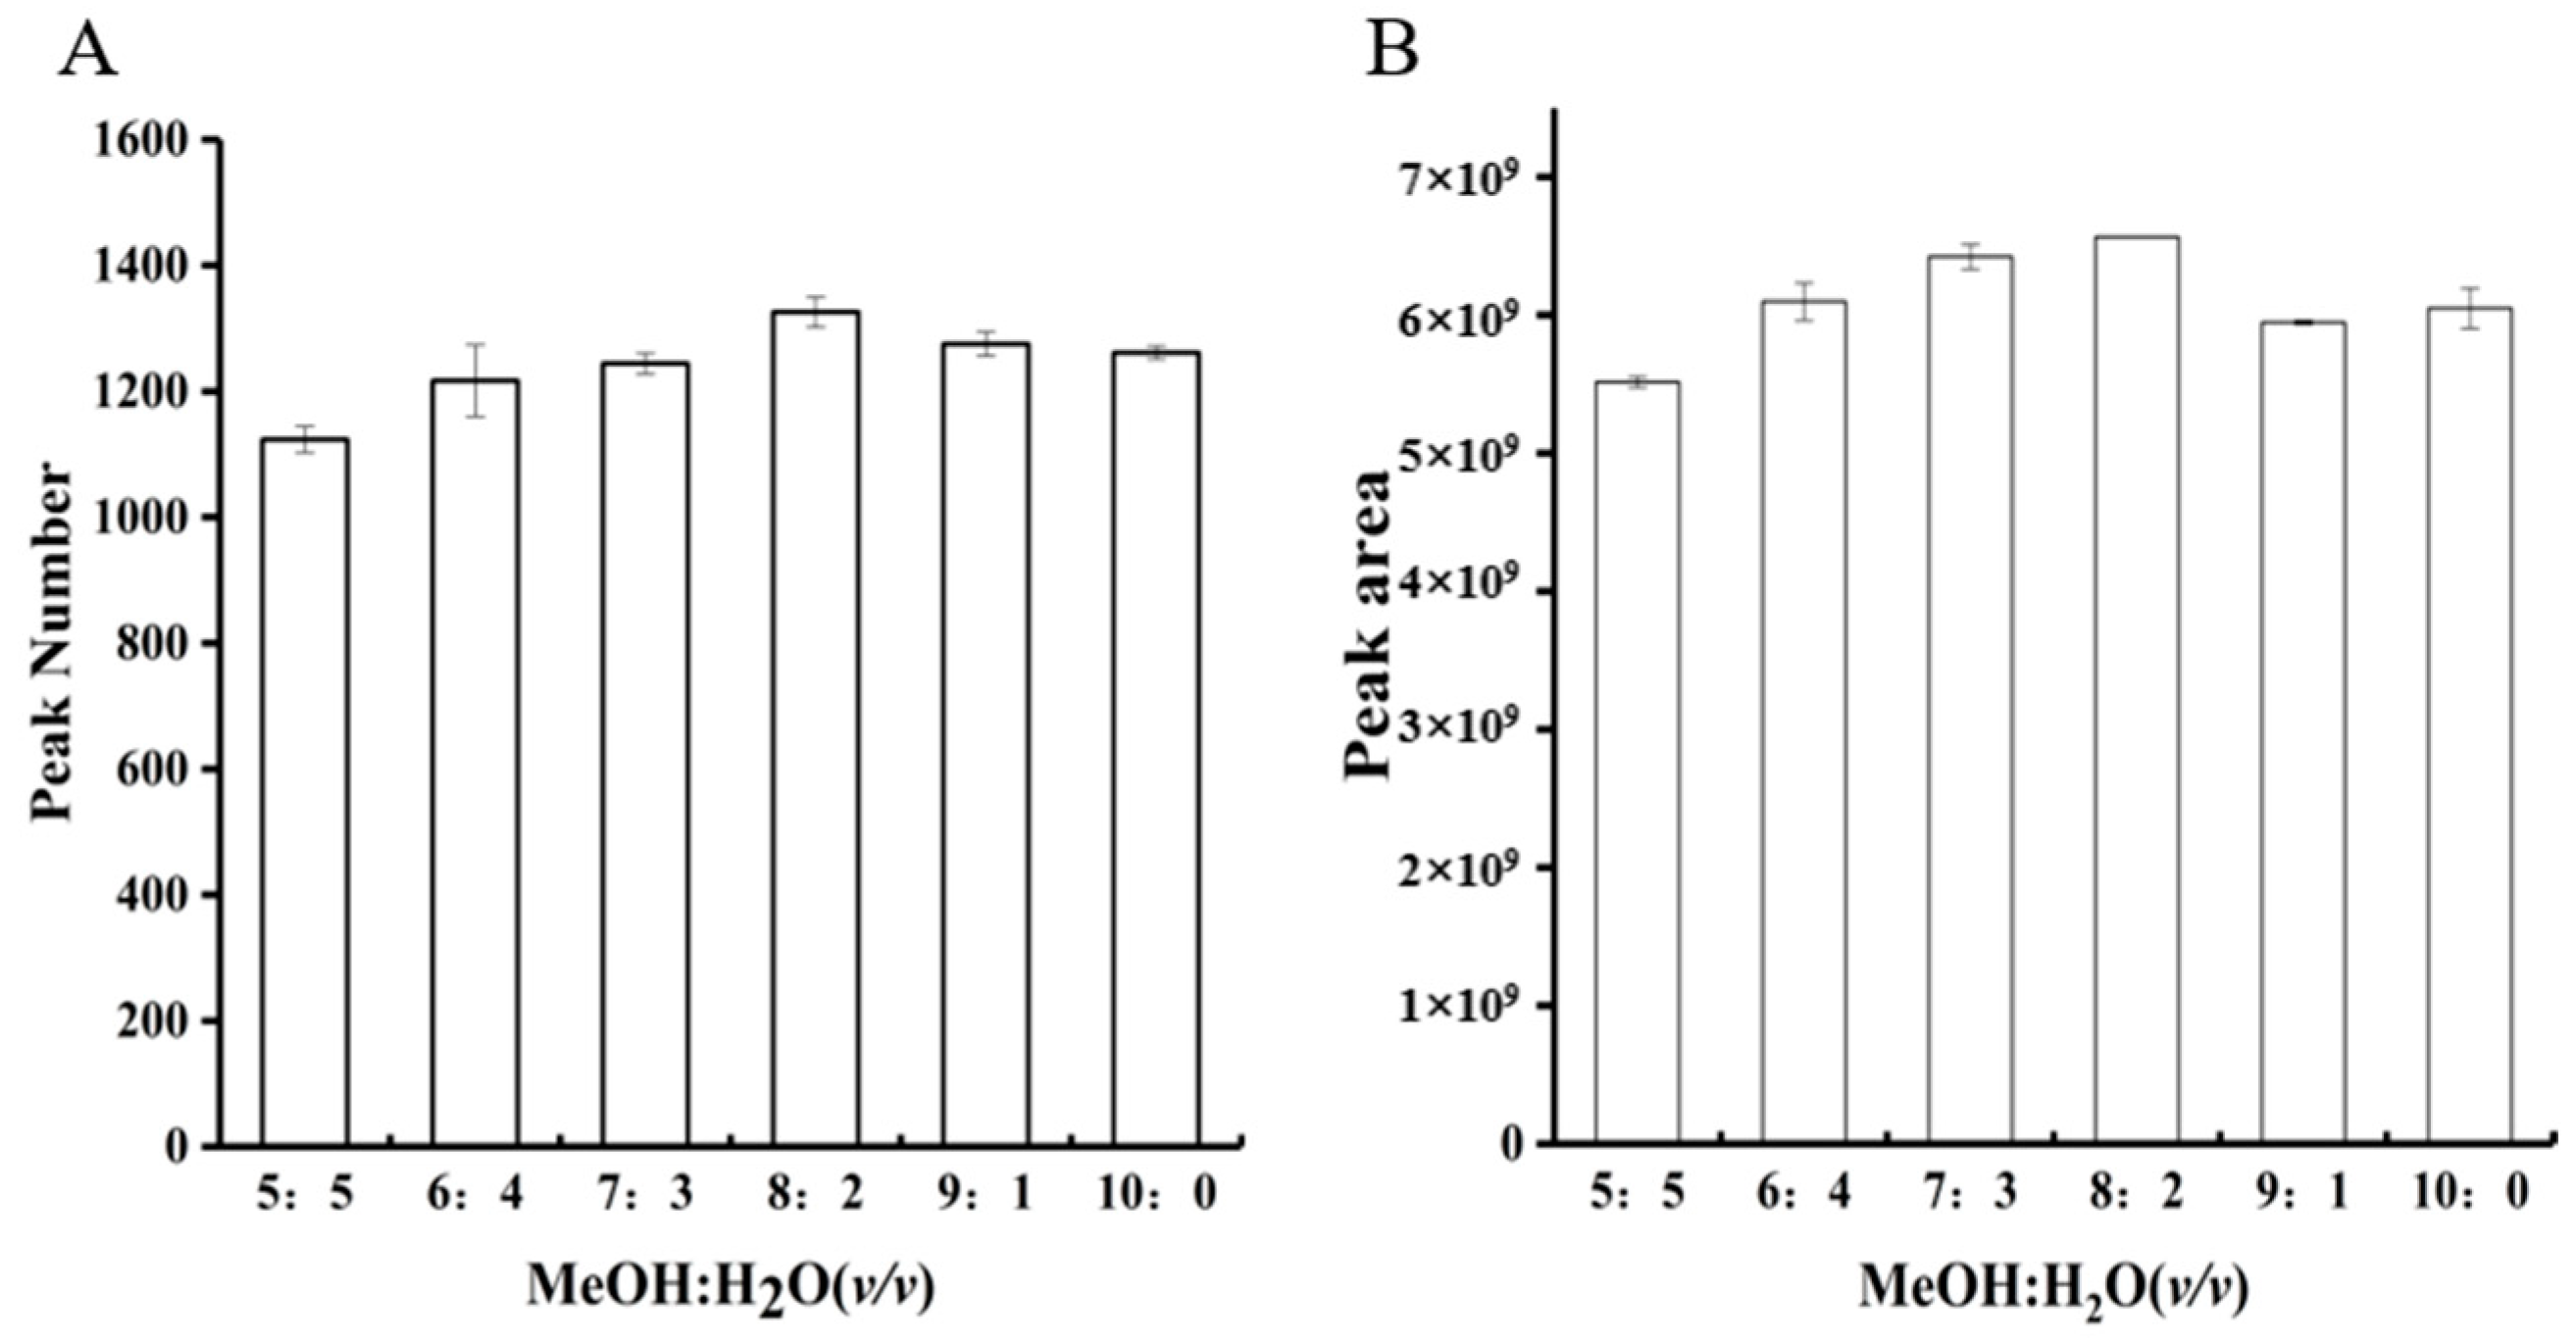
3.1.1. Extraction Solvent Optimization

The extraction procedure is important for the detection of small metabolites in the NTL leaves. Single solvent is difficult to extract different metabolites. Methanol solution is an effective solvent system to extract metabolites for large-scale plant metabolomic studies [7,58]. In this study, the ratio of methanol/water were optimized for extraction experiments, and six different solvent ratios (5:5, 6:4, 7:3, 8:2, 9:1, 10:0, v/v) were studied. Here, the peak number and area were treated as the criteria to evaluate the extraction efficiency. One can see from Figure 3A,B that methanol/water (8:2, v/v) has the best efficiency.

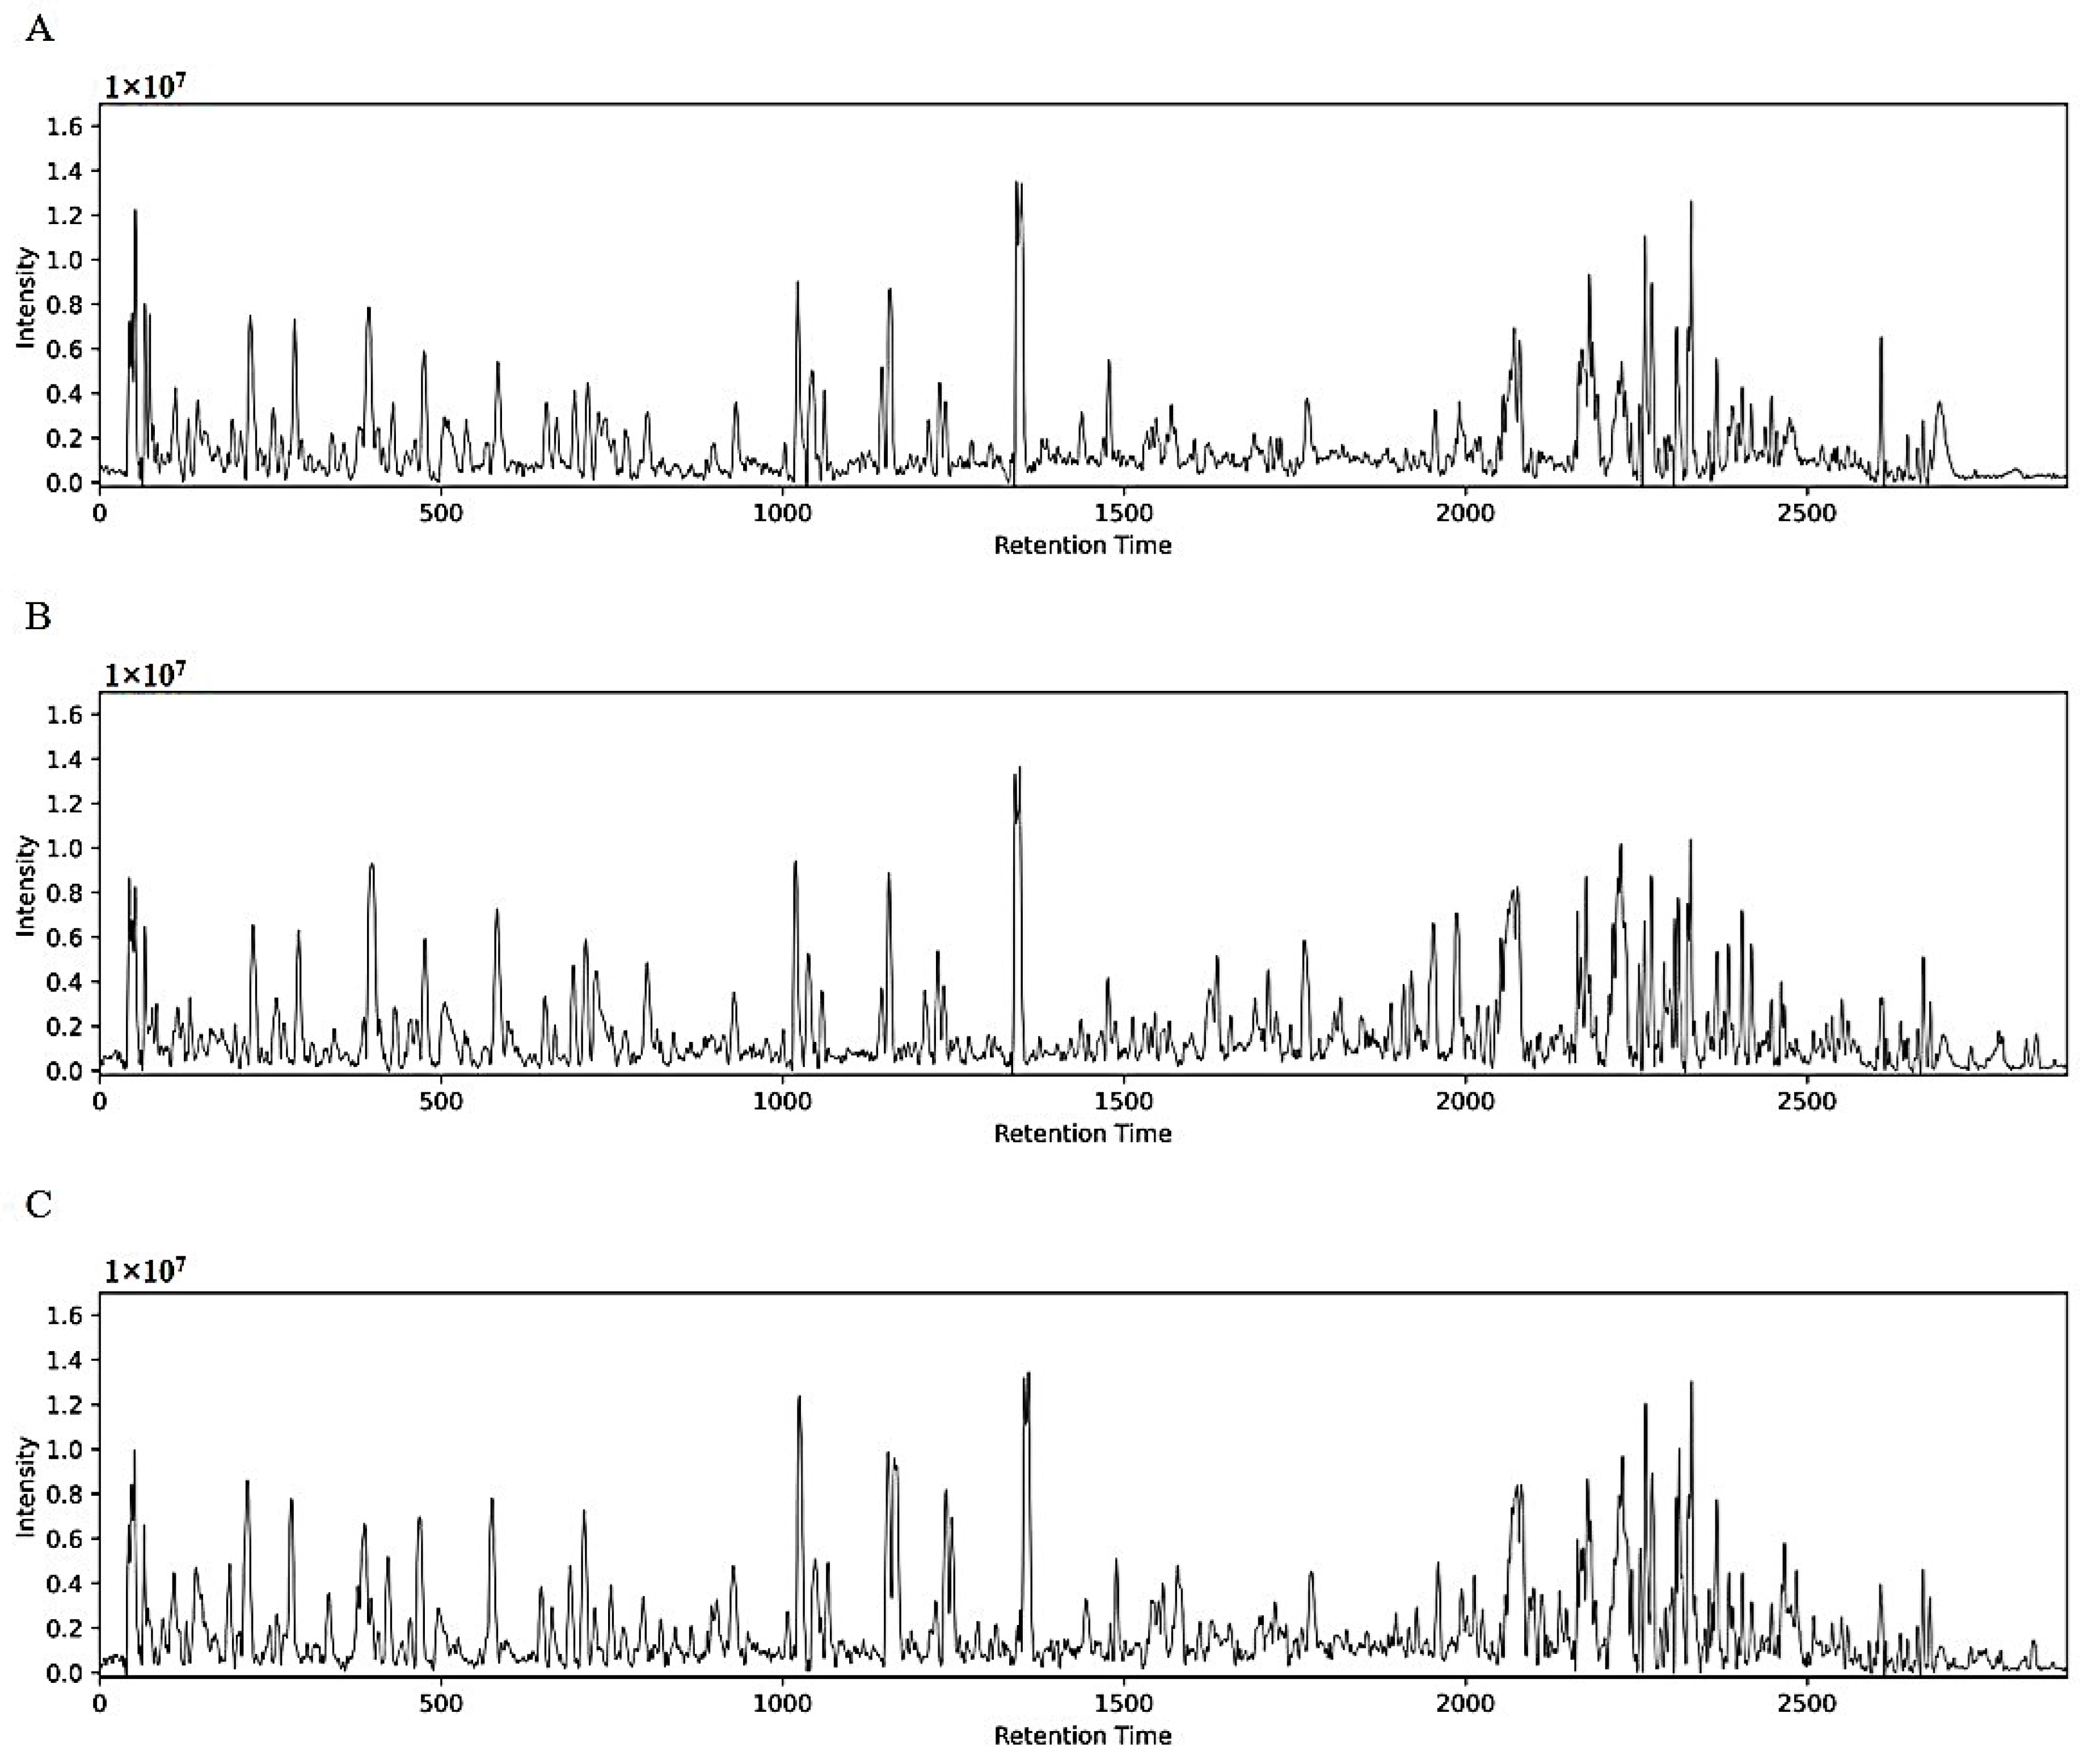
3.1.2. Extraction Time Selection

Ultrasound can increase the swelling index, which is the absorption of water by plant during the ultrasonic treatment. Compared with mechanical stirring, the extraction efficiency under ultrasonic treatment is much higher. In some cases, increased swelling of the plant tissue can damage the cell wall, thereby facilitating the metabolites extraction [59]. Here, five different extraction times (15, 30, 40, 50, 65 min) were studied. The number and area of peaks were used as the evaluation criteria. It can be seen from Figure 4A,B that the extraction efficiency of ultrasonic time at 65 min has not changed significantly compared with 15 min. In order to ensure the extraction quality and reduce random error in pretreatment [16], 30 min was selected as the appropriate extraction time.

3.1.3. Investigation of UPLC/IT-TOF MS Parameters

There are many types of metabolites in flue-cured NTL leaves, so the choice of chromatographic column is crucial for the separation of these metabolites. The ACQUITY UPLC BEH C18 column had high reliability to retain molecules with good repeatability. The trifunctionally bonded BEH particle gave the wide usable pH range (pH 1–12), ultra-low column bleed and excellent separation. In addition, the optimized mass spectrometry parameters made the analysis in a highly sensitive state. Because the positive ion mode had detected more features than the negative ion mode, the positive ion mode was selected to analyze the leaves from different maturity grades. Base peak chromatograms (BPC) of metabolites extracted from three typical leaves from different maturity grades were shown in the Figure 5A–C, respectively. As can be seen from the Figure 5, the relative areas of some peaks are significantly different.

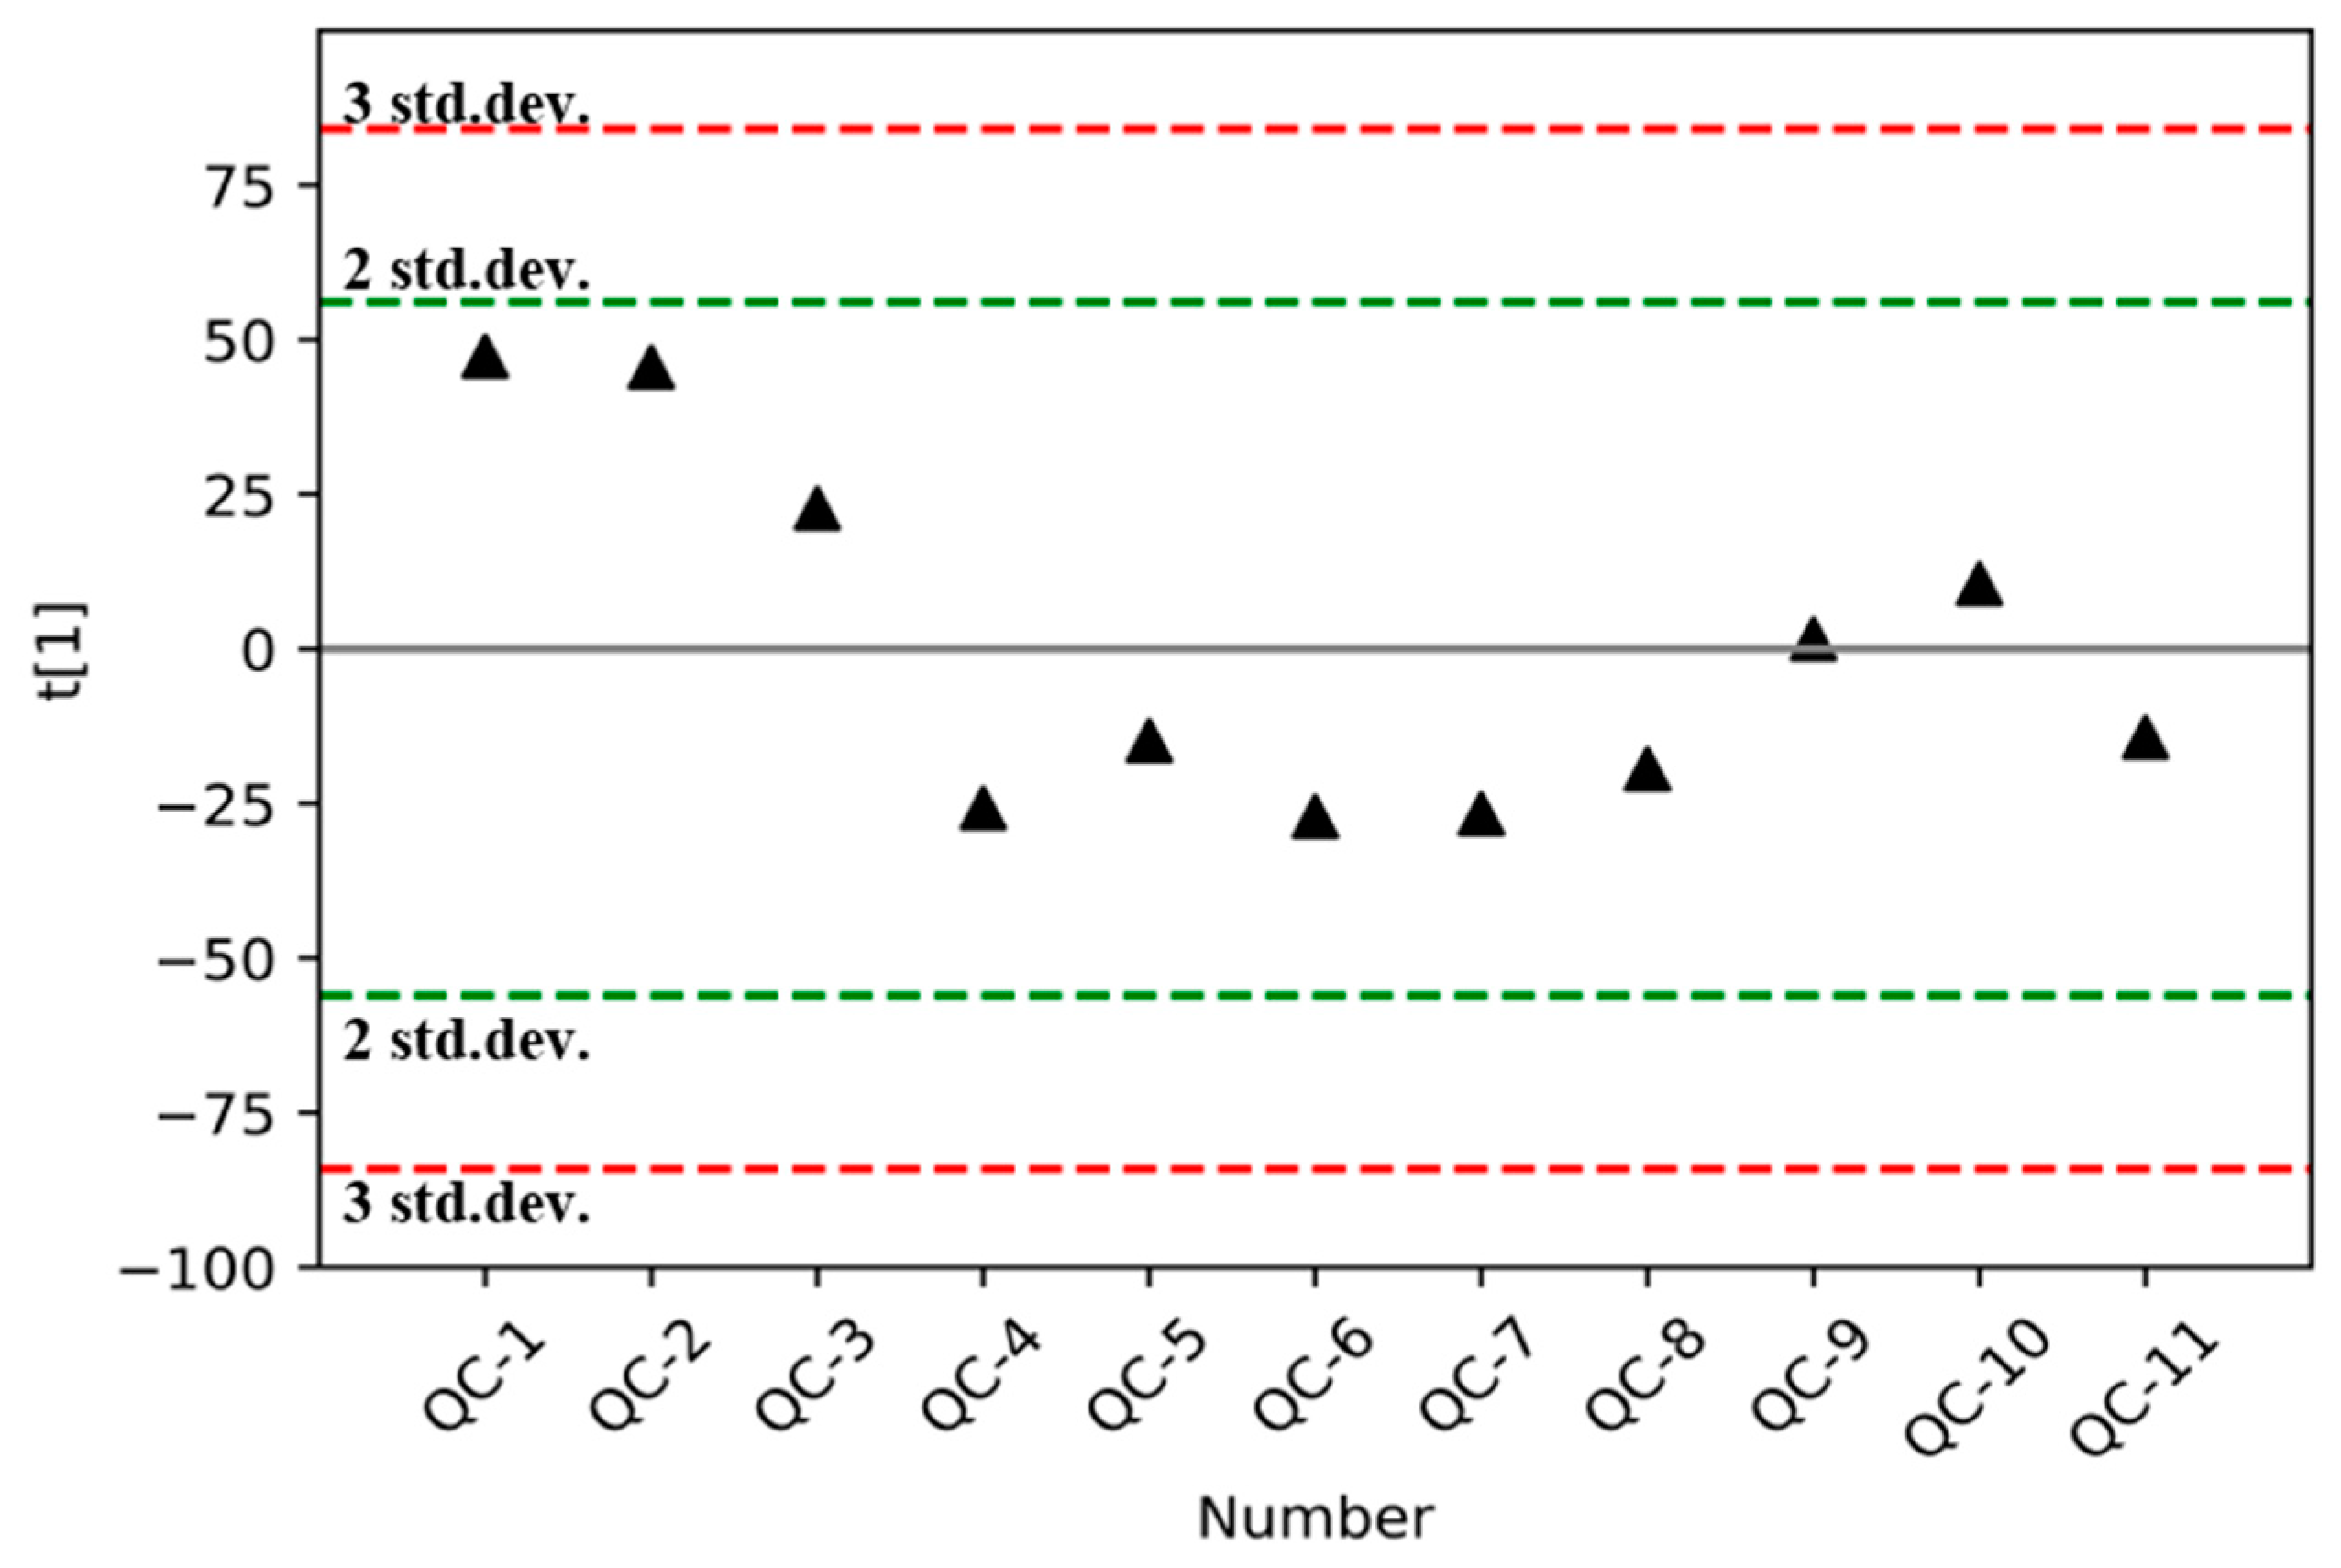
3.2. Validation of the Analytical Method

In order to ensure the repeatability, accuracy, and precision of the extraction results, it was necessary to evaluate the analysis method. As shown in Figure 6, the reproducibility of the extraction method, instrument stability, intraday precision and interday precision were verified.
To determine whether the repeatability of this extraction method is acceptable, six parallel QC samples were prepared according to Section 2. After LC-MS analysis and data preprocessing, a table of metabolites with retention time, m/z, and abundance was obtained. Then, the relative standard deviation (RSD) of each feature in six QC samples was calculated, and the number and area of features in different RSD ranges (0–10, 10–20, 20–30, >30%) were counted. Almost 89% features had an RSD within 20%, which accounted for 90% of the total peak area. Therefore, the preparation method of this sample had good repeatability.
Instrument precision was also an important parameter that needed to be investigated. Similarly, the samples were prepared according to the method in Section 2, and six consecutive LC-MS analyses on the same QC sample were performed. Peak number and area of features were computed in different RSD (0–10, 10–20, 20–30, >30%) ranges. Nearly 95% of metabolic features had an RSD < 20%, which accounted for 95% of the total peak area. The results showed that the instrument has excellent stability.
In order to investigate the intraday precision, six duplicated QC samples were analyzed at (2, 4, 6, 8, 10, 12 h) of the day, and the peak numbers and peak areas of metabolic features were counted in different RSD (0–10, 10–20, 20–30, >30%) ranges. As shown in Figure 6, there were 94% of the metabolic features within 20% of RSD, which accounted for approximately 94% of the total of the peak area. In order to investigate the interday precision, six QC samples were analyzed over 4 days, and the peak numbers and peak areas of metabolic features were computed in different RSD (0–10, 10–20, 20–30, >30%) ranges. It can be seen from Figure 6 that 88% of the metabolic features within 20% of RSD, accounting for about 91% of the total peak area. It showed that the method has a good intraday and interday precision.

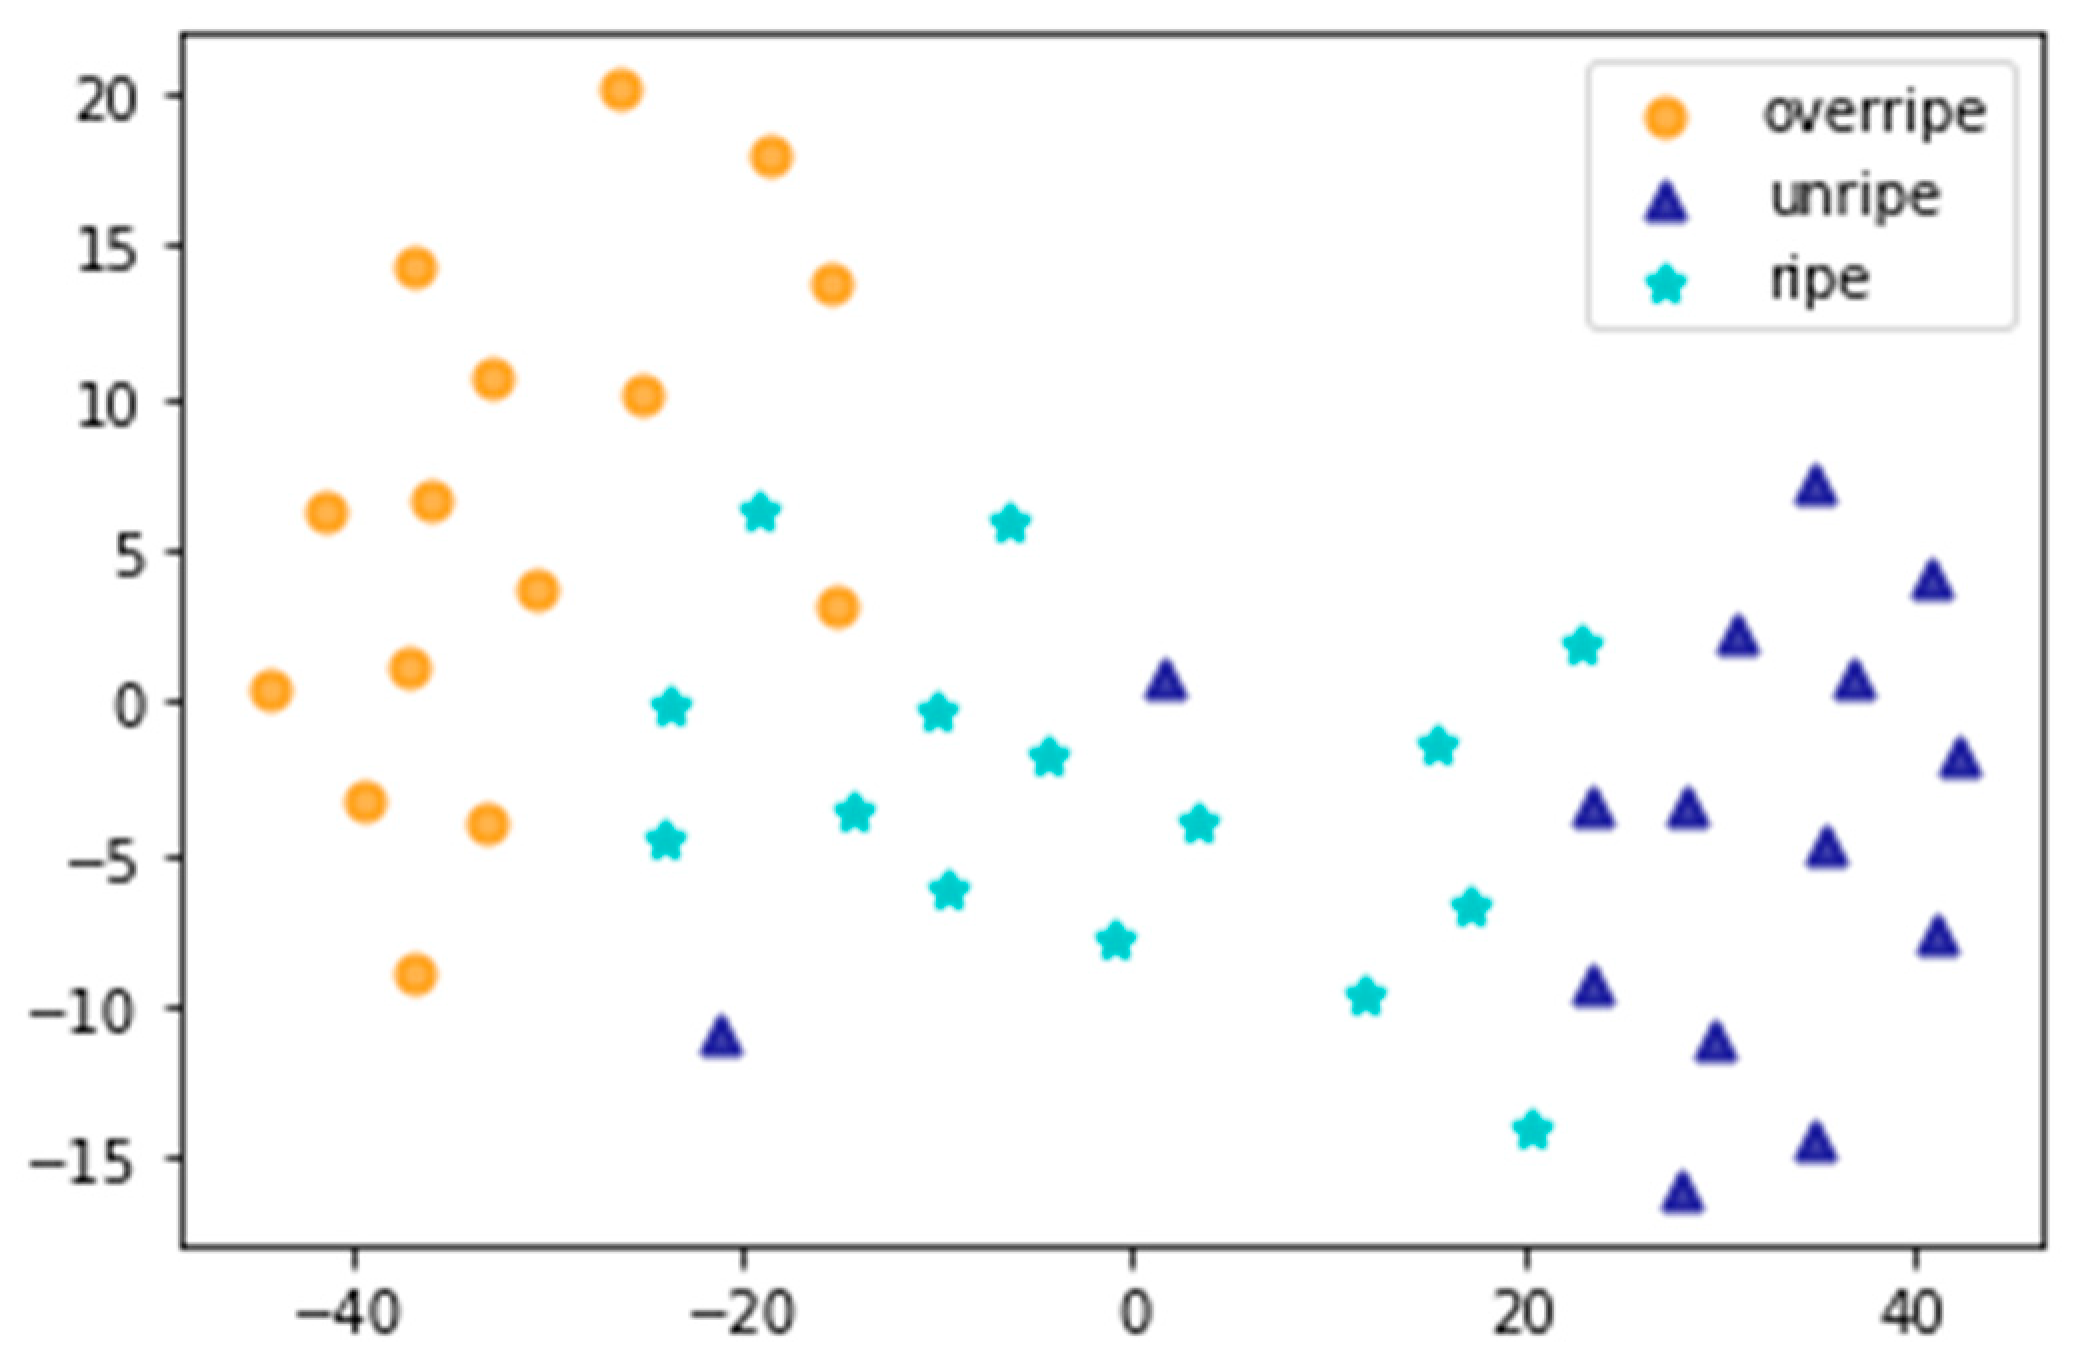
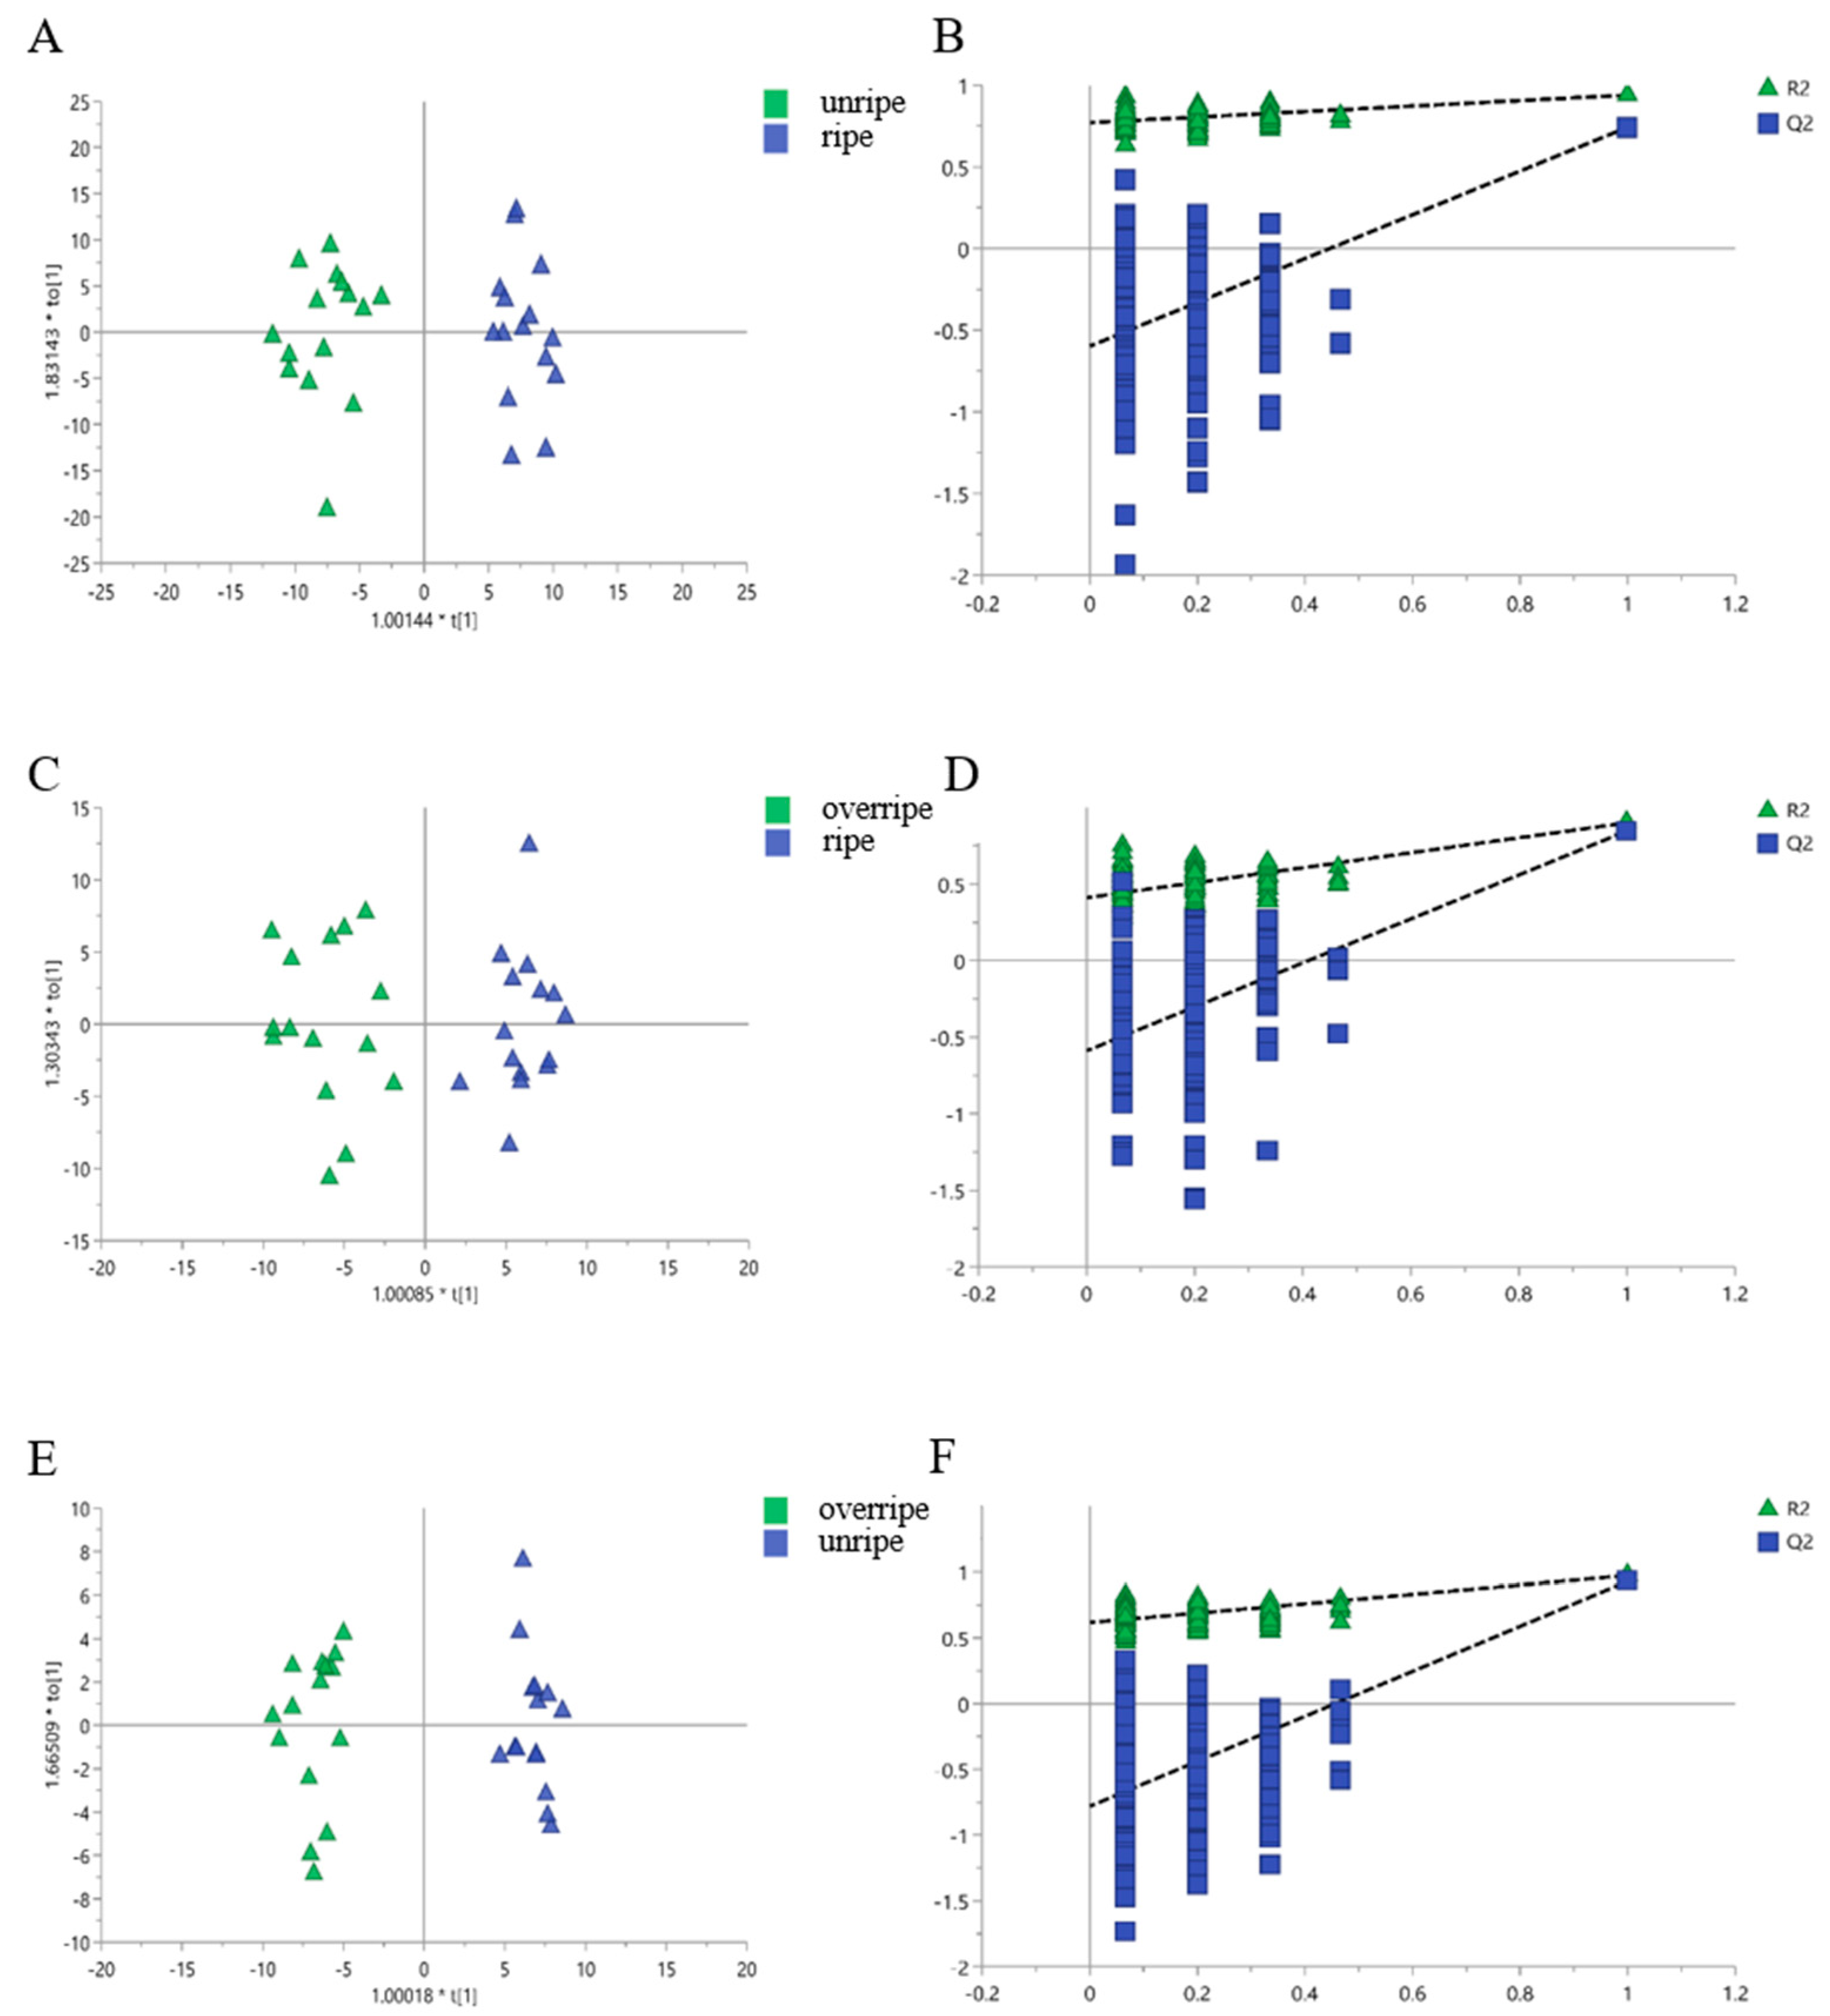
3.3. Classification of the Leaves from Different Maturity Grades

The reliability of the acquired data should be evaluated before further statistical analysis. In this study, the QC samples were inserted in the analysis sequence to monitor the data quality according to Section 2. The first principal component of 11 QC samples was illustrated in Figure 7. The results showed that the acquired data are stable during operation, and further statistical analysis can be performed to build discriminant models and screen the differential metabolites.
The t-SNE converts high-dimensional data into low-dimensional embedding (two-dimensional or three-dimensional) by minimizing the Kullback–Leibler divergence between their joint probabilities. It was superior to existing technologies and produced significantly better visualization [26]. So, t-SNE was used to reduce dimensionality and visualize flue-cured NTL leaves from different maturity grades. In Figure 8, the two-dimensional maps of t-SNE showed that these samples were obviously separated into three groups according to their maturity grades.
To further investigate the differences between the flue-cured NTL leaves from different maturity grades, the OPLS-DA models were established. OPLS-DA is an effective and interpretable discriminant method because of the elimination of information unrelated to maturity grades. First, the OPLS-DA model between the unripe and ripe samples was established, and its score plot and the result of the permutation test are shown in Figure 9A. The samples of two maturity grades were clearly separated along the PC1 axis. Results (R2Y = 0.939, Q2 = 0.742) showed that the model is accurate and reliable. To avoid over-fitting the OPLS-DA model, 200-times permutation testing was applied. The results of permutation test in Figure 9B showed that the model was reliable. The VIP > 1 and p < 0.05 were chosen as the criteria to screen out differential features. In this way, thirteen metabolites were found as the differential features between the unripe and ripe leaves, and the detailed information of these differential features is listed in Table S1.
Similarly, OPLS-DA and t-test were performed on overripe and ripe samples. The OPLS-DA score of overripe and ripe samples were plotted in Figure 9C, and samples of these two maturity grades can be clearly distinguished. Results (R2Y = 0.9, Q2 = 0.847) showed that the model is effective and reliable. The model was also assessed by a 200-times permutation test, and one can observe from Figure 9D that there is no over-fitting risk. Finally, according to VIP > 1 and p < 0.05, thirteen differential metabolites were found between the overripe and ripe samples, and the detailed information of these differential features were shown in Table S2.
Finally, the OPLS-DA model between the overripe and unripe samples was established. The score plot is shown in Figure 9E, samples from these two maturity grades can be clearly distinguished. Results (R2Y = 0.972, Q2 = 0.93) showed that the model is highly reliable and accurate. The OPLS-DA was also assessed by a 200-times permutation test, and there is no over-fitting risk from Figure 9F. Since there were more differential features detected in this model compared to the previous ones, it was difficult to conduct subsequent qualitative analysis. Therefore, a stricter criterion (VIP > 1.5 and p < 0.01) was set, and twenty-nine differential features were obtained. The detailed information of these differential features is listed in Table S3.
In order to analyze the changes in differential metabolites, heat maps (Figure 10A–C) were used to display the relative distribution of each metabolite in each maturity grade. It can be seen from these figures that the leaves from three different maturity grades were well clustered. It meant that the results of the analysis are credible.

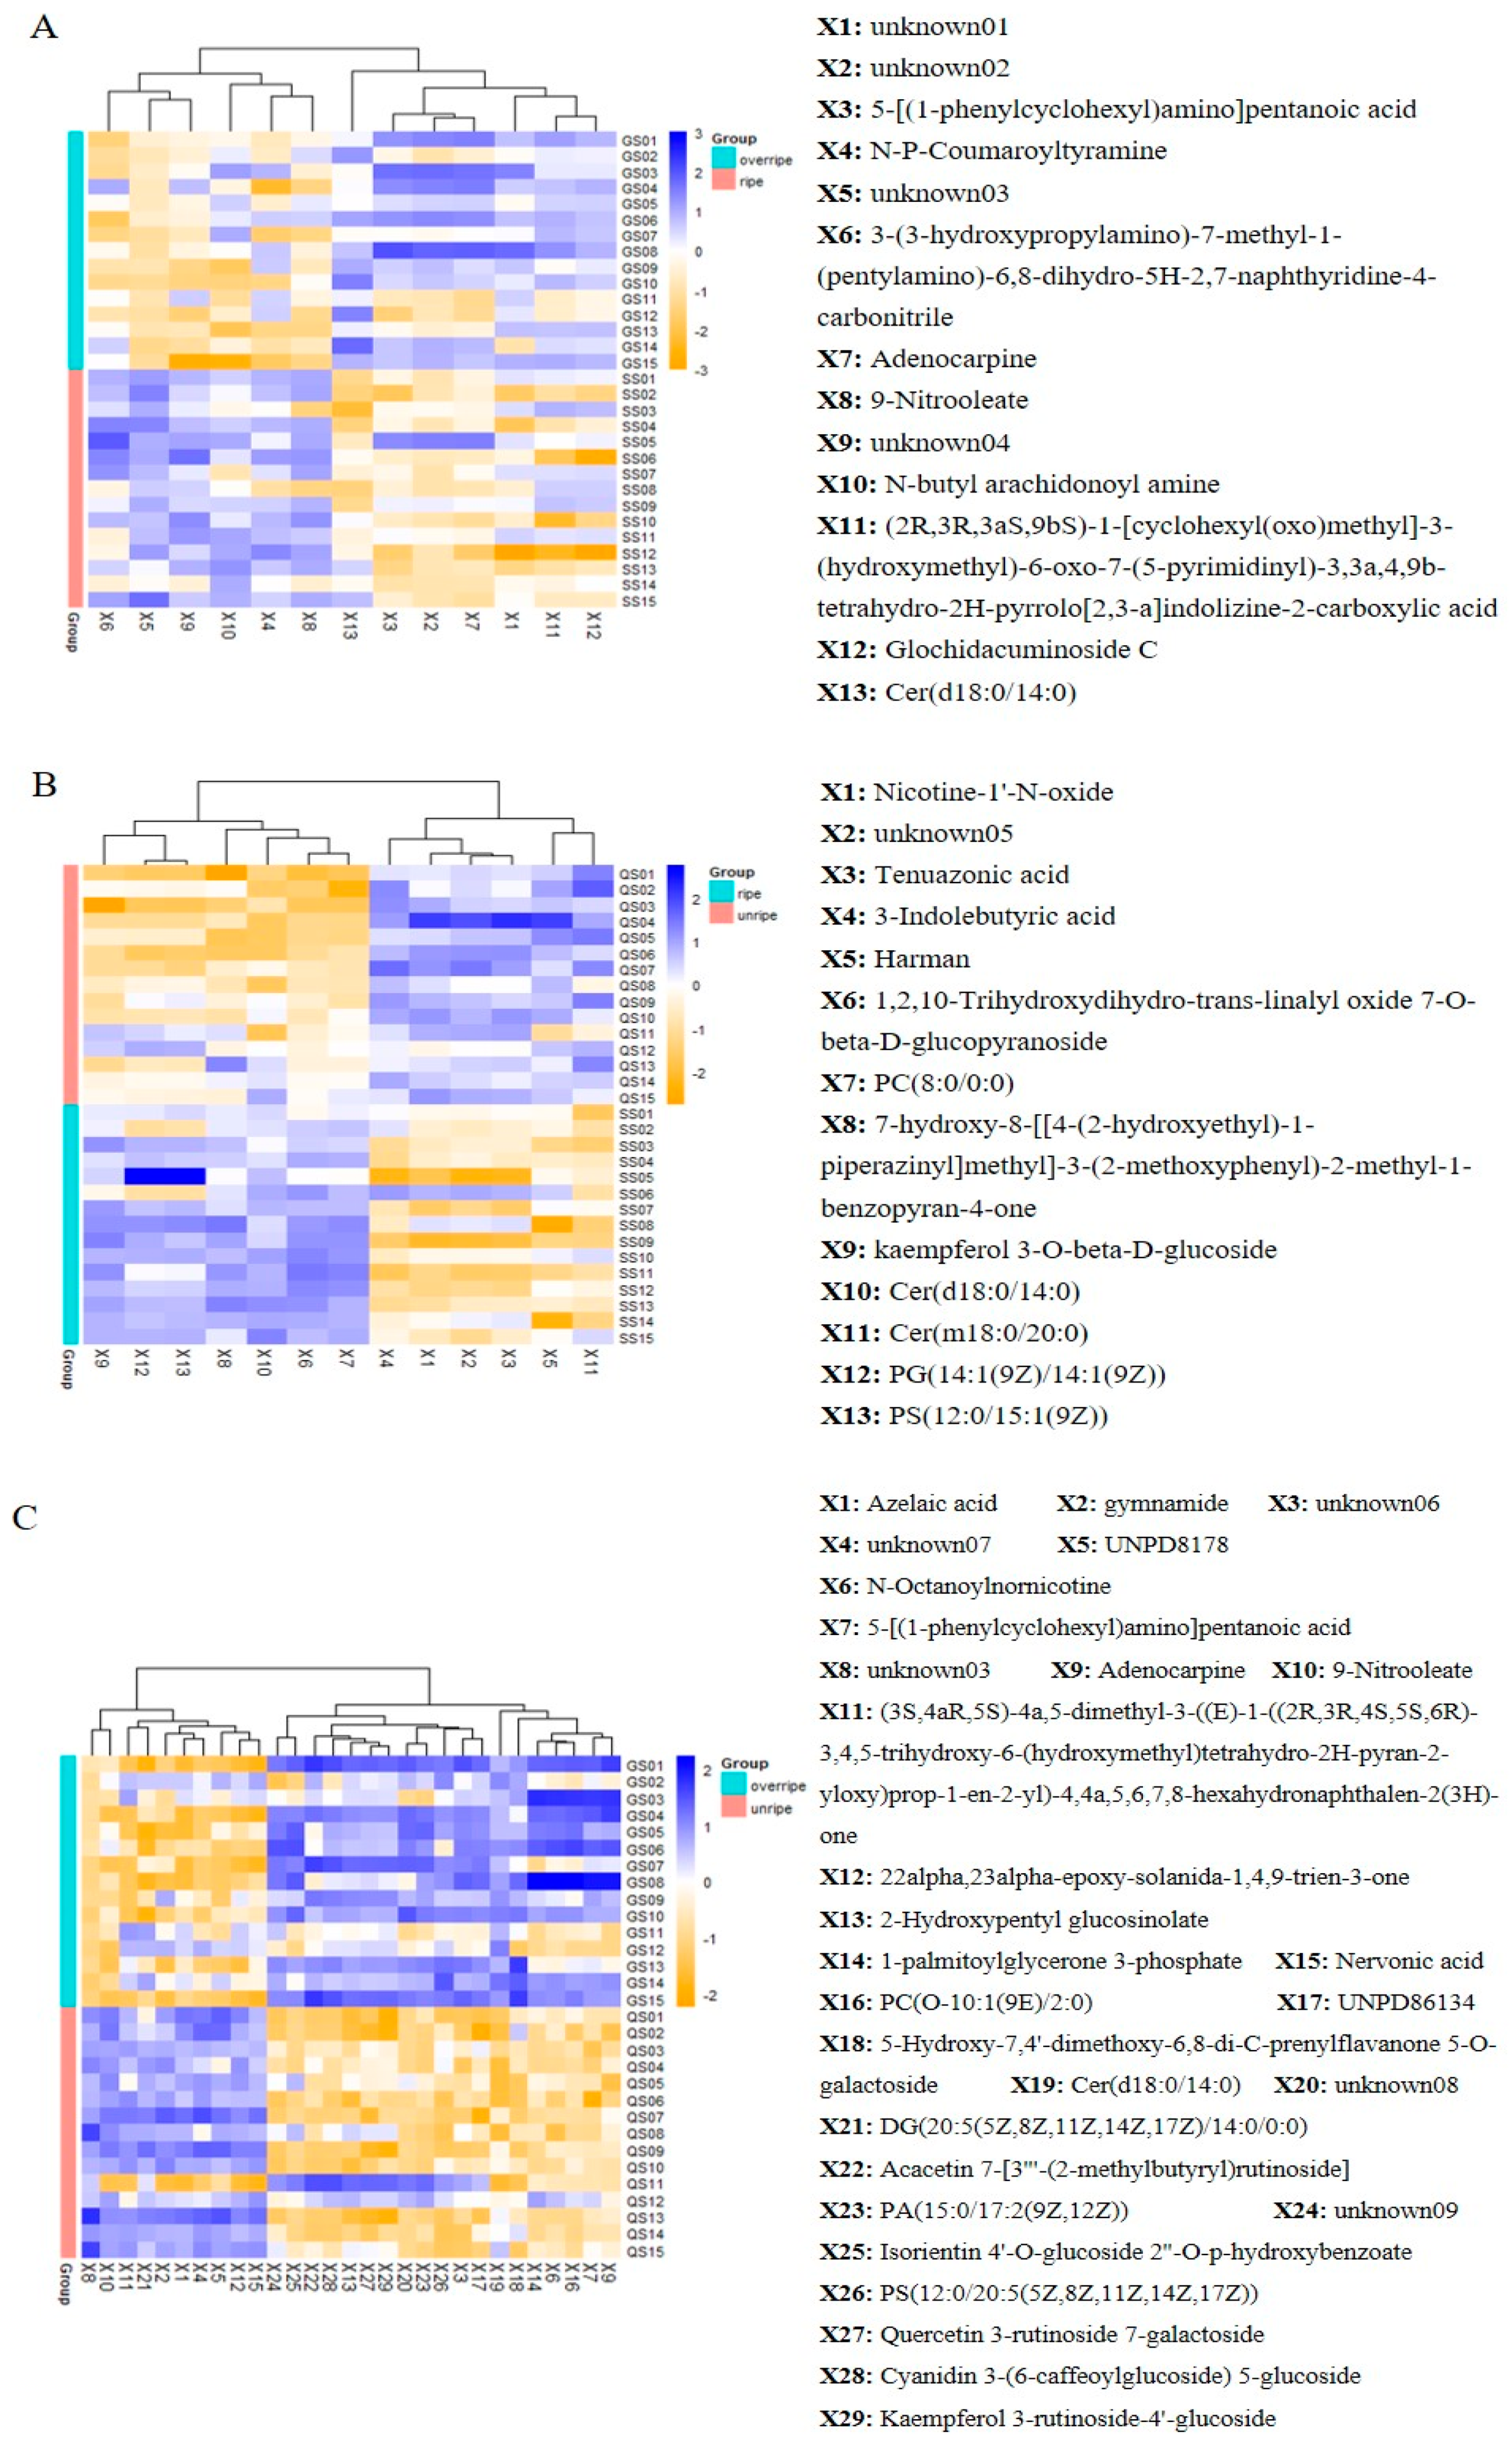
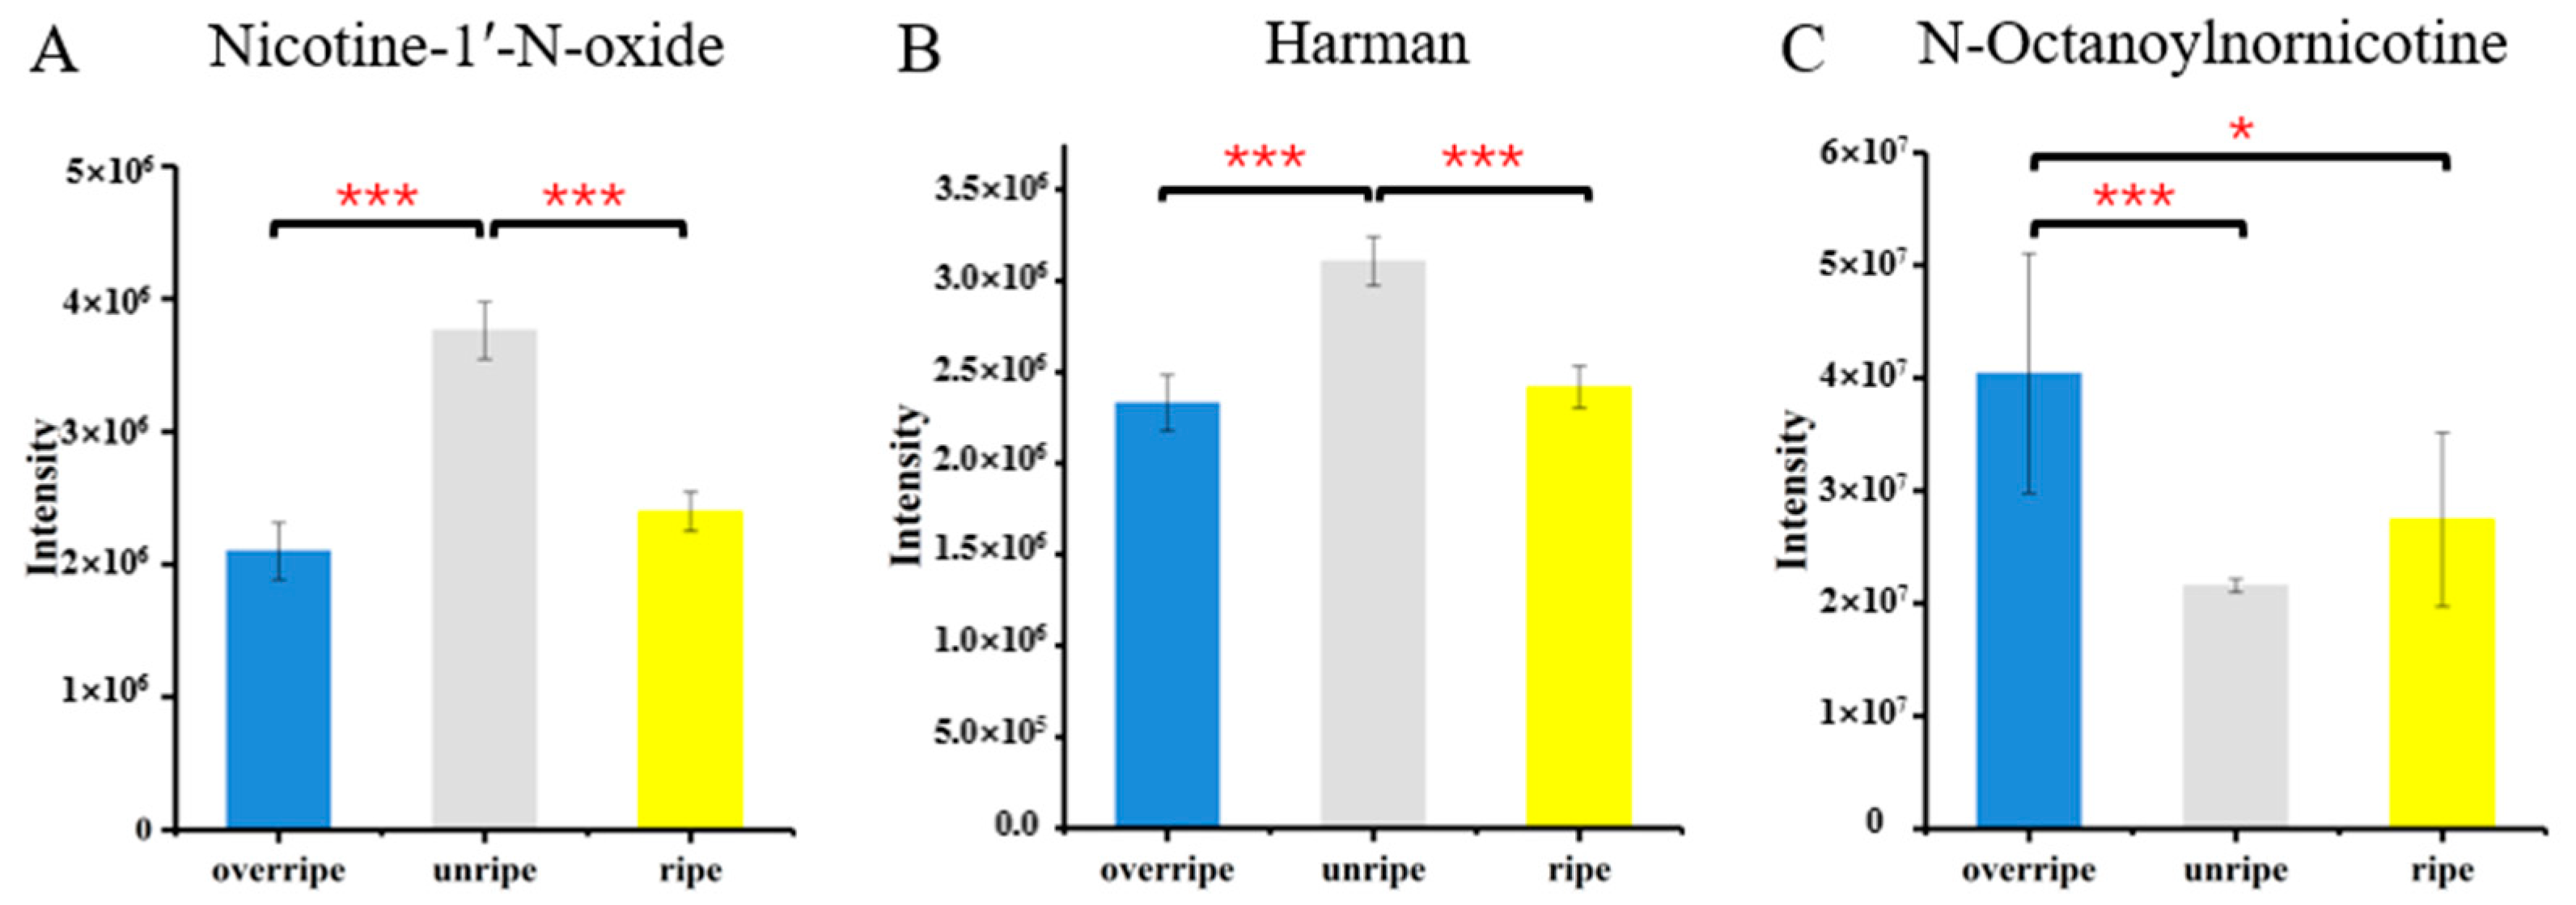
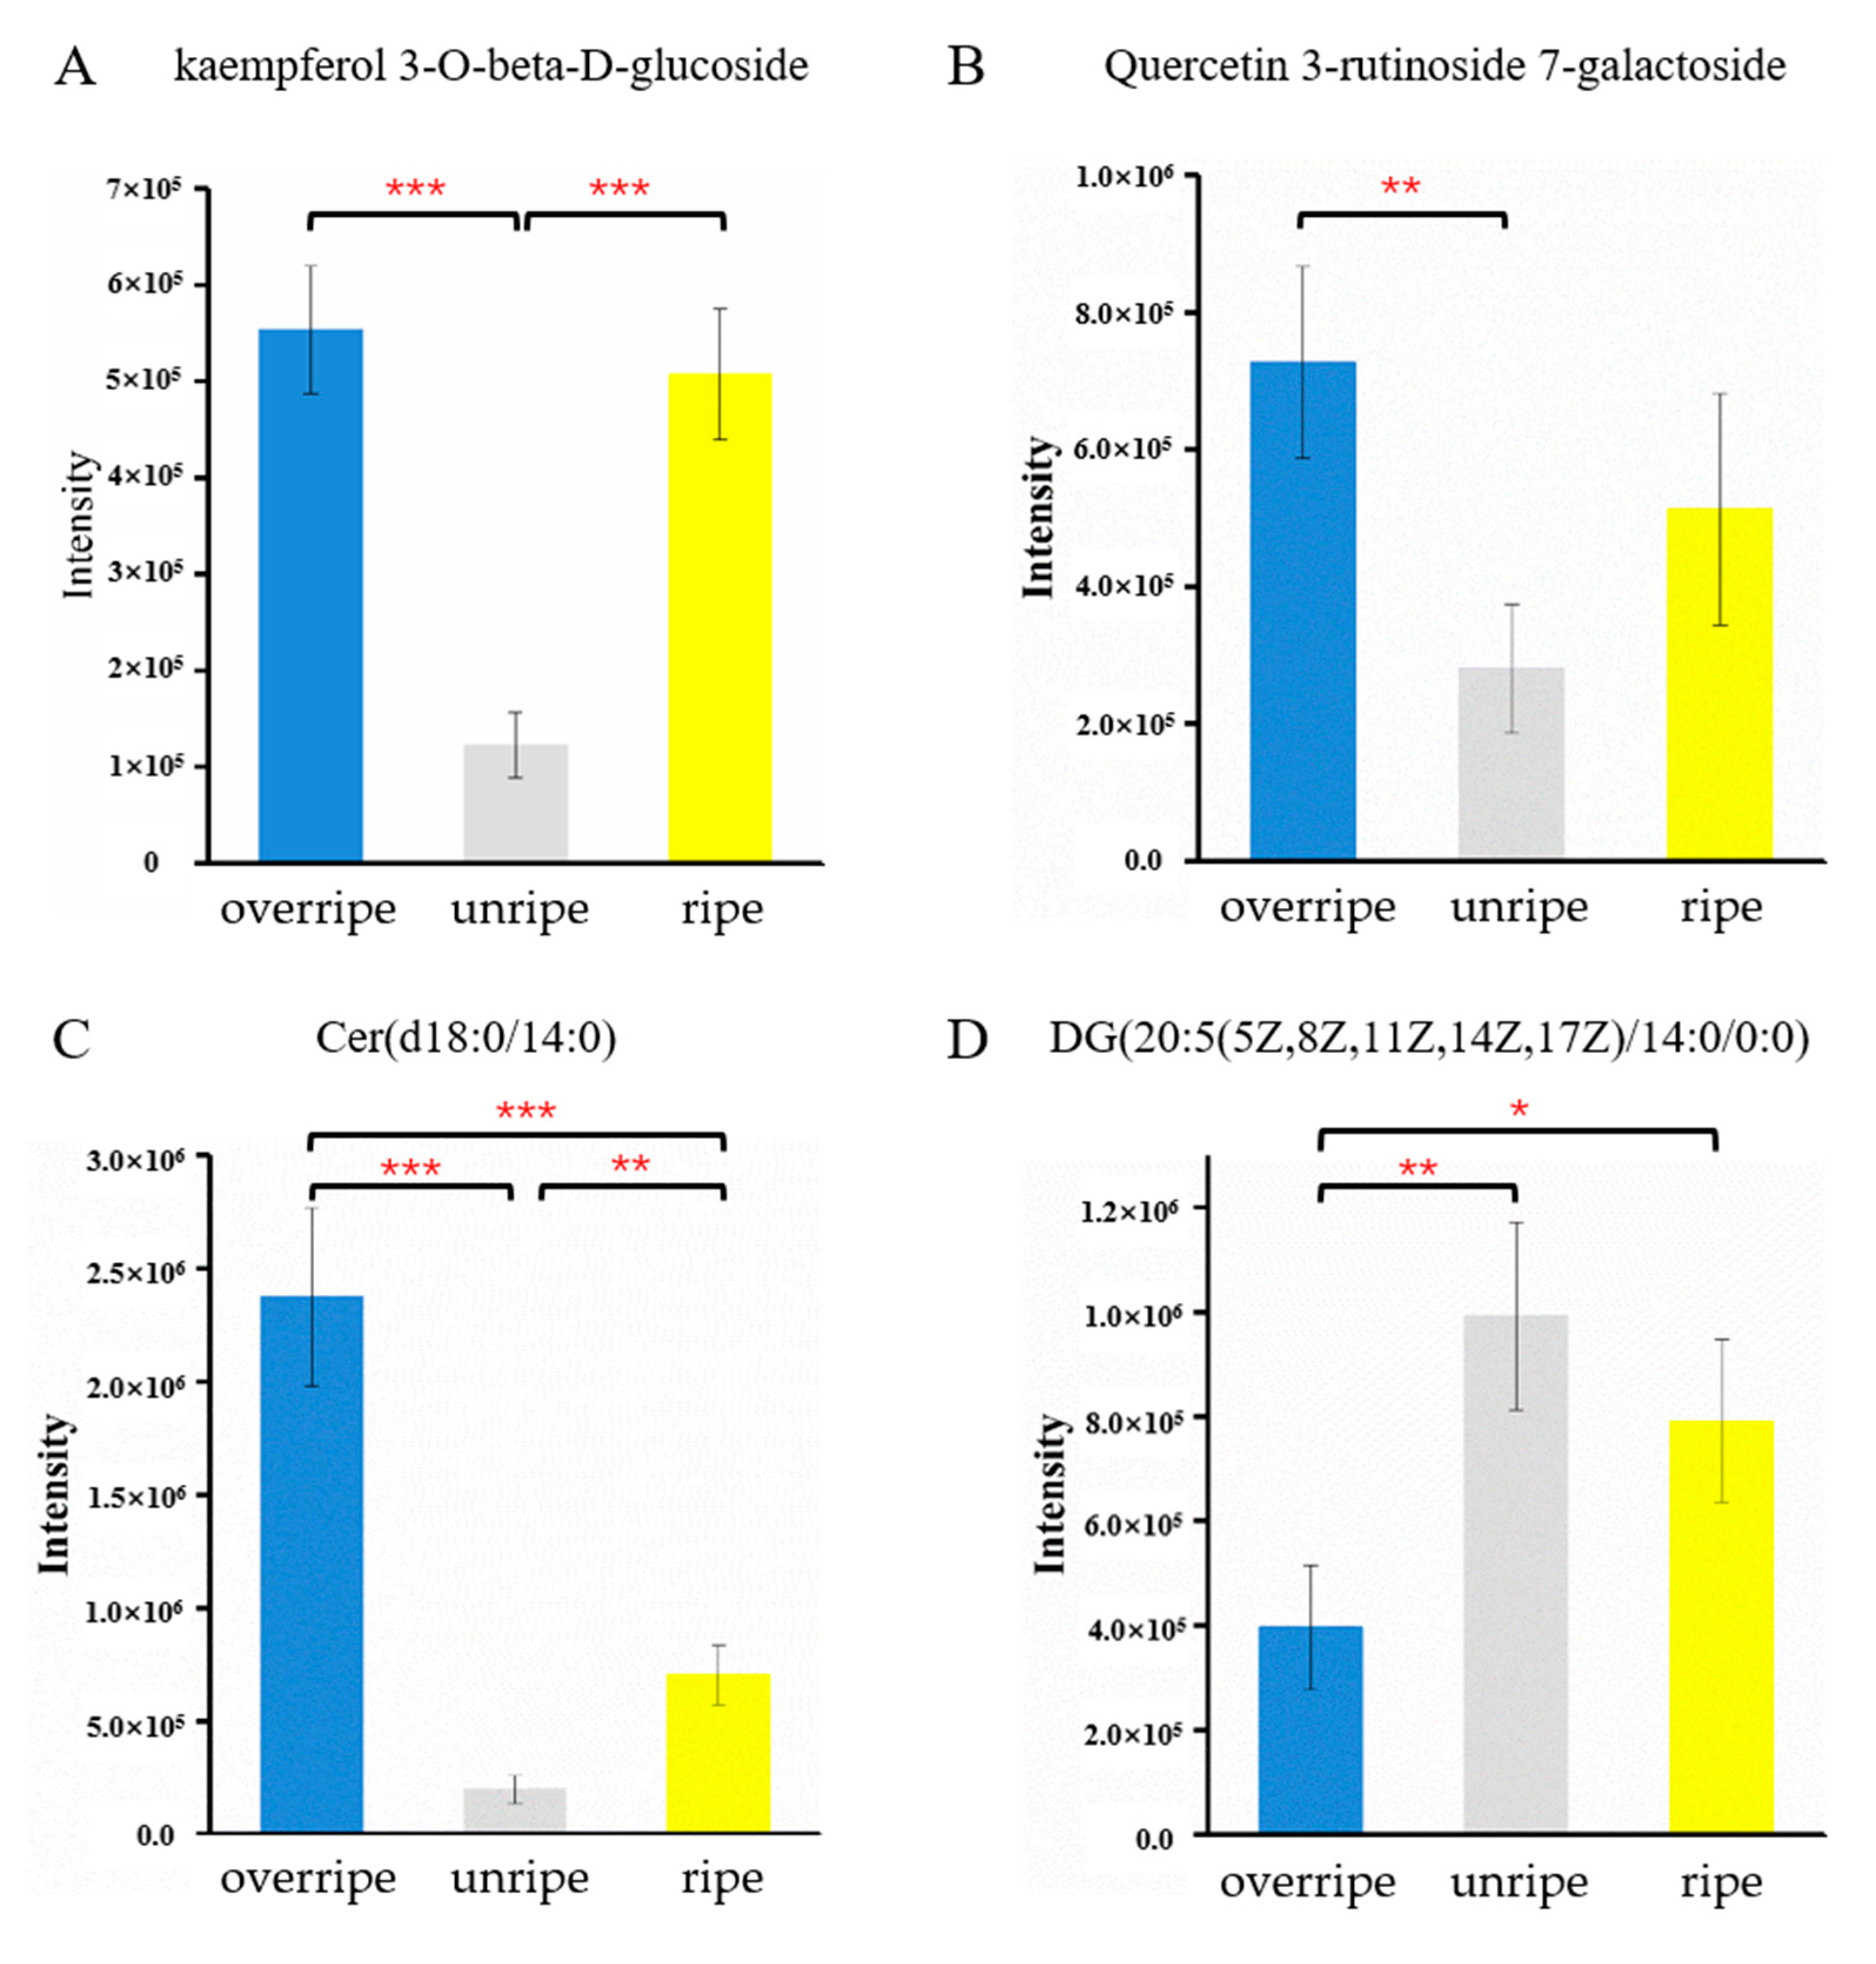
3.4. Identification of Metabolites from Different Maturity Grades

It can be seen from the above sections that forty-nine differential features were screened out by the OPLS-DA and t-test. One of them is common among three different maturity grades. Four of them were common differential metabolites in two OPLS-DA models. The MSP file of each metabolite was imported into MS-FINDER and searched in the user-defined library. Six metabolites were identified by the MS-FINDER and user-defined library. Afterwards, the libraries of plant metabolites in MS-FINDER were searched, and in silico MS/MS fragments were matched. Twenty-six differential metabolites were annotated. Eight metabolites were putative annotated by searching the METLIN database. In addition, nine metabolites had not been annotated because of the limited number of molecules in spectral or structural libraries.

4. Discussions

According to the VIP value and the p-value, forty-nine significantly differential metabolites were found between overripe, unripe, and ripe samples (Table S4). The differential metabolites mainly include amines, lipids, and phenols.
Nitrogen-containing compounds in flue-cured NTL leaves include protein, alkaloids, etc. Nitrogen-containing compounds not only affect the characteristics of leaves and determine economic output, but also have an important impact on the quality of leaves [60]. Alkaloids are a class of secondary metabolites that contain nitrogen. Among these alkaloids, nicotine is the most important compound, accounting for more than 95% of the total alkaloids, followed by nor-nicotine, etc. In the identification of differential metabolites of flue-cured leaves from different maturity grades, N-Octanoylnornicotine, Nicotine-1′-N-oxide (NNO), and 1-Methyl-9H-pyrido [3,4-b]indole (Harman) were detected (Figure 11A–C). Nicotine is synthesized in the roots of multiple Nicotiana species and transports to the aerial part of the plant followed by its demethylation to nornicotine [61]. The content of Nicotine-1′-N-oxide in the leaves decreased with the increase in maturity, while the content of N-Octanoylnornicotine increased with the maturity of leaves. Nicotine-1′-N-oxide is an oxidation product of nicotine. Nornicotine was produced by enzymatic degradation of nicotine during senescence and conditioning of leaves. Therefore, the content of N-Octanoylnornicotine of overripe leaves increased significantly. Harman is a naturally occurring beta-carboline alkaloid and only a small amount exists in leaves. The content of Harman tended to stabilize as the leaves matured.
Phenolic compounds have a variety of physiological functions, and almost all exist in the vacuole in the form of glycosides and esters [62]. The glycosides identified were mainly flavonoids (Figure 12A,B), such as Quercetin 3-rutinoside 7-galactoside, Kaempferol 3-rutinoside-4′-glucoside, etc. Flavonoids are widely found in plants and are the secondary metabolites of plants [63]. Most of them are combined with sugars to form glycosides or carbon sugar groups in plants. Flavonoids include the glycosides of kaempferol and quercetin. The content of Quercetin 3-rutinoside 7-galactoside and Kaempferol 3-rutinoside-4′-glucoside both increased with the maturity of the leaves and basically reached a balance when the leaves were at moderate maturity. Generally, when the content of phenols reaches the maximum, it is the suitable harvest period. However, different parts of a leaf, different amounts of growth regulator substances, baking conditions, and mineral nutrients will cause different levels of phenolic substances. Therefore, it is difficult to determine the most suitable harvest period based on phenolic compounds solely.
Lipids include phospholipids, glycolipids, and cholesterol and cholesterol esters. Among the identified differential lipids, most of them are diacylglycerol (DG), ceramide (Cer), phosphatidylcholine (PC), and phosphatidylethanolamine (PE). Phospholipids are the main components of biological membranes. As shown in Figure 12C,D, the content of Cer(d18:0/14:0) increased significantly when the leaves were over mature, and the content of DG(20:5(5Z,8Z,11Z,14Z)/14:0/0:0) decreased as the leaves matured. As the leaves matured, the glandular hair secretion increased continuously, and the content of lipid compounds also increased. However, lipids are also affected by the NTL plant’s own metabolism during the maturation process. The modulation, fermentation, and aging process of the leaves will also affect the changes in the chemical compositions. Therefore, it is not accurate and robust enough to judge the maturity of the leaves with only the lipid content.

5. Conclusions

In this study, we have developed a method to extract the metabolites from flue-cured NTL leaves, which has good repeatability and precision. The metabolites of samples from three different maturity grades were analyzed and compared by UPLC-IT-TOF/MS. The OPLS-DA models were built to classify the leaves with good accuracy. Differential metabolites related to three different maturity grades were identified by the user-defined structure library, the existing plant metabolites library, and MS-FINDER software. Forty-nine differential metabolites of the leaves were putatively identified, including amines, phenols, and lipids. These results indicated that UPLC-IT-TOF/MS-based metabolomics can be useful to discriminate the leaves from different maturity grades, and the user-defined structural library and computational tool have the potential to identify the unknown metabolites.

Supplementary Materials

The following are available online at https://0-www-mdpi-com.brum.beds.ac.uk/2297-8739/8/1/9/s1, Method S1: Detailed description of the t-SNE algorithm, Method S2: Detailed description of the OPLS-DA algorithm, Method S3: Detailed description of the MS-FINDER software, Table S1: Table of p-values and VIP values of 13 different metabolites selected between unripe leaves and ripe leaves, Table S2: Table of p-values and VIP values of 13 different metabolites selected between overripe leaves and ripe leaves, Table S3: Table of p-values and VIP values of 29 different metabolites selected between overripe leaves and unripe leaves, Table S4: The full list of identified compounds of flue-cured NTL leaves from different maturity grades (unripe, ripe, and overripe), Table S5: Table of detailed information about the structural formula library of plant metabolites that we built.

Author Contributions

This work presented here was carried out with collaboration among all authors. Planning and designing the research, Z.Z. and M.T.; methodology, M.T. and H.L.; software, Y.C., C.Z. and G.Z.; writing—original draft preparation, M.T. and Y.C.; writing—review and editing, Z.Z., Y.C. and C.Z. All authors have read and agreed to the published version of the manuscript.

Funding

This work is supported by the Yunnan Science and Technology Innovation Project (Grant No. 2019HB068) and the Yunnan Academy of Tobacco Agricultural Sciences (Grant Nos. 2019530000241019, 2020530000241025, and 20200530000241004). The studies meet with the approval of the university’s review board.

Institutional Review Board Statement

Not applicable.

Informed Consent Statement

Informed consent was obtained from all subjects involved in the study.

Data Availability Statement

The data presented in this study are available on request from the corresponding author.

Acknowledgments

We are grateful to all employees of this institute for their encouragement and support of this research.

Conflicts of Interest

The authors declare no conflict of interest.

References

  1. Chen, Y.; Ren, K.; He, X.; Gong, J.; Hu, X.; Su, J.; Jin, Y.; Zhao, Z.; Zhu, Y.; Zou, C. Dynamic changes in physiological and biochemical properties of flue-cured tobacco of different leaf ages during flue-curing and their effects on yield and quality. BMC Plant Biol. 2019, 19, 555. [Google Scholar] [CrossRef] [PubMed] [Green Version]
  2. Cui, G.; Huang, W.; Zhao, G.; Han, S. Effects of different maturity on appearance grade quality and key chemical components of baked tobacco leaves. J. Anhui Agric. Sci. 2013, 41, 10819–10822. [Google Scholar]
  3. Musilová, J.; Glatz, Z. Metabolomics-Basic concepts, Strategies and Methodologies. Chem. Listy 2011, 105, 745–751. [Google Scholar]
  4. Lisec, J.; Schauer, N.; Kopka, J.; Willmitzer, L.; Fernie, A.R. Gas chromatography mass spectrometry-based metabolite profiling in plants. Nat. Protoc. 2006, 1, 387–396. [Google Scholar] [CrossRef] [PubMed]
  5. Ramautar, R.; Busnel, J.-M.; Deelder, A.M.; Mayboroda, O.A. Enhancing the coverage of the urinary metabolome by sheathless capillary electrophoresis-mass spectrometry. Anal. Chem. 2012, 84, 885–892. [Google Scholar] [CrossRef] [PubMed]
  6. Núñez, N.; Vidal-Casanella, O.; Sentellas, S.; Saurina, J.; Núñez, O. Non-Targeted Ultra-High Performance Liquid Chromatography-High-Resolution Mass Spectrometry (UHPLC-HRMS) Fingerprints for the Chemometric Characterization and Classification of Turmeric and Curry Samples. Separations 2020, 7, 32. [Google Scholar] [CrossRef]
  7. De Vos, R.C.; Moco, S.; Lommen, A.; Keurentjes, J.J.; Bino, R.J.; Hall, R.D. Untargeted large-scale plant metabolomics using liquid chromatography coupled to mass spectrometry. Nat. Protoc. 2007, 2, 778–791. [Google Scholar] [CrossRef]
  8. Zhao, Y.; Zhao, J.; Zhao, C.; Zhou, H.; Li, Y.; Zhang, J.; Li, L.; Hu, C.; Li, W.; Peng, X. A metabolomics study delineating geographical location-associated primary metabolic changes in the leaves of growing tobacco plants by GC-MS and CE-MS. Sci. Rep. 2015, 5, 16346. [Google Scholar] [CrossRef] [Green Version]
  9. Li, L.; Zhao, J.; Zhao, Y.; Lu, X.; Zhou, Z.; Zhao, C.; Xu, G. Comprehensive investigation of tobacco leaves during natural early senescence via multi-platform metabolomics analyses. Sci. Rep. 2016, 6, 37976. [Google Scholar] [CrossRef]
  10. Wang, X.; Sun, H.; Zhang, A.; Wang, P.; Han, Y. Ultra-performance liquid chromatography coupled to mass spectrometry as a sensitive and powerful technology for metabolomic studies. J. Sep. Sci. 2011, 34, 3451–3459. [Google Scholar] [CrossRef]
  11. Patti, G.J. Separation strategies for untargeted metabolomics. J. Sep. Sci. 2011, 34, 3460–3469. [Google Scholar] [CrossRef] [PubMed]
  12. Monga, G.K.; Ghosal, A.; Ramanathan, D. To Develop the Method for UHPLC-HRMS to Determine the Antibacterial Potential of a Central American Medicinal Plant. Separations 2019, 6, 37. [Google Scholar] [CrossRef] [Green Version]
  13. Zhao, Y.; Zhao, C.; Lu, X.; Zhou, H.; Li, Y.; Zhou, J.; Chang, Y.; Zhang, J.; Jin, L.; Lin, F. Investigation of the relationship between the metabolic profile of tobacco leaves in different planting regions and climate factors using a pseudotargeted method based on gas chromatography/mass spectrometry. J. Proteome Res. 2013, 12, 5072–5083. [Google Scholar] [CrossRef] [PubMed]
  14. Zhao, J.; Zhao, Y.; Hu, C.; Zhao, C.; Zhang, J.; Li, L.; Zeng, J.; Peng, X.; Lu, X.; Xu, G. Metabolic profiling with gas chromatography–mass spectrometry and capillary electrophoresis–mass spectrometry reveals the carbon–nitrogen status of tobacco leaves across different planting areas. J. Proteome Res. 2016, 15, 468–476. [Google Scholar] [CrossRef] [PubMed]
  15. Li, L.; Lu, X.; Zhao, J.; Zhang, J.; Zhao, Y.; Zhao, C.; Xu, G. Lipidome and metabolome analysis of fresh tobacco leaves in different geographical regions using liquid chromatography–mass spectrometry. Anal. Bioanal. Chem. 2015, 407, 5009–5020. [Google Scholar] [CrossRef]
  16. Li, L.; Zhao, C.; Chang, Y.; Lu, X.; Zhang, J.; Zhao, Y.; Zhao, J.; Xu, G. Metabolomics study of cured tobacco using liquid chromatography with mass spectrometry: Method development and its application in investigating the chemical differences of tobacco from three growing regions. J. Sep. Sci. 2014, 37, 1067–1074. [Google Scholar] [CrossRef]
  17. Li, Q.; Zhao, C.; Li, Y.; Chang, Y.; Wu, Z.; Pang, T.; Lu, X.; Wu, Y.; Xu, G. Liquid chromatography/mass spectrometry-based metabolic profiling to elucidate chemical differences of tobacco leaves between Zimbabwe and China. J. Sep. Sci. 2011, 34, 119–126. [Google Scholar] [CrossRef]
  18. Zhang, L.; Wang, X.; Guo, J.; Xia, Q.; Zhao, G.; Zhou, H.; Xie, F. Metabolic profiling of Chinese tobacco leaf of different geographical origins by GC-MS. J. Agric. Food Chem. 2013, 61, 2597–2605. [Google Scholar] [CrossRef]
  19. Lommen, A.; Kools, H.J. MetAlign 3.0: Performance enhancement by efficient use of advances in computer hardware. Metabolomics 2012, 8, 719–726. [Google Scholar] [CrossRef] [Green Version]
  20. Pluskal, T.; Castillo, S.; Villar-Briones, A.; Orešič, M. MZmine 2: Modular framework for processing, visualizing, and analyzing mass spectrometry-based molecular profile data. BMC Bioinform. 2010, 11, 395. [Google Scholar] [CrossRef] [Green Version]
  21. Smith, C.A.; Want, E.J.; O’Maille, G.; Abagyan, R.; Siuzdak, G. XCMS: Processing mass spectrometry data for metabolite profiling using nonlinear peak alignment, matching, and identification. Anal. Chem. 2006, 78, 779–787. [Google Scholar] [CrossRef] [PubMed]
  22. Coble, J.B.; Fraga, C.G. Comparative evaluation of preprocessing freeware on chromatography/mass spectrometry data for signature discovery. J. Chromatogr. A 2014, 1358, 155–164. [Google Scholar] [CrossRef] [PubMed]
  23. Treviño, V.; Yañez-Garza, I.L.; Rodriguez-López, C.E.; Urrea-López, R.; Garza-Rodriguez, M.-L.; Barrera-Saldaña, H.-A.; Tamez-Peña, J.G.; Winkler, R.; Díaz de-la-Garza, R.I. GridMass: A fast two-dimensional feature detection method for LC/MS. J. Mass Spectrom. 2015, 50, 165–174. [Google Scholar] [CrossRef] [PubMed]
  24. Tautenhahn, R.; Boettcher, C.; Neumann, S. Highly sensitive feature detection for high resolution LC/MS. BMC Bioinform. 2008, 9, 504. [Google Scholar] [CrossRef] [PubMed] [Green Version]
  25. Li, L.; Zhao, J.; Wang, C.; Yan, C. Comprehensive evaluation of robotic global performance based on modified principal component analysis. Int. J. Adv. Robot. Syst. 2020, 17, 1729881419896881. [Google Scholar] [CrossRef]
  26. Maaten, L.v.d.; Hinton, G. Visualizing data using t-SNE. J. Mach. Learn. Res. 2008, 9, 2579–2605. [Google Scholar]
  27. Cloarec, O.; Dumas, M.-E.; Craig, A.; Barton, R.H.; Trygg, J.; Hudson, J.; Blancher, C.; Gauguier, D.; Lindon, J.C.; Holmes, E. Statistical total correlation spectroscopy: An exploratory approach for latent biomarker identification from metabolic 1H NMR data sets. Anal. Chem. 2005, 77, 1282–1289. [Google Scholar] [CrossRef]
  28. Bylesjo, M.; Rantalainen, M.; Cloarec, O.; Nicholson, J.K.; Holmes, E.; Trygg, J. OPLS discriminant analysis: Combining the strengths of PLS-DA and SIMCA classification. J. Chemom. 2006, 20, 341–351. [Google Scholar] [CrossRef]
  29. Guijas, C.; Montenegro-Burke, J.R.; Domingo-Almenara, X.; Palermo, A.; Warth, B.; Hermann, G.; Koellensperger, G.; Huan, T.; Uritboonthai, W.; Aisporna, A.E. METLIN: A technology platform for identifying knowns and unknowns. Anal. Chem. 2018, 90, 3156–3164. [Google Scholar] [CrossRef] [Green Version]
  30. Ivanova, P.T.; Milne, S.B.; Myers, D.S.; Brown, H.A. Lipidomics: A mass spectrometry based systems level analysis of cellular lipids. Curr. Opin. Chem. Biol. 2009, 13, 526–531. [Google Scholar] [CrossRef] [Green Version]
  31. Horai, H.; Arita, M.; Kanaya, S.; Nihei, Y.; Ikeda, T.; Suwa, K.; Ojima, Y.; Tanaka, K.; Tanaka, S.; Aoshima, K. MassBank: A public repository for sharing mass spectral data for life sciences. J. Mass Spectrom. 2010, 45, 703–714. [Google Scholar] [CrossRef] [PubMed]
  32. Matsuda, F.; Yonekura-Sakakibara, K.; Niida, R.; Kuromori, T.; Shinozaki, K.; Saito, K. MS/MS spectral tag-based annotation of non-targeted profile of plant secondary metabolites. Plant J. 2009, 57, 555–577. [Google Scholar] [CrossRef] [PubMed] [Green Version]
  33. Röst, H.L.; Sachsenberg, T.; Aiche, S.; Bielow, C.; Weisser, H.; Aicheler, F.; Andreotti, S.; Ehrlich, H.-C.; Gutenbrunner, P.; Kenar, E. OpenMS: A flexible open-source software platform for mass spectrometry data analysis. Nat. Methods 2016, 13, 741–748. [Google Scholar] [CrossRef] [PubMed]
  34. Bijlsma, S.; Bobeldijk, I.; Verheij, E.R.; Ramaker, R.; Kochhar, S.; Macdonald, I.A.; Van Ommen, B.; Smilde, A.K. Large-scale human metabolomics studies: A strategy for data (pre-) processing and validation. Anal. Chem. 2006, 78, 567–574. [Google Scholar] [CrossRef]
  35. Chong, J.; Xia, J. MetaboAnalystR: An R package for flexible and reproducible analysis of metabolomics data. Bioinformatics 2018, 34, 4313–4314. [Google Scholar] [CrossRef] [Green Version]
  36. Triba, M.N.; Le Moyec, L.; Amathieu, R.; Goossens, C.; Bouchemal, N.; Nahon, P.; Rutledge, D.N.; Savarin, P. PLS/OPLS models in metabolomics: The impact of permutation of dataset rows on the K-fold cross-validation quality parameters. Mol. Biosyst. 2015, 11, 13–19. [Google Scholar] [CrossRef]
  37. Creydt, M.; Arndt, M.; Hudzik, D.; Fischer, M. Plant metabolomics: Evaluation of different extraction parameters for nontargeted UPLC-ESI-QTOF-Mass spectrometry at the example of white Asparagus officinalis. J. Agric. Food Chem. 2018, 66, 12876–12887. [Google Scholar] [CrossRef]
  38. Hsu, P.C.; Lan, R.S.; Brasky, T.M.; Marian, C.; Cheema, A.K.; Ressom, H.W.; Loffredo, C.A.; Pickworth, W.B.; Shields, P.G. Metabolomic profiles of current cigarette smokers. Mol. Carcinog. 2017, 56, 594–606. [Google Scholar] [CrossRef] [Green Version]
  39. Rabara, R.C.; Tripathi, P.; Rushton, P.J. Comparative metabolome profile between tobacco and soybean grown under water-stressed conditions. Biomed Res. Int. 2017, 2017, 3065251. [Google Scholar] [CrossRef] [Green Version]
  40. Zhao, J.; Li, L.; Zhao, Y.; Zhao, C.; Chen, X.; Liu, P.; Zhou, H.; Zhang, J.; Hu, C.; Chen, A. Metabolic changes in primary, secondary, and lipid metabolism in tobacco leaf in response to topping. Anal. Bioanal. Chem. 2018, 410, 839–851. [Google Scholar] [CrossRef]
  41. Ishida, N. A Simultaneous analytical method to profile non-volatile components with low polarity elucidating differences between tobacco leaves using atmospheric pressure chemical ionization mass spectrometry detection. Beiträge Zur Tab. Int./Contrib. Tob. Res. 2016, 27, 60–74. [Google Scholar] [CrossRef] [Green Version]
  42. Madala, N.E.; Piater, L.A.; Steenkamp, P.A.; Dubery, I.A. Multivariate statistical models of metabolomic data reveals different metabolite distribution patterns in isonitrosoacetophenone-elicited Nicotiana tabacum and Sorghum bicolor cells. SpringerPlus 2014, 3, 254. [Google Scholar] [CrossRef] [PubMed] [Green Version]
  43. Leffingwell, J.C. Chemical constituents of tobacco leaf and differences among tobacco types. Chem. Prepr. Arch. 2001, 2001, 173–232. [Google Scholar]
  44. Rizzato, G.; Scalabrin, E.; Radaelli, M.; Capodaglio, G.; Piccolo, O. A new exploration of licorice metabolome. Food Chem. 2017, 221, 959–968. [Google Scholar] [CrossRef]
  45. Tugizimana, F.; Steenkamp, P.A.; Piater, L.A.; Dubery, I.A. Multi-platform metabolomic analyses of ergosterol-induced dynamic changes in Nicotiana tabacum cells. PLoS ONE 2014, 9, e87846. [Google Scholar] [CrossRef] [Green Version]
  46. Cho, K.; Kim, Y.; Wi, S.J.; Seo, J.B.; Kwon, J.; Chung, J.H.; Park, K.Y.; Nam, M.H. Nontargeted metabolite profiling in compatible pathogen-inoculated tobacco (Nicotiana tabacum L. cv. Wisconsin 38) using UPLC-Q-TOF/MS. J. Agric. Food Chem. 2012, 60, 11015–11028. [Google Scholar] [CrossRef]
  47. Beato, V.M.; Navarro-Gochicoa, M.T.; Rexach, J.; Herrera-Rodríguez, M.B.; Camacho-Cristóbal, J.J.; Kempa, S.; Weckwerth, W.; González-Fontes, A. Expression of root glutamate dehydrogenase genes in tobacco plants subjected to boron deprivation. Plant Physiol. Biochem. 2011, 49, 1350–1354. [Google Scholar] [CrossRef]
  48. Xu, J.; Chen, Z.; Wang, F.; Jia, W.; Xu, Z. combined transcriptomic and metabolomic analyses uncover rearranged gene expression and metabolite metabolism in tobacco during cold acclimation. Sci. Rep. 2020, 10, 1–13. [Google Scholar] [CrossRef]
  49. Scalabrin, E.; Radaelli, M.; Rizzato, G.; Bogani, P.; Buiatti, M.; Gambaro, A.; Capodaglio, G. Metabolomic analysis of wild and transgenic Nicotiana langsdorffii plants exposed to abiotic stresses: Unraveling metabolic responses. Anal. Bioanal. Chem. 2015, 407, 6357–6368. [Google Scholar] [CrossRef]
  50. Arndt, D.; Wachsmuth, C.; Buchholz, C.; Bentley, M. A complex matrix characterization approach, applied to cigarette smoke, that integrates multiple analytical methods and compound identification strategies for non-targeted liquid chromatography with high-resolution mass spectrometry. Rapid Commun. Mass Spectrom. 2020, 34, e8571. [Google Scholar] [CrossRef] [Green Version]
  51. Moco, S.; Bino, R.J.; Vorst, O.; Verhoeven, H.A.; de Groot, J.; van Beek, T.A.; Vervoort, J.; De Vos, C.R. A liquid chromatography-mass spectrometry-based metabolome database for tomato. Plant Physiol. 2006, 141, 1205–1218. [Google Scholar] [CrossRef] [PubMed] [Green Version]
  52. Torras-Claveria, L.; Jáuregui, O.; Codina, C.; Tiburcio, A.F.; Bastida, J.; Viladomat, F. Analysis of phenolic compounds by high-performance liquid chromatography coupled to electrospray ionization tandem mass spectrometry in senescent and water-stressed tobacco. Plant Sci. 2012, 182, 71–78. [Google Scholar] [CrossRef] [PubMed]
  53. Claassen, C.; Kuballa, J.r.; Rohn, S. Metabolomics-Based approach for the discrimination of potato varieties (Solanum tuberosum) using UPLC-IMS-QToF. J. Agric. Food Chem. 2019, 67, 5700–5709. [Google Scholar] [CrossRef] [PubMed]
  54. Tsaballa, A.; Sarrou, E.; Xanthopoulou, A.; Tsaliki, E.; Kissoudis, C.; Karagiannis, E.; Michailidis, M.; Martens, S.; Sperdouli, E.; Hilioti, Z. Comprehensive approaches reveal key transcripts and metabolites highlighting metabolic diversity among three oriental tobacco varieties. Ind. Crop. Prod. 2020, 143, 111933. [Google Scholar] [CrossRef]
  55. Popova, V.; Ivanova, T.; Stoyanova, A.; Nikolova, V.; Hristeva, T.; Gochev, V.; Yonchev, Y.; Nikolov, N.; Zheljazkov, V.D. Terpenoids in the essential oil and concentrated aromatic products obtained from Nicotiana glutinosa L. Leaves. Molecules 2020, 25, 30. [Google Scholar] [CrossRef] [Green Version]
  56. Jassbi, A.R.; Zare, S.; Asadollahi, M.; Schuman, M.C. Ecological roles and biological activities of specialized metabolites from the genus Nicotiana. Chem. Rev. 2017, 117, 12227–12280. [Google Scholar] [CrossRef]
  57. Tsugawa, H.; Kind, T.; Nakabayashi, R.; Yukihira, D.; Tanaka, W.; Cajka, T.; Saito, K.; Fiehn, O.; Arita, M. Hydrogen rearrangement rules: Computational MS/MS fragmentation and structure elucidation using MS-FINDER software. Anal. Chem. 2016, 88, 7946–7958. [Google Scholar] [CrossRef]
  58. Chang, Y.; Zhao, C.; Zhu, Z.; Wu, Z.; Zhou, J.; Zhao, Y.; Lu, X.; Xu, G. Metabolic profiling based on LC/MS to evaluate unintended effects of transgenic rice with cry1Ac and sck genes. Plant Mol. Biol. 2012, 78, 477–487. [Google Scholar] [CrossRef]
  59. Vinatoru, M. An overview of the ultrasonically assisted extraction of bioactive principles from herbs. Ultrason. Sonochem. 2001, 8, 303–313. [Google Scholar] [CrossRef]
  60. Lisuma, J.; Mbega, E.; Ndakidemi, P. Influence of Tobacco Plant on Macronutrient Levels in Sandy Soils. Agronomy 2020, 10, 418. [Google Scholar] [CrossRef] [Green Version]
  61. Morita, M.; Shitan, N.; Sawada, K.; Van Montagu, M.C.; Inzé, D.; Rischer, H.; Goossens, A.; Oksman-Caldentey, K.-M.; Moriyama, Y.; Yazaki, K. Vacuolar transport of nicotine is mediated by a multidrug and toxic compound extrusion (MATE) transporter in Nicotiana tabacum. Proc. Natl. Acad. Sci. USA 2009, 106, 2447–2452. [Google Scholar] [CrossRef] [PubMed] [Green Version]
  62. Abo-Zaid, G.A.; Matar, S.M.; Abdelkhalek, A. Induction of Plant Resistance against Tobacco Mosaic Virus Using the Biocontrol Agent Streptomyces cellulosae Isolate Actino 48. Agronomy 2020, 10, 1620. [Google Scholar] [CrossRef]
  63. Kachlicki, P.; Piasecka, A.; Stobiecki, M.; Marczak, Ł. Structural characterization of flavonoid glycoconjugates and their derivatives with mass spectrometric techniques. Molecules 2016, 21, 1494. [Google Scholar] [CrossRef] [PubMed] [Green Version]
Scheme 1. Schematic diagram of untargeted metabolomic analysis of Nicotiana tabacum L. (NTL) leaves based on liquid chromatography mass spectrometry (LC-MS). The untargeted metabolomic analysis based on LC-MS are mainly divided into the following six parts: extraction of metabolites of NTL leaves of different maturity grades, LC-MS analysis of the extracted metabolites, data preprocessing of LC-MS raw data, dimensionality reduction and visualization based on peak table, classification of samples with different maturity grades based on peak table, and identification of different metabolites.
Separations 08 00009 sch001
Figure 1. Curing curve of bulk curing barn in NTL growing area. The red and blue lines show the change in dry/wet bulb temperature of roasting with the curing time, respectively.
Separations 08 00009 g001
Figure 2. Flow chart of identification of differential metabolites in the flue-cured NTL leaves from three different maturity grades. At the first stage, metabolites were identified by searching the self-built library of Solanaceae plants (NTL, Tomato, Potato, Eggplant). At the second stage, metabolites are identified by searching the metabolomic libraries (KNApSAcK, LipidMAPS, PlantCyc, NANPDB) of plants in MS-FINDER and matching their spectra. At the third stage, metabolites are putatively identified by searching in METLIN, which stored a large number of small molecule metabolites.
Separations 08 00009 g002
Figure 3. Histogram of the number of peaks and peak areas with different proportions of methanol and water. (A) Total number of peaks of the flue-cured NTL leaves extracted by different proportions of methanol and water; (B) total number of peak areas of the leaves extracted by different proportions of methanol and water.
Separations 08 00009 g003
Figure 4. Histogram of the number of peaks and peak areas with different ultrasound times. (A) Total number of peaks of the flue-cured NTL leaves extracted with different ultrasound times; (B) total number of peak areas of the leaves extracted with different ultrasound times.
Separations 08 00009 g004
Figure 5. The base peak chromatogram of the flue-cured NTL leaves from different maturity grades. (A) The base peak chromatograms (BPC) plot of unripe leaves at m/z range of 50–1000; (B) the BPC plot of ripe leaves at m/z range of 50–1000; (C) the BPC plot of overripe leaves at m/z range of 50–1000.
Separations 08 00009 g005
Figure 6. Investigation of method repeatability, instrument stability, intraday precision, and interday precision in different relative standard deviation (RSD) ranges. The histogram represents a percentage of feature number with corresponding range of RSD. The lines represent percentage of peak area with corresponding range of RSD.
Separations 08 00009 g006
Figure 7. Scatter plot of the first principal component of eleven QC samples (triangles). This analysis showed that the standard deviation of QC samples was within ±2 SD, indicating that the results was reliable.
Separations 08 00009 g007
Figure 8. The t-SNE visualization of the flue-cured NTL leaves from three different maturity grades. They were clustered into three groups according their maturity degrees. This indicated that the maturity grades were closely related to their own metabolites.
Separations 08 00009 g008
Figure 9. Results of OPLS-DA analysis of the flue-cured NTL leaves from different maturity grades. (A) Score plot of OPLS-DA model between unripe and ripe samples; (B) the permutations plot for OPLS-DA model between unripe and ripe samples, R2 = (0.0, 0.771), Q2 = (0.0, −0.598); (C) score plot of OPLS-DA between overripe and ripe samples; (D) the permutations plot of OPLS-DA model between overripe and ripe samples, R2 = (0.0, 0.411), Q2 = (0.0, −0.589); (E) score plot of OPLS-DA model between overripe and unripe samples; (F) the permutations plot of OPLS-DA model between overripe and unripe samples, R2 = (0.0, 0.618), Q2 = (0.0, −0.781) of overripe and unripe samples. All blue Q2-values to the left are lower than the original points to the right, and the blue regression line of the Q2-points intersect the vertical axis below zero. This indicates that these models are not over-fitting.
Separations 08 00009 g009
Figure 10. Results of hierarchical cluster analysis (HCA) of the flue-cured NTL leaves from different maturity grades. (A) HCA of differential metabolites between overripe and ripe leaves; (B) HCA of differential metabolites between unripe and ripe leaves; (C) HCA of differential metabolites between unripe and overripe leaves.
Separations 08 00009 g010
Figure 11. The differential alkaloids between different maturity grades. (A) Nicotine-1′-N-oxide; (B) Harman; (C) N-Octanoylnornicotine, in the methanol extracts of the flue-cured NTL leaves. All data represent the mean values ± standard errors. The asterisks represent significant differences. One asterisk 0.05 ≧ p > 0.01, two asterisks 0.01 ≧ p  > 0.001, three asterisks p ≧ 0.001.
Separations 08 00009 g011
Figure 12. The differential phenols and lipids between different maturity grades. (A) Kaempferol 3-rutinoside-4′-glucoside; (B) Quercetin 3-rutinoside 7-galactoside; (C) Cer(d18:0/14:0); (D) DG(20:5(5Z,8Z,11Z,14Z)/14:0/0:0), in the methanol extracts of the flue-cured NTL leaves. All data represent the mean values ± standard error. The asterisks represent significant differences. One asterisk 0.05 ≧ p > 0.01, two asterisks 0.01 ≧ p > 0.001, three asterisks p ≦ 0.001.
Separations 08 00009 g012
Table 1. The detailed information of Nicotiana tabacum L. (NTL) samples.
Maturity GradeProducing AreaVarietyGrowth PeriodHARVEST PERIODNumber of Samples
Unripe sampleYunnan, ChinaK326April to August, 2020Transplanted for 70 days15
Ripe sampleYunnan, ChinaK326April to August, 2020Transplanted for 80 days15
Overripe sampleYunnan, ChinaK326April to August, 2020Transplanted for 90 days15
Publisher’s Note: MDPI stays neutral with regard to jurisdictional claims in published maps and institutional affiliations.

