Article

Grafting of Acrylic Membrane Prepared from Fibers Waste for Dyes Removal: Methylene Blue and Congo Red

1
Egyptian Petroleum Research Institute (EPRI), Nasr City, Cairo 11727, Egypt
2
National Research Centre (NRC), Polymers & Pigments Department, 33 El-Buhouth St. Dokki, Cairo 12622, Egypt
3
Faculty of Biotechnology, October University for Modern Sciences & Arts (MSA University), 6th October City 12451, Egypt
4
Department of Biotechnology, College of Science, Taif University, P.O. Box 11099, Taif 21944, Saudi Arabia
5
Department of Chemistry, College of Science, Taif University, P.O. Box 11099, Taif 21944, Saudi Arabia
*
Author to whom correspondence should be addressed.
Submission received: 27 January 2021 / Revised: 23 March 2021 / Accepted: 25 March 2021 / Published: 1 April 2021

Abstract

:
Dyes are a type of pollutant that have been discharged into water streams by various industries and had harmful effects on the environment and human health. Therefore, present work was directed to recycle acrylic fibers waste to be used as an adsorbent to exclude dyes such as methylene blue (MB) and Congo red (CR) from dyes-polluted wastewater. Acrylic fibers waste was converted into membrane followed by chemical grafting with p-phenylenediamine monomer to form functional modified membranes. Afterwards, some characterization analyses; Fourier transform-infrared, scanning electron microscope, swelling behavior, and porosity properties were performed for the acrylic fiber grafted membrane (AFGM). For obtaining the best conditions that permit the highest adsorption capacity of the AFGM, some preliminary experiments followed by general full factorial design experiments were displayed. Langmuir, Freundlich isotherms and kinetic studies evaluations were applied. Results revealed that, the adsorption capacities of the AFGM were 61% for Methylene blue and 86% for Congo red that stated the high affinity of the AFGM to the anionic dyes. The reusability of the AFGM membranes in different cycles for 3Rs processes “Removal, Recovery, and Re-use” indicated the efficiency of the AFGM to be used in wastewater treatment.

1. Introduction

Dyes are a valuable class of organic synthetic compounds that were used in many industries, particularly textiles as a coloring agent. Therefore, dyes have become one of the common pollutants to environment and water stream, either during their synthesis process or during the textile dyeing process [1]. Discharging of dyes-contaminated effluents into water flow had a harmful effect on the environment even at a small residue of dye due to their highly visible colors even at low dye concentration. Dyes are toxic and non-degradable compounds and when release into the natural sources of water they prevent the light-penetration into the aquatic plants and further disturb their photosynthesis process [2]. Furthermore, they had wide negative effects on human health where they cause dermatitis, allergies, skin irritation, cancers, reproductive and kidneys system damaging [3,4]. Hence, many conventional and non-conventional treatments approaches were developed for dyes removal from contaminated wastewater [5,6,7,8,9]. Dyes are normally not easily treated using conventional wastewater-treatment methods due to their inhibitory and recalcitrant nature [10,11,12,13,14]. Most of dyes are synthetic and has an aromatic complex molecular structure, and these make them more stable and non-biodegradable [15]. These were why non-conventional, safe, economically, and eco-friendly dyes removal-approaches “adsorption” was suggested by a lot of researchers, lately. Adsorption is a non-conventional method by which dyes may adsorb on the surface of the adsorbent material [16,17,18]. For instance, adsorption by natural polymeric substances is one of the most promising non-conventional approach and applicable methods for pollutants removal from contaminated wastewater [19,20]. This property may be attributed to their potentiality to have different shapes, simple processing, and easy regeneration [21,22,23]. Electro-spun nanofibrous polyimides with ion exchange performance were prepared as adsorptive membranes for the treatment of dye-loaded textile wastewater [24,25]. One of the most fibers forming polymers used in textile production is acrylic polymers (acrylic fibers) due to their versatile properties. The acrylic fibers consist mainly of nearly 85–90% acrylonitrile, whereas the residual is another acrylic monomer such as acrylic ester or acid that were added during the synthesis process of acrylic fibers in order to enhance certain property for example dyeability or processing [26]. Acrylic fiber wastes produced by textile industry may cause environmental problems. Therefore, many researchers tried to reuse the fiber waste as in concrete and soil enforcement and in adsorption process but after chemical treatment [27,28,29]. Wang et al. functionalized polyacrylonitrile fibers (PANF-g-CDs) with amine rich carbon dots via the hydrothermal method and used them to remove anionic dyes from wastewater. The PANF-g-CDs showed high adsorption capacity (422 mg/g) for methyl orange [30]. Therefore, the ongoing study aimed to use a synthetic polymeric membrane obtained from acrylic fibers waste to formulate an acrylic membrane. After that, chemical grafting polymerization of p-phenylenediamine was performed in order to form functional modified membranes. The morphology and the functional groups of AFGM were evaluated by scanning electron microscope (SEM), and Fourier transform infrared (FT-IR). Together with the porosity, swelling and adsorption assays, they allowed the characterization of AFGM. The AFGM was used for methylene blue (MB) and Congo red (CR) removal from polluted synthetic wastewater using static model. “However, most adsorption studies were used the shaking model to obtain the highest pollutant removal efficiency. A static model was applied to reduce the adsorption costs for an easily industrial application.” Furthermore, the optimization process was performed for the membrane to get the highest MB and CR removal capacity, such optimization as studying one factor’s effect while keeping all other parameters constant [26]. Such optimization experiments were followed by general full factorial design experiment by studying more than one factor at the same time [20]. Langmuir, Freundlich and kinetic studies were applied for the AFGM. Additionally, the AFGM was studied for recovery and reuse application to achieve at the end a product with 3Rs applications (removal, recovery and reuse).

2. Materials and Methods

2.1. Materials

Acrylic fibers waste was collected from local textile company; these fibers were synthetic fibers made from at least 85% acrylonitrile monomer and the residual other acrylic monomer mainly vinyl acetate or methyl acrylate. Polyethylene glycol (PEG) molecular weight 600 was purchased from Aldrich. Methylene blue as cationic dye and Congo red as anionic dye were supplied from Merck. Dimethylformamide was supplied from Sigma Aldrich. All used chemicals are of purity higher than 99%. NaOH and HCl were of analytical grade, and they were supplied from El-Nasr Company Egypt.

2.2. Membrane Preparation

Acrylic fibers waste conversion to membranes were employed by applying a phase inversion technique [31,32]. At first, acrylic fibers waste (1.7 g) was dissolved in (9 mL) dimethyl formaldehyde (DMF) in a conical flask at 60 °C under magnetic stirring until complete dissolution. Afterwards, polyethylene glycol (PEG) with 5% respect to the polymer was added to the solution as a pore former to improve the membrane porosity. Afterword, the solution was poured and casted on a clean dried glass plate by using a casting knife of 250 µm thickness. The glass plate which contains the casted solution was immersed in coagulated water bath without any evaporation process, for at least 1h. After that, the membrane was removed, rinsed with water and air dried.

2.3. Membrane Grafting

After membrane preparation, it was grafted with p-phenylenediamine via oxidative polymerization technique [33]. The membrane was immersed in a solution of p-phenylenediamine that was dissolved in 1M HCl and left for 1h to allow the monomer to penetrate within the membrane. Afterwards, ammonium persulfate (equal molar ratio p-phenylenediamine) was dissolved in 1M HCl and added slowly to the solution under mild shaking then left for a night at room temperature. The solution and the membrane became dark black, which indicated the formation of the AFGM chains and formation of poly-phenylenediamine. The membranes were removed and washed several times with distilled water until the rinse water become clear and the pH present neutrality. The membranes weight was recorded before and after grafting and the grafting percentage was calculated by applying Equation (1):
G r a f t i n g   ( % ) = ( W g W 0 ) W 0 × 100
where, Wg is the dry membrane polymer weight after grafting, and W0 is membrane polymer weigh before grafting (zero (0) time).

2.4. Dyes Preparation

Methylene blue (MB) (C16H18ClN3S; 319.85 g/mol) and Congo red (CR) (C32H22N6Na2O6S2; 696.665 g/mol) dyes were used for adsorption experiments. A stock solution of 1000 mg/L of MB and CR dyes were prepared by dissolving 1 g from each dry powder dye into 1 L of distilled water. After that, serial dilutions were applied to prepare the desired concentration throughout this study.

2.5. Charcterzation of AFGM

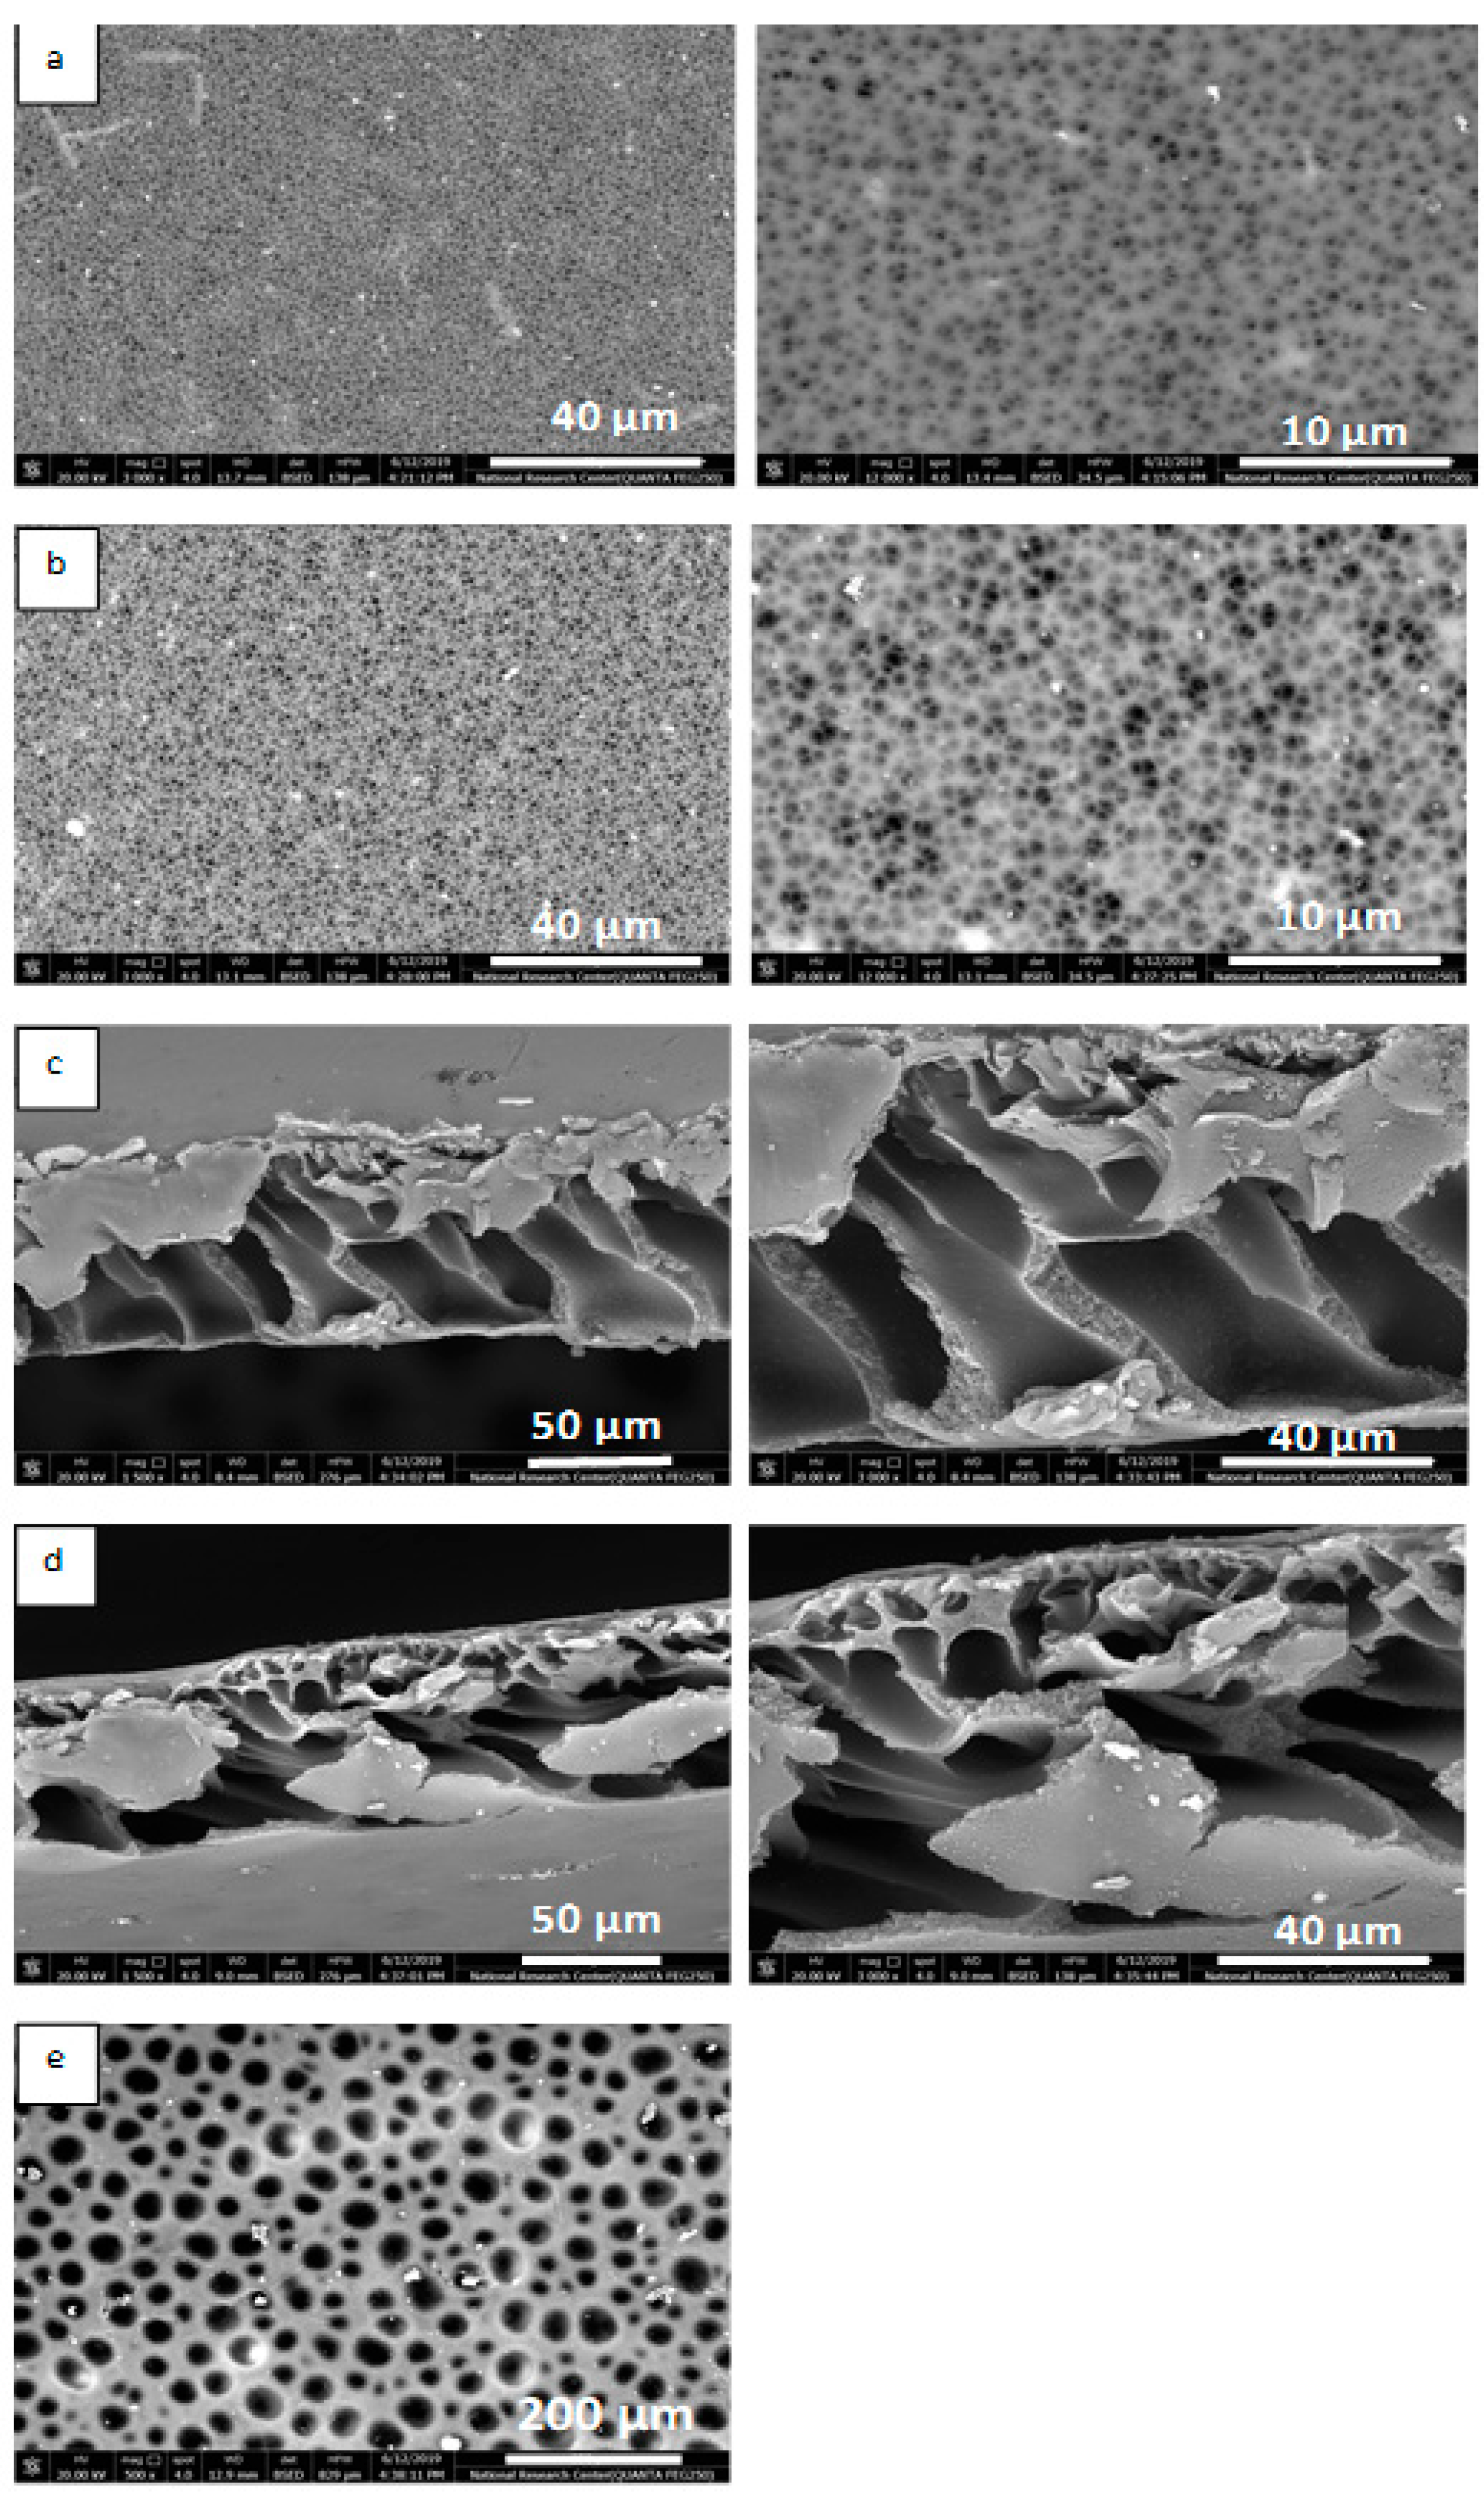
2.5.1. Scanning Electron Microscope (SEM)

The morphology of the AFGM surface was characterized using scanning electron microscopy (SEM) of high resolution (QUANTA FEG 250, ESEM, operated with an accelerating voltage of 200–30 kV and an operating voltage of 5–30 kV). Regarding to the examination, the membranes were sputter-coated by gold where S150A Sputter Coater-Edwards were used.

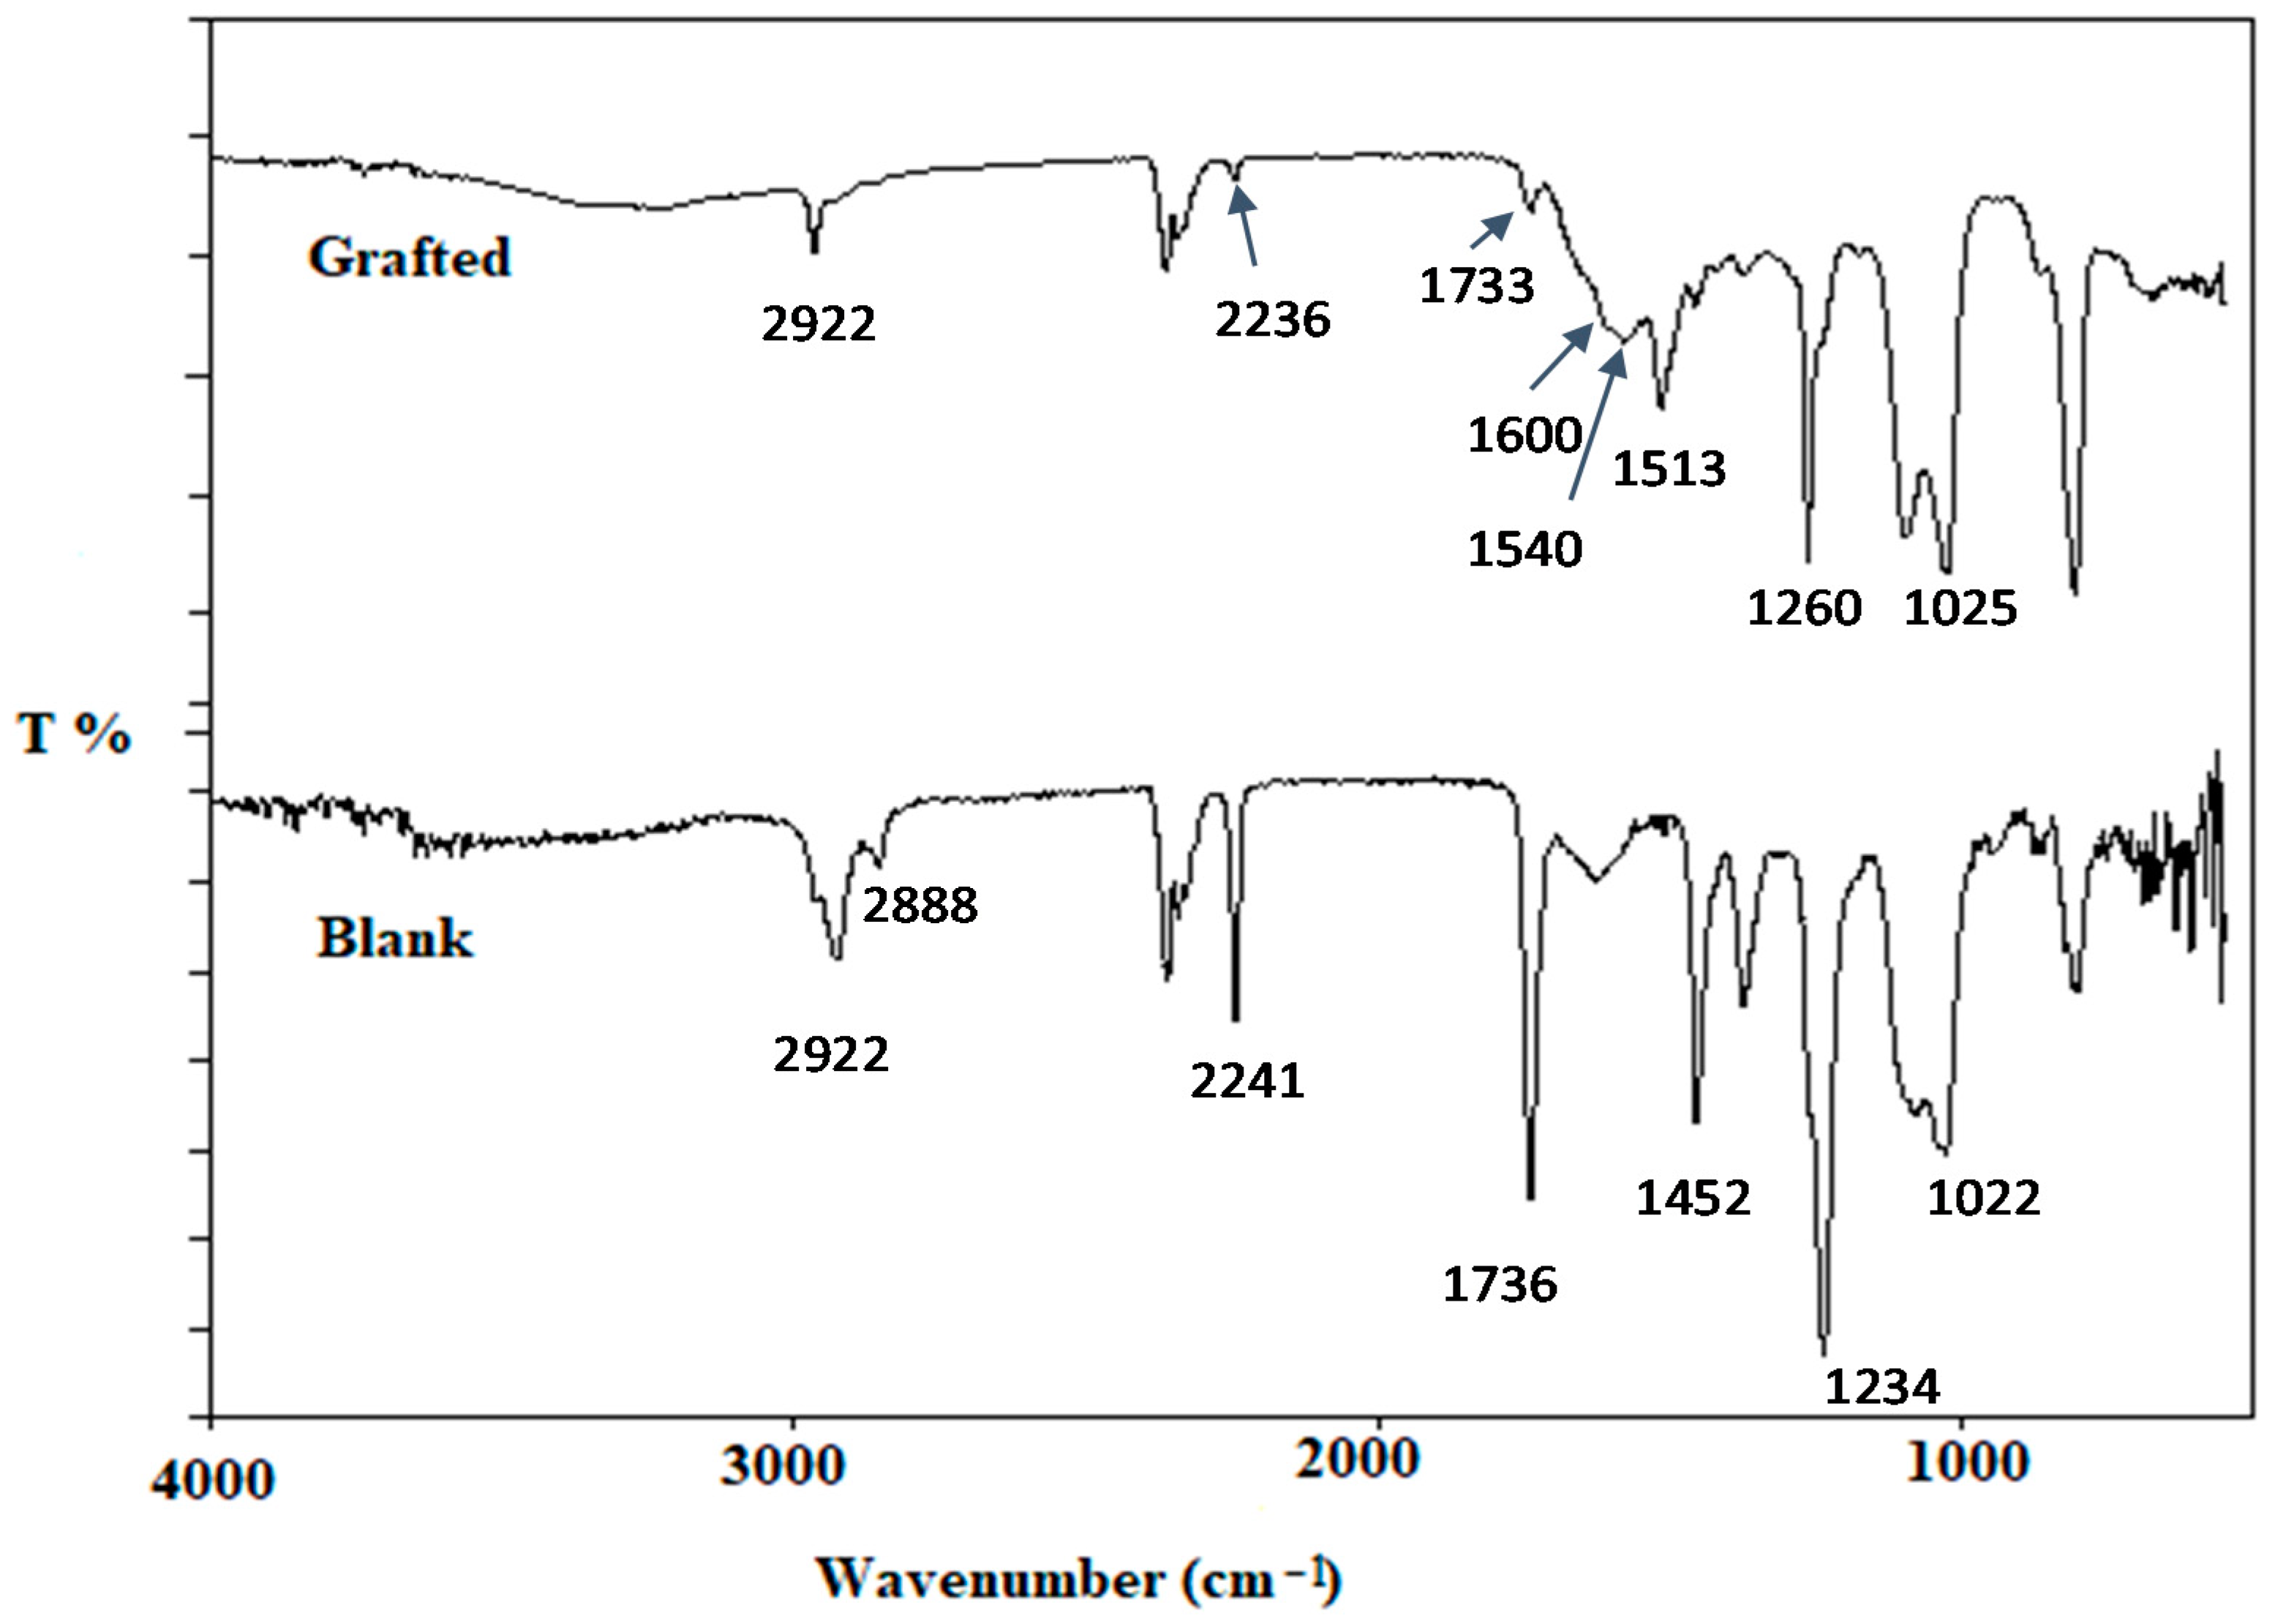
2.5.2. Fourier Transform Infrared (FT-IR)

Dried membrane’s material after and before grafting were evaluated using FT-IR Spectroscopy to detect the membranes functional groups by using a wavelength range from 400–4000 cm−1.

2.5.3. Porosity

The membrane porosity was estimated using dry–wet-weight method [24,25,34,35]. The membrane samples (3 cm × 3 cm) were weighted dry (Wdry) and immersed in distilled water for a day. The wet-weight (Wwet) was assessed after removing the excess water using filter paper. The membrane porosity was calculated by the Equation (2):
ε   ( % )   =   [ Wwet Wdry   dwAh ]   ×   100
where ε refers to the membrane porosity, dw refers to the density of pure water (0.998 g/cm3), A refers to the membrane area in the wet state (cm2) and h refers to the membrane thickness in the wet state (cm).

2.5.4. Swelling

The AFGM swelling property was evaluated by immersing the membrane samples (3  ×  3 cm2) into 250 mL distilled water at a room temperature (±20 °C) in atmospheric conditions until swelling equilibrium was obtained [36]. The assay was performed in triplicate. Afterwards, the AFGM was removed from the water and dried with filter paper and weighed. Additionally, the swelling capacity was calculated by the Equation (3):
S w e l l i n g ( % ) = W 2 W 1 W 1 × 100
where W1 (g) and W2 (g) indicate the weights of the dried and swollen membranes, respectively.

2.6. Adsorption and Optimization Experiments

A weighted amount of the AFGM was added to the dyes polluted solution. The dyes concentration was quantified before and after the treatment with a UV-Visible spectrophotometer (Cary 100 UV–Vis) at 668 nm and 497 nm for MB and CR, respectively. The removal efficiency of MB and CR was estimated by the Equation (4):
R e m o v a l   e f f e c i e n c y   ( % ) = C o C e C o × 100
where Co represented the initial dye concentration and Ce represented the final concentration.
The adsorption capacity (Qe) was calculated by the Equation (5)
A d s o r p t i o n   c a p a c i t y   ( Q e   ( mg g ) ) = C o C e m × V
where Co represented the initial dye concentration and Ce represented the final concentration. V is the volume of the solution (l) and m is the mass of adsorbent employed (g).
Different parameters were optimized through the preliminary optimization by one-factor-at-a-time (OFAT). The optimization of adsorption process was processed by studying the effect of different time intervals “0.5, 1, 3, 6, 10, 15” h, different pH “3, 5, 7” and different dye concentrations “50, 100, 150, and 200 mg/L”. Three replicates by parameter were performed. Its standard deviation is express with error bars in respective figures. The adsorption procedure evaluated by the full factorial experimental allowed to define the optimum parameters to obtain the highest removal efficiencies for MB and CR and tested as follows.

2.7. Full Factorial Design

Full factorial design experiment was displayed according to the selected low and high levels of the factors that were determined by the OFAT and displayed in Table 1. The matrix of the factorial design and the measured MB and CR removal efficiencies were shown in Table 2 with fits and residuals values. After that, the results were demonstrated with the Minitab @18 software and the resulted plots were displayed and interpreted [37].

2.8. Langmuir and Freundlich Isotherms

Langmuir and Freundlich isotherms were used to determine the MB and the CR adsorption mechanism by the AFGM. Linear form of Langmuir and Freundlich isotherms were applied as follows:

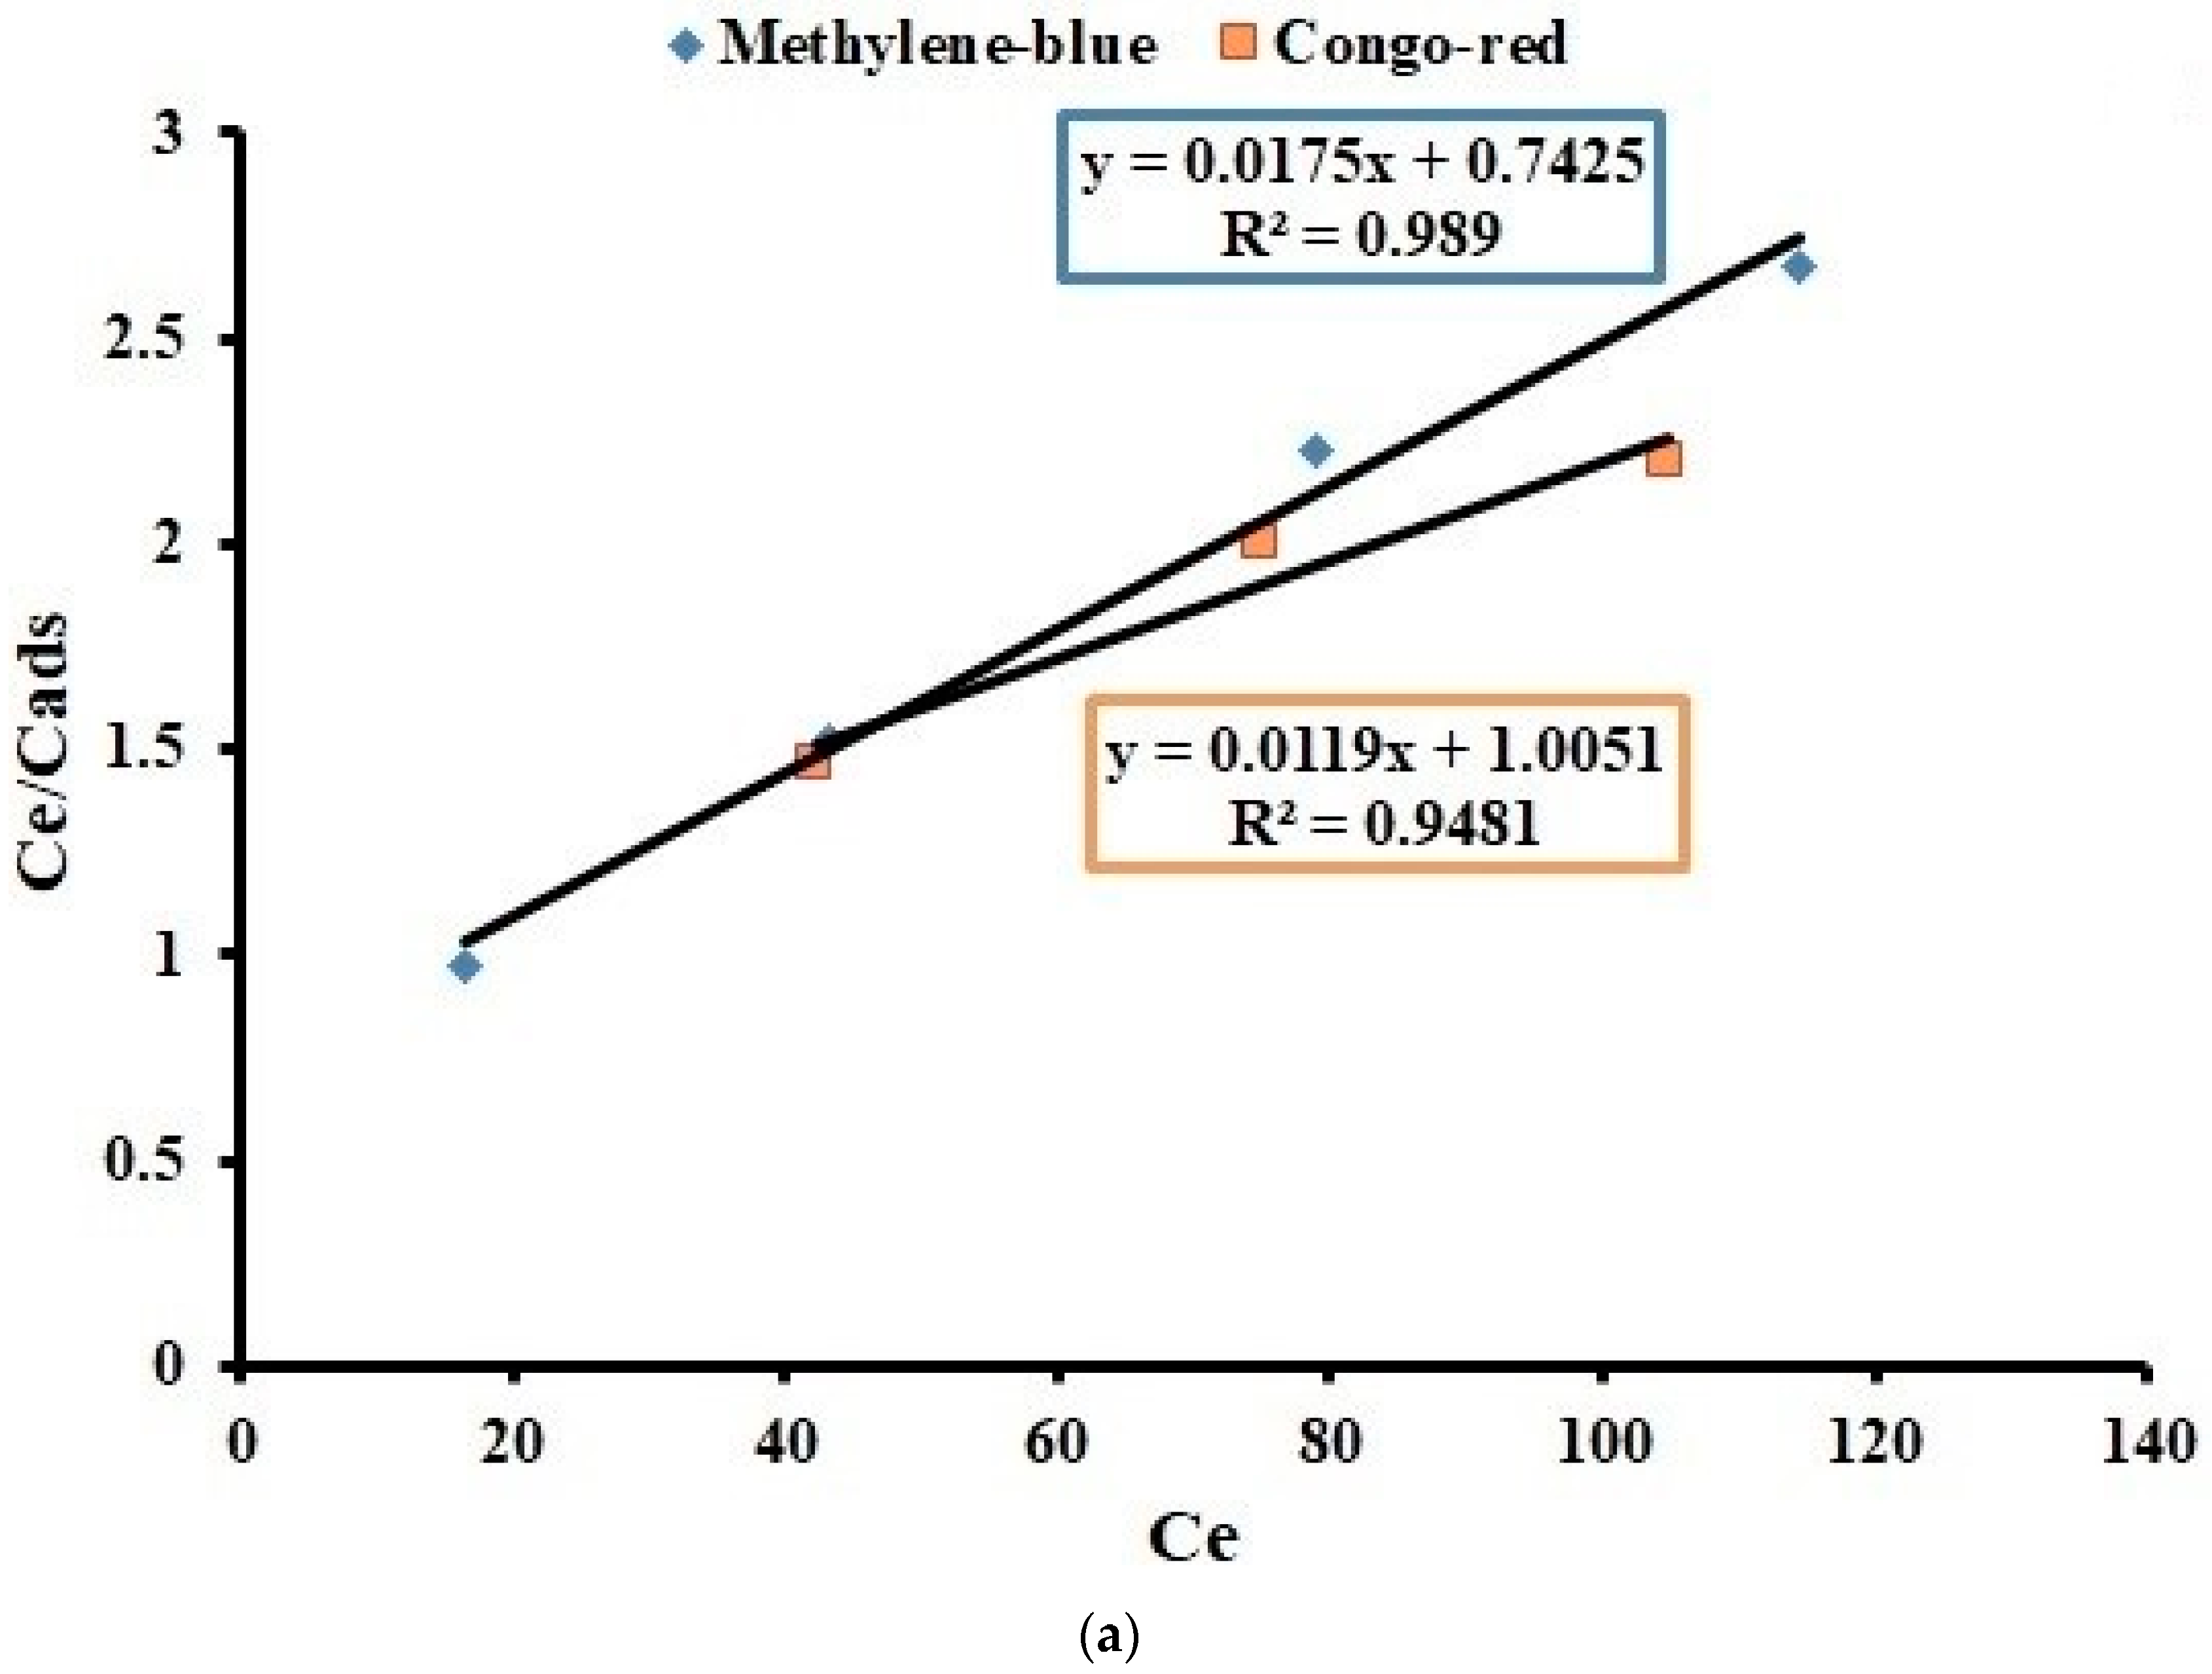
2.8.1. Langmuir Isotherm

Maximum adsorption capacity of the AFGM towards MB and the CR were studied by applying Equation (6) [38]:
C e Q e = C e Q m a x + 1 b Q m a x
where b represents a constant related to the AFGM adsorption/desorption capacity, and Qmax is the maximum adsorption capacity of the AFGM upon complete saturation of its surface, Ce (mg/L) is the dye concentration at equilibrium and Qe (mg/g) is the adsorption capacity at equilibrium.

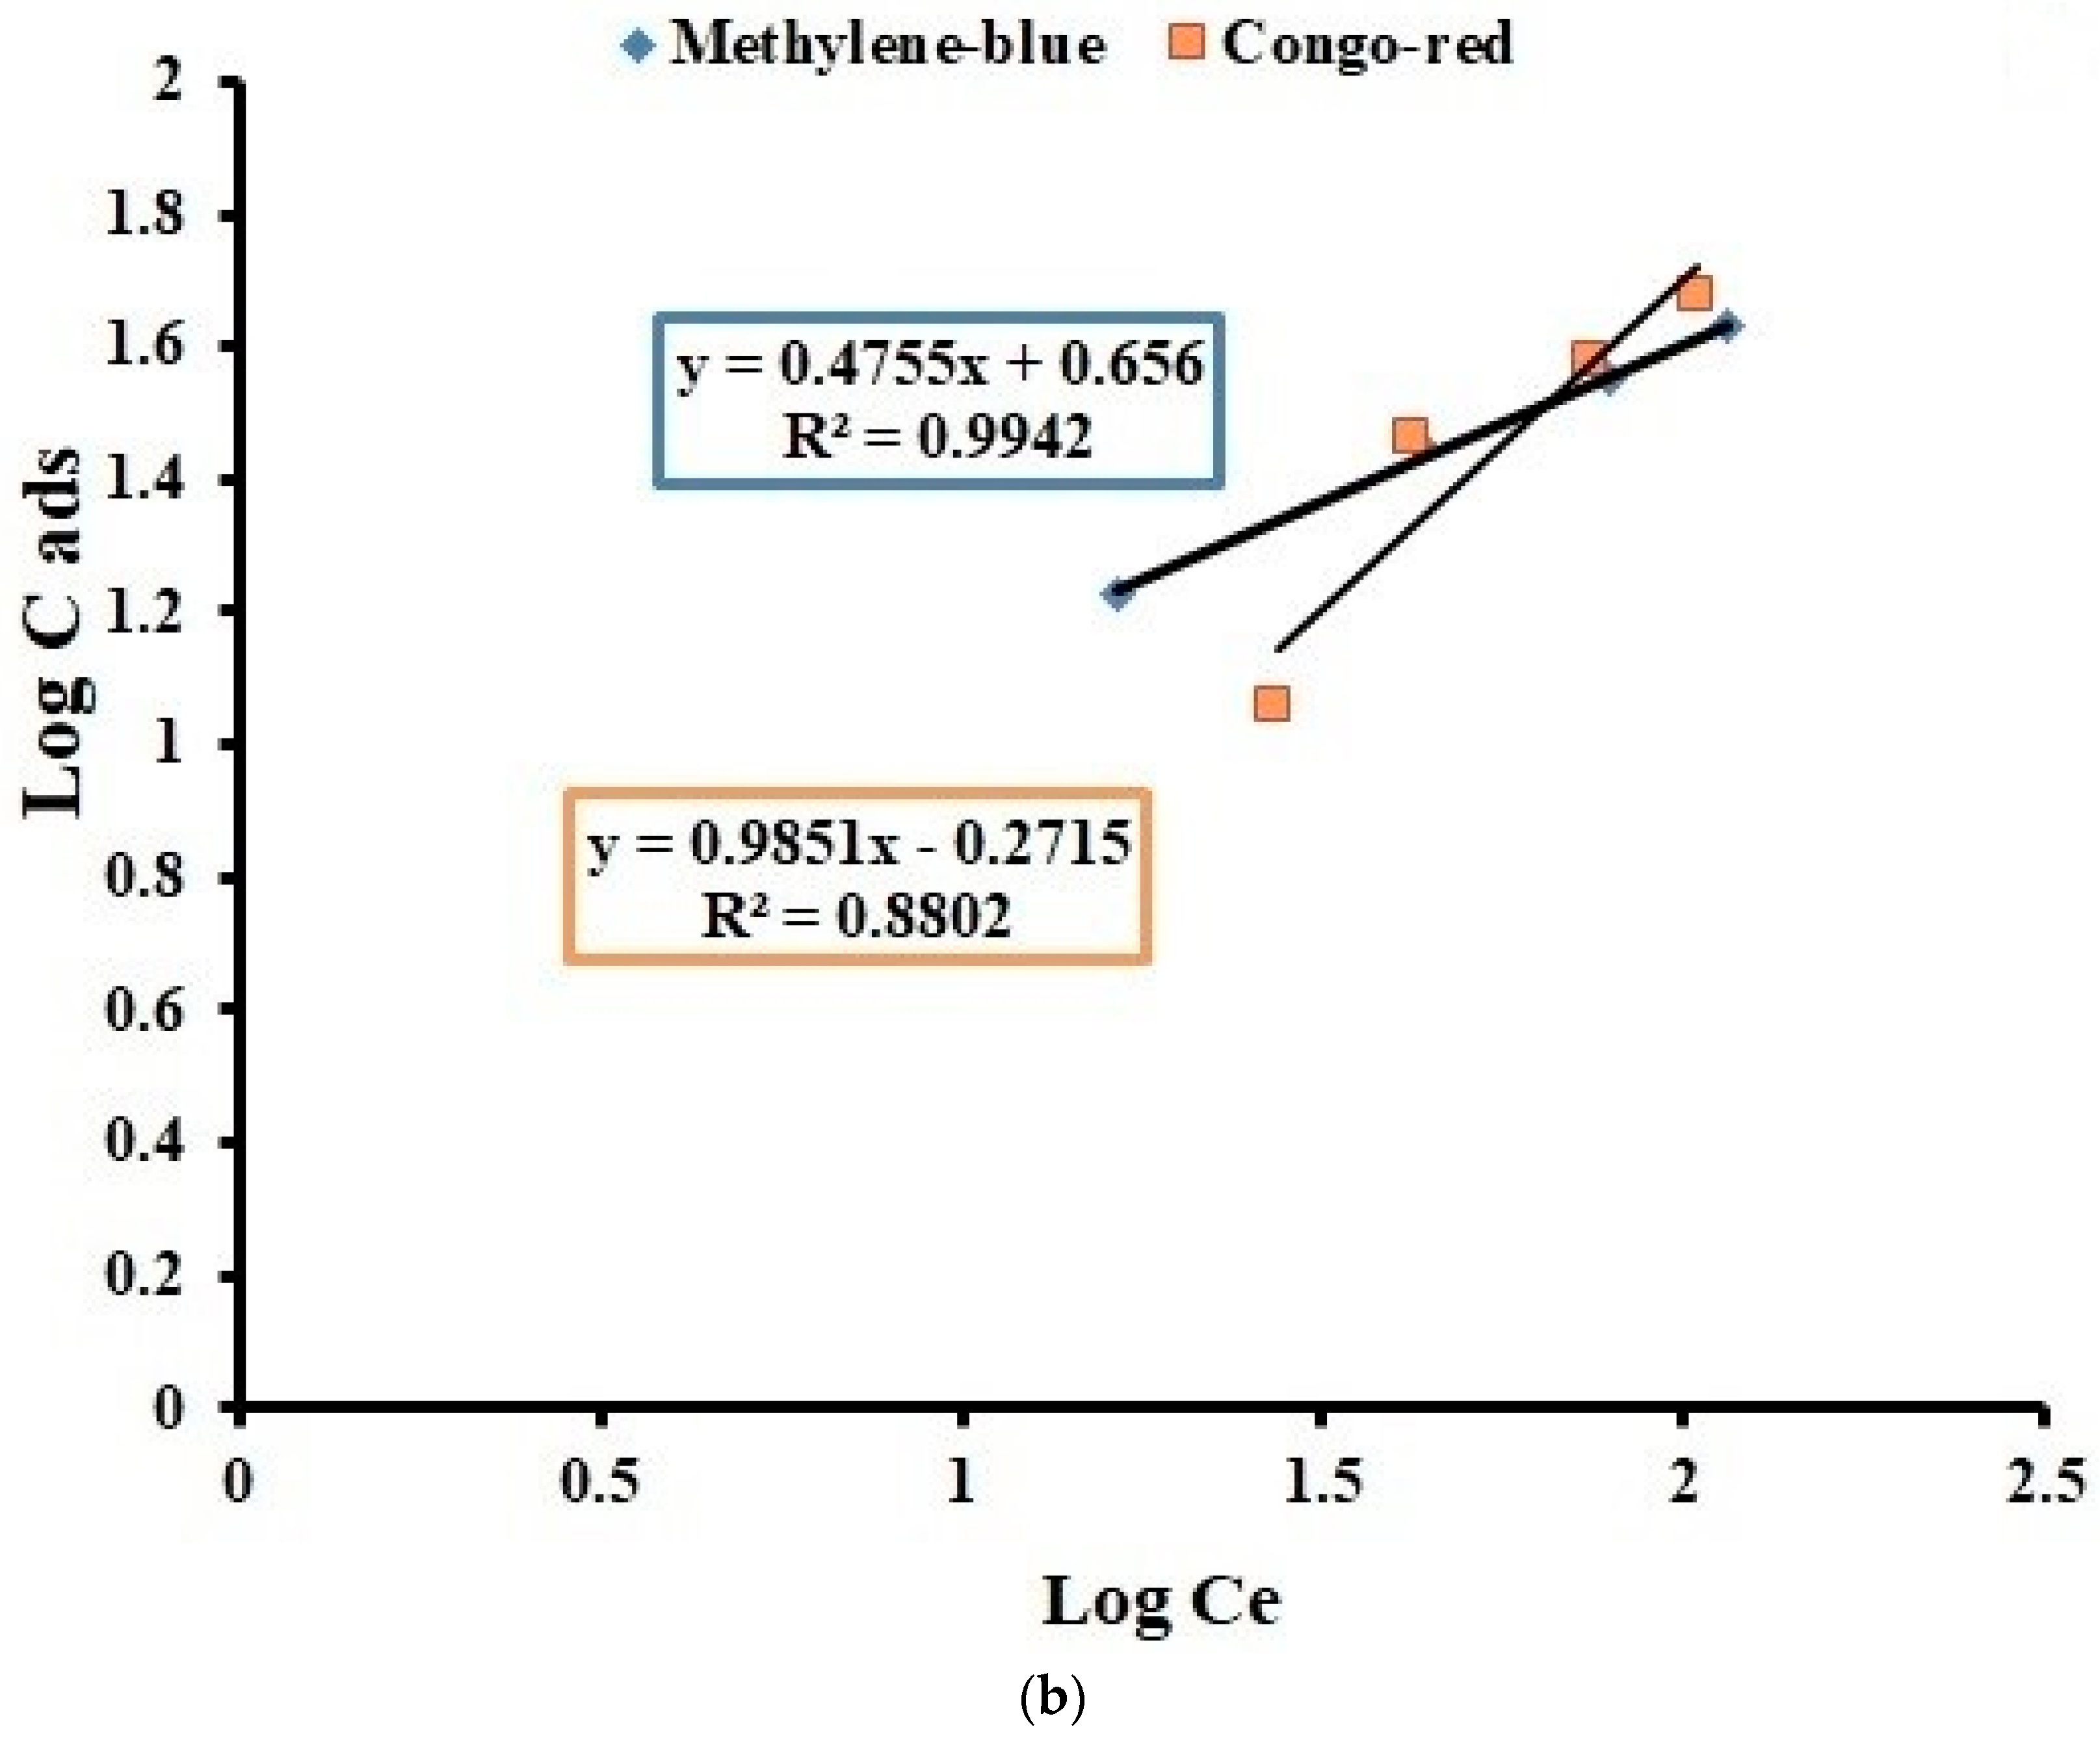
2.8.2. Freundlich Isotherm

Freundlich isotherm is an empirical equation employed to estimate the adsorption capacity of AFGM to MB and CR dyes, and it was represented by the Equation (7) [28,39]:
log Q e = log K f + 1 n log C e
where Qe is the quantity of solute adsorbed at equilibrium (adsorption density: mg of MB or CR per g of AFGM); Ce is the concentration of MB and CR dyes in solution at equilibrium (mg/L); and KF and 1/n are empirical constants dependent on the nature of sorbent and sorbate and the temperature.

2.9. Kinetics Studies

Adsorption process kinetics was performed to determine the MB and CR adsorption rate towards the AFGM that controls equilibrium time.

2.9.1. Pseudo First-Order Model

The pseudo first-order model was performed according to Equation (8):
ln ( Q e q Q t ) = log Q e   K 1 2.303
where Qe (mg/g), is adsorbed MB and CR dyes at equilibrium per unit weight of AFGM qt (mg/g) is adsorbed MB and CR at time t, and k1 is the rate constant per minute.
A plot of ln (QeQt) versus time (t) indicates a straight line of slope (k1/2.303) and an intercept of log (Qe).

2.9.2. Pseudo Second-Order Model

The data was analyzed by the pseudo second-order Equation (9):
t Q t = 1 K 2 Q e 2 + t Q e
where K2 expresses the equilibrium rate constant (g/mg min), and Qe and Qt express the sorption capacities at equilibrium and at time (t), respectively. A plot t/Qt versus t shows a straight line of slope (1/Qe) and an intercept of (1/K2Qe2).

3. Results

3.1. Acrylic-Fiber Grafted Membrane (AFGM) Characterization

3.1.1. SEM

Figure 1a displayed the blank membrane surface topography at different magnifications, the membrane had porous structure with the appearance of small fiber like structure, which might be due to fiber additives or insufficient dissolution time. Figure 1b, the membrane surface, indicated the high porosity of the membrane which resemble the sponge like structure. The surface of the AFGM appeared as multilayers with larger pore size than the blank membrane. The result also displayed disappearance of the small tiny fibers, which indicated complete coverage of the grafted layer over the membrane surface. Figure 1c,d displayed a blank acrylic membrane cross section and the AFGM, respectively. The figure revealed that, the cross-section of the membrane had macro-voids structure with many large pores that indicated the spontaneous solvent nonsolvent de-mixing during the membrane immersion onto the coagulation bath, which was known in phase inversion technique. The cross section of the AFGM had a similar structure with no obvious grafts at these magnifications, which may indicate the low grafting percentage occurred in bulk of the membrane. Whereas Figure 1e exhibited the bottom surface of the acrylic membrane (facing the glass plate during the membrane preparation) which appeared highly arranged porous structure with larger pore size than the top surface (facing the water during the manufacturing).

3.1.2. FT-IR

The blank acrylic membrane represented a distinct peak at 2241 cm−1, which belongs to nitrile group (CN) [29] and the peak at 1736 cm−1 corresponding to carbonyl group C=O of acrylic additives of acrylonitrile fiber. The acrylic fiber contains nearly 85% of acrylonitrile and the rest of the percent is another acrylate monomer. The band appeared at 2922 cm−1 and 2888 cm−1 related to stretching of CH and CH2, respectively [8]. Whereas 1452 cm−1 and 1378 cm−1 peaks corresponding to CH2 and CH bending, the peak at 1234 cm−1 related to stretching of C-O.
After grafting of the acrylic membrane, the peak at 2241 reduced and shifted to 2236 cm−1 also carbonyl band at 1736 cm−1 was shortened and shifted to 1733 cm−1. The appearance of peaks at 1540 and 1600 cm−1 corresponding to aromatic benzene ring C=C. from these data the grafting process was successfully occurred onto the acrylic membrane, see Figure 2.

3.1.3. Grafting Percentage

The membrane grafting percentage was reported in Table 3. The result referred to the weight gain after grafting process by 14.4% from its original weight. This demonstrates that the grafting process not just surface grafting but also bulk grafting. The increased in weight was not so much but it occurred on both surface and inside the membrane. This result expressed the successful grafting of poly p-phenylenediamine using ammonium persulfate as an initiator at a mild condition.

3.1.4. Porosity

Table 3 showed the porosity of the membranes. The blank membrane recorded about 23.1% of the polymer membrane’s weight, while it recorded 15% for the AFGM. A possible explanation for this largely decreased is the penetration of new polymer within the pores in AFGM, which reduced the voids in the membrane and declined its porosity. The grafted layer on the membrane surface formed on the porous substrate had the same morphology as the base substrate, so it appeared as porous in the SEM testing.

3.1.5. Swelling

Swelling of the acrylic membrane before and after grafting was presented in Table 3. It was noticed that the swelling performance of the membrane decreased from 420 to 354% indicating the formation of the AFGM polymer within the membrane voids and pores, not only on the membrane surface. The decline in the swelling ratio may also be due to the hydrophobic nature of the AFGM (poly p-phenylenediamine) with the aromatic structure. These data and the change in porosity and swelling confirmed the construction of the grafting branches within the AFGM.

3.2. Adsorption and Optimization Experiments Results

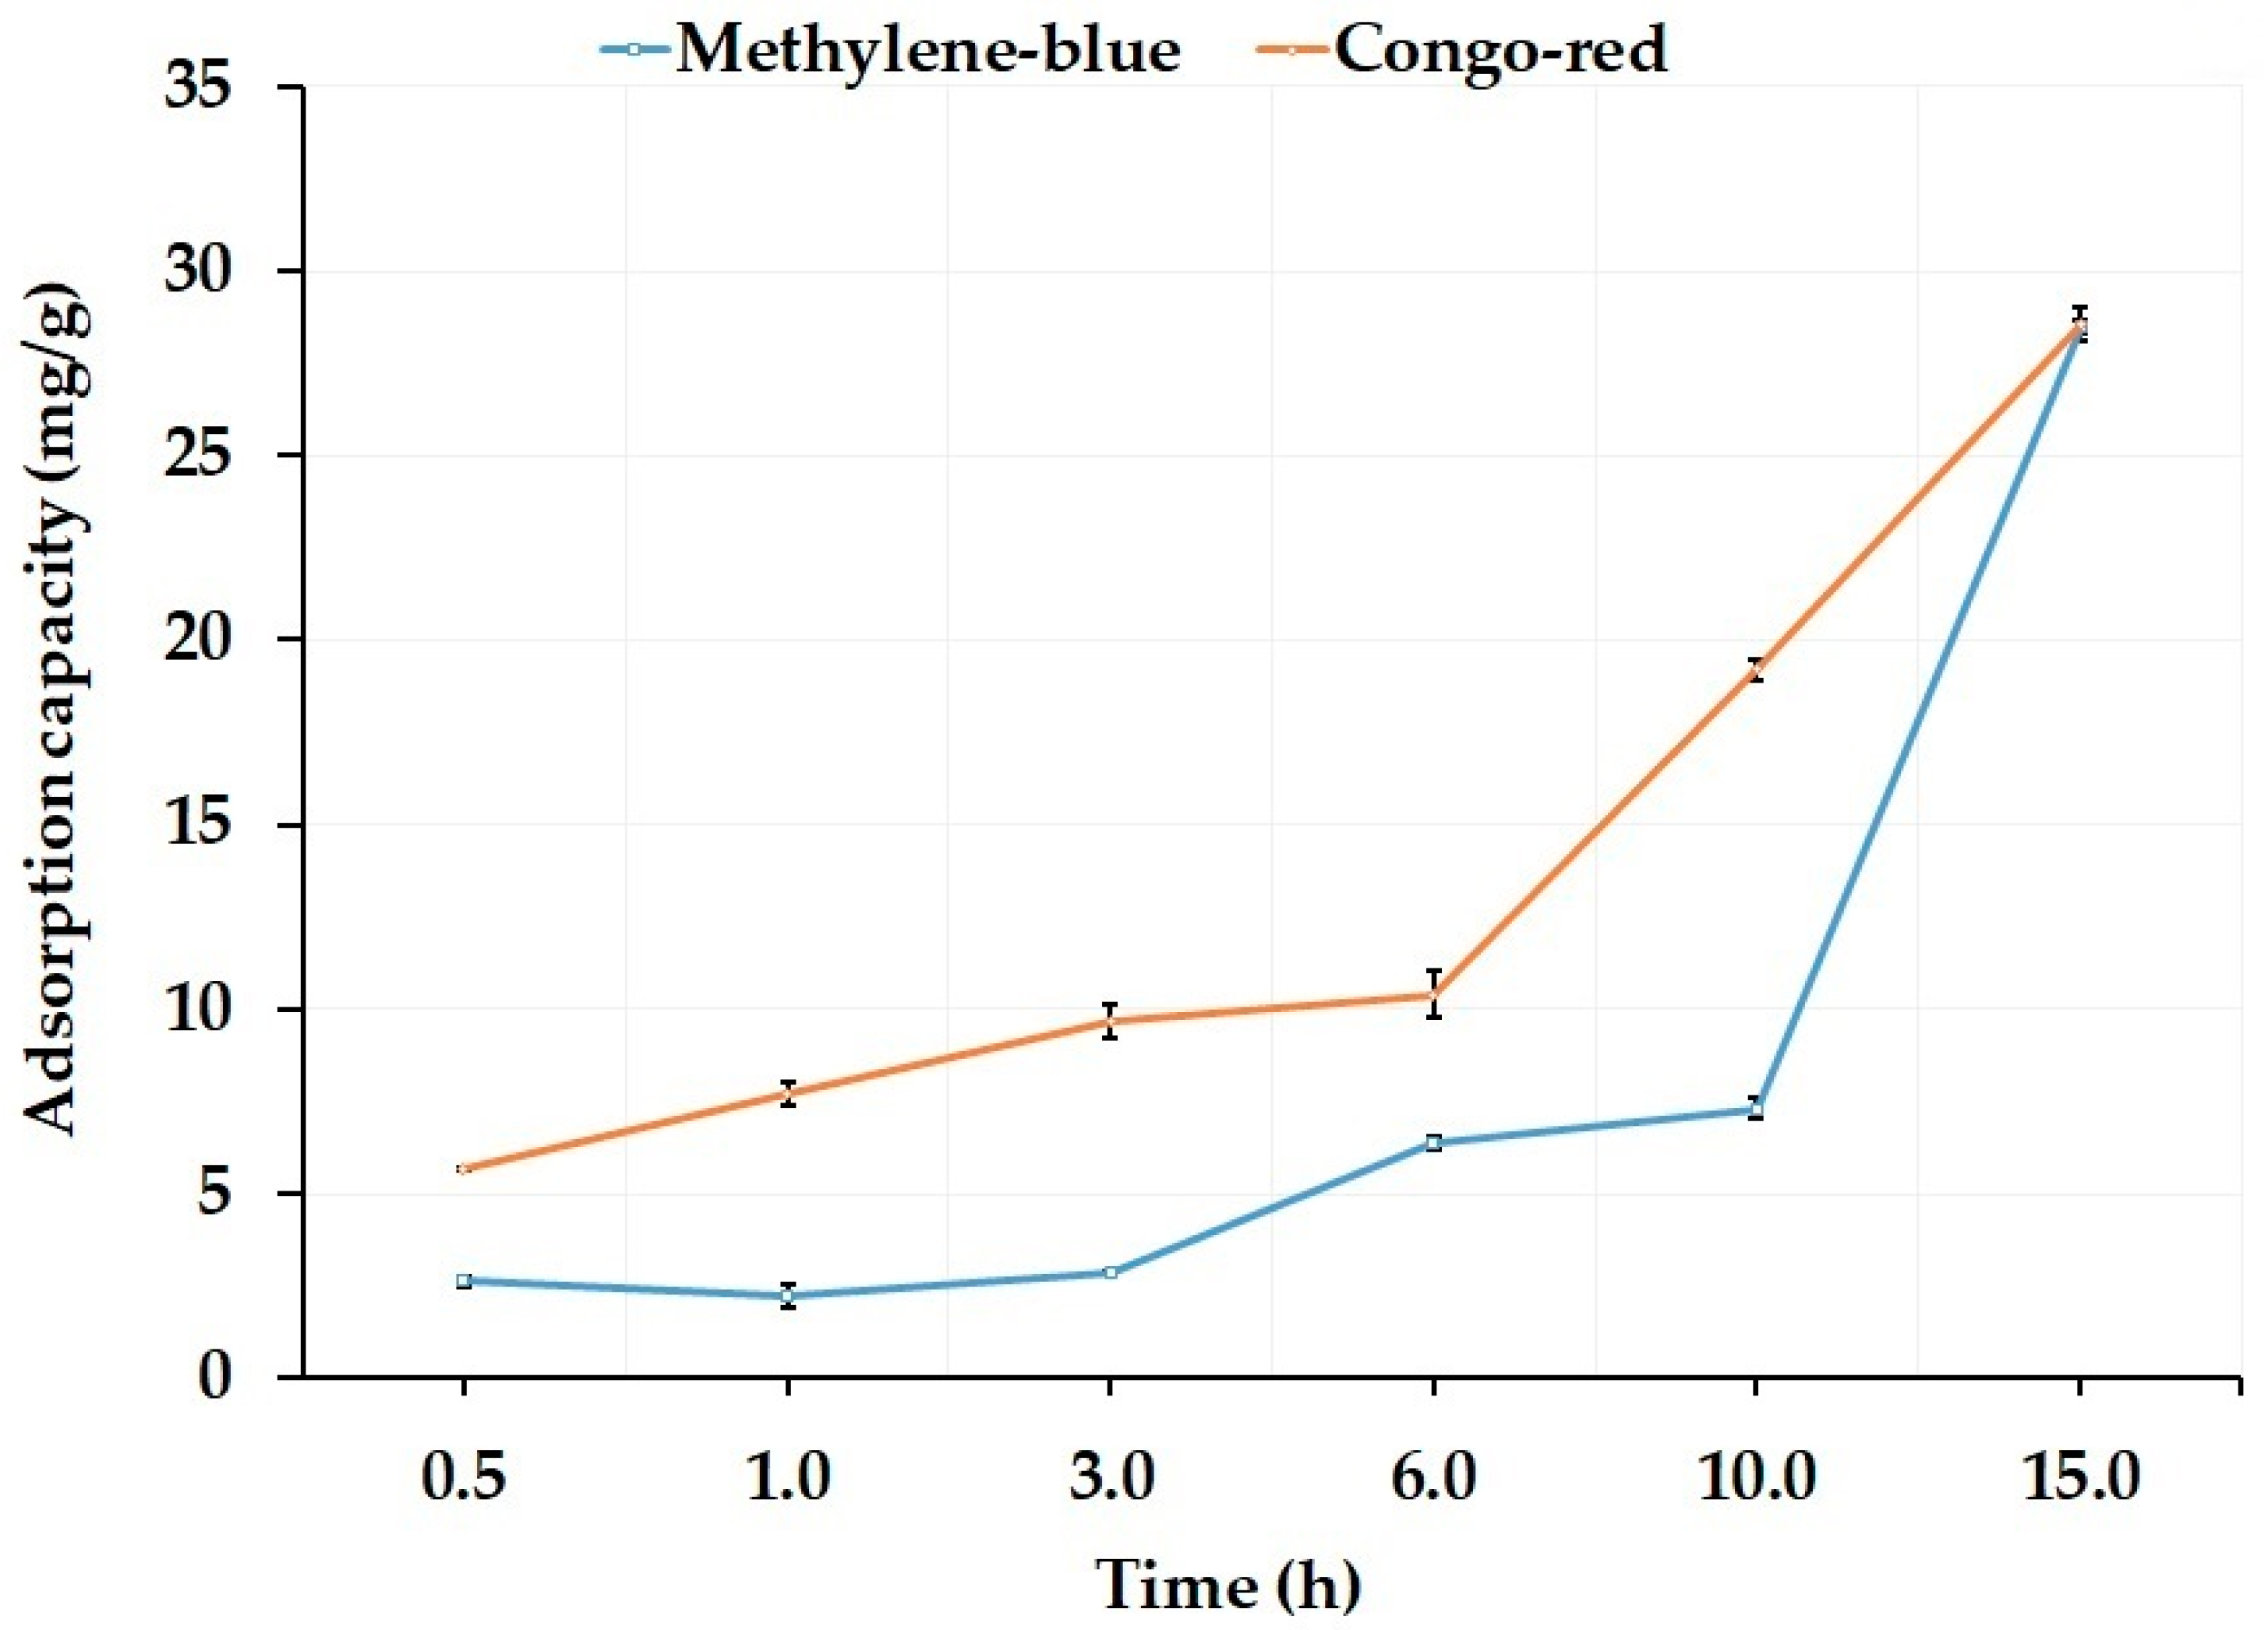
3.2.1. Effect of Contact Time
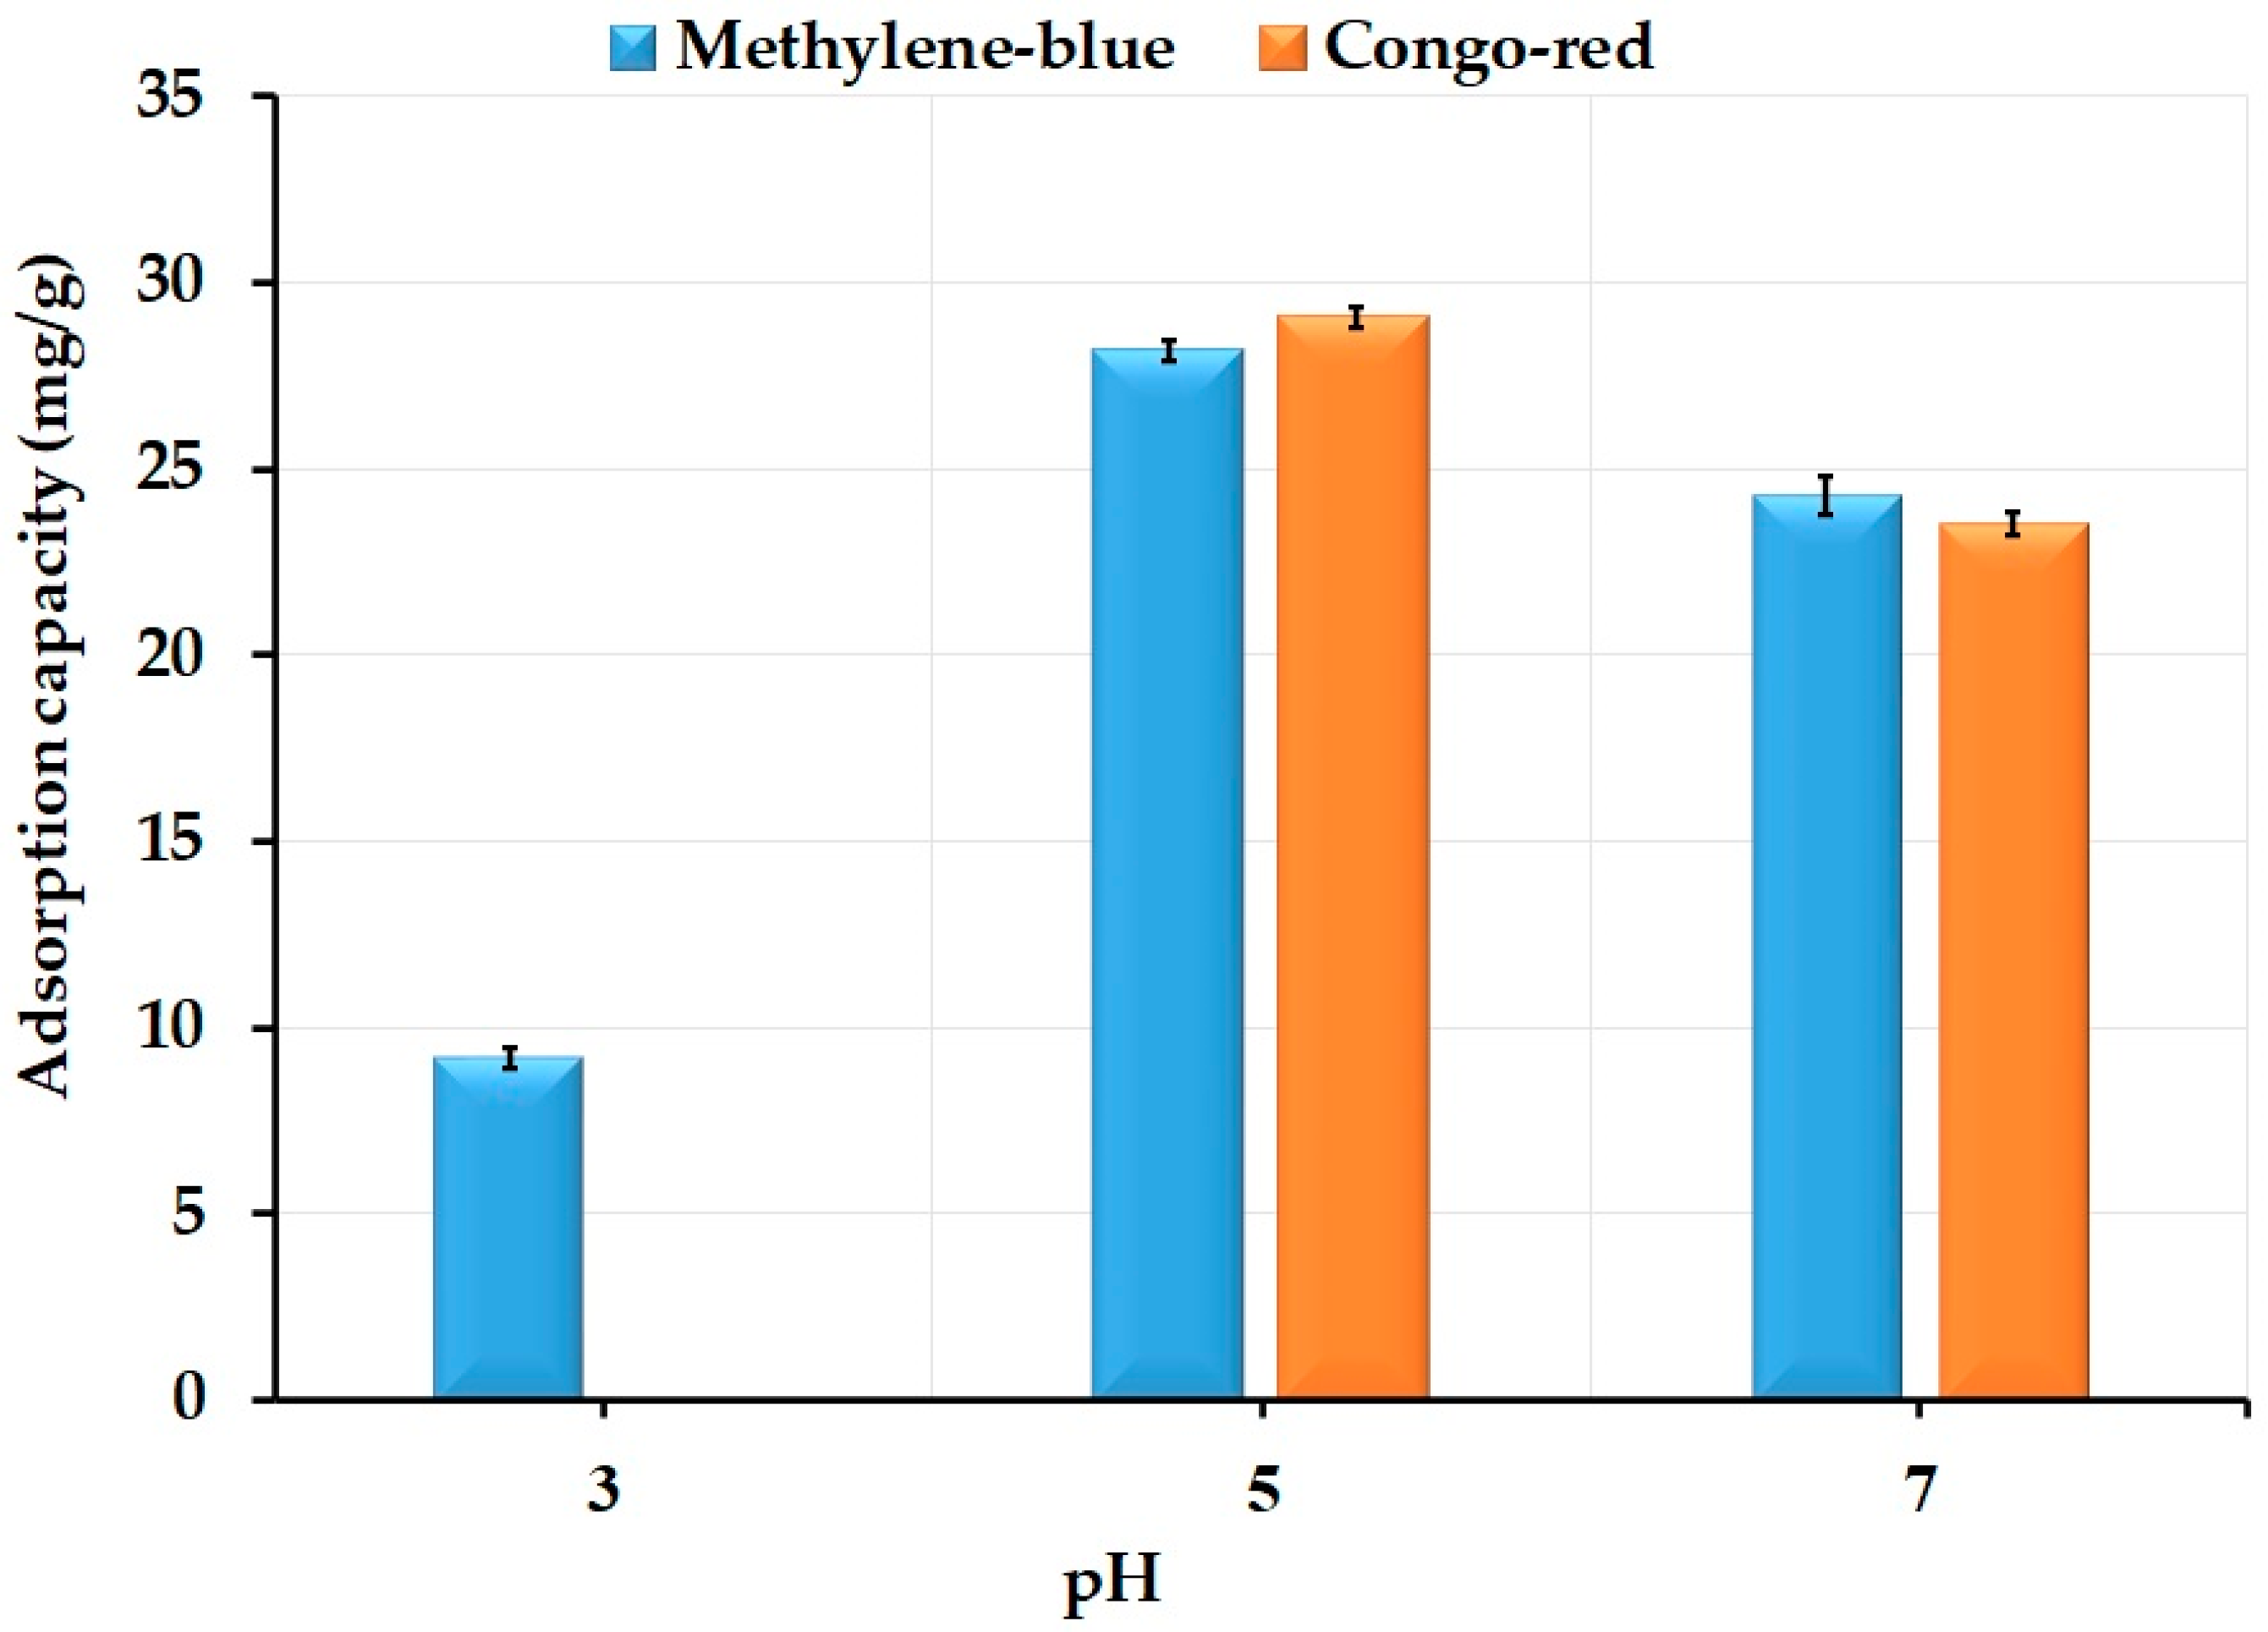
During 15 h, the adsorption capacity of AFGMs for MB and CR dyes were evaluated (Figure 3). The contact time was directly proportional to the percentage of the AFGM adsorption capacity for both MB and CR dyes. The CR removal recorded higher adsorption capacity than MB within the time progress, which stated the affinity of the AFGM with cationic amine groups towards the anionic dyestuff. The time was high due to a static model used; however, previous studies exhibited a long time up to 1500 min (nearly 24 h) even using a 150 rpm shaking model [40,41].

3.2.2. Effect of pH

The highest adsorption capacity for both dyes were accomplished at pH 5, while at higher acidic levels adsorption capacity tends to dramatically decrease for the MB which the cationic protons induce a competition between cationic MB molecules. Additionally, it was observed that, CR was turned onto violet then blue color and afterwards precipitated at acidic condition around pH 3 and no-result was recorded at this pH for CR removal and adsorption capacity see Figure 4. This observation was due to; at relatively high concentration of CR at acidic condition the hydrophobic interaction between the aromatic rings of the dye molecules was promote, which occur by the π–π stacking phenomenon resulted in agglomeration and precipitation of this dye at these condition [42,43].

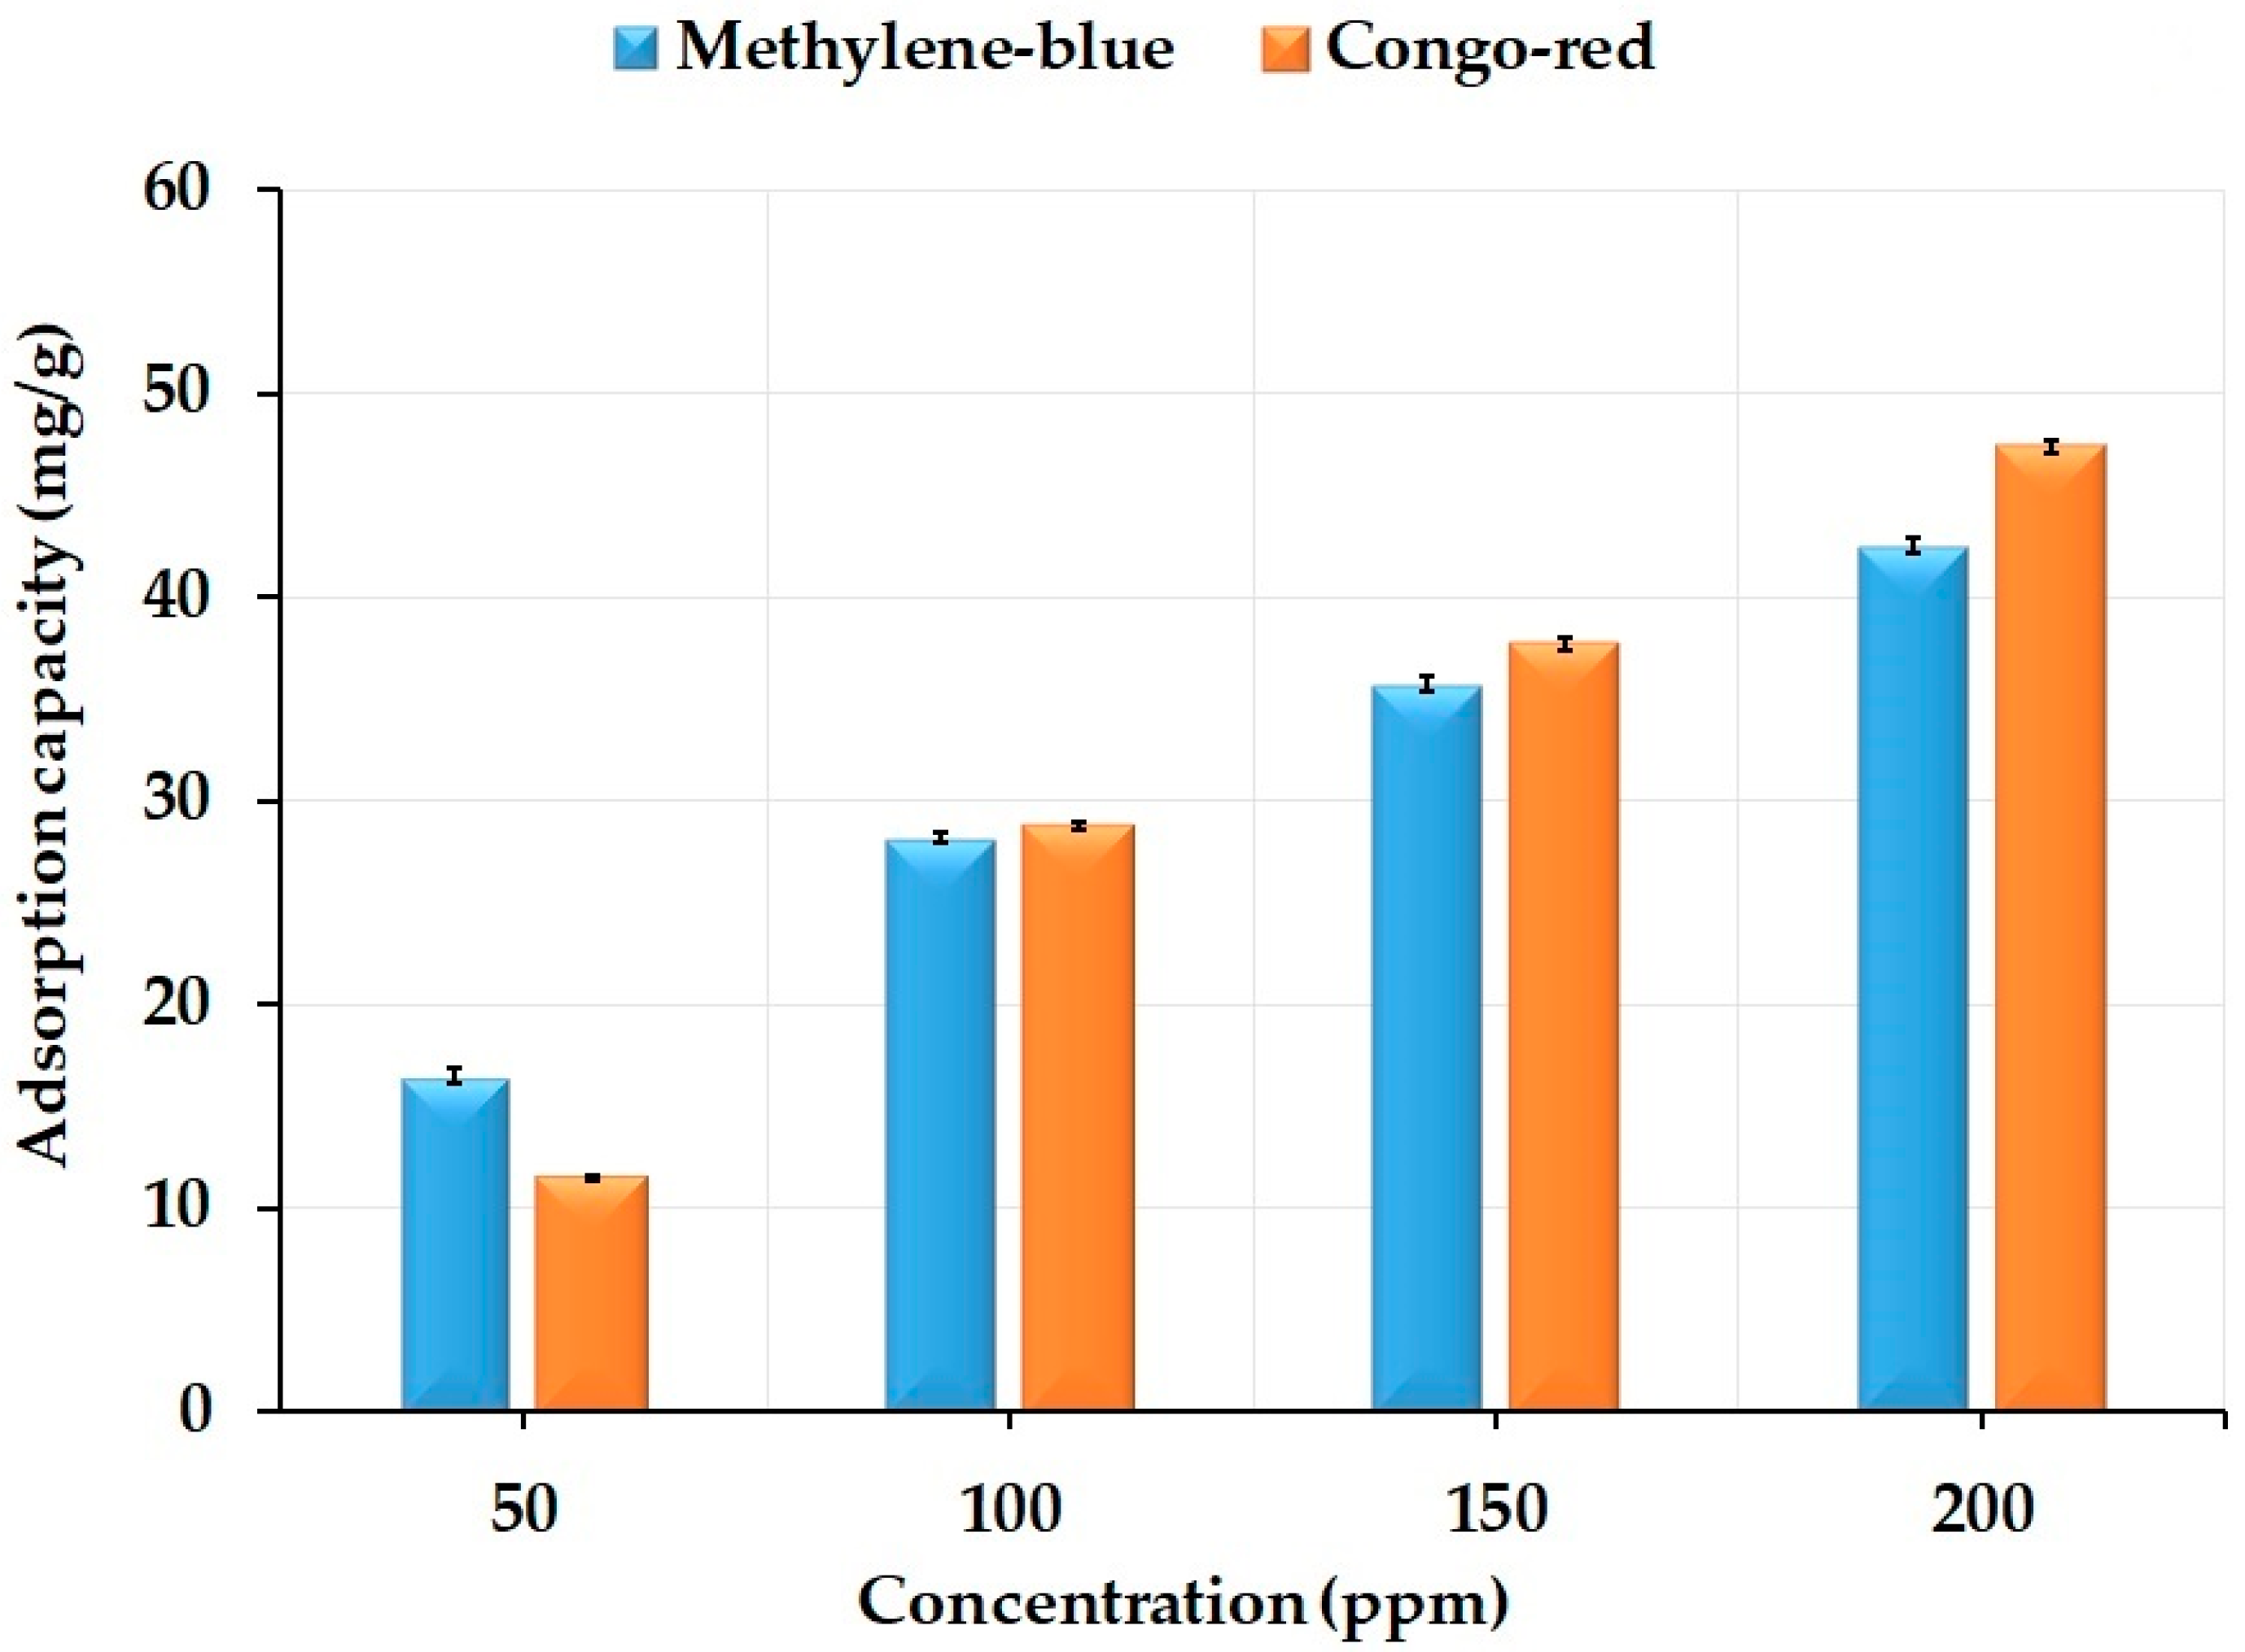
3.2.3. Effect of Concentration

Results demonstrated that, the increase in the initial dye-concentration leads to an increase in the AFGM adsorption capacity for both dyes. The highest adsorption capacities were recorded between 40 to 50 mg/g for both MB and CR, respectively see Figure 5. The AFGM showed adsorption capacities of 43 and 48 mg/g for dyes at high concentration of 200 mg/L for MB and CR, respectively. The results showed that, the adsorption of anionic dye was higher for the cationic one due to the cationic nature of the prepared adsorbent. However, the adsorption capacities were decreased by increasing concentration from 50, 100, 150, to 200 mg/L and this result was stated in previous studies [44,45,46,47]. At a diluted concentration; the adsorption capacities were higher due to the removal of most of dye molecules. However, at high dye concentrations the adsorption capacities were decreased with increasing in adsorbent capacity due to the higher diffusion of the dye molecules within the polymer matrix and pores.

3.2.4. Factorial Design
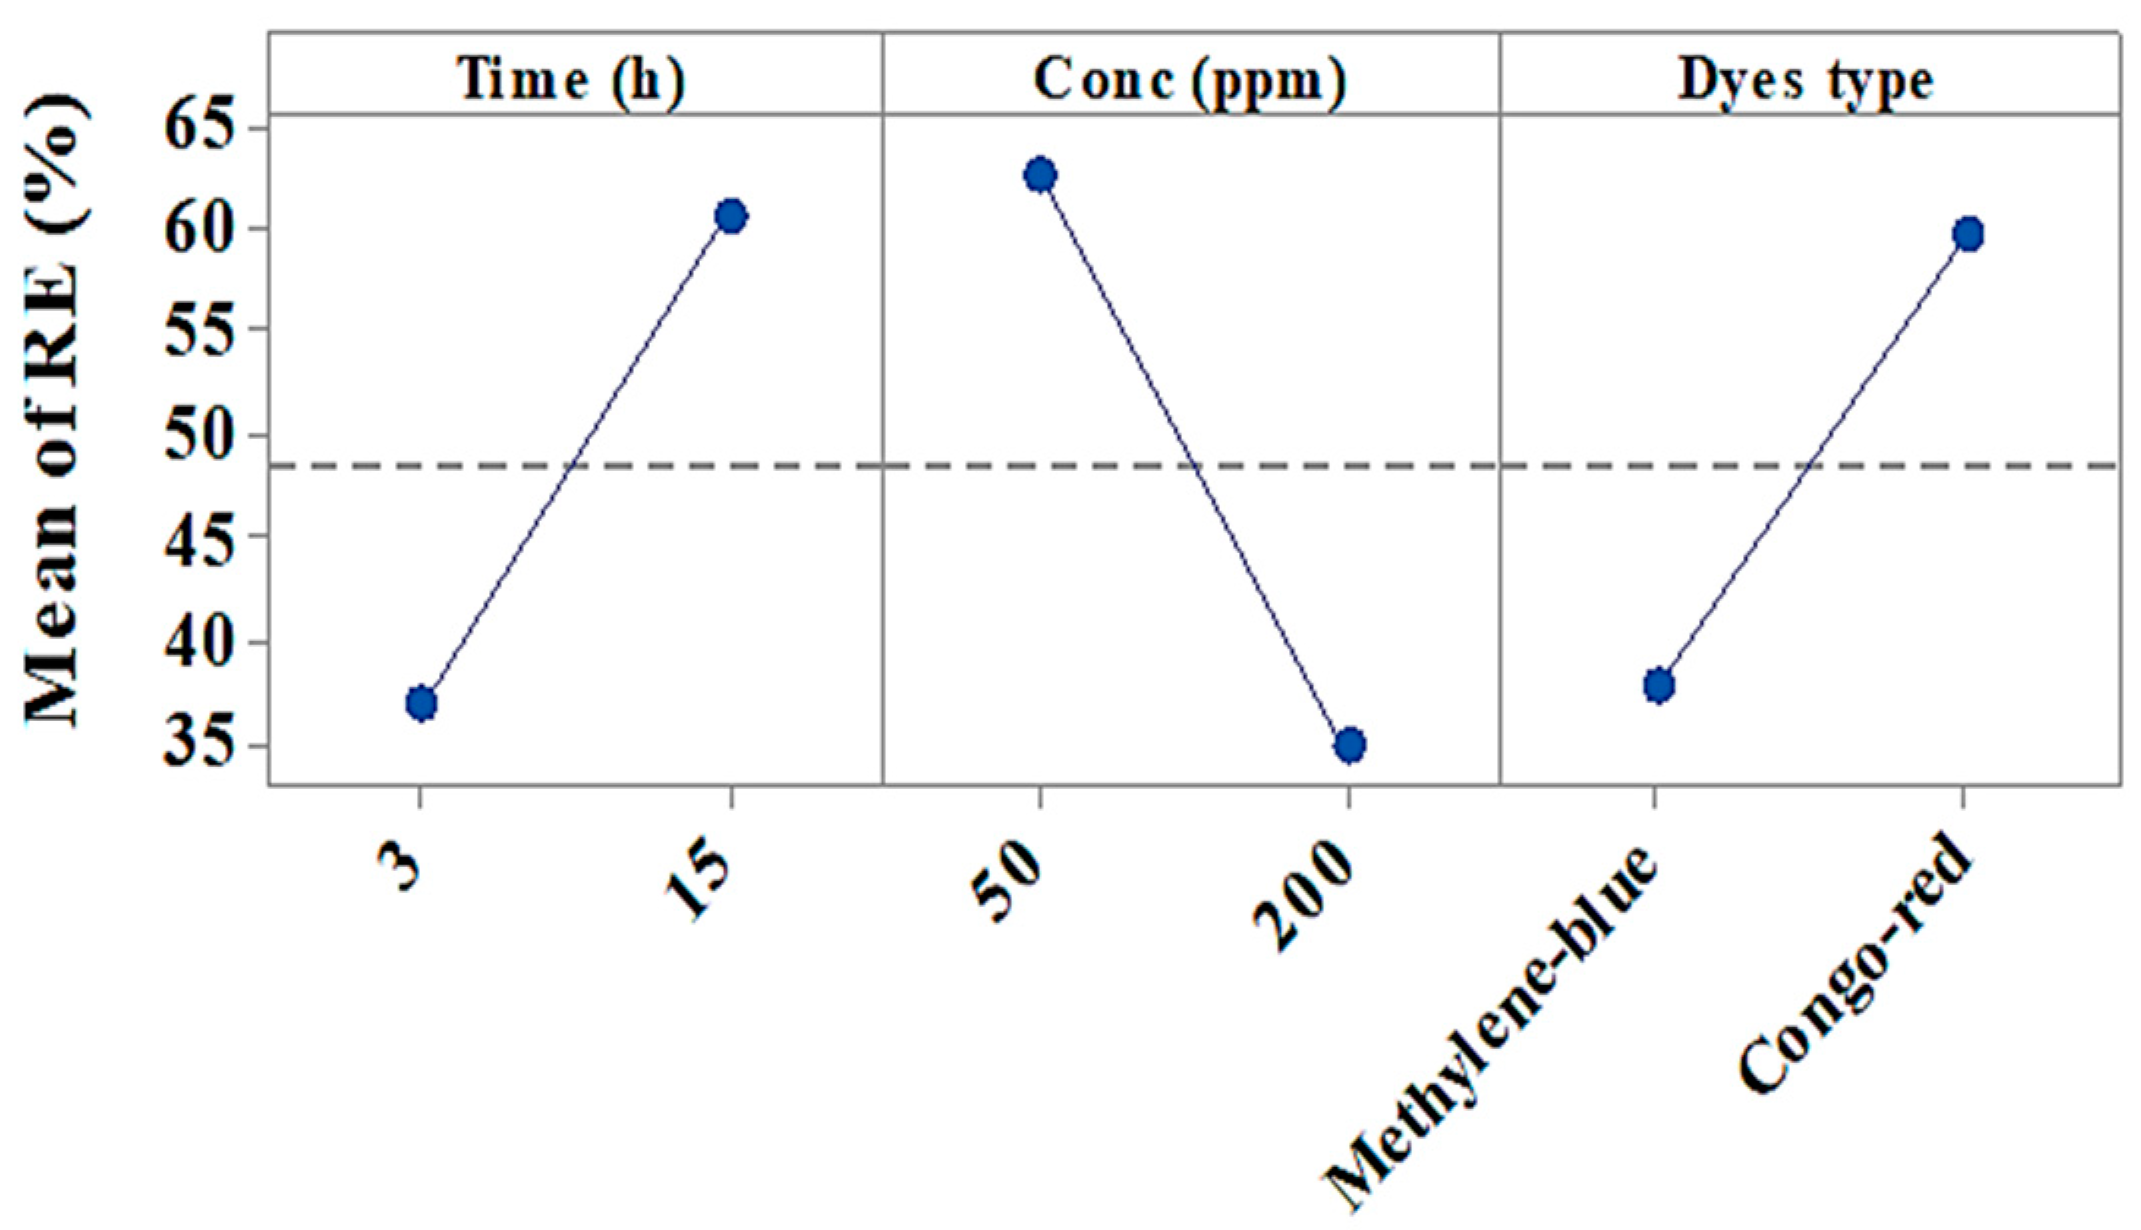
The Main Effects

Figure 6 showed the main effects plot which represented the deviation of the average from the low to the high level of each factor and its effect on the dye’s removal percent [44]. The increase in deviation from the low to the high levels of the factor reflected the factor positive effect on the dye’s removal efficiency that represent the increase in the removal efficiency. In contrast, the reduction that appear from the high to the low level of the factor reflect the negative affect of this factor on the dye’s removal efficiency. According to this information, Figure 6 and Table 4 stated that, both time and pollutant type positively affected the MB and CR removal percent, whereas dyes concentration negatively affected the removal efficiency. Furthermore, levels 15 h contact time in static mode and 50 ppm were the optimum levels that give the highest dyes removal. Additionally, it was noticed that the CR removal by the AFGM was better than MB removal.

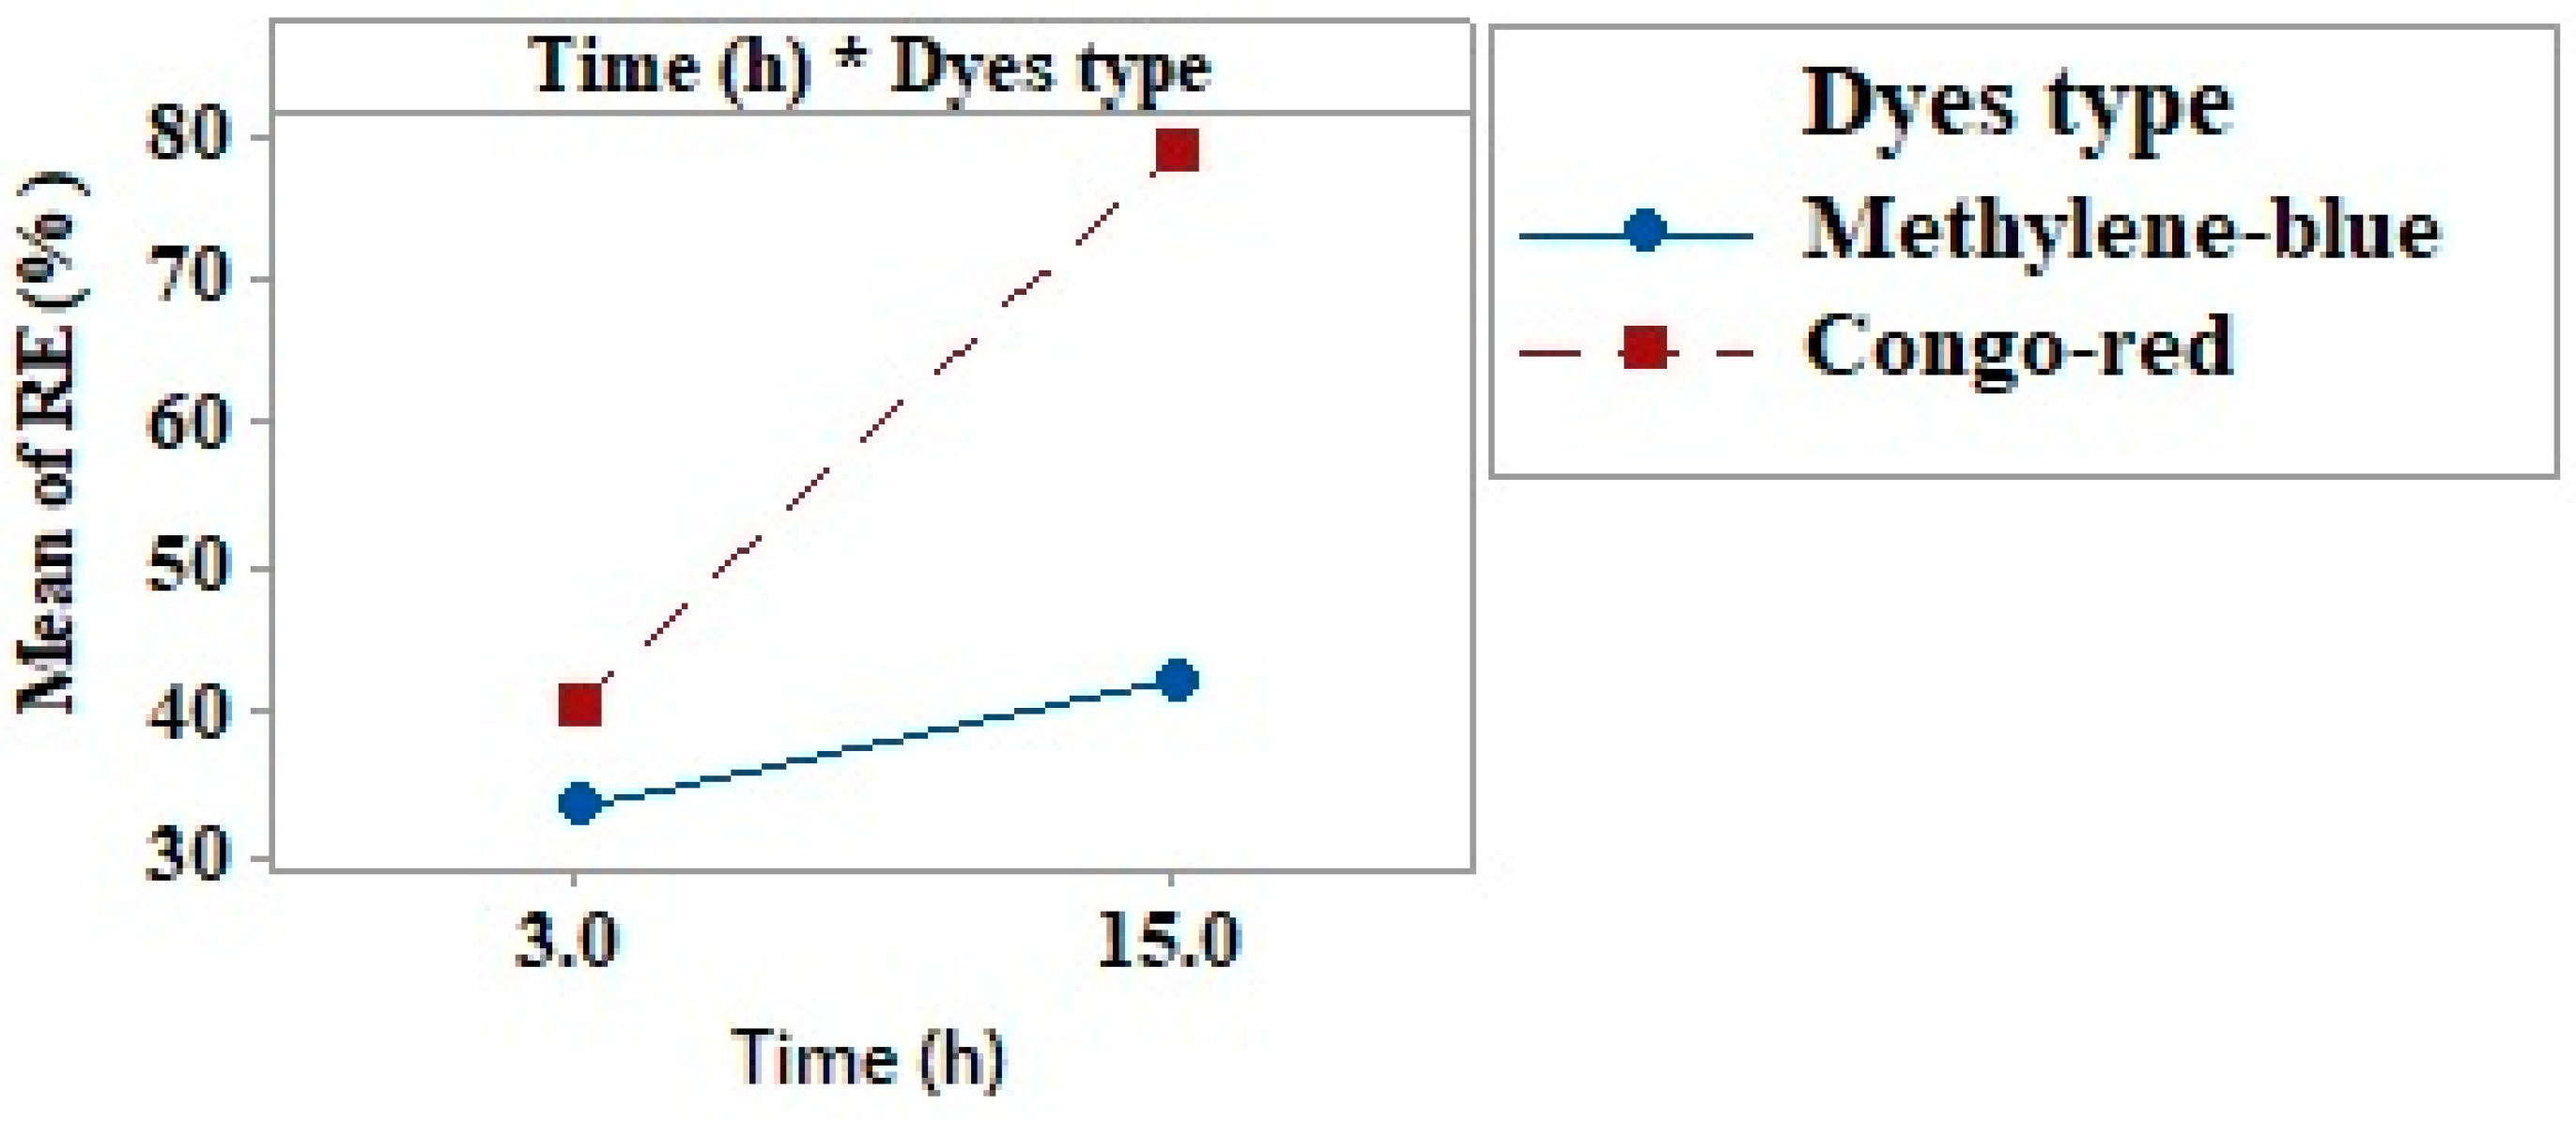
The Interaction Effects
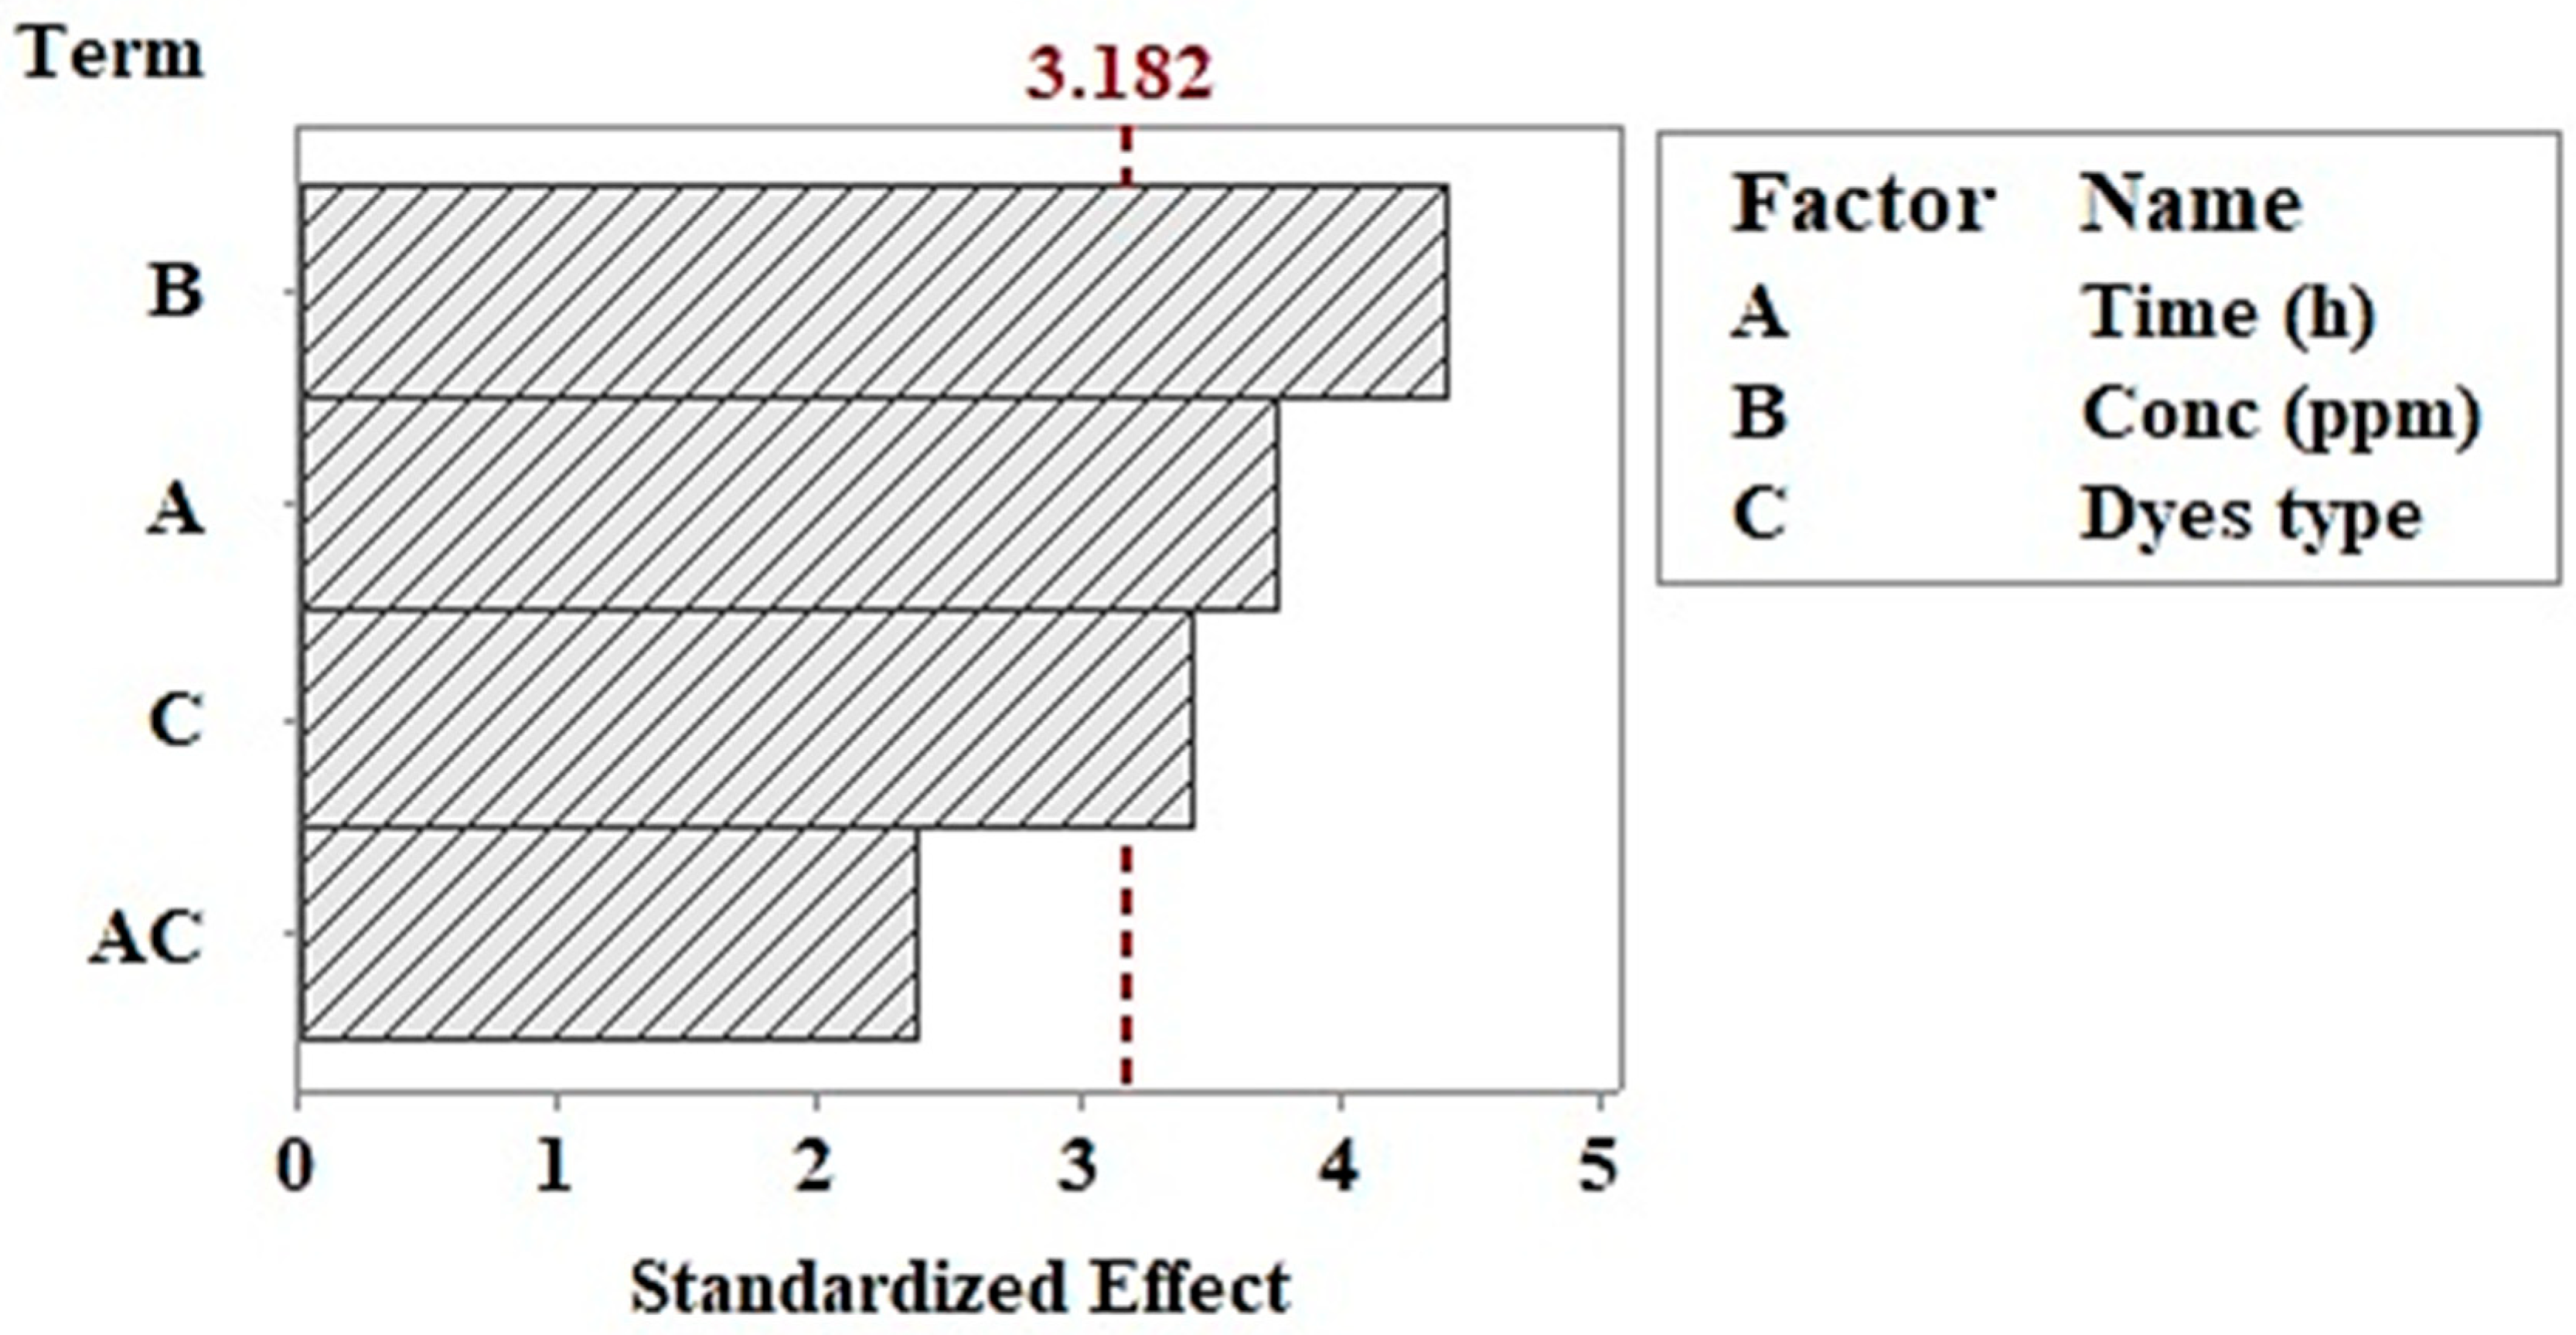
The interaction effects are the studying of two-interacted factors that had an effect on the removal efficiency [48]. Figure 7 and Table 4 illustrated that, the interaction effects of the optimized factors to obtain the highest MB and CR removal efficiency by using the AFGM, which seems does not have any significant interaction effects.

Pareto Chart

The Pareto chart in which a student t-test was estimated to determine the significance difference of different parameters from zero [49,50]. At sixteen degree of freedom and 95% confidence intervals, the t-value reference line was 3.182 (Figure 8). Previously, it was mentioned that all data that exceed the reference line are significant data whilst, the data that not-exceed the reference line are non-significant. Accordingly, the dyes concentration (B), time (A), and pollutant type (C) are significant factors that may have an effect on the dye’s removal efficiency.

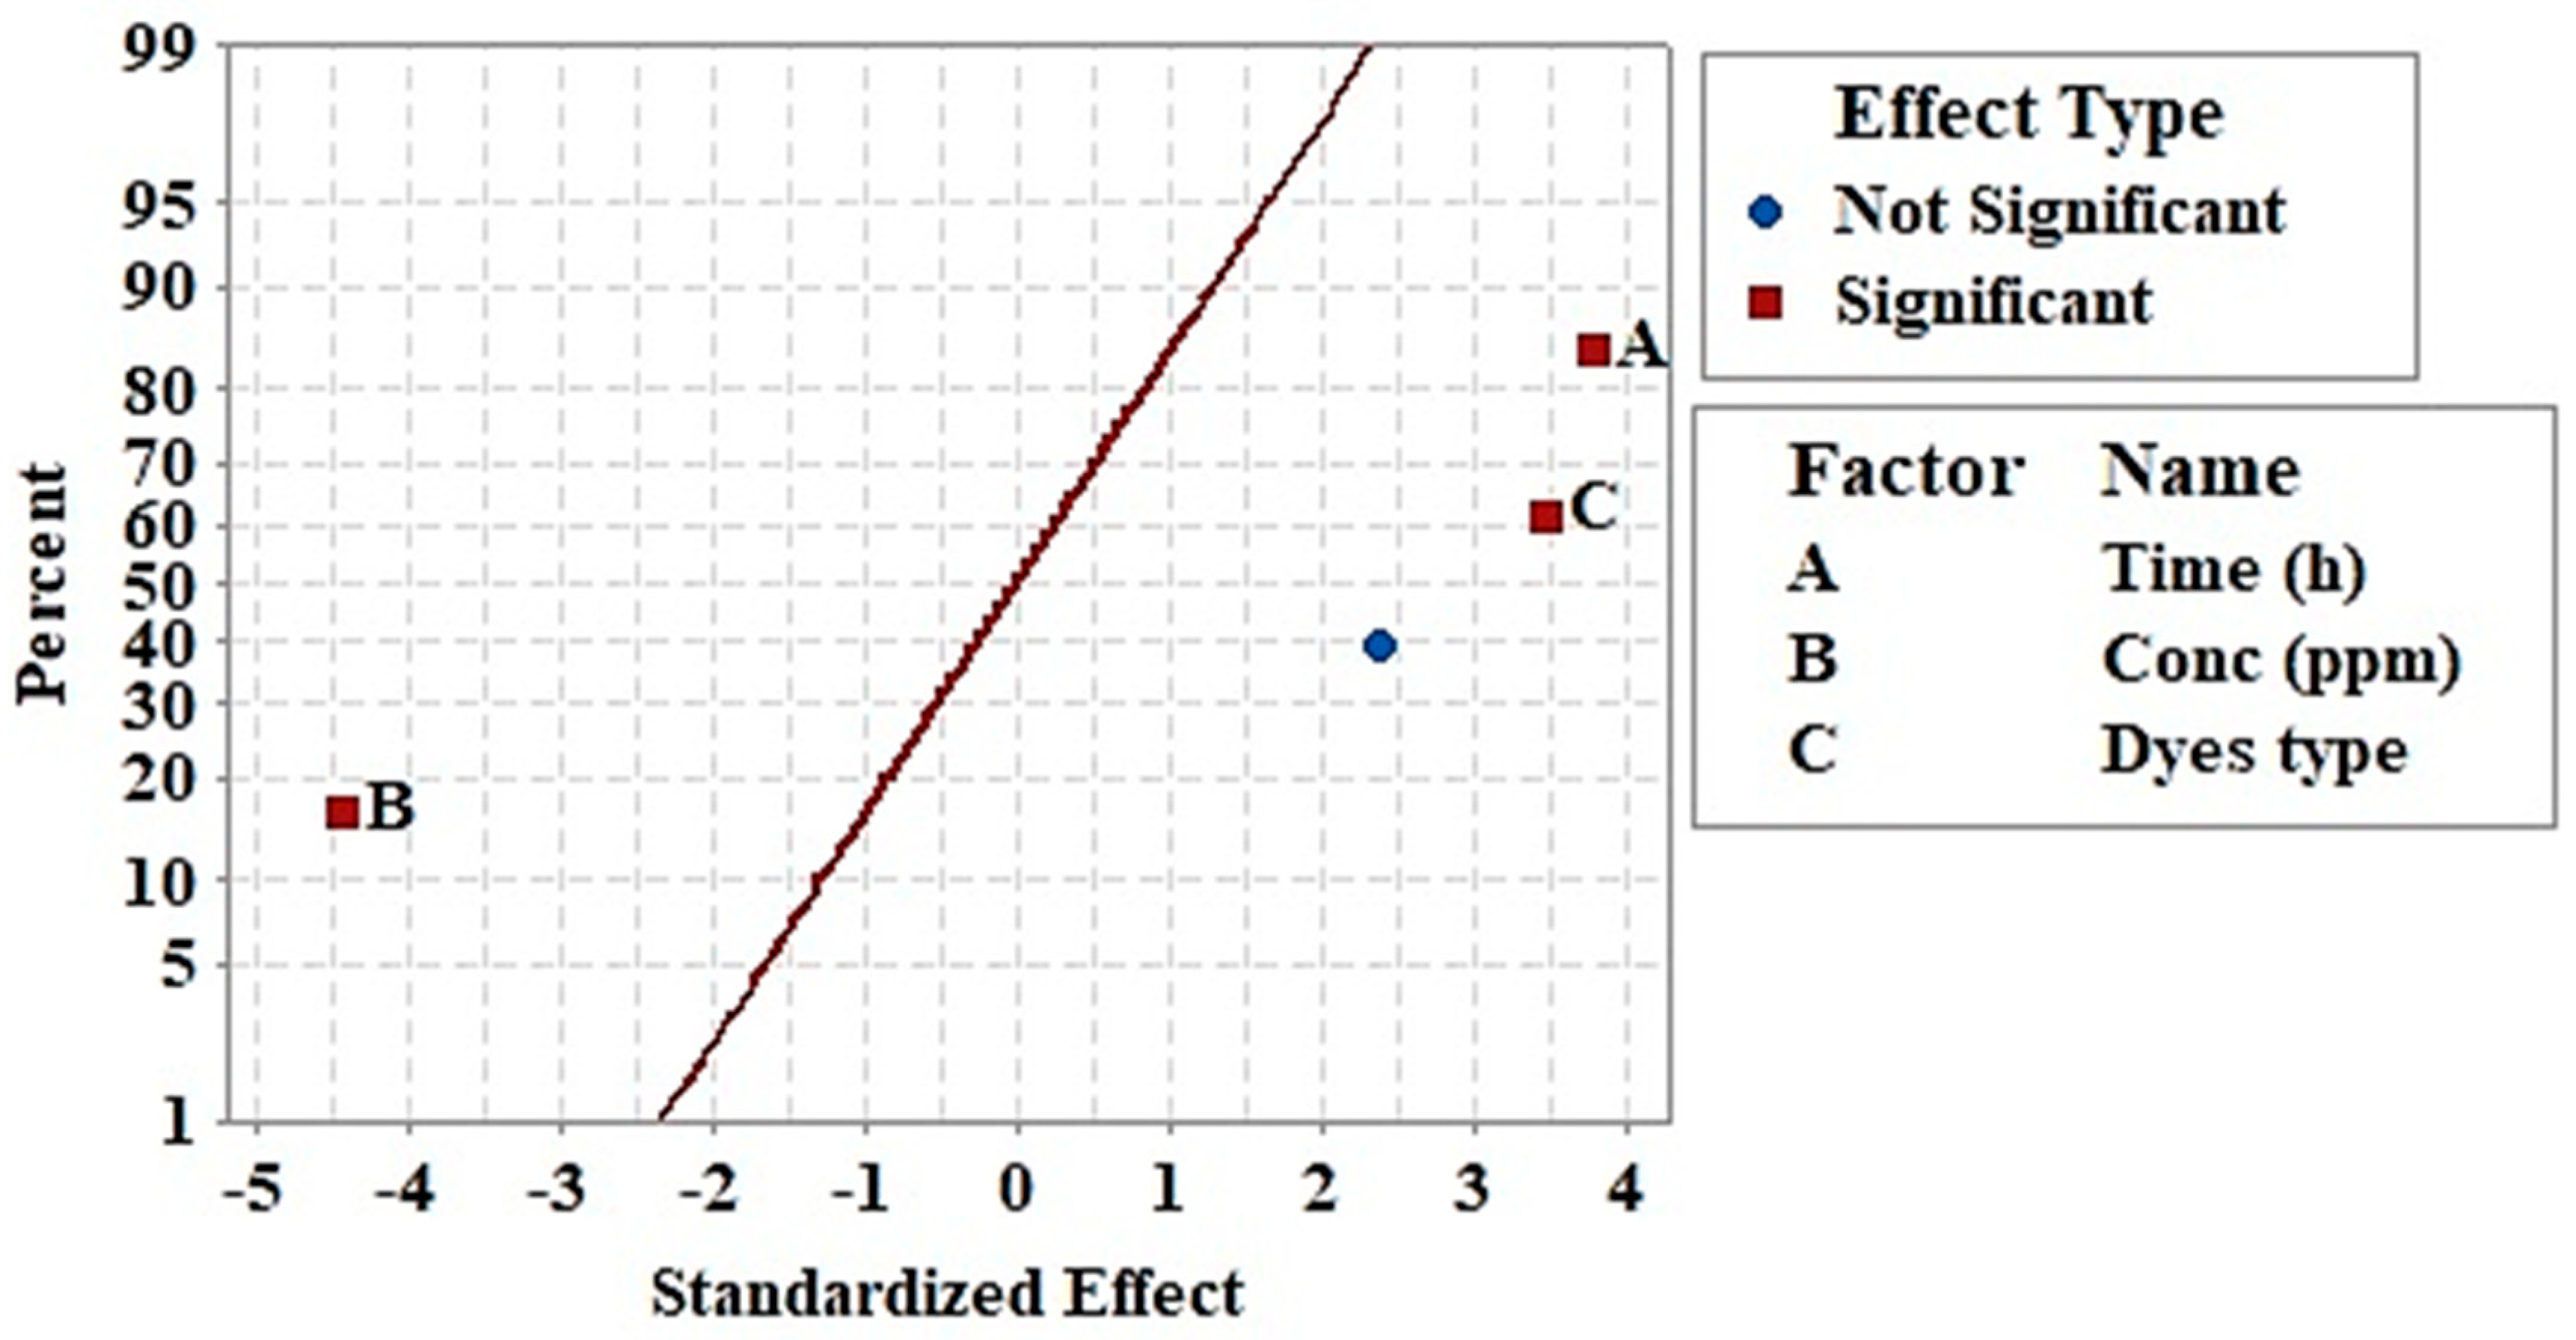
Normal Probability Plot
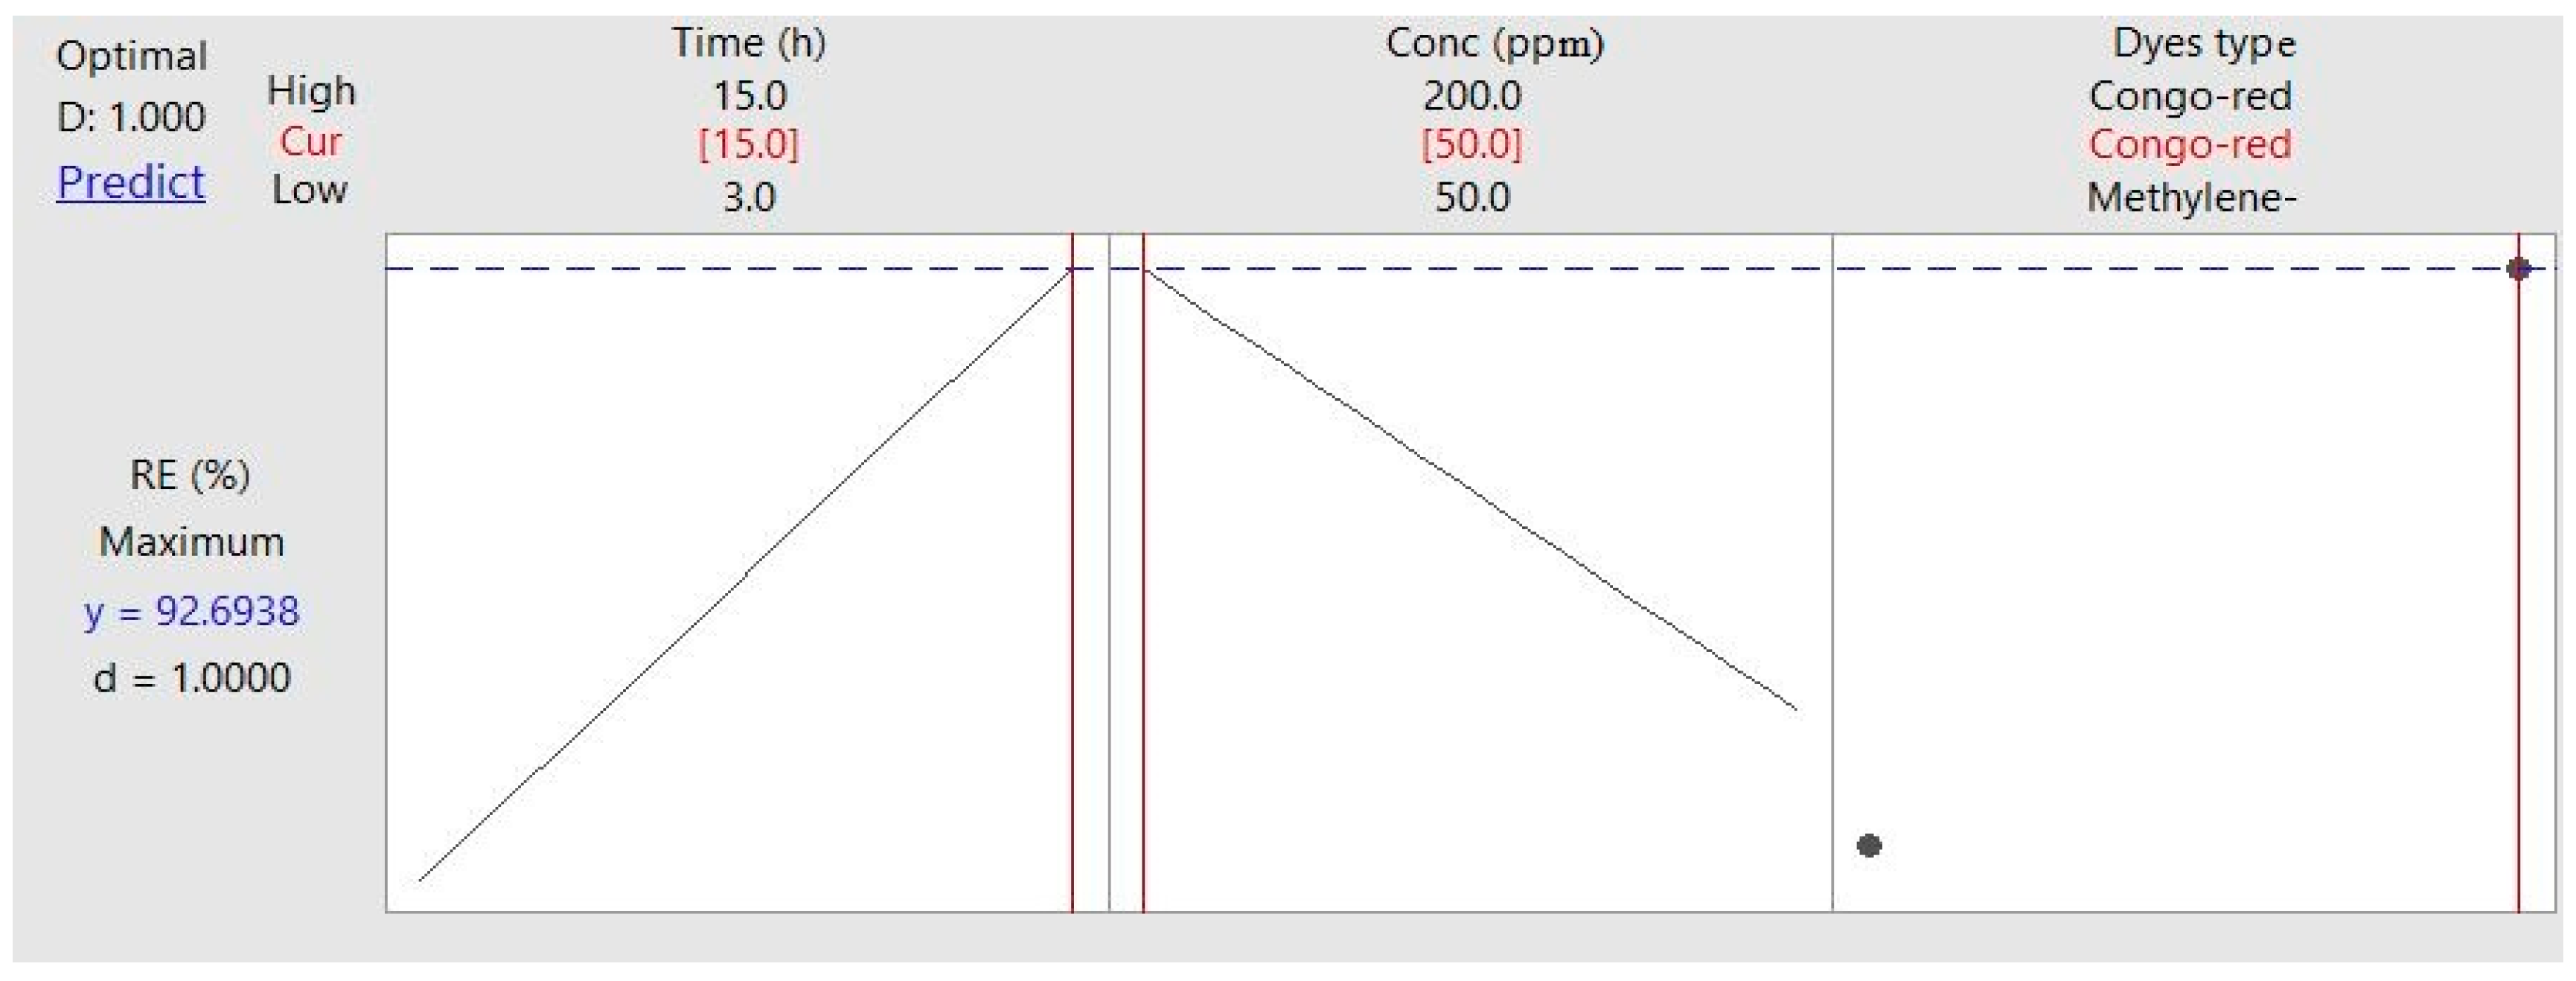
Figure 9 stated that, both of (B), (A), and (C) are real factors and they effect on the MB and CR removal percent because; they were positioned away from the plotted line. The points that lie on the left of the plotted line had a negative effect on the removal process (B) nevertheless, the points that lie on the right of the line had a positive effect on the dyes removal efficiency (A), and (C) [51,52]. All these results confirm the results obtained previously from Pareto, main, and interaction effects plot.

Response Optimizer

A response optimizer is a tool that predicted the effect of a group of factors or parameters on a response. In this study, the removal efficiency was studied by noticing the effect of time, dyes concentration and dyes type on the dye’s removal efficiency. Where, the removal efficiency of 92.6% was obtained after 15 h contact time, static condition, and CR concentration of 50 mg/L with a degree of accuracy of 1 (Figure 10).

3.3. Langmuir and Freundlich Isotherms
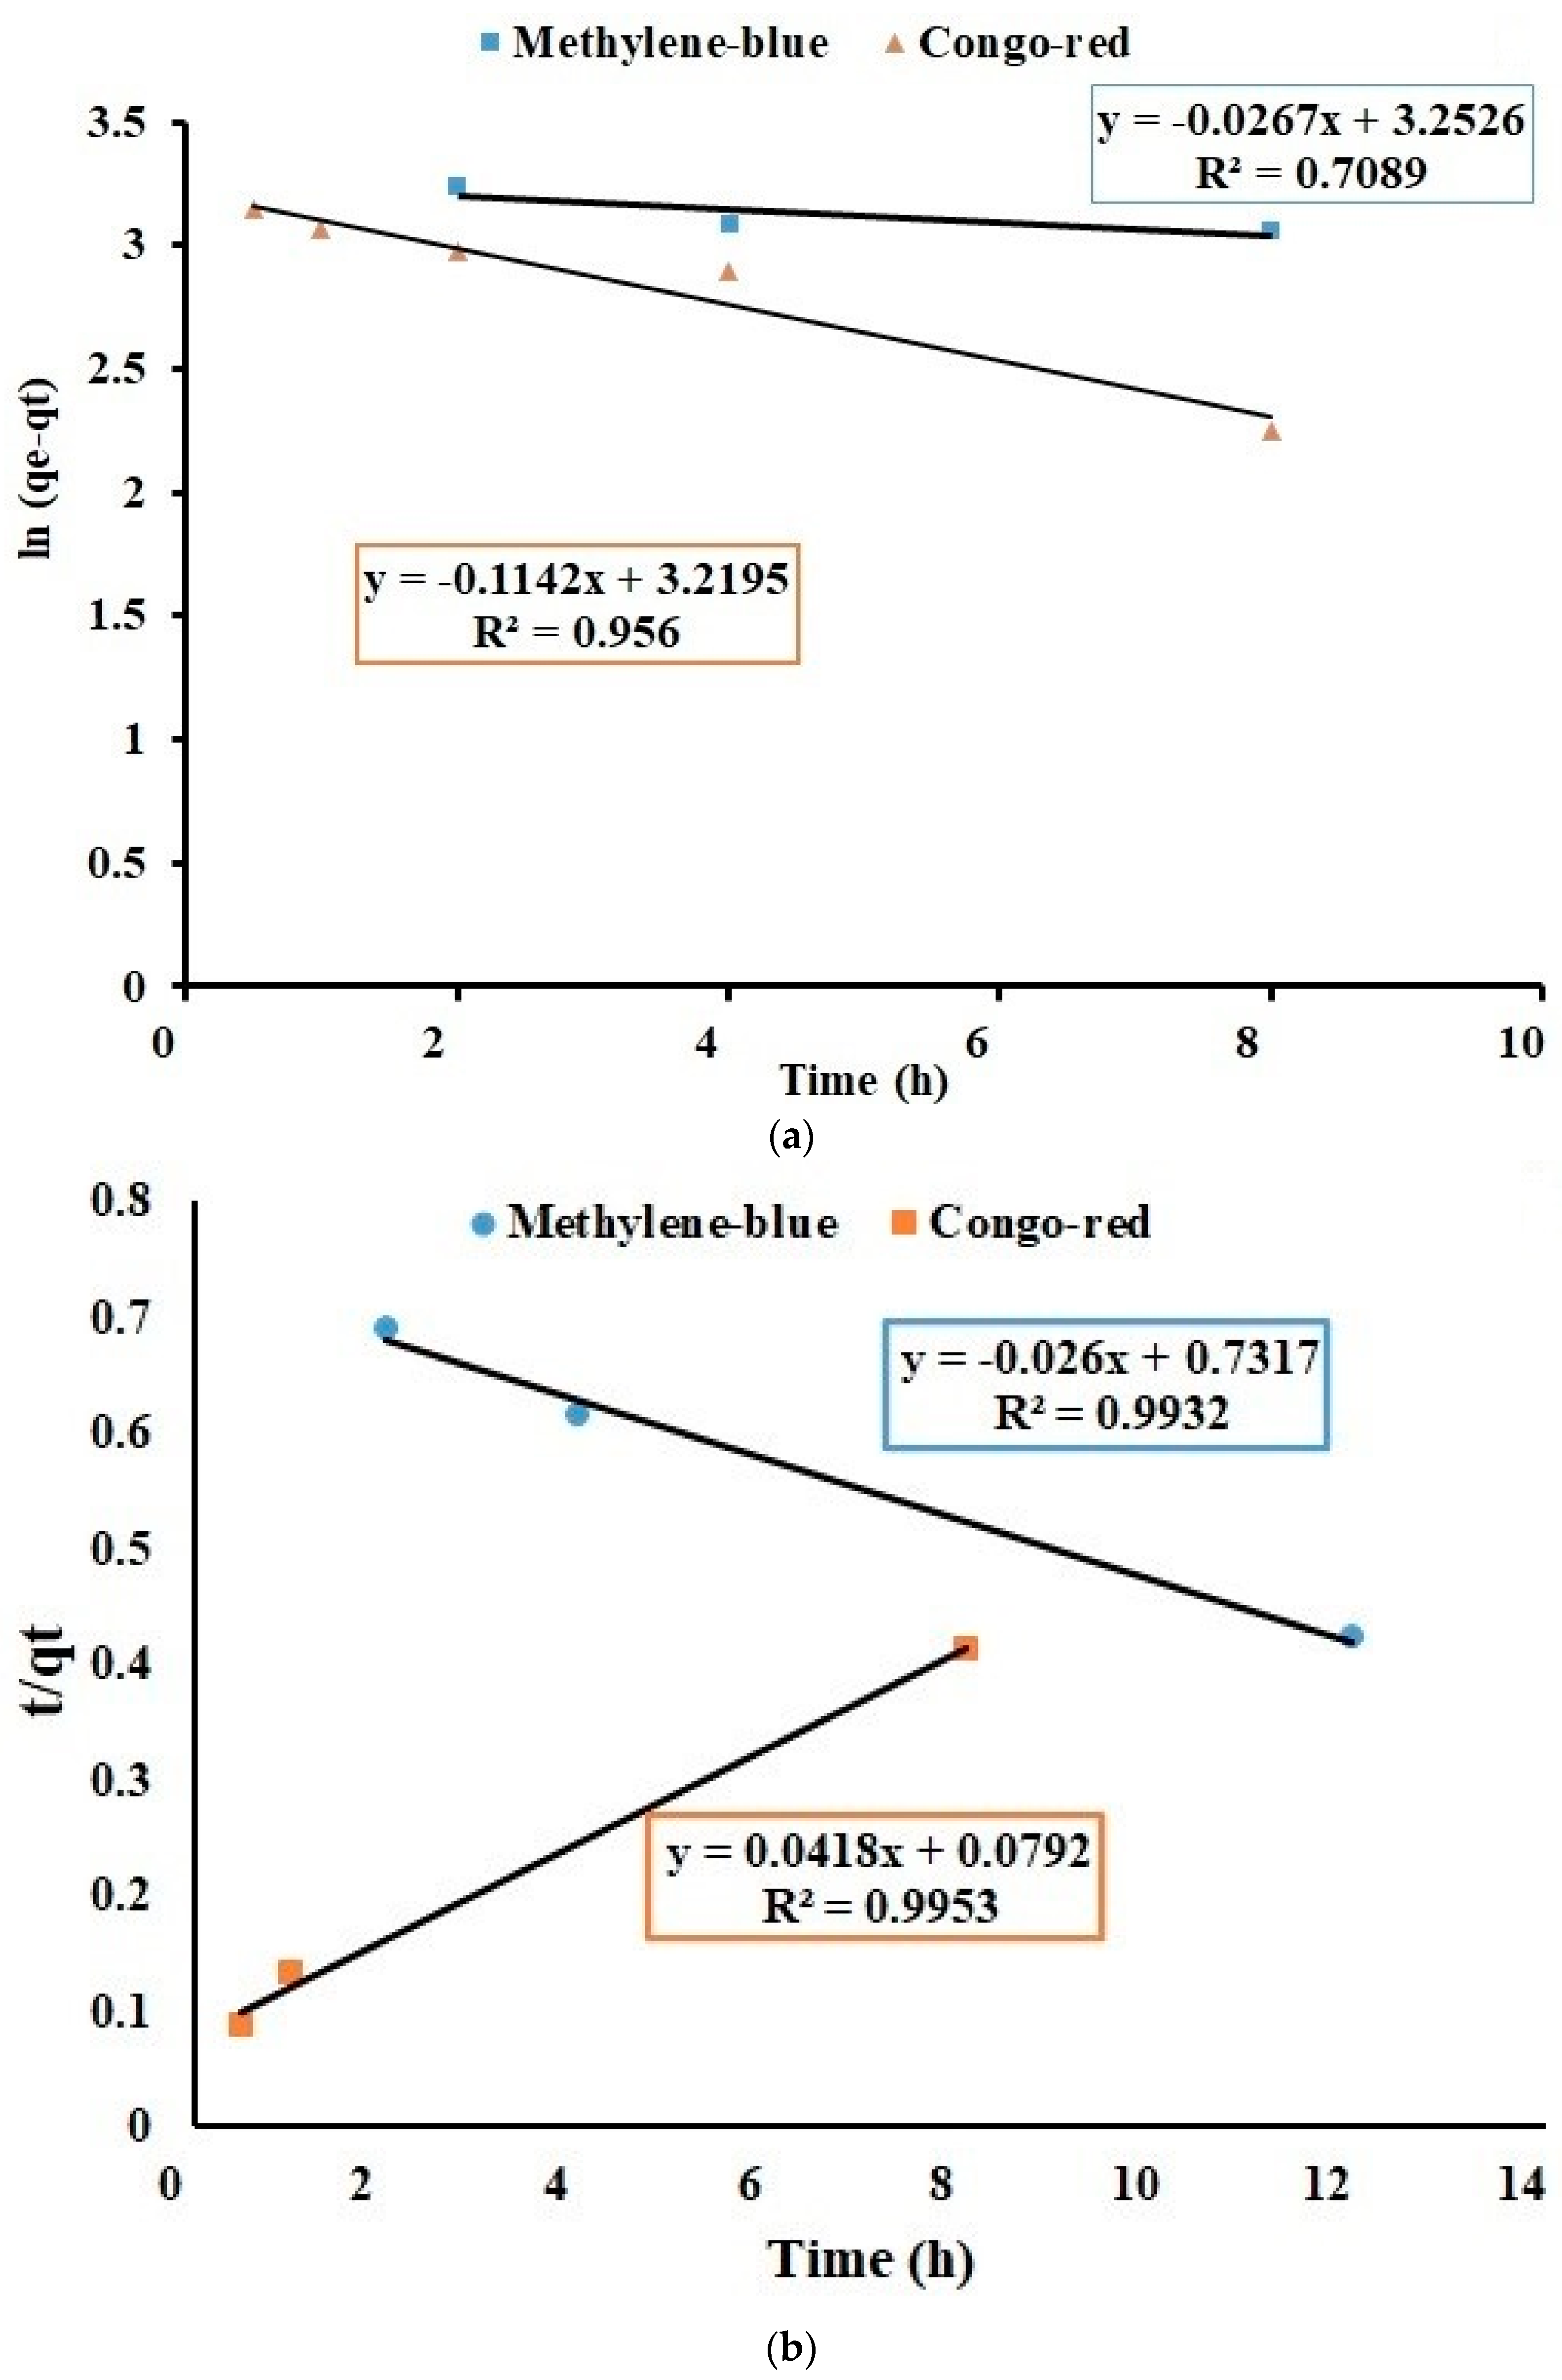
Adsorption isotherm models were demonstrated by applying the two linear equations, Langmuir and Freundlich. The Langmuir model was represented by a linear plot between a specific sorption (Ce/Qe) and the equilibrium concentration (Ce) for MB and CR dyes adsorption by AFGM. The Linear Langmuir and Freundlich isotherms plot and the calculated results were showed in Figure 11a,b and Table 5. In the current work, the adsorption nature of both MB and CR by AFGM exhibited by the Langmuir isotherm model. This can be attributed to the high R2 that was noticed in both states. Moreover, these results were due to the adsorbent surface homogenous nature. The dyes adsorbed completely to the AFGM surface “active sites” until no further adsorption can be noticed and no noticeable further interaction between the adsorbed dyes molecules and the neighboring active sites [50,51]. Table 6 compares de adsorption capacity of AFGM to the MB and CR to those obtained with other adsorption materials.

3.4. Kinetics

The study of equilibrium analysis is an important factor to demonstrate the AFGM affinity and capacity. The determination coefficient (R2) (Figure 12) and the calculated and experimental Qe values (Table 7) show that the pseudo-second-order model suited well with the experimental data than the pseudo-first-order model in two states of adsorption experiments. Previous studies revealed that MB and CR adsorption by the grafted membrane agreed well with pseudo-second-order reaction [60].

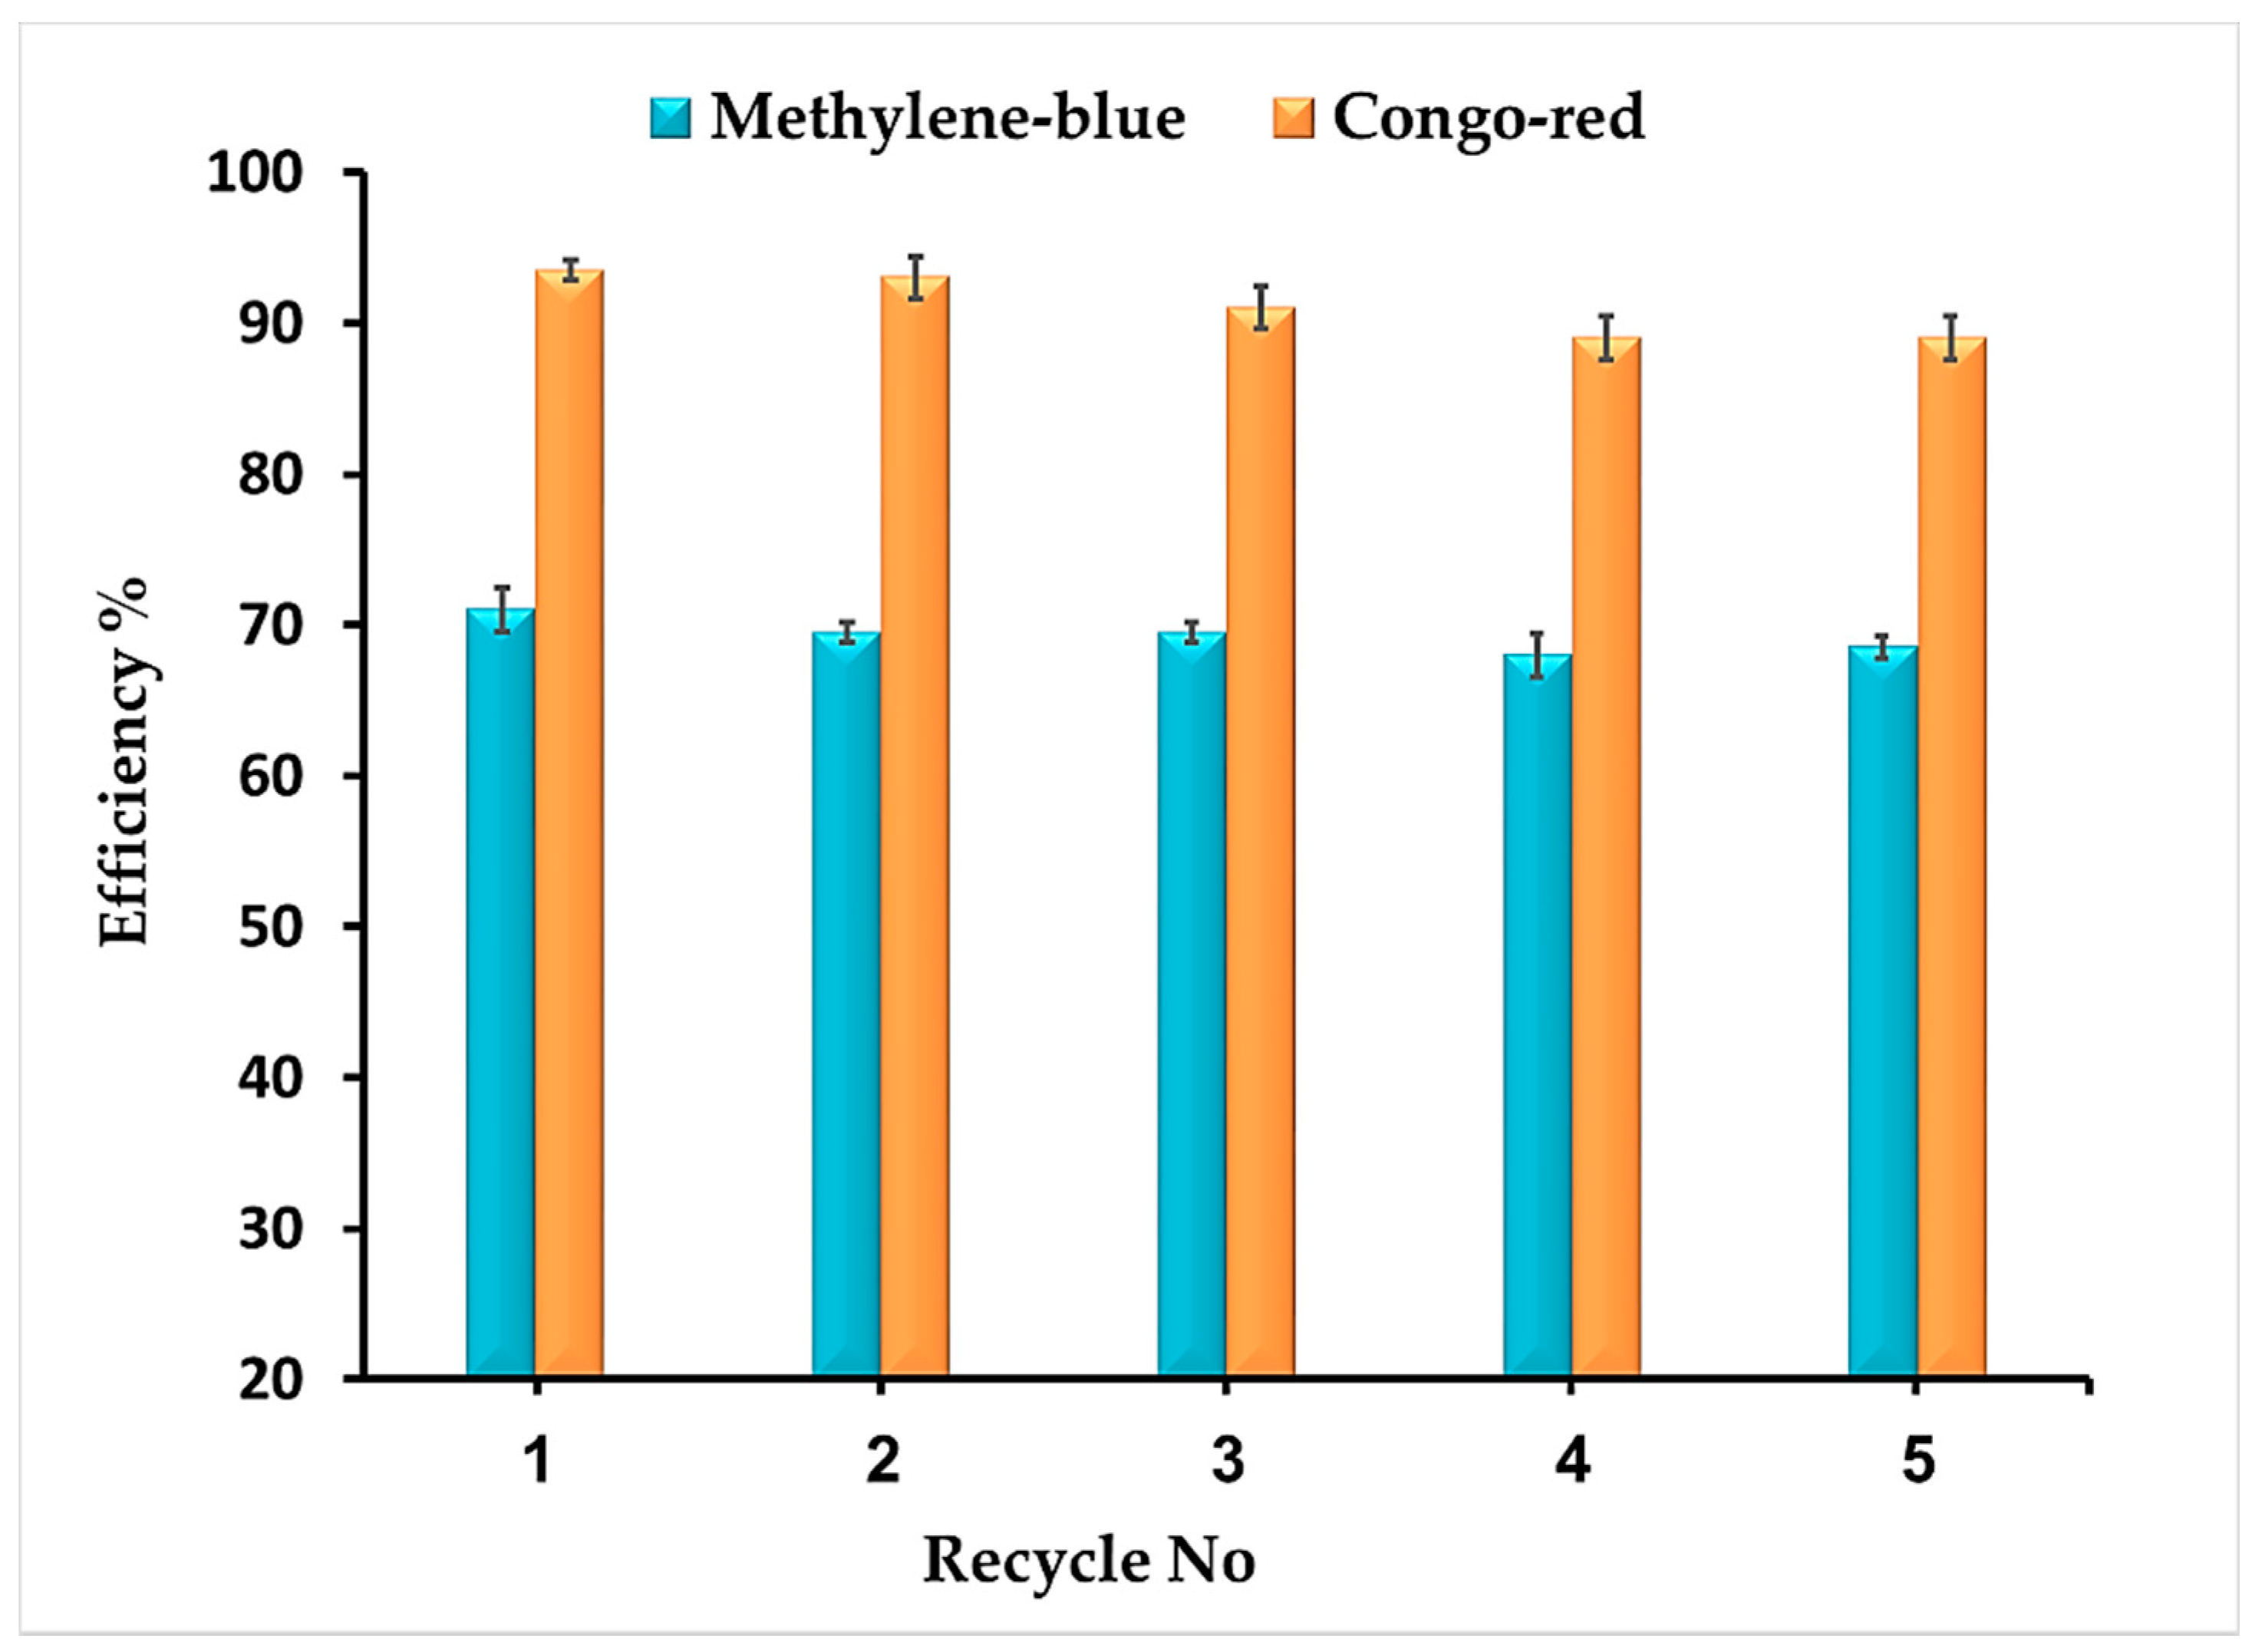
3.5. Regeneration Studies

Re-use experiments were performed for the AFGM, which stated that, 88%, and 68% of their removal capacity for the CR, and the MB dyes, respectively. The previous results were demonstrated after the recovery process by 25% aqueous ethanol solution after 5 cycles of adsorption and desorption. Additionally, the results indicated that, the AFGM remove CR with high percentage than MB removal, which may be due to the cationic nature of the adsorptive membrane that combined easily with anionic dye (CR) see Figure 13. These results indicated the stability of the AFGM in adsorption of dye from wastewater.

4. Conclusions

During this study, the acrylic fibers waste was recycled and converted onto a membrane then grafted using p-phenylenediamine forming AFGM that has adsorption capacity towards cationic and anionic dyes. The dye’s removal efficiency was successfully assessed and optimized through some preliminary experiments and full factorial design. The results stated that, methylene blue has a removal efficiency of 61% and an adsorption capacity of 56.06 at 50 mg/L conc, after 15 h contact time in a static mode. Whereas Congo red removal efficiency of 86% and adsorption capacity of 92.69 at 50 mg/L conc. after 15 h contact time in a static mode was achieved. From these results, it could be concluded that, the AFGM showed a good adsorbent capacity for dyes removal and it has shown higher affinity for anionic dyes (Congo red) than for cationic one (methylene blue). Furthermore, the data was fitted well with Langmuir isotherm and second order kinetics model. The three Rs processes “” were successfully applied where nearly 70% and 93% removal capacities of the Methylene blue and the Congo red dyes, respectively after the recovery process with 25% aqueous ethanol solution. Previous result stated the applicability of this membrane in industrial wastewater treatment. For further studies in the future, several materials could be investigated in the static model in order to achieve higher dyes adsorption capacity with an applicable low cost.

Author Contributions

Conceptualization, A.L., A.E.A. and S.H.; methodology, A.L., A.E.A., G.S., T.Y. and S.H.; software, A.L., A.E.A., G.S., E.A. and S.H.; validation, A.L., A.E.A., G.S., E.A., A.A.G., T.Y. and S.H.; formal analysis, A.L., A.E.A., T.Y. and S.H.; investigation, A.L., A.E.A., T.Y. and S.H.; resources, A.L., A.E.A., G.S., E.A., A.A.G., T.Y. and S.H.; writing—original draft preparation, A.L., A.E.A., T.Y. and S.H.; writing—review and editing, A.L., A.E.A., G.S., E.A., A.A.G., T.Y. and S.H.; project administration, A.L., A.E.A., G.S., S.H., E.A., A.A.G. and T.Y.; funding acquisition, E.A., A.A.G. All authors have read and agreed to the published version of the manuscript.

Funding

This research received no external funding.

Institutional Review Board Statement

Not applicable.

Informed Consent Statement

Not applicable.

Data Availability Statement

No new data were created or analyzed in this study. Data sharing is not applicable to this article.

Acknowledgments

We thank the researchers at Taif University, Taif, Saudi Arabia (supporting project number: TURSP-2020/13)).

Conflicts of Interest

The authors declare no conflict of interest.

References

  1. Aksakal, O.; Ucun, H. Equilibrium, kinetic and thermodynamic studies of the biosorption of textile dye (Reactive Red 195) onto Pinus sylvestris L. J. Hazard. Mater. 2010, 181, 666–672. [Google Scholar] [CrossRef] [PubMed]
  2. Soliman, M.; Elkelish, A.; Souad, T.; Alhaithloul, H.; Farooq, M. Brassinosteroid Seed Priming with Nitrogen Supplementation Improves Salt Tolerance in Soybean. Physiol. Mol. Biol. Plants 2020. [Google Scholar] [CrossRef]
  3. Abdel-Azeem, A.; Nada, A.; O’Donovan, A.; Kumar Thakur, V.; Elkelish, A. Mycogenic Silver Nanoparticles from Endophytic Trichoderma Atroviride with Antimicrobial Activity. J. Renew. Mater. 2019, 7, 171–185. [Google Scholar] [CrossRef]
  4. Salem, S.S.; El-Belely, E.F.; Niedbała, G.; Alnoman, M.M.; Hassan, S.E.-D.; Eid, A.M.; Shaheen, T.I.; Elkelish, A.; Fouda, A. Bactericidal and In-Vitro Cytotoxic Efficacy of Silver Nanoparticles (Ag-NPs) Fabricated by Endophytic Actinomycetes and Their Use as Coating for the Textile Fabrics. Nanomaterials 2020, 10, 2082. [Google Scholar] [CrossRef] [PubMed]
  5. Moghazy, R.M.; Labena, A.; Husien, S.; Mansor, E.S.; Abdelhamid, A.E. Neoteric approach for efficient eco-friendly dye removal and recovery using algal-polymer biosorbent sheets: Characterization, factorial design, equilibrium and kinetics. Int. J. Biol. Macromol. 2020, 157, 494–509. [Google Scholar] [CrossRef]
  6. Abdelhamid, A.E.; El-Sayed, A.A.; Khalil, A.M. Polysulfone nanofiltration membranes enriched with functionalized graphene oxide for dye removal from wastewater. J. Polym. Eng. 2020, 40, 833–841. [Google Scholar] [CrossRef]
  7. Husien, S.; Labena, A.; El-Belely, E.; Mahmoud, H.; Hamouda, A. Application of Nostoc sp. for hexavalent chromium [Cr(VI)] removal: Planktonic and biofilm. Int. J. Environ. Anal. Chem. 2020, 1–22. [Google Scholar] [CrossRef]
  8. Abd El-Ghaffar, M.; Elawady, M.M.; Rabie, A.M.; Abdelhamid, A.E.J.J.o.P.R. Enhancing the RO performance of cellulose acetate membrane using chitosan nanoparticles. J. Polym. Res. 2020, 27, 1–12. [Google Scholar]
  9. Badawi, A.K.; Zaher, K. Hybrid treatment system for real textile wastewater remediation based on coagulation/flocculation, adsorption and filtration processes: Performance and economic evaluation. J. Water Process Eng. 2021, 40, 101963. [Google Scholar] [CrossRef]
  10. Zhu, M.-X.; Lee, L.; Wang, H.-H.; Wang, Z. Removal of an anionic dye by adsorption/precipitation processes using alkaline white mud. J. Hazard. Mater. 2007, 149, 735–741. [Google Scholar] [CrossRef] [PubMed]
  11. Yao, L.; Zhang, L.; Wang, R.; Chou, S.; Dong, Z. A new integrated approach for dye removal from wastewater by polyoxometalates functionalized membranes. J. Hazard. Mater. 2016, 301, 462–470. [Google Scholar] [CrossRef]
  12. El-Shahat, M.; Abdelhamid, A.E.; Abdelhameed, R.M. Capture of iodide from wastewater by effective adsorptive membrane synthesized from MIL-125-NH2 and cross-linked chitosan. Carbohydr. Polym. 2020, 231, 115742. [Google Scholar] [CrossRef]
  13. Elawwad, A.; Karam, A.; Zaher, K. Using an algal photo-bioreactor as a polishing step for secondary treated wastewater. Pol. J. Environ. Stud. 2017, 26, 1493–1500. [Google Scholar] [CrossRef]
  14. Karam, A.; Bakhoum, E.S.; Zaher, K. Coagulation/flocculation process for textile mill effluent treatment: Experimental and numerical perspectives. Int. J. Sustain. Eng. 2020, 1–13. [Google Scholar] [CrossRef]
  15. Patel, H.; Vashi, R. Removal of Congo Red dye from its aqueous solution using natural coagulants. J. Saudi Chem. Soc. 2012, 16, 131–136. [Google Scholar] [CrossRef] [Green Version]
  16. Das, A.; Adhikari, S.; Kundu, P. Bioremediation of Wastewater Using Microalgae. In Environmental Biotechnology For Soil and Wastewater Implications on Ecosystems; Springer: Berlin/Heidelberg, Germany, 2019; pp. 55–60. [Google Scholar]
  17. Karam, A.; Zaher, K.; Mahmoud, A.S. Comparative studies of using nano zerovalent iron, activated carbon, and green synthesized nano zerovalent iron for textile wastewater color removal using artificial intelligence, regression analysis, adsorption isotherm, and kinetic studies. Air Soil Water Res. 2020, 13, 1178622120908273. [Google Scholar] [CrossRef]
  18. Badawi, A.K.; Bakhoum, E.S.; Zaher, K. Engineering Sustainable Evaluation of Using Nano Zero-Valent Iron and Activated Carbon for Real Textile Effluent Remediation. Arab. J. Sci. Eng. 2021, 1–16. [Google Scholar] [CrossRef]
  19. Mansour, T.; Labena, A.; Maziad, N.; Hessin, S. Radiation Copolymerization of PVA/Malic acid/HEMA/Macro-algal (Sargassum sp.) Biomass for Removal of Hexavalent Chromium. Egypt. J. Chem. 2019. [Google Scholar] [CrossRef]
  20. Xia, L.; Zhou, S.; Zhang, C.; Fu, Z.; Wang, A.; Zhang, Q.; Wang, Y.; Liu, X.; Wang, X.; Xu, W. Environment-friendly Juncus effusus-based adsorbent with a three-dimensional network structure for highly efficient removal of dyes from wastewater. J. Clean. Prod. 2020, 259, 120812. [Google Scholar] [CrossRef]
  21. Zidan, T.; Abdelhamid, A.E.; Zaki, E. N-Aminorhodanine modified chitosan hydrogel for antibacterial and copper ions removal from aqueous solutions. Int. J. Biol. Macromol. 2020. [Google Scholar] [CrossRef]
  22. Mansor, E.S.; Labena, A.; Moghazy, R.M.; Abdelhamid, A.E. Advanced eco-friendly and adsorptive membranes based on Sargassum dentifolium for heavy metals removal, recovery and reuse. J. Water Process. Eng. 2020, 37, 101424. [Google Scholar] [CrossRef]
  23. Abdelhamid, A.E.; Labena, A.; Mansor, E.S.; Husien, S.; Moghazy, R.M. Highly efficient adsorptive membrane for heavy metal removal based on Ulva fasciata biomass. Biomass Convers. Biorefinery 2021. [Google Scholar] [CrossRef]
  24. Cseri, L.; Topuz, F.; Abdulhamid, M.A.; Alammar, A.; Budd, P.M.; Szekely, G. Electrospun Adsorptive Nanofibrous Membranes from Ion Exchange Polymers to Snare Textile Dyes from Wastewater. Adv. Mater. Technol. 2021, 2000955. [Google Scholar] [CrossRef]
  25. Hardian, R.; Liang, Z.; Zhang, X.; Szekely, G. Artificial intelligence: The silver bullet for sustainable materials development. Green Chem. 2020, 22, 7521–7528. [Google Scholar] [CrossRef]
  26. Akbari, A. Novel membrane adsorbents prepared by waste fibers of mechanized carpet for Persian Orange X removal. Environ. Nanotechnol. Monit. Manag. 2017, 8, 209–218. [Google Scholar]
  27. Deng, S.; Bai, R.; Chen, J.P. Aminated polyacrylonitrile fibers for lead and copper removal. Langmuir 2003, 19, 5058–5064. [Google Scholar] [CrossRef]
  28. Mirzababaei, M.; Miraftab, M.; Mohamed, M.; McMahon, P. Impact of carpet waste fibre addition on swelling properties of compacted clays. Geotech. Geol. Eng. 2013, 31, 173–182. [Google Scholar] [CrossRef]
  29. Orabi, A.H.; Abdelhamid, A.E.-S.; Salem, H.M.; Ismaiel, D.A.J.J.o.R.; Chemistry, N. New adsorptive composite membrane from recycled acrylic fibers and Sargassum dentifolium marine algae for uranium and thorium removal from liquid waste solution. J. Radioanal. Nucl. Chem. 2020, 326, 1233–1247. [Google Scholar] [CrossRef]
  30. Wang, B.; Chen, P.-Y.; Zhao, R.-X.; Zhang, L.; Chen, Y.; Yu, L.-P. Carbon-dot modified polyacrylonitrile fibers: Recyclable materials capable of selectively and reversibly adsorbing small-sized anionic dyes. Chem. Eng. J. 2020, 391, 123484. [Google Scholar] [CrossRef]
  31. Abdelhamid, A.E.; Khalil, A.M. Polymeric membranes based on cellulose acetate loaded with candle soot nanoparticles for water desalination. J. Macromol. Sci. Part A 2019, 56, 153–161. [Google Scholar] [CrossRef]
  32. Abdelhamid, A.E.; Elawady, M.M.; El-Ghaffar, M.A.A.; Rabie, A.M.; Larsen, P.; Christensen, M.L. Surface modification of reverse osmosis membranes with zwitterionic polymer to reduce biofouling. Water Sci. Technol. Water Supply 2015, 15, 999–1010. [Google Scholar] [CrossRef]
  33. Abdelwahab, N.; Al-Ashkar, E.; El-Ghaffar, M.A. Preparation and characterization of eco-friendly poly (p-phenylenediamine) and its composite with chitosan for removal of copper ions from aqueous solutions. Trans. Nonferrous Met. Soc. China 2015, 25, 3808–3819. [Google Scholar] [CrossRef]
  34. Rabiee, H.; Vatanpour, V.; Farahani, M.H.D.A.; Zarrabi, H. Improvement in flux and antifouling properties of PVC ultrafiltration membranes by incorporation of zinc oxide (ZnO) nanoparticles. Sep. Purif. Technol. 2015, 156, 299–310. [Google Scholar] [CrossRef]
  35. Li, Y.; Su, Y.; Zhao, X.; He, X.; Zhang, R.; Zhao, J.; Fan, X.; Jiang, Z. Antifouling, high-flux nanofiltration membranes enabled by dual functional polydopamine. Acs Appl. Mater. Interfaces 2014, 6, 5548–5557. [Google Scholar] [CrossRef]
  36. Marrez, D.A.; Abdelhamid, A.E.; Darwesh, O.M. Eco-friendly cellulose acetate green synthesized silver nano-composite as antibacterial packaging system for food safety. Food Packag. Shelf Life 2019, 20, 100302. [Google Scholar] [CrossRef]
  37. Cao, B.; Adutwum, L.A.; Oliynyk, A.O.; Luber, E.J.; Olsen, B.C.; Mar, A.; Buriak, J.M. How To Optimize Materials and Devices via Design of Experiments and Machine Learning: Demonstration Using Organic Photovoltaics. ACS Nano 2018, 12, 7434–7444. [Google Scholar] [CrossRef] [Green Version]
  38. Langmuir, I. The adsorption of gases on plane surfaces of glass, mica and platinum. J. Am. Chem. Soc. 1918, 40, 1361–1403. [Google Scholar] [CrossRef] [Green Version]
  39. Freundlich, H. Über die adsorption in lösungen. Zeitschrift für physikalische Chemie 1907, 57, 385–470. [Google Scholar] [CrossRef]
  40. Sarioglu, M.; Atay, U.J.G.N.J. Removal of Methylene blue by using biosolid. Glob. NEST J. 2006, 8, 113–120. [Google Scholar]
  41. Song, J.; Kong, H.; Jang, J. Adsorption of heavy metal ions from aqueous solution by polyrhodanine-encapsulated magnetic nanoparticles. J. Colloid Interface Sci. 2011, 359, 505–511. [Google Scholar] [CrossRef]
  42. Pigorsch, E.; Elhaddaoui, A.; Turrell, S. Spectroscopic study of pH and solvent effects on the structure of Congo red and its binding mechanism to amyloid-like proteins. Spectrochim. Acta Part A Mol. Spectrosc. 1994, 50, 2145–2152. [Google Scholar] [CrossRef]
  43. Fu, Y.; Viraraghavan, T. Removal of Congo Red from an aqueous solution by fungus Aspergillus niger. Adv. Environ. Res. 2002, 7, 239–247. [Google Scholar] [CrossRef]
  44. El-Wakeel, S.; Moghazy, R.; Labena, A.; Husien, S. Algal biosorbent as a basic tool for heavy metals removal; the first step for further applications. J. Mater. Environ. Sci. 2019, 10, 75–87. [Google Scholar]
  45. Husien, S.; Labena, A.; El-Belely, E.; Mahmoud, H.M.; Hamouda, A.S. Adsorption studies of hexavalent chromium [Cr (VI)] on micro-scale biomass of Sargassum dentifolium, Seaweed. J. Environ. Chem. Eng. 2019, 7, 103444. [Google Scholar] [CrossRef]
  46. Husien, S.; Labena, A.; El-Belely, E.; Mahmoud, H.M.; Hamouda, A.S. Absorption of hexavalent chromium by green micro algae Chlorella sorokiniana: Live planktonic cells. Water Pract. Technol. 2019. [Google Scholar] [CrossRef]
  47. Moghazy, R.M. Activated biomass of the green microalga Chlamydomonas variabilis as an efficient biosorbent to remove methylene blue dye from aqueous solutions. Water SA 2019, 45, 20–28. [Google Scholar] [CrossRef] [Green Version]
  48. Tuzen, M.; Sarı, A.; Saleh, T.A. Response surface optimization, kinetic and thermodynamic studies for effective removal of rhodamine B by magnetic AC/CeO2 nanocomposite. J. Environ. Manag. 2018, 206, 170–177. [Google Scholar] [CrossRef]
  49. Saad, M.; Tahir, H.; Khan, J.; Hameed, U.; Saud, A. Synthesis of polyaniline nanoparticles and their application for the removal of Crystal Violet dye by ultrasonicated adsorption process based on Response Surface Methodology. Ultrason. Sonochem. 2017, 34, 600–608. [Google Scholar] [CrossRef]
  50. Saadat, S.; Karimi-Jashni, A. Optimization of Pb (II) adsorption onto modified walnut shells using factorial design and simplex methodologies. Chem. Eng. J. 2011, 173, 743–749. [Google Scholar] [CrossRef]
  51. Saad, M.; Tahir, H.; Ali, D. Green synthesis of Ag-Cr-AC nanocomposites by Azadirachta indica and its application for the simultaneous removal of binary mixture of dyes by ultrasonicated assisted adsorption process using Response Surface Methodology. Ultrason. Sonochem. 2017, 38, 197–213. [Google Scholar] [CrossRef]
  52. Ponnusami, V.; Krithika, V.; Madhuram, R.; Srivastava, S. Biosorption of reactive dye using acid-treated rice husk: Factorial design analysis. J. Hazard. Mater. 2007, 142, 397–403. [Google Scholar] [CrossRef]
  53. Woolard, C.; Strong, J.; Erasmus, C. Evaluation of the use of modified coal ash as a potential sorbent for organic waste streams. Appl. Geochem. 2002, 17, 1159–1164. [Google Scholar] [CrossRef]
  54. Cengiz, S.; Cavas, L. Removal of methylene blue by invasive marine seaweed: Caulerpa racemosa var. cylindracea. Bioresour. Technol. 2008, 99, 2357–2363. [Google Scholar] [CrossRef] [PubMed]
  55. Rouf, S.; Nagapadma, M.; Rao, R.R. Removal of harmful textile dye congo red from aqueous solution using chitosan and chitosan beads modified with CTAB. Int. J. Eng. Res. Appl. 2015, 5, 75–82. [Google Scholar]
  56. Sasmal, D.; Maity, J.; Kolya, H.; Tripathy, T. Study of congo red dye removal from its aqueous solution using sulfated acrylamide and N, N- dimethyl acrylamide grafted amylopectin. J. Water Process. Eng. 2017, 18, 7–19. [Google Scholar] [CrossRef]
  57. Li, G.; Zhu, W.; Zhang, C.; Zhang, S.; Liu, L.; Zhu, L.; Zhao, W. Effect of a magnetic field on the adsorptive removal of methylene blue onto wheat straw biochar. Bioresour. Technol. 2016, 206, 16–22. [Google Scholar] [CrossRef] [Green Version]
  58. Seow, W.Y.; Hauser, C.A.E. Freeze–dried agarose gels: A cheap, simple and recyclable adsorbent for the purification of methylene blue from industrial wastewater. J. Environ. Chem. Eng. 2016, 4, 1714–1721. [Google Scholar] [CrossRef]
  59. Omar, H.; El-Gendy, A.; Al-Ahmary, K. Bioremoval of toxic dye by using different marine macroalgae. Turk. J. Bot. 2018, 42, 15–27. [Google Scholar] [CrossRef]
  60. Kavitha, D.; Namasivayam, C. Experimental and kinetic studies on methylene blue adsorption by coir pith carbon. Bioresour. Technol. 2007, 98, 14–21. [Google Scholar] [CrossRef]
Figure 1. SEM analysis of membrane for (a) blank membrane surface, (b) AFGM surface, (c) cross section of blank, (d) cross section of the AFGM at different magnification (left and right) (e) bottom surface of blank membrane.
Separations 08 00042 g001
Figure 2. FT-IR analysis of the acrylic membrane before and after grafting.
Separations 08 00042 g002
Figure 3. Effect of time on removal efficiency of Methylene blue and Congo red dyes by the AFGM: adsorption capacity vs. time, n = 3.
Separations 08 00042 g003
Figure 4. Effect of pH on removal efficiency of Methylene blue and Congo red dyes by the AFGM: adsorption capacity vs. time, n = 3.
Separations 08 00042 g004
Figure 5. Effect AFGM adsorption capacity to methylene blue and Congo red dyes based on their concentration, n = 3.
Separations 08 00042 g005
Figure 6. The effect of the main parameters on the removal efficiency of methylene blue and Congo red dyes by the AFGM.
Separations 08 00042 g006
Figure 7. Plot of the interaction effects for the for the MB and CR adsorption by the AFGM.
Separations 08 00042 g007
Figure 8. Pareto chart for the MB and CR adsorption by the AFGM.
Separations 08 00042 g008
Figure 9. Plot of the normal probability for the MB and CR adsorption by the AFGM.
Separations 08 00042 g009
Figure 10. Response optimizer of MB and CR removal process by the AFGM.
Separations 08 00042 g010
Figure 11. Langmuir (a) and Freundlich (b) isotherm for the MB and CR adsorption by the AFGM.
Separations 08 00042 g011aSeparations 08 00042 g011b
Figure 12. The pseudo first-order reaction (a) and pseudo second order reaction (b) for methylene blue and Congo red dyes adsorption by AFGM.
Separations 08 00042 g012
Figure 13. Application of the AFGM in different adsorption desorption cycles, n = 3.
Separations 08 00042 g013
Table 1. Coded low and high levels of the factors that were used in full factorial optimization model of methylene blue and Congo red adsorption by the AFGM.
FactorSymbolStatistical CodeValues of Coded Levels
(Low)−1(High)+1
TimeTime (h)A315
Dyes ConcentrationConc. (mg/L)D50200
PollutantPollutantCMBCR
Table 2. Design of matrix of methylene blue and Congo red adsorption by using the AFGM, n = 1.
Std OrderRun OrderPt TypeBlocksTime (h)Conc. (mg/L)PollutantRE (%) *FITS **RES ***
61111550CR86.0092.69-6.693
42113200CR20.3526.13-5.78
731115200MB23.2528.18-4.931
1411350MB43.2047.21-4.018
55111550MB61.0056.064.931
2611350CR59.8054.015.781
37113200MB23.3519.334.018
881115200CR71.5064.806.693
* RE, removal efficiency; ** FITS, the value of point estimates of the mean RE for given values of the factors; ** RES, residuals (difference between observed value and its corresponding fitted value).
Table 3. Porosity, swelling measurements and grafting percent for acrylic membrane and the AFGM.
MembranePorosity (%)Swelling (%)Grafting (%)
Blank acrylic membrane23.1420%-
Acrylic fiber grafted membrane (AFGM)15354%14.5
Table 4. Coded co-efficient factors of methylene blue and Congo red dyes adsorption by AFGM.
TermEffectCoefSE CoefT-Valuep Value
Constant 48.563.1515.440.001
Time (h)23.7611.883.153.780.032
Conc. (mg/L)−27.89−13.943.15−4.430.021
Pollutant21.7110.863.153.450.041
Time (h)*Pollutant14.917.463.152.370.098
Table 5. Langmuir and Freundlich Isotherm parameters for MB and CR adsorptions by AFGM.
ModelParameters
LangmuirQmax (mg/g)bR2
MBCRMBCRMBCR
57.1484.030.02350.0110.9890.9481
FreundlichNKR2
MBCRMBCRMBCR
2.011.0153.4792.60.99420.8802
R2, determination coefficient. MB, methylene blue. CR, Congo red.
Table 6. Comparison between different sorbent materials for MB and CR dyes adsorption capacities.
Sorbent MaterialsDyeConc (mg/L)Adsorption Capacity (Qe mg/g)References
Acrylic fiber membraneMB10057.14Current study
Acrylic fiber membraneCR10084.03Current study
ZeoliteMB-10.82[53]
Rice huskMB10-12540.58[54]
CB-CTABCR2019.15[55]
Sulfated APCR1037.18[56]
Wheat straw biochar powderMB5–8062.5[57]
Freeze–dried agarose gelMB-10.4[58]
Sulfated AP-g-PAMCR1066.97[56]
Pinus brutiaCR5035.3[59]
Table 7. Kinetic parameters for MB and CR adsorption by AFGM.
ModelParameters
1st order KineticsQe calc.Qe exper.KR2
MBCRMBCRMBCRMBCR
1788.91657.628.428.90.061490.2580.70890.956
2nd order kineticsQe calc.Qe exper.KR2
MBCRMBCRMBCRMBCR
38.4623.9228.428.90.000920.022060.99320.9953
R2, determination coefficient. MB, Methylene blue. CR, Congo red.
Publisher’s Note: MDPI stays neutral with regard to jurisdictional claims in published maps and institutional affiliations.

