Article

Determination of Mitotane (DDD) and Principal Metabolite by a Simple HPLC-UV Method and Its Validation in Human Plasma Samples

1
Department of Clinical and Experimental Medicine, University of Pisa, Via Savi, 10-56126 Pisa, Italy
2
Unit of Clinical Pharmacology and Pharmacogenetics, Pisa University Hospital, Via Roma, 67-56126 Pisa, Italy
3
Department of Internal Medicine, Pharmacology & Toxicology Unit, University of Genoa, Viale Benedetto XV, 2-16132 Genoa, Italy
4
Clinical Pharmacology Unit, EO Ospedali Galliera, Mura delle Cappuccine, 14-16128 Genoa, Italy
*
Author to whom correspondence should be addressed.
Submission received: 19 April 2021 / Revised: 28 April 2021 / Accepted: 5 May 2021 / Published: 9 May 2021

Abstract

:
Mitotane (DDD) is prescribed in adrenocortical renal carcinoma. Its principal metabolite, dichlorodiphenylethene (DDE), can accumulate in fat tissues and from a toxicological point of view, is probably more interesting than the other metabolite dichlorodiphenylacetate (DDA). Therapeutic Drug Monitoring (TDM) of DDD plasma concentrations is required to combine therapeutic efficacy with acceptable toxicity. Therefore, we developed a simple and fast HPLC-UV method to monitor plasma concentrations after a liquid–liquid extraction of plasma calibration samples, quality controls, and anonymous plasma samples with unknown DDD and DDE concentrations. Samples were injected into an HPLC instrument and peaks of mitotane (DDD), DDE and aldrin (internal standard, IS) were resolved by a stationary phase C18 column (250 mm × 4.6 mm, 5 μm), maintained at 35 °C. Mobile phase, made by water/acetonitrile (10/90, v/v), was pumped at a flow of 1.0 mL/min, and absorbance was monitored at a wavelength of 226 nm. Average recovery was 95% for all analytes, and the method was linear for both DDD (r2 = 0.9988, range 1–50 mg/L) and DDE (r2 = 0.9964, range 1–40 mg/L). The values of limit of detection and quantitation were 0.102 and 0.310 mg/L for DDD and 0.036 and 0.108 mg/L for DDE, respectively. The retention time values of DDD, DDE and IS were 7.06, 9.42 and 12.60 min, respectively. The method was successfully validated according to FDA guidelines and finally adopted for routine TDM.

1. Introduction

Mitotane (1-chloro-2-[2,2-dichloro-1-(4-chlorophenyl)ethyl] benzene), also known as o,p′-DDD, was isolated in 1940 from the insecticide, dichlorodiphenyltrichloroethane (DDT), and finds its selective use in the treatment of adrenocortical carcinoma (AC), against which the drug is effective alone or in combination with other pharmacological agents [1]. Indeed, in the adjuvant setting, mitotane (DDD) significantly improves disease-free survival at the cost of moderate toxicities [2]. In advanced diseases, mitotane may control disease progression with a median overall survival of 12.0–14.8 months, depending on the combination regimen [3]. Even in that setting, the administration of mitotane may be associated with neurological and gastrointestinal toxicities that may require a decrease in daily dosage or the discontinuation of therapy [4]. In the latter case, the patient may lose the therapeutic benefit of the drug. Usually, in advanced adrenocortical carcinoma, there are two dose regimens: a low-dose starting regimen (a dose of 3 g daily is reached after 12 days), and a high-dose starting regimen (a dose of 6 g daily is reached after 4 days and kept until day 14). Further dose adjustments are guided by the results of mitotane monitoring [5].
Mitotane (DDD) metabolism involves two reactions via α- and β-hydroxylation. Alpha-hydroxylation forms the metabolite (1,1-(o,p′-dichlorodiphenyl)-2,2 dichloroethene, DDE), whereas β-hydroxylation forms the o,p′-dichlorodiphenyl acyl chloride (DDA) (Figure 1). DDA has a strong affinity for biological nucleophiles and can acylate different cellular molecules, but it may be rapidly converted to the metabolite o,p′(1,1-(o,p′-dichlorodiphenyl) acetic acid, DDA) in the presence of water. Indeed, DDA is less lipophilic than DDD and DDE, and its presence in urine suggests that it is a product of the DDD deactivation pathway. In contrast, it has been speculated that DDE could be an active metabolite, as it was not extensively found in plasma, urine, or feces, and exerted a cytotoxic effect against the H295R adrenocortical cell line [6], which has been used in many related studies on steroidogenesis [7]. However, further studies are needed to confirm this hypothesis.
Being a highly lipophilic drug, DDD has a wide tissue distribution and a long terminal half-life (18–159 days) [8], so a steady-state may be achieved after several weeks of therapy [9]. This is because the delay in every change in drug dosage modifies the plasma concentration. Furthermore, clinical studies have demonstrated that patients may achieve the best therapeutic benefit when minimum plasma concentrations (Cmin) of the drug are within the range of 14–20 mg/L [2,10]. Despite the long terminal plasma half-life, the timing of blood withdrawal should be carefully considered because plasma concentrations of mitotane (DDD) display a wide fluctuation after drug intake [10].
High-performance liquid chromatographic (HPLC) methods represent a valid alternative to gas chromatography [11,12] in monitoring plasma DDD levels, despite the fact that they do not always assess DDD, DDA, and DDE at the same time [13].
Therefore, the present study reports the elaboration and validation, according to FDA guidelines, of a rapid HPLC method for DDD and DDE Therapeutic Drug Monitoring (TDM). The method was then applied to human anonymized plasma samples, and it is currently used for drug monitoring at the Pisa University Hospital, which is a regional reference center for the therapy and management of AC patients in both adjuvant and palliative settings, with the aim of implementing the precision medicine concept, already practiced in other diseases [14,15].
Indeed, the final method resulted reliable and precise, with a short run time that allowed a minimum turnaround time [16]. Future perspectives could include a comparison with reference analytical methods or with SPE extractions, as performed for mitotane (DDD) [17] and other analytes [18,19,20].

2. Materials and Methods
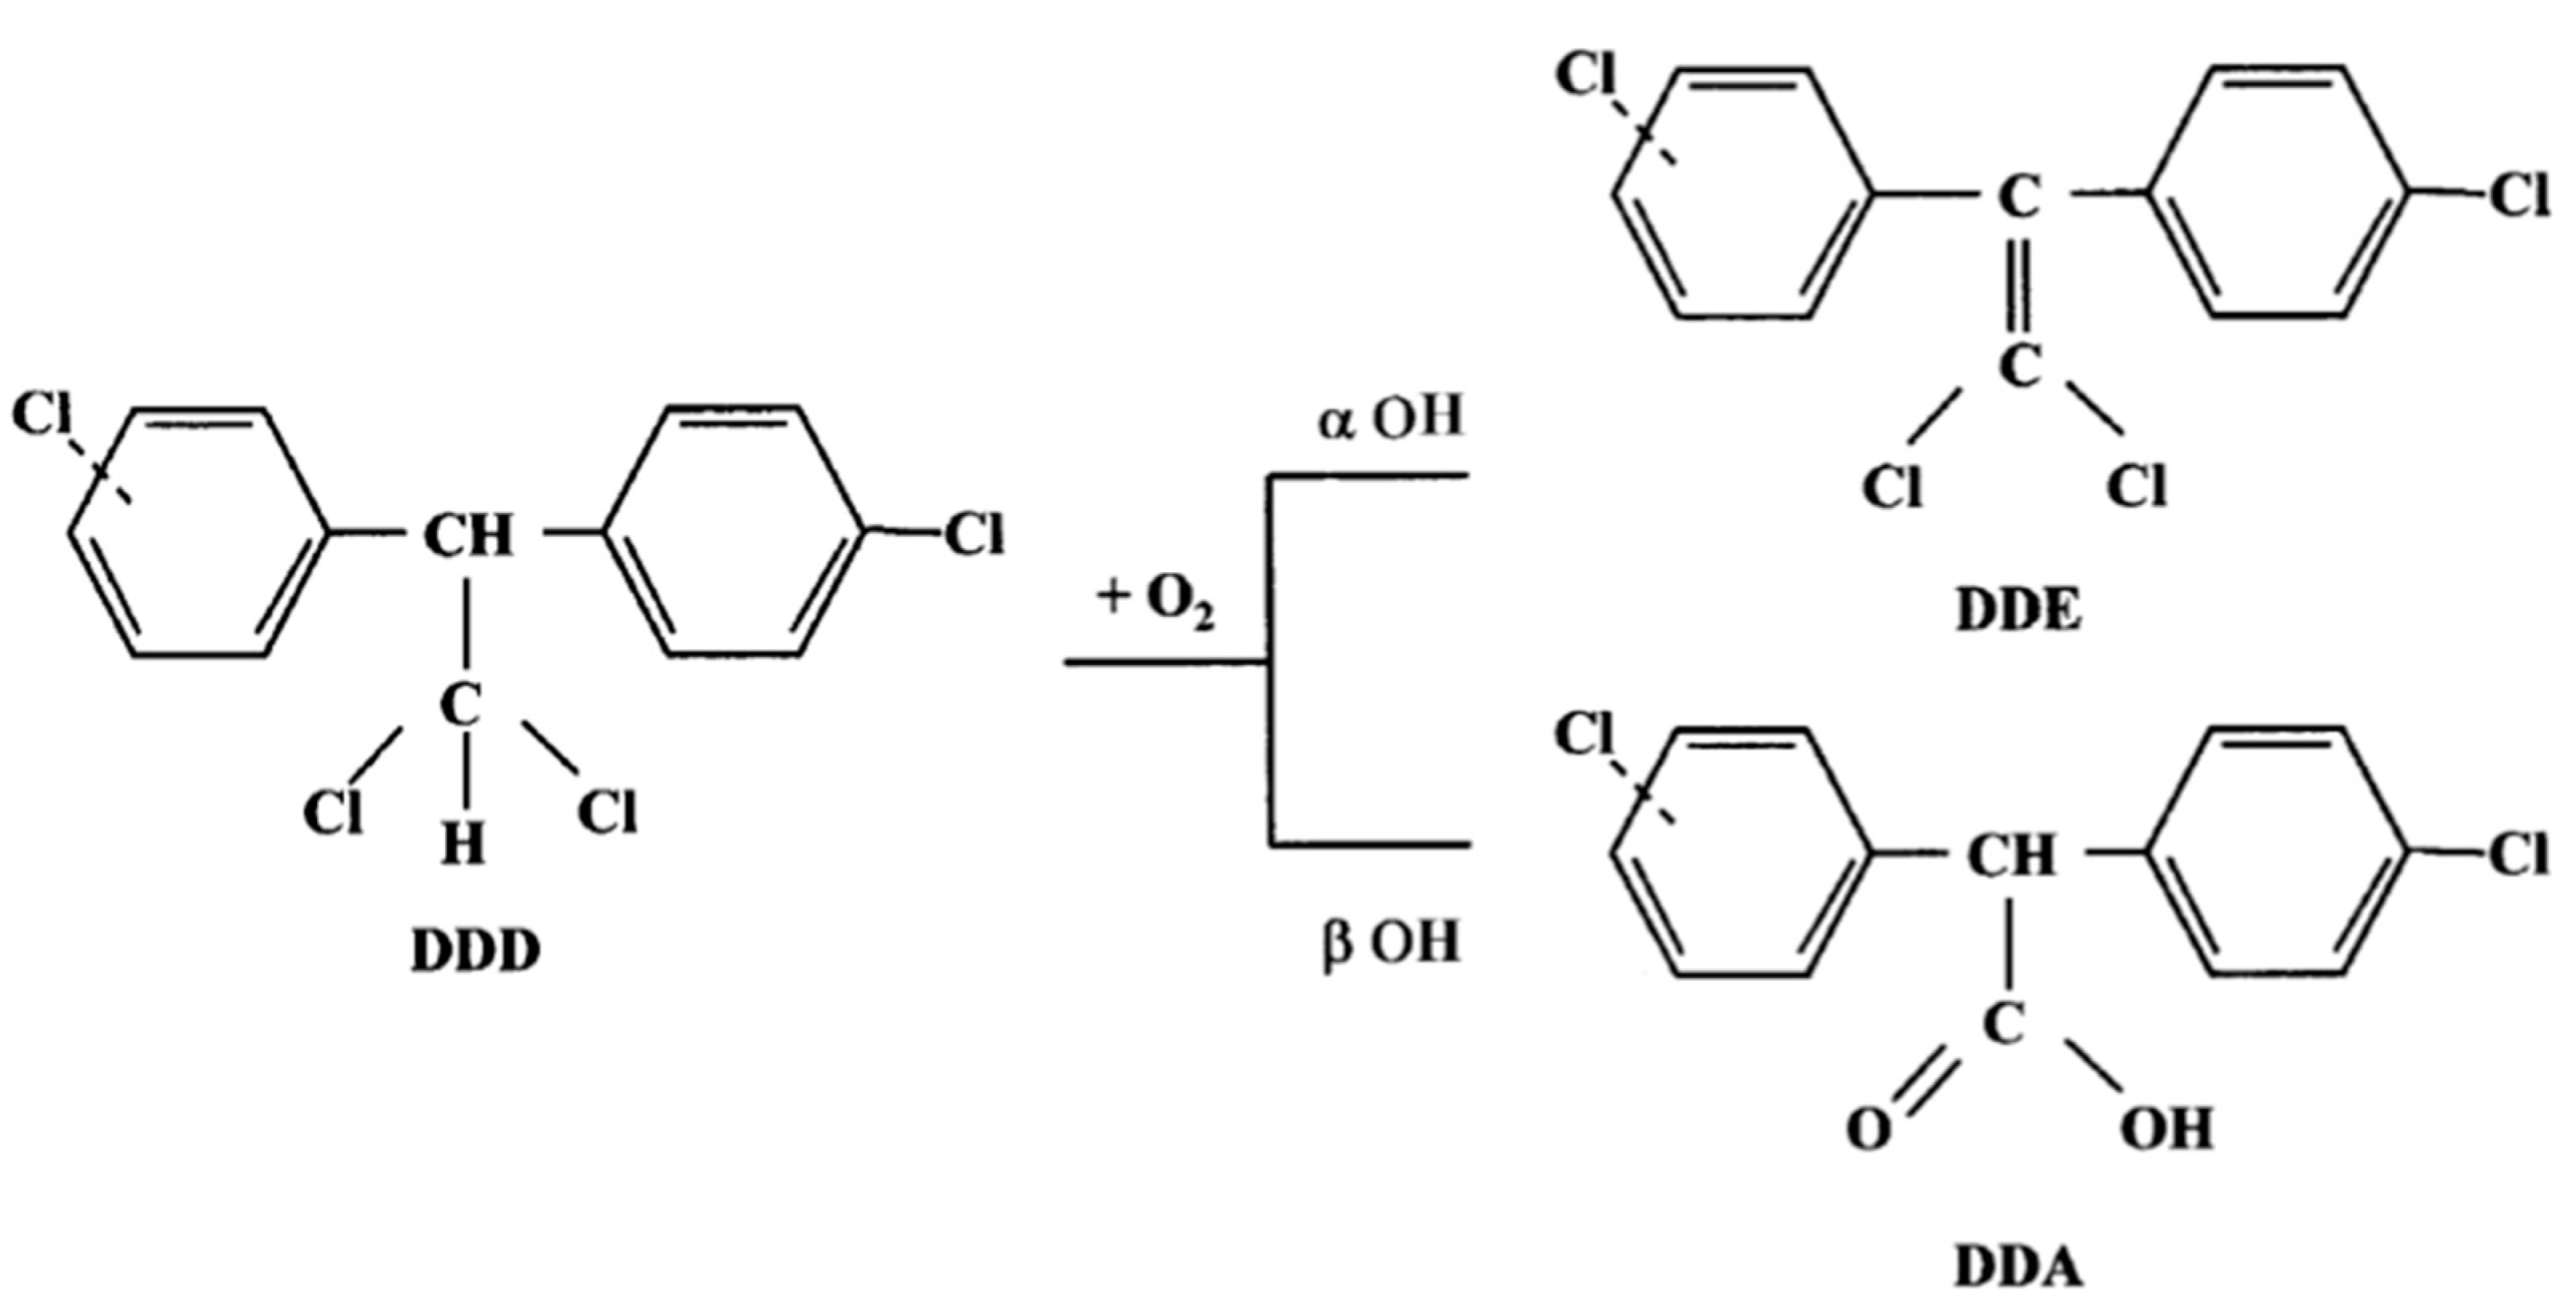
2.1. Chemicals

HPLC-grade acetonitrile (ACN), water, absolute ethanol, DDD (99% purity, powder), DDE (99% purity, 0.1 mg/mL solution) and aldrin (powder) used as internal standard (IS), were purchased from Merck (Merck, Darmstadt, Germany).

2.2. Instrumentation

The HPLC-UV method was developed using a Waters 2695 Separations Module equipped with a Waters 2487 Dual λ Absorbance Detector (Waters Corporation, Milford, CT, USA), and controlled by the Empower software version Pro (Waters Corporation, Milford, CT, USA). HPLC separation was accomplished on a HAISIL HL C18 250 mm × 4.6 mm, 5 μm (Higgins Analytical Inc., Mountain View, CA, USA).

2.3. Methods

2.3.1. Calibration and Quality Control Samples

Stock solutions of DDD and aldrin were prepared by dissolving 10 mg of the analyte in 10 mL of ethanol (final concentration, 1000 μg/mL). DDE commercial solution has a concentration of 100 μg/mL in methanol. Calibration and quality control samples were obtained by serial dilution of drugs (from stock solution aliquots) in blank human plasma for laboratory use, obtained by the Pisa Hospital Transfusion Unit. We diluted 100 μL of DDD and aldrin stock solutions with 900 μL of blank human plasma, obtaining working solutions of 100 μg/mL. The DDE solution was diluted to obtain a working solution of 10 μg/mL. Serial dilutions of DDD and DDE for calibration standards were made in blank human plasma up to final concentrations of 0.5, 1.0, 5.0, 25.0 and 50.0 mg/L. For method validation and intra- and inter-day variability tests, the following concentrations of DDD in quality controls (QC) were used: 0.5, 5.0, 50.0 mg/L. IS validation was performed on aldrin-spiked plasma samples.
DDD and aldrin solutions (in ethanol) were stored at −20 °C, while DDE was stored at 4 °C. Spiked plasma samples were kept at −20 °C for 3 consecutive days for intra- and inter-day validation, since the stability of polychlorinated compounds is known in the literature [21].

2.3.2. Sample Preparation

Calibration standards, quality controls, and anonymized samples (200 μL) were added with 20 μL of IS working solution (1000 μg/mL), then samples were vortexed for 30 s. Samples were deproteinized by adding 200 μL of ACN, vortexed for 30 s and centrifuged at 12,000 rpm for 10 min. The clear supernatant was transferred into HPLC autosampler vials for HPLC-UV analysis.

2.3.3. HPLC-UV Conditions and Detection

The HPLC mobile phase consisted of ACN and water at different percentages of volumes (Figure 1) to obtain the optimal identification and separation of analyte peaks. Moreover, to expedite the chromatographic runs, an isocratic elution of the mobile phase was chosen with a chromatographic column maintained at a controlled temperature (35 °C). Finally, the volume of injection was fixed at 50 μL, based on the chromatographic column size (250 mm × 4.6, 5 μm particle size).

2.3.4. Validation Studies

The method validation was made according to FDA guidelines, through the evaluation of precision and accuracy. In particular, a limit for intra-day precision was defined as 2(1−0.5logConc) × 2/3, while a limit for inter-day precision was calculated as 2(1−0.5logConc) [22].
Accuracy was defined as the percentage of results within the ±15% range of nominal concentrations and within the ±20% range at Limit of Quantitation (LOQ). QC samples were analyzed in triplicate at each of the three concentration levels. Samples were quantified in a single batch, considering mean concentration, standard deviation, and percentage coefficient of variation. Inter-day precision and accuracy values were calculated with the same parameters on QCs in triplicate at three different concentrations, for three consecutive days, for three weeks. To evaluate specificity, blank samples of human plasma were analyzed to check for the presence of interfering peaks at the retention time (RT) points of DDD, DDE and aldrin. To evaluate robustness, the Fisher test was carried out at three different concentration values of intra- and inter-day for both analytes (DDD and DDE). Potential interferences, caused by endogenous and chemically related compounds, were studied to evaluate the selectivity of the method. The signal-to-noise ratio of a possible interfering peak in a blank plasma sample should be below the signal-to-noise ratio of DDD, DDE, and aldrin in the same elution sector at the LOD level. The LOD was evaluated as a signal-to-noise ratio ≥ 3, while the LOQ value was calculated as 3.04 × LOD. Finally, the IS response was measured as a percentage difference between AC plasma samples and spiked plasma. The various parameters tested were: linearity, which is the method’s ability to obtain test results that are directly proportional to the concentration of analyte in the sample; accuracy, which is defined as the closeness of a result to the true value; and precision, which is defined as the extent to which results agree with one another. Limit of determination (LOD) is the smallest amount or concentration of analyte in the test sample that can be reliably distinguished from zero, and limit of quantitation (LOQ) is used to describe the smallest concentration of analyte that can be reliably measured by an analytical procedure.

2.3.5. Application of the Methods

From January 2020 to February 2021, the validated method was adopted for the routine TDM of AC patients. To protect patients’ privacy, each sample is registered on the sample list of the Empower software by an 8-digit number, assigned consecutively by the laboratory information system. No further information regarding patients and the prescribing physicians are recorded. Chromatograms were extracted from the DDD folder of the computer and reviewed by two technicians in a blinded fashion, together with the corresponding calibrator samples and quality controls used in every analytical session.

2.3.6. Statistical Calculations

Statistical calculations were performed with GraphPad Prism version 5.0a (GraphPad Software®, San Diego, CA, USA), and the level of significance was set at p = 0.05.

3. Results

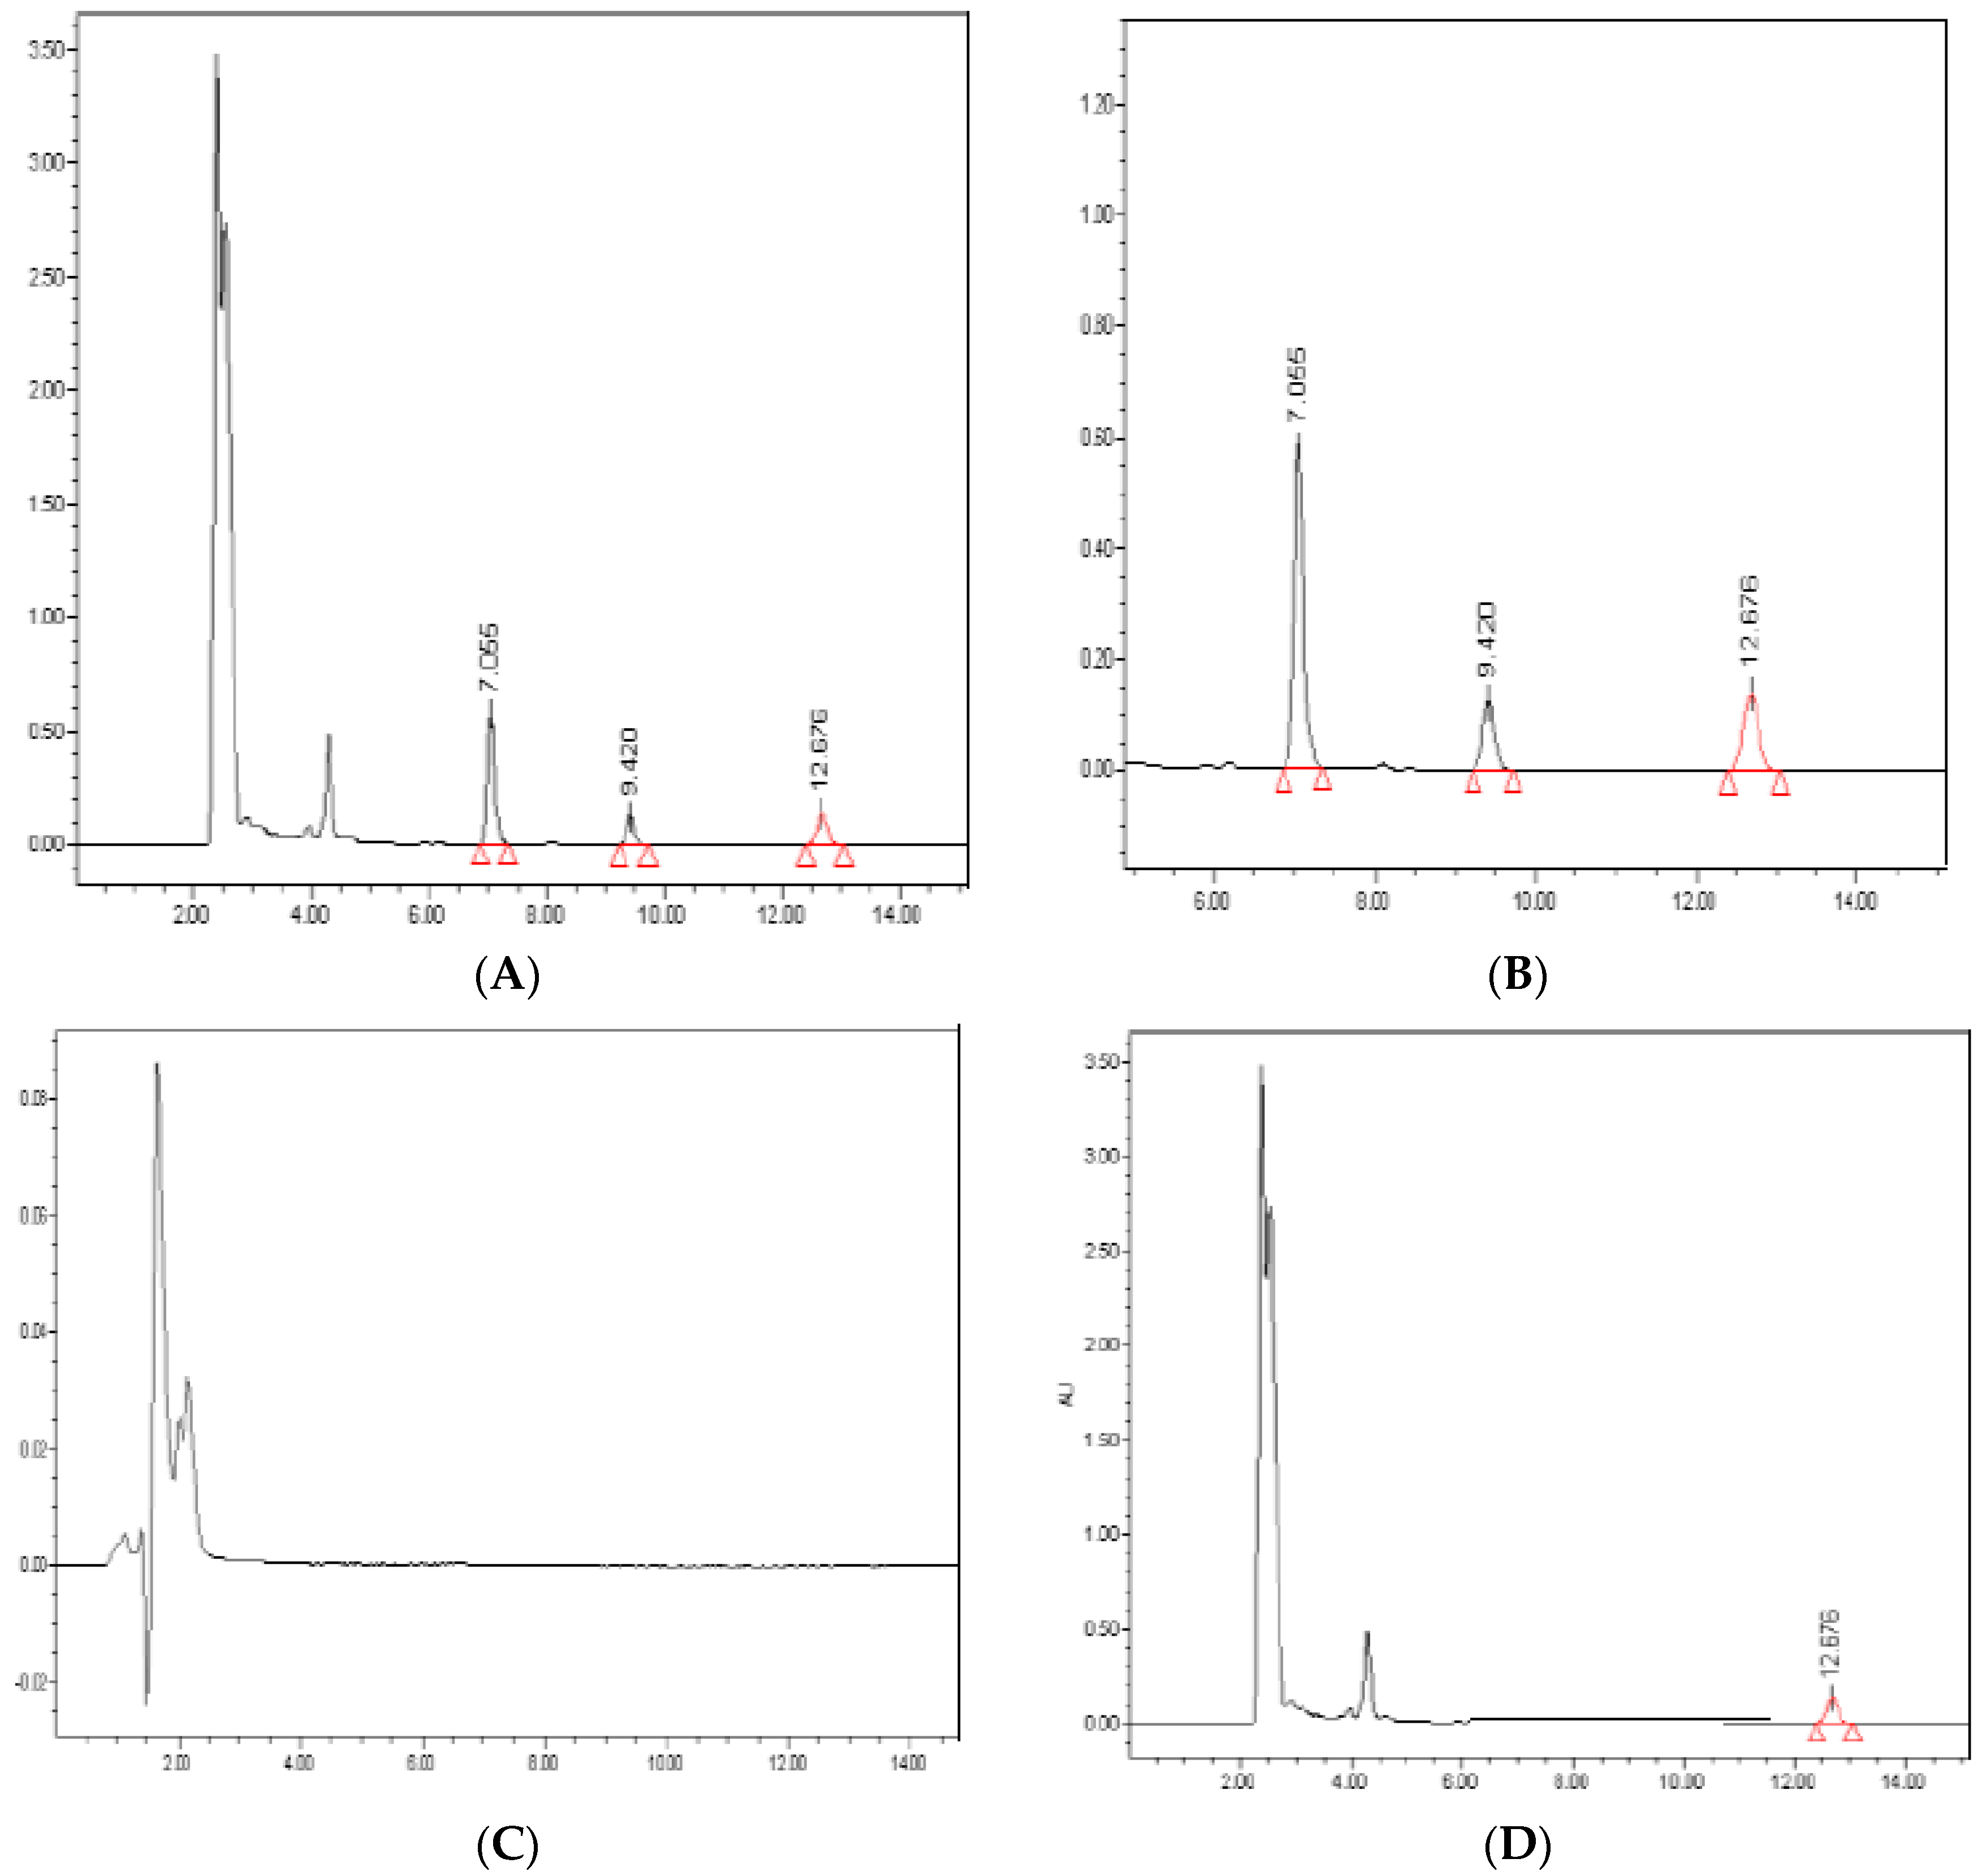
3.1. Sample Extraction and HPLC-UV Analysis

The sample preparation included a liquid–liquid extraction step, performed by adding ACN 200 μL to the plasma sample in a 1:1 volume ratio to precipitate plasma proteins. The choice of ACN, instead of using other solvents (i.e., methanol), was dependent on both the better deproteinization obtained with ACN and its presence in the mobile phase.
The optimal percentage of water and ACN constituting the mobile phase was chosen based on the RT values of analytes, until an excellent separation of peaks was obtained in the shortest chromatographic run (15 min). Indeed, the initial percentage of ACN (60%) was increased up to 90% (Figure 2), when peaks of interest were approximately 2 min apart from each other. The RT values were 7.0, 9.4 and 12.7 min for DDD, DDE and aldrin, respectively. Moreover, an ACN percentage of 90% ensured a faster elution of analytes than other mobile phases evaluated, so that the total run length was 15 min. These characteristics allowed a good separation of peaks among themselves from the wavefront, while ensuring an optimum turnaround time (TAT) [16].
Representative sample chromatograms extracted from human plasma samples are shown in Figure 3. Of note, the analysis of blank samples showed no interfering peaks at RT values of the analytes. Moreover, the average recovery from plasma samples was >95% for all analytes.

3.2. Carryover

The carryover effects of mitotane (DDD) and DDE were tested by analyzing the chromatograms of extracted blank plasma samples, injected after quality control samples containing mitotane at 20 mg/L and DDE at 1.00 mg/L of DDE. No carryover effects were detected.

3.3. Validation Studies

Validation parameters are reported in Table 1, Table 2 and Table 3. Analysis of the present findings demonstrated that the method completely fulfilled the requirements of the FDA 2018 analytical parameters guideline [23,24].
In particular, the method was proven to be linear in the full range of expected concentrations for DDD (0.5, 1.0, 5.0, 25.0, 50.0 mg/L, r2 = 0.9988) and DDE (0.10, 0.20, 0.40, 1.00, 5.00 mg/L, r2 = 0.9964) in plasma samples. For aldrin, the linearity was obtained in the range of 5.0–100.0 mg/L (5.0, 10.0, 25.0, 50.0, 100.0 mg/L, r2 = 0.9956), ensuring a wide range of choices for the final concentration of IS in samples. The intra- and inter-day variability values were <12% and <15%, respectively, for the three analytes at three different concentrations: 0.5, 5.0 and 50.0 mg/L for DDD, 0.10, 0.40 and 1.00 mg/L for DDE and 50.00, 100.00, 200.00 for aldrin. The LOQ and LOD values were 0.310 and 0.102 mg/L for mitotane (DDD), 0.036 and 0.108 mg/L for DDE, respectively. The average IS response in samples was +2.27%, compared to the average IS response of calibrators.
Accuracy and precision values were within the acceptable range of variability (±15%) for nominal concentrations at 0.5, 5.0, 50.0 mg/L for DDD and 0.10, 0.40, 1.00 for DDE, and within ±20% at LOQ, as per FDA guidelines. The Robustness test (F Fisher test) on robustness did not report differences between inter- and intra-day measured three level concentrations, with p-value >>> 0.05 for DDE and mitotane (DDD).
Finally, the LOD value and calibration range were acceptable based on the TDM routine and therapeutic range.

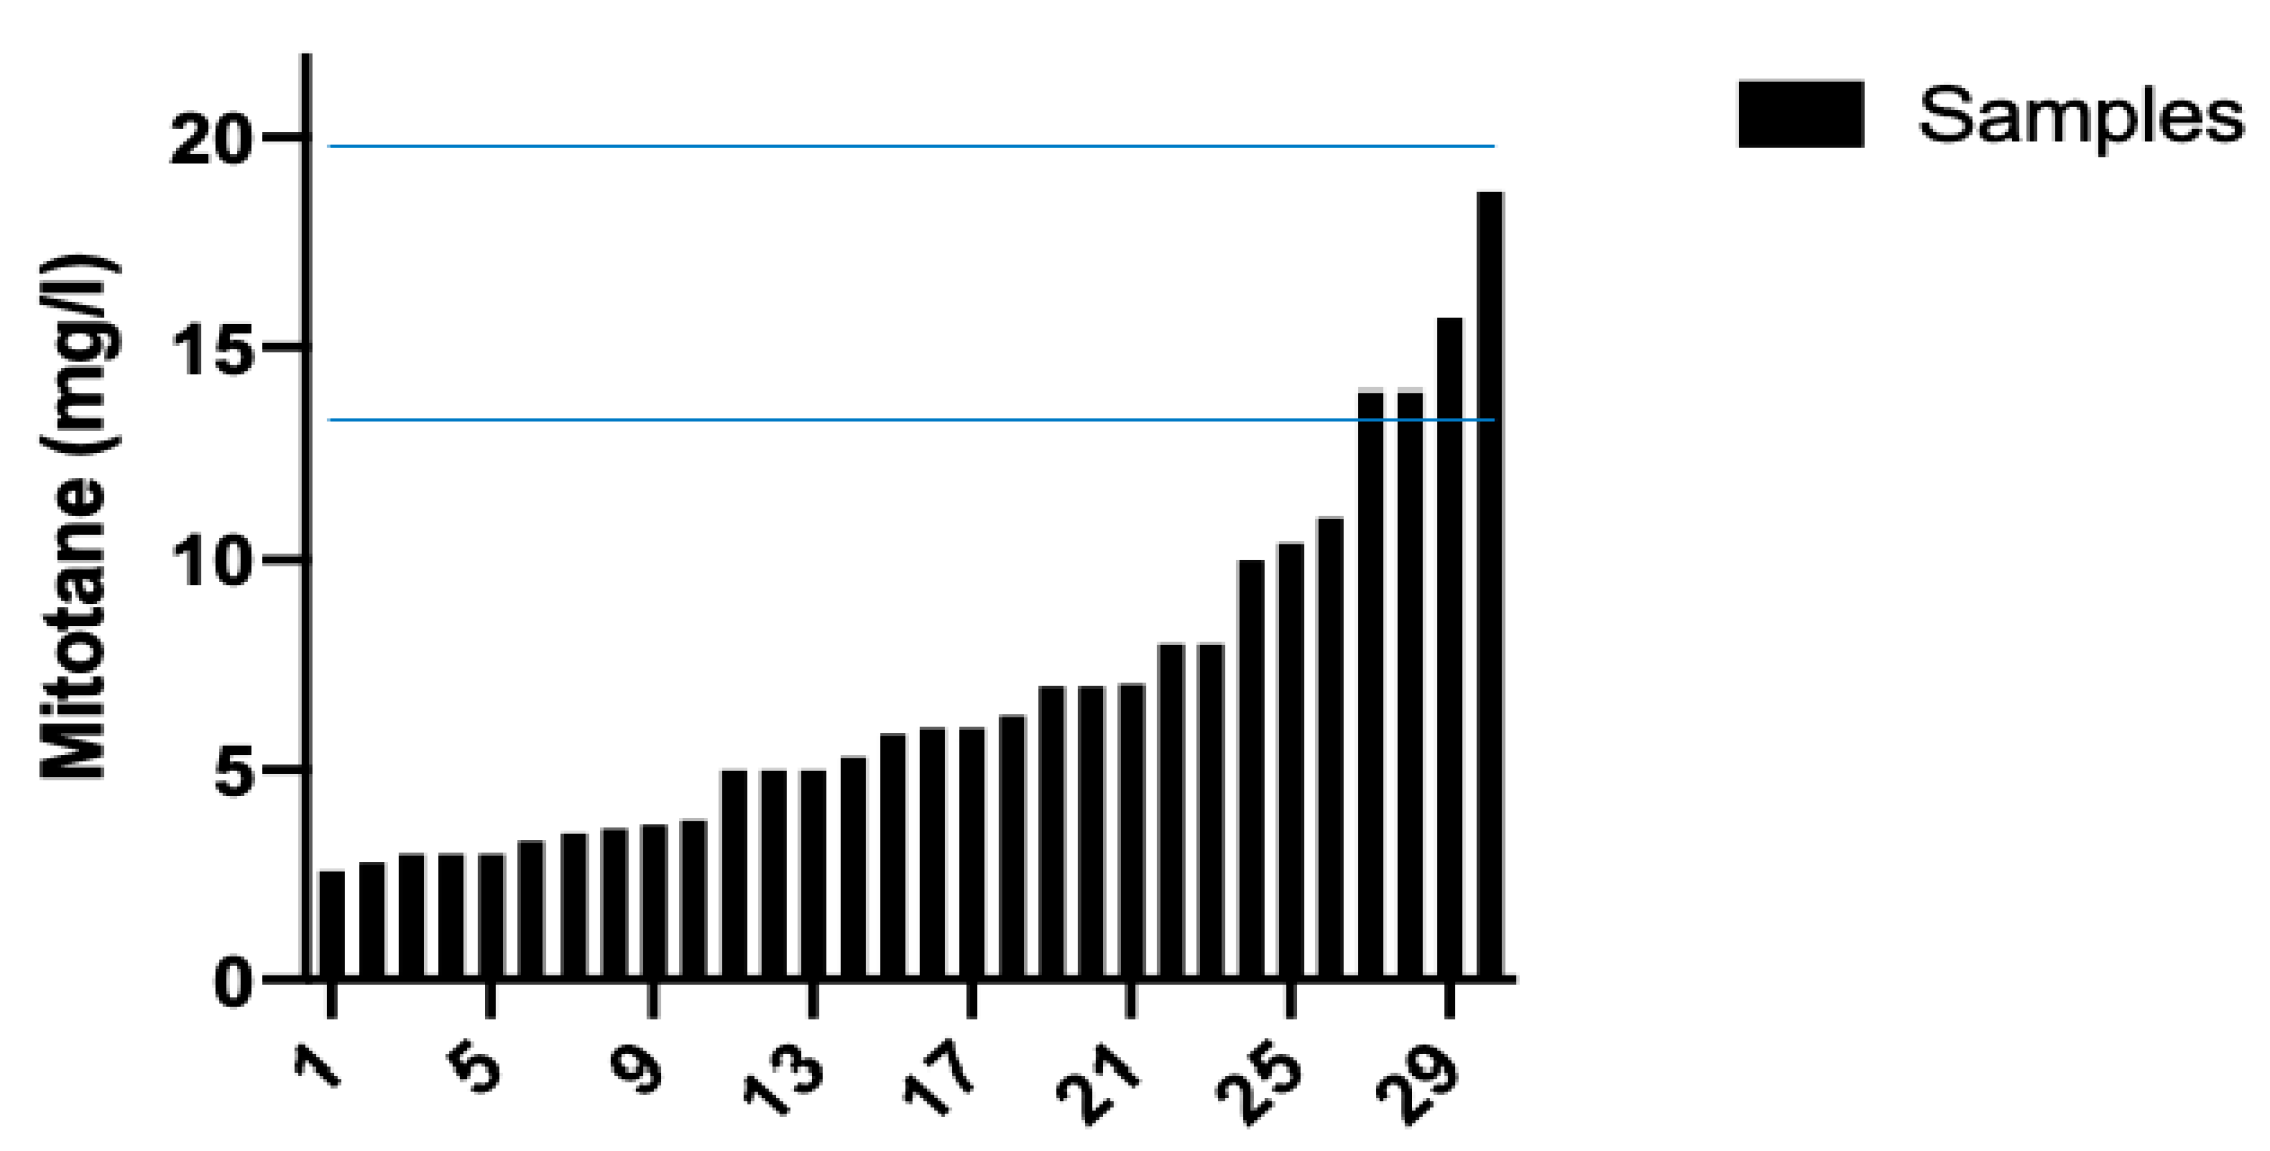
3.4. Analysis of Anonymous Samples

The review of 30 chromatograms obtained during the routine TDM protocol for DDD, and the corresponding calibration standards and QC, resulted in an easy identification of peaks of interest, without interfering peaks. Figure 4 shows the waterfall plot of DDD plasma concentrations. Notably, many samples had DDD plasma concentrations below the therapeutic range.
Most importantly, when the DDD concentration values were plotted against DDE values, a significant correlation was observed (p < 0.0001, r2 = 0.4712; Figure 5).
Moreover, the review of calibration standards for each of the nine (three a week, for three weeks consecutively) analytical sessions resulted in r2 values of 0.9986 ± 0.0010 and 0.9845 ± 0.0056 for DDD and DDE, respectively.

4. Discussion

The presented manuscript describes the development and validation of a simple, reliable HPLC-UV method for DDD and DDE measurement of plasma concentrations by rapid sample preparation and using an isocratic chromatographic run. These characteristics led to the successful adoption of the method to routinely monitor DDD and DDE plasma concentrations in AC patients.
The importance of DDD monitoring depends on several pharmacokinetic and pharmacodynamic aspects. First, among antineoplastic drugs, DDD has a recognized therapeutic range for its plasma concentrations. Therefore, the oncologist may adapt individual doses until the plasma concentrations are within the therapeutic range. However, the drug has a long terminal half-life (approximately 18–159 days) that significantly influences the time needed to achieve therapeutic plasma concentrations. This means that every change will generate steady-state plasma concentrations after weeks. It is worth noting that the earlier the patient obtains the therapeutic plasma concentrations, the better the therapeutic outcome will be. Indeed, a recent study has demonstrated increased survival among AC patients who achieved therapeutic plasma concentrations in the first 17 months of treatment [24]. Third, standard doses may expose the patients to the risk of toxicities, which will require an adjustment of the daily dose [25]. The toxicities may depend on the individual variability of DDD pharmacokinetics; concomitant therapies, changes in body weight, and alterations of liver and kidney functions raise the risk of a reduced benefit from DDD and possibly increase the risk of toxicities. Whatever the reason could be, a TDM protocol can help to define the most appropriate dose for a single patient.
In this context, the present chromatographic method appears to be suitable to monitor DDD plasma concentrations, as demonstrated by the revised anonymous chromatograms.
DDD metabolites are an interesting point of discussion because DDE has a residual anticancer activity [26]. On the contrary, DDA has a faster clearance and excretion rate than DDE, which suggests that DDA has lower toxic potential than DDE [27]. Therefore, DDE was a possible determinant of DDD activity, despite a therapeutic range for the DDE not being available (as with many active metabolites). Moreover, the review of chromatograms showed a significant linear correlation between DDD and DDE, and this fact suggested that the evaluation of DDD plasma concentrations could be enough to guide eventual dose adjustment. Further studies are needed to confirm or exclude the measurement of DDE from TDM protocols. In some cases, the therapeutic range is the sum of plasma concentrations of drugs and their corresponding metabolites [28].
From a technical view, the development of an isocratic HPLC method with UV detection for DDD TDM has some advantages, among which is the lower cost of the instrument and reagents than those of the mass spectrometry platform. Finally, the successful validation according to FDA guidelines confirms the reliability and robustness of the method.

5. Conclusions

In conclusion, we developed and validated a reliable and rapid HPLC-UV method to measure DDD and DDE in plasma samples over the range of drug concentrations expected at standard doses. The method includes aldrin as the internal standard for better accuracy and precision. Moreover, the simple preanalytical preparation of samples and the reduced costs of the HPLC platform may ensure a wide diffusion of the present method.

Author Contributions

G.L.: Writing, Editing, Data Curation, Validation, Methodology. F.C.: Data Curation. L.C.: Resources and visualization. F.M.: Visualization and Reviewing. M.L.: Resources and visualization. R.D.: Supervision. A.D.P.: Writing, Reviewing, Editing. All authors have read and agreed to the published version of the manuscript.

Funding

This research received no external funding.

Institutional Review Board Statement

The study did not require ethical approval.

Informed Consent Statement

The study did not require Informed Consent Statement.

Data Availability Statement

All Data is contained within the article.

Conflicts of Interest

The authors declare no conflict of interest.

References

  1. Fassnacht, M.; Allolio, B. Clinical management of adrenocortical carcinoma. Best Pract. Res. Clin. Endocrinol. Metab. 2009, 23, 273–289. [Google Scholar] [CrossRef]
  2. Terzolo, M.; Angeli, A.; Fassnacht, M.; Daffara, F.; Tauchmanova, L.; Conton, P.A.; Berruti, A. Adjuvant Mitotane Treatment for Adrenocortical Carcinoma. N. Engl. J. Med. 2007, 356, 2372–2380. [Google Scholar] [CrossRef] [Green Version]
  3. Fassnacht, M.; Terzolo, M.; Allolio, B.; Baudin, E.; Haak, H.; Berruti, A.; Skogseid, B. Combination Chemotherapy in Advanced Adrenocortical Carcinoma. N. Engl. J. Med. 2012, 366, 2189–2197. [Google Scholar] [CrossRef]
  4. Maiter, D.; Bex, M.; Vroonen, L.; T’Sjoen, G.; Gil, T.; Banh, C.; Chadarevian, R. Efficacy and safety of mitotane in the treatment of adrenocortical carcinoma: A retrospective study in 34 Belgian patients. Ann. Endocrinol. 2016, 77, 578–585. [Google Scholar] [CrossRef] [PubMed]
  5. Terzolo, M.; Zaggia, B.; Allasino, B.; De Francia, S. Practical treatment using mitotane for adrenocortical carcinoma. Curr. Opin. Endocrinol. Diabetes Obes. 2014, 21, 159–165. [Google Scholar] [CrossRef] [PubMed]
  6. Germano, A.; Rapa, I.; Volante, M.; De Francia, S.; Migliore, C.; Berruti, A.; Terzolo, M. RRM1 modulates mitotane activity in adrenal cancer cells interfering with its metabolization. Mol. Cell. Endocrinol. 2015, 401, 105–110. [Google Scholar] [CrossRef]
  7. Natoli, L.; Luci, G.; Mennillo, E.; Adeogun, A.O.; Arukwe, A. Assessing the effects of Awba dam sediment (Nigeria) on the steroidogenesis of H295R cells using different extraction methods. Sci. Total Environ. 2019, 650, 121–131. [Google Scholar] [CrossRef] [PubMed]
  8. Available online: https://www.ema.europa.eu/en/documents/product-information/lysodren-epar-product-information_en.pdf (accessed on 8 May 2021).
  9. Baudin, E.; Pellegriti, G.; Bonnay, M.; Penfornis, A.; Laplanche, A.; Vassal, G.; Schlumberger, M. Impact of monitoring plasma 1,1-dichlorodiphenildichloroethane (o, p′DDD) levels on the treatment of patients with adrenocortical carcinoma. Cancer 2001, 92, 1385–1392. [Google Scholar] [CrossRef]
  10. Kerkhofs, T.M.A.; Derijks, L.J.J.; Ettaieb, M.H.T.; Eekhoff, E.M.W.; Neef, C.; Gelderblom, H.; Haak, H.R. Short-term variation in plasma mitotane levels confirms the importance of trough level monitoring. Eur. J. Endocrinol. 2014, 171, 677–683. [Google Scholar] [CrossRef] [Green Version]
  11. Inouye, M.; Mio, T.; Sumino, K. Use of GC/MS/SIM for rapid determination of plasma levels of o, p′-DDD, o, p′-DDE and o, p′-DDA. Clin. Chim. Acta 1987, 170, 305–314. [Google Scholar] [CrossRef]
  12. Benecke, R.; Vetter, B.; De Zeeuw, R.A. Rapid micromethod for the analysis of mitotane and its metabolite in plasma by gas chromatography with electron-capture detection. J. Chromatogr. B Biomed. Sci. Appl. 1987, 417, 287–294. [Google Scholar] [CrossRef]
  13. Espb, V.; Musial, P.; Freeman, C.J.; Sinsheimer, J.E.; Arbor, A.; Cliffs, E. Mitotane (o.p’-DDD) emulsion and tablet analysis by high-perform- ance liquid chromatography. J. Chromatogr. 1985, 319, 6–9. [Google Scholar]
  14. Di Paolo, A.; Arrigoni, E.; Luci, G.; Cucchiara, F.; Danesi, R.; Galimberti, S. Precision medicine in lymphoma by innovative instrumental platforms. Front Oncol. 2019, 9, 1–12. [Google Scholar] [CrossRef] [PubMed]
  15. Di Paolo, A.; Luci, G. Personalized Medicine of Monoclonal Antibodies in Inflammatory Bowel Disease: Pharmacogenetics, Therapeutic Drug Monitoring, and Beyond. Front Pharmacol. 2021, 11, 1–15. [Google Scholar] [CrossRef]
  16. Sarli, V.; Ciofi, L.; Lastella, M.; Muscatello, B.; Pisaturo, F.; Paolilli, O.; Luci, G.; Cucchiara, F.; Pellegrini, G.; Bocci, G.; et al. Appropriateness of repetitive therapeutic drug monitoring and laboratory turnaround time. Clin. Chem. Lab. Med. 2019, 57, 14–16. [Google Scholar] [CrossRef]
  17. Mornar, A.; Sertić, M.; Turk, N.; Nigović, B.; Koršić, M. Simultaneous analysis of mitotane and its main metabolites in human blood and urine samples by SPE-HPLC technique. Biomed. Chromatogr. 2012, 26, 1308–1314. [Google Scholar] [CrossRef]
  18. Luci, G.; Cucchiara, F.; Ciofi, L.; Lastella, M.; Danesi, R.; Di, A. A new validated HPLC-UV method for therapeutic monitoring of daptomycin in comparison with reference mass spectrometry. J. Pharm. Biomed. Anal. 2020, 182, 113132. [Google Scholar] [CrossRef]
  19. Luci, G. A rapid HPLC-FLD method for Ochratoxin A detection in pig muscle, kidney, liver by using enzymatic digestion with MISPE extraction. MethodsX 2020, 7, 100873. [Google Scholar] [CrossRef]
  20. Luci, G.; Intorre, L.; Ferruzzi, G.; Mani, D.; Giuliotti, L.; Pretti, C.; Tognetti, R.; Bertini, S.; Meucci, V. Determination of ochratoxin A in tissues of wild boar (Sus scrofa L.) by enzymatic digestion (ED) coupled to high-performance liquid chromatography with a fluorescence detector (HPLC-FLD). Mycotoxin Res. 2018. [Google Scholar] [CrossRef] [PubMed]
  21. Hauser, R.; Chen, Z.; Pothier, L.; Ryan, L.; Altshul, L. The relationship between human semen parameters and environmental exposure to polychlorinated biphenyls and p,p′-DDE. Environ. Health Perspect. 2003, 111, 1505–1511. [Google Scholar] [CrossRef] [Green Version]
  22. Toscani, T.; Moseriti, A.; Dossena, A.; Dall’Asta, C.; Simoncini, N.; Virgili, R. Determination of ochratoxin A in dry-cured meat products by a HPLC-FLD quantitative method. J. Chromatogr. B Anal. Technol. Biomed. Life Sci. 2007, 855, 242–248. [Google Scholar] [CrossRef]
  23. U.S. Department of Health and Human Services Food and Drug Administration. Bioanalytical Method Validation Guidance for Industry; U.S. Department of Health and Human Services Food and Drug Administration: Silver Spring, MD, USA, 2018; pp. 1–44.
  24. Puglisi, S.; Calabrese, A.; Basile, V.; Ceccato, F.; Scaroni, C.; Simeoli, C.; Terzolo, M. Mitotane Concentrations Influence the Risk of Recurrence in Adrenocortical Carcinoma Patients on Adjuvant Treatment. J. Clin. Med. 2019, 8, 1850. [Google Scholar] [CrossRef] [PubMed] [Green Version]
  25. Di Paolo, A.; Ciofi, L.; Bacca, A.; Bernini, G. A case report of a TDM-guided optimization of mitotane for a safe and effective long-term treatment. J. Chemother. 2019, 31, 105–108. [Google Scholar] [CrossRef]
  26. Kelce, W.R.; Stone, C.R.; Laws, S.C.; Gray, L.E.; Kemppainent, J.A.; Wilsonti, E.M. Persistent DDT metabolite p,p′-DDE is a potent androgen receptor antagonist. Nature 1995, 4, 1054–1057. [Google Scholar] [CrossRef] [PubMed]
  27. Corso, C.R.; Acco, A.; Bach, C.; Bonatto, S.J.R.; de Figueiredo, B.C.; de Souza, L.M. Pharmacological profile and effects of mitotane in adrenocortical carcinoma. Br. J. Clin. Pharmacol. 2020. [Google Scholar] [CrossRef]
  28. Gründer, G.; Hiemke, C.; Paulzen, M.; Veselinovic, T.; Vernaleken, I. Therapeutic plasma concentrations of antidepressants and antipsychotics: Lessons from PET imaging. Pharmacopsychiatry 2011, 44, 236–248. [Google Scholar] [CrossRef] [PubMed]
Figure 1. Mitotane metabolism.
Separations 08 00063 g001
Figure 2. Analytes retention times. Changes in retention time of analytes (mitotane or DDD, DDE and aldrin) at different percentages of ACN and water HPLC grade. Flow of 1 mL/min. The temperature of column oven was set at 35 °C.
Separations 08 00063 g002
Figure 3. Representative chromatograms. Peaks of DDD (20 mg/L; 7.055 min), DDE (1 mg/L; 9.420 min) and aldrin (100 mg/L; 12.676 min) are identified in a plasma sample spiked with the analytes (panels A and B). Blank plasma sample (panel C), chromatogram of a plasma sample spiked with IS (100 mg/L) (panel D). Retention Time in minutes.
Separations 08 00063 g003
Figure 4. Mitotane (DDD) plasma concentrations. Therapeutic range of DDD (14–20 mg/L) was reached in 4 out of 30 samples.
Separations 08 00063 g004
Figure 5. Linear correlation between mitotane (DDD) and DDE plasma levels in 30 anonymous samples (r2 = 0.4712 e p < 0.0001). Parameters of the regression line: slope 0.04516, X-intercept 2.534, Y-intercept 0.1145. Continuous and dashed lines are regression line and 95% confidence intervals, respectively.
Separations 08 00063 g005
Table 1. Inter-day parameters. Theoretical and measured concentration of mitotane (DDD) in optimized conditions.
DAYMitotane (DDD) Concentration (mg/L)Accuracy
(%)
Precision
(%)
CV
(%)
TheoreticalMeasured
10.500.49 ± 0.02−2.044.086.01
5.04.78 ± 0.19−4.403.972.86
50.050.25 ± 1.860.506.382.45
20.500.53 ± 0.036.006.386.57
5.04.83 ± 0.14−3.402.893.23
50.049.56 ± 2.01−0.884.052.35
30.500.52 ± 0.034.006.525.67
5.04.89 ± 0.19−2.203.883.44
50.048.88 ± 2.33−2.244.762.77
Abbreviation: CV, coefficient of variation.
Table 2. Inter-day parameters. Theoretical and measured concentration of DDE in optimized conditions.
DAYDDE Concentration (mg/L)Accuracy
(%)
Precision
(%)
CV
(%)
TheoreticalMeasured
10.100.11 ± 0.0110.008.339.61
0.400.38 ± 0.03−5.009.374.50
1.000.94 ± 0.04−6.004.252.83
20.100.11 ± 0.0110.007.6910.89
0.400.37 ± 0.03−7.509.674.64
1.000.94 ± 0.05−6.005.312.08
30.100.08 ± 0.0110.007.149.05
0.400.37 ± 0.02−7.506.065.22
1.000.94 ± 0.05−6.005.371.77
Abbreviation: CV, coefficient of variation.
Table 3. Intra-day parameters. Theoretical and measured concentration of DDD and DDE in optimized conditions.
Concentration (mg/L)Acc.
(%)
Prec.
(%)
CV
(%)
LOD
(mg/L)
LOQ
(mg/L)
r2
TheoreticalMeasured
DDD0.500.49 ± 0.023.872.636.380.1020.3100.9988
5.04.78 ± 1.392.580.463.56
50.049.15 ± 1.861.160.112.20
DDE0.100.12 ± 0.033.872.636.380.0360.1080.9964
0.400.38 ± 0.102.580.463.56
1.000.98 ± 0.271.160.112.20
Abbreviation: Acc., accuracy; Prec., precision; CV, coefficient of variation; LOD, limit of detection; LOQ, limit of quantitation.
Publisher’s Note: MDPI stays neutral with regard to jurisdictional claims in published maps and institutional affiliations.

