Sex Differences in the Association between Household Income and Children’s Executive Function


1
Department of Family Medicine, Charles R. Drew University of Medicine and Science, Los Angeles, CA 90059, USA
2
Department of Pediatrics, Charles R. Drew University of Medicine and Science, Los Angeles, CA 90059, USA
3
Department of Family Medicine, University of California Los Angeles (UCLA), Los Angeles, CA 90095, USA
4
Department of Health Behaviors and Health Education, University of Michigan, Ann Arbor, MI 48109, USA
*
Author to whom correspondence should be addressed.
Sexes 2020, 1(1), 19-31; https://0-doi-org.brum.beds.ac.uk/10.3390/sexes1010002
Submission received: 11 August 2020
/
Revised: 12 October 2020
/
Accepted: 15 October 2020
/
Published: 19 October 2020
Abstract
:The study aimed to investigate sex differences in the boosting effects of household income on children’s executive function in the US. This is a cross-sectional study using data from Wave 1 of the Adolescent Brain Cognitive Development (ABCD) study. Wave 1 ABCD included 8608 American children between ages 9 and 10 years old. The independent variable was household income. The primary outcome was executive function measured by the stop-signal task. Overall, high household income was associated with higher levels of executive function in the children. Sex showed a statistically significant interaction with household income on children’s executive function, indicating a stronger effect of high household income for female compared to male children. Household income is a more salient determinant of executive function for female compared to male American children. Low-income female children remain at the highest risk regarding poor executive function.
1. Introduction
Among the most salient social determinants of children’s behavioral and developmental outcomes is socioeconomic position (SEP) [1,2,3]. Among various SEP indicators is household income, which is one of the most influential social determinants of children’s outcomes across domains [4,5,6,7]. Families with high-income report higher levels of parental involvement, which boosts a wide range of children’s desired outcomes [8,9,10,11,12].
Household income is a predictor of a wide range of positive children’s behavioral outcomes [4,5,6,7]. Children from high-income families are less likely to experience various types of stress and associated behavioral and health problems [13,14,15]. Income may partially explain some of the existing gaps in children’s behavioral outcomes between marginalized and privileged groups [16,17,18,19]. If income is partially responsible for the existing gaps, then reducing the income gap through income redistribution policies and empowering marginalized groups to secure more income should be regarded as the primary strategy for addressing the social inequalities that we observe between social groups [20,21].
Suppose income has differential effects on the outcomes of various sub-groups. In that case, income may also operate as a source, rather than a solution, of the existing inequalities [22,23]. The marginalization-related diminished returns (MDRs) literature shows that household income and other SEP indicators [24] generate unequal outcomes for racial and ethnic subgroups. As shown by the MDRs [25,26], social marginalization reduces the impact of SEP indicators such as income on generating tangible behavioral outcomes. For example, children who are members of a disadvantaged group show weaker effects of household income and other SEP indicators on children’s behavioral outcomes. The same is shown for race [25,26], ethnicity [24,27,28], sexual orientation [29], nativity [23], place [30], and sex [31,32]. In all these cases, the socially marginalized group shows weaker effects of income and other SEP indicators on behaviors [24]. Any marginalized group may face more difficulties leveraging their resources and working with social systems to secure measurable and desirable behavioral outcomes when SEP indicators such as education are available [26]. For example, marginalized groups gain less from their existing resources.
Some research has shown that SEP indicators may have some sex-specific effects on brain function [33]. Javanbakht et al. (2016) [34] and Kim et al. (2018) [35] found larger effects of household income on the brain function of female children than male children; Whittle and colleagues (2014) [36] and McDermott and colleagues (2019) [37] showed boys to be more sensitive than girls to a variety of environmental inputs. Thus, while sex differences in SEP effects on brain development are likely, the direction of these sex differences may depend on brain structure and function. The literature seems to be mixed on this matter.
Executive function is a set of mental skills that include working memory, flexible thinking, and self-control [38,39]. While memory and flexible thinking reflect other dimensions of executive function, response time, correct go responses to “go signals”, and correct stops to stop signs all reflect a domain of executive function that is associated with motor control, inhibiting, impulsivity, and response time [40,41,42,43,44]. Executive “brake failure” following executive control of response inhibition as well as the fast response to the go signals all reflect aspects of executive function [45,46]. These aspects of executive function can be measured using Stroop task [47], go/no-go [48,49,50], and stop-signal task [45,46]. While trauma reduces executive function [51], high SEP is closely associated with better executive function [38,52]. Executive function may mediate the effect of SEP on school performance and cognitive performance. Similarly, executive function reflects structure and functional aspects of the brain cortex and white matter [44,53,54]. To give examples, executive function is linked to cortical thickness [41,55], cortical function [53], white matter structure and volume [44,53,54], and functional connectivity between various brain regions, and cortex [42].
Aims
In this investigation, we compared male and female children for the effects of household income on children’s executive function. While high household income was expected to be associated with higher executive function, this effect is expected to be more salient for males than females. The male sex was conceptualized as an indicator of social privilege. Stronger effects of SEP indicators for males than females were shown by Whittle and colleagues (2014) [36] and McDermott and colleagues (2019) [37].
2. Materials and Methods
2.1. Design, Setting, and Sampling
This cross-sectional study was a secondary analysis of existing data. We borrowed data from the Adolescent Brain Cognitive Development (ABCD) study [56,57,58,59,60]. The ABCD is a national children’s brain development study with a broad sample, diversified based on race, ethnicity, sex, and SEP [56,61].
Participants were recruited from multiple cities across various states in the US. This sample was enrolled through the US school system. The recruitment catchment area of the ABCD, which was composed of 21 participating sites, encompasses more than 20% of the entire United States population of 9–10-year-old children. The ABCD applied a carefully designed sampling and recruitment process across various sites, described elsewhere [56,57,59,61,62,63,64,65,66,67,68,69,70,71,72,73,74], to ensure that the sample is random and representative. Such local randomization efforts yielded a final overall ABCD sample that is a close approximation of national sociodemographic factors. These sociodemographic factors include race and ethnicity, age, sex, SEP, and urbanicity. The SEP target in the ABCD has two sources: (1) the American Community Survey (ACS) and (2) annual 3rd and 4th-grade school enrollment. A full description of the ABCD sample and sampling is published here [75]. The first is a large-scale survey of approximately 3.5 million households conducted annually by the US Census Bureau. The second data is maintained by the National Center for Education Statistics (NCES), which is affiliated with the US Department of Education.
Analytical Sample
This study included 7920 non-twin 9–10-year-old children who had data on income and executive function. Children from any race or ethnicity were included.
2.2. Measures
2.2.1. Outcome
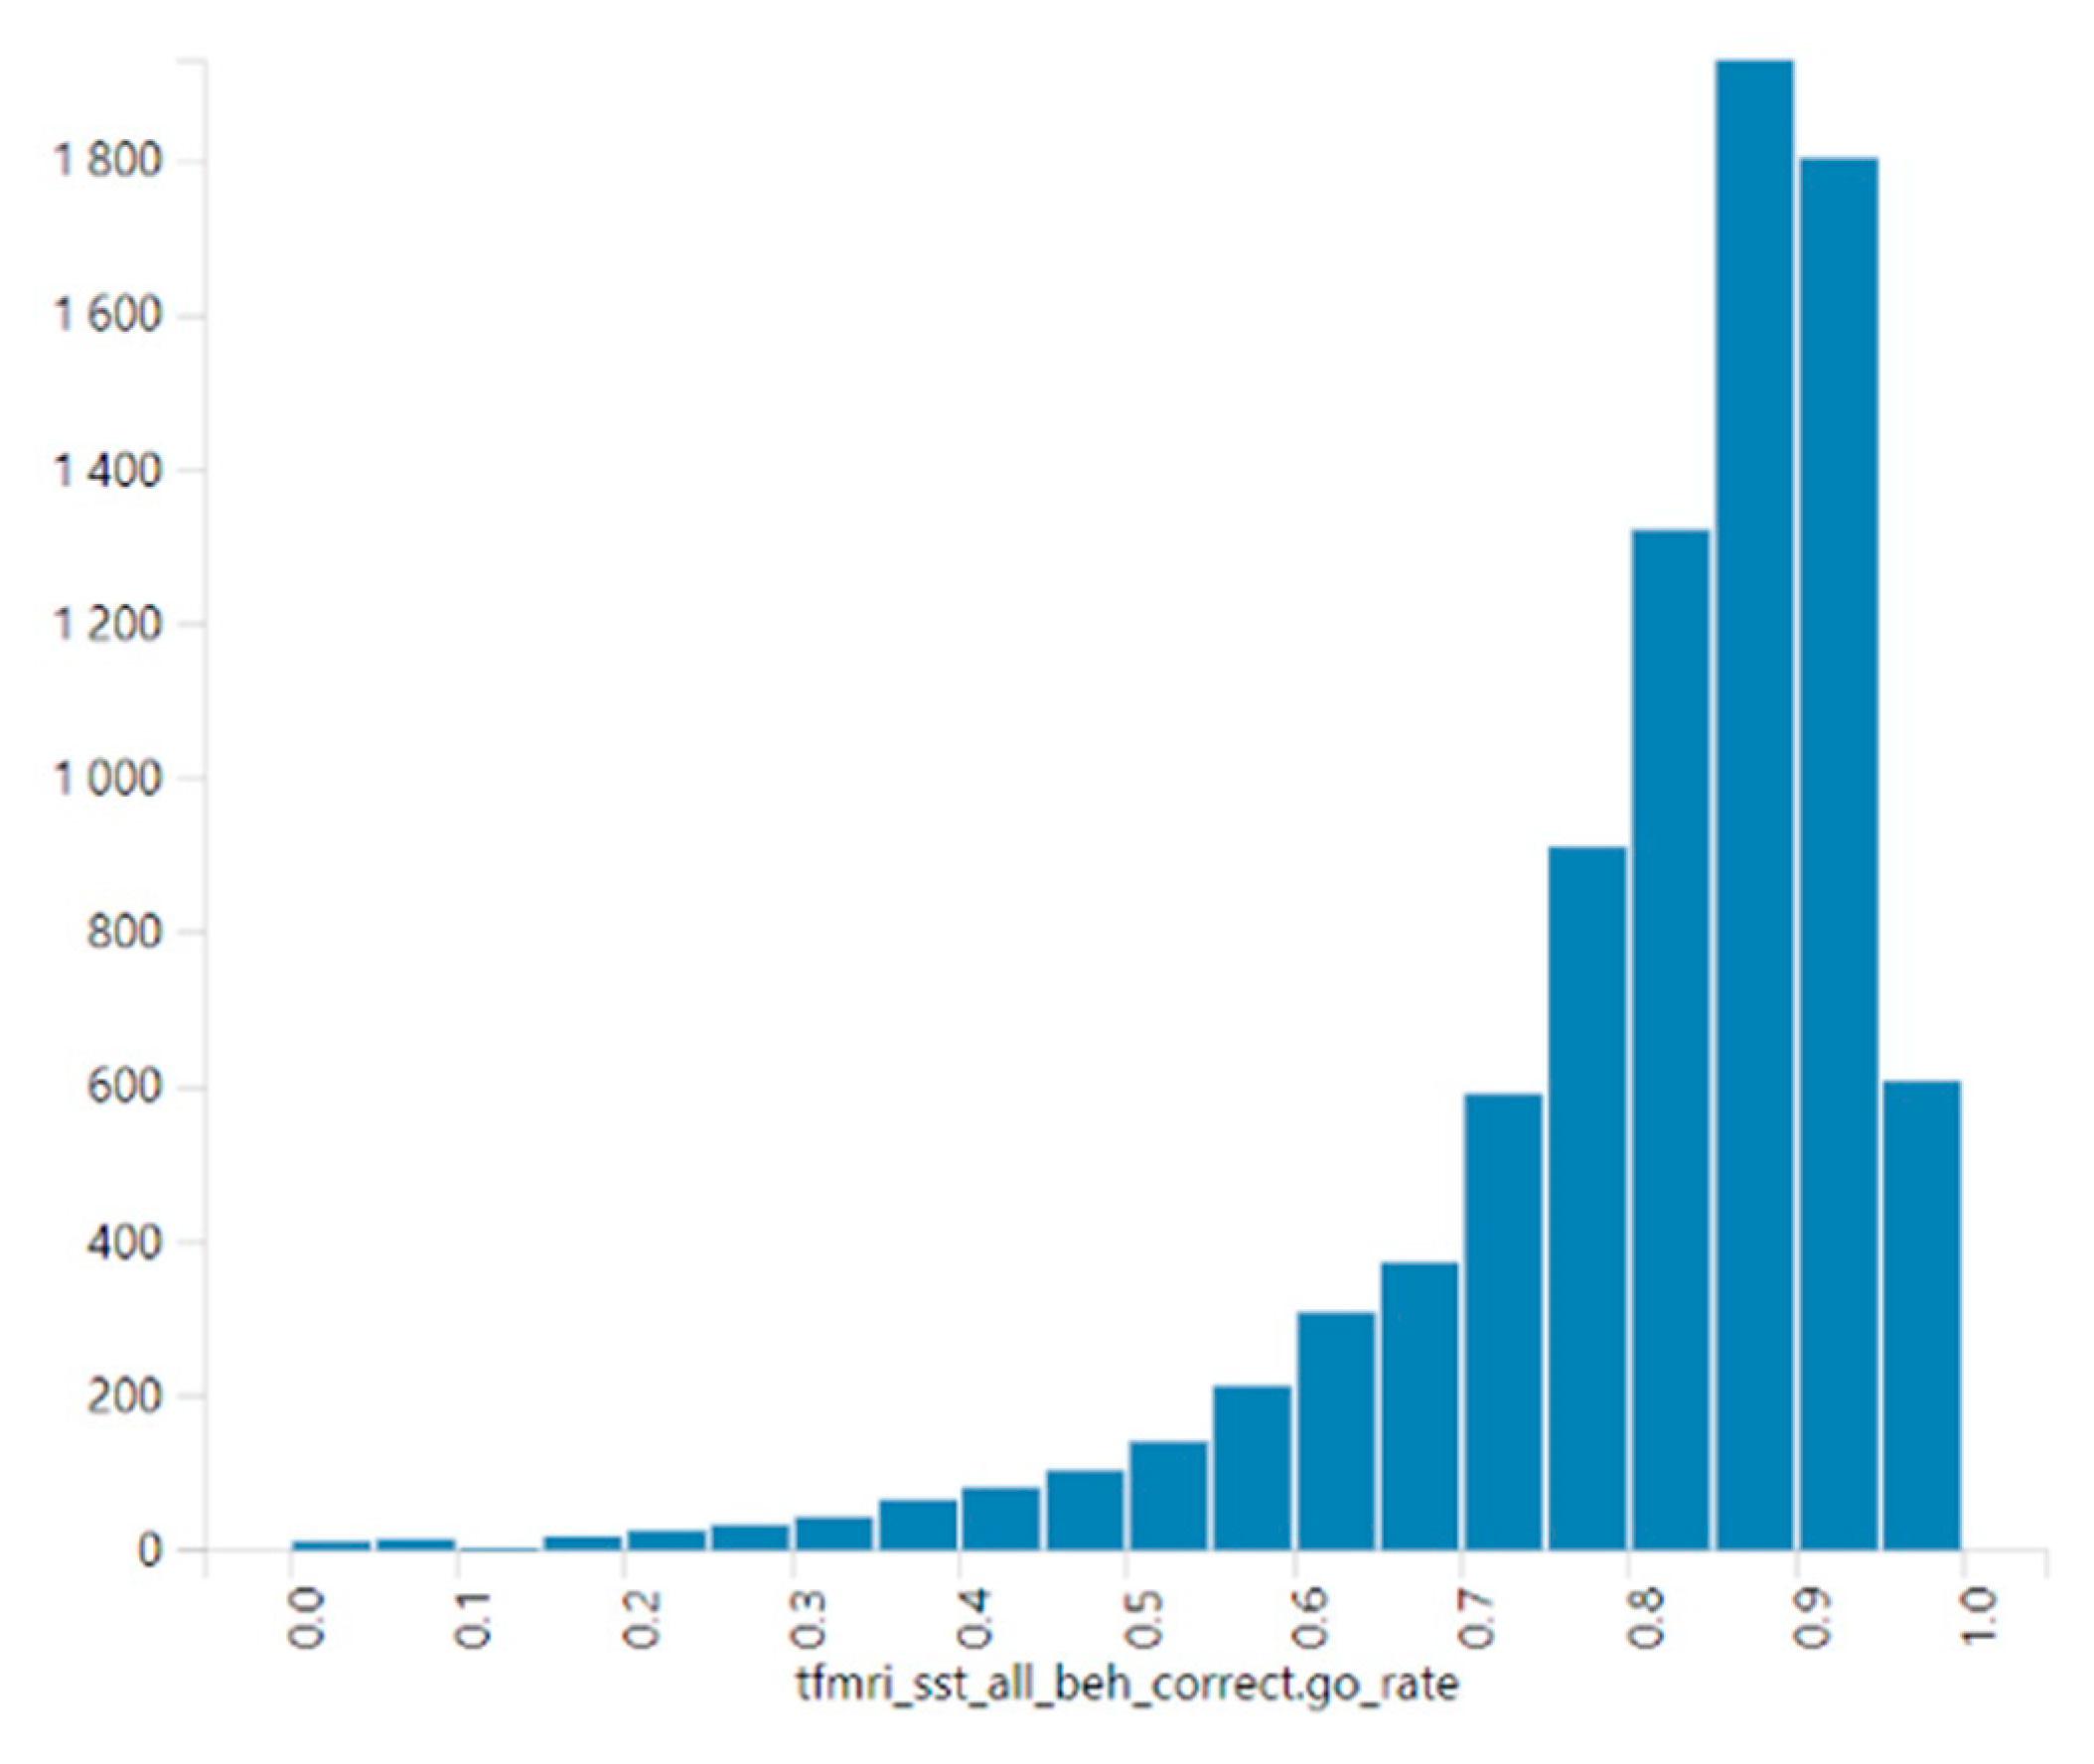
Executive function. This variable was operationalized as rate of correct “go” in the runs (average of run 1 and run 2). This variable is named tfmri_sst_all_beh_correct.go_rate in the DEAP system. Executive function in this study was treated as a continuous measure, with a higher score being an indication of a higher executive function. Figure 1 shows the distribution of the outcome.
2.2.2. Moderator
Sex. Sex, 1 for males and 0 for females, was a dichotomous variable. This variable was the effect modifier.
2.2.3. Independent Variable
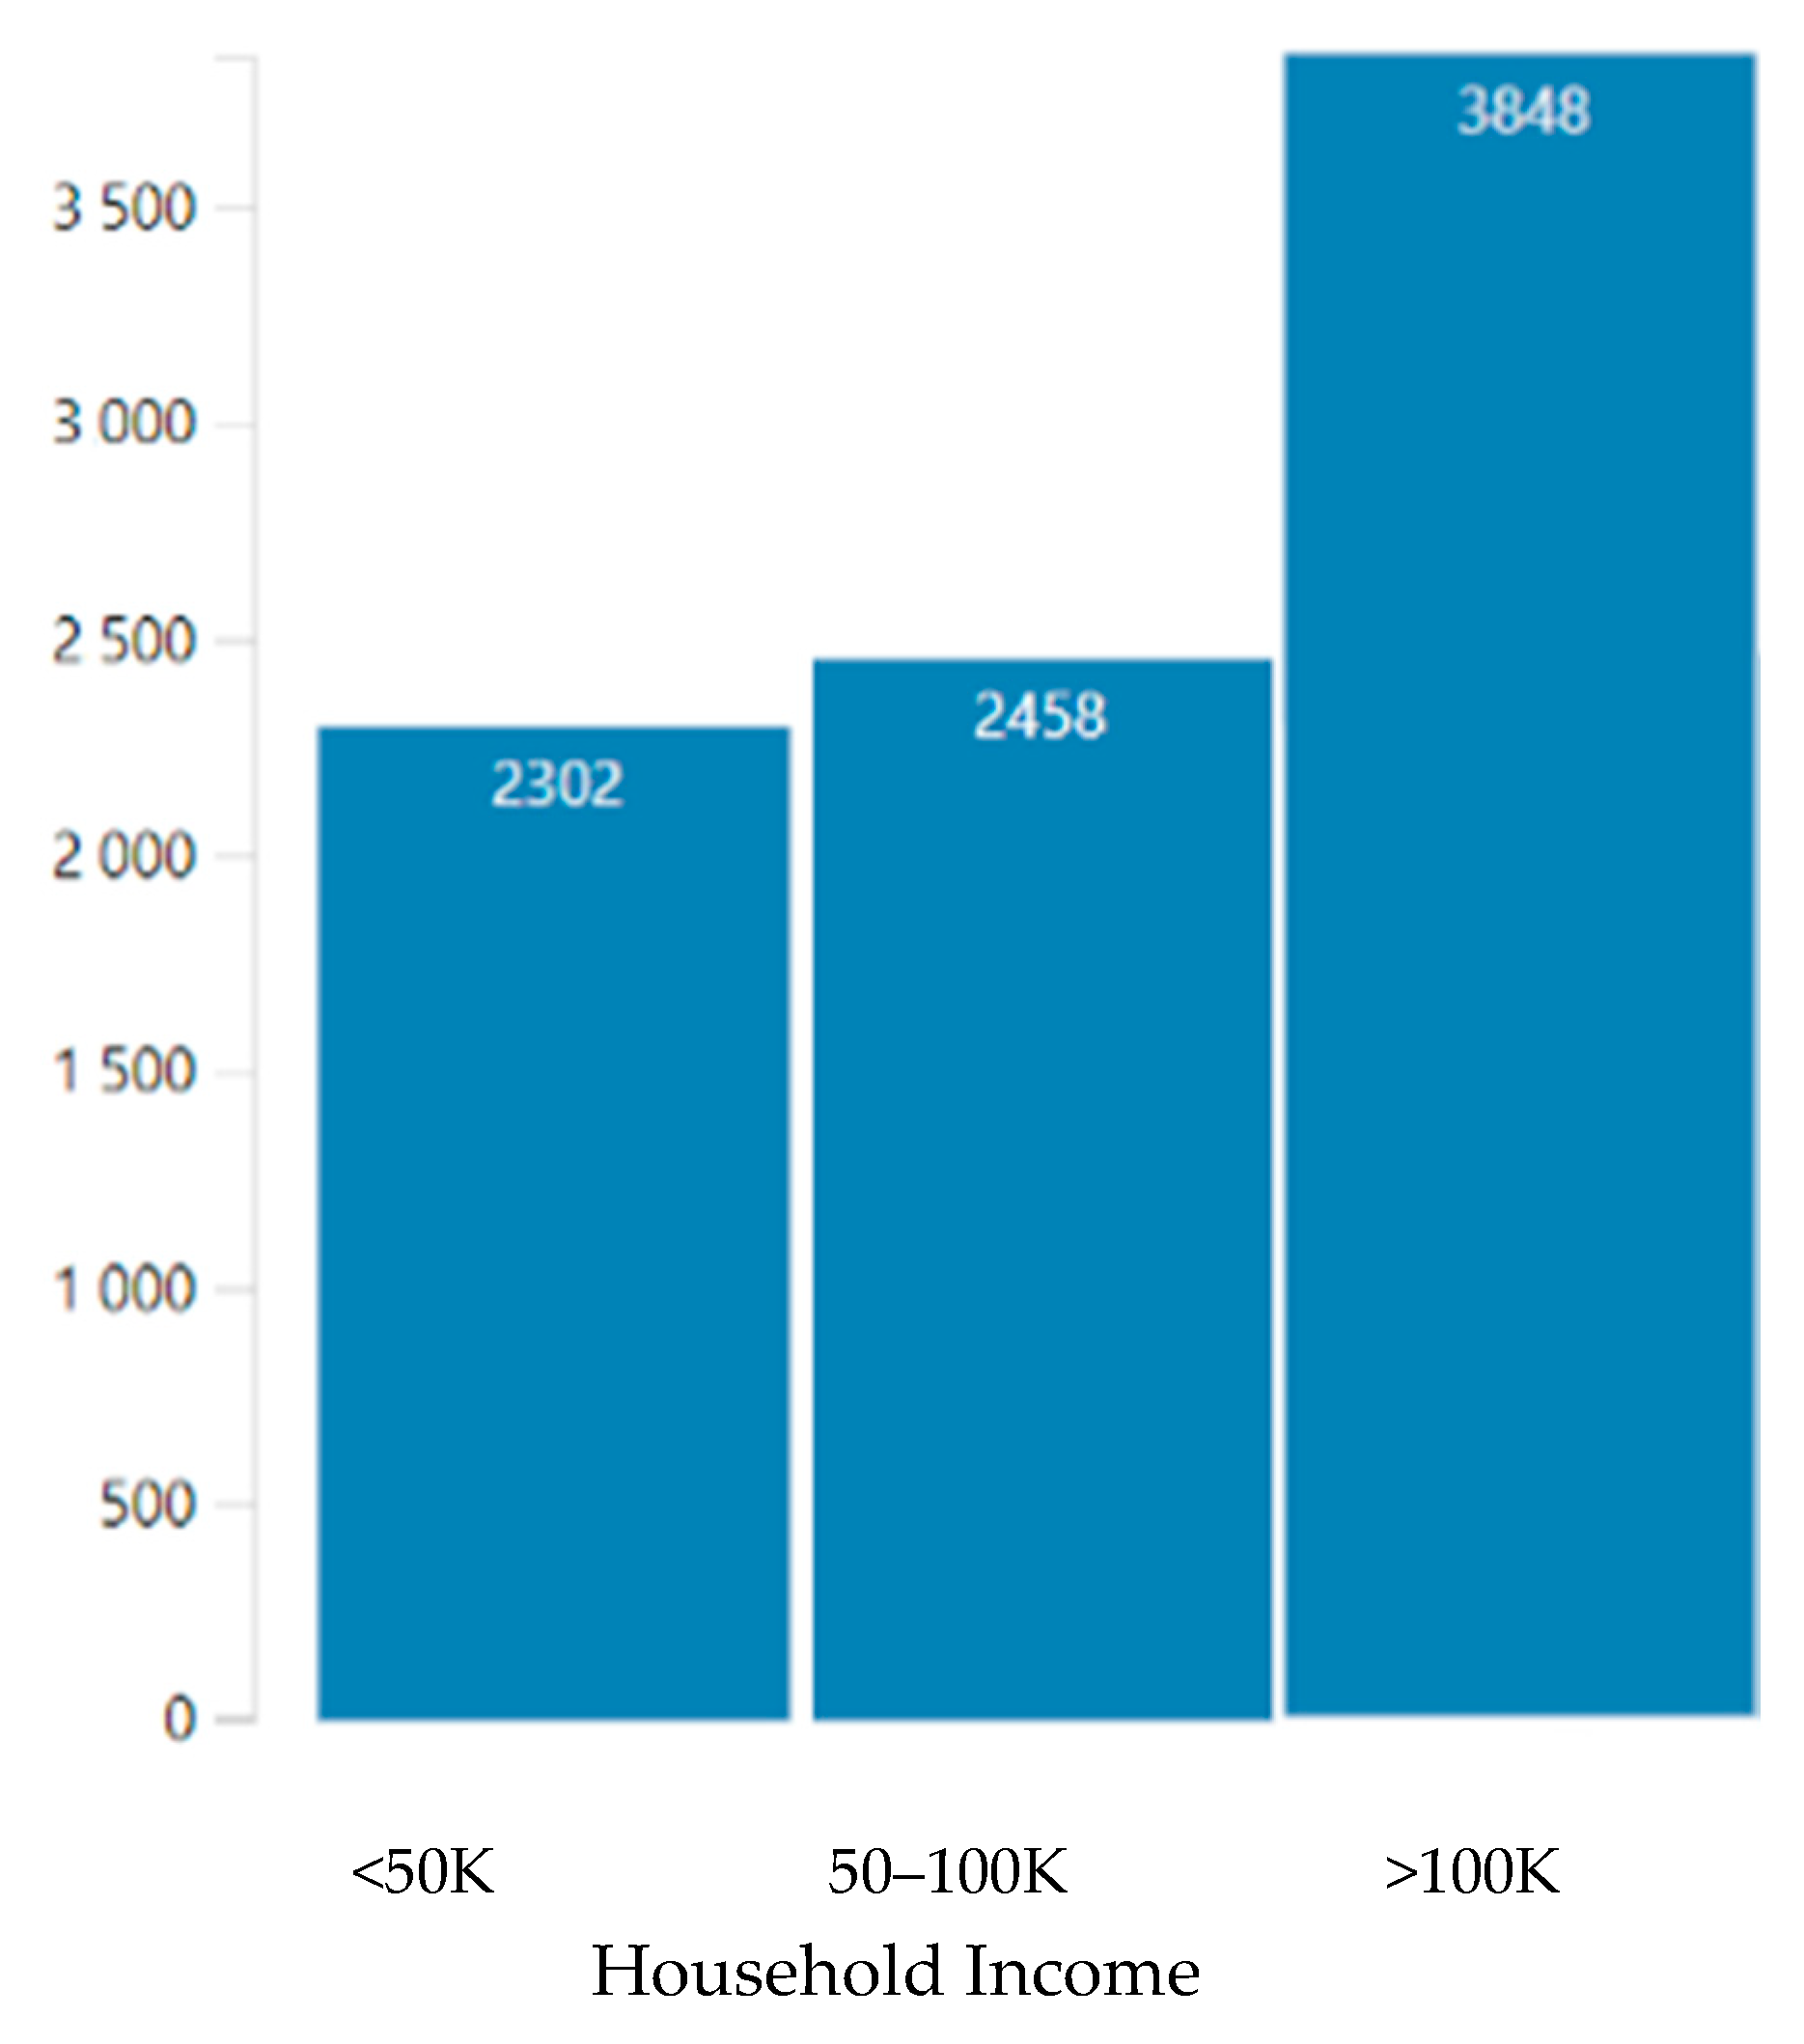
Household income. Household income was a three-level categorical variable. The item used to measure household income was “What is your total combined household income for the past 12 months? This should include income (before taxes and deductions) from all sources, wages, rent from properties, social security, disability and veteran’s benefits, unemployment benefits, workman”. Responses included 1 = less than $50,000; 2 = $50,000 to $99,000; 3 = $100,000 or more. Distribution of our household income variable is shown in Figure 2.
2.2.4. Confounders
Race [76,77], ethnicity [78], age [79], and parental marital status [39] were the confounders. These confounders were selected based on a literature review [38,52].
Race. Race, a self-identified variable, was a categorical variable with the following options: Black, Asian, Other/Mixed Race, and White (reference group). Racial variation in executive function is well described [78].
Ethnicity. Ethnicity was also a self-identified variable and a categorical variable: Hispanics vs. non-Hispanics (reference category). Age was a dichotomous measure with a response of either 9 or 10 (years old). Ethnicity is shown to have an impact on executive function [78].
Age. Parents reported the age of the children. Age is a predictor of executive function [79].
Parental marital status. Marital status of the household was a dichotomous variable: married = 1 and non-married = 0. Family structure and marital status of the parents are shown to predict children’s executive function [39].
2.3. The Stop Signal Task (SST)
The SST is most appropriate for evaluation of core brain regions and networks that are involved in the domains of impulsivity and impulse control. The SST, however, also measures attention, executive function, and memory. These brain functions have major implications in cognitive disorders, ADHD, learning disorders, and addiction effects. These tasks are also well validated in adolescents. The SST measures how well a participant withholds or interrupts a motor response to a “go” signal when he or she unpredictably faces a “stop” signal. The ABCD SST is composed of 2 runs each contain 180 trials. Each trial starts with an instruction that includes the presentation of leftward or rightward pointing arrows. Participants are asked to indicate the direction of the arrows, while responding “as quickly and accurately as they can”. These responses should be using a two-button response panel. A total number of 30 trials (16.67%) are “stops”. More information on the ABCD SST is available elsewhere [57].
2.4. Data Analysis
2.4.1. Main Analysis
To describe our sample, we reported mean (SD) for continuous variables and frequencies and percentages for categorical variables in the pooled sample and by age. We also used Chi square or independent sample t test to compare male and female children for the study variables. Our main analysis applied mixed (random) effect models that allowed adjusting for the nested nature of the data. This analysis was performed in the Data Analysis and Exploration Portal (DEAP), National Data Archive (NDA), National Institutes of Health (NIH). Participants were nested within families who were nested within 21 sites. As such, our models corrected for non-independence of our observations. To conduct mixed effect multivariable analysis, two models were performed. In both of these models, executive function was the outcome, sex was the moderator, household income was the predictor, and covariates (ethnicity, age, and parental marital status) and site ID and family ID were controlled. Both of these mixed effect models were estimated in the overall/pooled sample. Model 1 (no interaction), the main effect model, was estimated in the absence of the household income by sex interaction term. Model 2 (the interaction model) added an interaction term between sex and household income. Appendix A shows the Model 1 and Model 2 in the DEAP system. Regression coefficient (b), SE, and p-values were reported for each model. Graphs reflecting these results were also shown.
2.4.2. Ethical Aspect
For this study, we used a fully de-identified data set. As such, this study was exempt from a full review of the Institutional Review Board (IRB number 1665000-1). However, the protocol of the main study, the ABCD, was approved by the IRB at the University of California, San Diego (UCSD), and several other institutions. Participants signed consent or assent depending on their age [61].
3. Results
Table 1 depicts the summary statistics of the pooled/overall sample. The current analysis was performed on 8608, 9–10-year-old children of whom 51% were male and 49% were female.
Table 2 provides a summary of our two mixed-method regression models that adjusted for the nested nature of the data. Both models were in the overall (pooled) sample. Model 1 (main effect model) showed an effect of household income on executive function. Model 2 (interaction model) showed an interaction term between sex and household income on executive function, suggesting that the effect of household income on executive function was weaker for males than females.
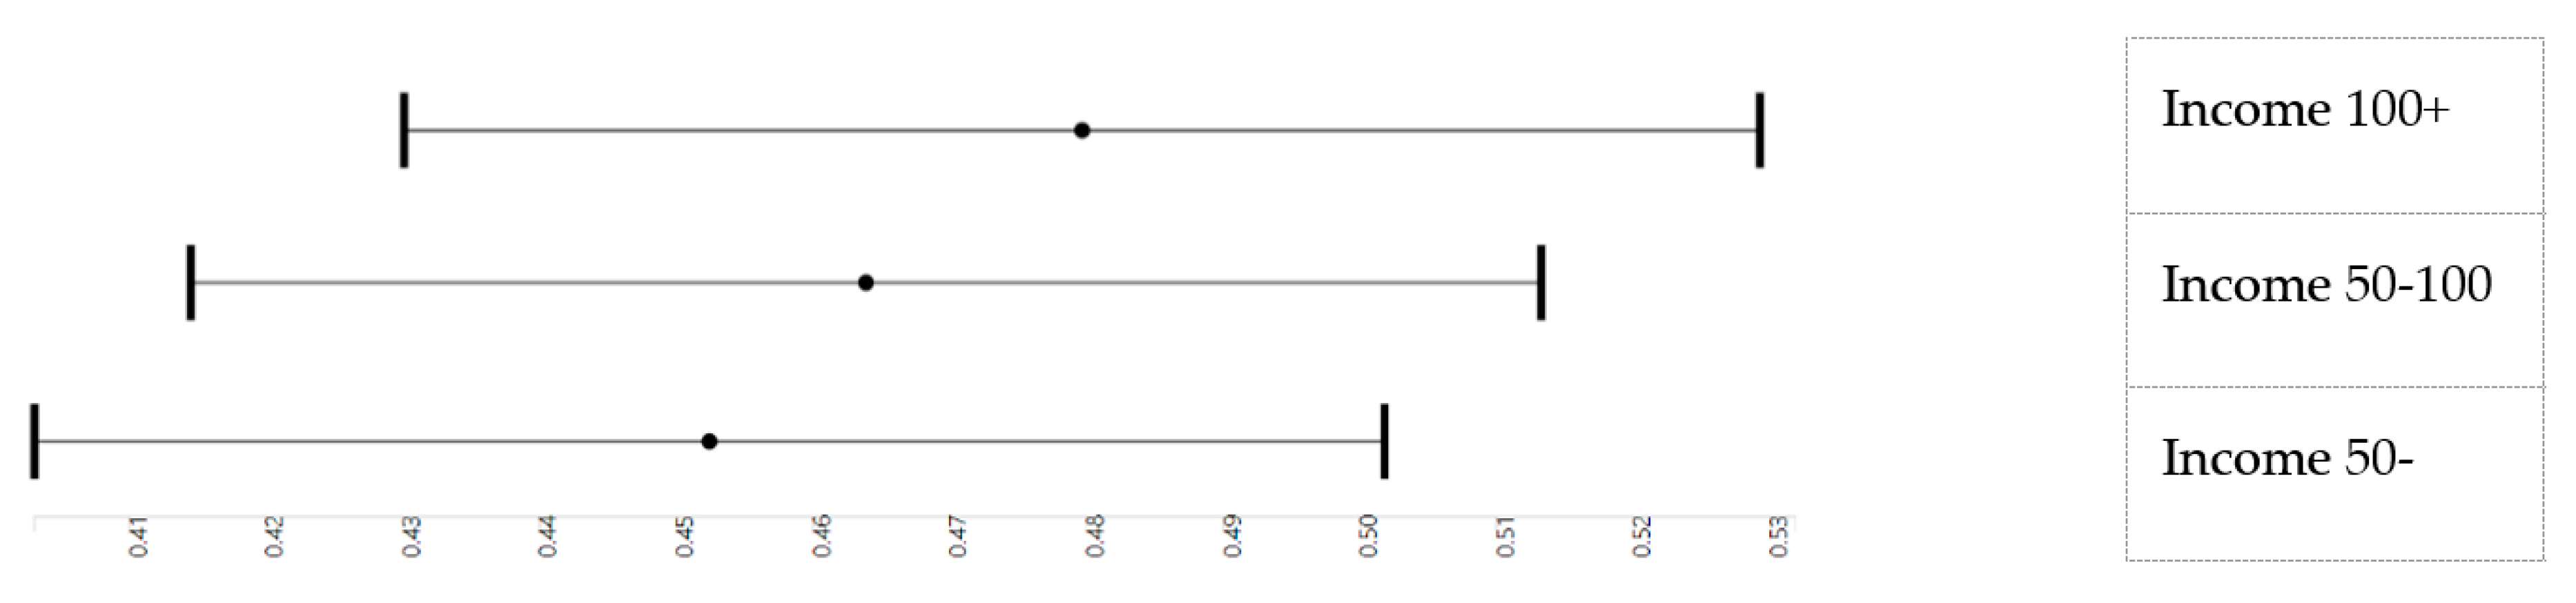
Figure 3 shows an effect of household income on executive function in the pooled sample. As this figure shows, there was a stepwise association between household income and children’s executive function, with children from families with a household income of more than 100,000 USD showing the highest levels of executive function, children from families with a household income between 50,000 and 100,000 showing the second highest executive function, and children from families with a household income less than 50,000 showing the lowest level of executive function.
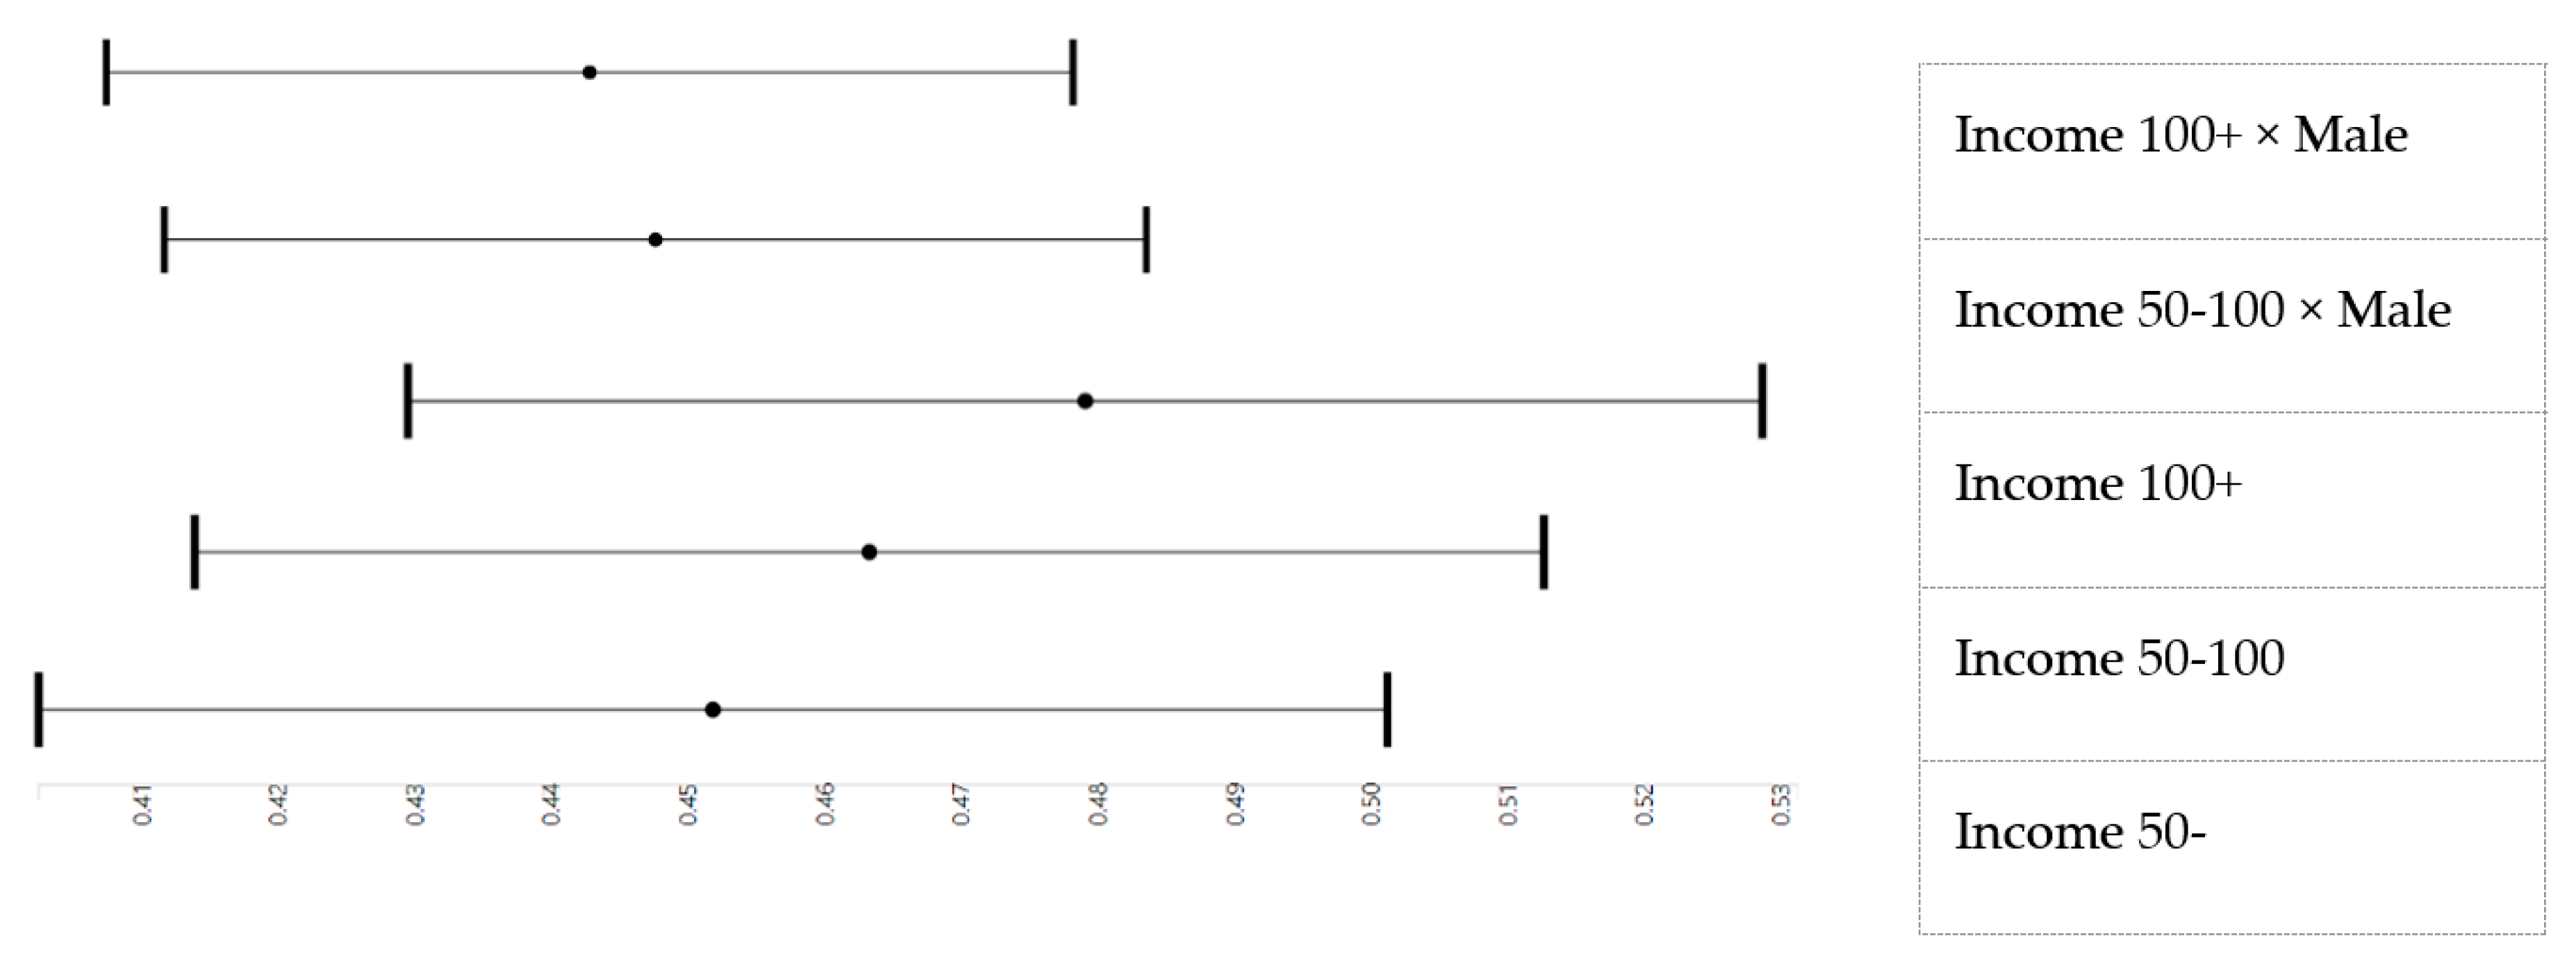
Figure 4 shows an interaction between household income and executive function in the pooled sample. As this figure shows, gain in children’s executive function due to high household income was smaller for male than female children.
4. Discussion
Our findings showed that sex alters the effects of household income on children’s executive function, with stronger effects of household income being observed for female than male American adolescents. Our replication findings also confirmed our primary modeling. These results can be explained via the effects of sex, a biological construct that reflects differential brain development due to sex hormones or genetics, or the effects of gender, a social construct that reflects differential socialization of girls and boys in society.
Sex differences may explain the results. Environmental input, including variation in SEP, may have some sex-specific effects on brain structure and function [33]. A study showed that SEP indicators such as income may have a larger effect on brain structures (e.g., amygdala) of females than males [34]. Another study found that household income was associated with an increase in the structural brain network efficiency of female but not male children aged 6–11 years old [35]. Some other studies have provided the opposite results. Another study documented a stronger effect of SEP on the shape of the cortical surface of males than females [37]. A study showed that positive parenting and caregiving better predict the volumetric growth of the amygdala and the cortical thinning of the right anterior cingulate for boys than girls [36]. Thus, although sex differences may exist in the effects of environment and SEP on brain development, the directions of these sex differences are inconsistent [80].
Gender differences, the difference in the social experiences of males and females, may also explain the findings. Gender differences may be caused by social networks, culture, norms, parents, and friends. It is possible that the impact of parents, teachers, and peers differ across SES levels for boys and girls. Similarly, it is likely that SEP has a larger impact on opportunities and experiences of girls than boys. While boys of high- and low-income families similarly develop, high- and low-income girls experience vastly different effects of parenting, stress, peers, and social risk. How parents socialize or monitor their boys and girls widely varies [81,82,83]. The influence of peers also varies for boys and girls [84]. Finally, males and females use different coping mechanisms [85]. These may all result in gender differences in the effects of SES on daily experiences and exposures that shape brain development and executive function.
Sex and gender differences are neither specific to an age group (children), an SEP indicator (income), or a behavioral outcome (executive function). That means sex and gender differential effects of a wide range of SEP indicators on many outcomes have been documented for children, adults, and older adults. Among adults, many studies have shown stronger health effects of income and other related SEP indicators for males than females [86,87,88,89,90].
4.1. Future Research
We argue that studies on behaviors or development should not merely control for gender/sex. This is particularly true for studies investigating how SEP indicators shape neural, behavioral, and social development of diverse groups of children. Most of the research has traditionally “controlled” for the statistical effect of sex or gender. Researchers should be aware that sex/gender may also alter SEP indicators’ effect on behaviors and brain function and development.
4.2. Future Research
Additional research is needed on parental, social, psychological, and even biological mechanisms that may explain why child gender or sex interfere with SEP indicators such as income on executive function. According to the social reproduction theory, parental SEP may differently impact children’s developmental and behavioral outcomes across social groups [91]. Furthermore, not only sex but the intersection of race, sex, place, and class may shape the outcomes of children in the US [92]. These, however, require further research.
4.3. Methodological Limitations
A limitation of this study is the cross-sectional design. This study only investigated the MDRs of one SEP indicator, namely household income. It is unknown if there are differential marginal returns of other SEP indicators such as wealth, parental education, parental marital status, employment, and even higher-level SEP indicators such as neighborhood SEP. In addition, recall bias may have affected our variable household income, which was self-reported. Marital status, our confounder, also only had two categories of married and unmarried. More nuanced measurements of marital status of the family, and separating never married, partnered, and divorced families could shed more insight on the details of how and when family structure influences children’s brain development. Future research may study peer influences, norms, expectations, parenting, and sex hormones to explain why household income influences male and female children differently.
5. Conclusions
High household income shows a greater influence on the executive function of girls than boys. This means that girls from low-income families would have the poorest executive function. However, boys with high and low incomes do not vary much in their executive function.
Author Contributions
Conceptualization, S.A., S.B., M.B., and C.H.C.; formal analysis, S.A.; writing—original draft preparation, S.A., writing—review and editing, S.A., S.B., M.B., and C.H.C.; supervision, C.H.C.; funding acquisition, M.B.; All authors have read and agreed to the published version of the manuscript.
Funding
Shervin Assari is supported by the grants with the numbers CA201415 02, DA035811-05, U54MD007598, U54MD008149, D084526-03, and U54CA229974 by the National Institutes of Health (NIH).
Acknowledgments
The ABCD Study is supported by the National Institutes of Health and additional federal partners under award numbers U01DA041022, U01DA041028, U01DA041048, U01DA041089, U01DA041106, U01DA041117, U01DA041120, U01DA041134, U01DA041148, U01DA041156, U01DA041174, U24DA041123, U24DA041147, U01DA041093, and U01DA041025. A full list of supporters is available at https://abcdstudy.org/federal-partners.html. A listing of participating sites and a complete listing of the study investigators can be found at https://abcdstudy.org/wp-content/uploads/2019/04/Consortium_Members.pdf. ABCD consortium investigators designed and implemented the study and/or provided data but did not necessarily participate in analysis or writing of this report. This manuscript reflects the views of the authors and may not reflect the opinions or views of the NIH or ABCD consortium investigators. The ABCD data repository grows and changes over time. The current paper used the Curated Annual Release 2.0, also defined in NDA Study 634 (doi:10.15154/1503209).
Conflicts of Interest
The authors declare no conflict of interest.
Appendix A. Model Formula for Our Models
| Variable Names in DEAP | Study Constructs |
| Model 1 | Model 1 |
| tfmri_sst_all_beh_correct.go_rate ~ household.income.bl + race.4level + sex + married.bl + age + hisp | Executive function = household income + race + sex + married + age + Hispanic |
| Random: ~(1|abcd_site/rel_family_id) | Random: Site + Family |
| Model 2 | Model 2 |
| tfmri_sst_all_beh_correct.go_rate ~ household.income.bl + race.4level + sex + married.bl + age + hisp + household.income.bl * sex | Executive function = household income + race + sex + married + age + Hispanic + household income x race |
| Random: ~(1|abcd_site/rel_family_id) | Random: Site + Family |
References
- Valencia, M.L.C.; Tran, B.T.; Lim, M.K.; Choi, K.S.; Oh, J.K. Association Between Socioeconomic Status and Early Initiation of Smoking, Alcohol Drinking, and Sexual Behavior Among Korean Adolescents. Asia Pac. J. Public Health 2019, 31, 443–453. [Google Scholar] [CrossRef] [PubMed]
- Ahmad, A.; Zulaily, N.; Shahril, M.R.; Syed Abdullah, E.F.H.; Ahmed, A. Association between socioeconomic status and obesity among 12-year-old Malaysian adolescents. PLoS ONE 2018, 13, e0200577. [Google Scholar] [CrossRef] [PubMed] [Green Version]
- Merz, E.C.; Tottenham, N.; Noble, K.G. Socioeconomic Status, Amygdala Volume, and Internalizing Symptoms in Children and Adolescents. J. Clin. Child Adolesc. Psychol. 2018, 47, 312–323. [Google Scholar] [CrossRef] [PubMed]
- Alvarado, S.E. The impact of childhood neighborhood disadvantage on adult joblessness and income. Soc. Sci. Res. 2018, 70, 1–17. [Google Scholar] [CrossRef] [PubMed]
- Barreto, S.M.; de Figueiredo, R.C.; Giatti, L. Socioeconomic inequalities in youth smoking in Brazil. BMJ Open 2013, 3, e003538. [Google Scholar] [CrossRef] [Green Version]
- Schreier, H.M.; Chen, E. Socioeconomic status and the health of youth: A multilevel, multidomain approach to conceptualizing pathways. Psychol. Bull. 2013, 139, 606–654. [Google Scholar] [CrossRef]
- Hemovich, V.; Lac, A.; Crano, W.D. Understanding early-onset drug and alcohol outcomes among youth: The role of family structure, social factors, and interpersonal perceptions of use. Psychol. Health Med. 2011, 16, 249–267. [Google Scholar] [CrossRef] [Green Version]
- Poh, B.K.; Lee, S.T.; Yeo, G.S.; Tang, K.C.; Noor Afifah, A.R.; Siti Hanisa, A.; Parikh, P.; Wong, J.E.; Ng, A.L.O.; Group, S.S. Low socioeconomic status and severe obesity are linked to poor cognitive performance in Malaysian children. BMC Public Health 2019, 19, 541. [Google Scholar] [CrossRef] [Green Version]
- Karlsson, O.; De Neve, J.W.; Subramanian, S.V. Weakening association of parental education: Analysis of child health outcomes in 43 low- and middle-income countries. Int. J. Epidemiol. 2018. [Google Scholar] [CrossRef]
- Madhushanthi, H.J.; Wimalasekera, S.W.; Goonewardena, C.S.E.; Amarasekara, A.; Lenora, J. Socioeconomic status is a predictor of neurocognitive performance of early female adolescents. Int. J. Adolesc. Med. Health 2018. [Google Scholar] [CrossRef]
- Christensen, D.L.; Schieve, L.A.; Devine, O.; Drews-Botsch, C. Socioeconomic status, child enrichment factors, and cognitive performance among preschool-age children: Results from the Follow-Up of Growth and Development Experiences study. Res. Dev. Disabil. 2014, 35, 1789–1801. [Google Scholar] [CrossRef] [PubMed] [Green Version]
- Bouthoorn, S.H.; Wijtzes, A.I.; Jaddoe, V.W.; Hofman, A.; Raat, H.; van Lenthe, F.J. Development of socioeconomic inequalities in obesity among Dutch pre-school and school-aged children. Obesity 2014, 22, 2230–2237. [Google Scholar] [CrossRef] [PubMed]
- Yelin, E.; Trupin, L.; Bunde, J.; Yazdany, J. Poverty, Neighborhoods, Persistent Stress, and Systemic Lupus Erythematosus Outcomes: A Qualitative Study of the Patients’ Perspective. Arthritis Care Res. 2019, 71, 398–405. [Google Scholar] [CrossRef] [PubMed]
- Harnett, N.G.; Wheelock, M.D.; Wood, K.H.; Goodman, A.M.; Mrug, S.; Elliott, M.N.; Schuster, M.A.; Tortolero, S.; Knight, D.C. Negative life experiences contribute to racial differences in the neural response to threat. Neuroimage 2019, 202, 116086. [Google Scholar] [CrossRef]
- Schulz, A.J.; Mentz, G.; Lachance, L.; Johnson, J.; Gaines, C.; Israel, B.A. Associations between socioeconomic status and allostatic load: Effects of neighborhood poverty and tests of mediating pathways. Am. J. Public Health 2012, 102, 1706–1714. [Google Scholar] [CrossRef] [PubMed]
- Kaufman, J.S.; Cooper, R.S.; McGee, D.L. Socioeconomic status and health in blacks and whites: The problem of residual confounding and the resiliency of race. Epidemiology 1997, 8, 621–628. [Google Scholar] [CrossRef] [PubMed]
- Bell, C.N.; Sacks, T.K.; Thomas Tobin, C.S.; Thorpe, R.J., Jr. Racial Non-equivalence of Socioeconomic Status and Self-rated Health among African Americans and Whites. SSM Popul. Health 2020, 10, 100561. [Google Scholar] [CrossRef]
- Samuel, L.J.; Roth, D.L.; Schwartz, B.S.; Thorpe, R.J.; Glass, T.A. Socioeconomic Status, Race/Ethnicity, and Diurnal Cortisol Trajectories in Middle-Aged and Older Adults. J. Gerontol. B Psychol. Sci. Soc. Sci. 2018, 73, 468–476. [Google Scholar] [CrossRef] [Green Version]
- Fuentes, M.; Hart-Johnson, T.; Green, C.R. The association among neighborhood socioeconomic status, race and chronic pain in black and white older adults. J. Natl. Med. Assoc. 2007, 99, 1160–1169. [Google Scholar] [PubMed]
- Williams, D.R.; Costa, M.V.; Odunlami, A.O.; Mohammed, S.A. Moving upstream: How interventions that address the social determinants of health can improve health and reduce disparities. J. Public Health Manag. Pract. 2008, 14, S8–S17. [Google Scholar] [CrossRef]
- Williams, D.R. Race, socioeconomic status, and health the added effects of racism and discrimination. Ann. N. Y. Acad. Sci. 1999, 896, 173–188. [Google Scholar] [CrossRef]
- Assari, S.; Preiser, B.; Kelly, M. Education and Income Predict Future Emotional Well-Being of Whites but Not Blacks: A Ten-Year Cohort. Brain Sci. 2018, 8, 122. [Google Scholar] [CrossRef] [PubMed] [Green Version]
- Assari, S. Socioeconomic Status and Current Cigarette Smoking Status: Immigrants’ Diminished Returns. Int. J. Travel Med. Glob. Health 2020, 8, 66–72. [Google Scholar] [CrossRef] [PubMed]
- Assari, S.; Farokhnia, M.; Mistry, R. Education Attainment and Alcohol Binge Drinking: Diminished Returns of Hispanics in Los Angeles. Behav. Sci. 2019, 9, 9. [Google Scholar] [CrossRef] [Green Version]
- Assari, S. Health Disparities due to Diminished Return among Black Americans: Public Policy Solutions. Soc. Issues Policy Rev. 2018, 12, 112–145. [Google Scholar] [CrossRef]
- Assari, S. Unequal Gain of Equal Resources across Racial Groups. Int. J. Health Policy Manag. 2017, 7, 1–9. [Google Scholar] [CrossRef] [Green Version]
- Shervin, A.; Ritesh, M. Diminished Return of Employment on Ever Smoking among Hispanic Whites in Los Angeles. Health Equity 2019, 3, 138–144. [Google Scholar] [CrossRef] [Green Version]
- Assari, S. Socioeconomic Determinants of Systolic Blood Pressure; Minorities’ Diminished Returns. J. Health Econ. Dev. 2019, 1, 1–11. [Google Scholar]
- Assari, S. Education Attainment and ObesityDifferential Returns Based on Sexual Orientation. Behav. Sci. 2019, 9, 16. [Google Scholar] [CrossRef] [Green Version]
- Assari, S.; Boyce, S.; Bazargan, M.; Caldwell, C.H.; Zimmerman, M.A. Place-Based Diminished Returns of Parental Educational Attainment on School Performance of Non-Hispanic White Youth. Front. Educ. 2020, 5. [Google Scholar] [CrossRef]
- Assari, S.; Caldwell, C.H. Gender and Ethnic Differences in the Association between Obesity and Depression among Black Adolescents. J. Racial Ethn. Health Disparities 2015, 2, 481–493. [Google Scholar] [CrossRef] [PubMed]
- Assari, S.; Lankarani, M.M. Association between Stressful Life Events and Depression; Intersection of Race and Gender. J. Racial Ethn. Health Disparities 2016, 3, 349–356. [Google Scholar] [CrossRef] [PubMed]
- Wierenga, L.M.; Sexton, J.A.; Laake, P.; Giedd, J.N.; Tamnes, C.K.; Pediatric Imaging, N.; Study, G. A key characteristic of sex differences in the developing brain: Greater variability in brain structure of boys than girls. Cereb. Cortex 2018, 28, 2741–2751. [Google Scholar] [CrossRef] [PubMed] [Green Version]
- Javanbakht, A.; Kim, P.; Swain, J.E.; Evans, G.W.; Phan, K.L.; Liberzon, I. Sex-Specific Effects of Childhood Poverty on Neurocircuitry of Processing of Emotional Cues: A Neuroimaging Study. Behav. Sci. 2016, 6, 28. [Google Scholar] [CrossRef] [PubMed] [Green Version]
- Kim, D.-J.; Davis, E.P.; Sandman, C.A.; Glynn, L.; Sporns, O.; O’Donnell, B.F.; Hetrick, W.P. Childhood poverty and the organization of structural brain connectome. NeuroImage 2019, 184, 409–416. [Google Scholar] [CrossRef] [Green Version]
- Whittle, S.; Lichter, R.; Dennison, M.; Vijayakumar, N.; Schwartz, O.; Byrne, M.L.; Simmons, J.G.; Yücel, M.; Pantelis, C.; McGorry, P. Structural brain development and depression onset during adolescence: A prospective longitudinal study. Am. J. Psychiatry 2014, 171, 564–571. [Google Scholar] [CrossRef]
- McDermott, C.L.; Seidlitz, J.; Nadig, A.; Liu, S.; Clasen, L.S.; Blumenthal, J.D.; Reardon, P.K.; Lalonde, F.; Greenstein, D.; Patel, R. Longitudinally mapping childhood socioeconomic status associations with cortical and subcortical morphology. J. Neurosci. 2019, 39, 1365–1373. [Google Scholar] [CrossRef] [Green Version]
- Lawson, G.M.; Hook, C.J.; Farah, M.J. A meta-analysis of the relationship between socioeconomic status and executive function performance among children. Dev. Sci. 2018, 21, e12529. [Google Scholar] [CrossRef]
- Rhoades, B.L.; Greenberg, M.T.; Lanza, S.T.; Blair, C. Demographic and familial predictors of early executive function development: Contribution of a person-centered perspective. J. Exp. Child Psychol. 2011, 108, 638–662. [Google Scholar] [CrossRef] [Green Version]
- Albert, W.D.; Hanson, J.L.; Skinner, A.T.; Dodge, K.A.; Steinberg, L.; Deater-Deckard, K.; Bornstein, M.H.; Lansford, J.E. Individual differences in executive function partially explain the socioeconomic gradient in middle-school academic achievement. Dev. Sci. 2020, e12937. [Google Scholar] [CrossRef] [Green Version]
- Gautam, P.; Warner, T.D.; Kan, E.C.; Sowell, E.R. Executive function and cortical thickness in youths prenatally exposed to cocaine, alcohol and tobacco. Dev. Cogn. Neurosci. 2015, 16, 155–165. [Google Scholar] [CrossRef]
- Kesler, S.R.; Ogg, R.; Reddick, W.E.; Phillips, N.; Scoggins, M.; Glass, J.O.; Cheung, Y.T.; Pui, C.H.; Robison, L.L.; Hudson, M.M.; et al. Brain Network Connectivity and Executive Function in Long-Term Survivors of Childhood Acute Lymphoblastic Leukemia. Brain Connect. 2018, 8, 333–342. [Google Scholar] [CrossRef] [PubMed]
- Last, B.S.; Lawson, G.M.; Breiner, K.; Steinberg, L.; Farah, M.J. Childhood socioeconomic status and executive function in childhood and beyond. PLoS ONE 2018, 13, e0202964. [Google Scholar] [CrossRef] [PubMed]
- Ursache, A.; Noble, K.G.; Pediatric Imaging, N.; Genetics, S. Socioeconomic status, white matter, and executive function in children. Brain Behav. 2016, 6, e00531. [Google Scholar] [CrossRef] [PubMed]
- Livesey, D.; Keen, J.; Rouse, J.; White, F. The relationship between measures of executive function, motor performance and externalising behaviour in 5-and 6-year-old children. Hum. Mov. Sci. 2006, 25, 50–64. [Google Scholar] [CrossRef] [PubMed]
- Ramaekers, J.G.; Kauert, G.; van Ruitenbeek, P.; Theunissen, E.L.; Schneider, E.; Moeller, M.R. High-potency marijuana impairs executive function and inhibitory motor control. Neuropsychopharmacology 2006, 31, 2296–2303. [Google Scholar] [CrossRef] [PubMed] [Green Version]
- Phillips, L.H.; Bull, R.; Adams, E.; Fraser, L. Positive mood and executive function: Evidence from Stroop and fluency tasks. Emotion 2002, 2, 12. [Google Scholar] [CrossRef] [PubMed] [Green Version]
- Castellanos, F.X.; Marvasti, F.F.; Ducharme, J.L.; Walter, J.M.; Israel, M.E.; Krain, A.; Pavlovsky, C.; Hommer, D.W. Executive function oculomotor tasks in girls with ADHD. J. Am. Acad. Child Adolesc. Psychiatry 2000, 39, 644–650. [Google Scholar] [CrossRef] [PubMed]
- Kiefer, M.; Marzinzik, F.; Weisbrod, M.; Scherg, M.; Spitzer, M. The time course of brain activations during response inhibition: Evidence from event-related potentials in a go/no go task. Neuroreport 1998, 9, 765–770. [Google Scholar] [CrossRef] [Green Version]
- Casey, B.; Trainor, R.J.; Orendi, J.L.; Schubert, A.B.; Nystrom, L.E.; Giedd, J.N.; Castellanos, F.X.; Haxby, J.V.; Noll, D.C.; Cohen, J.D. A developmental functional MRI study of prefrontal activation during performance of a go-no-go task. J. Cogn. Neurosci. 1997, 9, 835–847. [Google Scholar] [CrossRef]
- Silveira, S.; Shah, R.; Nooner, K.B.; Nagel, B.J.; Tapert, S.F.; de Bellis, M.D.; Mishra, J. Impact of Childhood Trauma on Executive Function in Adolescence-Mediating Functional Brain Networks and Prediction of High-Risk Drinking. Biol. Psychiatry Cogn. Neurosci. Neuroimaging 2020, 5, 499–509. [Google Scholar] [CrossRef]
- Hackman, D.A.; Gallop, R.; Evans, G.W.; Farah, M.J. Socioeconomic status and executive function: Developmental trajectories and mediation. Dev. Sci. 2015, 18, 686–702. [Google Scholar] [CrossRef] [PubMed]
- Chung, T.; Ferrell, R.; Clark, D.B. Indirect association of DAT1 genotype with executive function through white matter volume in orbitofrontal cortex. Psychiatry Res. 2015, 232, 76–83. [Google Scholar] [CrossRef] [PubMed] [Green Version]
- Lebel, C.; Warner, T.; Colby, J.; Soderberg, L.; Roussotte, F.; Behnke, M.; Davis Eyler, F.; Sowell, E.R. White matter microstructure abnormalities and executive function in adolescents with prenatal cocaine exposure. Psychiatry Res. 2013, 213, 161–168. [Google Scholar] [CrossRef] [PubMed] [Green Version]
- Piccolo, L.R.; Merz, E.C.; Noble, K.G.; Pediatric Imaging, N.; Genetics, S. School climate is associated with cortical thickness and executive function in children and adolescents. Dev. Sci. 2019, 22, e12719. [Google Scholar] [CrossRef] [PubMed] [Green Version]
- Alcohol Research: Current Reviews Editorial Staff. NIH’s Adolescent Brain Cognitive Development (ABCD) Study. Alcohol. Res. 2018, 39, 97. [Google Scholar]
- Casey, B.J.; Cannonier, T.; Conley, M.I.; Cohen, A.O.; Barch, D.M.; Heitzeg, M.M.; Soules, M.E.; Teslovich, T.; Dellarco, D.V.; Garavan, H.; et al. The Adolescent Brain Cognitive Development (ABCD) study: Imaging acquisition across 21 sites. Dev. Cogn. Neurosci. 2018, 32, 43–54. [Google Scholar] [CrossRef]
- Karcher, N.R.; O’Brien, K.J.; Kandala, S.; Barch, D.M. Resting-State Functional Connectivity and Psychotic-like Experiences in Childhood: Results from the Adolescent Brain Cognitive Development Study. Biol. Psychiatry 2019, 86, 7–15. [Google Scholar] [CrossRef]
- Lisdahl, K.M.; Sher, K.J.; Conway, K.P.; Gonzalez, R.; Feldstein Ewing, S.W.; Nixon, S.J.; Tapert, S.; Bartsch, H.; Goldstein, R.Z.; Heitzeg, M. Adolescent brain cognitive development (ABCD) study: Overview of substance use assessment methods. Dev. Cogn. Neurosci. 2018, 32, 80–96. [Google Scholar] [CrossRef]
- Luciana, M.; Bjork, J.M.; Nagel, B.J.; Barch, D.M.; Gonzalez, R.; Nixon, S.J.; Banich, M.T. Adolescent neurocognitive development and impacts of substance use: Overview of the adolescent brain cognitive development (ABCD) baseline neurocognition battery. Dev. Cogn. Neurosci. 2018, 32, 67–79. [Google Scholar] [CrossRef]
- Auchter, A.M.; Hernandez Mejia, M.; Heyser, C.J.; Shilling, P.D.; Jernigan, T.L.; Brown, S.A.; Tapert, S.F.; Dowling, G.J. A description of the ABCD organizational structure and communication framework. Dev. Cogn. Neurosci. 2018, 32, 8–15. [Google Scholar] [CrossRef] [PubMed]
- Asaad, S.K.; Bjarkam, C.R. The Aalborg Bolt-Connected Drain (ABCD) study: A prospective comparison of tunnelled and bolt-connected external ventricular drains. Acta Neurochir. 2019, 161, 33–39. [Google Scholar] [CrossRef] [PubMed]
- ABCD. ABCD Protocl Brocure-Baseline. Available online: abcdstudy.org/images/Protocol-Brochure-Baseline.pdf (accessed on 10 October 2020).
- Feldstein Ewing, S.W.; Chang, L.; Cottler, L.B.; Tapert, S.F.; Dowling, G.J.; Brown, S.A. Approaching Retention within the ABCD Study. Dev. Cogn. Neurosci. 2018, 32, 130–137. [Google Scholar] [CrossRef]
- Werneck, A.O.; Agostinete, R.R.; Cayres, S.U.; Urban, J.B.; Wigna, A.; Chagas, L.G.M.; Torres, W.; Fernandes, R.A. Association between Cluster of Lifestyle Behaviors and HOMA-IR among Adolescents: ABCD Growth Study. Medicina 2018, 54, 96. [Google Scholar] [CrossRef] [PubMed] [Green Version]
- Fine, J.D.; Moreau, A.L.; Karcher, N.R.; Agrawal, A.; Rogers, C.E.; Barch, D.M.; Bogdan, R. Association of Prenatal Cannabis Exposure with Psychosis Proneness among Children in the Adolescent Brain Cognitive Development (ABCD) Study. JAMA Psychiatry 2019, 76, 762–764. [Google Scholar] [CrossRef]
- Dick, A.S.; Garcia, N.L.; Pruden, S.M.; Thompson, W.K.; Hawes, S.W.; Sutherland, M.T.; Riedel, M.C.; Laird, A.R.; Gonzalez, R. No evidence for a bilingual executive function advantage in the nationally representative ABCD study. Nat. Hum. Behav. 2019, 3, 692–701. [Google Scholar] [CrossRef]
- Michelini, G.; Barch, D.M.; Tian, Y.; Watson, D.; Klein, D.N.; Kotov, R. Delineating and validating higher-order dimensions of psychopathology in the Adolescent Brain Cognitive Development (ABCD) study. Transl. Psychiatry 2019, 9, 261. [Google Scholar] [CrossRef] [PubMed] [Green Version]
- Gray, J.C.; Schvey, N.A.; Tanofsky-Kraff, M. Demographic, psychological, behavioral, and cognitive correlates of BMI in youth: Findings from the Adolescent Brain Cognitive Development (ABCD) study. Psychol. Med. 2019, 1–9. [Google Scholar] [CrossRef]
- Beauchaine, T.P. Editorial: Family History of Depression and Child Striatal Volumes in the ABCD Study: Promise and Perils of Neuroimaging Research with Large Samples. J. Am. Acad. Child Adolesc. Psychiatry 2020. [Google Scholar] [CrossRef]
- Buscemi, S.; Corleo, D.; Vasto, S.; Buscemi, C.; Massenti, M.F.; Nuzzo, D.; Lucisano, G.; Barile, A.M.; Rosafio, G.; Maniaci, V.; et al. Factors associated with circulating concentrations of irisin in the general population cohort of the ABCD study. Int. J. Obes. 2018, 42, 398–404. [Google Scholar] [CrossRef]
- Exuperio, I.N.; Agostinete, R.R.; Werneck, A.O.; Maillane-Vanegas, S.; Luiz-de-Marco, R.; Mesquita, E.D.L.; Kemper, H.C.G.; Fernandes, R.A. Impact of Artistic Gymnastics on Bone Formation Marker, Density and Geometry in Female Adolescents: ABCD-Growth Study. J. Bone Metab. 2019, 26, 75–82. [Google Scholar] [CrossRef] [PubMed]
- Lynch, K.R.; Anokye, N.K.; Vlachopoulos, D.; Barbieri, F.A.; Turi-Lynch, B.C.; Codogno, J.S.; Agostinete, R.R.; Fernandes, R.A. Impact of sports participation on incidence of bone traumatic fractures and health-care costs among adolescents: ABCD—Growth Study. Phys. Sportsmed. 2019, 1–6. [Google Scholar] [CrossRef] [PubMed]
- Hoffman, E.A.; Howlett, K.D.; Breslin, F.; Dowling, G.J. Outreach and innovation: Communication strategies for the ABCD Study. Dev. Cogn. Neurosci. 2018, 32, 138–142. [Google Scholar] [CrossRef] [PubMed]
- Garavan, H.; Bartsch, H.; Conway, K.; Decastro, A.; Goldstein, R.Z.; Heeringa, S.; Jernigan, T.; Potter, A.; Thompson, W.; Zahs, D. Recruiting the ABCD sample: Design considerations and procedures. Dev. Cogn. Neurosci. 2018, 32, 16–22. [Google Scholar] [CrossRef]
- Nesbitt, K.T.; Baker-Ward, L.; Willoughby, M.T. Executive function mediates socio-economic and racial differences in early academic achievement. Early Child. Res. Q. 2013, 28, 774–783. [Google Scholar] [CrossRef]
- Martel, M.M. Individual differences in attention deficit hyperactivity disorder symptoms and associated executive dysfunction and traits: Sex, ethnicity, and family income. Am. J. Orthopsychiatry 2013, 83, 165. [Google Scholar] [CrossRef] [Green Version]
- Holochwost, S.J.; Gariépy, J.-L.; Propper, C.B.; Gardner-Neblett, N.; Volpe, V.; Neblett, E.; Mills-Koonce, W.R. Sociodemographic risk, parenting, and executive functions in early childhood: The role of ethnicity. Early Child. Res. Q. 2016, 36, 537–549. [Google Scholar] [CrossRef]
- Hongwanishkul, D.; Happaney, K.R.; Lee, W.S.; Zelazo, P.D. Assessment of hot and cool executive function in young children: Age-related changes and individual differences. Dev. Neuropsychol. 2005, 28, 617–644. [Google Scholar] [CrossRef]
- Gur, R.E.; Gur, R.C. Sex differences in brain and behavior in adolescence: Findings from the Philadelphia Neurodevelopmental Cohort. Neurosci. Biobehav. Rev. 2016, 70, 159–170. [Google Scholar] [CrossRef] [Green Version]
- Fagot, B.I. Parenting boys and girls. In Handbook of Parenting; Lawrence Erlbaum Associates, Inc.: Mahwah, NJ, USA, 1995. [Google Scholar]
- Carlo, G.; Raffaelli, M.; Laible, D.J.; Meyer, K.A. Why are girls less physically aggressive than boys? Personality and parenting mediators of physical aggression. Sex Roles 1999, 40, 711–729. [Google Scholar] [CrossRef]
- Khooshabi, K.; Setareh-Ameneh-Forouzan, A.G.; Assari, S. Is there a gender difference in associates of adolescents’ lifetime illicit drug use in Tehran, Iran? Arch. Med. Sci. AMS 2010, 6, 399. [Google Scholar] [CrossRef] [PubMed]
- Frost, L. Doing bodies differently? Gender, youth, appearance and damage. J. Youth Stud. 2003, 6, 53–70. [Google Scholar] [CrossRef]
- Matud, M.P. Gender differences in stress and coping styles. Personal. Individ. Differ. 2004, 37, 1401–1415. [Google Scholar] [CrossRef]
- Gagné, T.; Veenstra, G. Inequalities in hypertension and diabetes in Canada: Intersections between racial identity, gender, and income. Ethn. Dis. 2017, 27, 371. [Google Scholar] [CrossRef] [PubMed]
- McDonough, P.; Williams, D.R.; House, J.S.; Duncan, G.J. Gender and the socioeconomic gradient in mortality. J. Health Soc. Behav. 1999, 40, 17–31. [Google Scholar] [CrossRef] [PubMed]
- Hammarström, A. Health consequences of youth unemployment—Review from a gender perspective. Soc. Sci. Med. 1994, 38, 699–709. [Google Scholar] [CrossRef]
- Waldron, I. Effects of labor force participation on sex differences in mortality and morbidity. In Women, Work, and Health; Springer: Berlin/Heidelberg, Germany, 1991; pp. 17–38. [Google Scholar]
- Garcy, A.M.; Vågerö, D. The length of unemployment predicts mortality, differently in men and women, and by cause of death: A six year mortality follow-up of the Swedish 1992–1996 recession. Soc. Sci. Med. 2012, 74, 1911–1920. [Google Scholar] [CrossRef] [PubMed]
- Bowden, M.; Bartkowski, J.; Xu, X.; Lewis, R., Jr. Parental occupation and the gender math gap: Examining the social reproduction of academic advantage among elementary and middle school students. Soc. Sci. 2017, 7, 6. [Google Scholar] [CrossRef] [Green Version]
- Chetty, R.; Hendren, N.; Kline, P.; Saez, E. Where is the land of opportunity? The geography of intergenerational mobility in the United States. Q. J. Econ. 2014, 129, 1553–1623. [Google Scholar] [CrossRef] [Green Version]
Figure 1.
Distribution of the outcome.

Figure 2.
Distribution of household income.

Figure 3.
Association between household income and children’s executive function.

Figure 4.
Association between household income and children’s executive function by child sex.


Table 1.
Descriptive data overall and by sex (n = 8608).
| Characteristics | All | Female | Male | p |
|---|---|---|---|---|
| 8608 | 4220 | 4388 | ||
| Mean (SD) | Mean (SD) | Mean (SD) | ||
| Age | 119.18 (7.46) | 118.94 (7.44) | 119.40 (7.46) | 0.004 |
| Executive function (mean (SD)) | 0.81 (0.15) | 0.81 (0.15) | 0.81 (0.14) | 0.471 |
| Household income | n(%) | n(%) | n(%) | |
| <50 K | 2302 (26.7) | 1161 (27.5) | 1141 (26.0) | 0.231 |
| ≥50 K & <100 K | 2458 (28.6) | 1205 (28.6) | 1253 (28.6) | |
| ≥100 K | 3848 (44.7) | 1854 (43.9) | 1994 (45.4) | |
| Race | ||||
| White | 5891 (68.4) | 2833 (67.1) | 3058 (69.7) | 0.073 |
| Black | 1129 (13.1) | 578 (13.7) | 551 (12.6) | |
| Asian | 186 (2.2) | 99 (2.3) | 87 (2.0) | |
| Other/Mixed | 1402 (16.3) | 710 (16.8) | 692 (15.8) | |
| Sex | ||||
| Female | 4220 (49.0) | 4220 (100.0) | 0 (0.0) | <0.001 |
| Male | 4388 (51.0) | 0 (0.0) | 4388 (100.0) | |
| Married family | ||||
| No | 2463 (28.6) | 1252 (29.7) | 1211 (27.6) | 0.036 |
| Yes | 6145 (71.4) | 2968 (70.3) | 3177 (72.4) | |
| Hispanic | ||||
| No | 6998 (81.3) | 3420 (81.0) | 3578 (81.5) | 0.572 |
| Yes | 1610 (18.7) | 800 (19.0) | 810 (18.5) |
Table 2.
The results of mixed effect models that adjusted for nested data.
| Characteristics | Estimate | Std. Error | t | p | Sig. |
|---|---|---|---|---|---|
| Model 1 | |||||
| Household income [≥100 K] | 0.02987 | 0.00484 | 6.18 | <10−6 | *** |
| Household income [≥50 K & < 100 K] | 0.02013 | 0.00466 | 4.32 | 1.55 × 10⁻⁵ | *** |
| Model 2 | |||||
| Household income [≥100 K] | 0.04250 | 0.00611 | 6.95 | <10−6 | *** |
| Household income [≥50 K & < 100 K] | 0.02528 | 0.00620 | 4.08 | 4.62 × 10⁻⁵ | *** |
| Sex (Male) | 0.01413 | 0.00587 | 2.41 | 0.0161502 | * |
| Household income [≥100 K] × Male | −0.02507 | 0.00745 | −3.37 | 0.0007673 | *** |
| Household income [≥50 K & < 100 K] × Male | −0.01061 | 0.00820 | −1.29 | 0.1958092 | - |
Age, marital status, race, and ethnicity are controlled in both models. * p < 0.05; *** p < 0.001.
Publisher’s Note: MDPI stays neutral with regard to jurisdictional claims in published maps and institutional affiliations. |
© 2020 by the authors. Licensee MDPI, Basel, Switzerland. This article is an open access article distributed under the terms and conditions of the Creative Commons Attribution (CC BY) license (http://creativecommons.org/licenses/by/4.0/).
Share and Cite
MDPI and ACS Style
Assari, S.; Boyce, S.; Bazargan, M.; Caldwell, C.H. Sex Differences in the Association between Household Income and Children’s Executive Function. Sexes 2020, 1, 19-31. https://0-doi-org.brum.beds.ac.uk/10.3390/sexes1010002
AMA Style
Assari S, Boyce S, Bazargan M, Caldwell CH. Sex Differences in the Association between Household Income and Children’s Executive Function. Sexes. 2020; 1(1):19-31. https://0-doi-org.brum.beds.ac.uk/10.3390/sexes1010002
Chicago/Turabian StyleAssari, Shervin, Shanika Boyce, Mohsen Bazargan, and Cleopatra Howard Caldwell. 2020. "Sex Differences in the Association between Household Income and Children’s Executive Function" Sexes 1, no. 1: 19-31. https://0-doi-org.brum.beds.ac.uk/10.3390/sexes1010002