Article

Sex Differences in the Association between Internet Usage and Overweight/Obesity: Evidence from a Nationally Representative Survey in Nepal

1
Department of Public Health, School of Health and Life Sciences, North South University, Dhaka 1229, Bangladesh
2
Department of Biostatistics and Epidemiology, School of Public Health and Health Sciences, University of Massachusetts, Amherst, MA 01003, USA
3
South Asia Institute for Social Transformation (SAIST), Dhaka 1205, Bangladesh
4
Department of Statistics, University of Dhaka, Dhaka 1000, Bangladesh
5
School of Behavioral and Health Sciences, Australian Catholic University, Fitzroy, VIC 3065, Australia
6
Department of Epidemiology and Preventive Medicine, School of Public Health and Preventive Medicine, Monash University, Melbourne, VIC 3004, Australia
*
Author to whom correspondence should be addressed.
Submission received: 16 February 2021 / Revised: 10 March 2021 / Accepted: 15 March 2021 / Published: 18 March 2021

Abstract

:
Objective: To examine the associations between internet use and overweight/obesity in people aged 15–49 years in Nepal and the extent to which these associations differ by biological sex. Materials and methods: The study analyzed the nationally representative Nepal Demographic and Health Survey (NDHS) 2016 data. Multivariable ordinal logistic regression models were fitted to estimate the total effects of internet use (IU) in the last 12 months and frequency of internet use (FIU) in the last month on overweight/obesity adjusted for potential confounders. Results: Of the 10,380 participants, the prevalence of overweight/obesity by IU was 38% (95% confidence interval (CI): 35.9%, 40.1%) for males and 44.1% (95% CI: 41.6%, 46.6%) for female. The likelihood of overweight/obesity was significantly higher (adjusted odds ratio (aOR): 1.55; 95% CI: 1.40, 1.73; p < 0.001) among those participants who used the internet compared to the participants who did not use the internet in the last 12 months. Similar associations were observed when using the augmented measure of exposure-FIU in the last month. We observed the modification effect of sex in the associations of IU (p-difference < 0.001) and FIU (p-difference < 0.002) with overweight/obesity in Nepal. Conclusions: Our findings suggest that future overweight/obesity interventions in Nepal discourage unnecessary internet use, particularly among males.

1. Introduction

Overweight/obesity, a major risk factor for non-communicable disease (NCD), premature deaths, and disability, is increasing exponentially worldwide, especially among people in low and middle-income countries (LMICs) [1,2]. Physical inactivity and sedentary lifestyles significantly contribute to this trend [3]. The internet has become an integral source of daily communication and information in contemporary society with its easy accessibility, cost-effectiveness, and time-saving attributes [4]. This increasing dependency on the internet has an apparent impact on sedentary lifestyle and physical inactivity [5,6], which is associated with overweight/obesity and related diseases and complications [7,8].
Studies have shown that excessive internet use and internet-based activities (screen time), especially during weekends and leisure hours, affect individuals’ regular food consumption patterns, and sleep hours that are associated with weight gain [9,10,11]. Limiting screen time from an early age has been recommended [12]. There is evidence that night-time internet use, especially for video games and complementary daytime sleeping, is significantly associated with increased body mass index (BMI) [13]. Numerous studies have found that prolonged internet usage (3 h or more a day) and recreational screen-time, for activities such as watching online movies, reading newspapers, playing games, and watching television, are associated with increasing BMI among adolescents and adults [14,15,16,17]. In addition, there is evidence that greater online gaming and virtual social networking are associated with increased consumption of sugar-sweetened beverages [18] and, therefore, overweight and obesity [19].
Overweight/obesity prevalence is higher in women than in men in Nepal [20,21] due to several biological factors, such as fat distribution and hormonal influences [20] and socio-cultural factors [22,23]. In relation to internet use, there is evidence of a “digital divide” between male and female users of the internet [24]. This is characterized by the internet predominantly being accessed by males rather than females due to societal roles, occupation, economic factors that lead to differential health consequences [25]. The absence of internet literacy in older people, particularly older women, means many are reluctant to use the internet. In contrast, the younger generation, irrespective of sex, use the internet for a variety of purposes [24].
The prevalence of overweight/obesity and internet use are increasing in Nepal. For example, the prevalence of overweight/obesity has increased from 21% in 2015 to 31% in 2018 in Nepal [20,21], while the prevalence of internet use has increased exponentially from 9% in 2011 to 63% in 2019 [26]. However, whether overweight/obesity and internet use are associated has not been investigated. We hypothesized that the increasing trend of overweight/obesity in Nepal could be explained by the increasing use of internet in the country. To address this knowledge gap, using nationally representative data, we examined the associations between internet use and overweight/obesity in people aged 15–49 years in Nepal and the extent to which these associations differ by biological sex.

2. Materials and Methods

2.1. Study Design, Population and Setting

The study analyzed the nationally representative Nepal Demographic and Health Survey (NDHS) 2016 data, collected between June 2016 and January 2017. Data on this study were obtained from the NDHS 2016 implemented by New ERA under the supervision of the Ministry of Health, Nepal. The households of the NDHS 2016 were selected in two ways based on the urban/rural locations. Firstly, the two-stage stratified sampling process was used in rural areas where wards were selected in the first stage as a primary sampling unit (PSU), and households were selected in the second stage. Secondly, three-stage stratified sampling was used in urban areas to select households where wards were selected in the first stage (PSUs), enumeration areas (EA) were selected from each PSU in the second stage, and households were selected from EAs in the third stage. A total of 383 wards, 184 urban and 199 rural, were selected all together. Finally, a total of 11,490 households (rural—5970 and urban—5520) were selected for the NDHS 2016 [27]. Data were collected by the trained interviewers visiting the households. The overall response rate was approximately 97%. BMI was measured among 14,763 individuals with 6120 men and 8647 women aged 15–49 years. In our study, a total unweighted sample was 10,380 comprising men (3995) and women (6385), after excluding participants aged >49 years and discarding the missing and extreme values. The total weighted analytic sample was 10,384 participants (men 4054 and women 6330) aged 15–49 years (Figure 1). Details of the NDHS 2016, including survey design, sample size determination, and questionnaires, have been described elsewhere [27].

2.2. Measures of Outcomes: Body Mass Index

The outcome of interest in this study was BMI. It was categorized using both South Asia (SA) specific and World Health Organization (WHO) cut-offs. According to SA cutoff values, underweight was defined as BMI <18.50 kg/m2, normal 18.50 kg/m2 to < 23.00 kg/m2, overweight 23.00 kg/m2 to 27.50 kg/m2 and obesity was defined as BMI ≥27.50 kg/m2. According to the World Health Organization (WHO), the corresponding categories were underweight (<18.50 kg/m2), normal (18.50 kg/m2 to <24.99 kg/m2), overweight (25.00 kg/m2 to 29.99 kg/m2) and obesity (≥30.00 kg/m2).

2.3. Measures of Exposures: Internet Usage

Internet use (IU) in the last 12 months or earlier and frequency of internet use (FIU) in the last month were two main exposures of interest. IU was categorized as (1) no and (2) yes, while FIU was categorized as (1) non-user, (2) less than a week/at least once in a week, and (3) almost every day.

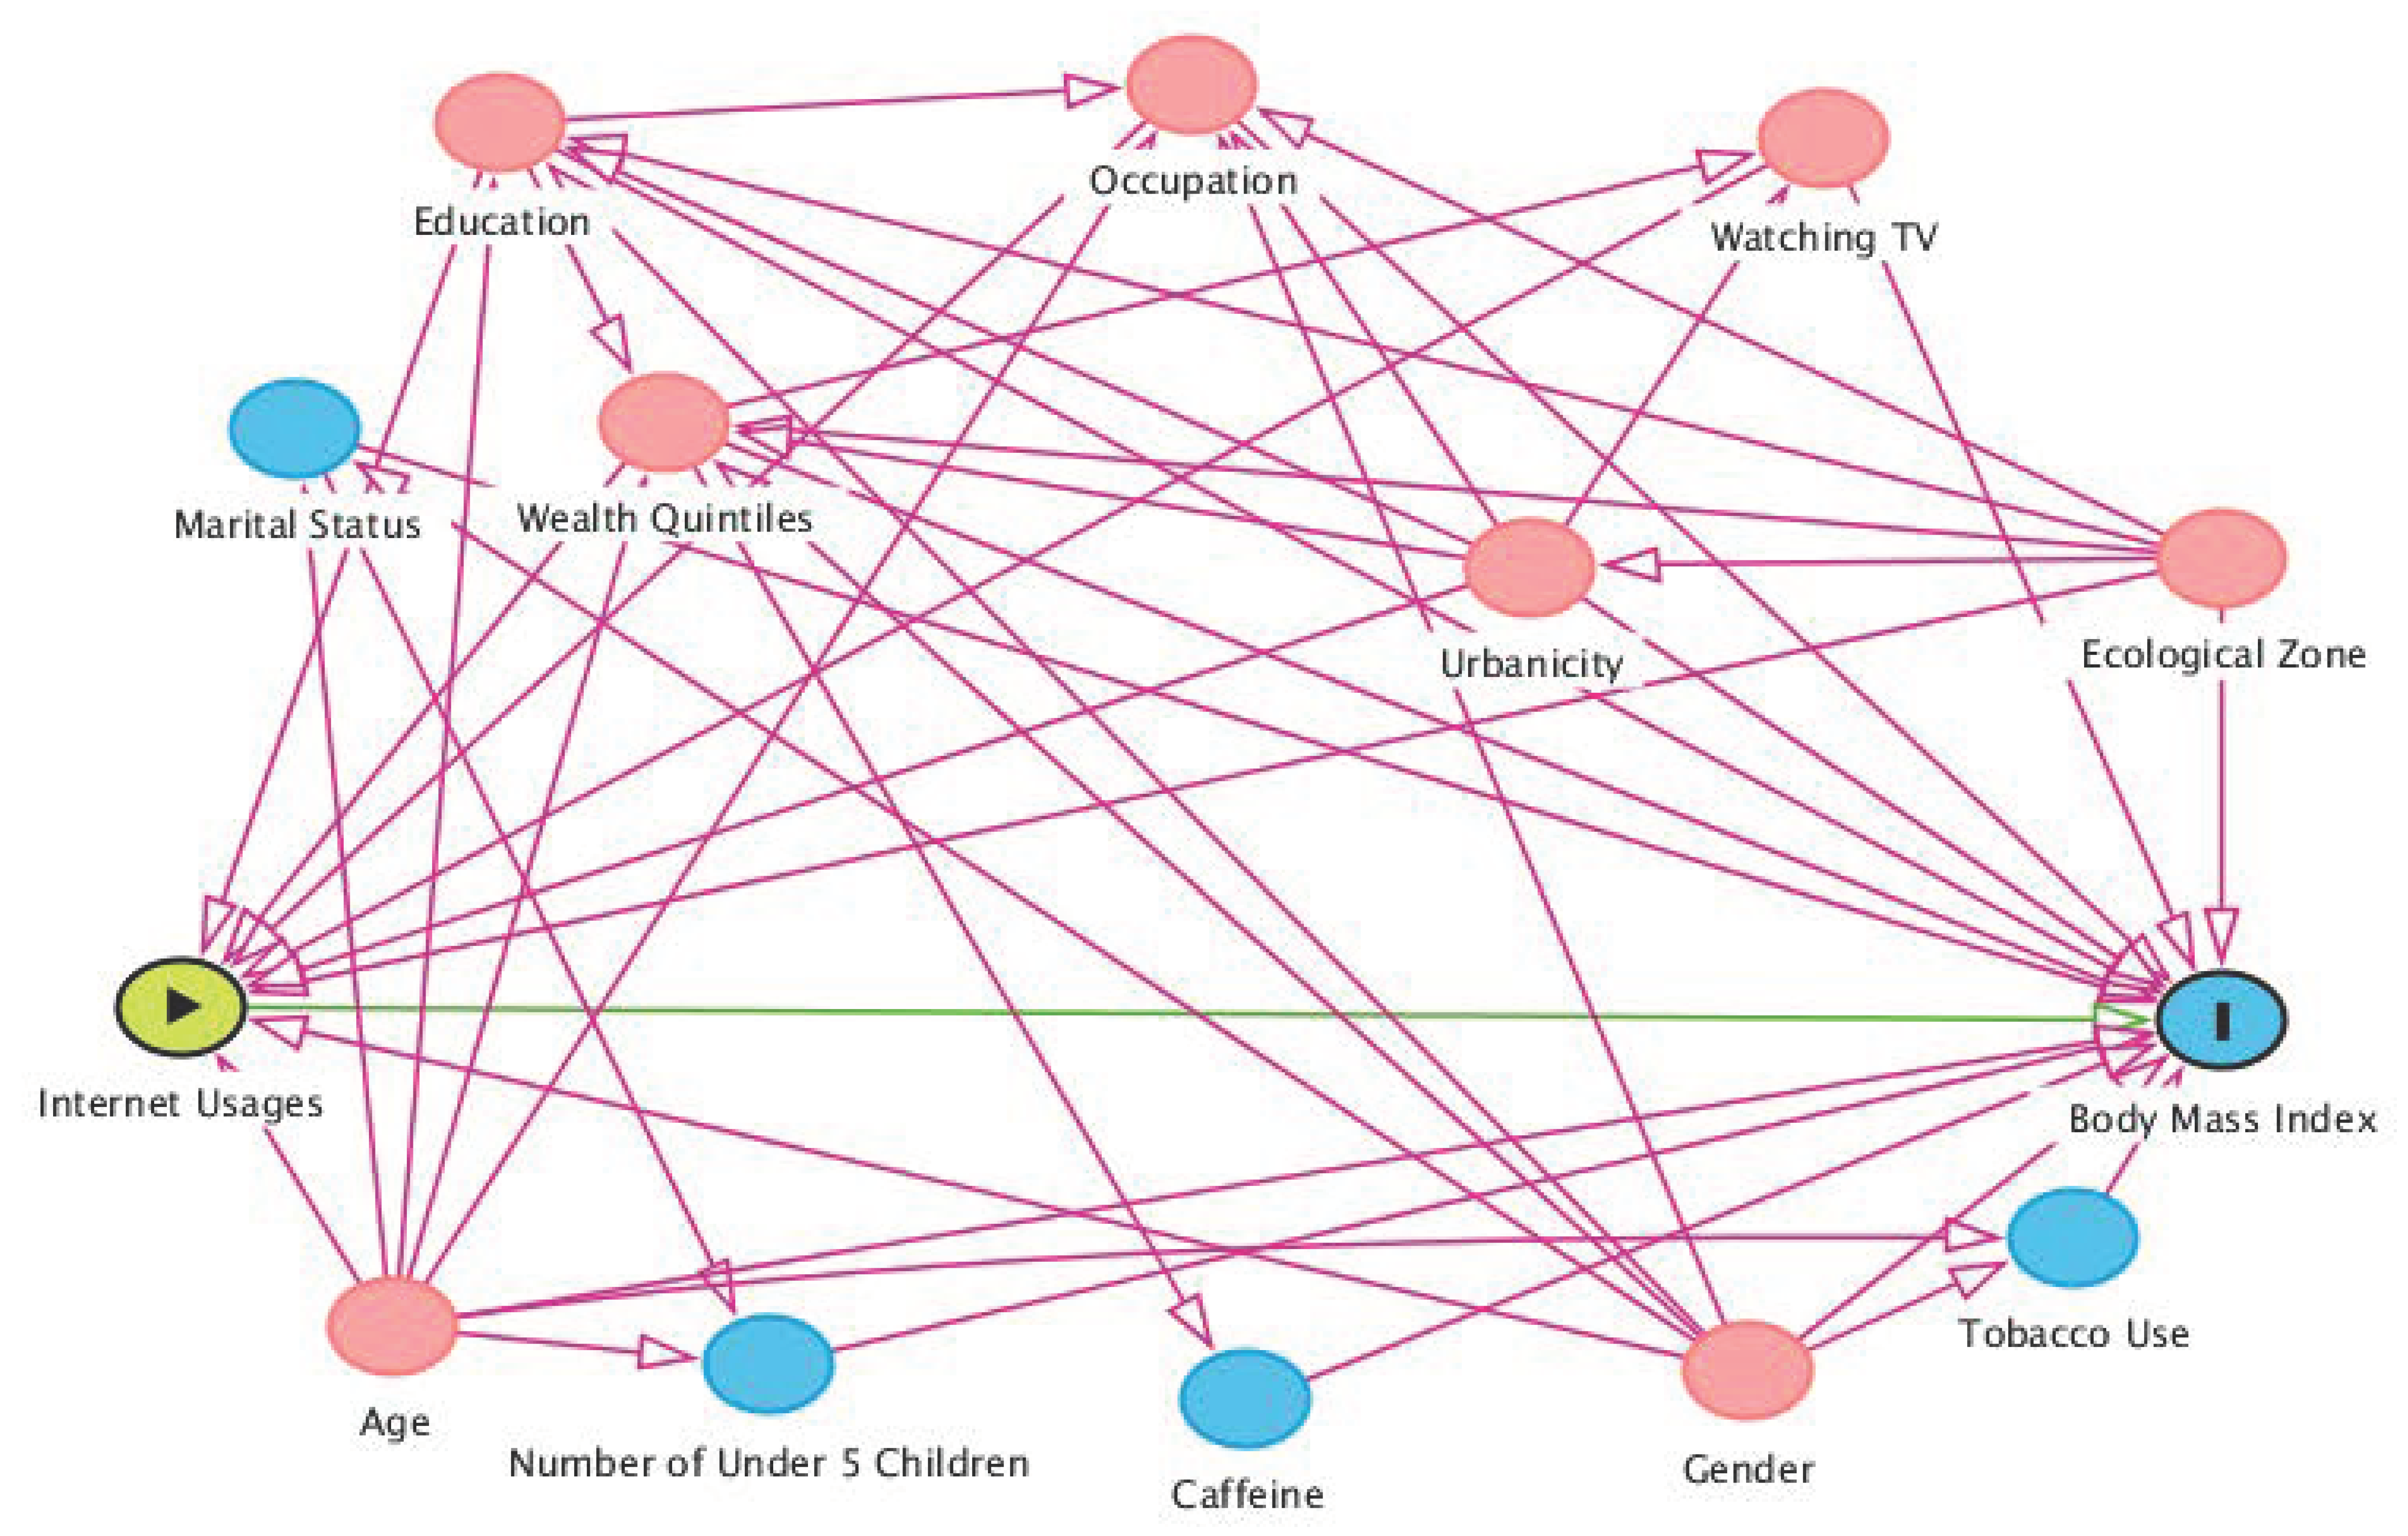
2.4. Covariates and Potential Confounders

A number of covariates have been selected in this study based on prior literature and researchers’ subject knowledge [28,29,30,31]. These are age group (15–24, 25–34, 35–44 and 45–49), sex (male and female), urbanicity (urban and rural), ecological zone (Mountain, Hill, and Terai), education (no education, primary, secondary and higher), household wealth quintiles (poorest, poorer, middle, richer and richest), number of under-five children (no, one, two, and three or more), occupation (unemployed, non-manual job, manual job, and agriculture), marital status (unmarried and ever married including divorced, widow and separated), watching television (TV) (not at all, less than once a week and at least once a week), caffeine consumption (no and yes) and current tobacco use (yes, no).

2.5. Statistical Analysis

We first present the characteristics of the study population by BMI categories and the exposure variables (IU and FIU). The univariate associations of BMI categories and the internet usages with different sample characteristics were examined by chi-square tests. Multivariable ordinal logistic regression models were fitted to estimate the total effects of IU and FIU on overweight/obesity adjusted for minimal sufficient adjustment set of potential confounders (age, sex, marital status, occupation, household wealth index, urbanicity, and ecological zone) based on the directed acyclic graph (DAG) model (Figure 2 and Table 1), and effect modification of sex in these associations. To avoid multicollinearity and over adjustment, we did not adjust for watching TV and level of education. Results were presented as adjusted odds ratio (aOR) and 95% confidence interval (CI). All analyses accounted for complex survey design to adjust clustering variation, the probability of selection, and non-response in the NDHS [32]. All statistical tests were two-sided, and a p-value < 0.05 was the level of significance. The p-difference was extracted using a Wald test for the models with interaction terms. Analyses were conducted using software R version 4.2 [33]. Codes are available upon request.

3. Results

3.1. Sample Characteristics

A total of 10,380 (unweighted sample) participants were included in the analysis, and their characteristics (weighted percentage) are presented in Table 1. The mean (SE) age of the participants was 29.4 (0.11). Of the study participants, 61% were female, 74.6% were either married or once married which included divorced, separated, or widowed. About two-thirds (63%) of the participants lived in urban areas, while about half of them (50.1%) watched TV at least once in a week. About one-quarter (24.0%) of the participants had no education, 40% of the participants were involved in agricultural work, and 35.4% of the participants were from the poorest and poorer households.

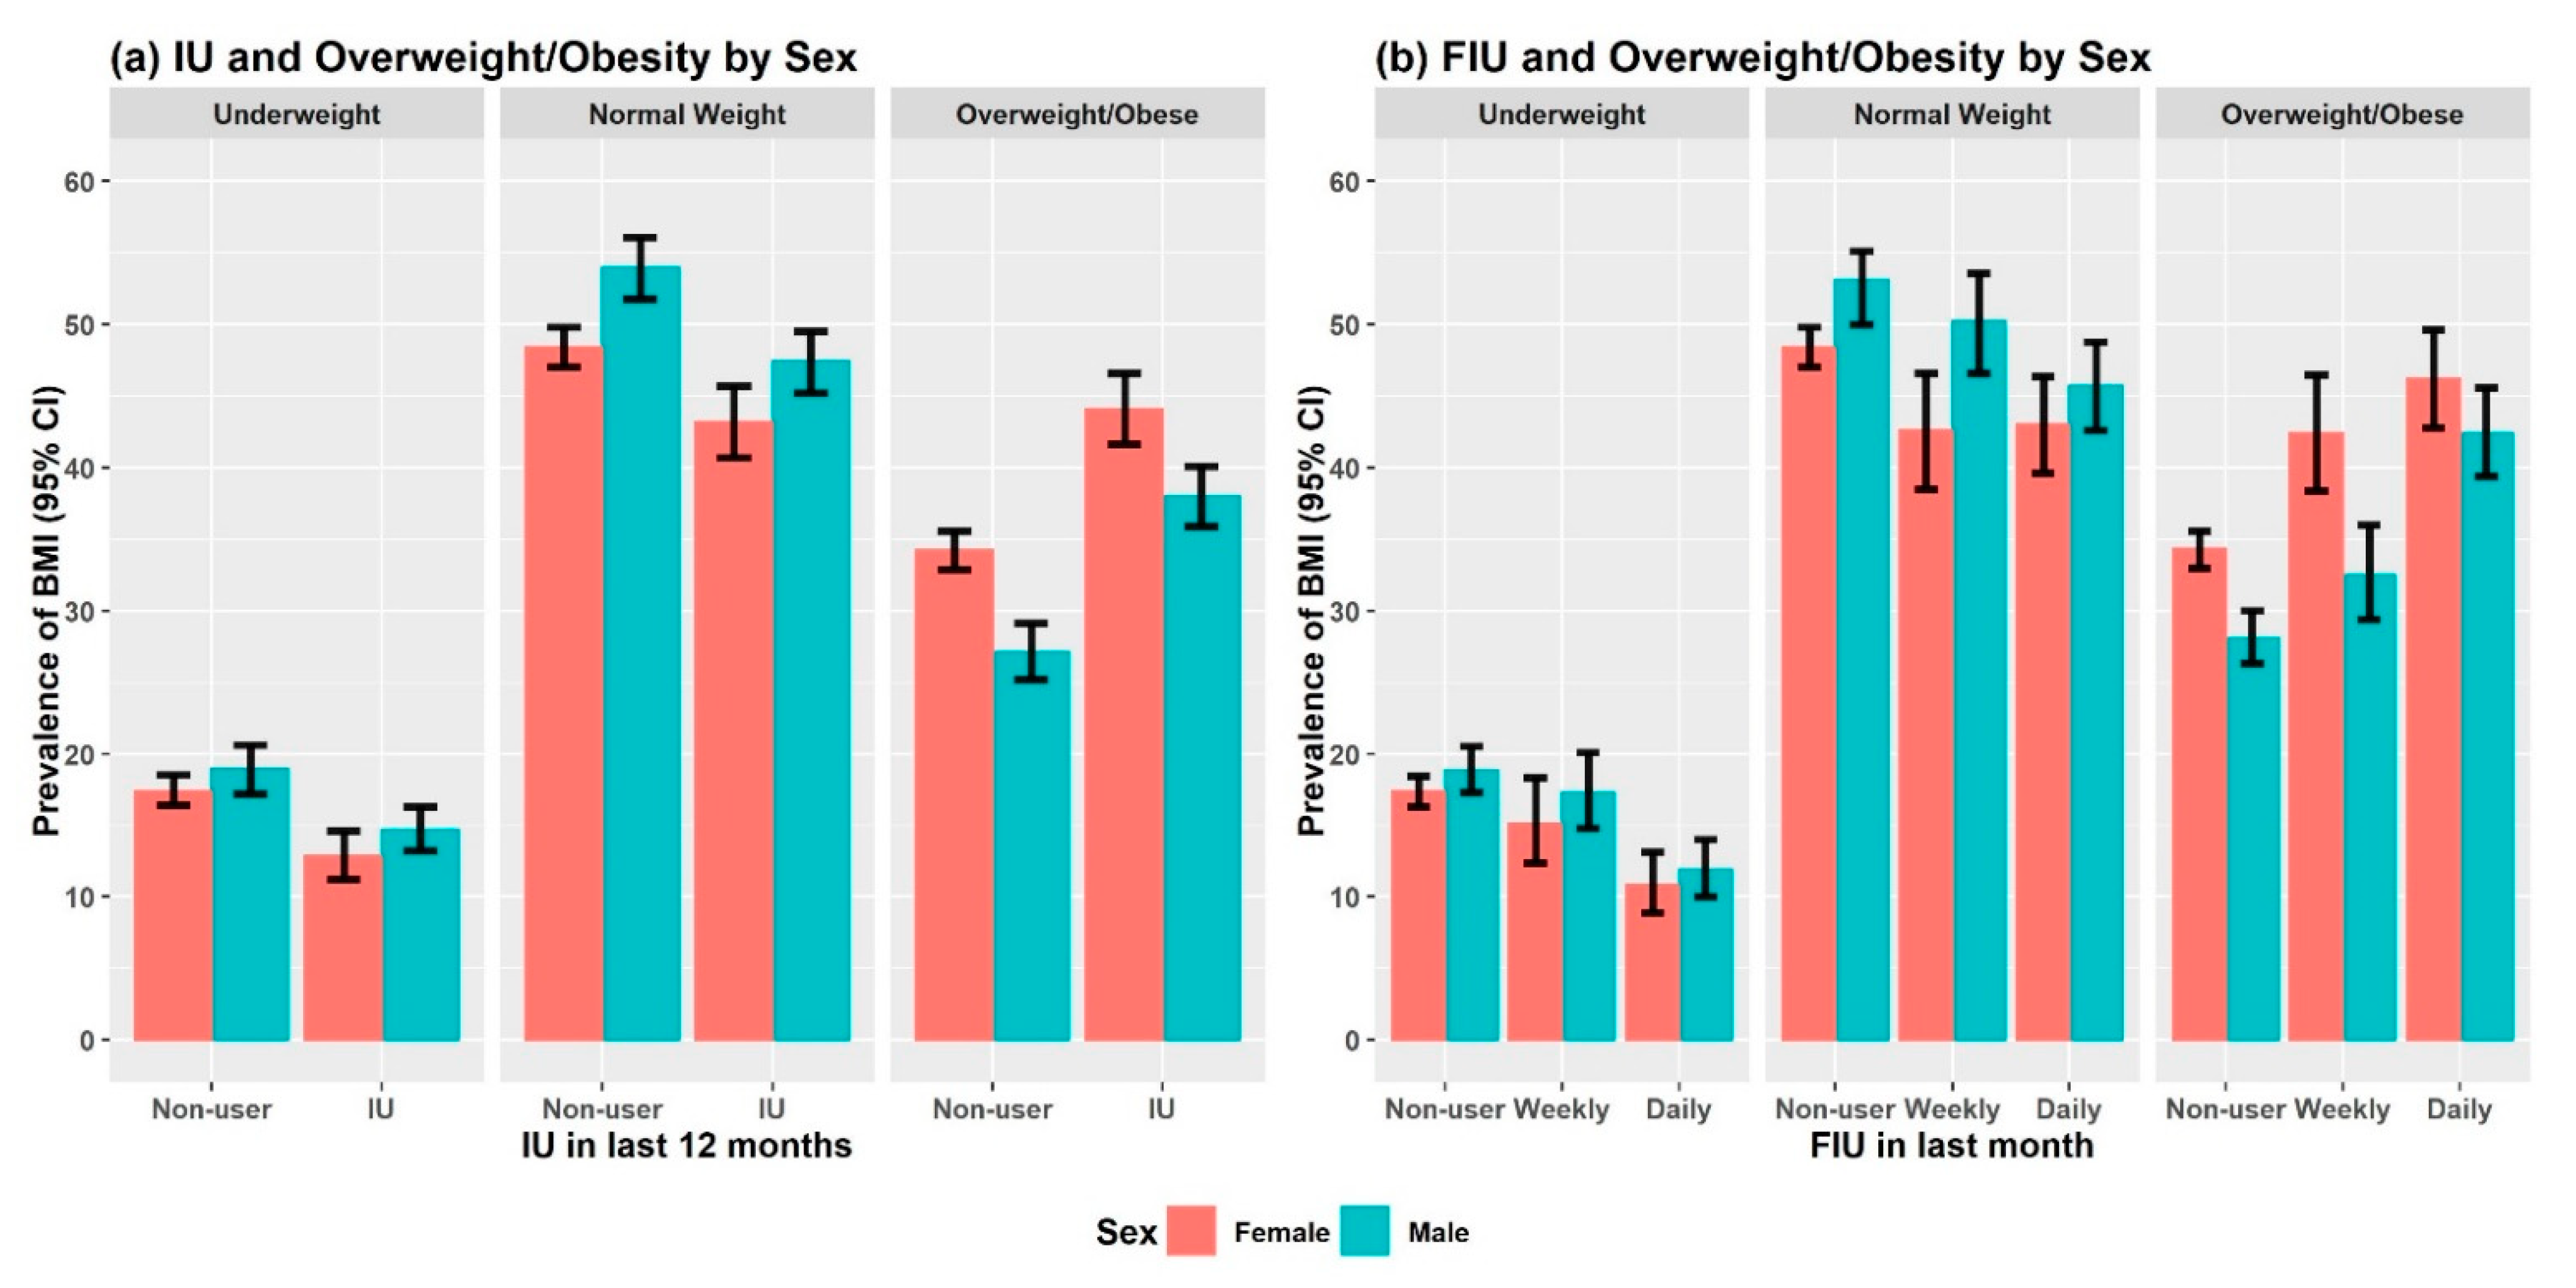
3.2. Weighted Prevalence of Overweight/Obesity and Internet Usages by Sample Characteristics

The univariate associations of overweight/obesity and internet usages are presented in Table 1, Table S1, and Figure 3. The overall prevalence of overweight/obesity was 35.0% (Table 1). The sex stratified weighted prevalence of BMI categories by internet usage was shown in Figure 3a,b. The prevalence of overweight/obesity by IU in the last 12 months was 38.0% (95% CI: 35.9%, 40.1%) for male and 44.1% (95% CI: 41.6%, 46.6%) for female, while the corresponding prevalence of overweight/obesity were 32.5% (95% CI: 29.4%, 36.0%) for males and 42.4% (95% CI: 38.4%, 46.5%) who used internet at least once in week, and 42.4% (95% CI: 39.4%, 45.6%) for males and 46.2% (95% CI: 42.8%, 49.6%) who used the internet almost every day in the last month.
Table 1 also shows that the prevalence of overweight/obesity was highest among those who were once married (41.6%), highly educated (42.2%), non-manual job holders (51.8%), richest (55.8%), weekly TV viewers (43.4%), urban residents (38.5%) and residents living in Hill (39.8%).
Of the 10,380 participants, 33.9% used internet in the last 12 months, and 13.1% used less than/at least once in a week, and 17.5% used internet almost every day in the last month (Table S1). The prevalence of IU in the last 12 months among males (49.4%) was higher compared to females (23.9%). People with higher education, wealth quintiles, and non-manual jobs had higher percentages of internet usage.

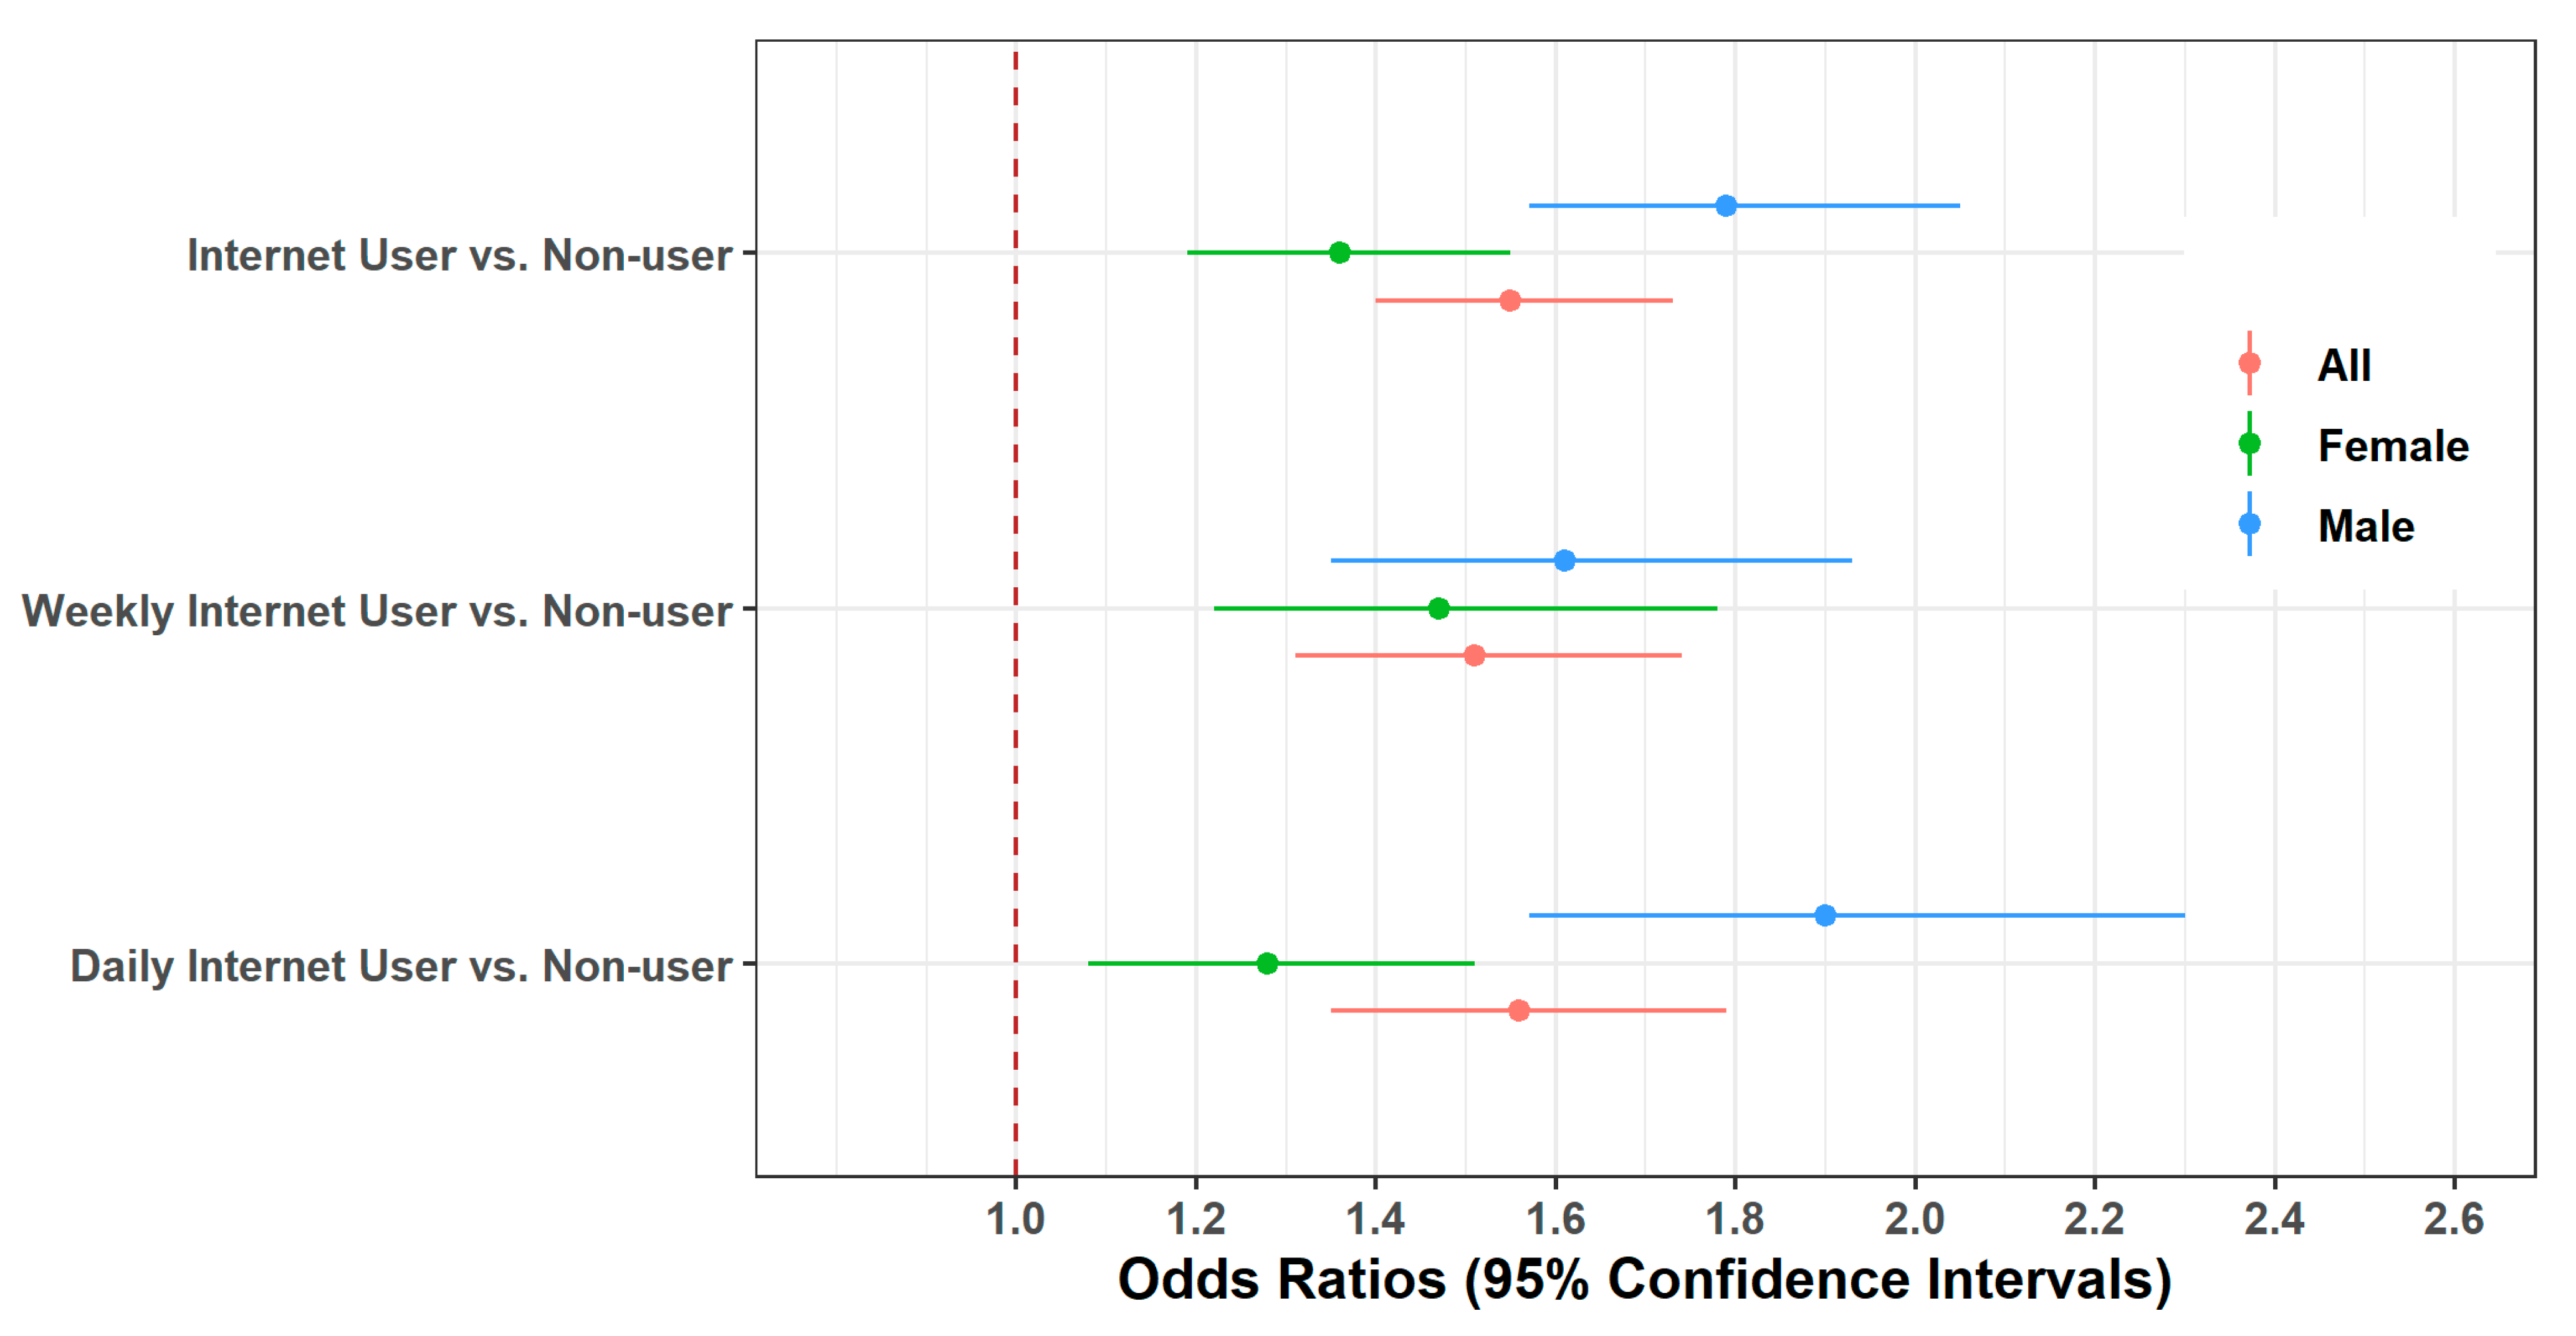
3.3. Associations between Internet Usage and Overweight/Obesity

The ordered logistic regression models were developed to estimate the total effect of internet usage on overweight/obesity after adjusting for age, sex, marital status, occupation, household wealth index, urbanity, and ecological zone and the effect modification of sex in the associations between internet usage and overweight/obesity (Figure 4). Results show that the risk of overweight/obesity was significantly 1.55 times higher (aOR: 1.55; 95% CI: 1.40, 1.73; p < 0.001) among those participants who used the internet compared to the individual who did not use the internet in the last 12 months or earlier. When using the augmented measure of exposure-FIU, the risk of overweight/obesity was significantly 1.51 times higher (aOR: 1.55; 95% CI: 1.31, 1.74; p < 0.001) among those participants who used the internet less than/at least once in a week compared to the participants who did not use the internet in the last month. Similarly, the participants who used internet almost every day in the last month (aOR: 1.56; 95% CI: 1.35, 1.79; p < 0.001) had 1.56 times higher risk of being overweight/obese compared to participants who did not use the internet (Figure 4).
When exploring the effect of modification by sex, we observed that the risk of overweight/obesity was significantly 1.79 (95% CI: 1.57, 2.05) times higher among males who used the internet in the last 12 months or earlier compared to males who did not use the internet. A similar association was observed among females who used the internet (aOR: 1.36; 95% CI: 1.19, 1.55). The differences of effect estimates were significantly different (p-difference < 0.001) between males and females. Likewise, we observed modification effect of sex in the association between FIU and overweight/obesity in Nepal (Figure 4). In other words, the risk of being overweight/obese was higher among males compared to females (p-difference = 0.002) who used the internet frequently in the last month.

3.4. Sensitivity Analyses

As a part of the sensitivity analyses, an additional analysis was conducted using the global cut-off of BMI categories, and we found similar results (data not shown).

4. Discussion

This is the first study to investigate the association between internet use and overweight/obesity and the moderating effects of this association, a novel finding, in a LMIC. Using data from a large, nationally representative survey in Nepal, we have found that in the adjusted analysis, internet use was associated with overweight/obesity compared to no internet use in the last 12 months. This was also true among those people who used the internet less than/at least once in a week or who used the internet almost every day in the last month, compared to people who did not use the internet. Furthermore, we found effect modification by sex—the likelihood of overweight/obesity was higher among males compared to females who used the internet frequently in the last month. These data have implications for public health measures to control overweight/obesity in LMICs.
After adjusting for age, sex, marital status, occupation, household wealth index, urbanicity, and ecological zone, our study showed that internet use, either less than/at least once in a week or almost every day, is independently and positively associated with increased odds of overweight/obesity. This is consistent with a recent systematic review and meta-analysis of nine cross-sectional studies from high and LMICs [8]. Furthermore, excessive internet use during weekends and leisure hours and/or frequency of internet use has a positive association with overweight/obesity [8,34], which is in agreement with our study. The widespread uptake of internet use across the world may be contributing to the rising rate of overweight and obesity globally [35,36], an observation that is supported by our study.
It is a matter of great concern that the increased dependency on the internet has initiated an apparent drift from physical mobility to a sedentary lifestyle [34,37]. Consistent with this, one of the greatest changes in the last decade in the Nepalese lifestyle is that internet use has increased substantially in more than half of the total population [26]. Possible mechanisms through which internet use may cause obesity include a disrupted sleeping schedule leading to weight gain as well as effects on an individuals’ regular food consumption [9,10,11]. Increasing consumption of snacks and sugar-sweetened beverage consumption during online gaming or watching movies online [19] may also result in excess fat accumulation [18] that needs further investigation. In addition, increasing computer usage contributes to obesity in households in other LMICs, including China, Ghana, and South Africa [29,38,39].
We explored the modification effect of sex on internet use and obesity. We found the odds of overweight/obesity was significantly higher among males who used the internet in the last 12 months or earlier compared to those who did not. A similar but weaker association was observed among females. This association modified by sex suggests that male internet users have a higher likelihood of obesity/overweight than female users. The relationship between the prevalence of overweight/obesity and internet use, is likely to be modified by other factors. Differences in occupation, income and lifestyle between men and women are also likely to influence the occurrence of overweight/obesity. In Nepal, men are more likely to be involved in white-collar jobs, eat high-energy diets, and play online games, while women are involved in physically demanding household chores, especially in rural areas [25,40,41,42]. This may partially explain the sex differences of overweight/obesity in this context. However, the effect modification of sex on the risk of overweight/obesity in LMICs during economic transition is complex and needs further delineation.
Whereas previous studies have examined the association between TV watching and obesity [43], examining internet use and obesity is a new finding, particularly in LMICs. TV viewing is a proxy for physical inactivity and has shown an association with numerous risk factors, including poor diet, lower socioeconomic status, obesity, smoking, or depressive symptoms [43]. Whereas TV viewing is more likely to occur for relaxation, internet use is greater as it can be either for relaxation (e.g., playing games, social media participation, online movies, reading newspapers and other internet-based recreational activities) or work (use of libraries, accessing work-related websites, email, banking, appointments, meeting, and other online work activities). Both uses are likely to result in an increase in physical inactivity. Internet use, however, is a more contemporary proxy for physical inactivity. In future, direct measures of ‘weekly screen time’ downloaded from internet-enabled devices rather than recalled estimates will be able to be used to examine the associations between internet use and obesity with greater precision.
The major strengths of our study include the use of a large, nationally representative sample from a survey in Nepal and using robust statistical methods to minimize bias (e.g., DAG to adjust for confounders). Importantly, we examined the association between internet use and overweight/obesity using both South Asian specific and WHO cut-offs. Our findings were consistent across both measures. Limitations include the fact that inferences about causality cannot be made due to cross-sectional data. In fact, the relationship between internet use and overweight/obesity may be bi-directional. Future prospective studies will be able to determine the strength and direction of the causal association between internet use and obesity.
We adjusted for all confounding variables available to us (e.g., socioeconomic status, occupation, urbanicity); however, other relevant variables were not collected as part of the survey (e.g., dietary intake and physical activity). We measured internet use as exposure in two ways: internet use in the last 12 months and an augmented measure of internet use frequency in the last month. It is possible that both measures are subject to recall bias. However, our results are consistent across both measures. The NDHS did not collect hourly exposure of internet use, which is another potential limitation. Thus, whether there is a dose–response effect of internet use on overweight/obesity—that is, more internet use leads to greater overweight/obesity, as suggested by our results—needs further detailed investigation.

5. Conclusions

In conclusion, internet use is potentially associated with overweight/obesity in Nepal. A comprehensive assessment of how sex interacts with internet usage and obesity suggests that the likelihood of overweight/obesity was higher among Nepalese males compared with females who used the internet frequently. Future research could investigate whether this is also the case in other LMICs in South East Asia. The implications of our findings are that future overweight/obesity interventions in Nepal, should discourage unnecessary internet use, particularly among males.

Supplementary Materials

The following are available online at https://0-www-mdpi-com.brum.beds.ac.uk/2411-5118/2/1/11/s1, Table S1: The weighted prevalence of internet use in the last 12 months and frequency of internet use in the last month by sample characteristics in Nepal 2016.; Table S2: Association between Internet Use (IU) in the Last 12 Months and Overweight/Obesity Modified by Sex.; Table S3: Association between Frequency Internet Use (FIU) in the Last Month and Overweight/Obesity Modified by Sex.

Author Contributions

Conceptualization, J.R. and R.I.; methodology, J.R., M.M.I., and R.I.; software, J.R.; validation, R.I. and J.O.; formal analysis, J.R.; data curation, J.R.; writing—original draft preparation, J.R., J.O., N.S., and M.M.I.; writing—review and editing, J.R., J.O., and R.I.; visualization, J.R.; supervision, R.I. All authors have read and agreed to the published version of the manuscript.

Funding

This research received no external funding.

Institutional Review Board Statement

The Nepal Health Research Council and the ICF Institutional Review Board (IRB), and the Ministry of Health, Ramshah Path, Kathmandu, Nepal, approved the NDHS 2016 survey protocol.

Informed Consent Statement

The 2016 NDHS required written consent from the household head to carry out the interviews and anemia testing. Informed consent was taken from each participant before the enrollment. For the current study, we obtained approval from ICF in June 2018 to use the de-identified data of the DHS online archive.

Data Availability Statement

All data files are available from the DHS program database: https://dhsprogram.com/data/dataset/Nepal_Standard-DHS_2016.cfm.

Acknowledgments

The authors are grateful to MEASURE DHS for granting access to the Nepal Demographic and Health Survey 2016 Data.

Conflicts of Interest

The authors declare no conflict of interest.

References

  1. Wang, Y.; Beydoun, M.A.; Min, J.; Xue, H.; Kaminsky, L.A.; Cheskin, L.J. Has the prevalence of overweight, obesity and central obesity levelled off in the United States? Trends, patterns, disparities, and future projections for the obesity epidemic. Int. J. Epidemiol. 2020, 49, 810–823. [Google Scholar] [CrossRef] [PubMed]
  2. Amugsi, D.A.; Dimbuene, Z.T.; Mberu, B.; Muthuri, S.; Ezeh, A.C. Prevalence and time trends in overweight and obesity among urban women: An analysis of demographic and health surveys data from 24 African countries, 1991–2014. BMJ Open 2017, 7. [Google Scholar] [CrossRef] [PubMed] [Green Version]
  3. Lin, T.C.; Courtney, T.K.; Lombardi, D.A.; Verma, S.K. Association between Sedentary Work and BMI in a U.S. National Longitudinal Survey. Am. J. Prev. Med. 2015, 49, e117–e123. [Google Scholar] [CrossRef] [Green Version]
  4. World Health Organization. Global Status Report on Noncommunicable Diseases 2014; WHO: Geneva, Switzerland, 2014. [Google Scholar]
  5. Dean, E.; Söderlund, A. What is the role of lifestyle behaviour change associated with non-communicable disease risk in managing musculoskeletal health conditions with special reference to chronic pain? BMC Musculoskelet. Disord. 2015, 16, 1–7. [Google Scholar] [CrossRef]
  6. Ezzati, M.; Riboli, E. Behavioral and dietary risk factors for noncommunicable diseases. N. Engl. J. Med. 2013, 369, 954–964. [Google Scholar] [CrossRef] [PubMed] [Green Version]
  7. Barrense-Dias, Y.; Berchtold, A.; Akre, C.; Surís, J.C. The relation between internet use and overweight among adolescents: A longitudinal study in Switzerland. Int. J. Obes. 2016, 40, 45–50. [Google Scholar] [CrossRef] [PubMed]
  8. Aghasi, M.; Matinfar, A.; Golzarand, M.; Salari-Moghaddam, A.; Ebrahimpour-Koujan, S. Internet Use in Relation to Overweight and Obesity: A Systematic Review and Meta-Analysis of Cross-Sectional Studies. Adv. Nutr. 2019, 11, 349–356. [Google Scholar] [CrossRef]
  9. Chaput, J.P.; Després, J.P.; Bouchard, C.; Tremblay, A. The association between sleep duration and weight gain in adults: A 6-year prospective study from the Quebec Family Study. Sleep 2008, 31, 517–523. [Google Scholar] [CrossRef] [Green Version]
  10. Lin, P.H.; Lee, Y.C.; Chen, K.L.; Hsieh, P.L.; Yang, S.Y.; Lin, Y.L. The relationship between sleep quality and internet addiction among female college students. Front. Neurosci. 2019, 13. [Google Scholar] [CrossRef] [PubMed] [Green Version]
  11. Do, Y.K.; Shin, E.; Bautista, M.A.; Foo, K. The associations between self-reported sleep duration and adolescent health outcomes: What is the role of time spent on Internet use? Sleep Med. 2013, 14, 195–200. [Google Scholar] [CrossRef]
  12. Tooth, L.; Moss, K.; Hockey, R.; Mishra, G.D. Adherence to screen time recommendations for Australian children aged 0–12 years. Med. J. Aust. 2019, 211, 181–182. [Google Scholar] [CrossRef] [Green Version]
  13. Eliacik, K.; Bolat, N.; Koçyiğit, C.; Kanik, A.; Selkie, E.; Yilmaz, H.; Catli, G.; Dundar, N.O.; Dundar, B.N. Internet addiction, sleep and health-related life quality among obese individuals: A comparison study of the growing problems in adolescent health. Eat. Weight Disord. 2016, 21, 709–717. [Google Scholar] [CrossRef]
  14. Tsai, M.C.; Strong, C.; Chen, W.T.; Lee, C.T.; Lin, C.Y. Longitudinal impacts of pubertal timing and weight status on adolescent internet use: Analysis from a cohort study of taiwanese youths. PLoS ONE 2018, 13, e0197860. [Google Scholar] [CrossRef] [Green Version]
  15. Tsitsika, A.K.; Andrie, E.K.; Psaltopoulou, T.; Tzavara, C.K.; Sergentanis, T.N.; Ntanasis-Stathopoulos, I.; Bacopoulou, F.; Richardson, C.; Chrousos, G.P.; Tsolia, M. Association between problematic internet use, socio-demographic variables and obesity among European adolescents. Eur. J. Public Health 2016, 26, 617–622. [Google Scholar] [CrossRef] [Green Version]
  16. Goel, D.; Subramanyam, A.; Kamath, R. A study on the prevalence of internet addiction and its association with psychopathology in Indian adolescents. Indian J. Psychiatry 2013, 55, 140–143. [Google Scholar] [CrossRef]
  17. Bener, A.; Bhugra, D. Lifestyle and depressive risk factors associated with problematic internet use in adolescents in an Arabian Gulf culture. J. Addict. Med. 2013, 7, 236–242. [Google Scholar] [CrossRef] [PubMed]
  18. Bradbury, K.M.; Turel, O.; Morrison, K.M. Electronic device use and beverage related sugar and caffeine intake in US adolescents. PLoS ONE 2019, 14. [Google Scholar] [CrossRef] [PubMed]
  19. Haque, M.; McKimm, J.; Sartelli, M.; Samad, N.; Haque, S.Z.; Bakar, M.A. A narrative review of the effects of sugar-sweetened beverages on human health: A key global health issue. J. Popul. Ther. Clin. Pharmacol. 2020, 27, e76–e103. [Google Scholar] [CrossRef]
  20. Aryal, K.K.; Mehata, S.; Neupane, S.; Vaidya, A.; Dhimal, M.; Dhakal, P.; Rana, S.; Bhusal, C.L.; Lohani, G.R.; Paulin, F.H.; et al. The burden and determinants of non communicable diseases risk factors in Nepal: Findings from a nationwide STEPS survey. PLoS ONE 2015, 10, e0134834. [Google Scholar] [CrossRef]
  21. Rawal, L.B.; Kanda, K.; Mahumud, R.A.; Joshi, D.; Mehata, S.; Shrestha, N.; Poudel, P.; Karki, S.; Renzaho, A. Prevalence of underweight, overweight and obesity and their associated risk factors in Nepalese adults: Data from a nationwide survey, 2016. PLoS ONE 2018, 13, e0205912. [Google Scholar] [CrossRef] [PubMed]
  22. Xu, C.-X.; Zhu, H.-H.; Fang, L.; Hu, R.-Y.; Wang, H.; Liang, M.-B.; Zhang, J.; Lu, F.; He, Q.-F.; Wang, L.-X.; et al. Gender disparity in the associations of overweight/obesity with occupational activity, transport to/from work, leisure-time physical activity, and leisure-time spent sitting in working adults: A cross-sectional study. J. Epidemiol. 2017, 27, 401–407. [Google Scholar] [CrossRef]
  23. Poobalan, A.; Aucott, L. Obesity Among Young Adults in Developing Countries: A Systematic Overview. Curr. Obes. Rep. 2016, 5, 2–13. [Google Scholar] [CrossRef] [Green Version]
  24. Dixon, L.J.; Correa, T.; Straubhaar, J.; Covarrubias, L.; Graber, D.; Spence, J.; Rojas, V. Gendered Space: The digital divide between male and female users in internet public access sites. J. Comput. Commun. 2014, 19, 991–1009. [Google Scholar] [CrossRef] [Green Version]
  25. Su, W.; Han, X.; Jin, C.; Yan, Y.; Potenza, M.N. Are males more likely to be addicted to the internet than females? A meta-analysis involving 34 global jurisdictions. Comput. Human Behav. 2019, 99, 86–100. [Google Scholar] [CrossRef]
  26. Mis, N. Nepal Telecommunications Authority. 2019. Volume 174, pp. 1–11. Available online: https://nta.gov.np/wp-content/uploads/MIS-2076-Baisakh.pdf (accessed on 10 July 2020).
  27. Ministry of Health, Nepal; New ERA; ICF. Nepal Demographic and Health Survey 2016; Ministry of Health, Nepal: Kathmandu, Nepal, 2017.
  28. Al Kibria, G.M. Prevalence and factors affecting underweight, overweight and obesity using Asian and World Health Organization cutoffs among adults in Nepal: Analysis of the Demographic and Health Survey 2016. Obes. Res. Clin. Pract. 2019, 13, 129–136. [Google Scholar] [CrossRef]
  29. Bishwajit, G. Household wealth status and overweight and obesity among adult women in Bangladesh and Nepal. Obes. Sci. Pract. 2017, 3, 185–192. [Google Scholar] [CrossRef]
  30. Matusitz, J.; McCormick, J. Sedentarism: The effects of internet use on human obesity in the United States. Soc. Work Public Health 2012, 27, 250–269. [Google Scholar] [CrossRef]
  31. Shrier, I.; Platt, R.W. Reducing bias through directed acyclic graphs. BMC Med. Res. Methodol. 2008, 8, 1–15. [Google Scholar] [CrossRef] [PubMed] [Green Version]
  32. Rana, J.; Ahmmad, Z.; Sen, K.K.; Bista, S.; Islam, R.M. Socioeconomic Differentials in Hypertension based on JNC7 and ACC/AHA 2017 Guidelines Mediated by Body Mass Index: Evidence from Nepal Demographic and Health Survey. PLoS ONE 2020, 15. [Google Scholar] [CrossRef] [PubMed]
  33. R Core Team. R: A Language and Environment for Statistical Computing 2020; R Core Team: Vienna, Austria, 2020. [Google Scholar]
  34. Vandelanotte, C.; Sugiyama, T.; Gardiner, P.; Owen, N. Associations of leisure-time internet and computer use with overweight and obesity, physical activity and sedentary behaviors: Cross-sectional study. J. Med. Internet Res. 2009, 11, 1–8. [Google Scholar] [CrossRef] [PubMed]
  35. Afshin, A.; Forouzanfar, M.H.; Reitsma, M.B.; Sur, P.; Estep, K.; Lee, A.; Marczak, L.; Mokdad, A.H.; Moradi-Lakeh, M.; Naghavi, M.; et al. Health effects of overweight and obesity in 195 countries over 25 years. N. Engl. J. Med. 2017, 377, 13–27. [Google Scholar] [CrossRef] [PubMed]
  36. Clement, J. Internet Usage Worldwide—Statistics & Facts; Statistica Inc.: New York, NY, USA, 2015. [Google Scholar]
  37. Meral, G. Is digital addiction a reason for obesity? Ann. Med. Res. 2018, 25, 472. [Google Scholar] [CrossRef]
  38. Gaskin, C.J.; Orellana, L. Factors associated with physical activity and sedentary behavior in older adults from six Lowand middle-income countries. Int. J. Environ. Res. Public Health 2018, 15, 908. [Google Scholar] [CrossRef] [Green Version]
  39. Kim, J.H.; Lau, C.H.; Cheuk, K.K.; Kan, P.; Hui, H.L.C.; Griffiths, S.M. Brief report: Predictors of heavy Internet use and associations with health-promoting and health risk behaviors among Hong Kong university students. J. Adolesc. 2010, 33, 215–220. [Google Scholar] [CrossRef] [PubMed]
  40. Elder, S. Labour Market Transitions of Young Women and Men in Sub-Saharan Africa; Series No. 9; International Labour Organization: Geneva, Switzerland, 2014. [Google Scholar]
  41. Pedisic, Z.; Shrestha, N.; Loprinzi, P.D.; Mehata, S.; Mishra, S.R. Prevalence, patterns, and correlates of physical activity in Nepal: Findings from a nationally representative study using the Global Physical Activity Questionnaire (GPAQ). BMC Public Health 2019, 19, 1–8. [Google Scholar] [CrossRef] [PubMed]
  42. Bodner-Adler, B.; Shrivastava, C.; Bodner, K. Risk factors for uterine prolapse in Nepal. Int. Urogynecol. J. 2007, 18, 1343–1346. [Google Scholar] [CrossRef]
  43. Rosiek, A.; Maciejewska, N.F.; Leksowski, K.; Rosiek-Kryszewska, A.; Leksowski, Ł. Effect of television on obesity and excess of weight and consequences of health. Int. J. Environ. Res. Public Health 2015, 12, 9408–9426. [Google Scholar] [CrossRef] [PubMed] [Green Version]
Figure 1. Flowchart of the analytic sample selection process.
Sexes 02 00011 g001
Figure 2. A directed acyclic graph (DAG) for adjusting confounders in the associations between internet usages and overweight/obesity. Overweight/obesity was the outcome variable, and internet usages were the exposure variable. Minimal sufficient adjustment sets for estimating the total effect of internet usages on body mass index (BMI) contains age, ecological zone, education, sex, occupation, urbanicity, watching television, and wealth quintiles. This figure was constructed through dagitty web app (Online access: http://dagitty.net/mVo4Gb9).
Sexes 02 00011 g002
Figure 3. Sex stratified weighted prevalence of underweight, normal weight and overweight/obesity by internet usage.
Sexes 02 00011 g003
Figure 4. Associations between internet usage and overweight/obesity (South Asian Cut-off) modified by sex in Nepali adult populations 2016 OLR models without interaction terms were adjusted for age, sex, marital status, occupation, household wealth index, urbanicity, and ecological zone. Detailed results of ordered logistic regression (OLR) models I-VI are in Supplementary Tables S2 and S3.
Sexes 02 00011 g004
Table 1. The weighted prevalence of underweight, normal weight, and overweight/obesity (South Asian Cut-off) by sample characteristics in Nepal 2016.
CharacteristicsSample Distribution (%)Prevalence of (%) Underweight, Normal Weight, and Overweight/Obesity
UnderweightNormalOverweight/
Obesity
p-Value
Overall10380 (100)16.5 (1722)48.5 (5243)35.0(3415)-
Age group
15–244048 (38.2)25.157.117.8<0.001
25–342950 (29.0)11.746.541.8
35–442417 (23.7)10.739.350.0
45–49965 (9.1)11.043.445.6
Sex
Male3995 (39.0)16.850.732.5<0.001
Female6385 (61.0)16.347.136.6
Marital status
Unmarried2609 (25.4)27.856.915.3<0.001
Ever Married7771 (74.6)12.745.741.6
Number of under five years old child
No under 55892 (57.0)15.547.736.8<0.001
One2910 (27.9)16.048.535.5
Two1241 (11.9)20.651.827.6
Three or more337 (3.2)23.452.424.2
Educational qualification
No education2524 (24.0)17.850.731.5<0.001
Primary1783 (17.7)17.346.136.6
Secondary4325 (40.9)17.849.033.2
Higher1748 (17.4)10.847.042.2
Occupational status
Unemployed2579 (25.3)21.446.132.5<0.001
Non-manual job2080 (21.7)8.339.951.8
Agriculture4436 (40.0)17.454.228.4
Manual job1285 (13.0)17.850.232.0
Wealth index
Poorest2109 (16.6)18.659.522.0<0.001
Poorer2088 (18.8)20.552.327.2
Middle2106 (20.1)19.751.428.9
Richer2204 (23.1)15.947.636.5
Richest1873 (21.4)9.035.255.8
Current tobacco use (any type)
No7631 (73.9)17.047.535.50.014
Yes2749 (26.1)15.151.633.3
Coffee, tea, cola, or other drink (Caffeine)
No9809 (94.2)16.848.934.3<0.001
Yes571 (5.8)10.943.046.1
Frequency of watching television
Not at all2901 (25.7)21.554.024.5<0.001
Less than once a week2644 (24.2)17.354.228.5
At least once a week4835 (50.1)13.643.043.4
Urbanicity
Urban6736 (63.0)15.546.038.5<0.001
Rural3644 (37.0)18.352.828.9
Ecological zone
Mountain751 (6.1)12.056.131.9<0.001
Hill4668 (43.6)11.648.639.8
Terai4961 (50.3)21.347.631.1
Internet use (IU) at the last 12 months or earlier
No7134 (66.1)17.950.032.1<0.001
Yes3246 (33.9)13.945.640.5
Frequency of internet use (FIU) in the last month
Non-user7472 (69.4)17.849.932.3<0.001
Less than/at least once in a week1324 (13.1)16.447.036.6
Almost every day1584 (17.5)11.444.544.1
Publisher’s Note: MDPI stays neutral with regard to jurisdictional claims in published maps and institutional affiliations.

