Improving Speech Quality for Hearing Aid Applications Based on Wiener Filter and Composite of Deep Denoising Autoencoders


1
Key Laboratory of Modern Teaching Technology, Ministry of Education, Shaanxi Normal University, Xi’an 710062, China
2
School of Computer Science, Shaanxi Normal University, No.620, West Chang’an Avenue, Chang’an District, Xi’an, China
*
Author to whom correspondence should be addressed.
Signals 2020, 1(2), 138-156; https://0-doi-org.brum.beds.ac.uk/10.3390/signals1020008
Submission received: 10 July 2020
/
Revised: 13 August 2020
/
Accepted: 1 September 2020
/
Published: 21 October 2020
Abstract
:In hearing aid devices, speech enhancement techniques are a critical component to enable users with hearing loss to attain improved speech quality under noisy conditions. Recently, the deep denoising autoencoder (DDAE) was adopted successfully for recovering the desired speech from noisy observations. However, a single DDAE cannot extract contextual information sufficiently due to the poor generalization in an unknown signal-to-noise ratio (SNR), the local minima, and the fact that the enhanced output shows some residual noise and some level of discontinuity. In this paper, we propose a hybrid approach for hearing aid applications based on two stages: (1) the Wiener filter, which attenuates the noise component and generates a clean speech signal; (2) a composite of three DDAEs with different window lengths, each of which is specialized for a specific enhancement task. Two typical high-frequency hearing loss audiograms were used to test the performance of the approach: Audiogram 1 = (0, 0, 0, 60, 80, 90) and Audiogram 2 = (0, 15, 30, 60, 80, 85). The hearing-aid speech perception index, the hearing-aid speech quality index, and the perceptual evaluation of speech quality were used to evaluate the performance. The experimental results show that the proposed method achieved significantly better results compared with the Wiener filter or a single deep denoising autoencoder alone.
1. Introduction
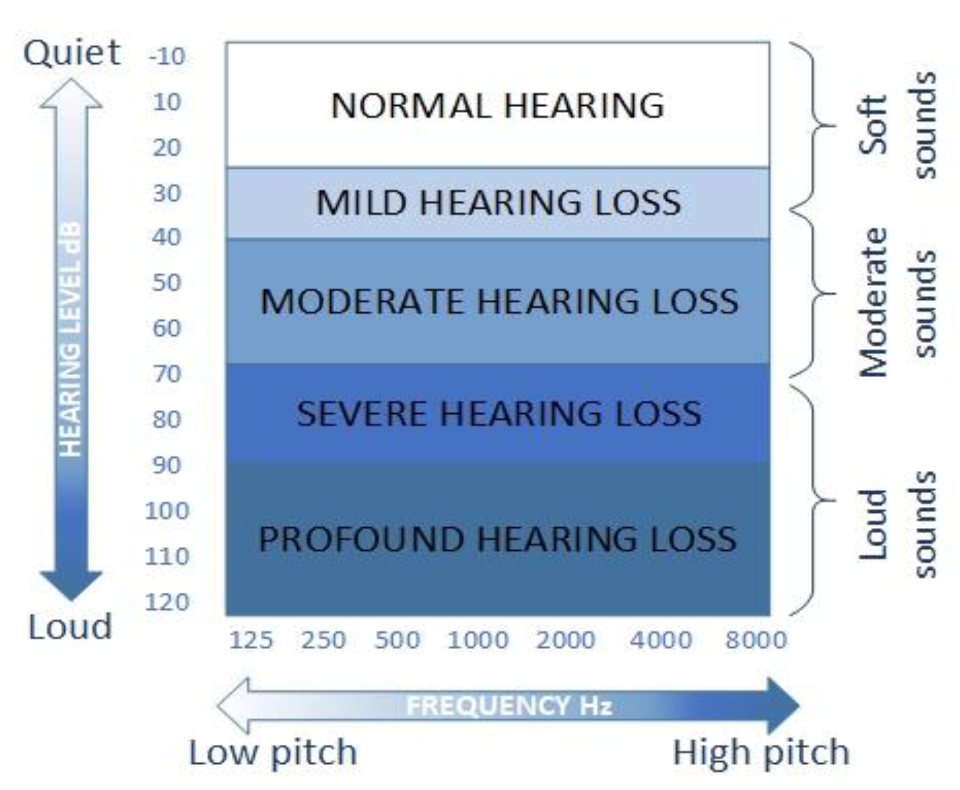
Approximately 10% of the population suffers from some degree of hearing loss (HL) (Figure 1) due to overexposure to noise—both long-term, repeated exposure to noise and one-time exposure to a powerful sound that causes damage to the auditory system [1]. According to the World Health Organization (WHO), in 2018 [2,3], roughly 466 million people had HL.\, and it is estimated that over 900 million people will have hearing loss by 2050. The usage of hearing aids and amplifying devices is the most common treatment method. However, only a small percentage of potential wearers use a hearing aid due to the general problem of enhancing speech in a noisy environment. One of the major complaints from hearing aid wearers involves the devices’ lack of versatility—they amplify all sounds rather than just those the wearer wants to hear [4,5]. The recent development of commercial hearing aids with digital signal processing capabilities has allowed the development of advanced signal processing techniques to aid the hearing impaired. The perception and translation of speech in a noisy environment are difficult, even when using state-of-the-art devices [6], which necessitates the use of effective and bettermethods to benefit people with hearing difficulties [7,8].
Multiple studies have revealed challenges in understanding the real causes and effects related to hearing aids. Recently, deep learning offers great promise for addressing these challenges, and many algorithms based on speech enhancement (SE) can be found in the literature and have attracted great attention, such as-. Wiener filter based on prior SNR estimation [9]. This study used a directional microphone and a time variant based on producing noisy mixture signals to enhance speech. However, this method has a limitation in the case of signal components coming from diverse directions, which may harm the speech signal and thus result in a significant decline in the objective speech quality measurement [10]. The spectral subtraction [11] method evaluates the noise spectrum, and it decreases the computational complexity and memory constraint exclusion of voice activity recognition. This method frequently results in an unpleasant artifact called musical noise, which makes the audio sound as though it was recorded underwater. The Karhunen Lo’eve transform (KLT) approach [12] has been successfully used for speech communication, providing the best approximation for a stochastic signal under the condition that its rank is fixed. However, since the KLT does not consider noise, its ability to suppress noise is very poor [13].
Recently, deep neural networks (DNNs) [14,15] have attracted great attention among hearing aid researchers. The denoising autoencoder (DAE) and its deep version the DDAE were proposed in [16,17] for noise reduction and speech enhancement. The experimental outcomes suggest that compared with the traditional speech enhancement methods, the DDAE model can effectively reduce the noise in speech, improving the speech quality and signal-to-noise ratio. Lai et al. [15] used the DDAE model in cochlear implant (CI) simulation to improve the intelligibility of voice coding [18] and the actual CI receiver. Meng et al. [12] introduced a separate deep autoencoder (SDAE) to estimate the clean speech and noise spectra by minimizing the total reconstruction error of the noisy speech spectrum. By adjusting the estimated clean speech spectrum and the unknown noise parameters in the DAE, one can reach a stationary point to minimize the total reconstruction error of the noisy speech spectrum. Deep recurrent neural networks (DRNNs) were proposed in [19], which added the recurrent structure of the speech denoising autoencoder (SDAE) [20] along with a discriminative term.
Furthermore, a multi-modular neural network (MNN) was proposed in [11], which includes a particular speech enhancement module as an expert, with a speech autoencoder (AE) as the referee. However, a DAE with a fixed number of input layers cannot extract contextual information because of the local minima, the poor performance of the network in the unknown signal-to-noise ratios [14,15,21], the poor generalization, and the fact that the enhanced output has some residual noise. In the present paper, a new hybrid-composite system for hearing aid applications is proposed, called HC-DDAEs. The system encompasses two stages: (1) the Wiener filter, which attenuates the noise component and generates a clean speech signal; (2) a composite of three multilayer DDAEs with different frames for each DDAE, which map the output of the Wiener filter to clean features and enhance the speech based on the patient’s hearing loss. The composite DDAEs include one, three, and five window lengths for each DDAE level, respectively. The output of each DDAE is connected to the input of the next DDAE, each of which is specified for an enhancement subtask of the complete enhancement. This method takes into account a hierarchical learning structure, which uses a smaller dedicated frame compared to a single DDAE to complete specific enhancement tasks rather than a single DDAE with a fixed number of layers to complete general enhancement tasks. The proposed composite DDAEs divide the training set into subsets that correspond to distinct subtasks. Each DDAE works as an expert in a specific enhancement task while its adjacent frames decide which DDAE should be used for each training case. The rest of this paper is organized as follows: Section 2 introduces the background knowledge about noise reduction based on autoencoders. Section 3 gives the background and context of auditory perception and hearing aids. Section 4 presents the proposed hearing aid system. Section 5 and Section 6 describe our experimental setup and evaluation methodology for this study, respectively. Finally, Section 7 presents the conclusion of this work.
2. Denoising Autoencoder Based Noise Reduction
Noise reduction (NR) aims to reduce noise components from noisy speech to generate enhanced speech with improved SNR, intelligibility, and perceptual quality. Let’s say that:
where and are the noisy-clean speech signals, respectively, and denotes the noise added to in the time domain. In the spectral domain, the noisy speech spectrum, has the below expression:
where is the discrete-time index . NR approaches restore the clean speech from noisy speech [18].
2.1. Denoising Autoencoder
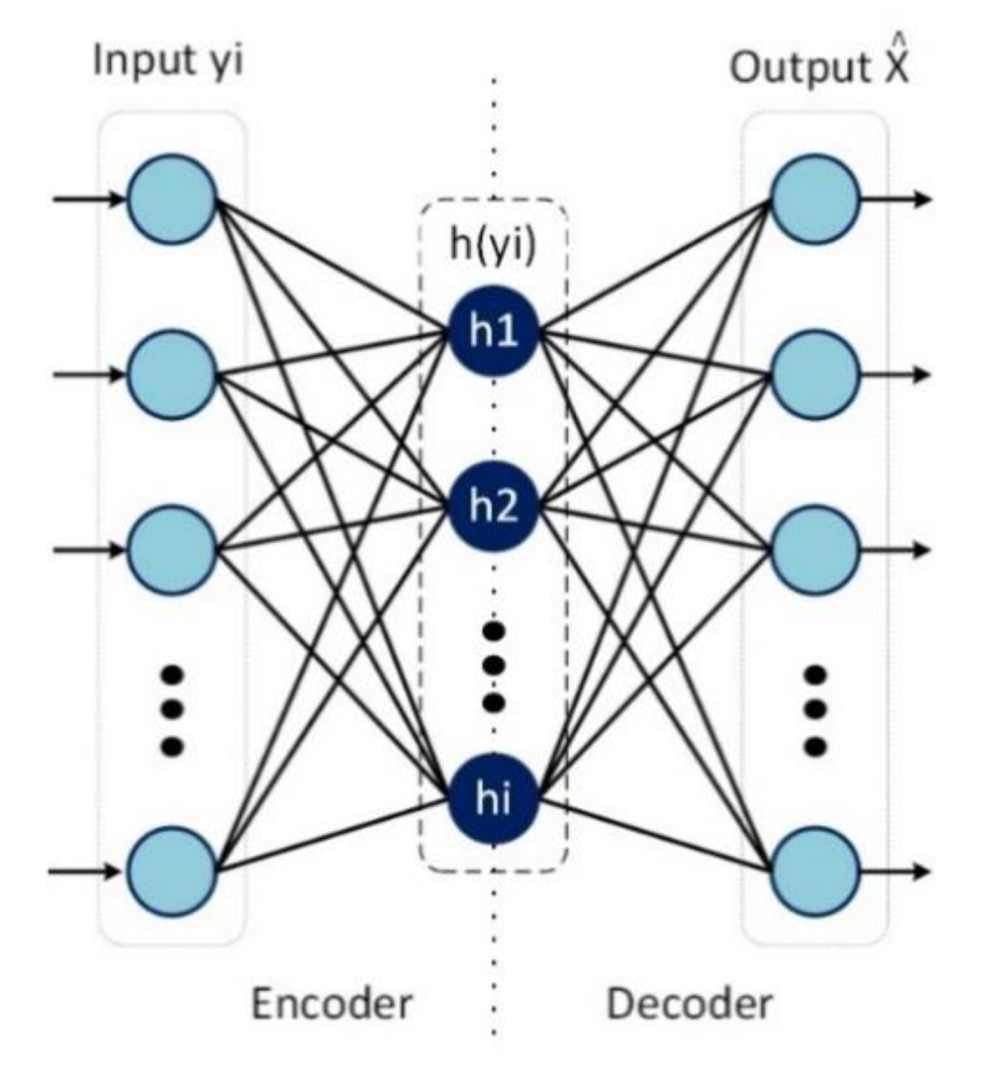
An autoencoder is a kind of feed-forward neural network with a thin middle layer (bottleneck). It attempts to reproduce the input at the output [22], as shown in Figure 2. It usually used for novelty detection and deep neural architectures for robust feature extraction and classification. The use of DAE and its deep version DDAE to perform NR was initially proposed by Lu et al. [17].
The NR method based on a DDAE covers two phases: namely, training (offline) phase and the testing (online) phase [15,17,22,23]. In the offline step, a pair of noisy and clean speech signals are prepared to represent the input and output of the DDAE model, respectively. Through this processing, the DDAE model can learn the statistical differences between clean and noisy speech. Let be the input for the DDAE model with the the hidden layers:
where refers to the connection weight matrix, are the bias vectors for the hidden layers. denotes the frame index for the short-time-Fourier transform (STFT) of the (training) vector. is the vector containing the logarithmic amplitudes of enhanced speech corresponding to the noisy counterpart . The nonlinear function of the hidden neuron is the logistic function defined as:
where the logistic function and the identity function [23] are used in the hidden layer and the output layer separately. is the steepness, and is the output of each unit in the neural network. If is a huge positive number, then the output is approximately 1, and if is a very negative number, then the output is approximately 0. In the testing (online) phase, the parameters of the DDAE are obtained from the training phase to transfer to clean speech signal . Additionally, the DDAE in this phase does not learn about the noise signal as the types of noise in both phases are different [13,17].
2.2. Effect of Depth (Layer by Layer Pre-Training)
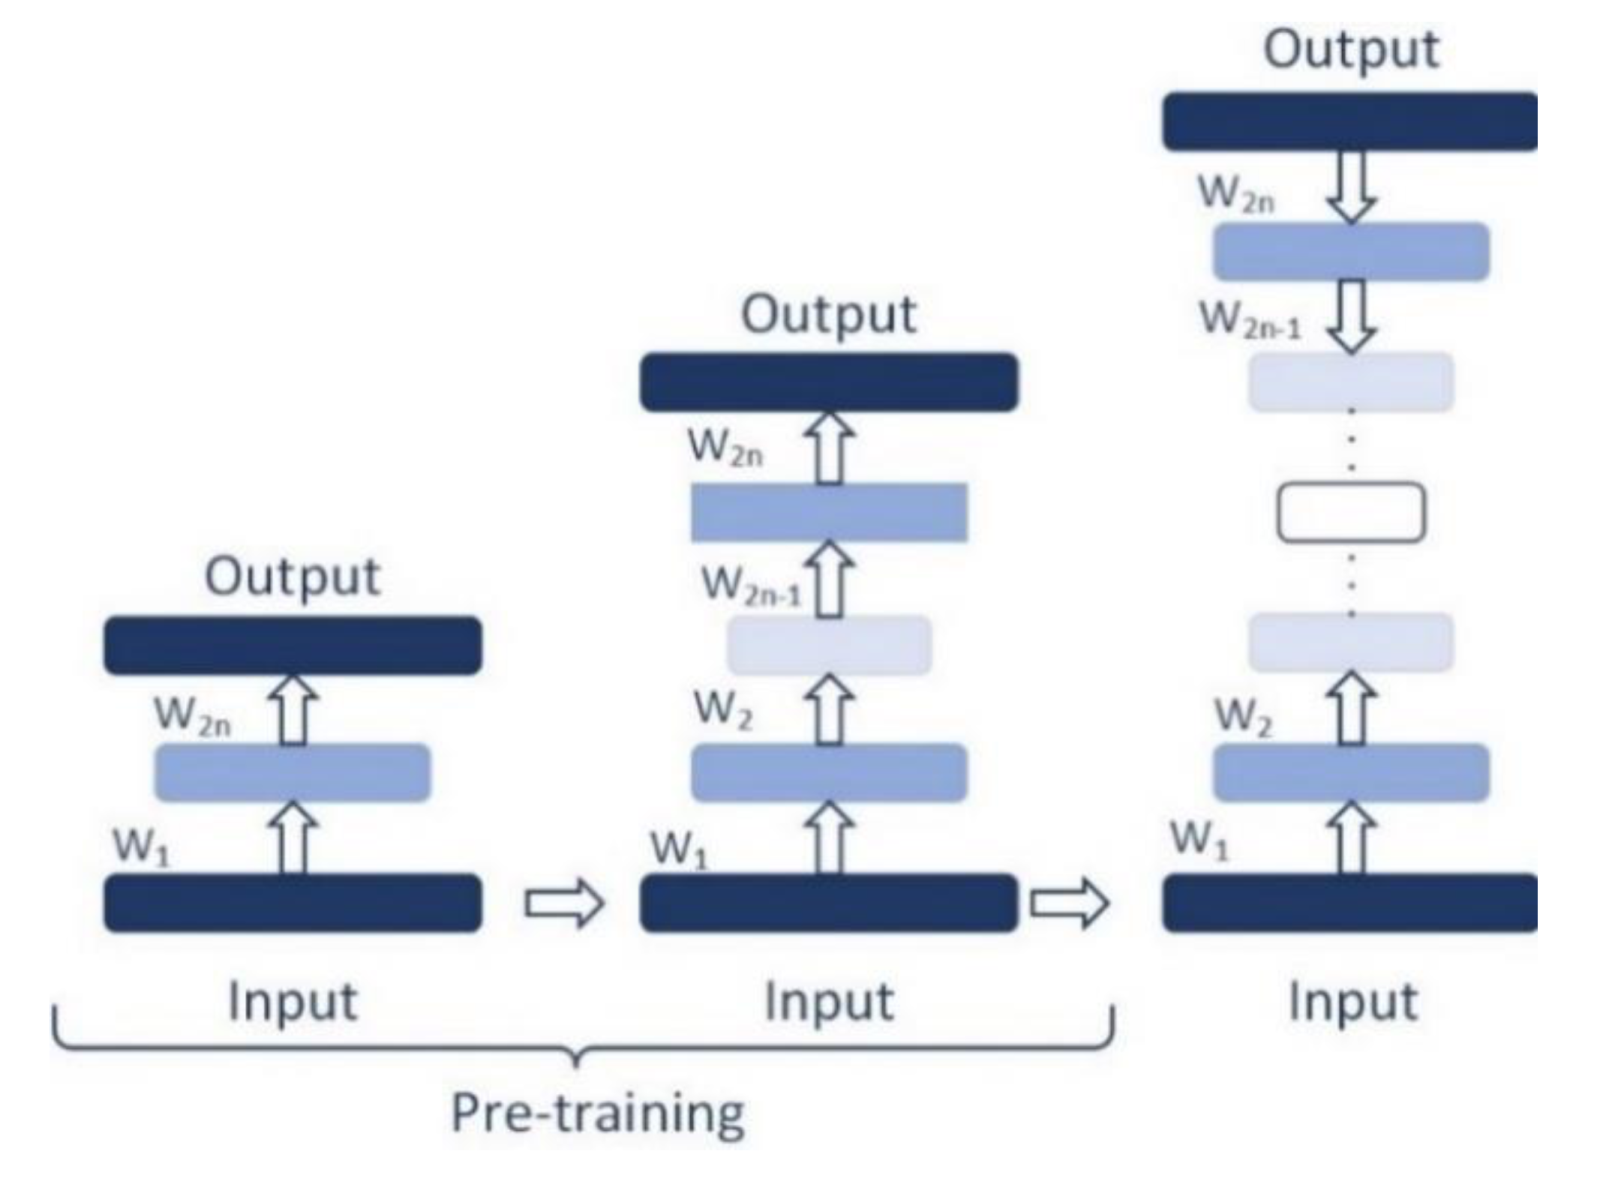
A deep neural network is usually more potent than a shallow neural network in order to reconstruct the nonlinear relationship between the input and output. In most deep learning studies, the general conclusion is that increasing the depth of the neural network pattern always helps performance either for pattern classifications or for encoding. Similarly, we increased the system’s depth by stacking several AEs from a DAE and carrying out speech denoising experiments. However, with the number of hidden layers, the training of the network becomes more difficult due to the local minima. Therefore, as a way of overcoming this issue, layer by layer pre-training is adopted [24], which is an unsupervised learning process (Figure 3). The initial values of the weight matrix and the deviation vector are pre-trained and computed layer by layer where the input layer and the first hidden layer consider as the DAE and training. Then, the first hidden layer is considered as the input layer for the second DAE, which constructs the second DAE with the second hidden layer and so on, until the i- DAE is trained. After the neural network training is completed, the weight matrix and deviation vector of a single neural network are taken to be the initial value of DDAE, and the calculated value of the DDAE sequence (fine-tuning) [25], respectively. More details can be found in [24].
3. Speech Perception and Hearing Aids
3.1. Hearing and Perception
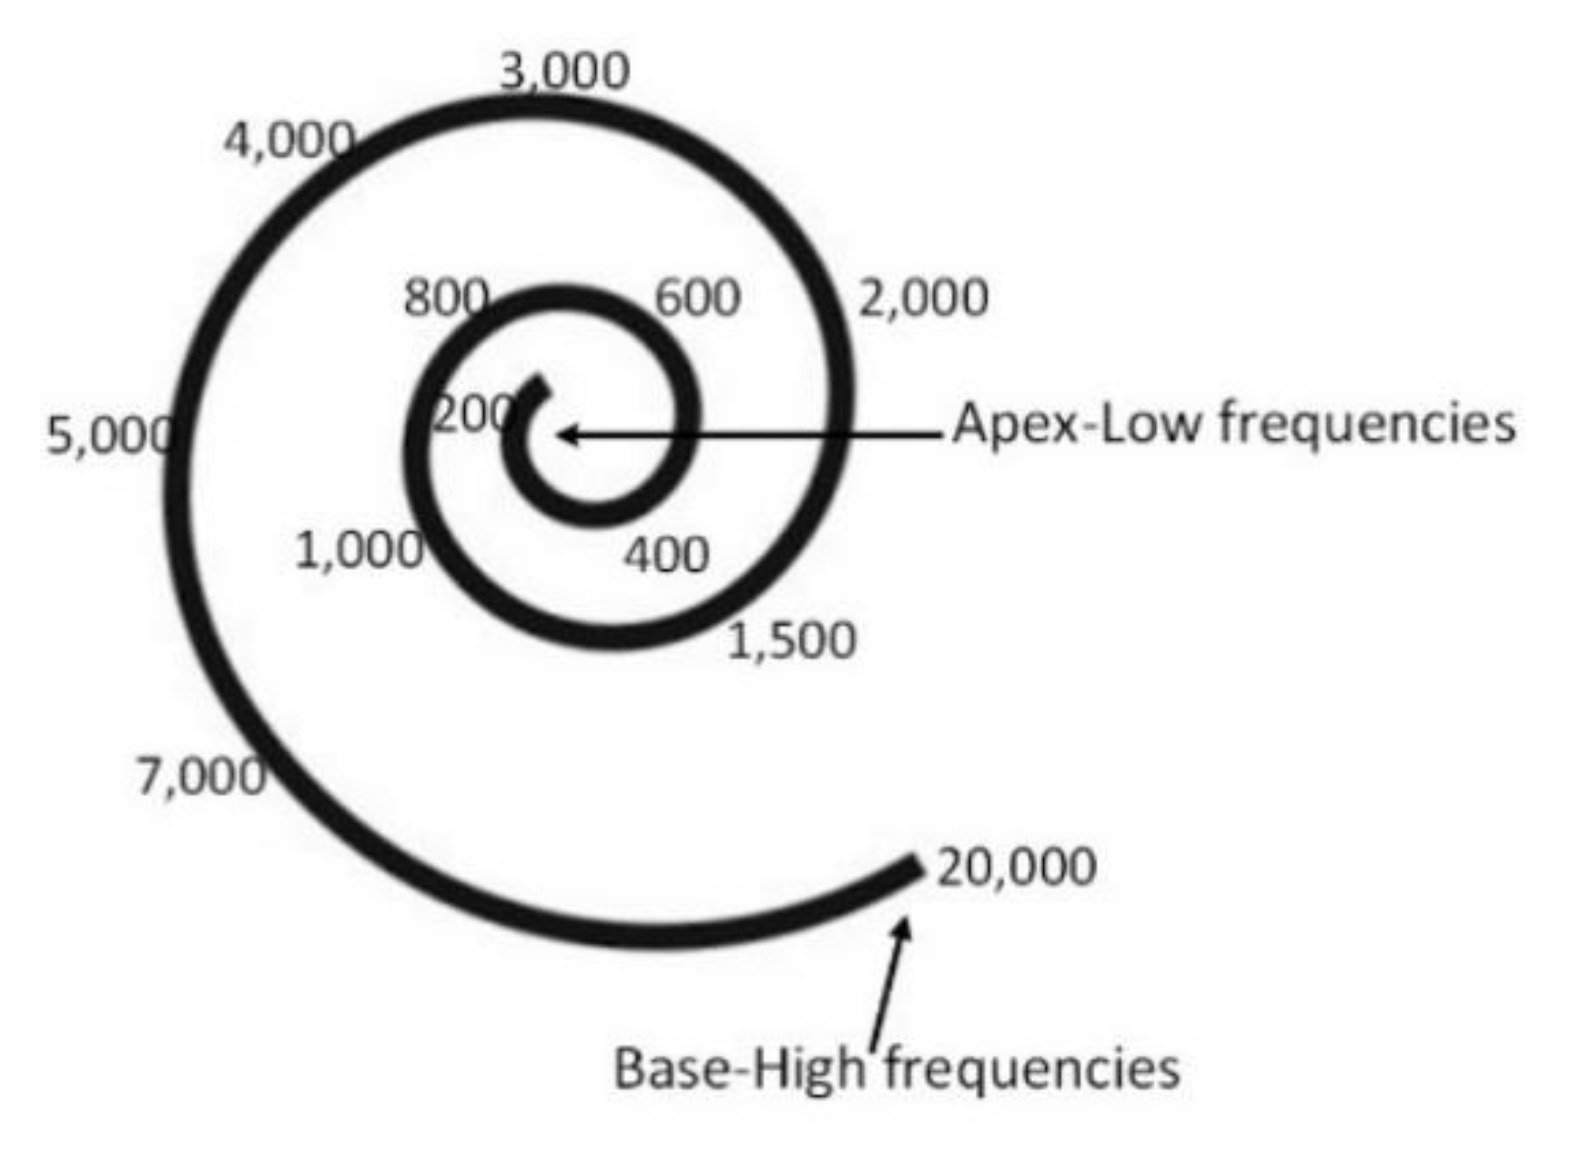
The speech signal is a kind of time-varying signal, whose signal characteristics represent the different speech produced—an audible signal transmitted to the human ear by the vibration of particles in the air. There are three ways to mark events in speech. The first is silence, where there is no speech. The second is the unvoiced state, where the vocal cord does not vibrate; therefore, the output speech waveform is aperiodic and random [26]. The last is the vocal state, where the vocal cords vibrate periodically as air is expelled from the lungs. The membrane is displaced in different positions depending on the frequencies; for example, the membrane is displaced near its apex with low frequencies while stimulating the membrane at its base with high frequencies. The displacement ability of the membrane at a specific point is directly proportional to the amplitude of the frequency at which it is excited. When a sound contains multiple frequencies, the basement membrane displaces at multiple points. The cochlea then divides complex sounds into frequency components [23] (Figure 4).
Each pronounced word consists of the phonetic combination of a limited set of the vowel (which carry the power of the sound), and consonant (which provide intelligibility) speech sound units [1,3]. Lower frequency sounds (between 250 and 500 Hz) correspond to the vowel sounds, while higher frequencies (between 2000 and 4000 Hz) correspond to the consonant sounds. Recent studies have shown that healthy ears can decode separate consonants efficiently [27,28]. However, with sensorineural hearing loss where hair cells and synaptic connections are not correctly functioning, speech can be heard but not understood. The most considerable difficulty may include communication in background noise (predominantly of low frequency), which results in difficulty understanding talkers with soft voices and hearing speech at a distance.
3.2. Audiogram of Sensorineural Hearing Loss
An audiogram is a graph that illustrates hearing ability by plotting the hearing threshold based on the patient hearing loss level, which allows the patient to hear different frequencies. The pitch (frequency) of a sound is measured along the chart’s horizontal axis, in Hertz, from 0.25 to 8 kHz. However, speech energy above 3000 Hz provides important language information for listeners. The standard speech intelligibility index (SII: ANSI 1997) allocates 27% of important speech at 3150 Hz and above. For more complex speech types, such as meaningless syllables, high-frequency regions account for 31% of the importance of speech signals [29]. In terms of the acoustic characteristics of speech, this high-frequency importance is significant, because the high-frequency part provides essential speech signals. For instance, the lowest frequency peak of /s/ is between 2.9 kHz and 8.9 kHz. Recent studies have shown that patients with moderate-severe hearing loss need an audible bandwidth of 9 kHz for a child; 5 kHz for male speech, and 6-9 kHz for female expression and for understanding /s/. Thus, if the hearing aid user can hear the spectrum energy of /s/, it needs to provide much more than the gains and outputs of the current commonly provided hearing [29].
4. Proposed Hearing Aid System
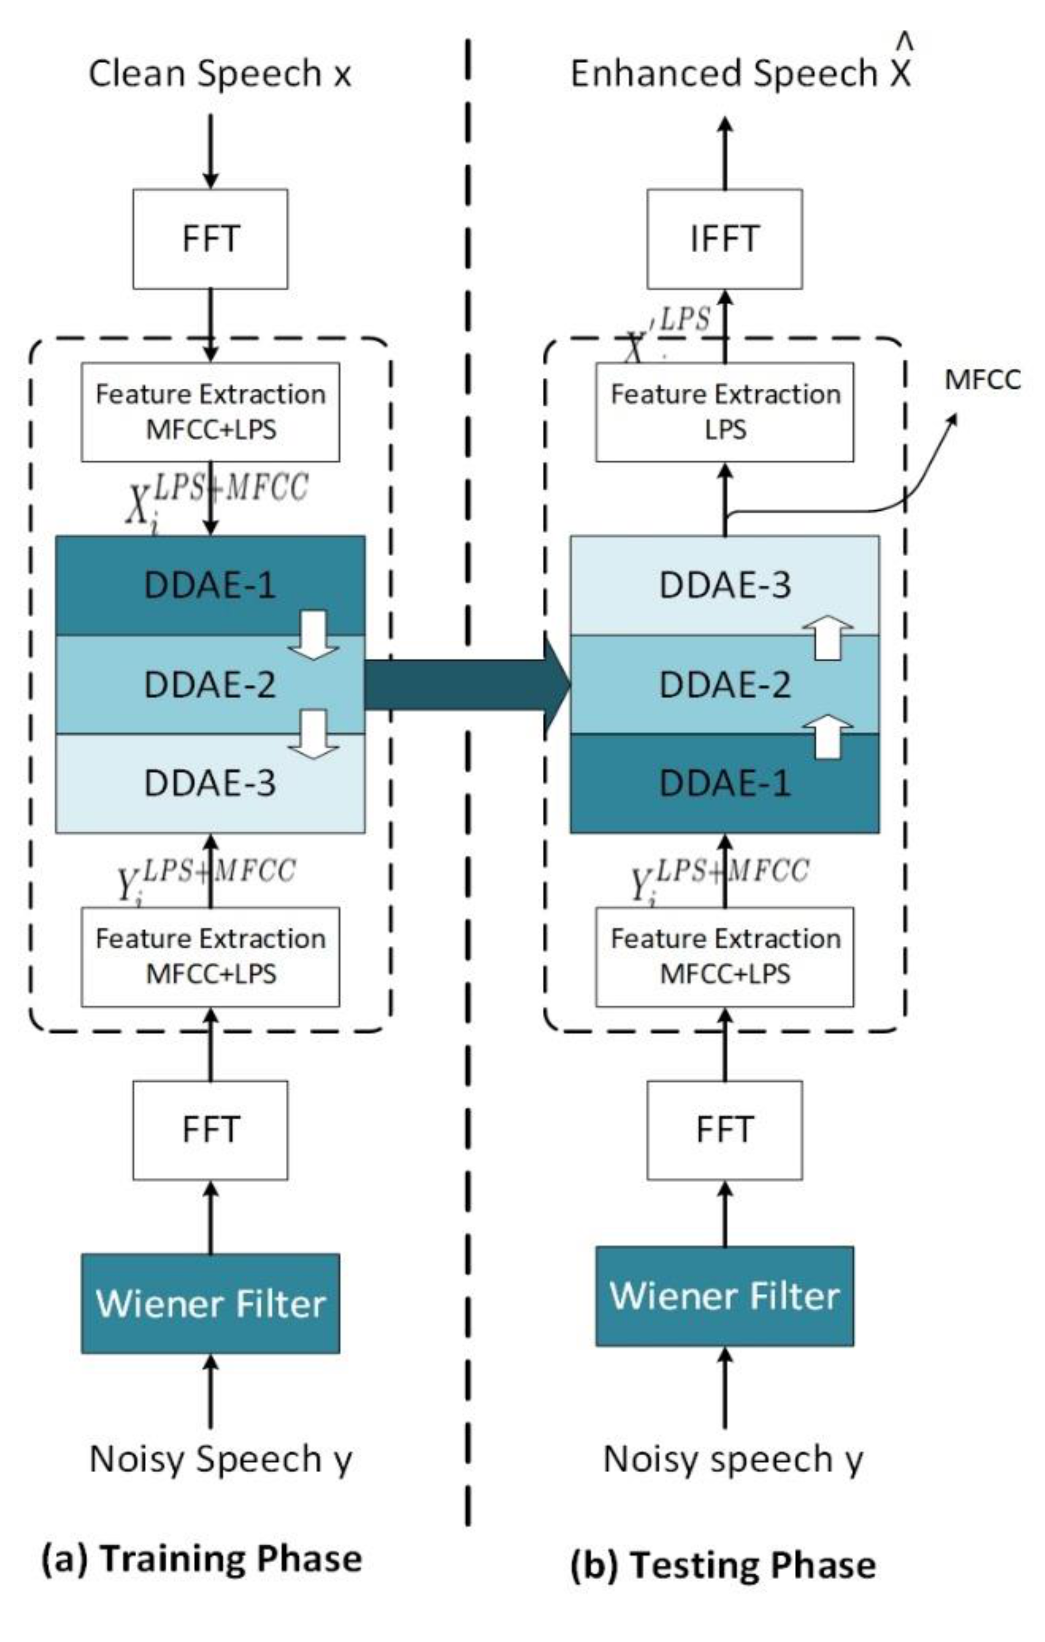
In this paper, we propose a system for the application of hearing aids (Figure 5). The system consists of two stages, i.e., Wiener filter and a composite of three levels of multilayers of DDAE, which use the output of the Wiener filter as input to enhance the speech signal based on the user’s hearing loss.
4.1. Wiener Filter (WF)
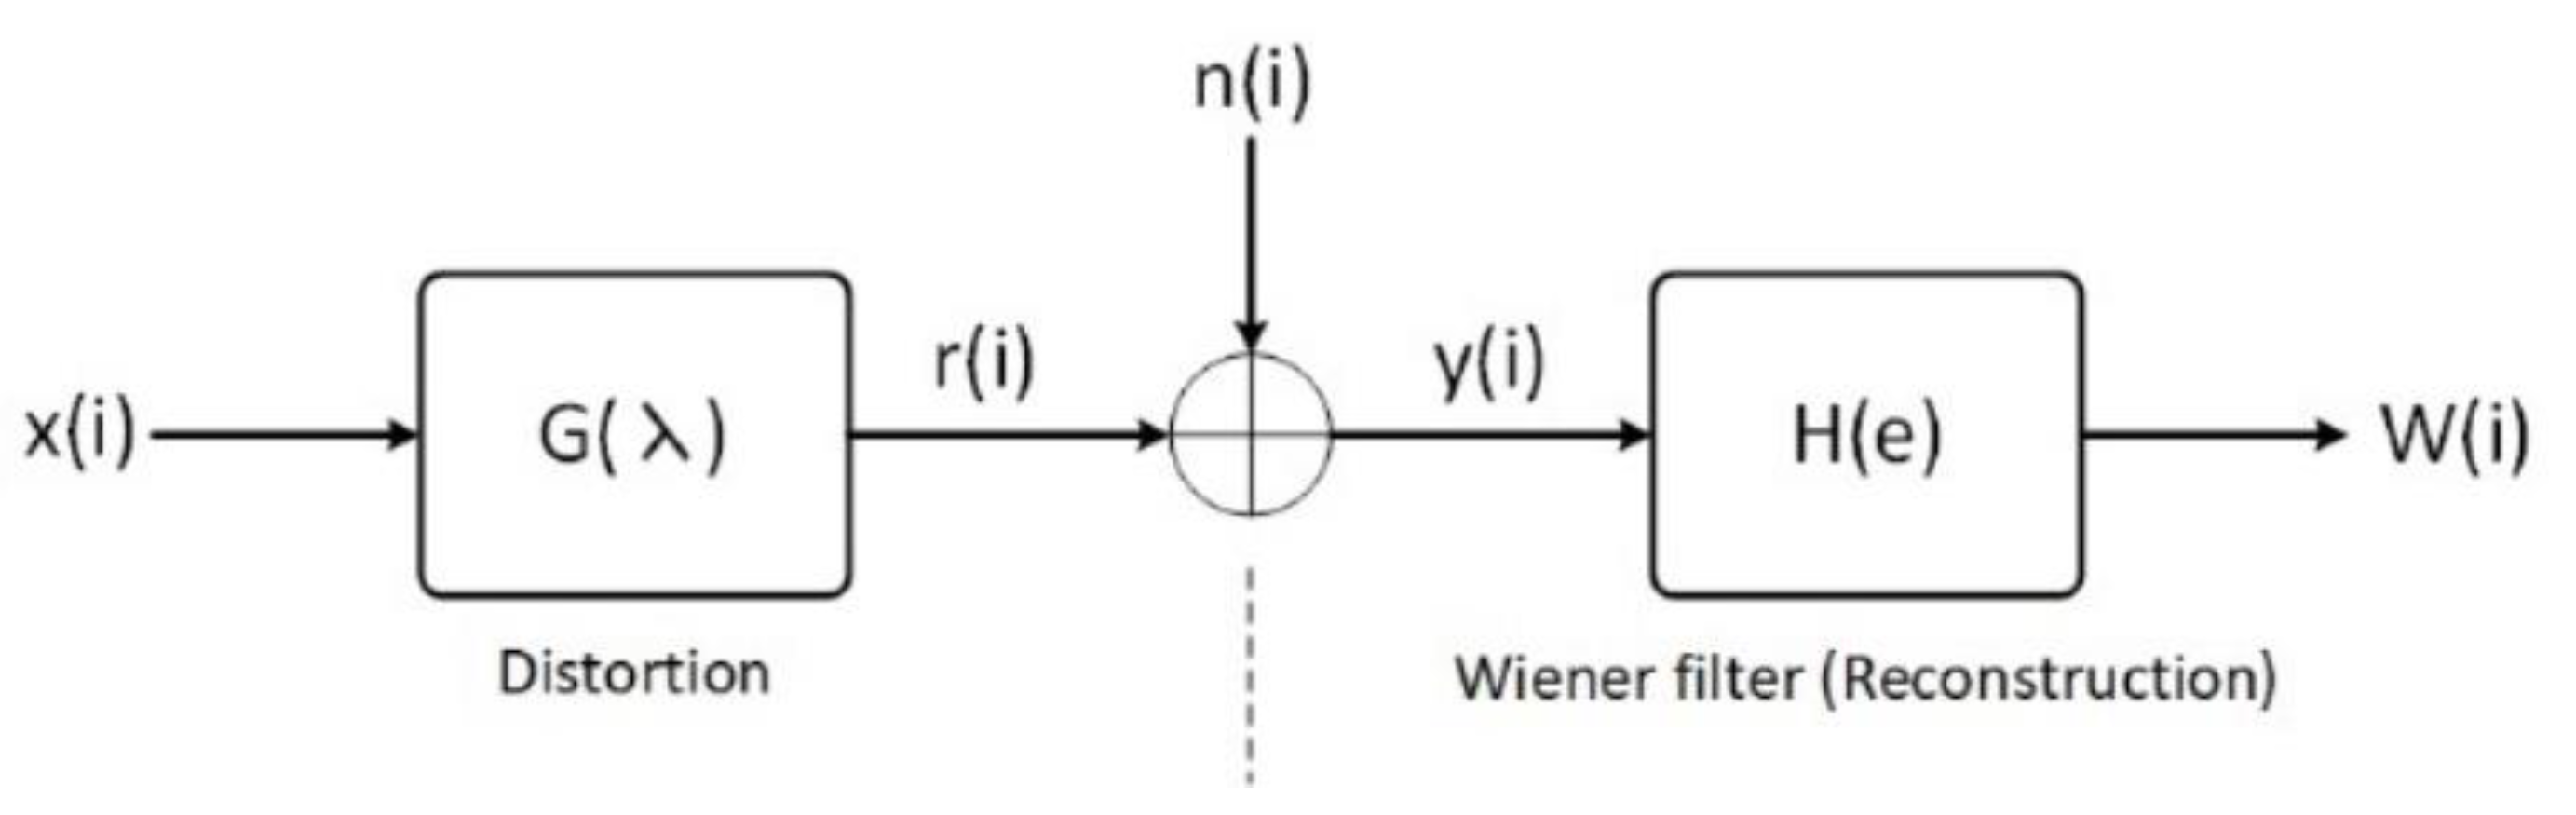
To eliminate noise and improve the enhancement of the input signal, we applied the Wiener filter to noisy speech as the first step in the HC-DDAEs as shown in Figure 6.
A random clean signal is subject to distortion by the gain and additive noise (Equation (2)). The frequency-domain Wiener filter can be defined as:
where is the gain function for the i- sub-band in the frame and is the estimate of a priori SNR, which is the main parameter to reduce speech distortion in a noisy environment. In this work, we used the posteriori and a priori SNR estimates for the noise power spectral density at each frequency component :
where represents half-wave rectification at the actual time interval , and is the spectrum of the noise. The presented priori SNR has a definition below:
We set the values of the main parameters to . Higher values may make the noise even quieter, and may result in damaging the audio that remains. Further details are provided in [19]. Fast Fourier transform (FFT) is applied to transform signals from the time domain to the frequency domain. Firstly, input elements are rearranged in bit-reversed order, then the transform output (time extraction) is generated. The basic idea is to break up a transform of length points into two transforms of length :
where denotes the frame in the FFT transform, more details can be found in [25]. The frequency range is 0.1 to 1 Hz. Then, the two popular sound features, namely, the Mel frequency cepstral coefficients (MFCC) [30,31] and the log power spectrum (LPS) [28], are used as the acoustic features in the proposed approach for better results. The feature extraction task to extract characteristic features out of speech utterances takes the signal’s frame every 16–32 ms and updates every 8–16 ms. When MFCC constraints are applied to the output layer, clean LPS characteristics can better predict:
where is the network parameter , which controls the trade-off between the reconstruction accuracy and regularization of the weighting coefficients. In this study we set ). Using the estimated parameters of the DDAE model, noisy speech is reconstructed to enhanced speech in the online phase.
where is the total number of training samples (noisy-clean pairs); and represent the LPS and MFCC features of clean speech, respectively; the parameter presents the Frobenius norm. (value from 0 to 1) is the weighting coefficient for two error parts in these vectors. was set to (0.7) in this study; however, the larger the value, the greater the contribution of LPS characteristics to DDAE training, and vice versa. The LPS and MFCC features obtained [23] as acoustic features in the proposed approach. Feature vectors of the Wiener enhanced signal and the clean signal can be composed of their static-dynamic or context features. Wiener enhanced speech and the clean speech are then placed in the composite-DDAEs model as input-output, respectively, for constructing the model.
4.2. Composite of Deep Denoising Autoencoder (C-DDAEs)
The second stage of the proposed approach consists of the training and testing phases, as presented in Section 4.2.1 and Section 4.2.2, respectively.
4.2.1. Training Phase (Offline)
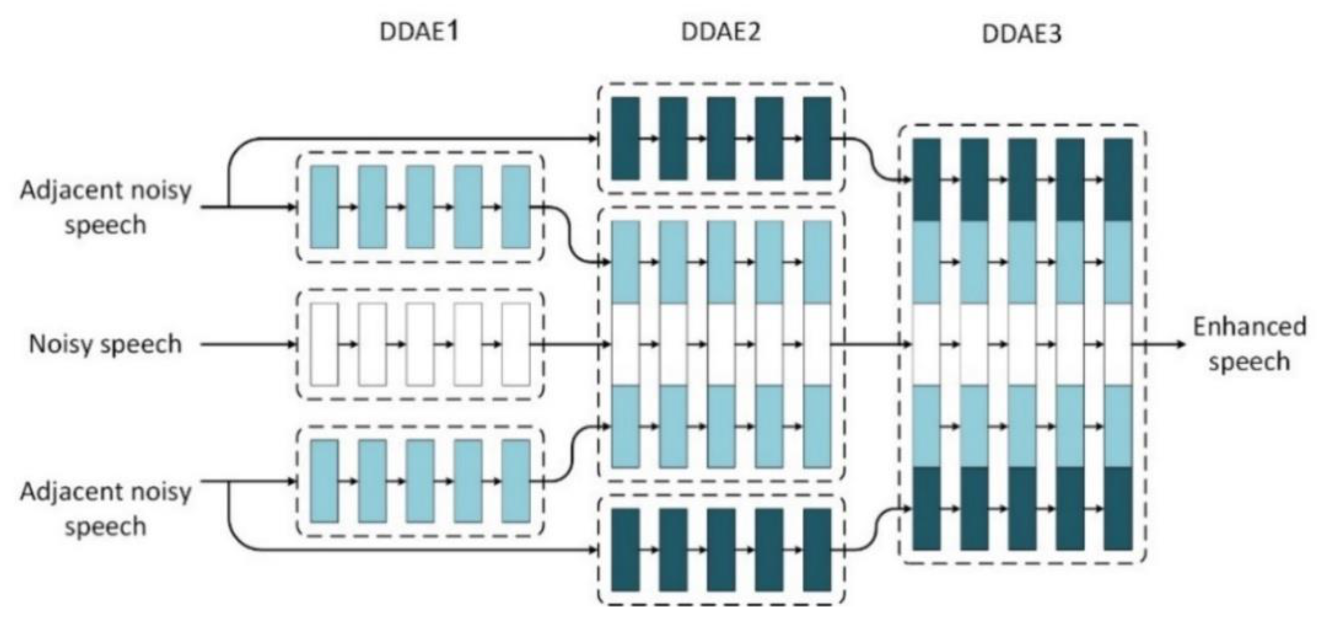
The training phase is presented in (Figure 5a). The composite-DDAEs (which we called C-DDAE) includes three multi-layers of the DDAE. Each DDAE works as an expert and is specialized for specific enhancement tasks, which is different to a single DDAE that has a fixed quantity of frames for general enhancement tasks. The output of each DDAE is the central pattern for the composite-DDAEs, which is either the original signal estimation or a referee that is used in the next DDAE to recover the speech—Noted here we used Wiener enhanced-and clean utterances features as the input and output of the composite-DDAEs, respectively, instead of noisy-clean speech. The composite-DDAEs works by adding one future and one past adjacent frame to the next DDAE, along with the outputs for each DDAE (Figure 7). Finally, the output of the central frame of third DDAE is considered as the target result. The C-DDAEs is trained offline and tested online, and the training set is divided into subsets, each of which corresponds to specific subtasks of the complete enhancement task, and the adjacent frame decides which DDAE should be used for each training case by making a stochastic decision about which single DDAE to use on each occasion. In this way, the training task learns the mapping function to produce an output vector , which is either the clean signal estimation or a referee that used for the next DDAE to recover the clean speech (desired signal) at the t- time index , of zero means from the noise spectra.
The DDAEs were set as follows:
- has three hidden layers and 128 units for each layer. One magnitude spectrum with 513-dimensionalis used as the input in the t- time frame.
- is with three hidden layers and 512 units for each layer. The three frames spectra used .
- has three hidden layers and 1024 units for each layer. The three frames used .
4.2.2. Testing Phase (Online)
The testing phase is presented in (Figure 5b). The composite-DDAEs transforms the speech vector into the enhanced speech feature vector by well-trained DDAEs, which are gained from the testing phase. Note that MFCC speech feature vector is not used to invert the enhanced speech signals, more details can be found in [26]. The enhanced output speech of the composite-DDAEs is applied to the speech-recovery stage, which includes:
- The mean and variance de-normalizations applied to process the output of the DDAE model;
- The exponential transform applied to the de-normalized features;
- The Mel-to-spectrum transform used to obtain the amplitude features;
- The inverse fast Fourier transform (IFFT) applied to convert spectral LPS speech features to time-domain waveforms.
5. Experiments
This section includes two parts: (A) The experimental setup and process, and (B) a comparison of spectrograms.
5.1. Experimental Setup and Process
Seven hundred IEEE sentences database [32] was used for training (including 20 speakers, two genders, and 18 utterances). The database also included eight kinds of noises (i.e., train, babble, car, exhibition hall, restaurant, street, airport, and railway station noises), which were mixed with the clean utterances in four SNR levels (i.e., 0, 5, 10, and 15 dB) and the testing set was not the same as that used in the training stage. Note that a 16 ms window and an 8 ms frameshift were applied to each voice sample. Each windowed speech segment was processed with 256 FFT points and then converted into a 129-dimensional LPS eigenvector. During the training process, the nonlinear activation function is realized by the time algorithm, and the sum of squares of errors is minimized during training. As the sigmoid colon function in [33] maps features to the range of (0 to 1), the use of features with a smaller dynamic range will reduce the probability that they are located in the saturated area of the sigmoid colon function (away from 0 and 1), so it can learn better:
A software simulator (MATLAB R2019b) was used to implement the hearing aid processing of damaged subjects. Two high-frequency hearing loss (HFHL) audiograms sets were used in this work [33] to test the performance of the approach: Audiogram 1 = {0, 0, 0, 60, 80, 90} and Audiogram 2 = {0, 15, 30, 60, 80, 85} at differences in pure tone audiometry > 10 dB at the frequencies of (0.25, 0.5, 1, 2, 4, and 8 kHz) were calculated (Table 1). These audiograms are often used to evaluate new speech enhancement algorithms for hearing-impaired subjects.
5.1.1. Experiment 1: Variations in the Types of Noise
For the training, we prepared 30 clean utterances for each type of noise: . Then, we mixed these utterances with white noise, pink noise, and one of three noise types (i.e., train, babble, and restaurant noises) at five SNR levels (i.e., 0, 5, 10, and 15 dB). For the testing stage, we prepared three test data sets from 15 gender-balanced clean utterances (five for each of the three speakers), in which different parts of the same three noise types were mixed.
5.1.2. Experiment 2: Variations in Gender
In the second experiment, we constructed two data sets, each from 12 male or 12 female speakers. Eight noise types (i.e., train, babble, car, exhibition hall, restaurant, street, airport, railway station noises) were used in this experiment. The noises were mixed with clean words, a total of 600/gender. For the testing stage, we collected utterances per gender and mixed them with the same eight noises types.
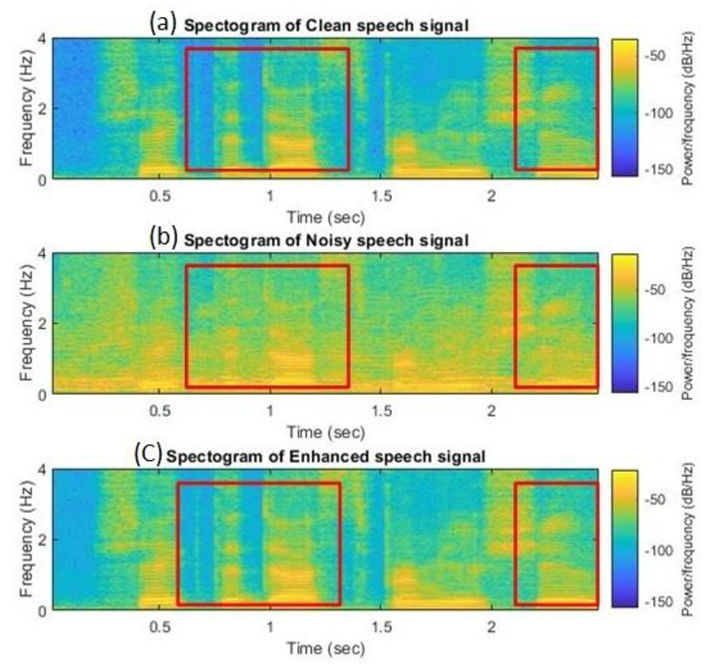
5.2. Comparison of Spectrograms
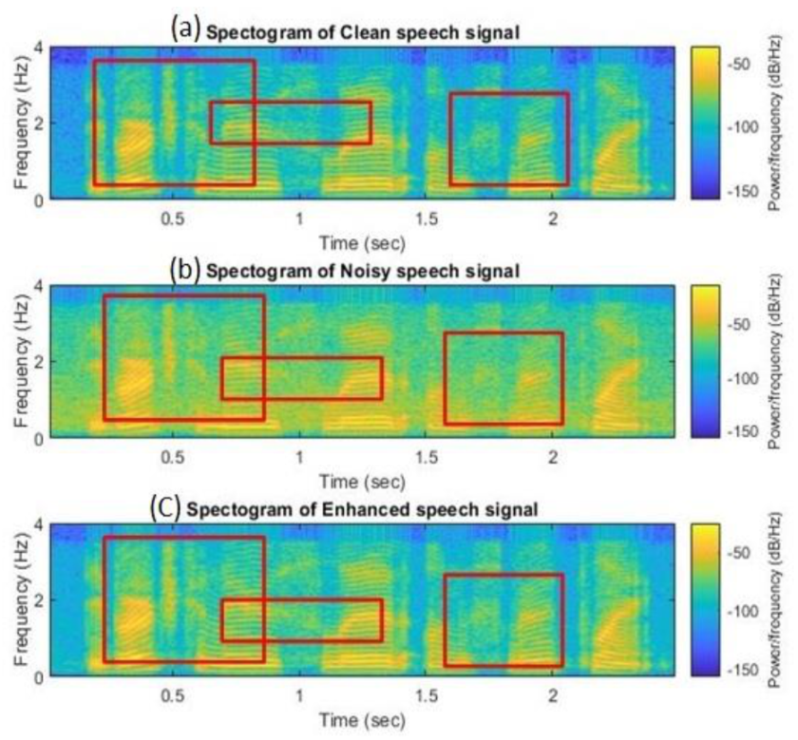
A spectrogram is a standard tool for analyzing the time spectrum characteristics of speech signals [34,35]. The effects of single DDAE and the HC-DDAE were studied qualitatively using spectrogram. The clean language used was extracted from a man’s voice, he said: “God bless him, I hope to see him forever.” The X-axis and Y-axis of the spectrum represent the time index and the frequency, respectively. (Figure 8 and Figure 9) contain three subgraphs showing (a) a spectrum of clean speech, (b) a spectrum of noise, and (c) a spectrum of enhanced speech processed by the HC-DDAE method.
6. Speech Quality and Intelligibility Evaluation
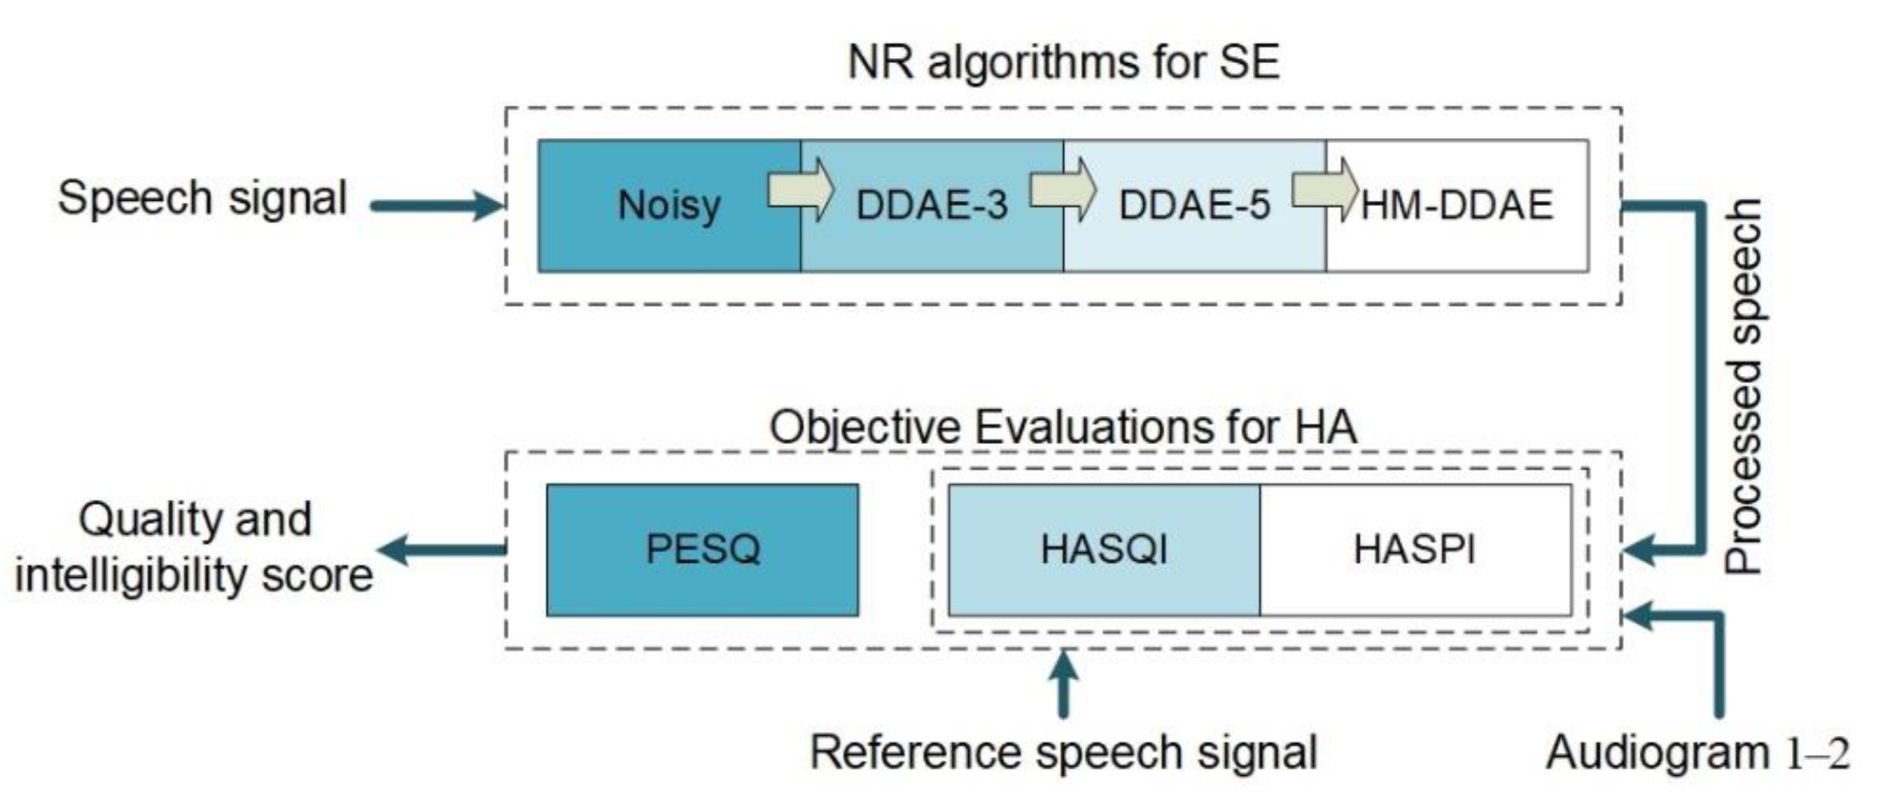
6.1. Objective Evaluation
Three objective indexes were used—to evaluate the results of the proposed method (Figure 10) in comparison to the Wiener filter, and single DDAE:
6.1.1. Speech Quality Perception Evaluation (PESQ)
The standard PESQ [36] uses an auditory model, which includes an auditory filter, a spectrum, time masking, and is defined in ITU-T Recommendation p.862ITU. Hearing loss is not included in the auditory model. In its basic version, the index measures 11 signal features compared with the reference signal and combines these signal features to give the quality value. An index developed to evaluate the high-quality codec system of the NH audience. Index prediction designed for a small amount of distortion is not accurate for larger distortion associated with low data rate codecs [35,36]. They are not expected to be accurate for the larger range of signal attenuation found in hearing aids. The noisy speech reduction and the signal distortion are measured by Equations (13) and (14), respectively:
where is the total number of testing samples, and is the size (dimension) of the input data of the first layer of the DDAE. Based on the noise reduction criterion (denoted as “Reduct” in the experiments), the larger the value, the better the restored speech. However, reducing much noise inevitably causes speech distortion. Based on the speech distortion measurement (denoted as “Dist” in the experiments), the lower the value, the better the restored speech.
6.1.2. Hearing Aid Speech Quality Index (HASQI)
The HASQI can predict the sound quality performance of device according to the hearing threshold of the hearing impaired individual. Moreover, the HASQI is the product of two independent indexes. The first component, called captures the effects of noise and nonlinear distortion. The second component is , which captures linear filtering and spectral changes by targeting differences in the long-term average spectrum [37]. Both elements are calculated from the output of the auditory model to quantify specific changes in the clean reference signal and the enhanced signal by:
6.1.3. Hearing Aid Speech Perception Index (HASPI)
The HASPI uses auditory models to predict intelligibility. The auditory model combines all aspects of normal and impaired peripheral auditory function [38] by calculating the correlation value (Equation (16)) between the output of the auditory model of the degraded test signal (i.e., the spectral shape of the signal enhanced over time) and the generation of the unprocessed reference input signal.
where is the basis function number, and is the normalized correlation; more details can be found in [38].
The reference signal is the output of the normal-hearing model, and the input has no noise or other degradation. For normal-hearing listeners, the processed signal is the output of the normal-hearing model with a degraded signal as the input. For hearing-impaired people, the auditory model is used to modify the processed signal to include hearing loss, and the model input includes amplification to compensate for the loss.
Auditory coherence is used to measure the cross-correlation of the high-level part (expressed as ) of the enhanced signal and the clean signal in each frequency band. The envelope is sensitive to the dynamic signal behaviour related to consonants, while the cross-correlation tends to retain the harmonics in stable vowels. Finally, the HASPI score is calculated according to and . Let be the low-level auditory coherence value, be the mid-level value, and be the high-level value, then the HASPI intelligibility is given by:
6.2. Evaluation Procedure
As described in (Section 4), the proposed approach includes two stages, i.e., the Wiener filter and a composite-DDAEs, and the DDAE has two phases, namely the training phase and the testing phase. For each overlapped windowed frame (16-ms window and 8-ms frameshift), the LPS feature calculated through the short-time Fourier transform (STFT), was computed during the MFCC feature by the following steps:(1) Pre-emphasis; (2) windowing; (3) FFT; (4) Mel filtering; (5) nonlinear transform; (6) discrete cosine transform (DCT). Wiener enhanced speech and the clean speech were then added as the input and output of the composite-DDAEs, separately, to train the model instead of noisy-clean pairs. Moreover, the Wiener filter and DDAE methods were used separately to compare the performance with the proposed hybrid-composite approach.
6.3. Results and Discussion
In this section, we present the average scores of the objective measurements of the test set for the proposed system in comparison to the Wiener filter and single multi-layers DDAE. Pair of Wiener enhanced utterances and clean speech signals were used to train the composite-DDAE models instead of noisy-clean speech. To achieve the purpose of generalization, the noisy speech signal of the testing set was not the same used in the training set. For comparison purposes, we kept the output of the Wiener filter, and individual DDAE, and also trained another set of composite-DDAEs networks to directly map the noisy features to clean features. In the training phase, the noisy-clean speech signals were first converted into LPS and MFCC features.
Based on the qualitative analysis results used in this work, our proposed hybrid approach achieved relative performance of 9% in terms of the PESQ. The results for the PESQ metric are presented in (Figure 11), which indicate that: (1) DDAE achieves better performance for SNR of 0 dB for white noise and SNR 0 and 5 dB for restaurant noise. Based on the experimental results we found that the individual DDAE network is unable to obliterate the noise due to local minima, and the enhanced signal residual noises. To overcome this issue, we need to increase the epoch in the training stage, which subsequently increases the training time. (2) The Wiener filter gives better results in pink noise of a 5 dB SNR. (3) The HC-DDAEs approach achieved better effects in most SNR levels of the rest of the types of noises. In our approach, the adjacent frames showed important effects on the clean frames reconstructions due to considering the dynamic structure.
The average PESQ scores of different types of noises for the (Wiener, individual DDAE, and HCDDAEs approaches in comparison with no approach) are presented in Table 2 and Table 3. For pink noise, the Wiener filter provides better results for SNR 5, while the individual DDAE achieved almost the same results as the HC-DDAEs in SNR of 15 dB. The HC-DDAEs achieved the best results for the rest of the cases.
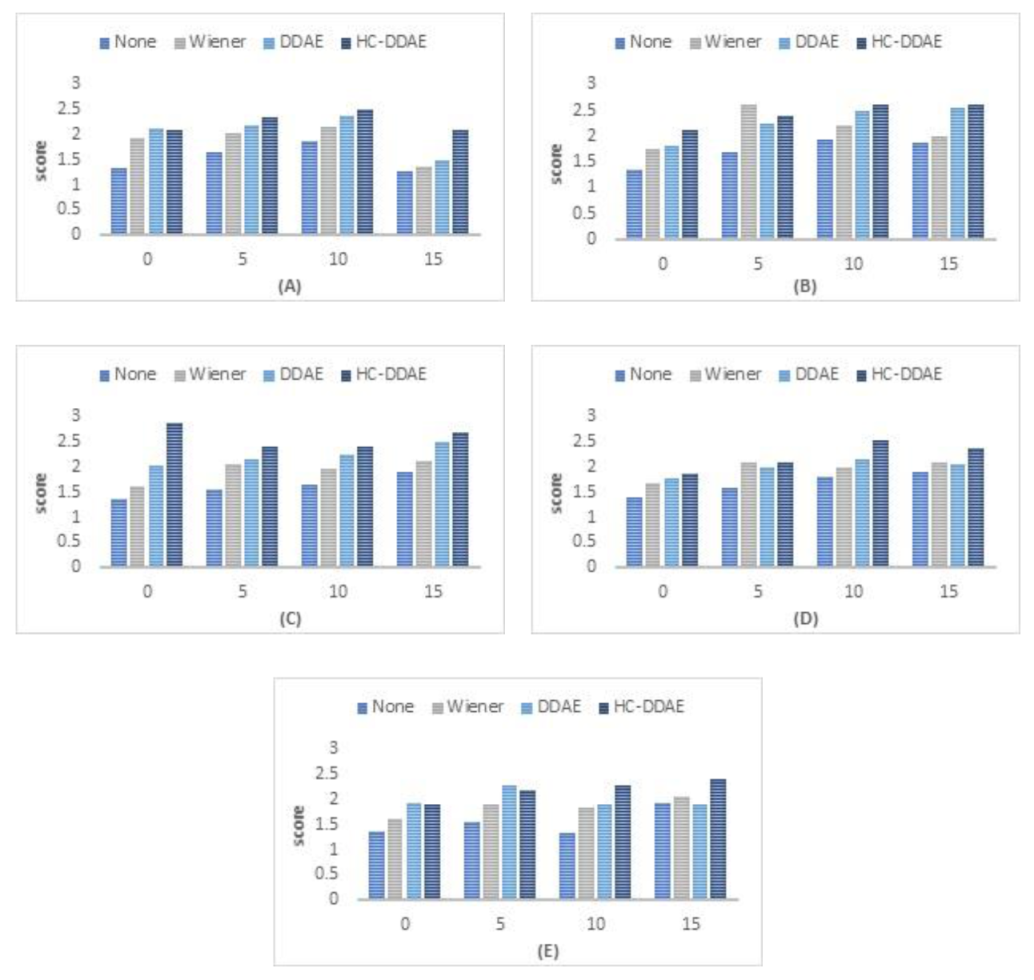
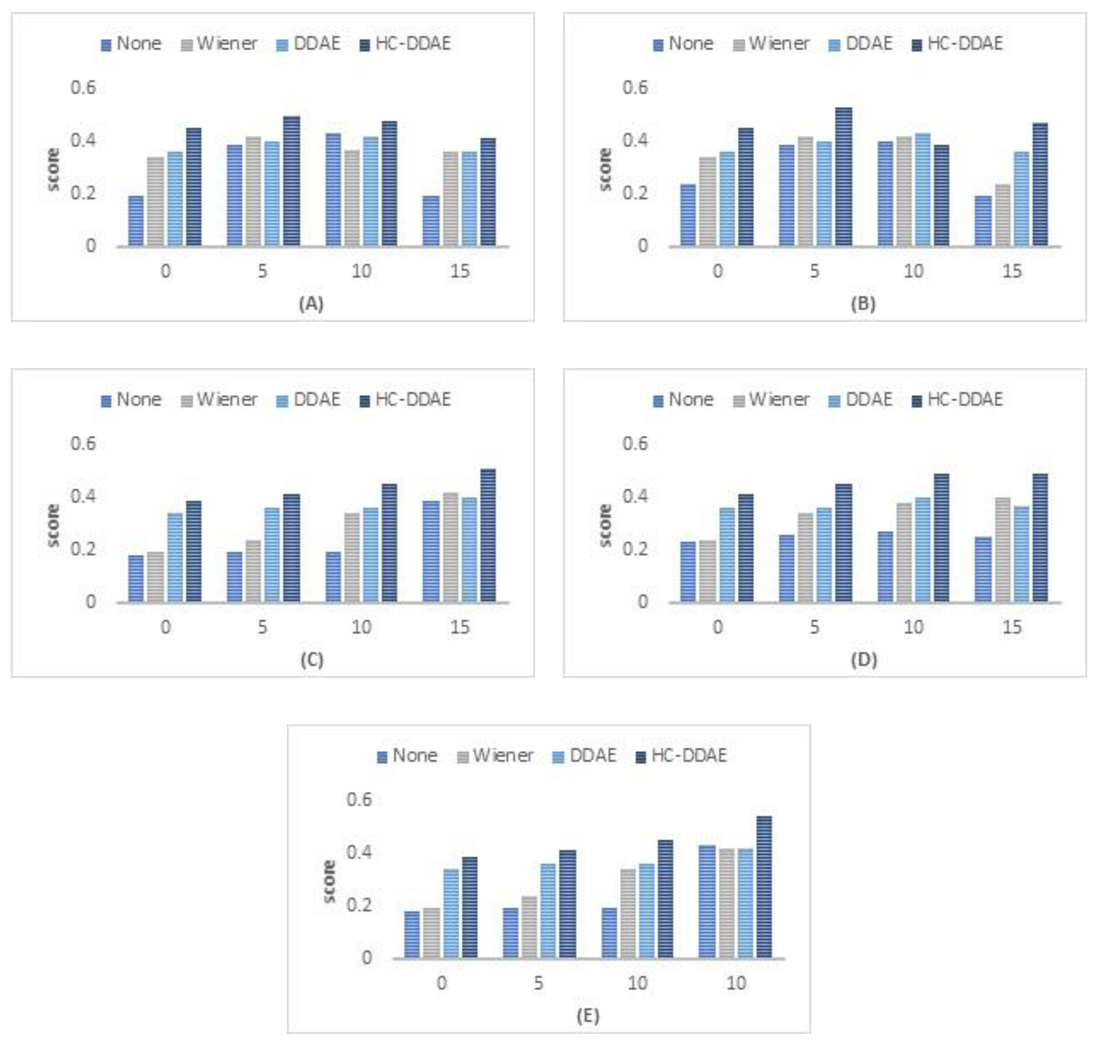
In this section the results of different types of noises for (Wiener, DDAE, and HC-DDAEs approaches) are presented in terms of two objectives metrics, namely, HASQI and HASPI, using two sensorineural hearing loss audiograms (audiograms 4 and 5), more details of which can found in Table 1. (Figure 12) presents the HASQI score for the four different SNR levels (i.e., 0, 5, 10, and 15 dB) of experiment 1. Based on the experimental results, it is clear that the HC-DDAEs achieved significantly higher speech quality results than the Wiener filter and the individual DDAE for the two sensorineural hearing loss audiograms under most listening conditions of different noises in every SNR levels, while the DDAE alone presents better results for SNR 5 dB for the white and restaurant noises.
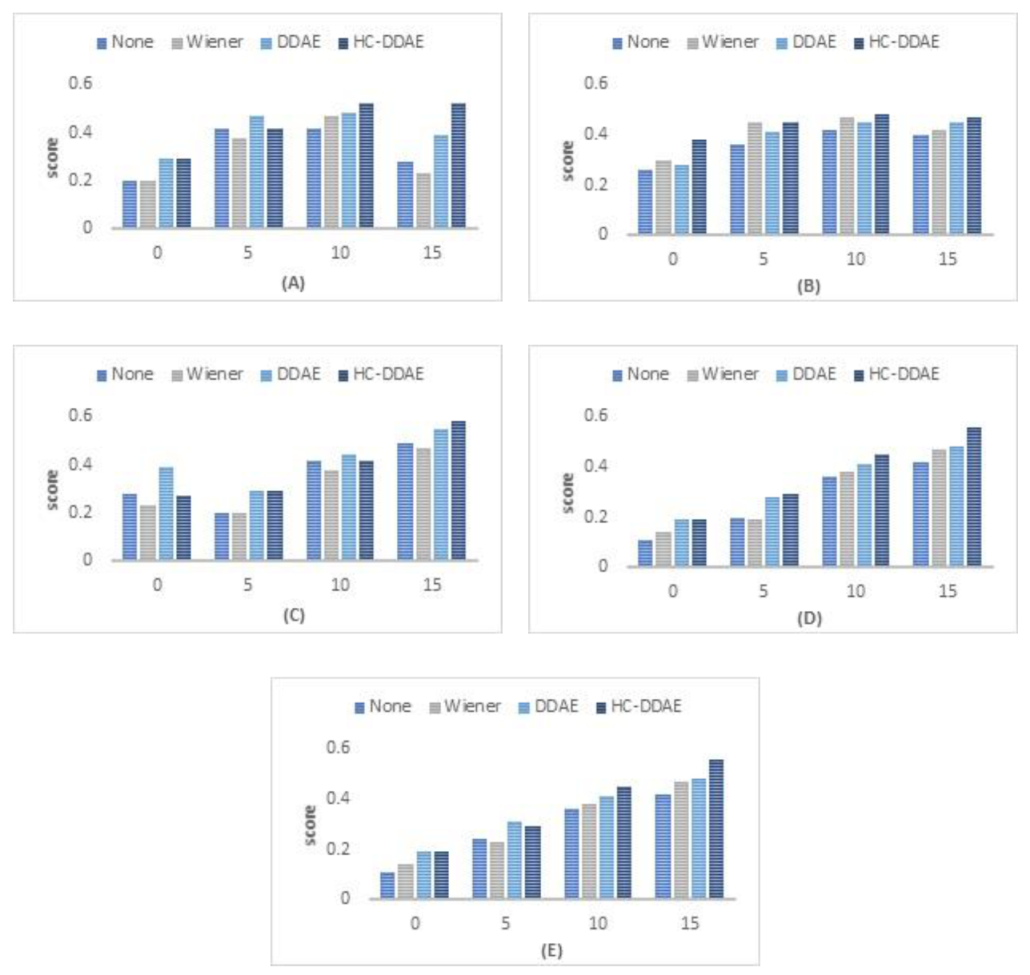
(Figure 13), shows the HASPI scores for five types of noises from experiment (1) in the four different SNR levels (i.e., 0, 5, 10, 15 dB). The results indicate that HC-DDAEs provided significantly higher HASPI scores than the other methods (i.e., Wiener filter and single DDAE separately) under most of the tested conditions. In contrast, the individual DDAE presents better results for SNR 10 of pink noise. Based on the previous results, the proposed HC-DDAEs can significantly improve the speech quality for hearing aids under noisy conditions.
7. Conclusions
In this study, we presented a new hybrid-composite approach to improve the quality and intelligibility of speech for hearing aids users (called HC-DDAEs). The proposed method was divided into two stages: 1) The filtering stage, which uses the Wiener filter to reduce the noise components and to generate a clean speech; 2) a composite of three levels of DDAEs with different windows lengths of one, three, and five frames, for DDAE1, DDAE2, and DDAE3, respectively. For observing the improvement in performance, we adopted multi-objective learning technology. Two kinds of experiments were presented in this paper, in the first experiment; five types of noises were used (i.e., white, pink, train, babble, and restaurant noises) and were added to the training set by corrupting random training speech signals at four SNR levels (i.e., 0, 5, 10, 15 dB). In contrast, in the second experiment, 600 speech signals/gender were mixed with eight noise types (i.e., train, babble, car, exhibition hall, restaurant, street, airport, and railway station noises). We conducted an extensive evaluation of the speech intelligibility and quality produced by the proposed method based on three well-known evaluation metrics, which were applied to two HFHL audiograms. We compared the results with the Wiener filter and the single DDAE networks separately and performed tests to assess the statistical significance in enhancing noisy speech signals. Based on our experimental results, we concluded that the HC-DDAEs approach yields higher HASPI and HASQI scores than the Wiener filter and the individual DDAE methods under most of the test conditions. Thus, the proposed method could provide better speech intelligibility and quality for individuals with hearing loss. More noise classes with of the seven sensorineural hearing losses will be evaluated in the future.
Author Contributions
R.Y.L. developed the algorithm, conducted the experiments and participated in writing the paper. X.W. supervised the overall work and reviewed the paper. Z.Y. review the paper. All authors have read and agreed to the published version of the manuscript.
Funding
This work was partially supported by the National Key Research and Development Program of China (No.2017YFB1402102), the National Natural Science Foundation of China (No.11772178, No.11502133, No.11872036, and No.61701291), the Fundamental Research Fund for the Central Universities (No.GK201801004), the China Postdoctoral Science Foundation-funded project (No.2017M613053) and the Shaanxi Natural Science Foundation Project (No.2018JQ6089).
Conflicts of Interest
The authors declare no conflict of interest.
References
- Lin, B.M.; Curhan, S.G.; Wang, M.; Eavey, R.; Stankovic, K.M.; Curhan, G.C. Hypertension, Diuretic Use, and Risk of Hearing Loss. Am. J. Med. 2016, 129, 416–422. [Google Scholar] [CrossRef] [Green Version]
- World Health Organization (2018 March). 10 Facts about Deafness. Available online: http://origin.who.int/features/factfiles/deafness/en/ (accessed on 13 August 2020).
- Jiang, W.; Zhao, F.; Guderley, N.; Manchaiah, V. Daily music exposure dose and hearing problems using personal listening devices in adolescents and young adults: A systematic review. Int. J. Audiol. 2016, 55, 197–205. [Google Scholar] [CrossRef] [PubMed] [Green Version]
- Scollie, S.; Glista, D.; Scollie, S. Diagnosis and Treatment of Severe High Frequency Hearing Loss. In Proceedings of the Phonak Adult Care Conference, Chicago, IL, USA, 2006, 13–15 November 2006; pp. 169–179. [Google Scholar]
- Preminger, J.E.; Carpenter, R.; Ziegler, C.H. A Clinical Perspective on Cochlear Dead Regions: Intelligibility of Speech and Subjective Hearing Aid Benefit. J. Am. Acad. Audiol. 2005, 16, 600–613. [Google Scholar] [CrossRef] [Green Version]
- Chen, F.; Loizou, P.C. Impact of SNR and gain-function over- and under-estimation on speech intelligibility. Speech Commun. 2012, 54, 272–281. [Google Scholar] [CrossRef] [PubMed] [Green Version]
- Levitt, H. Noise reduction in hearing aids: A review. J. Rehabil. Res. Dev. 2001, 38, 111–121. [Google Scholar] [PubMed]
- Chung, K. Challenges and Recent Developments in Hearing Aids: Part I. Speech Understanding in Noise, Microphone Technologies and Noise Reduction Algorithms. Trends Amplif. 2004, 8, 83–124. [Google Scholar] [CrossRef] [Green Version]
- Harbach, A.A.; Arora, K.; Mauger, S.J.; Dawson, P.W. Combining directional microphone and single-channel noise reduction algorithms: A clinical evaluation in difficult listening conditions with cochlear implant users. Ear Hear. J. 2012, 33, 13–23. [Google Scholar]
- Buechner, A.; Brendel, M.; Saalfeld, H.; Litvak, L.; Frohne-Buechner, C.; Lenarz, T. Results of a Pilot Study With a Signal Enhancement Algorithm for HiRes 120 Cochlear Implant Users. Otol. Neurotol. 2010, 31, 1386–1390. [Google Scholar] [CrossRef]
- Chen, J.; Wang, Y.; Yoho, S.E.; Wang, D.; Healy, E.W. Large-scale training to increase speech intelligibility for hearing-impaired listeners in novel noises. J. Acoust. Soc. Am. 2016, 139, 2604–2612. [Google Scholar] [CrossRef] [Green Version]
- Sun, M.; Zhang, X.; Zheng, T.F. Unseen noise estimation using a separable deep autoencoder for speech enhancement. IEEE/Acm Trans. Audio Speech Lang. Process. 2016, 24, 93–104. [Google Scholar] [CrossRef] [Green Version]
- Lai, Y.H.; Zheng, W.Z.; Tang, S.T.; Fang, S.H.; Liao, W.H.; Tsao, Y. Improving the performance of hearing aids in noisy environments based on deep learning technology. In Proceedings of the 2018 40th Annual International Conference of the IEEE Engineering in Medicine and Biology Society (EMBC), Honolulu, HI, USA, 18–21 July 2018; Volume 20, pp. 404–408. [Google Scholar]
- Xu, Y.; Du, J.; Dai, L.-R.; Lee, C.-H. A Regression Approach to Speech Enhancement Based on Deep Neural Networks. IEEE/ACM Trans. Audio Speech Lang. Process. 2014, 23, 7–19. [Google Scholar] [CrossRef]
- Lai, Y.-H.; Chen, F.; Wang, S.-S.; Lu, X.; Tsao, Y.; Lee, C.-H. A Deep Denoising Autoencoder Approach to Improving the Intelligibility of Vocoded Speech in Cochlear Implant Simulation. IEEE Trans. Biomed. Eng. 2016, 64, 1568–1578. [Google Scholar] [CrossRef] [PubMed]
- Lu, X.; Tsao, Y.; Matsuda, S.; Hori, C. Ensemble modelling of denoising autoencoder for speech spectrum restoration. In Proceedings of the 15th Annual Conference of the International Speech Communication Association, Singapore, 14–18 September 2014; pp. 885–889. [Google Scholar]
- Lu, X.; Tsao, Y.; Matsuda, S.; Hori, C. Speech enhancement based on deep denoising autoencoder. Interspeech 2013, 2013, 436–440. [Google Scholar]
- Lai, Y.-H.; Tsao, Y.; Lu, X.; Chen, F.; Su, Y.-T.; Chen, K.-C.; Chen, Y.-H.; Chen, L.-C.; Li, L.P.-H.; Lee, C.-H. Deep Learning–Based Noise Reduction Approach to Improve Speech Intelligibility for Cochlear Implant Recipients. Ear Hear. 2018, 39, 795–809. [Google Scholar] [CrossRef]
- Huang, P.; Kim, M.; Hasegawa-Johnson, M.; Smaragdis, P. Joint optimization of masks and deep recurrent neural networks for monaural source separation. IEEE/ACM Trans. Audio Speech Lang. Process. 2015, 23, 2136–2147. [Google Scholar] [CrossRef] [Green Version]
- Xu, Y.; Du, J.; Dai, L.-R.; Lee, C.-H. An experimental study on speech enhancement based on deep neural networks. IEEE Signal. Process. Lett. 2014, 21, 65–68. [Google Scholar] [CrossRef]
- Kim, M. Collaborative Deep learning for Speech Enhancement: A Run time- Model Selection Method Using Autoencoders. In Proceedings of the 2017 IEEE International Conference on Acoustics, Speech and Signal Processing (ICASSP), New Orleans, LA, USA, 5–9 March 2017. [Google Scholar]
- Ororbia, A.; Giles, C.; Reitter, D. Online Semi-Supervised Learning with Deep Hybrid Boltzmann Machines and Denoising Autoencoders. arXiv 2016, arXiv:1511.06964. [Google Scholar]
- Xu, Y.; Du, J.; Huang, Z.; Dai, L.R.; Lee, C.H. Multi-Objective Learning and Mask-Based Post-Processing for Deep Neural Network Based Speech Enhancement. arXiv 2017, arXiv:1703.07172v1. [Google Scholar]
- Seyyed sallehi, S.Z.; Seyyed sallehi, S.A. A fast and efficient pre-training method based on layer-by layer maximum discrimination for deep neural networks. Neurocomputing 2015, 168, 669–680. [Google Scholar] [CrossRef]
- Souza, P. Speech Perception and Hearing Aids; Springer Handbook of Auditory research: Berlin, Germany, 2016; Volume 56, pp. 151–180. [Google Scholar]
- Healy, E.W.; Yoho, S.E.; Wang, Y.; Wang, D. An algorithm to improve speech recognition in noise for hearing-impaired listeners. J. Acoust. Soc. Am. 2013, 134, 3029–3038. [Google Scholar] [CrossRef] [Green Version]
- Healy, E.W.; Yoho, S.E.; Wang, Y.; Apoux, F.; Wang, D. Speech-cue transmission by an algorithm to increase consonant recognition in noise for hearing-impaired listeners. J. Acoust. Soc. Am. 2014, 136, 3325–3336. [Google Scholar] [CrossRef] [Green Version]
- Lai, Y.; Zheng, W. Multi-objective learning based speech enhancement method to increase speech quality and intelligibility for hearing aid device users. Biomed. Signal. Process. Control. 2019, 48, 35–45. [Google Scholar] [CrossRef]
- WHO. Deafness and Hearing Loss. Available online: http://www.who.int/news-room/fact-sheets/detail/deafness-and-hearing-loss (accessed on 13 August 2020).
- Vergin, R.; O’Shaughnessy, D.; Farnat, A. Generalized Mel frequency cepstral coefficients for large vocabulary speaker-independent continuous speech recognition. IEEE Trans. 1999, 7, 525–532. [Google Scholar] [CrossRef]
- Yin, X.; Ling, Z.; Lei, M.; Dai, L. Considering Global Variance of the Log Power Spectrum Derived from Mel-Cepstrum in HMM-based Parametric Speech Synthesis. In Proceedings of the 13th Annual Conference of the International Speech Communication Association, Portland, OR, USA, 9–13 September 2012. [Google Scholar]
- NOIZEUS: A Noisy Speech Corpus for Evaluation of Speech Enhancement Algorithms. Available online: https://ecs.utdallas.edu/loizou/speech/noizeus/ (accessed on 13 August 2020).
- Duan, Z.; Mysore, G.J.; Smaragdis, P. Online PLCA for real-time semi-supervised source separation, International Conference on Latent Variable Analysis and Signal Separation (LVA/ICA). In International Conference on Latent Variable Analysis and Signal Separation; Springer: Berlin/Heidelberg, Germany, 2012; pp. 34–41. [Google Scholar]
- Tsao, Y.; Lai, Y.H. Generalized maximum a posteriori spectral amplitude estimation for speech enhancement. Speech Commun. 2016, 76, 112–126. [Google Scholar] [CrossRef]
- Deng, L.; Seltzer, M.; Yu, D.; Acero, A.; Mohamed, A.R.; Hinton, G. Binary Coding of Speech Spectrograms Using a Deep Auto-encoder. In Proceedings of the 11th Annual Conference of the International Speech Communication Association, Makuhari, Chiba, Japan, 26–30 September 2010. [Google Scholar]
- Beerends, J.; Hekstra, A.; Rix, A.W.; Hollier, M.P. Perceptual evaluation of speech quality (PESQ) the new ITU standard for end-to-end speech quality assessment part 2: Psychoacoustic model. J. Audio Eng. Soc. 2002, 50, 765–778. [Google Scholar]
- Kates, S.J.; Arehart, K. The hearing-aid speech quality index (HASQI). J. Audio Eng. Soc. 2010, 58, 363–381. [Google Scholar]
- Kates, J.M.; Arehart, K.H. The hearing-aid speech perception index (HASPI). Speech Commun. 2014, 65, 75–93. [Google Scholar] [CrossRef]
- Gupta, S.; Jaafar, J.; Ahmad, W.F.W.; Bansal, A. Feature Extraction Using Mfcc. Signal. Image Process. Int. J. 2013, 4, 101–108. [Google Scholar] [CrossRef]
Figure 1.
Different degrees of hearing loss. Intensity commonly ranges from −10 to 120 dB.

Figure 2.
Denoising autoencoder (DAE) with one hidden layer . and are the noisy-enhanced speech, respectively.
Figure 2.
Denoising autoencoder (DAE) with one hidden layer . and are the noisy-enhanced speech, respectively.

Figure 3.
Layer-by-layer pre-training method for the composite-DDAEs. Each layer is pre-trained for the next layer and provides it with some of the initial weights.
Figure 3.
Layer-by-layer pre-training method for the composite-DDAEs. Each layer is pre-trained for the next layer and provides it with some of the initial weights.

Figure 4.
Frequency map of the human cochlea hearing organ, with a base that responds to high frequencies with sufficient energy to make it vibrate (20,000 Hz), and an apex that responds to low frequencies (200 Hz), which can travel further.
Figure 4.
Frequency map of the human cochlea hearing organ, with a base that responds to high frequencies with sufficient energy to make it vibrate (20,000 Hz), and an apex that responds to low frequencies (200 Hz), which can travel further.

Figure 5.
The proposed HC-DDAEs model-based speech enhancement with the Wiener filter and a composite of three DDAEs. The model includes an (a) offline phase (i.e., training stage), and an (b) online phase (i.e. testing stage). IFFT, inverse fast Fourier transform; FFT, fast Fourier transform; LPS, log power spectrum; MFCC, Mel frequency cepstral coefficient.

Figure 6.
Wiener filter at a noisy speech signal.

Figure 7.
The structure of the composite-DDAEs. The DDAE1 with one future and one past adjacent frame is fed as input to the DDAE2 with a windows length of three. The output for the DDAE2 with two future and two past adjacent frames is then input into the DDAE3 with a windows length of five.
Figure 7.
The structure of the composite-DDAEs. The DDAE1 with one future and one past adjacent frame is fed as input to the DDAE2 with a windows length of three. The output for the DDAE2 with two future and two past adjacent frames is then input into the DDAE3 with a windows length of five.

Figure 8.
The spectrograms result for (a) clean speech, (b) noisy speech, and (c) enhanced speech by the proposed method using—train noise (SNR = 0).
Figure 8.
The spectrograms result for (a) clean speech, (b) noisy speech, and (c) enhanced speech by the proposed method using—train noise (SNR = 0).

Figure 9.
The spectrograms result for (a) clean speech, (b) noisy speech, and (c) enhanced speech by the proposed method using street noise (SNR = 15 dB).
Figure 9.
The spectrograms result for (a) clean speech, (b) noisy speech, and (c) enhanced speech by the proposed method using street noise (SNR = 15 dB).

Figure 10.
The block diagram of objective evaluation used for the study. NR, noise reduction; HA, hearing aid; PESQ, speech quality perception evaluation; HASQI, hearing aid speech quality index; HASPI, hearing aid speech perception index.
Figure 10.
The block diagram of objective evaluation used for the study. NR, noise reduction; HA, hearing aid; PESQ, speech quality perception evaluation; HASQI, hearing aid speech quality index; HASPI, hearing aid speech perception index.

Figure 11.
The PESQ results (average measures for the test set). Higher values present better results (A) White noise enhancement; (B) pink noise enhancement; (C) train noise enhancement; (D) bubble noise enhancement; and (E) restaurant noise enhancement.
Figure 11.
The PESQ results (average measures for the test set). Higher values present better results (A) White noise enhancement; (B) pink noise enhancement; (C) train noise enhancement; (D) bubble noise enhancement; and (E) restaurant noise enhancement.

Figure 12.
The HASQI results (average measures for the test set). Higher values present better results (A) White noise enhancement; (B) pink noise enhancement; (C) train noise enhancement; (D) bubble noise enhancement; and (E) restaurant noise enhancement.
Figure 12.
The HASQI results (average measures for the test set). Higher values present better results (A) White noise enhancement; (B) pink noise enhancement; (C) train noise enhancement; (D) bubble noise enhancement; and (E) restaurant noise enhancement.

Figure 13.
The HASPI results (average measures for the test set). Higher values present better results (A) White noise enhancement; (B) pink noise enhancement; (C) train noise enhancement; (D) bubble noise enhancement; and (E) restaurant noise enhancement.
Figure 13.
The HASPI results (average measures for the test set). Higher values present better results (A) White noise enhancement; (B) pink noise enhancement; (C) train noise enhancement; (D) bubble noise enhancement; and (E) restaurant noise enhancement.


Table 1.
Audiograms of the seven sensorineural hearing losses (HLs). In this study, we used audiograms (4) and (5) for comparing speech enhancement (SE) approaches.
Table 1.
Audiograms of the seven sensorineural hearing losses (HLs). In this study, we used audiograms (4) and (5) for comparing speech enhancement (SE) approaches.
| Frequency (kHz) in dB HL | |||||||
|---|---|---|---|---|---|---|---|
| Audiogram | 0.25 | 0.5 | 1 | 2 | 4 | 8 | |
| 1 | Plane loss | 60 | 60 | 60 | 60 | 60 | 60 |
| 2 | Reverse tilt loss | 70 | 70 | 70 | 50 | 10 | 10 |
| 3 | Moderate tilt high-frequency loss | 40 | 40 | 50 | 60 | 65 | 65 |
| 4 | Steep slope high-frequency loss with standard low-frequency threshold | 0 | 0 | 0 | 60 | 80 | 90 |
| 5 | Steep slope high-frequency loss with mild low-frequency hearing loss | 0 | 15 | 30 | 60 | 80 | 85 |
| 6 | Mild to moderate tilt high-frequency hearing loss. In this study | 14 | 14 | 11 | 14 | 24 | 39 |
| 7 | 24 | 24 | 25 | 31 | 46 | 60 | |
Table 2.
The PESQ results for Experiment 1 (average measures for the test set). Higher values represent better results.
Table 2.
The PESQ results for Experiment 1 (average measures for the test set). Higher values represent better results.
| (1) White Noise | 0 | 5 | 10 | 15 |
| None | 1.34 | 1.54 | 1.73 | 2.12 |
| Wiener Filter | 1.64 | 2.02 | 2.2 | 2.34 |
| DDAE | 1.86 | 2.16 | 2.38 | 2.5 |
| HC-DDAEs | 1.28 | 1.38 | 1.49 | 2.09 |
| (2) Pink Noise | 0 | 5 | 10 | 15 |
| None | 1.34 | 1.61 | 1.8 | 2.12 |
| Wiener Filter | 1.69 | 1.9 | 2.25 | 2.4 |
| DDAE | 1.92 | 2.2 | 2.49 | 2.6 |
| HC-DDAEs | 1.87 | 1.98 | 2.53 | 2.62 |
| (3) Train Noise | 0 | 5 | 10 | 15 |
| None | 1.38 | 1.54 | 1.66 | 1.91 |
| Wiener Filter | 1.62 | 2.07 | 1.97 | 2.11 |
| DDAE | 2.02 | 2.16 | 2.26 | 2.5 |
| HC_DDAEs | 2.87 | 2.41 | 2.41 | 2.69 |
| (4) Babble Noise | 0 | 5 | 10 | 15 |
| None | 1.4 | 1.59 | 1.8 | 1.91 |
| Wiener Filter | 1.67 | 2.09 | 1.99 | 2.09 |
| DDAE | 1.78 | 1.99 | 2.16 | 2.06 |
| HC_DDAEs | 1.87 | 2.09 | 2.53 | 2.36 |
| (5) Restaurant Noise | 0 | 5 | 10 | 15 |
| None | 1.36 | 1.57 | 1.34 | 1.94 |
| Wiener Filter | 1.63 | 1.91 | 1.84 | 2.07 |
| DDAE | 1.92 | 2.28 | 1.89 | 1.89 |
| HC_DDAEs | 1.91 | 2.19 | 2.29 | 2.42 |
Table 3.
The PESQ results for Experiment 2 (average measures for the test set). Higher values represent better results.
Table 3.
The PESQ results for Experiment 2 (average measures for the test set). Higher values represent better results.
| Noise | Gender | None | Wiener | DDAE | HC-DDAEs |
|---|---|---|---|---|---|
| Train | Male | 1.38 | 1.7 | 2.32 | 2.46 |
| Female | 1.34 | 1.78 | 2.1 | 2.51 | |
| Babble | Male | 1.87 | 2.02 | 2.08 | 2.12 |
| Female | 1.92 | 1.96 | 2.16 | 2.57 | |
| Car | Male | 1.51 | 2.21 | 2.61 | 2.73 |
| Female | 1.82 | 2.1 | 2.12 | 2.54 | |
| Exhibition hall | Male | 1.53 | 1.99 | 1.78 | 2.13 |
| Female | 1.57 | 1.68 | 2.01 | 2.36 | |
| Restaurant | Male | 1.38 | 1.79 | 2.34 | 2.47 |
| Female | 1.62 | 1.79 | 2.39 | 2.41 | |
| Street | Male | 1.29 | 2 | 2.01 | 2.27 |
| Female | 1.31 | 1.88 | 2.1 | 2.34 | |
| Airport | Male | 1.38 | 1.79 | 2.02 | 2.48 |
| Female | 1.42 | 1.99 | 2.1 | 2.17 | |
| Railway station | Male | 1.76 | 1.78 | 2.13 | 2.09 |
| Female | 1.71 | 1.95 | 2.4 | 2.67 |
Publisher’s Note: MDPI stays neutral with regard to jurisdictional claims in published maps and institutional affiliations. |
© 2020 by the authors. Licensee MDPI, Basel, Switzerland. This article is an open access article distributed under the terms and conditions of the Creative Commons Attribution (CC BY) license (http://creativecommons.org/licenses/by/4.0/).
Share and Cite
MDPI and ACS Style
Lazim, R.Y.; Yun, Z.; Wu, X. Improving Speech Quality for Hearing Aid Applications Based on Wiener Filter and Composite of Deep Denoising Autoencoders. Signals 2020, 1, 138-156. https://0-doi-org.brum.beds.ac.uk/10.3390/signals1020008
AMA Style
Lazim RY, Yun Z, Wu X. Improving Speech Quality for Hearing Aid Applications Based on Wiener Filter and Composite of Deep Denoising Autoencoders. Signals. 2020; 1(2):138-156. https://0-doi-org.brum.beds.ac.uk/10.3390/signals1020008
Chicago/Turabian StyleLazim, Raghad Yaseen, Zhu Yun, and Xiaojun Wu. 2020. "Improving Speech Quality for Hearing Aid Applications Based on Wiener Filter and Composite of Deep Denoising Autoencoders" Signals 1, no. 2: 138-156. https://0-doi-org.brum.beds.ac.uk/10.3390/signals1020008