1. Introduction
The Internet of Things (IoT) is a relatively brand-new concept that alludes to the organized interconnection of everyday objects with intelligence [
1]. Thus, an IoT architecture is a structured solution to solve real-life problems that involves virtual programs, physical sensors, communication protocols and services, among other elements. There are many types of IoT architecture dedicated to different areas of science, such as healthcare, smart cities or wireless sensor networks [
2].
The IoT technology enables the development of a global network capable of enriching different aspects of human life. In other words, interactions between people and the environment are adapted to achieve comfort inside buildings, in workplaces and elsewhere. For example, IoT is able to check the optimal state of a building with home automation components, such as pressure, humidity, temperature, air quality sensors, etc. [
3,
4].
On the other hand, radon is a radioactive gas that constitutes a health risk because it deteriorates lung tissue. It leads to different respiratory problems and diseases. This way, radon is the second cause of lung cancer worldwide after tobacco [
5]. The highest concentration of radon is introduced into the organism by inhalation; however, there is a small percentage of accumulated radon by ingestion of contaminated water.
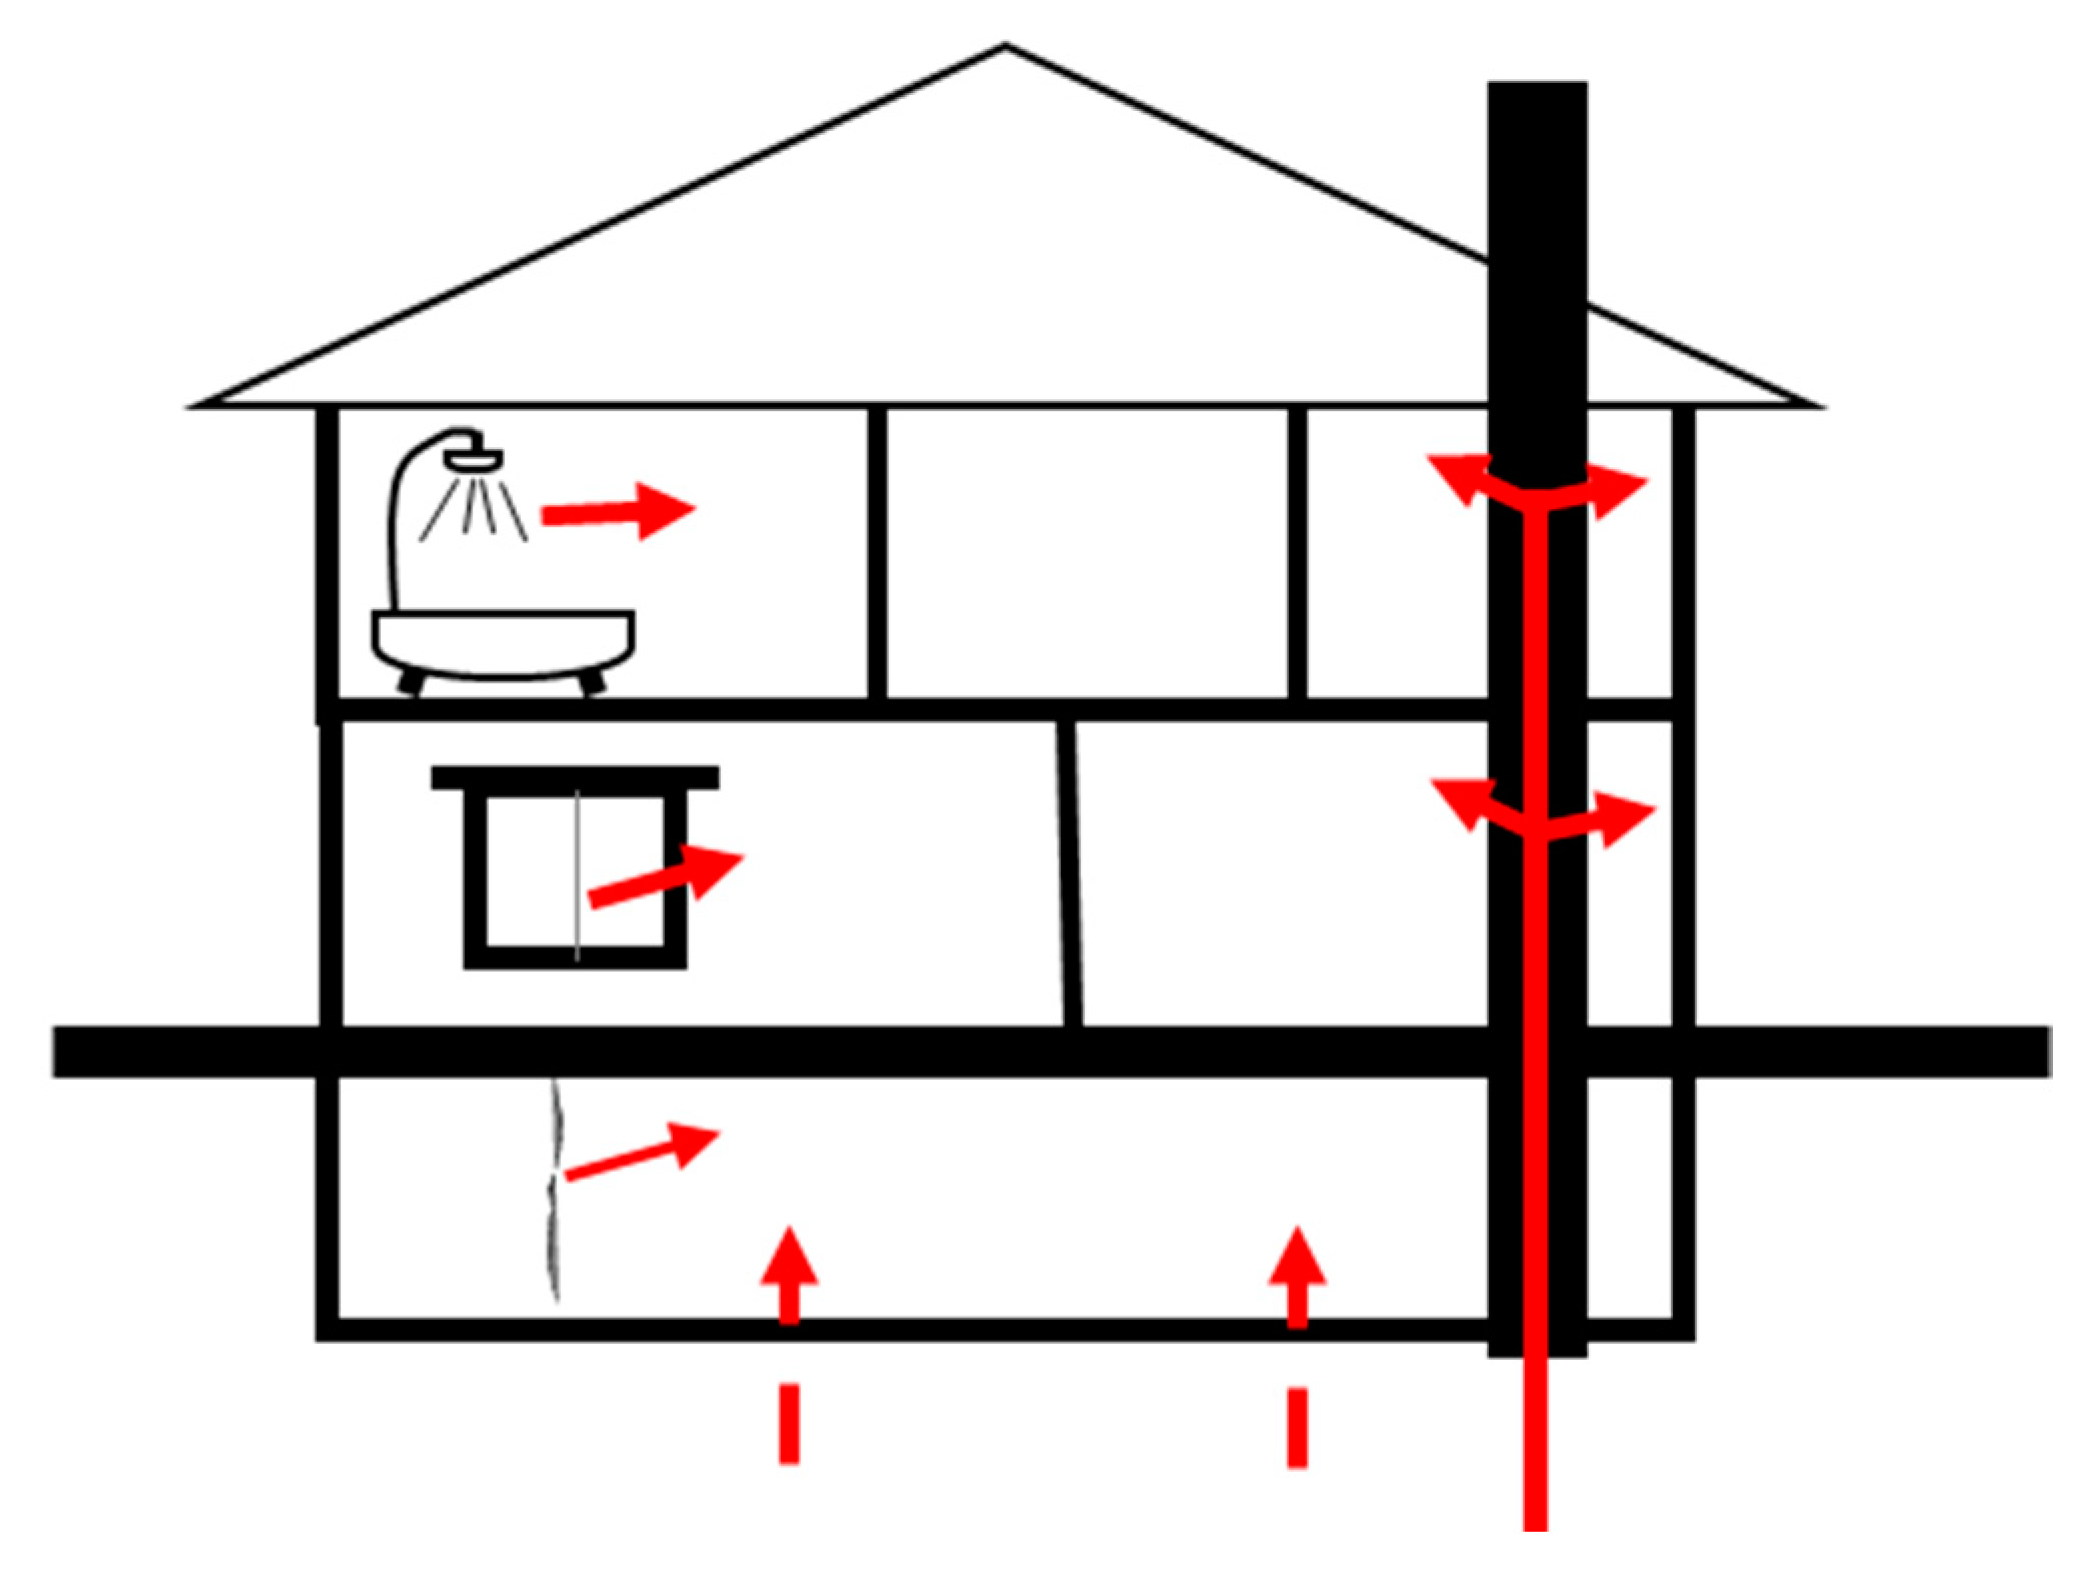
Considering that radon gas is denser than air, the places with the highest probability of accumulation and exposition for human beings are in basements and first floors of buildings where radon penetrates, as represented in
Figure 1 (from the outside ground to the inside of the house through the building materials). To reduce radon concentration in a house, manual ventilation is an effective preventive measure. However, there are other solutions that divert the radon path within a building, such as anti-radon foils or mechanical extraction systems (forced ventilation). These latter measures are the most expensive solutions because they involve modification of the building structure [
6,
7].
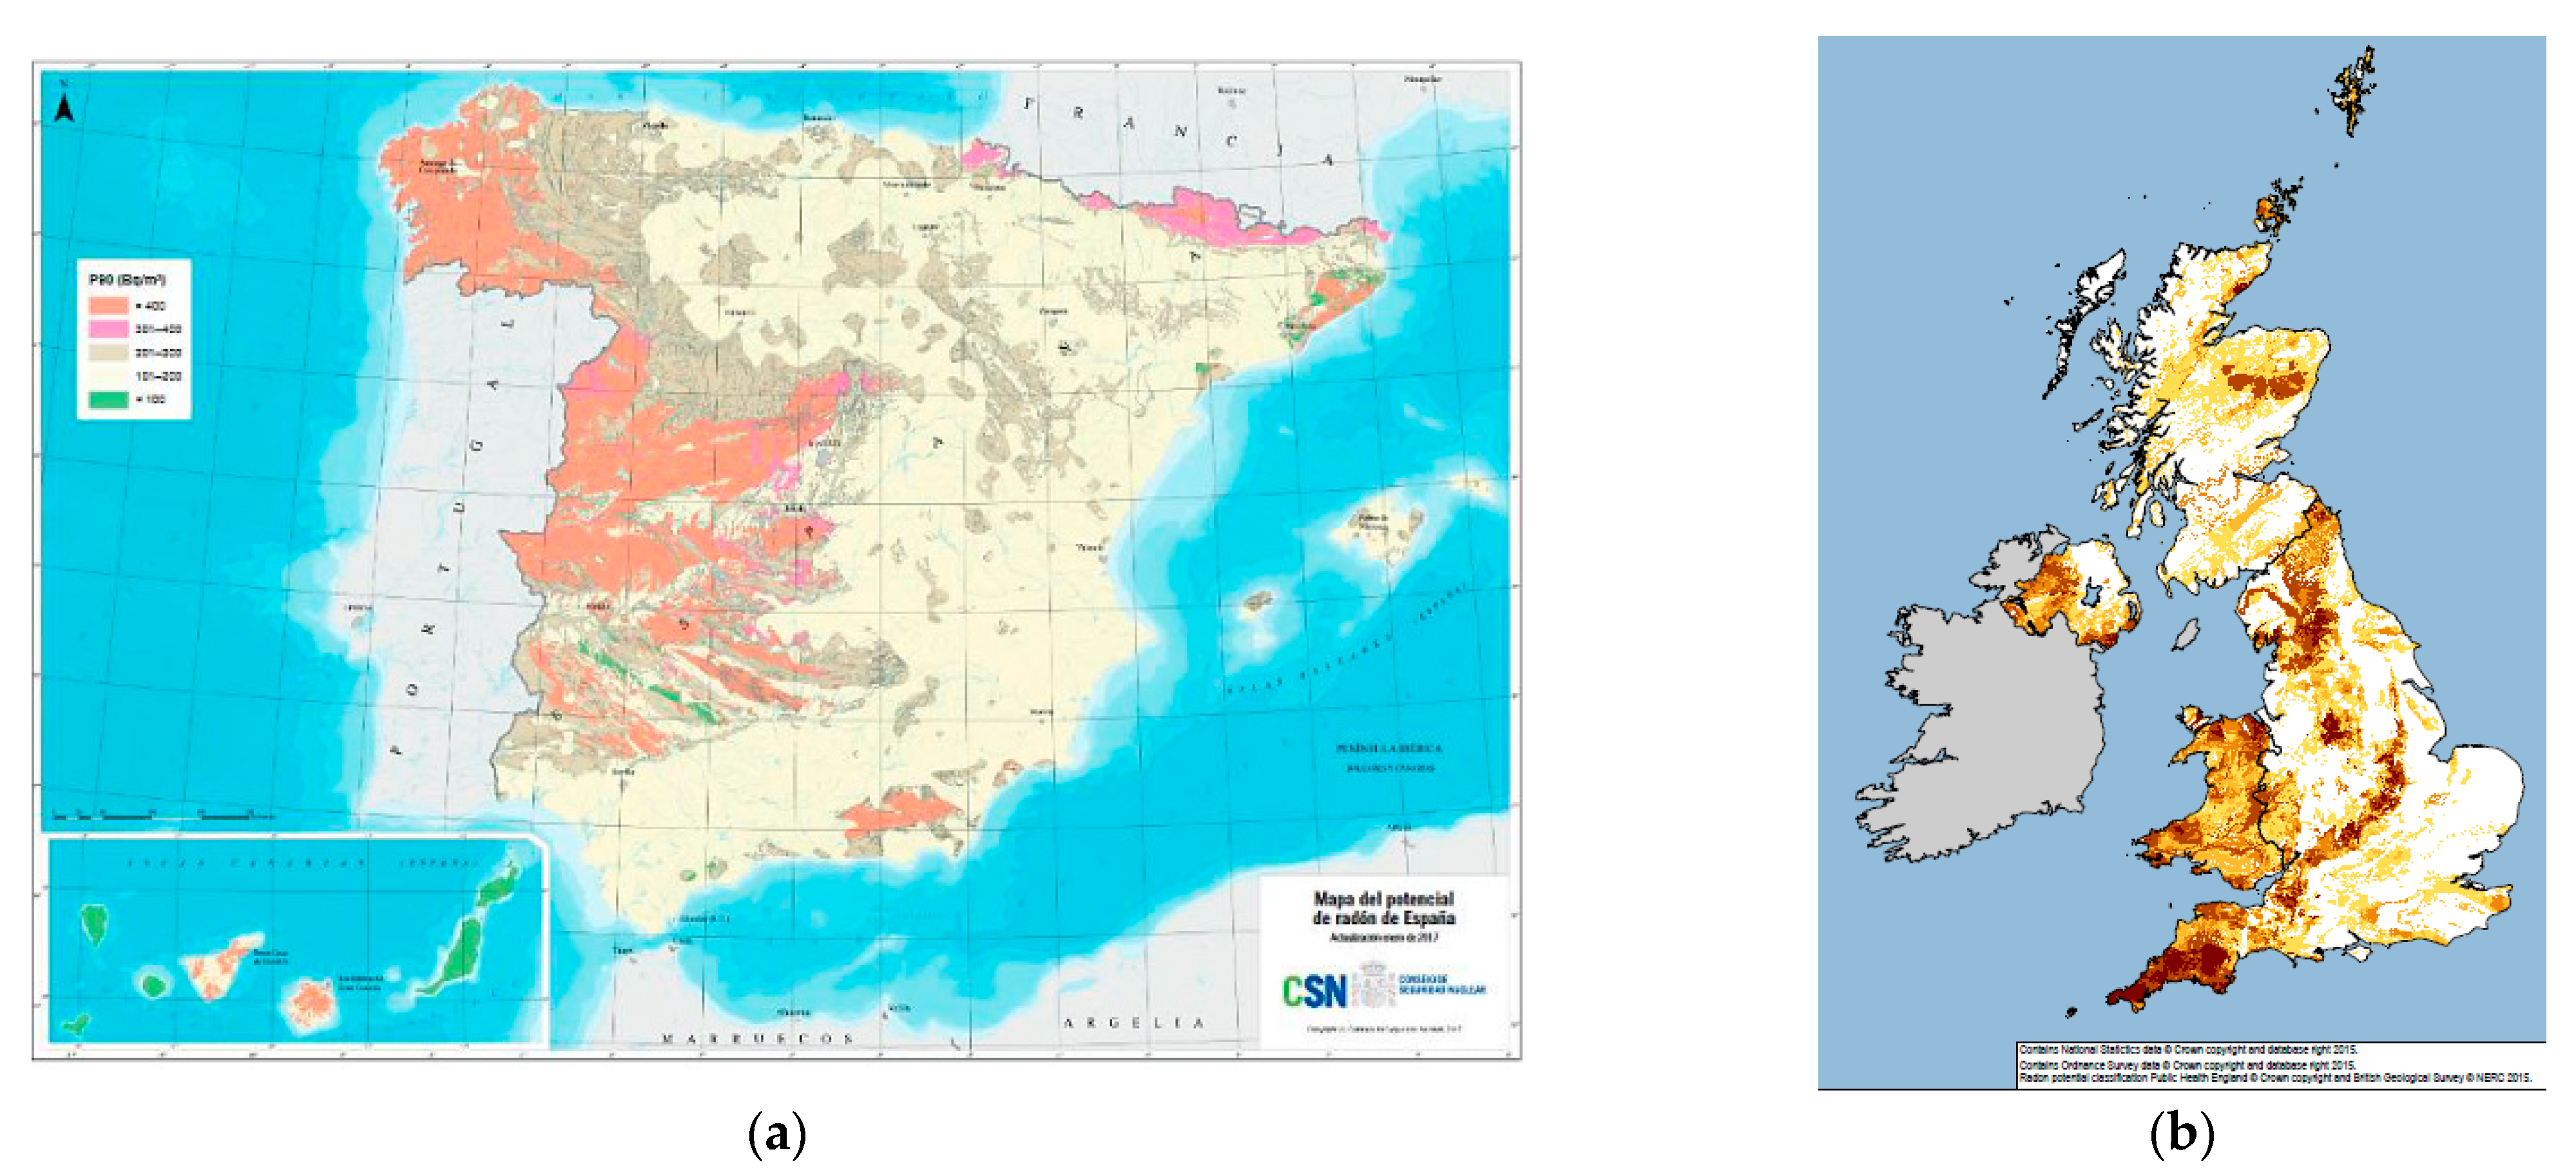
In a zone, the exposure level of radon can be determined by consulting databases from official sources, such as the Nuclear Safety Council (CSN) in Spain or UKradon in the United Kingdom. These two examples constitute the radiological protection agency of their respective countries, and both websites provide radon cartographic maps, as shown in
Figure 2.
Indeed,
Figure 2a shows the radon potential available in different Spanish provinces classified according to the radon concentration obtained in a specific sampling campaign, and
Figure 2b displays an overall map for England and Wales areas whose exposure to radon is expressed as a percentage for all residences [
8,
9].
According to the International System of Units, radon concentration is expressed in becquerel per cubic meter (Bq/m
3), where Bq stands for becquerel, and this unit is equivalent to one disintegration per second. However, the older unit, which represents the activity in a gram of radius, the curie (Ci), is also often seen as picocuries per litre (pCi/L). The relation between the curie and becquerel is given by:
The aim of this paper is to describe the details related to radon gas monitoring through a novel IoT architecture based on MQTT and Node-RED. Considering the aforementioned, a study case is presented to obtain real-time radon measurements and display them on a website.
The article is organized as follows:
Section 2 summarizes the related work about monitoring radon gas.
Section 3 introduces briefly the basic model used in IoT architecture, based on Recommendation ITU-T Y.4113.
Section 4, an IoT architecture based on MQTT and Node-RED is proposed. Next, in
Section 5, the details of the case study for monitoring radon concentration are described. In
Section 6, a brief discussion is introduced, highlighting the advantages of the architecture presented in this work. Finally, in
Section 7, the conclusion is presented.
2. Related Work
In recent years, there has been a special interest in air quality. As already mentioned, radon gas is a radioactive gas that is colourless, odourless and undetectable under normal conditions. Consequently, its presence is very harmful to health [
5], and the main route of exposure occurs through inhalation. Taking into account the aforementioned, there is a health problem related to radiological exposure of radon in countries that need to be solved.
Most commercial devices that measure radon concentrations tend to be expensive. Additionally, many of them are devices that offer a screen to display the data or have a serial, WiFi or Bluetooth interface that allows connection to a computer to extract the measured data.
The use of this type of sensor within IoT architectures is recent. Consequently, there are few studies where other authors use IoT systems to monitor radon concentrations.
The work by Amato et al. (2019) [
10] proposes an IoT architecture to measure radon gas. The authors use sensors, a processing unit as a single-board computer (SBC) to transfer the information via client/server socket application and a communication unit, using WiFi connection or 4G modem, see
Figure 3a. Blanco-Novoa et al. (2018) [
11] propose an IoT architecture too. The authors present an architecture based on three subsystems: sensor subsystem formed by a sensor and a microcontroller ESP8266; service subsystems with two APIs to develop the communications with the sensor and the users; and the visualization subsystem, which shows the radon concentration values. The data are evacuated by WiFi connection to the cloud and to the client-side. In this case, HTTP methods are used to send the data, see
Figure 3b.
In [
12], the authors use the IoT edge device, LoRaWAN network and RESTful API to send the data. The authors in [
13] present a secure and complex architecture of radon monitoring using two communication technologies: WiFi and Sigfox. MQTT is used to send alerts of high radon concentration, and Node-RED is used to process the data. This work focuses mainly on the security aspects of the architecture.
In [
14], an outdoor IoT architecture is proposed. The authors measure radon concentrations and monitor volcano activity. The data is sent with Json files using the Elastic Stack Suite platform (Beats, Logstash and Elasticsearch products from Elastic) using LoRaWAN. Additionally, the data is visualized using the free software Grafana. The authors use the MQTT protocol to share the collected information with users.
In this work, we propose an architecture based on lightweight messaging protocols as MQTT [
15] to send the data collected by the sensors and Node-RED [
16] as a tool based on the data flow.
To connect IoT devices and create a network, no matter what type of, it is necessary to describe the communication protocol, usually M2M (machine-to-machine). In this research work, MQTT is used as the standard messaging protocol for the Internet of Things. Furthermore, another aspect to be considered in the system is the management of radon concentrations for storage and further processing. In this case, Node-RED is the IoT tool that allows data flows to be created and managed.
3. IoT Architectures
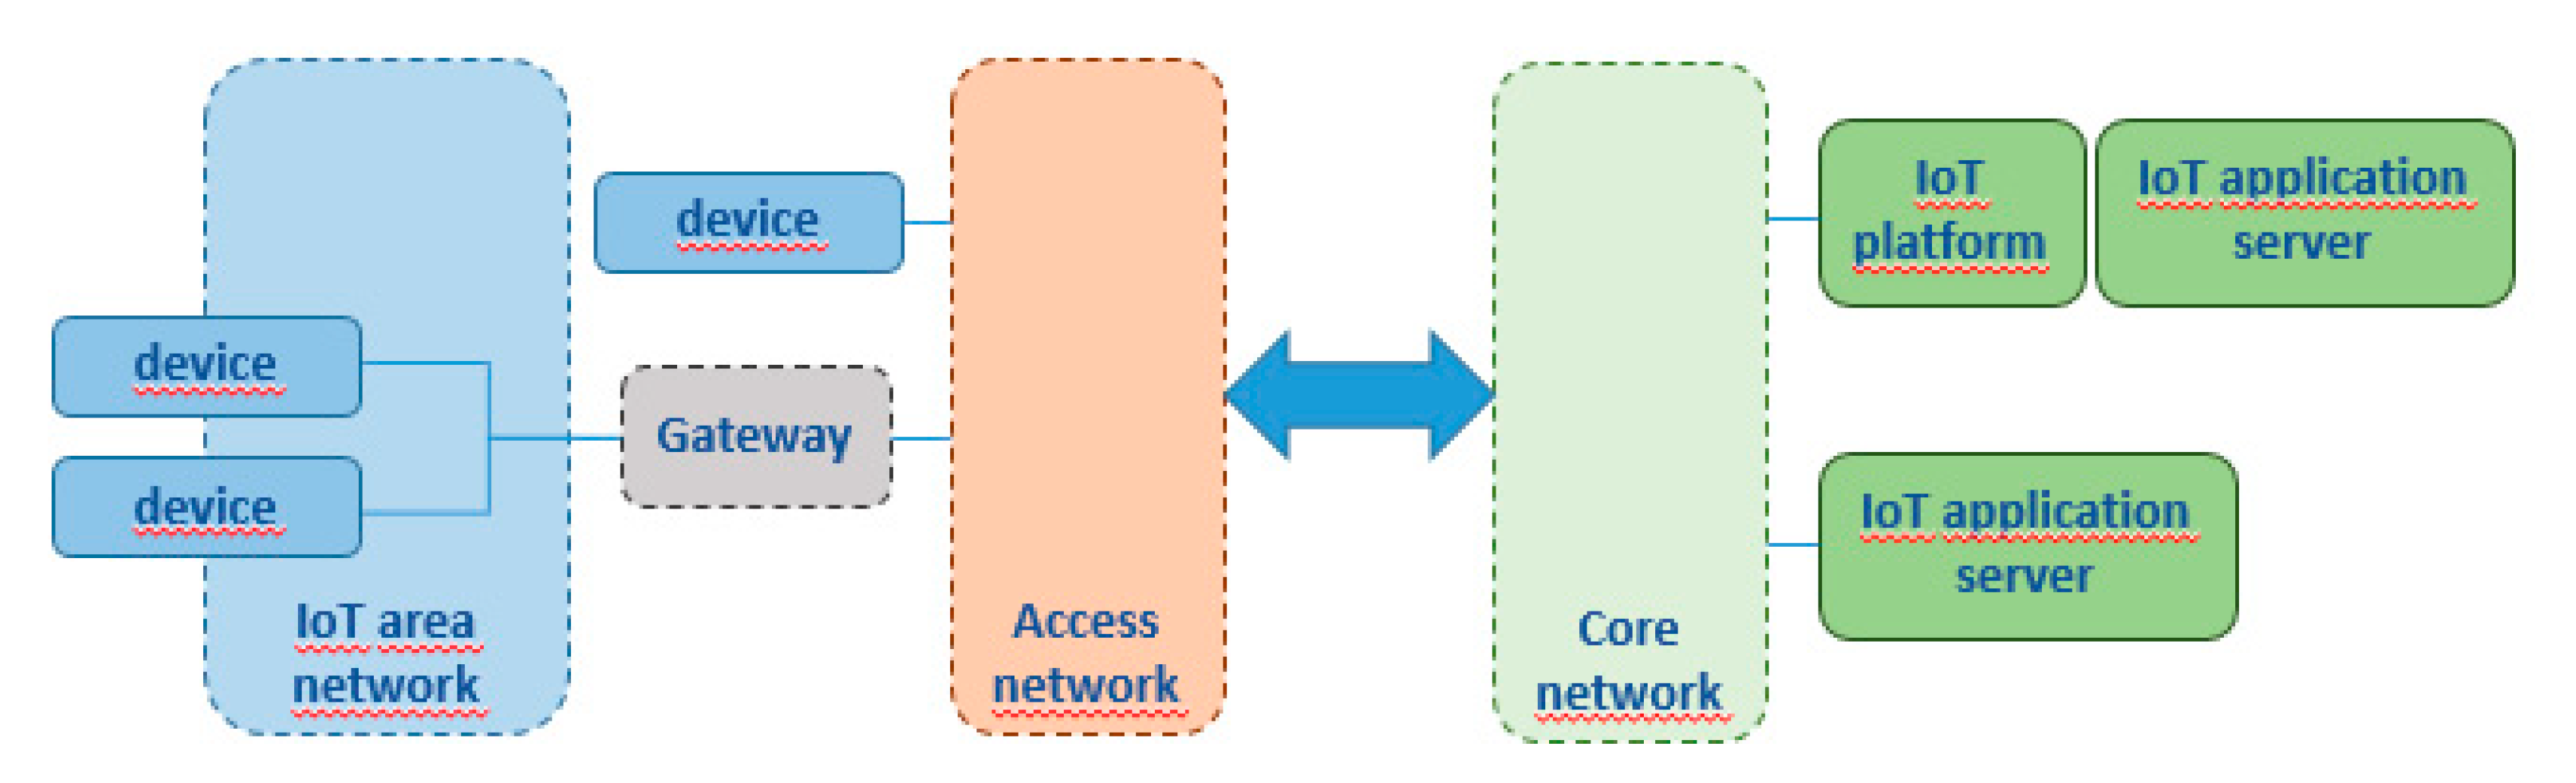
The Internet of Things has experienced rapid growth in recent years; since then, different architectures and protocols have been proposed. Recommendation ITU-T Y.4113 [
17] presents the basic model, which is composed of the following blocks: IoT area network, access network and core network (see
Figure 4). The IoT area network consists of devices capable of capturing data (sensors), actuators, storage and communication capabilities. The access network is responsible for enabling IoT devices to connect to the core networks. Access networks can be implemented using different technologies, either wired or wireless, such as WiFi, Bluetooth or 4G, among others. Finally, the core network provides the connectivity infrastructure from the access network to the service provider. It contains the ability to provide the connection to servers, which can process the data, store it and display the data received from the access network.
This block includes the servers with the IoT applications or platforms already developed to facilitate the implementation of this type of architecture.
The elements involved in this model are briefly discussed below. The authors in [
18] identified all the components and regulations that are involved in an IoT architecture.
3.1. Device or Mote
In this block, we find the devices, normally known as motes. These elements are devices with computing and connectivity capabilities since they are designed to be located in remote places in order to collect data or act upon events. Therefore, they are devices that can carry both sensors and actuators that are connected to a microcontroller or single-board computer (SBC). These microcontrollers or SBCs are responsible for capturing the data, processing it and sending it to the network or performing any action on the actuators in an event. These devices are designed with low power, low cost and Internet connection goals in mind.
Another aspect to take into account is the size of the data that is transmitted/received by the device. Low consumption means that the size of the data being transmitted is text type and small in size.
In many cases, a gateway is needed to translate the protocols or messages from the sensors/actuators to the protocols that are used in the core networks.
3.2. IoT Messaging Protocols
The authors in [
19,
20,
21] review the protocols used in IoT. A comparison of these protocols can be found in [
20]. In [
19], an IoT platform is presented that supports multiple application layer communication protocols providing a unique environment. Moreover, a comparative study of the different protocols is also evaluated in this work. One of the protocols responsible for message transmission is the Message Queuing Telemetry Transport (MQTT) protocol. Indeed, it is the most widely used. It runs over TCP port 1883; therefore, it is a connection-oriented protocol. MQTT uses the publish/subscribe pattern, and it is based on the transmission of short messages. This protocol is used between machine-to-server (S2M) and machine-to-machine (M2M), and the routing mechanism can be one-to-many, one-to-one and many-to-many.
The Constrained Application Protocol (CoAP) is another messaging protocol. It runs over UDP, and it is based on REST and uses methods, such as GET, PUT, POST and DELETE.
The Advanced Message Queuing Protocol (AMQP) is an open standard message-oriented application layer protocol that uses the publish/subscribe pattern.
The Extensible Messaging and Presence Protocol (XMPP) is a protocol for real-time communication such as voice and video applications. XMPP is a suitable protocol for interpersonal communication that is supported by the TCP transport protocol. Indeed, XMPP uses the publish/subscribe pattern and request/response messages.
3.3. IoT Communication Technologies
The communication protocols that enable the connectivity to the devices with the core network define the format of the data to be transmitted, the routing used, the flow control and the retransmissions of the lost packets [
18].
Table 1 shows the main characteristics of the technologies used in IoT.
3.4. IoT Platforms and IoT Aplication Servers
Many platforms can be found at present that are capable of processing data directly by applications on servers or by platforms specifically designed for data processing and graphical representation. In [
18], the IoT platforms are classified into five main types: connectivity platforms, device management platforms, cloud platforms, application enablement platforms and advanced analytics platforms. The edge platform comprises a type of cloud platform located between the access network and core network, which is defined in Recommendation ITU-T Y.4208 [
22].
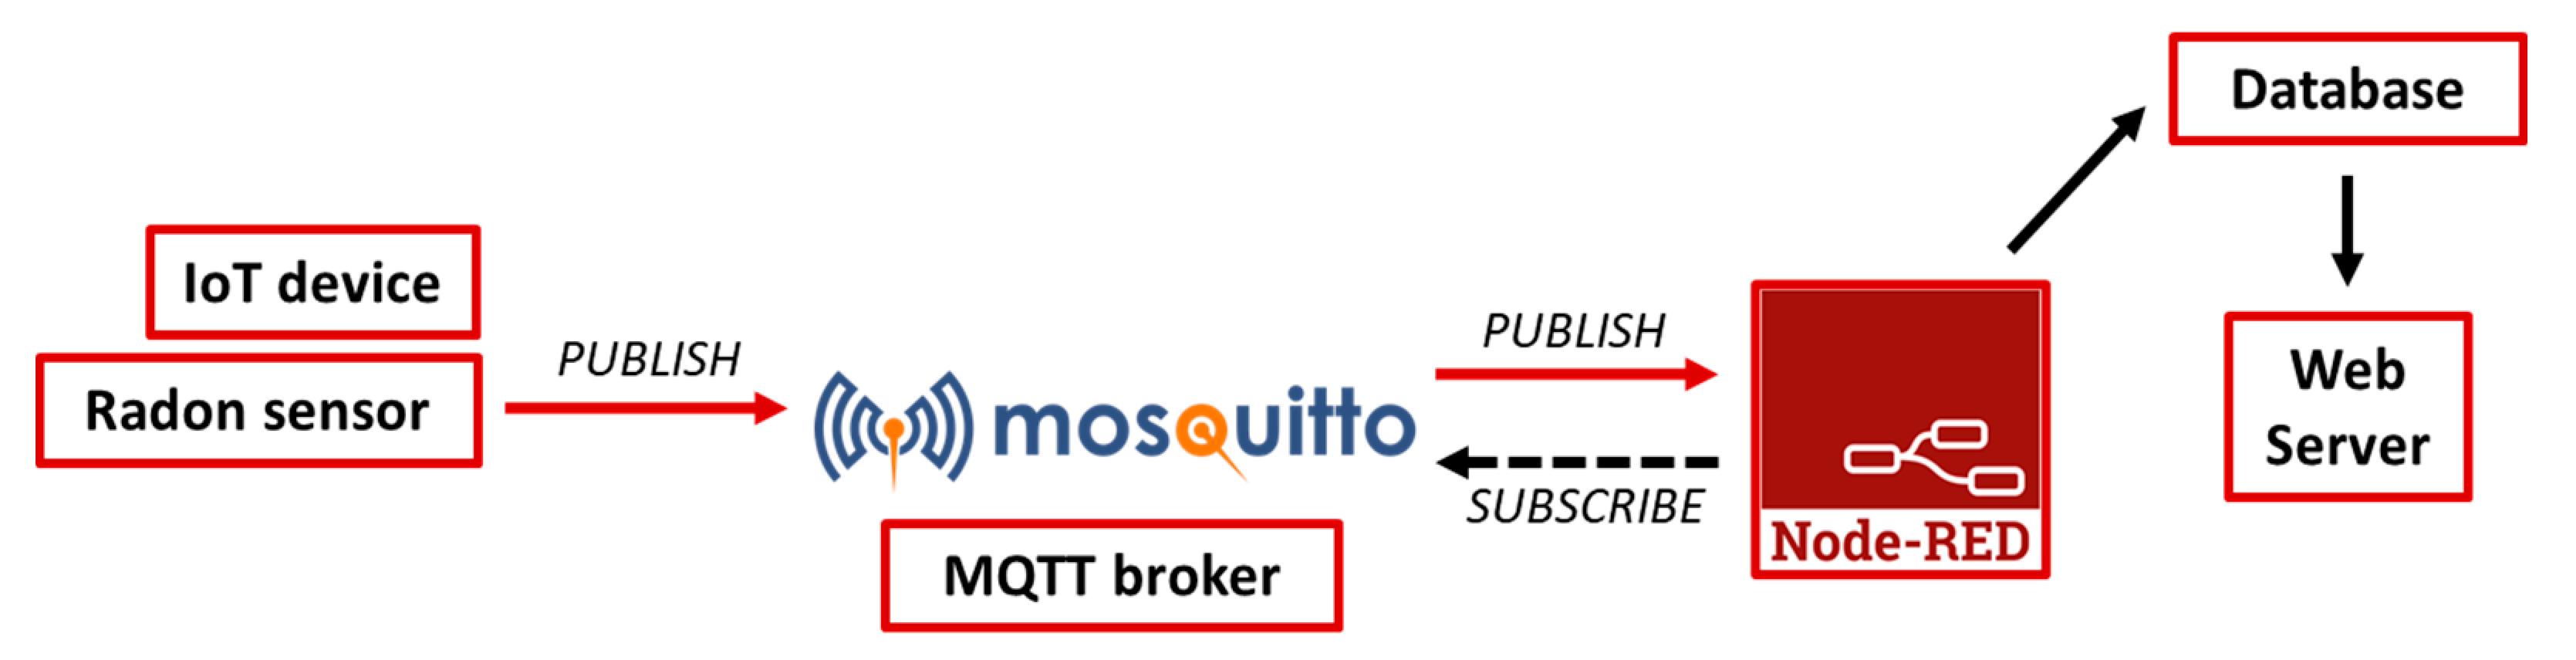
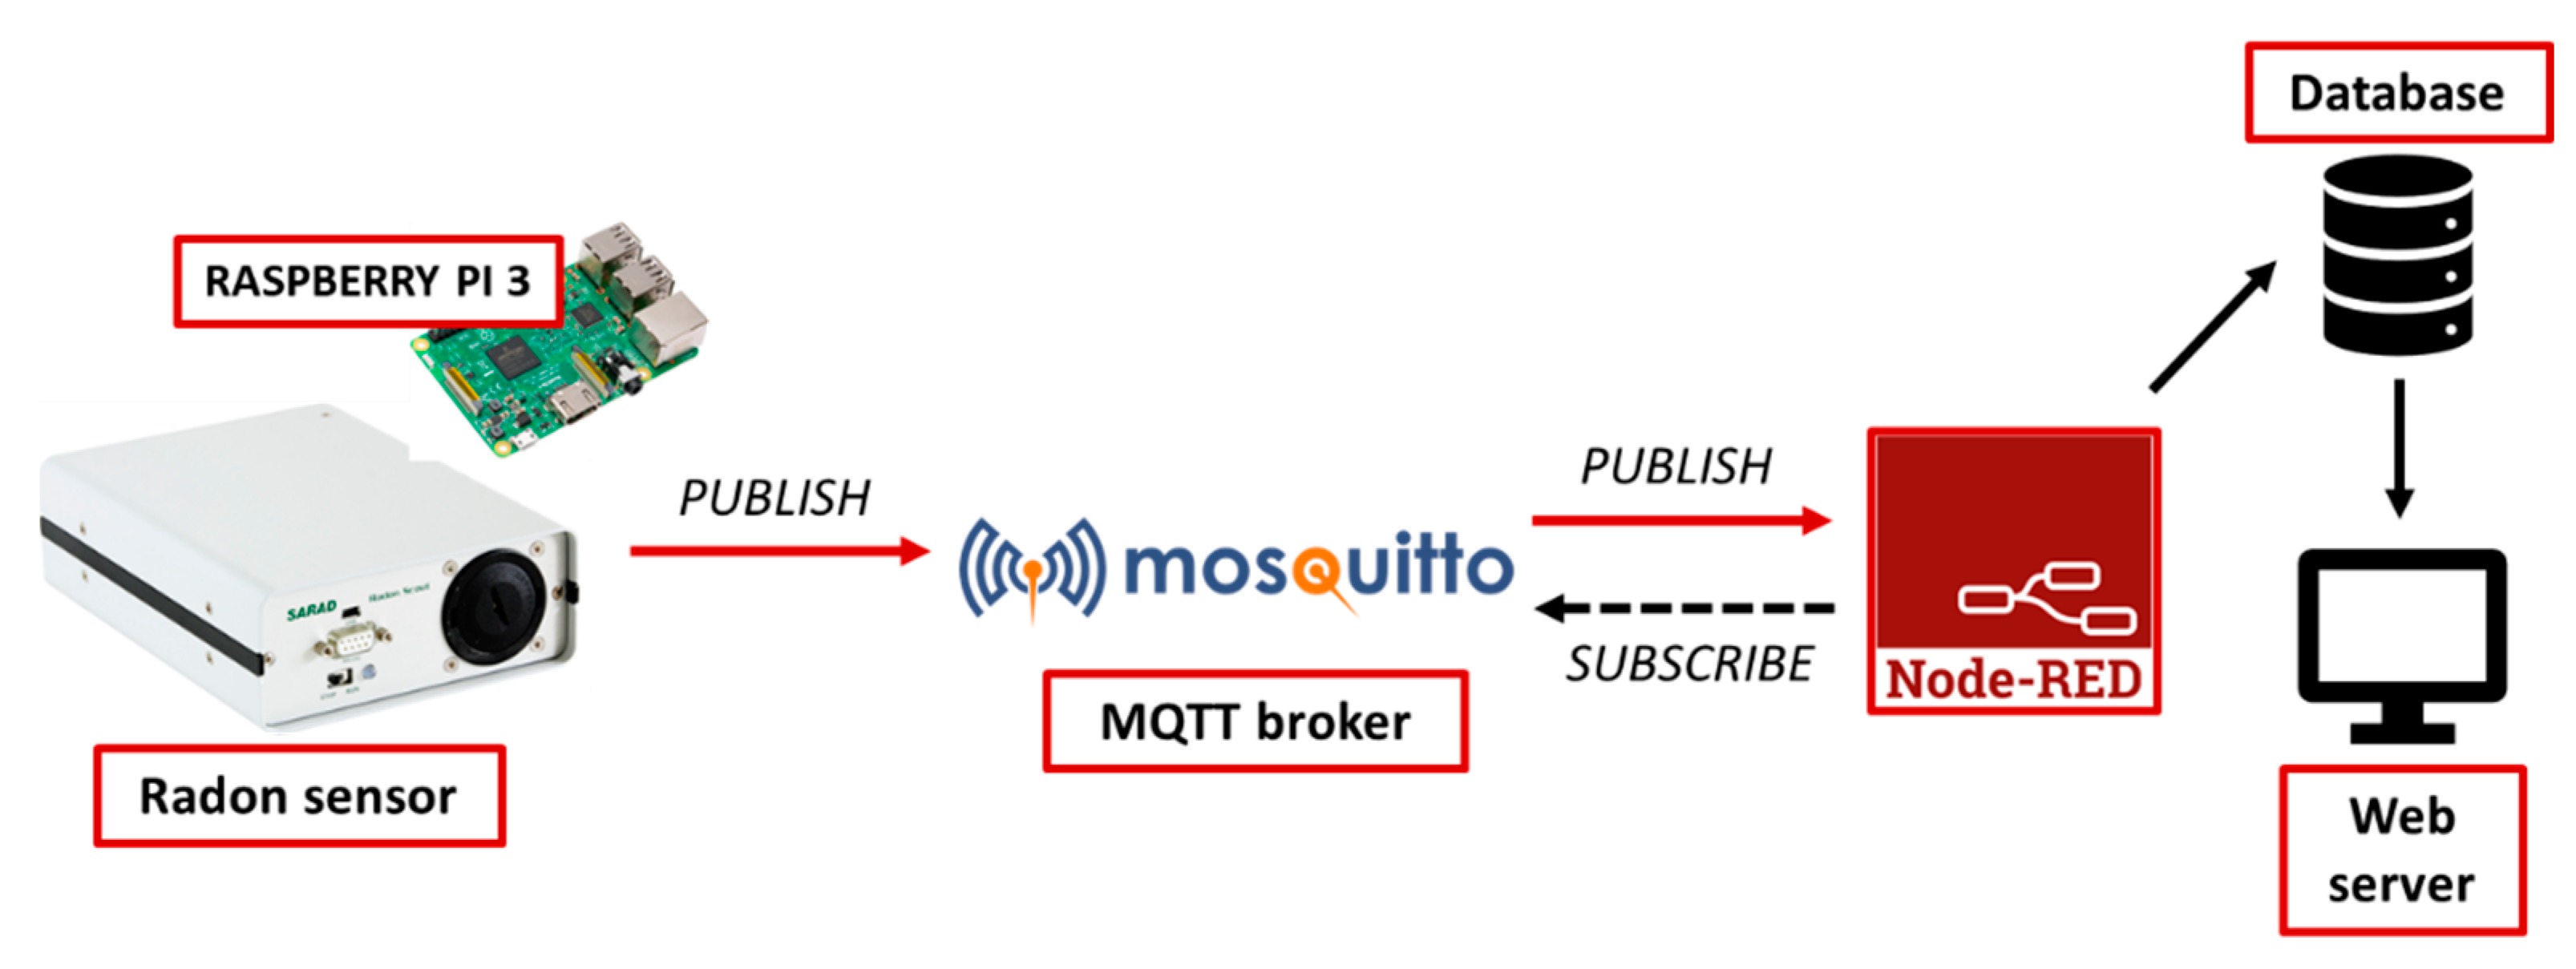
4. Proposed IoT Architecture
Based on the previous section, the elements that are involved in our proposal must be selected. The proposed IoT architecture scheme of this work is going to be exposed in
Figure 5. Next, each element of the architecture will be described in order to know what role it plays in the system. These components are a sensor, an IoT device, an IoT messaging protocol, tools for data flow as well as database management and a web server.
4.1. Sensor
The function of a sensor in an IoT system, as for any other environmental parameter, is to provide information about levels and early detection and alert the user to mitigate the hazard. In this work, a radon sensor has been used to evaluate the IoT architecture. It is common to use companies with assessment services, consulting and sales of products for radon monitoring in homes or workplaces. These products can also be purchased from different online sales platforms as long as they comply with accuracy and safety protocols.
Taking into account that radon varies depending on the porosity of the walls and the ventilation habits inside a building, there is a heterogeneous distribution in constructed homes that is difficult to theorize. Because of these fluctuations, it is not advisable to perform rapid radon measurements to obtain reliable data and to know whether it is necessary to implement anti-radon solutions [
5,
23].
Considering the above, the minimum components that integrate a radon monitoring system are a sensor, a monitoring unit, wires to connect the different elements and a power supply that provides the power consumption for long measurements [
11]. At a professional level, a continuous assessment of radon exposure over a period of at least three months is required for reliable results. Indeed, short-term radon tests are mainly intended for domestic use [
24].
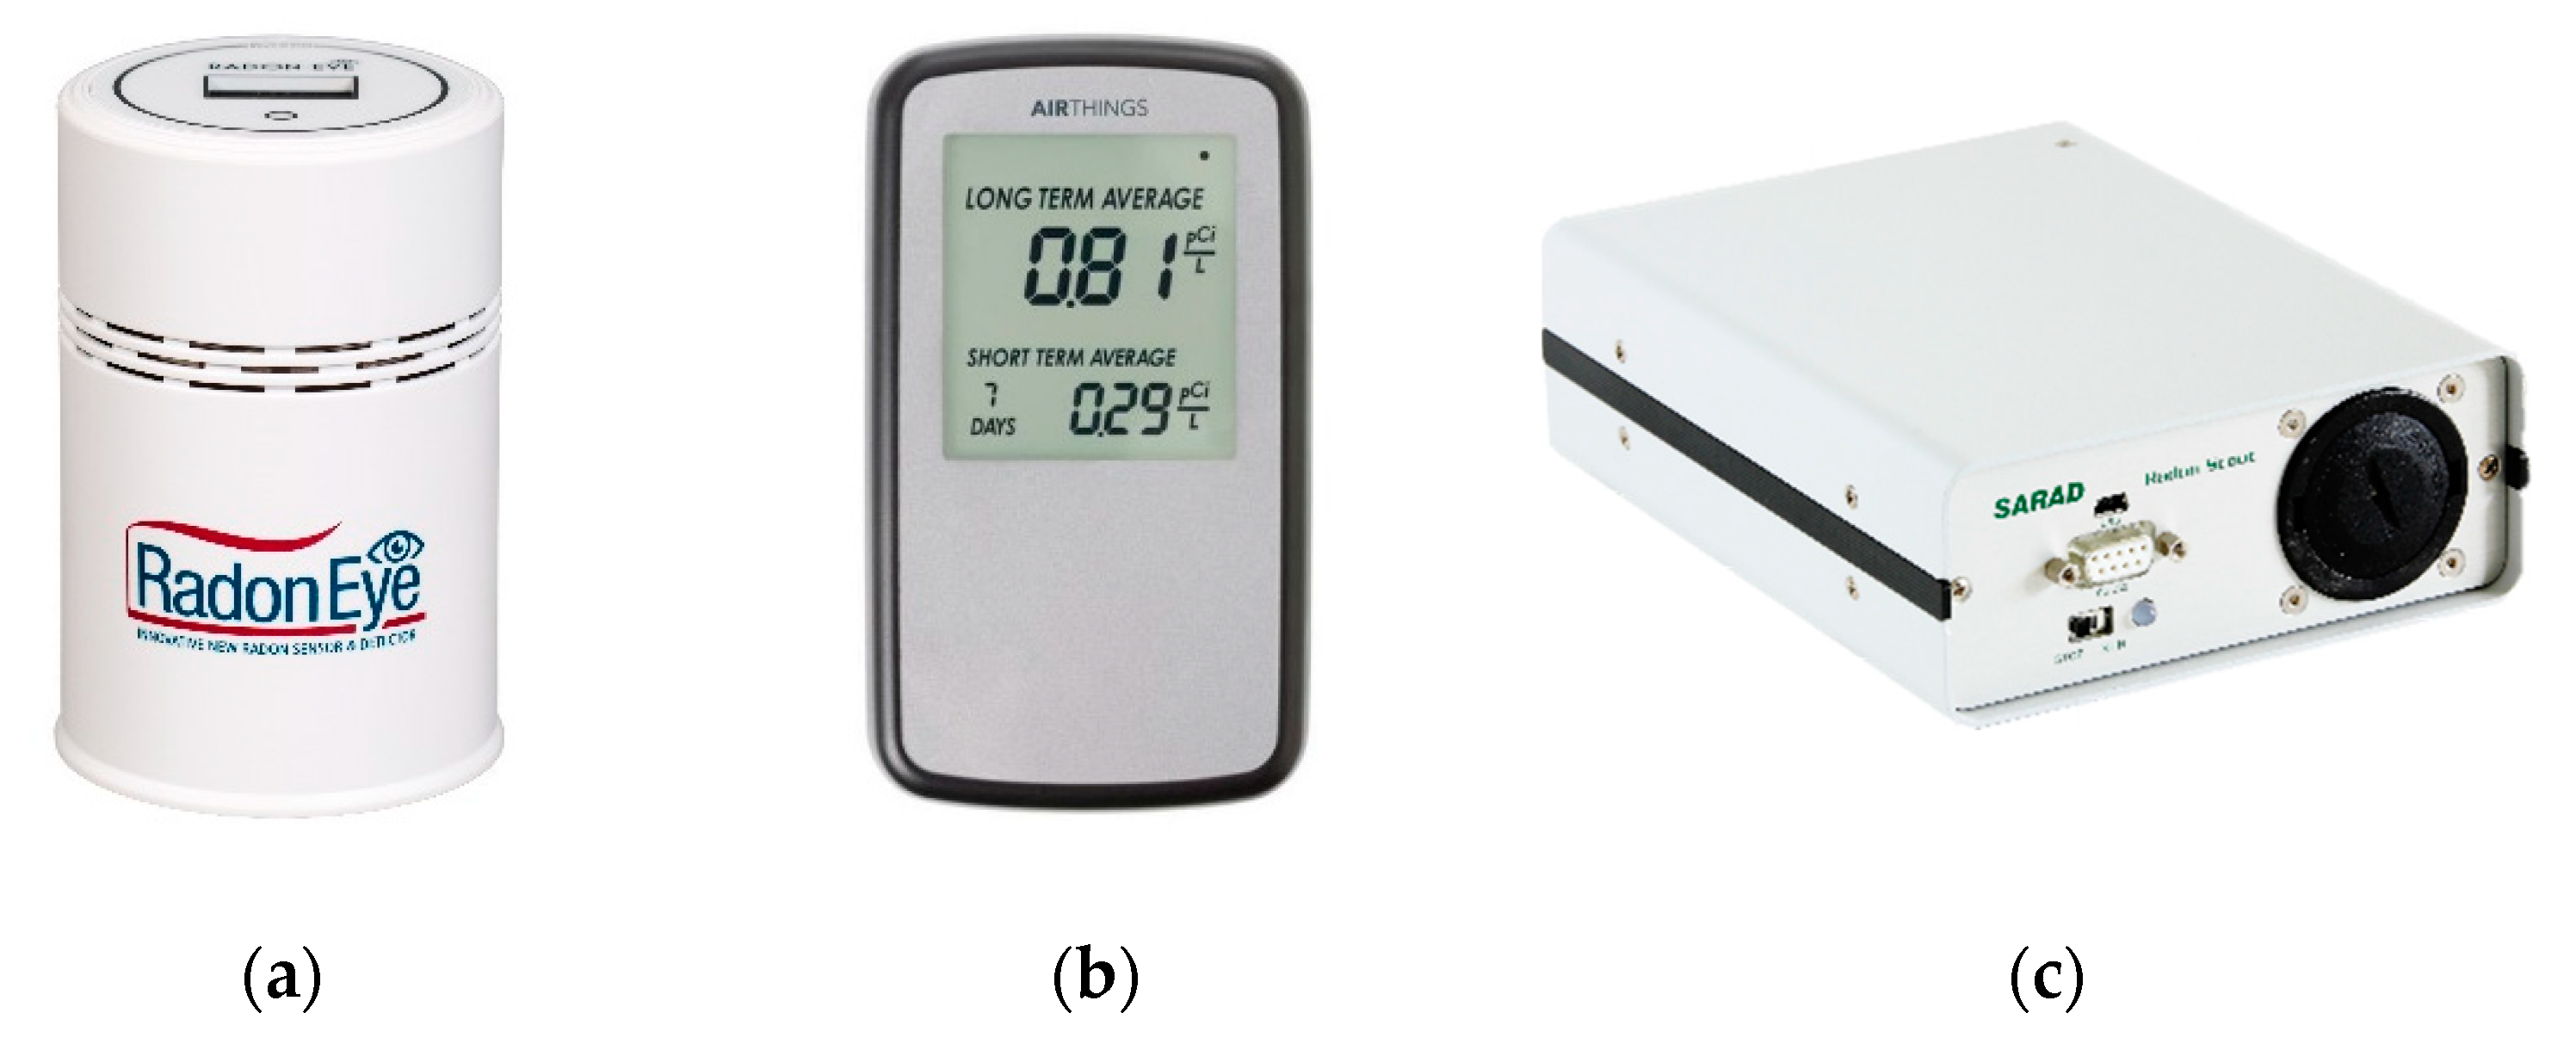
The characteristics of three radon detectors are described below: RadonEye RD200, Corentium Home and Radon Scout (
Figure 6). They are commercially available sensors that use different communication paths between the controller and the user.
First, RadonEye RD200 is an intelligent radon detector for real-time monitoring of enclosed spaces, designed by FTLAB in Korea. It is based on a screen that displays the performed measurements and a radon detection module (RD200M). In addition, the data transmission is carried out via Bluetooth to enable the data visualization on a mobile device or tablet.
Secondly, Corentium Home is a detector manufactured in Norway by Airthings and belongs to a full line of long-term measurement devices. Contrary to the previous detector, the Corentium Home must be placed on a horizontal surface with respect to the ground to work under optimal conditions.
Lastly, Radon Scout is a professional radon sensor from SARAD in Germany, and it is programmed to measure air quality, in terms of radon, inside indoor spaces. The data obtained by the sensor can be read out with the Radon Vision software. The radon measurements are transferred to the terminal equipment remotely by various USB inputs, such as direct cable or serial port. Additionally, this device has temperature and humidity sensors included.
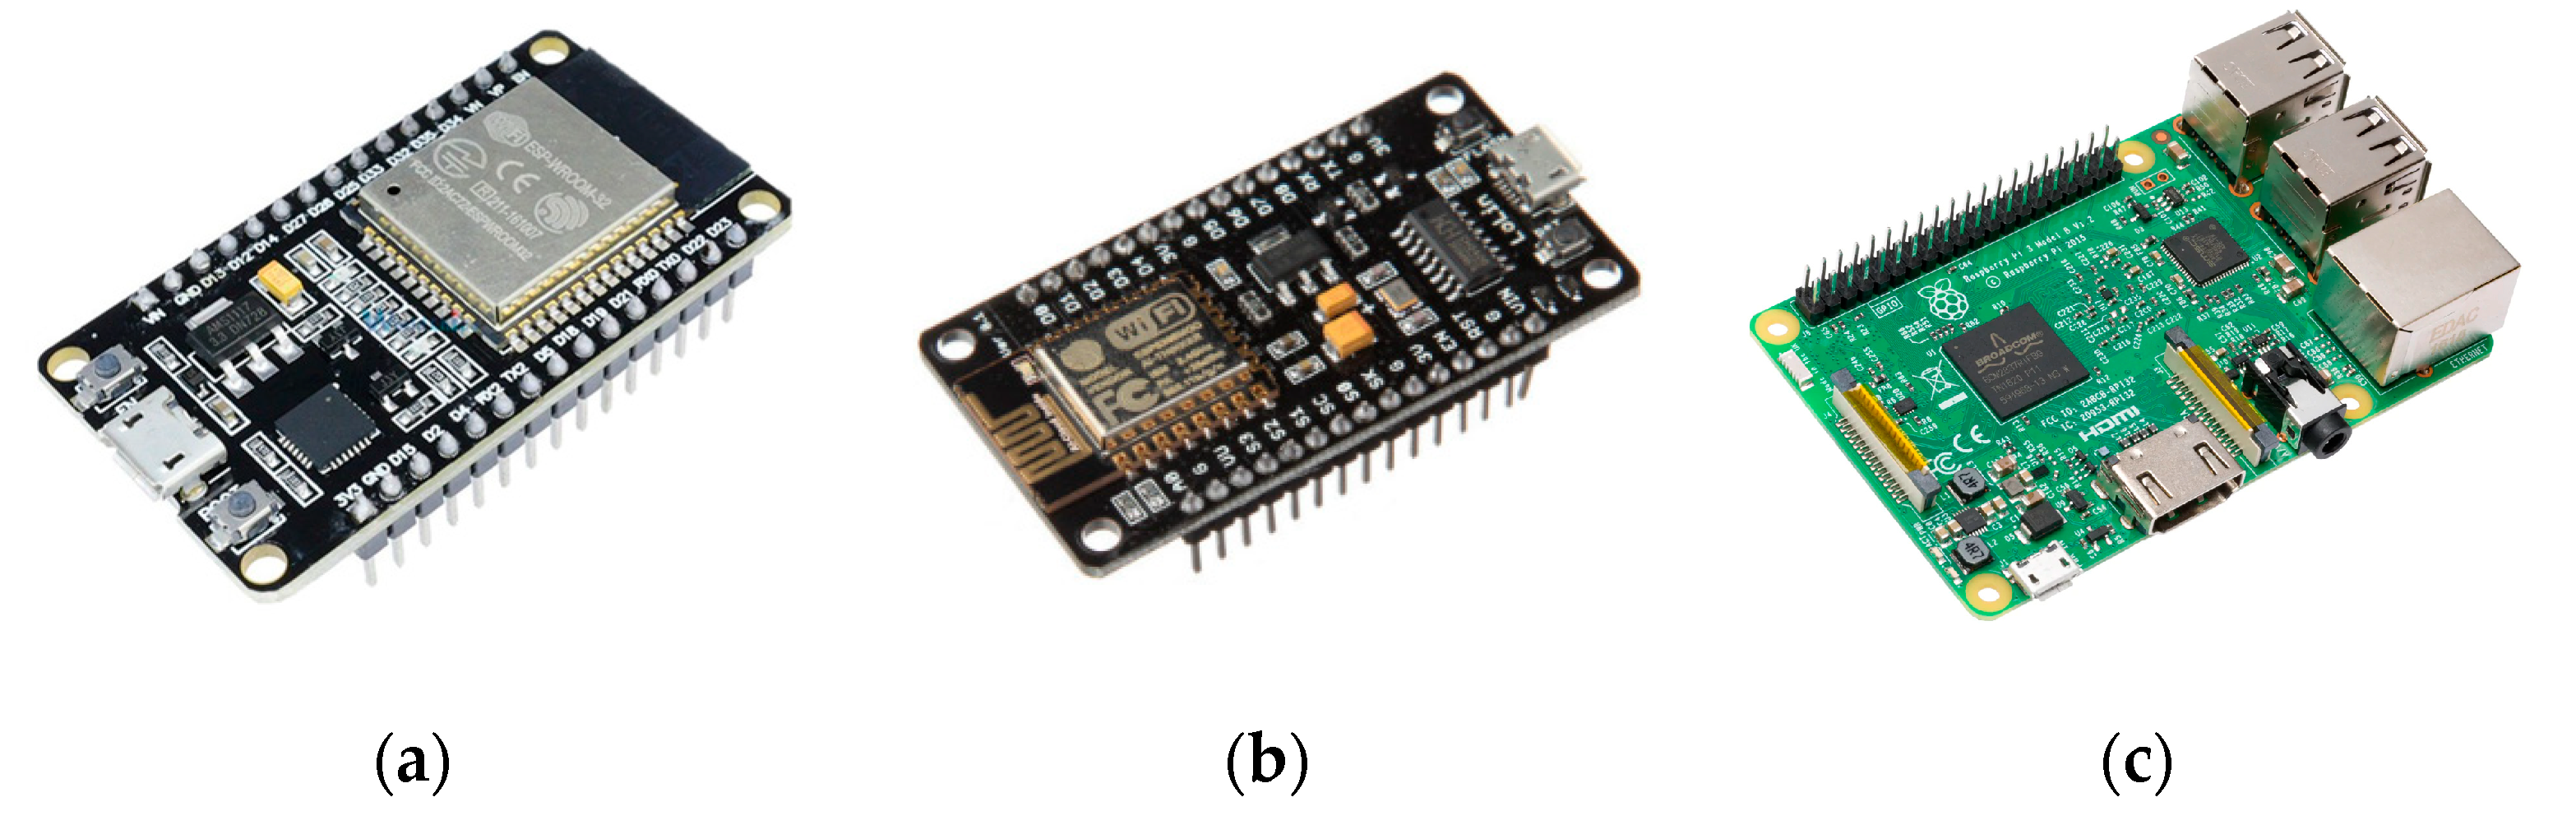
4.2. IoT Devices
The second component of the IoT architecture for monitoring radon is referred to as IoT devices. This is a physical object programmed to perform the functions of receiving and transmitting information over the Internet, usually known as a microcontroller [
25]. In
Figure 7, some models, such as the chip series (ESP32 and ESP8266) and single-board computer (SBC), such as Raspberry Pi products, will be discussed below.
On one hand, ESP32 and ESP8266 belong to the family of System on Chip (SoC) integrating Wi-Fi MCU (microcontroller), made by Espressif Systems. These two chips are designed for a full spectrum of applications, for IoT in particular. It is worth noting that the ESP32 has Bluetooth connectivity compared to the ESP8266. Other differences between these chips can be seen by reading their datasheets: standby power consumption, hardware encryption and a processor, among others.
On the other hand, a single-board computer is referred to as tiny electronic devices that include components of a computer. Because of its potential, it can be used for applications, such as house automation, despite the fact it is a non-IoT-oriented device.
4.3. MQTT
This third part of the architecture involves the widely used IoT messaging protocol that utilizes low-power devices: MQTT (Message Queuing Telemetry Transport). This is a lightweight messaging format that provides reliable communications between units, based on the Publish/Subscribe model for wireless sensor networks [
15].
The architecture that defines this technology is divided into three elements: two clients and a server (broker), and the first element corresponds to the client that publishes information and sends it in the form of messages to the other end of the network. The second client is the one who subscribes to a specific topic and receives the previous data, having the possibility of interacting with the first part by sending messages as well. The broker is the element that allows the bidirectional exchange of information between clients and keeps the devices connected to the cloud. That is, clients subscribed to a topic can receive and send messages via a broker. In
Figure 5, the clients are related to the radon sensor (which has the information) and Node-RED (which receives the data).
Specifically, an MQTT broker is the component that keeps the information from sensors classified in different topics and distributes it to subscribed clients. A very famous example of an open-source MQTT broker is Mosquitto. It is a server developed by the Eclipse foundation that can be used in various environments and operating systems, and its installation is compatible with mobile devices or microcontrollers. It should also be noted that it is used under the Eclipse Public License (EPL).
4.4. IoT Aplication Server
4.4.1. Node-RED
Node-RED is defined as an open-source editor that facilitates workflow management. Thus, the nodes of this low-code programming tool need to be interconnected to fulfil the function of the user creating the structure [
16]. In the presented architecture, the purpose of Node-RED is based on receiving the radon sensor information from the MQTT broker and leading the data flow to database storage. This process is carried out with a previous subscription of the Mosquitto broker to a topic.
4.4.2. Databases
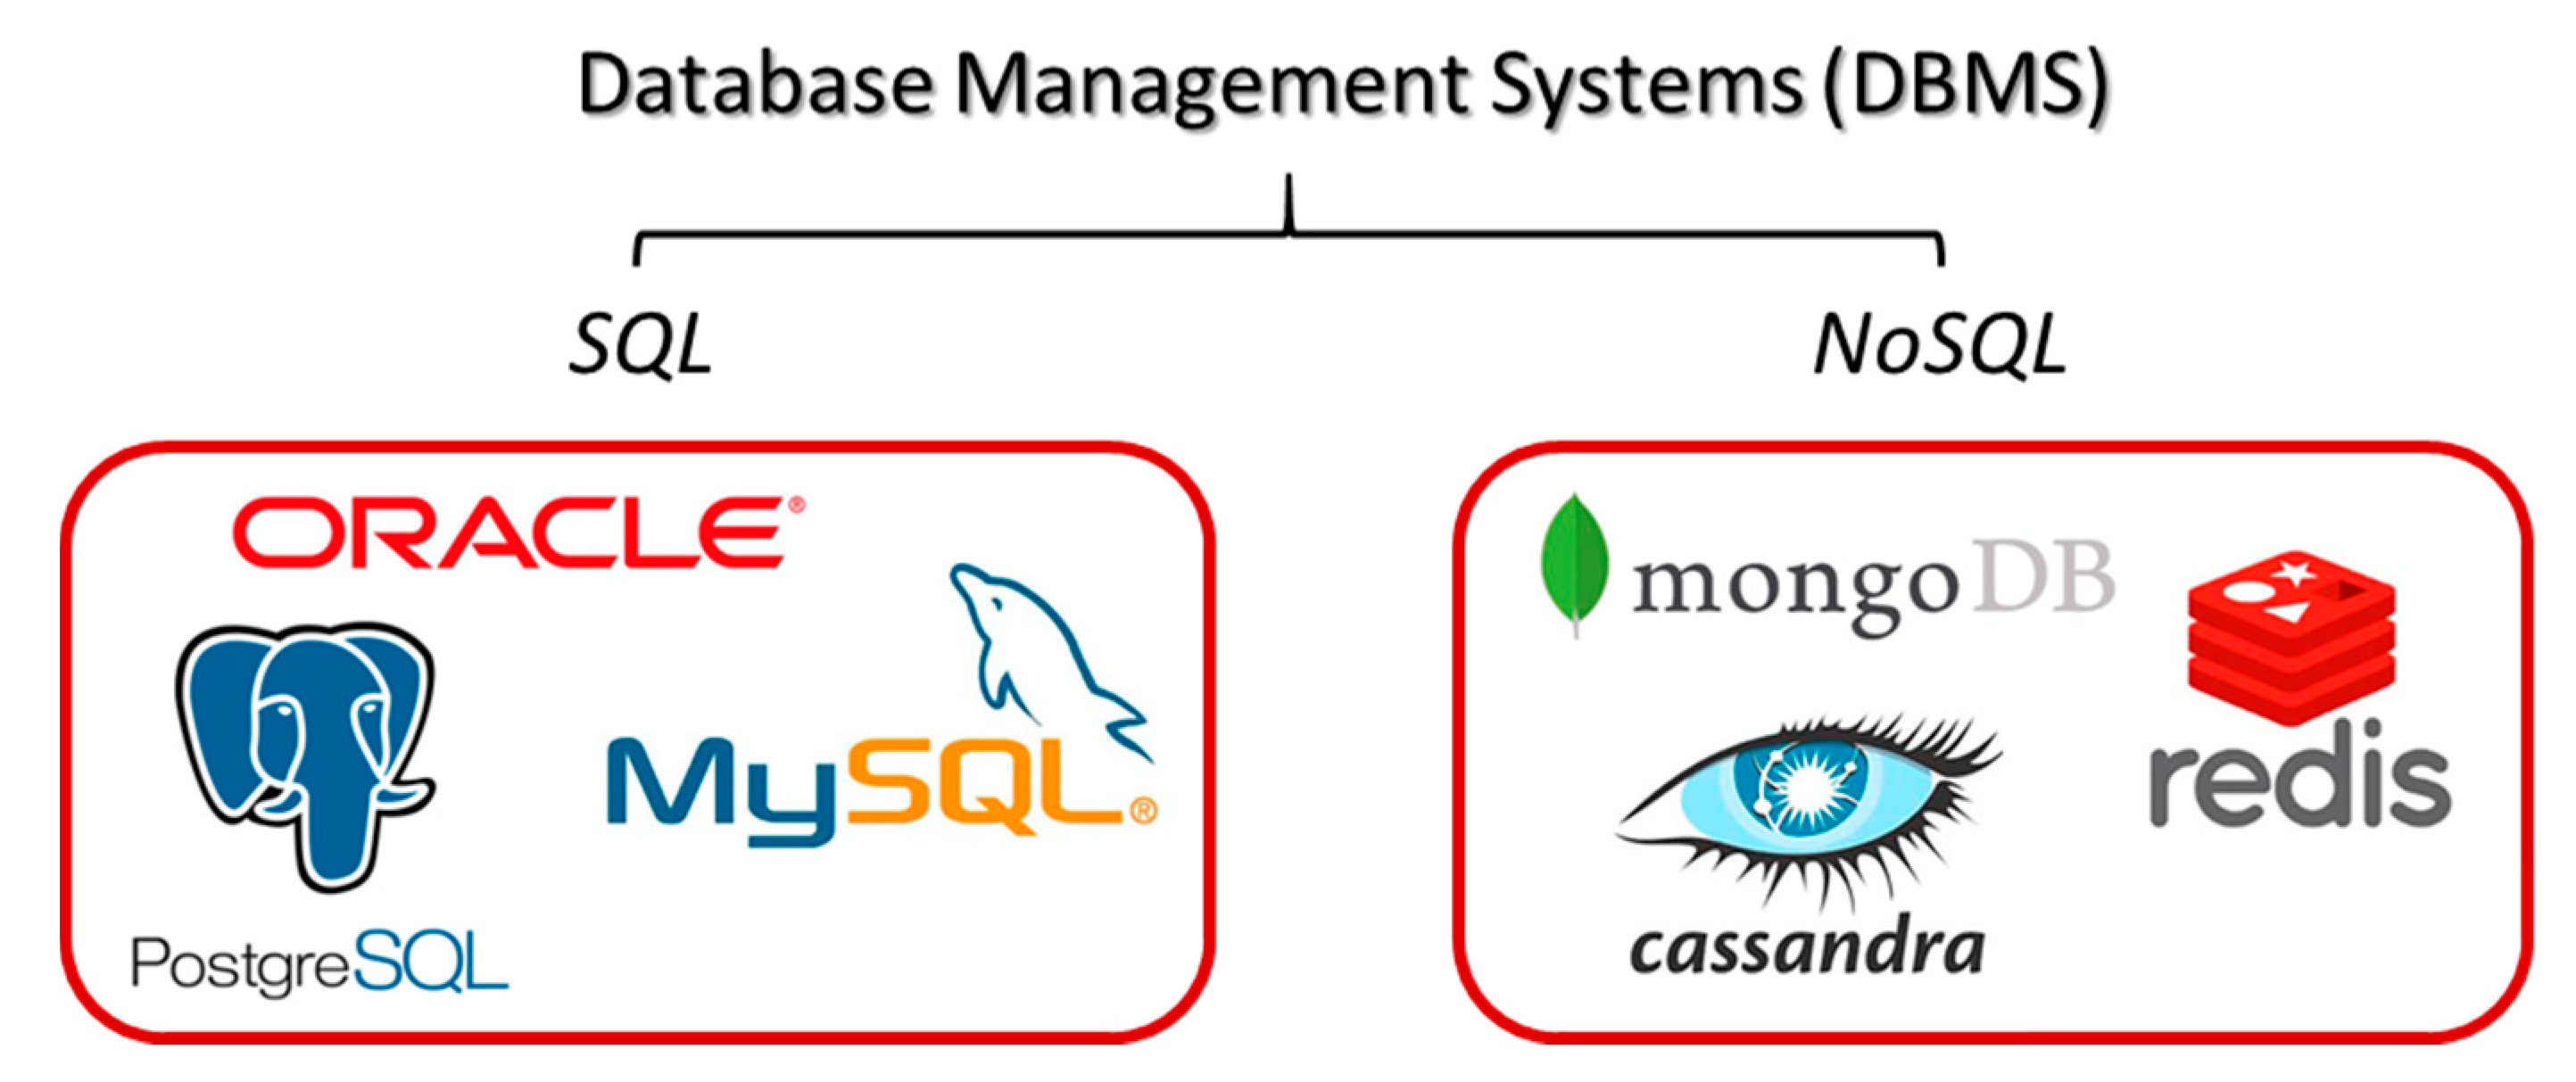
The purpose of a database is related to the storage of the sensor information so that the data can be handled with queries and performed when needed. The Database Management Systems (DBMS) allows data storage and user access to modify or edit the database are often used for this purpose.
During the design of a database, it is necessary to take into account the structural scheme of the information to be stored as two different models can be used: SQL and NoSQL. The SQL model (Structured Query Language) uses a high-level language where the database is organized into related tables with the assignment of primary or foreign keys. The primary key provides unique values to the values of the rows in a table and plays the role of identifier against other records; therefore, they cannot be repeated. Meanwhile, the foreign key can be applied in several tables, and the assigned fields are the same because they are related to a primary key of another table.
On the other hand, the NoSQL system is applied in databases whose storage does not follow a defined structure and does not use the SQL language to perform queries. Due to their simplicity, these databases are easy to develop and support large volumes of information because they are not divided into smaller entities. In
Figure 8, some DBMS have been classified to provide some examples, and they are relational (SQL) or non-relational (NoSQL) databases.
A typical concept of relational databases is the Entity-Relationship Model, and it is the structured design of the information that is implemented in a DBMS. This model is composed of several elements, such as entities and attributes. The entities represent physical objects, and the attributes represent qualities. Consequently, the relationship that links one entity to another is identified by an attribute. It should be noted that there are different types of relationships, which depend on the number of entities involved.
The database in
Figure 4 should be defined based on the aforementioned, plus knowing that there are two types of platforms that offer storage services: local (on-premise) and cloud (remote). A local database is a program where the user is responsible for the security and management of the information, including the infrastructure. Meanwhile, a cloud database does not require local physical storage. The latter is easily accessible compared to a local database, is ubiquitous and has the security of the network. Otherwise, a remote database is based on cloud computing technology (providing service over the Internet).
4.4.3. Web Server
Finally, the last element of the architecture illustrated in
Figure 5 concerns the web server. This is a device that holds websites, webpages and connects to the Internet for data exchange and visualization. In addition, a web server offers HTTP (Hypertext Transfer Protocol) support, which specifies how hypertext (linked web documents) can be transferred between clients.
For this purpose, the radon concentrations obtained by the sensor should be presented as a historical record and plotted on a map, available on the website.
5. Study Case: Radon Monitoring
The methodology used to perform the database programming and the website design includes the following steps: data extraction from the radon tester, IoT device programming with MQTT, database design and implementation, data flow management with Node-RED and website integration. Accordingly, the components involved in the proposed architecture for the case study are presented in
Figure 9.
5.1. Data Extraction from Radon Sensor
In the first instance, the Radon Scout sensor has been used for radon gas measurements, but the main idea is that the proposed architecture is adaptable to a wide range of sensors. In this case, it was necessary to understand the inner workings of this sensor in order to know a way to transmit the data to Node-RED, considering the specificities of the Radon Scout.
The Radon Scout sensor is prepared to obtain isolated data. The data is retrieved when the Radon Scout sensor is connected to a personal computer via the serial port through the software provided by the manufacturer, Radon Vision. The Radon Scout sensor works on command and response.
Several tests were carried out for data capture for several days, at 1-h intervals. The information obtained through the serial interface is expressed in the hexadecimal system, which required an interpretation of the collected data.
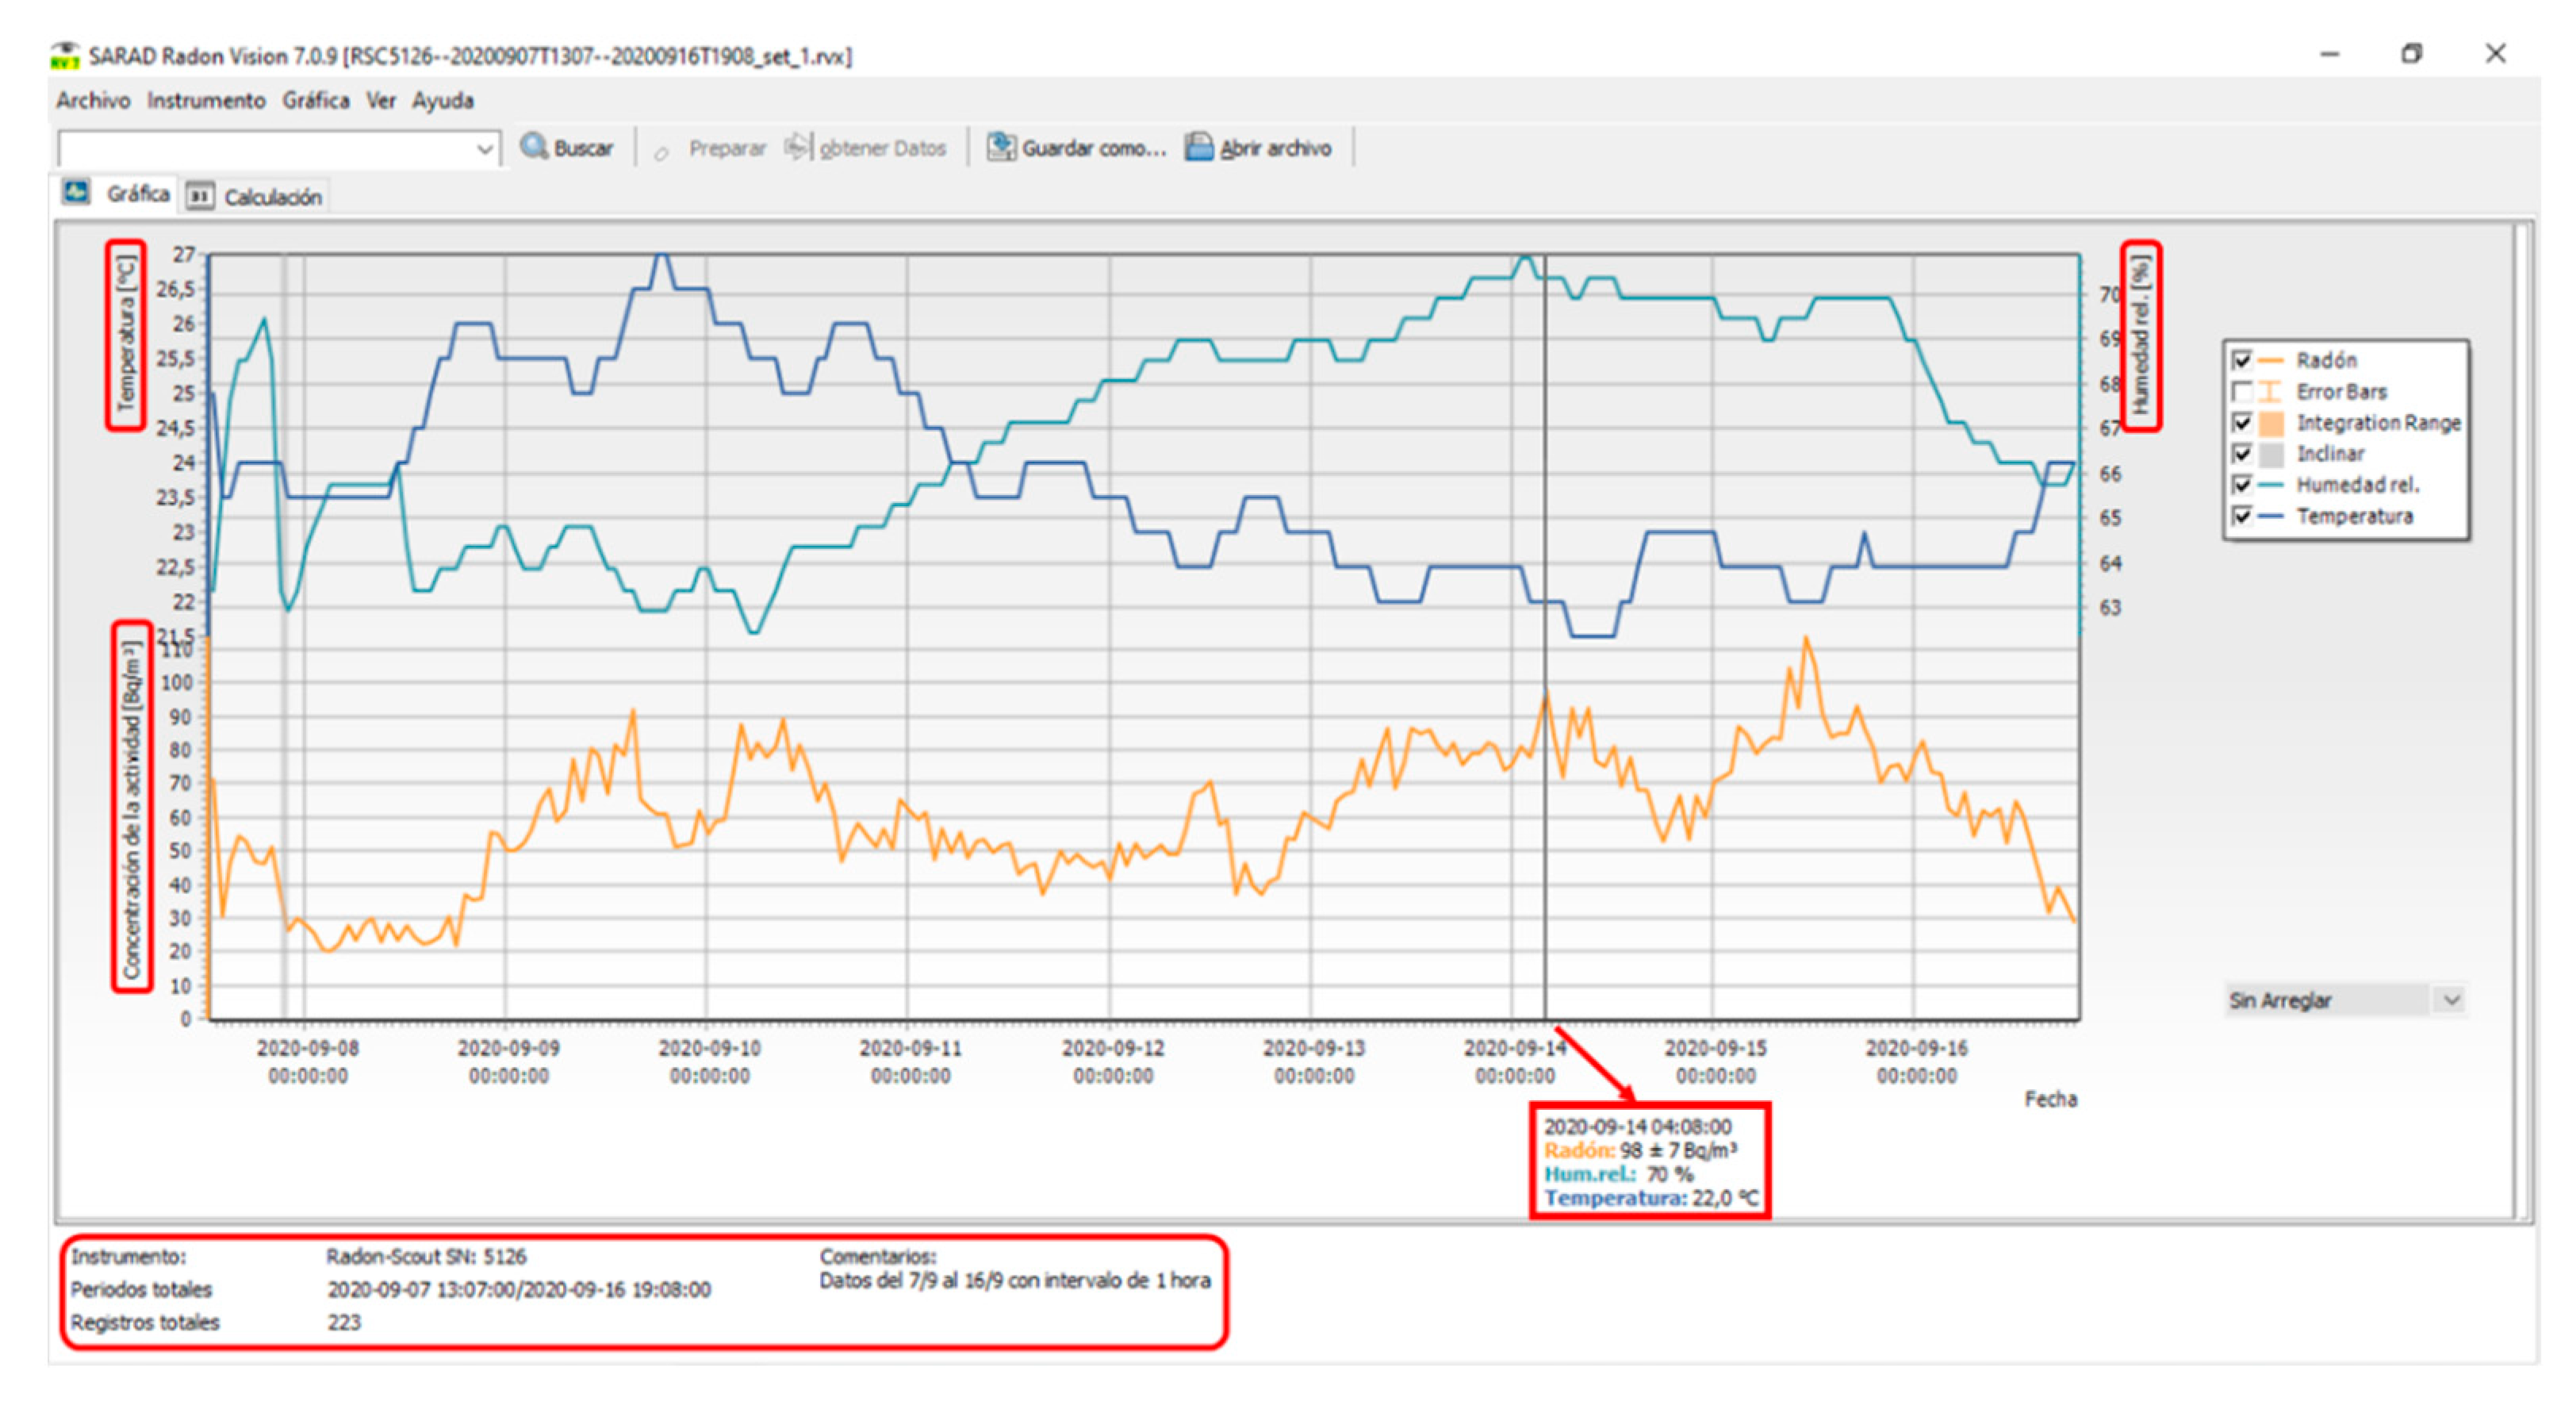
Therefore, Radon Vision 7.0.10 software has been used in combination with other serial port monitoring software to understand the information collected by the sensor. A screenshot of the sample analysis of the one-hour interval is attached in
Figure 10 to visualise the front-end of the software Radon Vision 7.0.10.
The red frames surrounding the graph point out the magnitudes that can be measured by the sensor (radon concentration, humidity, and temperature) in their respective units. The functionality of the interface is quite simple, and it is possible to see the measurement values one by one if needed and the information related to the data set of the uploaded file (date of the interval, number of total measurements and type of sensor) in the lower-left corner.
A comparison study of the data obtained in hexadecimal format from Radon Scout sensor and those represented by the software was carried out in order to establish the relationships between the hexadecimal values and those represented in Radon Vision software. In this way, the IoT device would be programmed to control the Radon Scout sensor, extract and process the data correctly.
5.2. Programming the IoT Device Using MQTT
This section sets out the details to enable the transmission and reception of data from the radon sensor for subsequent storage and processing on the web server.
A Raspberry Pi 3 was used for the experiment. The radon Scout sensor has an RS232 communications interface (9-pin connector). To connect it to the Raspberry Pi 3, it could be done via the GPIO (General Purpose Input/Output) pins or by connecting it directly to one of the USB ports. In this case, it was used one USB port.
The communication program between the radon sensor and Node-RED was developed in Python. For this, it was necessary to install the “PySerial” libraries (for communication with the USB ports), the “paho-mosquitto” library, which is the module that allows us to use MQTT from Python. In this case, the program publishes the radon concentration on the Mosquitto broker using the ‘sensors/sensor_bq’ topic. Other libraries also needed to be installed for the conversion of data received by the sensor (hexadecimal data) into strings, such as “sys” or the “binascii” library.
5.3. Database Desing and Implementation
Once the above has been completed, it is time to create the database that will collect the information from the sensor every time a new measurement is taken.
For this case study, MySQL is used as a relational database [
26]. Following the Entity-Relationship model,
Table 2 shows the entities and attributes selected to store the information of users, sensors and values of radon concentration, humidity and temperature.
The first User entity contains the information about the users who register on the website and saves the name, the password and the e-mail account. Meanwhile, the Sensors entity contains the coordinates of each registered sensor, and the Measurements entity contains the values extracted in each reading.
5.4. Data Flow Management with Node-RED
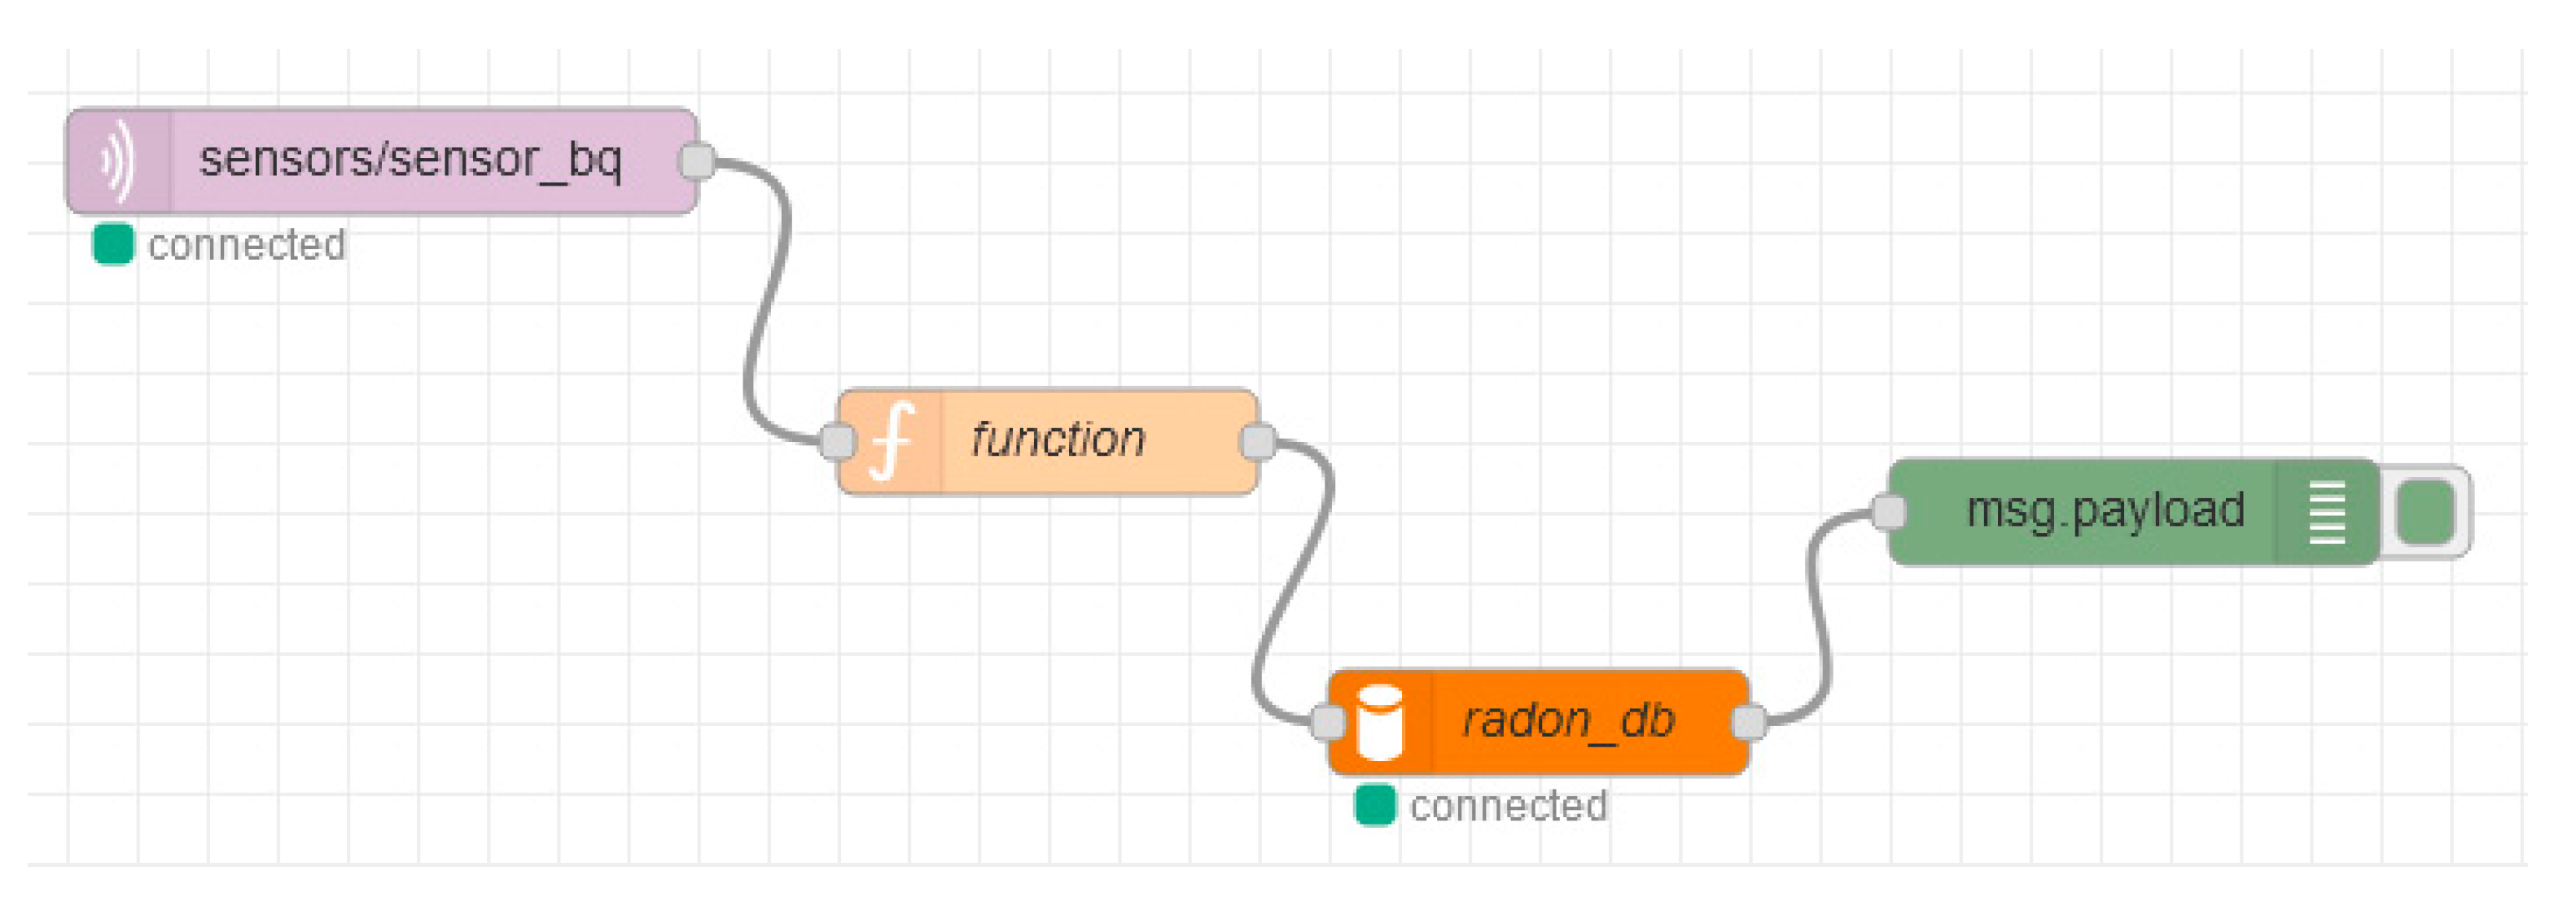
Node-RED functions and manages the radon sensor data traffic to process the information obtained from the MQTT broker subscription and store it in a MySQL database. To achieve this, it is necessary to launch Node-RED in the browser. So, the data flow has been built in the editor, as shown in
Figure 11.
The nodes of this diagram are as follows:
Node ‘mqtt in’ (first) allows to connect to the Mosquitto broker, subscribe to the specified topic and receive the information. In this case, the topic used with the Radon Scout sensor has been set as ‘sensors/sensor_bq.’
Node ‘function’ (second) organises messages from the previous node before being sent to the next one.
Node ‘mysql’ (third) needs to be pre-installed in Node-RED for transfer the input information to the network in the MySQL database storage. Thus, the database is called ‘radon_bd.’
Node ‘debug’ (fourth) is used to display the output messages, which are distributed in the node properties.
The properties of each node are expressed in JavaScript language. In addition, the code that structures the theme data to be stored in the database includes the following functions (described in the second node).
Therefore, the ‘function’ node is prepared to read the input string, separate the bytes and identify each pair of characters as year, month, day, hour, minute, measurement interval, humidity, temperature and radon concentration values.
5.5. Website Integration
To develop the website, this section describes the code programmed in PHP. The purpose of the website is to create an online map from which to visualise the sensors registered with position marks and to have access to a table with all the measurements read by these sensors. The main views that support these targets on the website are described below.
5.5.1. Home Page
At first, the website should be provided with a static header to make navigation comfortable for the user. For the study case, references to open-source online libraries, such as Boostrap and Leaflet, have been added. The former adapts to the front-end to the screen of any device, and the latter is used to develop interactive maps.
5.5.2. Map
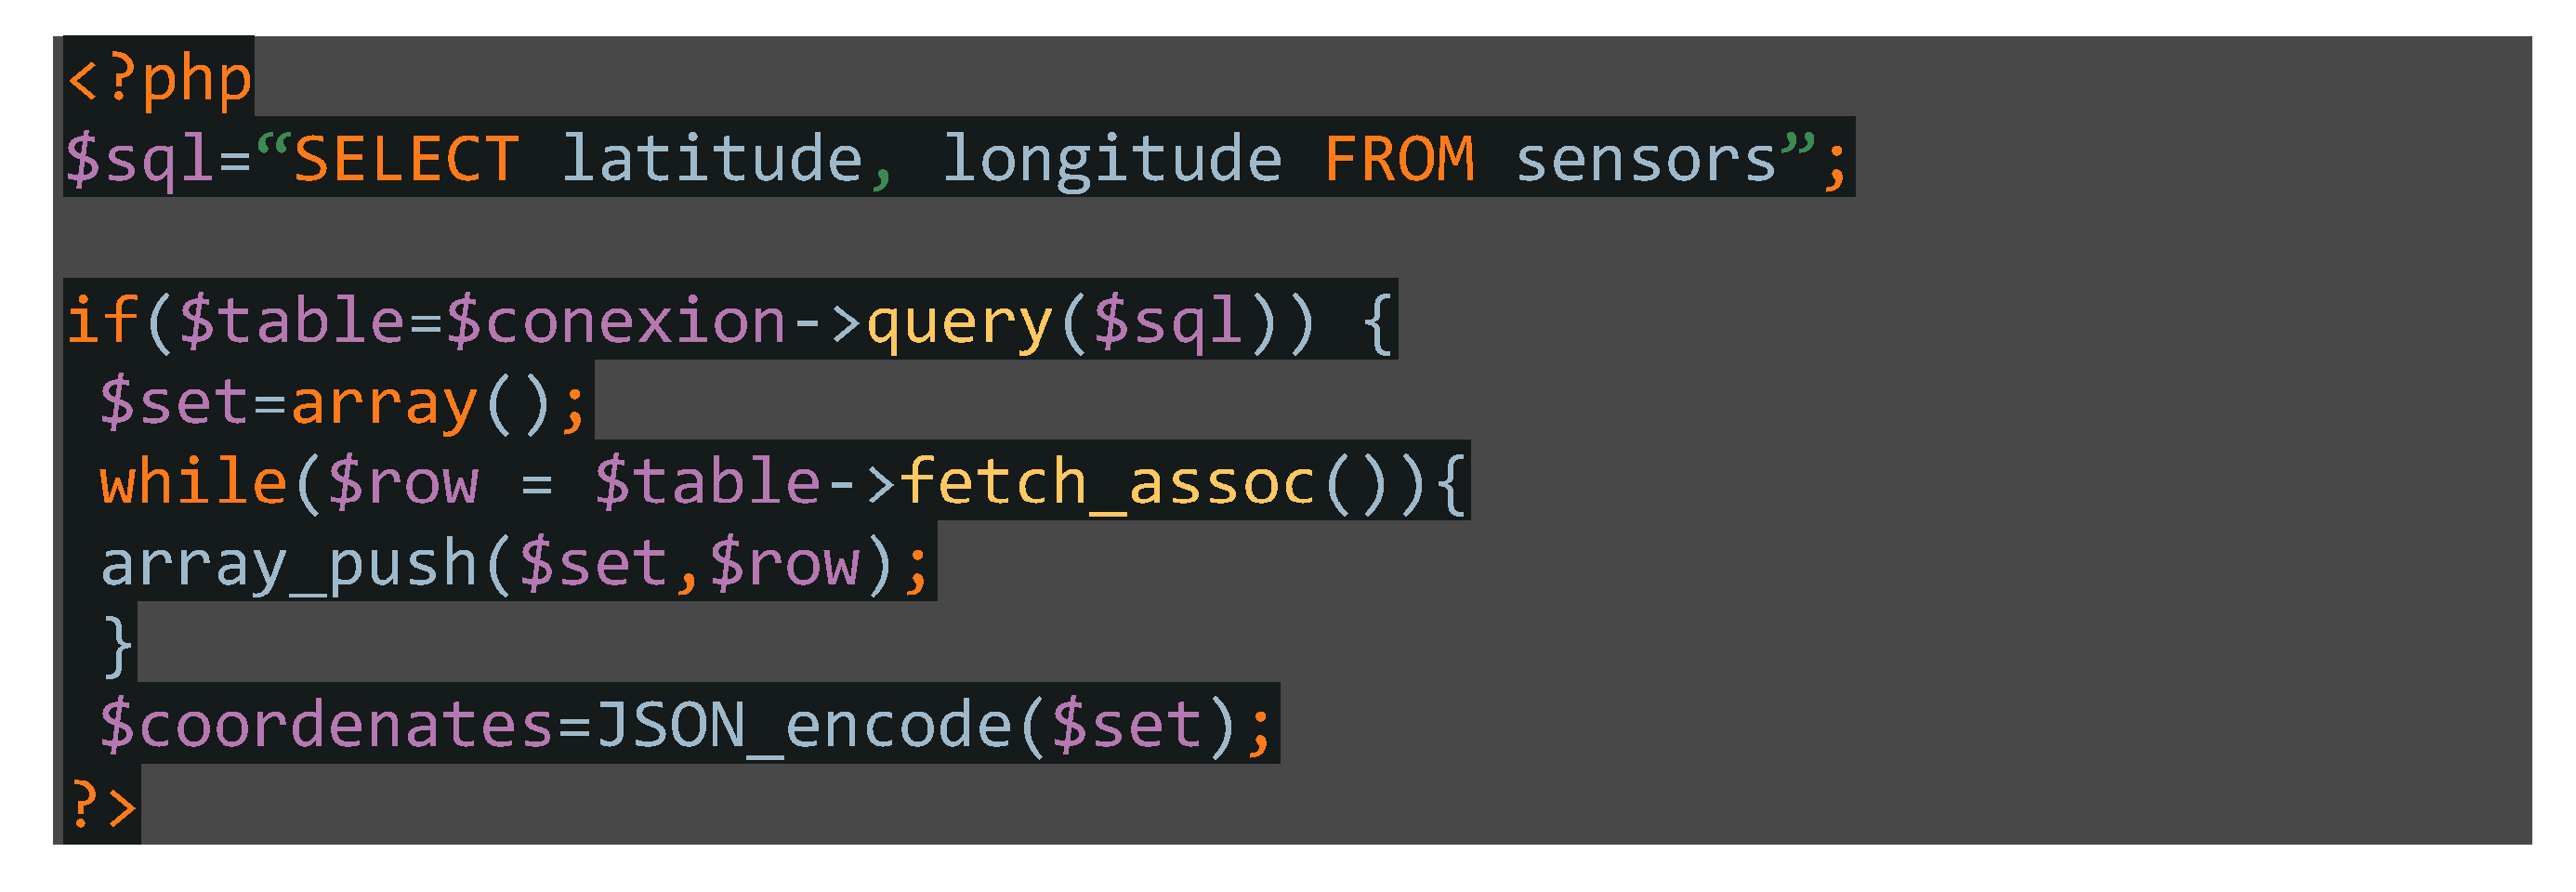
The most noticeable page of the website draws the location marks referring to the sensors that have been registered on the portal. In this case, a Leaflet map is used and programmed with JSON language, as it seems in
Figure 12.
All the coordinates stored in the database are selected in the PHP file with the $table. Then, that PHP string is transformed into a JSON string, and, at the end, the latitude and longitude values are separated by specifying another variable (called ‘latlong’).
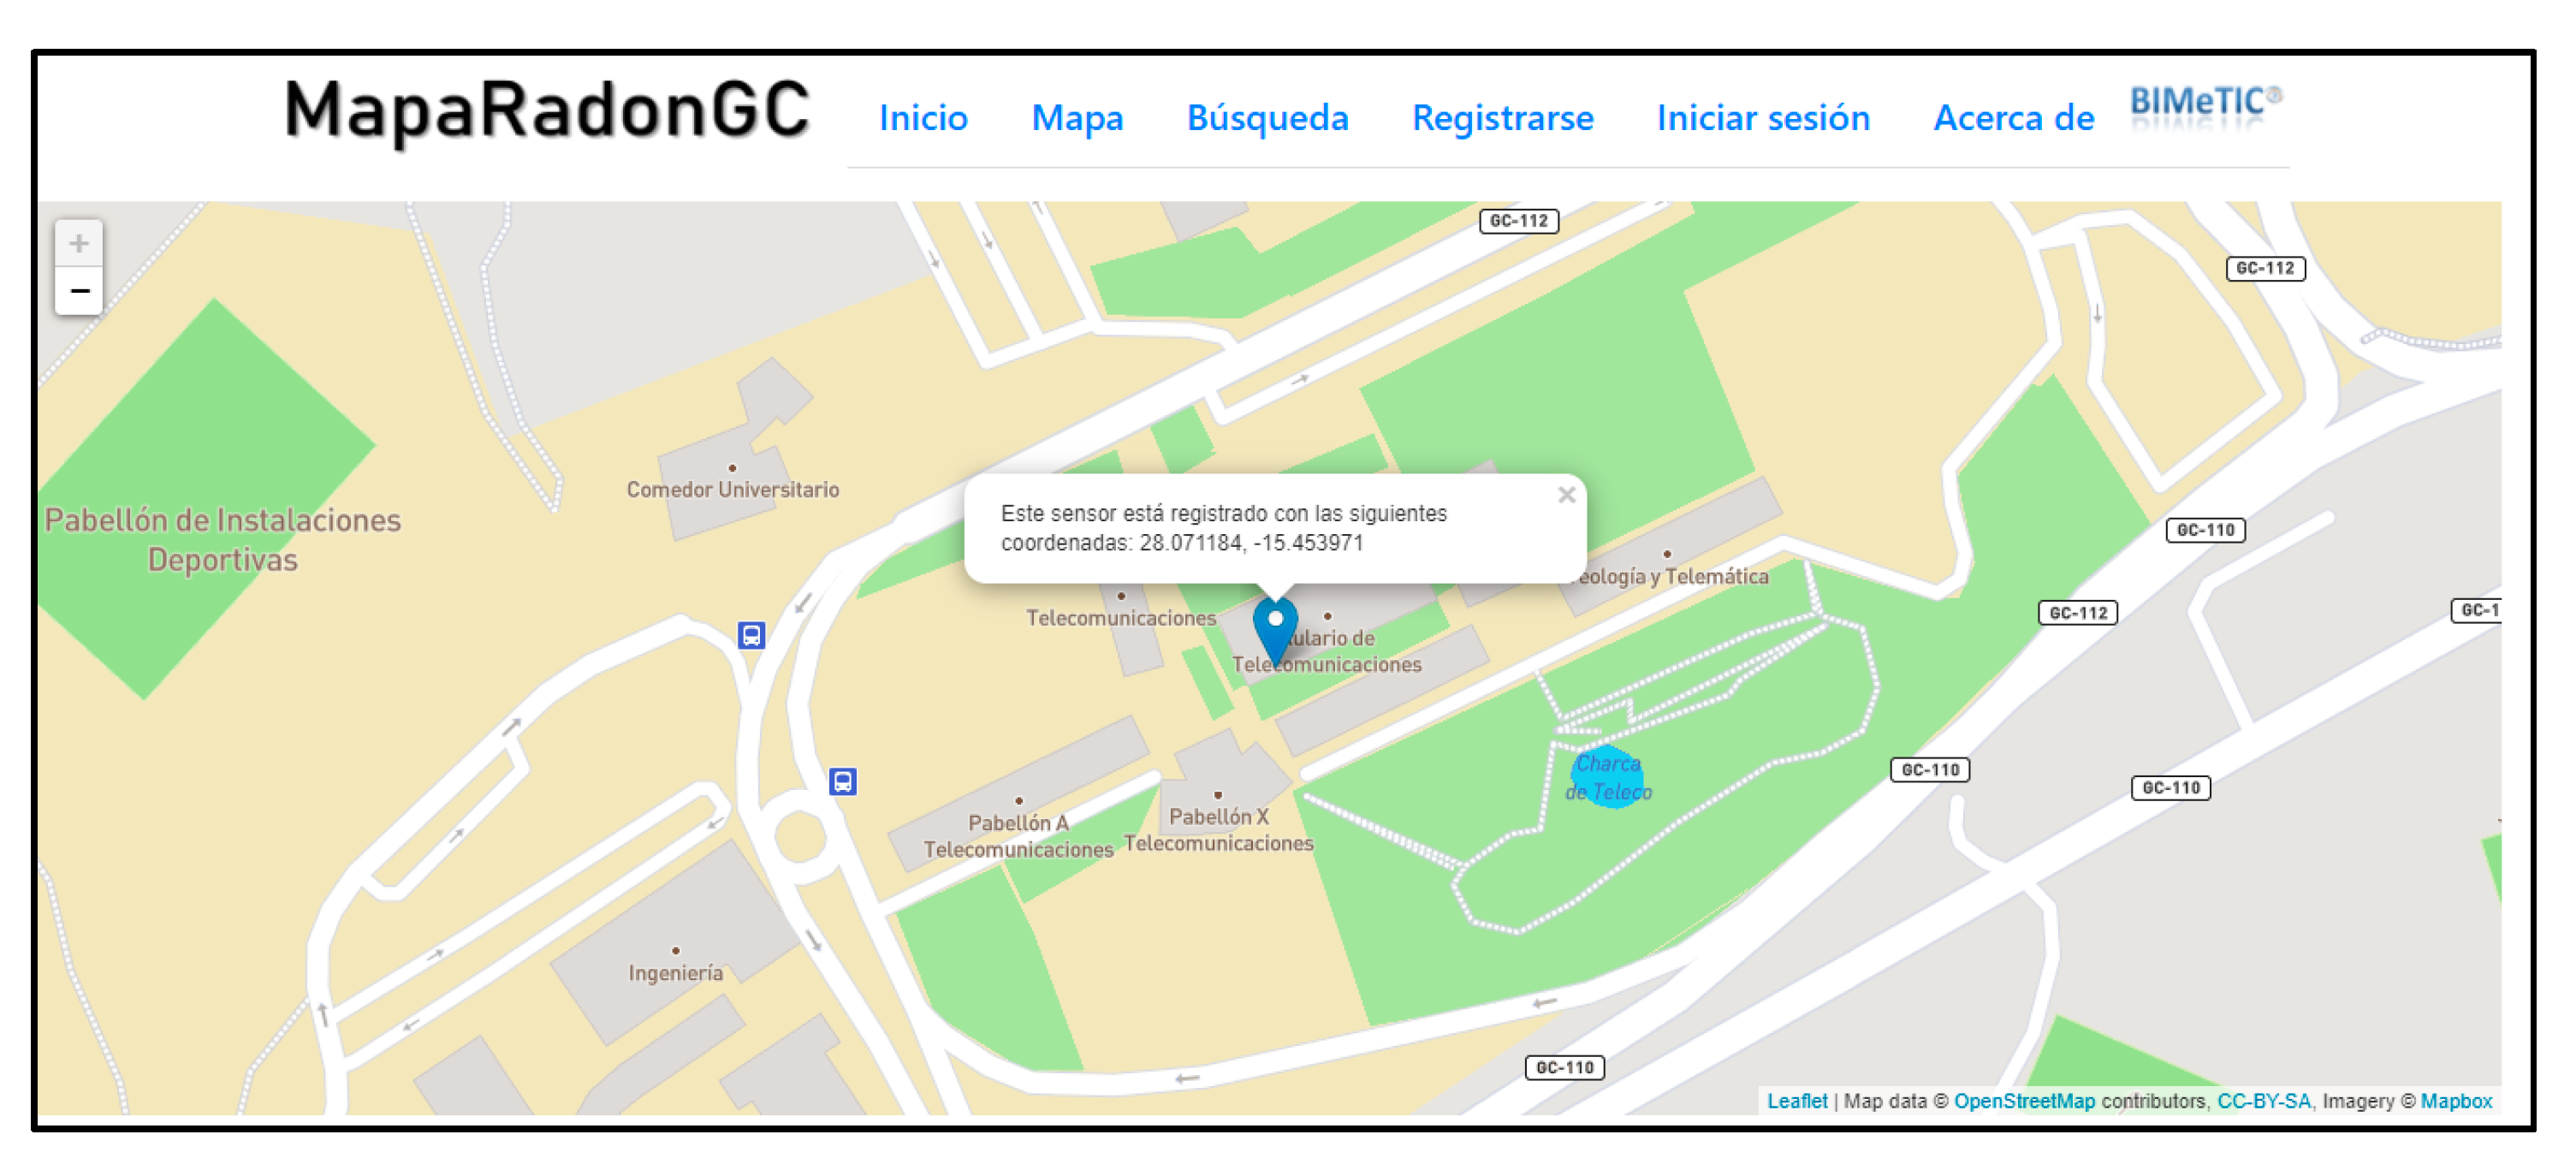
Figure 13 is the window where the coordinates of a sensor registered in the web portal appear. In this case, the sensor is located at the Telecommunication Technology Engineering School of the University of Las Palmas de Gran Canaria. To achieve this view, the Leaflet JavaScript library is used, where variables are defined to: fix the centre of the map with a certain zoom; draw the position marks; and show a popup that notifies the coordinates of any point.
5.5.3. Measurement Historical Register
This section allows querying the radon measurements stored in the database. Additionally, a form for selecting the information by date as an extra. For this study, when users log in, it is possible to filter and search information by sensor identifier as well by the time interval of interest. For this file, PHP and HTML are combined.
5.5.4. Sign up and Log in
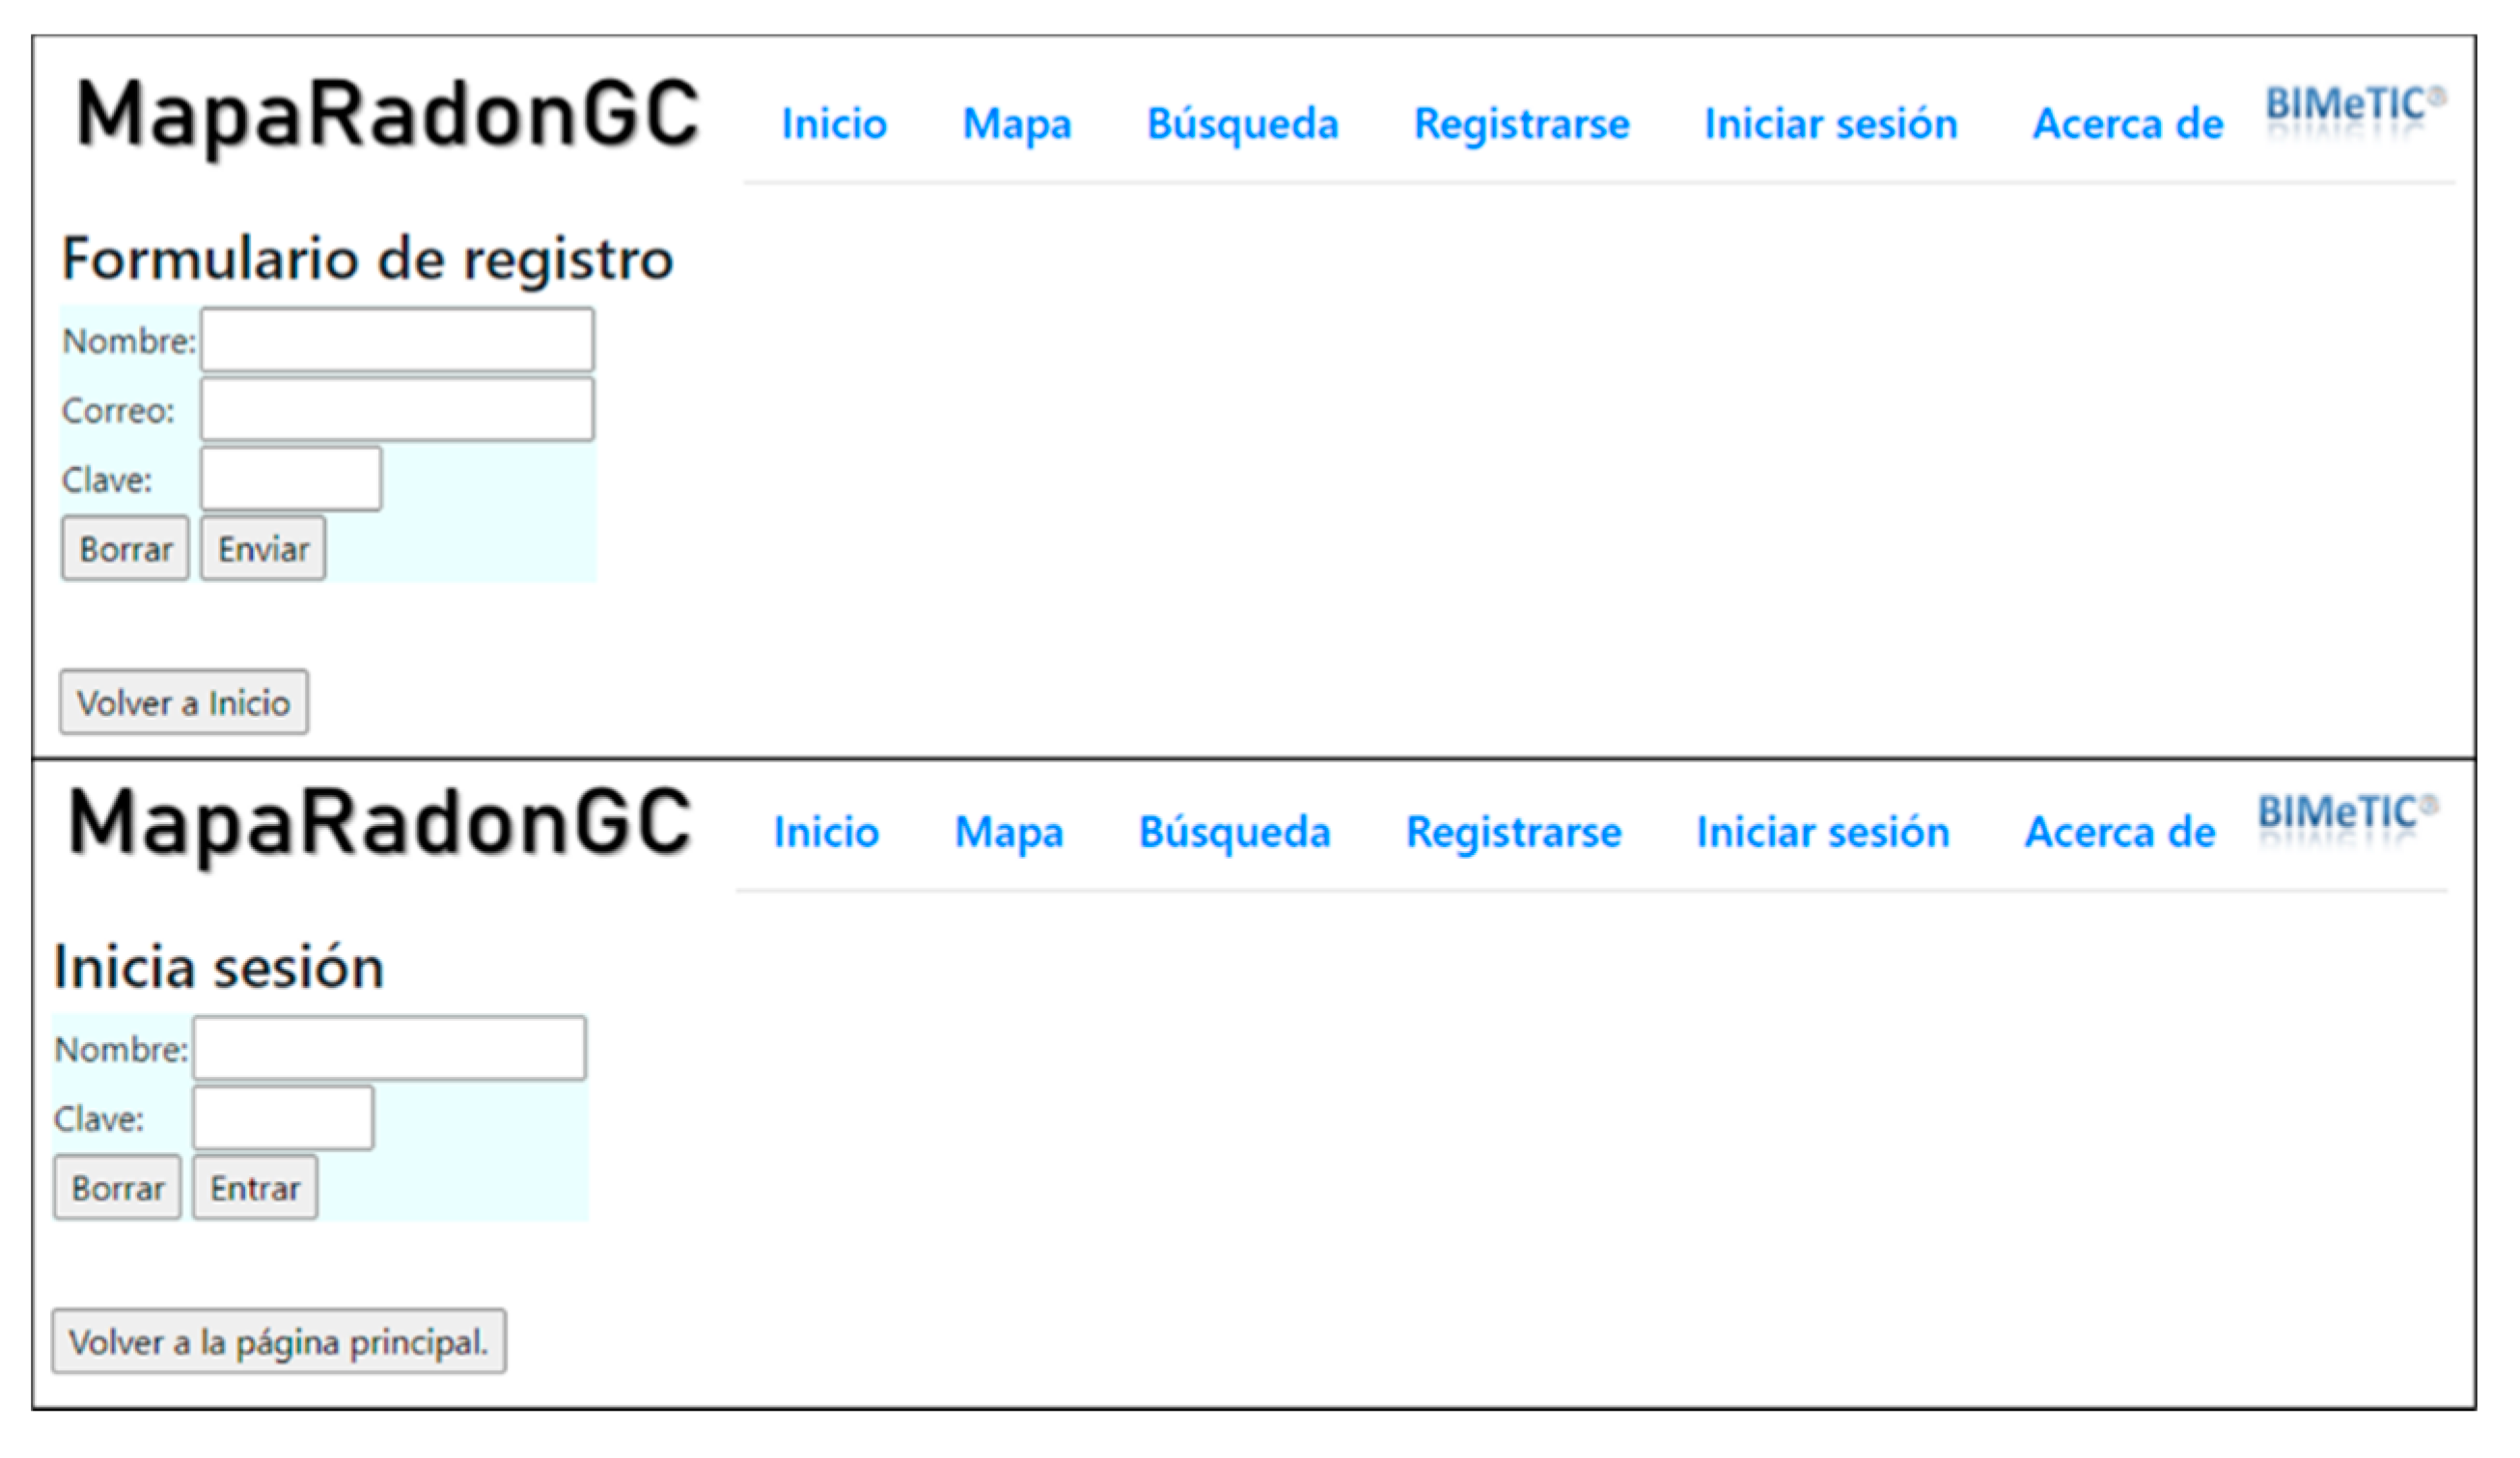
The registration and login option allows a user to register in the application the sensor installed at home and to publish the radon sensor data, with the architecture presented in this work, see
Figure 14.
In our experiment, the codes for these functions were programmed in PHP. Each code includes JavaScript validation of each form field to avoid empty cells in the MySQL database. When starting the session (with the session_start() function), the user has access to the above data, including the “Catalogue” and “Logout” options.
6. Discussion
In
Section 3, the basic model and the elements of an IoT architecture have been briefly described. All the works consulted for monitoring radon concentration levels follow this basic model. The differences between them are due to the elements that make up the system and the services they want to provide. The main novelty of our work comes from the fact of implementing a low-cost IoT architecture, where radon concentrations are stored on a server. It is a rapid architecture for deployment. Nevertheless, the combination of lightweight messaging protocols with Node-RED facilitates two important aspects: on the one hand, the communication process between the IoT devices and the server, and on the other hand, it avoids excessive consumption in the IoT devices. In addition, the use of the MQTT protocol allows one-to-many message distribution and decoupling of applications. It is a very important aspect when the size of the sensor’s network is large because several Node-RED servers could be implemented to manage different types of sensors using a unique MQTT broker. A web application was designed to visualize the data as well as the location of the sensors. An added value is that it is a platform designed so that users with radon sensors, once registered and authenticated on the platform, can contribute and build a map of radon measurements.
Finally, a comparative study has been done with some related works. As can be appreciated in
Table 3, the architecture presented is comparable with other works. The authors in [
10] and [
11] have developed APIs for sensor-user communication based on websocket and HTTP. They do not use lightweight messaging protocols. In [
13], MQTT is used to transmit the data and generate the alerts, and the data processing is implemented using Node-RED in the server. Although two types of access networks, WiFi and Sigfox, are considered, the infrastructure responsible for receiving, processing and storing the data have been designed with security aspects in mind. However, this architecture is more complex in design and maintenance because the services were installed on virtualized servers, and all connections are managed by a firewall, VPN and router. Moreover, it is an access-controlled and private IoT network deployment. In [
14], the MQTT protocol is only used to share data with end-users. The information from the sensors is sent via Json files using the Elastic Stack Suite; therefore, our proposed architecture is more efficient and lightweight.
7. Conclusions
As was discussed in this work, the development of technology for the IoT provides an enriching of different aspects of human life. Furthermore, environmental monitoring is becoming a major concern to people, as well as radon gas, which constitutes a health risk because it deteriorates lung tissue. This gas that is very harmful to health, is a colourless, tasteless and radioactive gas, which is in soils and rocks. This work describes an IoT architecture where radon concentrations are stored on a server. A web application is designed to visualize the data in real-time as well as the sensor locations. The lightweight messaging protocols, MQTT and Node-RED, were used for sending the data and processing the information, respectively. The architecture presented allows the monitoring of many sensors spread over a territory or city in order to obtain a map of measurements of this gas in an automated and updated way. This architecture can be used for any type of sensor and combine different measurements on a map. Moreover, the use of the MQTT lightweight messaging protocol minimises the traffic network and the energy consumption of devices. This architecture was evaluated with a study case.
The collection of data and the availability of historical radon data will allow the assessment of other physical phenomena in nature and the concentration of diseases in certain areas.
In our ongoing work, one of the improvements to be implemented in our architecture would be the generation of alerts and to act automatically with ventilation mechanisms in the area where there is a high radon concentration.


