
Electric Vehicle Charging Load Allocation at Residential Locations Utilizing the Energy Savings Gained by Optimal Network Reconductoring

 , , , , , and
Abstract
:1. Introduction
- Flower Pollination Algorithm (FPA) was applied to reconductor the distribution network while satisfying the voltage and current constraints.
- A heuristic methodology was developed to allocate the EV charging load at every node in a residential distribution network without any violation of the system operational constraints.
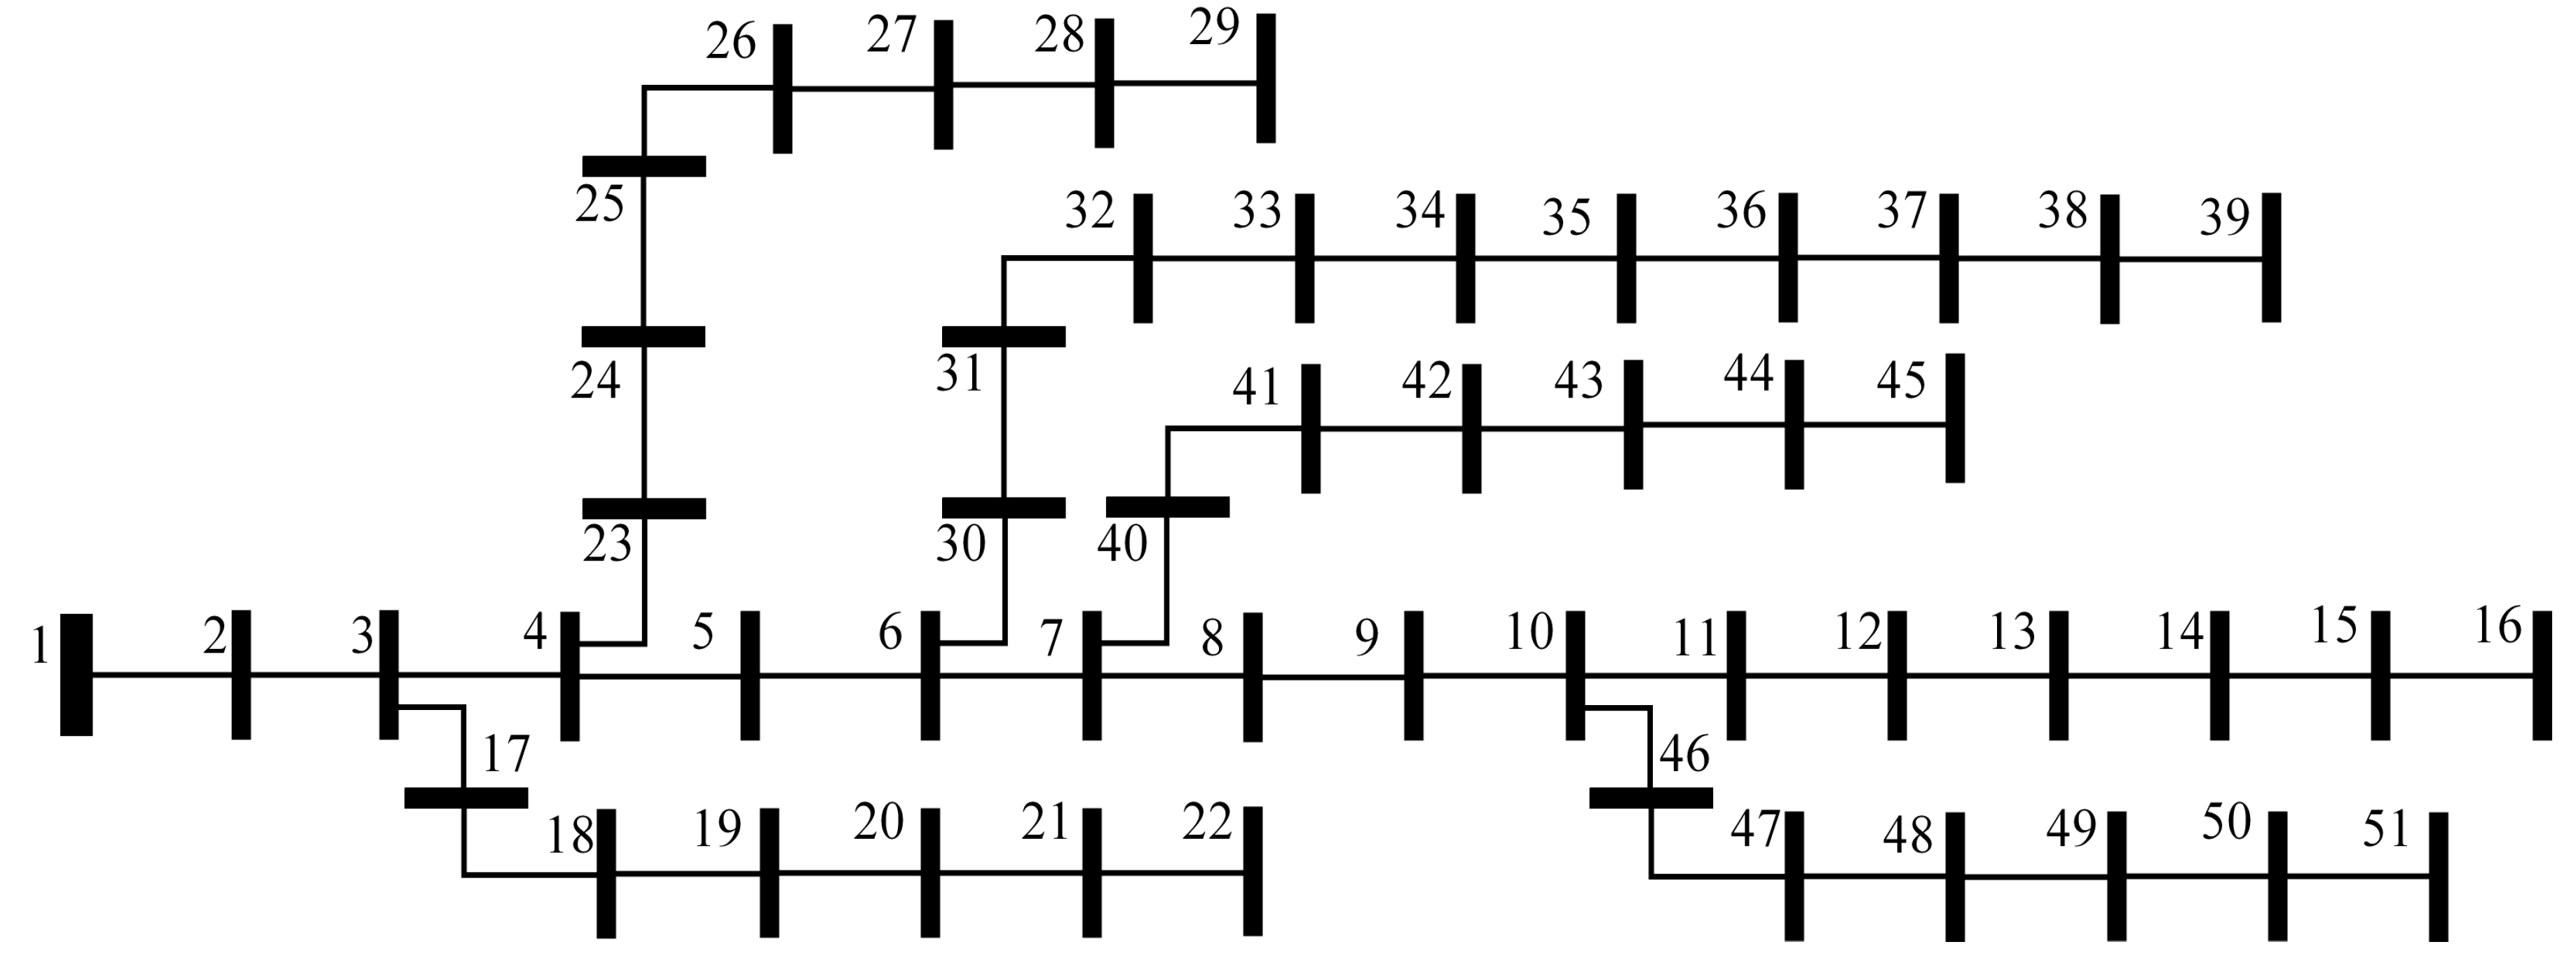
- The effectiveness of the proposed algorithms was demonstrated through various case studies performed on 51 bus and 123 bus test systems.
- The methodology proposed in this work will be a valuable tool for power engineers working with distribution utility management to allocate EV charging load efficiently.
2. Problem Formulation
2.1. Objective Function
2.2. Voltage and Current Constraints
3. FPA for Network Reconductoring
| Algorithm 1: Step-by-Step Algorithm for Reconductoring using FPA |
|
4. Energy and Economical Savings Due to Network Reconductoring
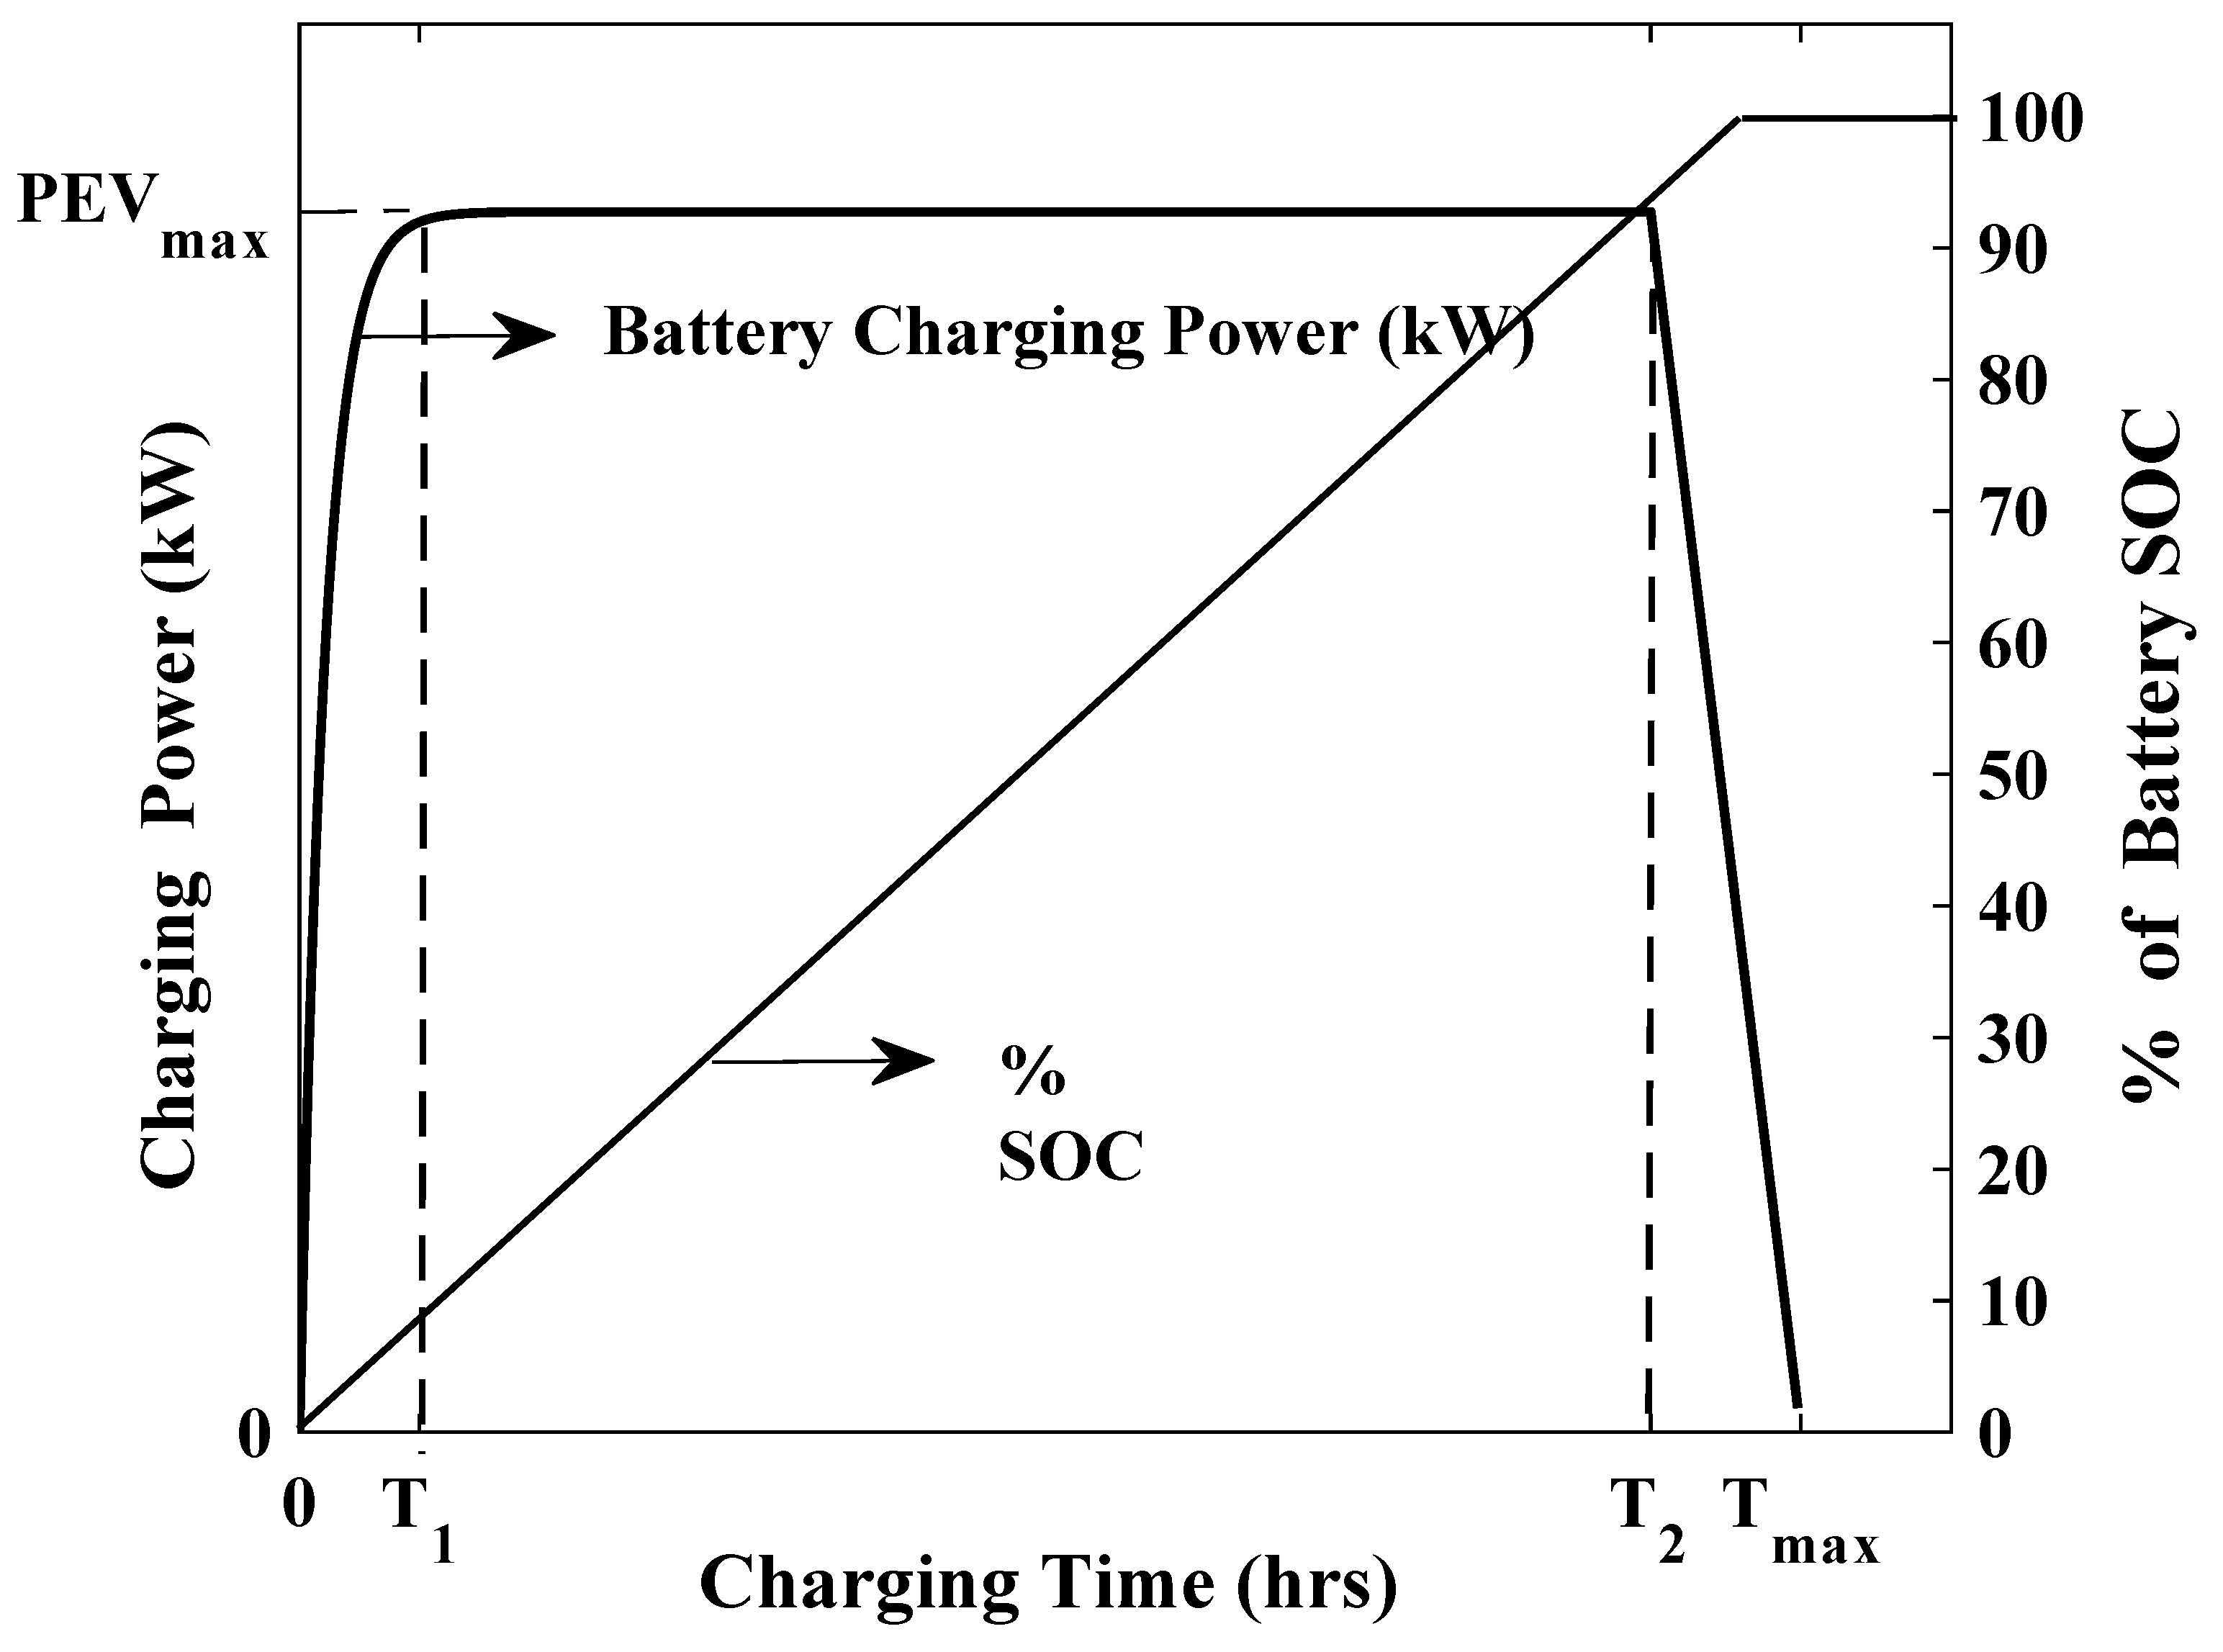
5. Modeling of EV Charging Load Demand
6. Energy Savings Division for EV Load Allocation among Charging Slots
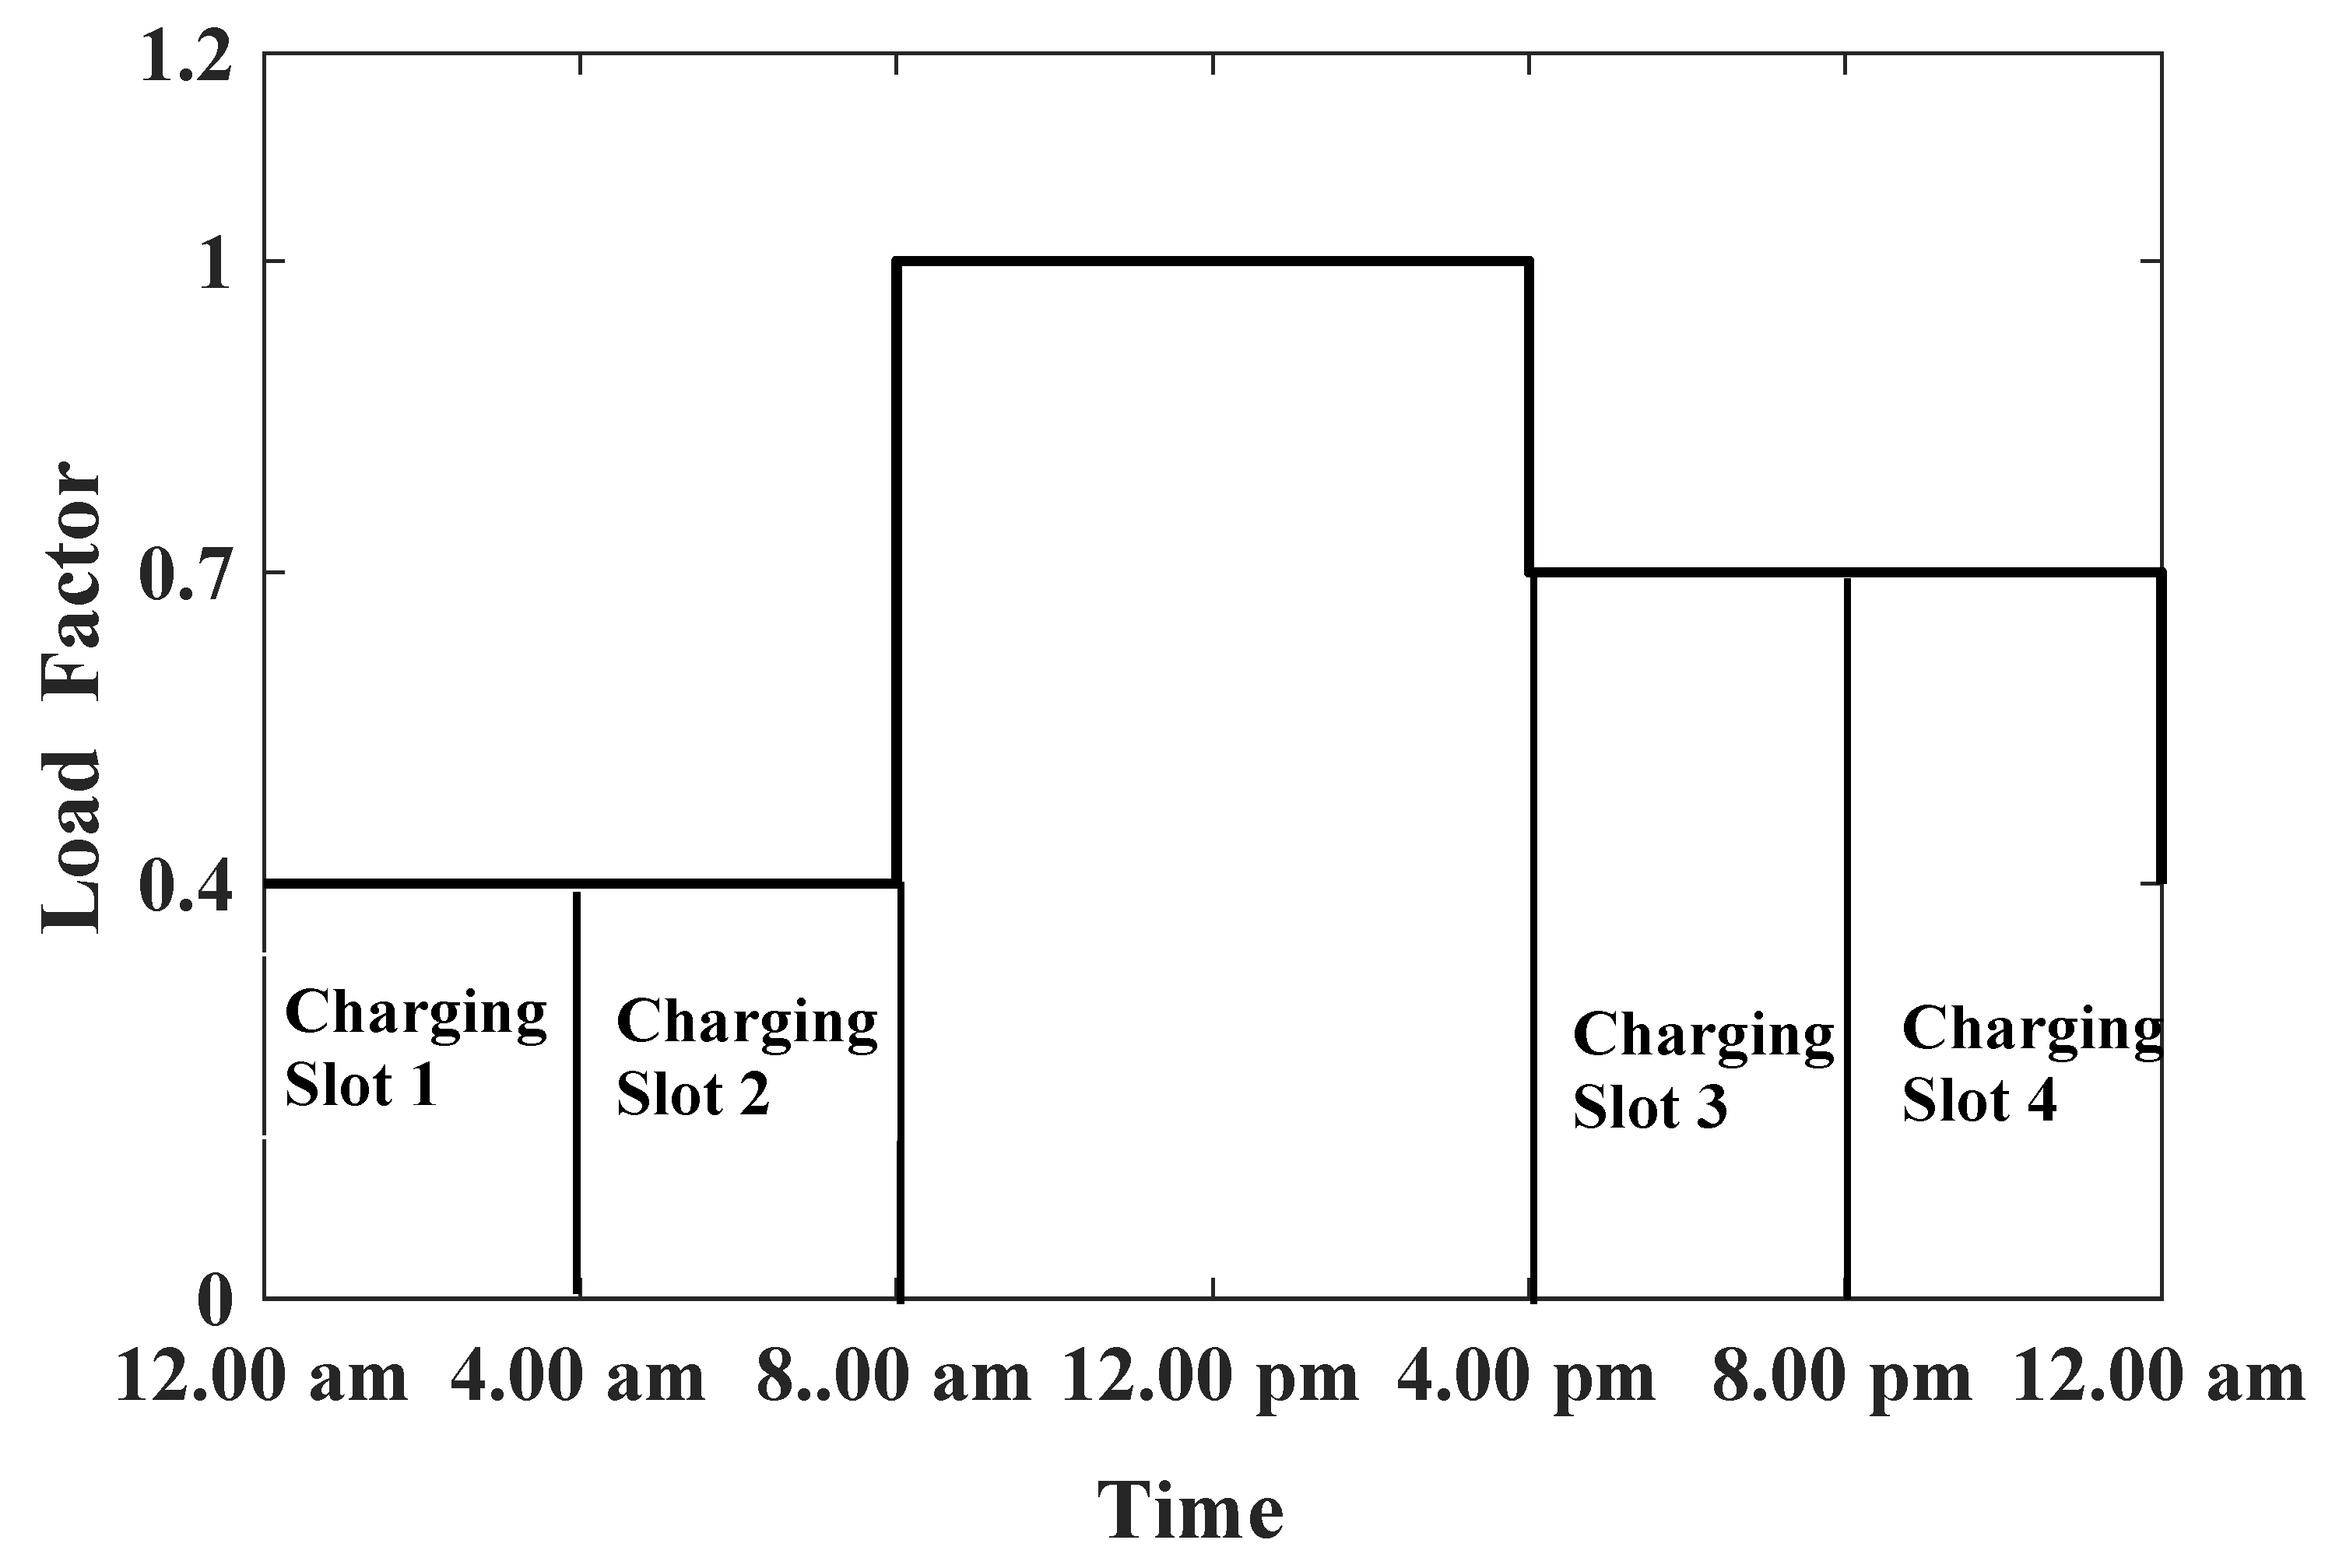
6.1. EV Load Charging Slots Division
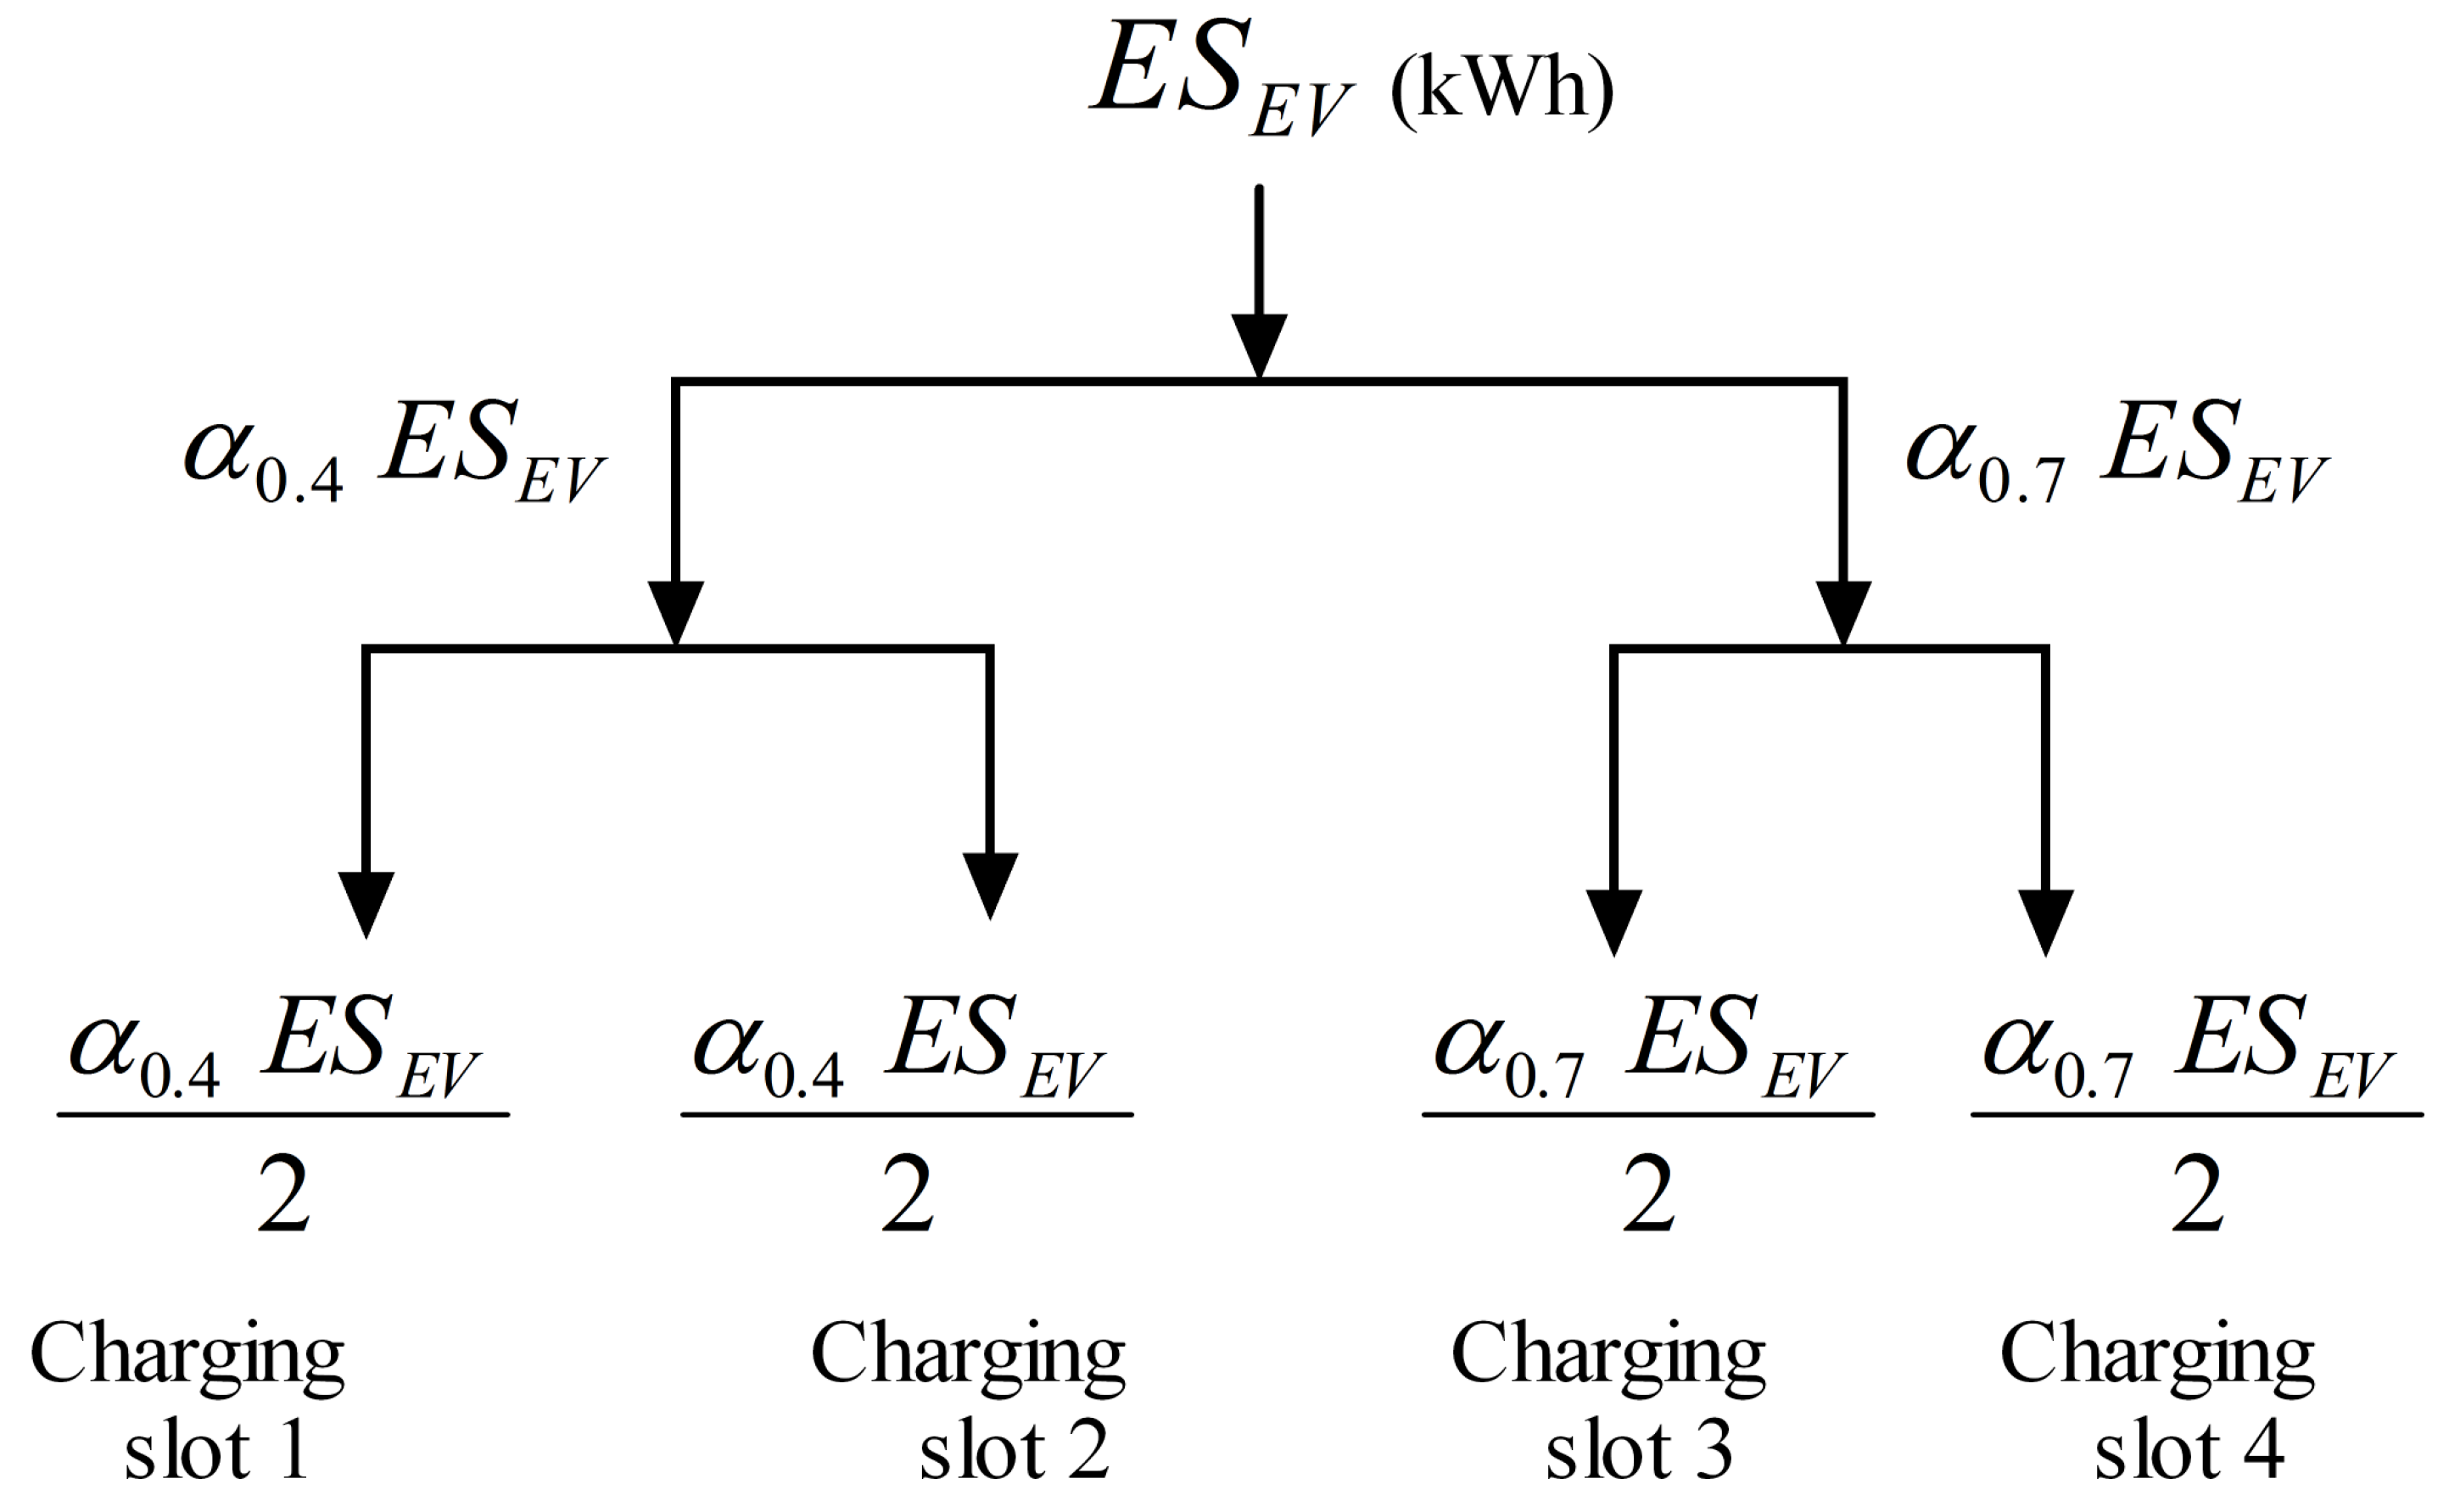
6.2. Energy Savings Division among the Charging Slots
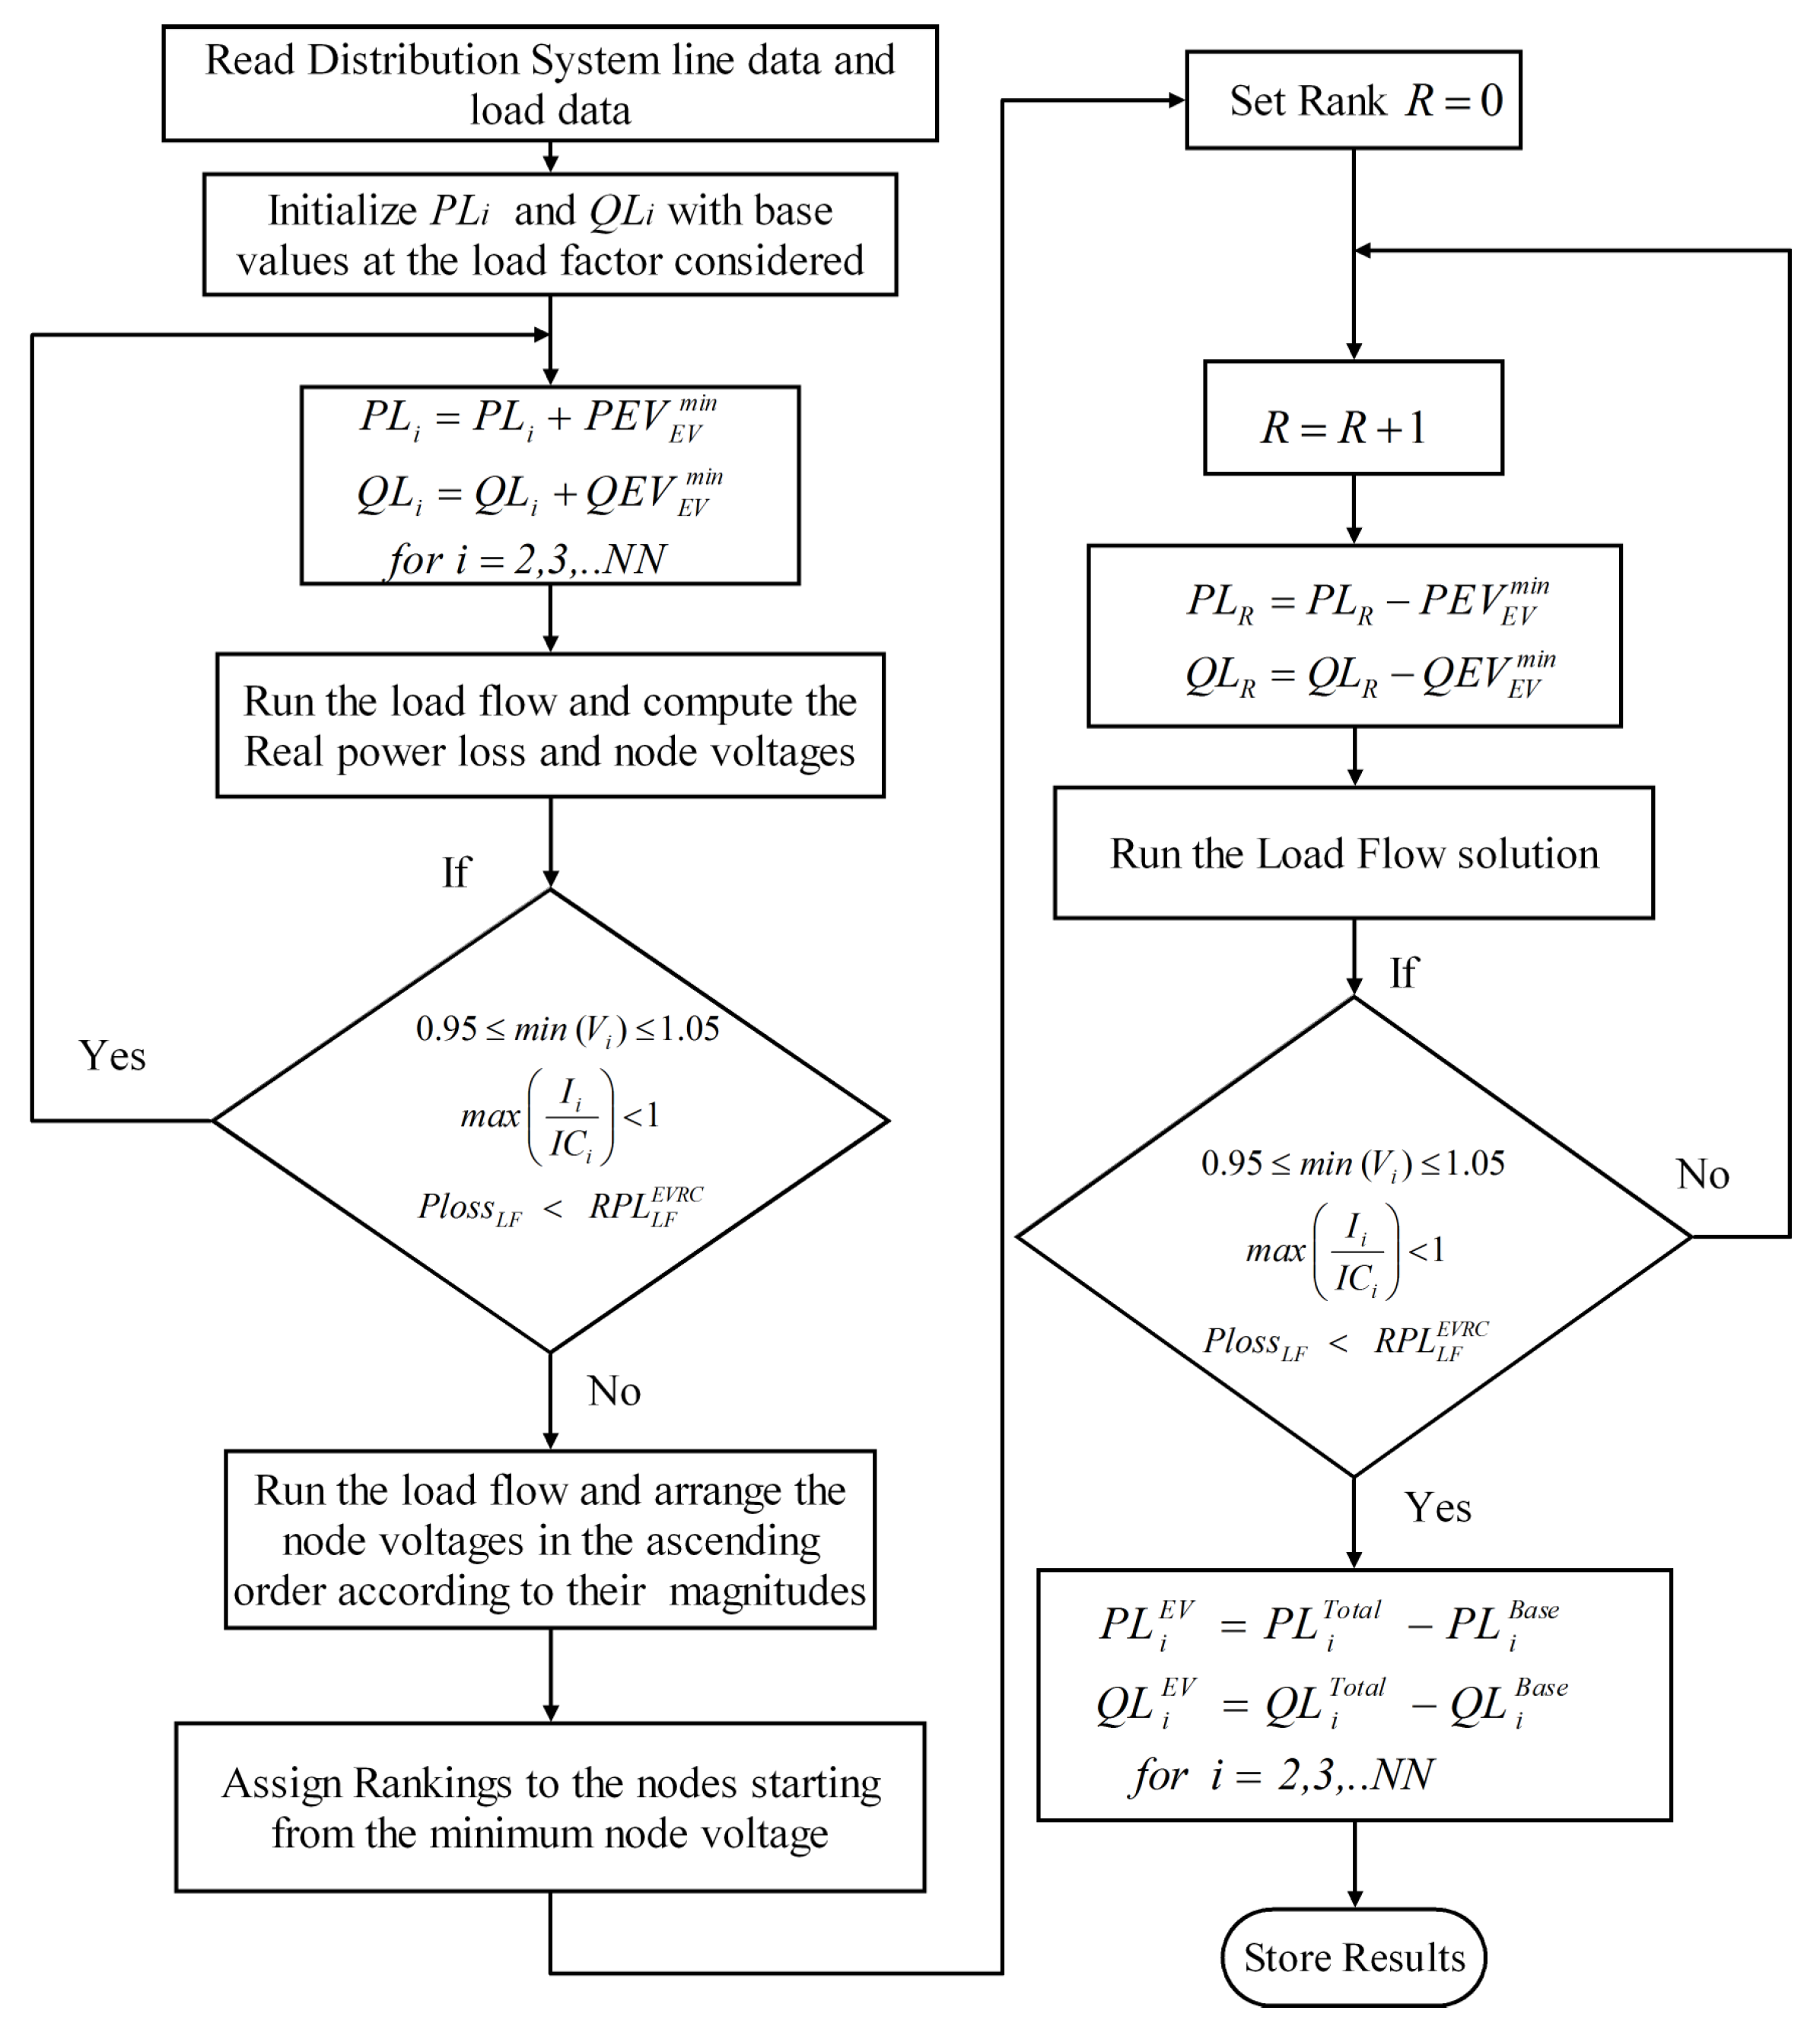
7. Energy Savings Based Heuristic Approach for EV Load Sizing and Allocation
| Algorithm 2: Step-by-Step Algorithm for the Proposed Heuristic Approach for EV Charging Load Allocation |
|
8. Results and Discussions
Optimal Network Reconductoring Using Flower Pollination Algorithm
9. Conclusions
Author Contributions
Funding
Conflicts of Interest
Abbreviations
| Annual installment payment | |
| Active power with EV load at ith node | |
| Annual energy savings cost | |
| Reactive power with EV load at ith node | |
| Annual peak loss savings cost | |
| EV battery Charging power | |
| Annual economics savings | |
| Constant power mode EV load power | |
| Number of branches in the distribution network | |
| Constant voltage mode EV load power | |
| N | Number of years of installment |
| Energy savings for EV charging per day | |
| M | Mantegna algorithm |
| Annual distribution load h at LF | |
| Distribution load factor | |
| Minimum EV real power load | |
| Cost of the conductor in ith branch in Rs./km | |
| Minimum EV reactive power load | |
| Instantaneous battery storage capacity | |
| Maximum power drawn by electric car | |
| Rate of interest | |
| Maximum power drawn by electric bike | |
| Current in branch j for the load factor LF | |
| Maximum power drawn by electric scooter | |
| Max current capacity of conductor type k | |
| Base case real power loss at LF | |
| Cost of energy loss in Rs./kWh | |
| Power loss with reconductoring at LF | |
| Cost for peak losses in Rs./kW | |
| Base case peak power loss | |
| Length of branch i in km | |
| Peak power loss with reconductoring | |
| Levy distribution function | |
| Resistance of the ith branch | |
| Mantegna algorithm function | |
| Number of cars at ith node | |
| EV load active power at ith node | |
| Number of scooters at ith node | |
| Base case Active power load at ith node | |
| Number of Nodes | |
| Base case reactive power load at ith node | |
| Maximum voltage limit | |
| Total active power load including EV load | |
| Minimum voltage limit | |
| Total reactive power load including EV load | |
| Step size controlling factorr | |
| Real Power Loss at Peak Load | |
| Annual interest and depreciation factor |
References
- Wang, Z.; Liu, H.; Yu, D.C.; Wang, X.; Song, H. A practical approach to the conductor size selection in planning radial distribution systems. IEEE Trans. Power Deliv. 2000, 15, 350–354. [Google Scholar] [CrossRef]
- Mandal, S.; Pahwa, A. Optimal selection of conductors for distribution feeders. IEEE Trans. Power Syst. 2002, 17, 192–197. [Google Scholar] [CrossRef]
- Ranjan, R.; Chaturvedi, A.; Solanki, S. Optimal Conductor Selection Of Radial Distribution Feeders Using Evolutionary Programming. TENCON 2003. Conf. Converg. Technol. Asia-Pac. Reg. 2003, 1, 456–459. [Google Scholar] [CrossRef]
- Satyanarayana, S.; Ramana, T.; Rao, G.K.; Sivanagaraju, S. Improving the Maximum Loading by Optimal Conductor Selection of Radial Distribution Systems. Electr. Power Components Syst. 2006, 34, 747–757. [Google Scholar] [CrossRef]
- Kaur, D.; Sharma, J. Optimal conductor sizing in radial distribution systems planning. J. Electr. Power Energy Syst. 2008, 30, 261–271. [Google Scholar] [CrossRef]
- Rao, R.S.; Satish, K.; Narasimham, S.V. Optimal conductor size selection in distribution systems using the harmony search algorithm with a differential operator. Electr. Power Components Syst. 2011, 40, 41–56. [Google Scholar] [CrossRef]
- Franco, J.F.; Rider, M.J.; Lavorato, M.; Romero, R. Optimal conductor size selection and reconductoring in radial distribution systems using a mixed-integer LP approach. IEEE Trans. Power Syst. 2013, 28, 10–20. [Google Scholar] [CrossRef]
- Abul’Wafa, A.R. Multi-conductor feeder design for radial distribution networks. Electr. Power Syst. Res. 2016, 140, 184–192. [Google Scholar] [CrossRef]
- Samal, P.; Mohanty, S.; Ganguly, S. Simultaneous capacitor allocation and conductor sizing in unbalanced radial distribution systems using differential evolution algorithm. In Proceedings of the 2016 National Power Systems Conference (NPSC), Bhubaneswar, India, 19–21 December 2016; pp. 1–6. [Google Scholar] [CrossRef]
- Abdelaziz, A.Y.; Fathy, A. A novel approach based on crow search algorithm for optimal selection of conductor size in radial distribution networks. Eng. Sci. Technol. Int. J. 2017, 20, 391–402. [Google Scholar] [CrossRef]
- Ismael, S.M.; Abdel Aleem, S.H.E.; Abdelaziz, A.Y.; Zobaa, A.F. Practical Considerations for Optimal Conductor Reinforcement and Hosting Capacity Enhancement in Radial Distribution Systems. IEEE Access 2018, 6, 27268–27277. [Google Scholar] [CrossRef]
- Gampa, S.R.; Makkena, S.; Goli, P.; Das, D. FPA Pareto optimality-based multiobjective approach for capacitor placement and reconductoring of urban distribution systems with solar DG units. Int. J. Ambient Energy 2020. [Google Scholar] [CrossRef]
- Burgio, A.; Cimmino, D.; Jasiński, M.; Leonowicz, Z.; Siano, P. A Heuristic Method to Calculate the Capacity of Residential PV-BESS in Providing Upward Flexibility Services in Energy Communities. IEEE Access 2022, 10, 2908–2928. [Google Scholar] [CrossRef]
- Garcia-Valle, R.; Vlachogiannis, J.G. Electric vehicle demand model for load flow studies. Electr. Power Compon. Syst. 2009, 37, 577–582. [Google Scholar] [CrossRef] [Green Version]
- Shireen, W.; Patel, S. Plug-in Hybrid Electric vehicles in the smart grid environment. In Proceedings of the IEEE PES T D 2010, New Orleans, LA, USA, 19–22 April 2010; pp. 1–4. [Google Scholar] [CrossRef]
- van den Berg, M.; Lampropoulos, I.; AlSkaif, T. Impact of electric vehicles charging demand on distribution transformers in an office area and determination of flexibility potential. Sustain. Energy Grids Netw. 2021, 26, 100452. [Google Scholar] [CrossRef]
- Brinkel, N.; AlSkaif, T.; van Sark, W. Grid congestion mitigation in the era of shared electric vehicles. J. Energy Storage 2022, 48, 103806. [Google Scholar] [CrossRef]
- Iria, J.; Heleno, M.; Cardoso, G. Optimal sizing and placement of energy storage systems and on-load tap changer transformers in distribution networks. Appl. Energy 2019, 250, 1147–1157. [Google Scholar] [CrossRef]
- Nick, M.; Cherkaoui, R.; Paolone, M. Optimal Allocation of Dispersed Energy Storage Systems in Active Distribution Networks for Energy Balance and Grid Support. IEEE Trans. Power Syst. 2014, 29, 2300–2310. [Google Scholar] [CrossRef]
- Nick, M.; Cherkaoui, R.; Paolone, M. Optimal Planning of Distributed Energy Storage Systems in Active Distribution Networks Embedding Grid Reconfiguration. IEEE Trans. Power Syst. 2018, 33, 1577–1590. [Google Scholar] [CrossRef] [Green Version]
- Marra, F.; Yang, G.Y.; Træholt, C.; Larsen, E.; Rasmussen, C.N.; You, S. Demand profile study of battery electric vehicle under different charging options. In Proceedings of the 2012 IEEE Power and Energy Society General Meeting, San Diego, CA, USA, 22–26 July 2012; pp. 1–7. [Google Scholar] [CrossRef] [Green Version]
- Guo, C.; Zhu, K.; Chen, C.; Xiao, X. Characteristics and effect laws of the large-scale electric Vehicle’s charging load. eTransportation 2020, 3, 100049. [Google Scholar] [CrossRef]
- Zhang, J.; Yan, J.; Liu, Y.; Zhang, H.; Lv, G. Daily electric vehicle charging load profiles considering demographics of vehicle users. Appl. Energy 2020, 274, 115063. [Google Scholar] [CrossRef]
- Hecht, C.; Das, S.; Bussar, C.; Sauer, D.U. Representative, empirical, real-world charging station usage characteristics and data in Germany. eTransportation 2020, 6, 100079. [Google Scholar] [CrossRef]
- Sachan, S.; Kishor, N. Optimal location and optimum charging of electric vehicle based on sensitivity indices. In Proceedings of the 2015 IEEE Innovative Smart Grid Technologies—Asia (ISGT ASIA), Bangkok, Thailand, 3–6 November 2015; pp. 1–6. [Google Scholar] [CrossRef]
- Gampa, S.R.; Jasthi, K.; Goli, P.; Das, D.; Bansal, R.C. Grasshopper optimization algorithm based two stage fuzzy multiobjective approach for optimum sizing and placement of distributed generations, shunt capacitors and electric vehicle charging stations. J. Energy Storage 2020, 27, 101117. [Google Scholar] [CrossRef]
- Luo, L.; Wu, Z.; Gu, W.; Huang, H.; Gao, S.; Han, J. Coordinated allocation of distributed generation resources and electric vehicle charging stations in distribution systems with vehicle-to-grid interaction. Energy 2020, 192, 116631. [Google Scholar] [CrossRef]
- Li, D.; Zouma, A.; Liao, J.T.; Yang, H.T. An energy management strategy with renewable energy and energy storage system for a large electric vehicle charging station. eTransportation 2020, 6, 100076. [Google Scholar] [CrossRef]
- Bayram, I.S.; Galloway, S.; Burt, G. A probabilistic capacity planning methodology for plug-in electric vehicle charging lots with on-site energy storage systems. J. Energy Storage 2020, 32, 101730. [Google Scholar] [CrossRef]
- Fan, V.H.; Dong, Z.; Meng, K. Integrated distribution expansion planning considering stochastic renewable energy resources and electric vehicles. Appl. Energy 2020, 278, 115720. [Google Scholar] [CrossRef]
- Mehrjerdi, H.; Hemmati, R. Stochastic model for electric vehicle charging station integrated with wind energy. Sustain. Energy Technol. Assessments 2020, 37, 100577. [Google Scholar] [CrossRef]
- Rahmani-Andebili, M.; Shen, H.; Fotuhi-Firuzabad, M. Planning and Operation of Parking Lots Considering System, Traffic, and Drivers Behavioral Model. IEEE Trans. Syst. Man, Cybern. Syst. 2019, 49, 1879–1892. [Google Scholar] [CrossRef]
- Parastvand, H.; Moghaddam, V.; Bass, O.; Masoum, M.A.S.; Chapman, A.; Lachowicz, S. A Graph Automorphic Approach for Placement and Sizing of Charging Stations in EV Network Considering Traffic. IEEE Trans. Smart Grid 2020, 11, 4190–4200. [Google Scholar] [CrossRef]
- Suresh, V.; Bazmohammadi, N.; Janik, P.; Guerrero, J.M.; Kaczorowska, D.; Rezmer, J.; Jasinski, M.; Leonowicz, Z. Optimal location of an electrical vehicle charging station in a local microgrid using an embedded hybrid optimizer. Int. J. Electr. Power Energy Syst. 2021, 131, 106979. [Google Scholar] [CrossRef]
- Richardson, P.; Flynn, D.; Keane, A. Local Versus Centralized Charging Strategies for Electric Vehicles in Low Voltage Distribution Systems. IEEE Trans. Smart Grid 2012, 3, 1020–1028. [Google Scholar] [CrossRef]
- Fachrizal, R.; Munkhammar, J. Improved Photovoltaic Self-Consumption in Residential Buildings with Distributed and Centralized Smart Charging of Electric Vehicles. Energies 2020, 13, 1153. [Google Scholar] [CrossRef] [Green Version]
- Coffman, M.; Bernstein, P.; Wee, S. Integrating electric vehicles and residential solar PV. Transp. Policy 2017, 53, 30–38. [Google Scholar] [CrossRef]
- Khalkhali, H.; Hosseinian, S.H. Multi-class EV charging and performance-based regulation service in a residential smart parking lot. Sustain. Energy Grids Networks 2020, 22, 100354. [Google Scholar] [CrossRef]
- Ayyadi, S.; Bilil, H.; Maaroufi, M. Optimal charging of Electric Vehicles in residential area. Sustain. Energy Grids Netw. 2019, 19, 100240. [Google Scholar] [CrossRef]
- Gong, H.; Ionel, D.M. Optimization of Aggregated EV Power in Residential Communities with Smart Homes. In Proceedings of the 2020 IEEE Transportation Electrification Conference Expo (ITEC), Chicago, IL, USA, 23–26 June 2020; pp. 779–782. [Google Scholar] [CrossRef]
- Ahmadi, S.; Arabani, H.P.; Haghighi, D.A.; Guerrero, J.M.; Ashgevari, Y.; Akbarimajd, A. Optimal use of vehicle-to-grid technology to modify the load profile of the distribution system. J. Energy Storage 2020, 31, 101627. [Google Scholar] [CrossRef]
- Limmer, S.; Rodemann, T. Peak load reduction through dynamic pricing for electric vehicle charging. Int. J. Electr. Power Energy Syst. 2019, 113, 117–128. [Google Scholar] [CrossRef]
- Haes Alhelou, H.; Mirjalili, S.J.; Zamani, R.; Siano, P. Assessing the optimal generation technology mix determination considering demand response and EVs. Int. J. Electr. Power Energy Syst. 2020, 119, 105871. [Google Scholar] [CrossRef]
- Wang, H.; Sheng, L.; Yasin, G.; Wang, L.; Xu, H.; He, X. Reviewing the current status and development of polymer electrolytes for solid-state lithium batteries. Energy Storage Mater. 2020, 33, 188–215. [Google Scholar] [CrossRef]
- Yasin, G.; Arif, M.; Mehtab, T.; Lu, X.; Yu, D.; Muhammad, N.; Nazir, M.T.; Song, H. Understanding and suppression strategies toward stable Li metal anode for safe lithium batteries. Energy Storage Mater. 2020, 25, 644–678. [Google Scholar] [CrossRef]
- Mehtab, T.; Yasin, G.; Arif, M.; Shakeel, M.; Korai, R.M.; Nadeem, M.; Muhammad, N.; Lu, X. Metal-organic frameworks for energy storage devices: Batteries and supercapacitors. J. Energy Storage 2019, 21, 632–646. [Google Scholar] [CrossRef]
- Hou, Q.; Yu, Y.; Du, E.; He, H.; Zhang, N.; Kang, C.; Liu, G.; Zhu, H. Embedding scrapping criterion and degradation model in optimal operation of peak-shaving lithium-ion battery energy storage. Appl. Energy 2020, 278, 115601. [Google Scholar] [CrossRef]
- Dixon, J.; Bell, K. Electric vehicles: Battery capacity, charger power, access to charging and the impacts on distribution networks. eTransportation 2020, 4, 100059. [Google Scholar] [CrossRef]
- Das, H.; Rahman, M.; Li, S.; Tan, C. Electric vehicles standards, charging infrastructure, and impact on grid integration: A technological review. Renew. Sustain. Energy Rev. 2020, 120, 109618. [Google Scholar] [CrossRef]
- Anees, A.S. Grid integration of renewable energy sources: Challenges, issues and possible solutions. In Proceedings of the 2012 IEEE 5th India International Conference on Power Electronics (IICPE), Delhi, India, 6–8 December 2012; pp. 1–6. [Google Scholar] [CrossRef]
- Al-Shetwi, A.Q.; Hannan, M.; Jern, K.P.; Mansur, M.; Mahlia, T. Grid-connected renewable energy sources: Review of the recent integration requirements and control methods. J. Clean. Prod. 2020, 253, 119831. [Google Scholar] [CrossRef]
- Iria, J.; Scott, P.; Attarha, A. Network-constrained bidding optimization strategy for aggregators of prosumers. Energy 2020, 207, 118266. [Google Scholar] [CrossRef]
- Yang, X.S.; Karamanoglu, M.; He, X. Flower pollination algorithm: A novel approach for multiobjective optimization. Eng. Optim. 2014, 46, 1222–1237. [Google Scholar] [CrossRef] [Green Version]
- Alyasseri, Z.A.A.; Khader, A.T.; Al-Betar, M.A.; Awadallah, M.A.; Yang, X.S. Variants of the flower pollination algorithm: A review. Stud. Comput. Intell. 2018, 744, 91–118. [Google Scholar] [CrossRef]
- Jaipuria. Conductor Types and Specifications. Available online: http://www.jaipuriabrotherselect.com/acsr-conductors-accessories.html (accessed on 8 December 2021).
- Lakshmi, S.; Ganguly, S. Centralized and Distributed Battery Energy Storage System for Peak Load Demand Support of Radial Distribution Networks. In Proceedings of the 2019 IEEE Milan PowerTech, Milan, Italy, 23–27 June 2019; pp. 1–6. [Google Scholar] [CrossRef]


| Conductor Type Number | Conductor Type | Area (mm2) | Resistance (Ω/km) | Reactance (Ω/km) | Maximum Current Capacity (A) | Weight (Kg/km) |
|---|---|---|---|---|---|---|
| 1 | Squirrel | 20.71 | 1.374 | 0.355 | 115 | 85 |
| 2 | Gopher | 25.91 | 1.09 | 0.349 | 133 | 106 |
| 3 | Weasel | 31.21 | 0.9116 | 0.345 | 150 | 128 |
| 4 | Ferret | 41.84 | 0.672 | 0.339 | 181 | 171 |
| 5 | Rabbit | 52.21 | 0.5449 | 0.335 | 208 | 214 |
| 6 | Mink | 62.32 | 0.4565 | 0.333 | 234 | 255 |
| 7 | Beaver | 74.07 | 0.3906 | 0.33 | 261 | 303 |
| 8 | Raccoon | 77.83 | 0.3656 | 0.329 | 270 | 318 |
| 9 | Cat | 94.21 | 0.315 | 0.327 | 305 | 385 |
| 10 | Dog | 103.6 | 0.2745 | 0.315 | 324 | 394 |
| 11 | Tiger | 128.1 | 0.2221 | 0.282 | 382 | 604 |
| 12 | Bear | 258.1 | 0.1102 | 0.25 | 595 | 1229 |
| Branch Number | Conductor Type | Branch Number | Conductor Type | ||||
|---|---|---|---|---|---|---|---|
| Base Case | PSO | FPA | Base Case | PSO | FPA | ||
| 1 | Bear | Bear | Bear | 62 | Tiger | Bear | Bear |
| 2 | Bear | Bear | Bear | 63 | Squirrel | Bear | Squirrel |
| 3 | Squirrel | Bear | Squirrel | 64 | Squirrel | Squirrel | Bear |
| 4 | Squirrel | Squirrel | Squirrel | 65 | Dog | Bear | Bear |
| 5 | Squirrel | Bear | Beaver | 66 | Cat | Bear | Bear |
| 6 | Squirrel | Squirrel | Raccoon | 67 | Squirrel | Bear | Weasel |
| 7 | Squirrel | Squirrel | Squirrel | 68 | Squirrel | Bear | Bear |
| 8 | Bear | Bear | Bear | 69 | Squirrel | Squirrel | Bear |
| 9 | Bear | Bear | Bear | 70 | Squirrel | Squirrel | Rabbit |
| 10 | Squirrel | Bear | Cat | 71 | Squirrel | Bear | Squirrel |
| 11 | Squirrel | Bear | Weasel | 72 | Cat | Bear | Bear |
| 12 | Squirrel | Squirrel | Squirrel | 73 | Squirrel | Bear | Bear |
| 13 | Squirrel | Bear | Gopher | 74 | Squirrel | Squirrel | Tiger |
| 14 | Squirrel | Squirrel | Beaver | 75 | Squirrel | Squirrel | Bear |
| 15 | Bear | Bear | Bear | 76 | Squirrel | Squirrel | Ferret |
| 16 | Squirrel | Squirrel | Weasel | 77 | Weasel | Bear | Bear |
| 17 | Squirrel | Squirrel | Mink | 78 | Squirrel | Bear | Bear |
| 18 | Squirrel | Squirrel | Bear | 79 | Squirrel | Squirrel | Squirrel |
| 19 | Squirrel | Squirrel | Weasel | 80 | Squirrel | Squirrel | Gopher |
| 20 | Ferret | Bear | Bear | 81 | Squirrel | Bear | Bear |
| 21 | Squirrel | Bear | Raccoon | 82 | Squirrel | Squirrel | Mink |
| 22 | Squirrel | Ferret | Gopher | 83 | Squirrel | Squirrel | Bear |
| 23 | Squirrel | Squirrel | Dog | 84 | Squirrel | Squirrel | Rabbit |
| 24 | Squirrel | Squirrel | Squirrel | 85 | Squirrel | Squirrel | Squirrel |
| 25 | Squirrel | Bear | Mink | 86 | Squirrel | Bear | Rabbit |
| 26 | Squirrel | Squirrel | Beaver | 87 | Squirrel | Squirrel | Squirrel |
| 27 | Squirrel | Squirrel | Squirrel | 88 | Squirrel | Squirrel | Rabbit |
| 28 | Squirrel | Squirrel | Weasel | 89 | Squirrel | Squirrel | Squirrel |
| 29 | Squirrel | Squirrel | Mink | 90 | Squirrel | Squirrel | Raccoon |
| 30 | Squirrel | Squirrel | Squirrel | 91 | Squirrel | Squirrel | Bear |
| 31 | Squirrel | Squirrel | Weasel | 92 | Squirrel | Squirrel | Dog |
| 32 | Squirrel | Squirrel | Squirrel | 93 | Squirrel | Bear | Dog |
| 33 | Squirrel | Squirrel | Squirrel | 94 | Squirrel | Squirrel | Beaver |
| 34 | Squirrel | Bear | Rabbit | 95 | Squirrel | Squirrel | Raccoon |
| 35 | Squirrel | Bear | Gopher | 96 | Squirrel | Squirrel | Bear |
| 36 | Squirrel | Squirrel | Cat | 97 | Squirrel | Bear | Squirrel |
| 37 | Squirrel | Squirrel | Bear | 98 | Squirrel | Squirrel | Squirrel |
| 38 | Squirrel | Bear | Bear | 99 | Squirrel | Squirrel | Squirrel |
| 39 | Squirrel | Squirrel | Mink | 100 | Squirrel | Squirrel | Beaver |
| 40 | Squirrel | Squirrel | Squirrel | 101 | Squirrel | Squirrel | Bear |
| 41 | Squirrel | Gopher | Bear | 102 | Gopher | Bear | Bear |
| 42 | Squirrel | Squirrel | Bear | 103 | Squirrel | Squirrel | Tiger |
| 43 | Squirrel | Bear | Bear | 104 | Squirrel | Squirrel | Squirrel |
| 44 | Squirrel | Bear | Bear | 105 | Squirrel | Bear | Squirrel |
| 45 | Squirrel | Squirrel | Bear | 106 | Squirrel | Bear | Weasel |
| 46 | Squirrel | Bear | Beaver | 107 | Squirrel | Bear | Tiger |
| 47 | Squirrel | Bear | Bear | 108 | Squirrel | Bear | Bear |
| 48 | Squirrel | Bear | Mink | 109 | Squirrel | Squirrel | Rabbit |
| 49 | Squirrel | Bear | Squirrel | 110 | Squirrel | Squirrel | Bear |
| 50 | Squirrel | Squirrel | Ferret | 111 | Squirrel | Bear | Weasel |
| 51 | Squirrel | Squirrel | Ferret | 112 | Squirrel | Bear | Bear |
| 52 | Squirrel | Squirrel | Bear | 113 | Squirrel | Ferret | Squirrel |
| 53 | Squirrel | Bear | Squirrel | 114 | Squirrel | Squirrel | Squirrel |
| 54 | Squirrel | Squirrel | Squirrel | 115 | Squirrel | Bear | Tiger |
| 55 | Squirrel | Bear | Squirrel | 116 | Squirrel | Bear | Raccoon |
| 56 | Tiger | Bear | Bear | 117 | Squirrel | Squirrel | Squirrel |
| 57 | Tiger | Bear | Bear | 118 | Squirrel | Squirrel | Squirrel |
| 58 | Tiger | Bear | Bear | 119 | Squirrel | Bear | Cat |
| 59 | Tiger | Bear | Bear | 120 | Squirrel | Bear | Bear |
| 60 | Squirrel | Squirrel | Bear | 121 | Squirrel | Squirrel | Squirrel |
| 61 | Squirrel | Bear | Squirrel | 122 | Squirrel | Squirrel | Squirrel |
| Branch Number | Conductor Type | Branch Number | Conductor Type | ||||
|---|---|---|---|---|---|---|---|
| Base Case | PSO | FPA | Base Case | PSO | FPA | ||
| 1 | Dog | Bear | Bear | 26 | Squirrel | Ferret | Beaver |
| 2 | Dog | Bear | Bear | 27 | Squirrel | Squirrel | Squirrel |
| 3 | Dog | Bear | Bear | 28 | Squirrel | Bear | Ferret |
| 4 | Dog | Bear | Bear | 29 | Rabbit | Squirrel | Tiger |
| 5 | Mink | Bear | Bear | 30 | Rabbit | Dog | Dog |
| 6 | Mink | Bear | Bear | 31 | Rabbit | Dog | Cat |
| 7 | Mink | Bear | Bear | 32 | Rabbit | Racoon | Beaver |
| 8 | Mink | Bear | Bear | 33 | Rabbit | Dog | Racoon |
| 9 | Squirrel | Dog | Dog | 34 | Rabbit | Mink | Squirrel |
| 10 | Squirrel | Bear | Dog | 35 | Rabbit | Bear | Beaver |
| 11 | Squirrel | Dog | Racoon | 36 | Rabbit | Squirrel | Squirrel |
| 12 | Squirrel | Dog | Rabbit | 37 | Rabbit | Weasel | Gopher |
| 13 | Squirrel | Squirrel | Dog | 38 | Rabbit | Squirrel | Gopher |
| 14 | Squirrel | Mink | Racoon | 39 | Squirrel | Bear | Dog |
| 15 | Squirrel | Squirrel | Squirrel | 40 | Squirrel | Dog | Dog |
| 16 | Squirrel | Dog | Dog | 41 | Squirrel | Dog | Rabbit |
| 17 | Squirrel | Bear | Rabbit | 42 | Squirrel | Mink | Mink |
| 18 | Squirrel | Dog | Cat | 43 | Squirrel | Ferret | Rabbit |
| 19 | Squirrel | Mink | Ferret | 44 | Squirrel | Squirrel | Ferret |
| 20 | Squirrel | Ferret | Squirrel | 45 | Squirrel | Dog | Dog |
| 21 | Squirrel | Squirrel | Rabbit | 46 | Squirrel | Squirrel | Ferret |
| 22 | Squirrel | Dog | Tiger | 47 | Squirrel | Mink | Rabbit |
| 23 | Squirrel | Dog | Beaver | 48 | Squirrel | Rabbit | Squirrel |
| 24 | Squirrel | Mink | Squirrel | 49 | Squirrel | Bear | Ferret |
| 25 | Squirrel | Squirrel | Mink | 50 | Squirrel | Squirrel | Squirrel |
| 123 Bus | 51 Bus | |||||
|---|---|---|---|---|---|---|
| Load Factor | 0.4 | 0.7 | 1.0 | 0.4 | 0.7 | 1.0 |
| Base Case | 0.9930 | 0.9877 | 0.9824 | 0.9659 | 0.9390 | 0.9107 |
| PSO | 0.9949 | 0.9911 | 0.9872 | 0.9851 | 0.9737 | 0.9621 |
| FPA | 0.9956 | 0.9923 | 0.9890 | 0.9852 | 0.9739 | 0.9623 |
| 123 Bus | 51 Bus | |||||
|---|---|---|---|---|---|---|
| Load Factor | 0.4 | 0.7 | 1.0 | 0.4 | 0.7 | 1.0 |
| Base Case | 7.83 | 24.17 | 49.73 | 19.20 | 61.07 | 129.81 |
| PSO | 4.28 | 13.19 | 27.08 | 6.38 | 19.88 | 41.31 |
| FPA | 3.91 | 12.04 | 24.71 | 6.26 | 19.51 | 40.52 |
| 123 Bus System | 51 Bus System | |||
|---|---|---|---|---|
| PSO | FPA | PSO | FPA | |
| Conductor Cost (Rs) | 1,482,368 | 1,339,892 | 4,344,009 | 3,664,850 |
| Annual Energy Savings (kWh) | 108,566 | 119,924 | 416,129 | 419,867 |
| Energy savings/day (kWh) | 297.44 | 328.56 | 1140.08 | 1150.32 |
| Annual Economical Savings (Rs) | 208,204 | 264,940 | 959,392 | 1,052,353 |
| 123 Bus | Case-1 | Case-2 | ||
|---|---|---|---|---|
| (25–75%) | (50–50%) | |||
| Load Factor | 0.4 | 0.7 | 0.4 | 0.7 |
| Energy Savings Available/day (kWh) | 41.07 | 123.21 | 82.14 | 82.14 |
| Energy Savings Available/slot (kWh) | 20.535 | 61.605 | 41.07 | 41.07 |
| Additional Real power loss with EV load (kW) | 5.13 | 15.4 | 10.26 | 10.26 |
| Real power loss without EV load (kW) | 3.91 | 12.04 | 3.91 | 12.04 |
| Total loss permitted with EV load (kW) | 9.04 | 27.44 | 14.17 | 22.3 |
| Actual loss with EV load (kW) | 9.04 | 27.44 | 14.17 | 22.3 |
| Voltage min (p.u) | 0.9938 | 0.9891 | 0.9924 | 0.9901 |
| 51 Bus | Case-1 | Case-2 | ||
|---|---|---|---|---|
| (25–75%) | (50–50%) | |||
| Load Factor | 0.4 | 0.7 | 0.4 | 0.7 |
| Energy Savings Available/day (kWh) | 143.79 | 431.37 | 287.58 | 287.58 |
| Energy Savings Available/slot (kWh) | 71.895 | 215.685 | 143.79 | 143.79 |
| Additional Real power loss with EV load (kW) | 17.97 | 53.92 | 35.94 | 35.94 |
| Real power loss without EV load (kW) | 6.26 | 19.51 | 6.26 | 19.51 |
| Total loss permitted with EV load (kW) | 24.23 | 73.43 | 42.2 | 54.45 |
| Actual loss with EV load (kW) | 24.23 | 73.43 | 42.2 | 54.45 |
| Voltage min (p.u) | 0.9736 | 0.9536 | 0.966 | 0.9594 |
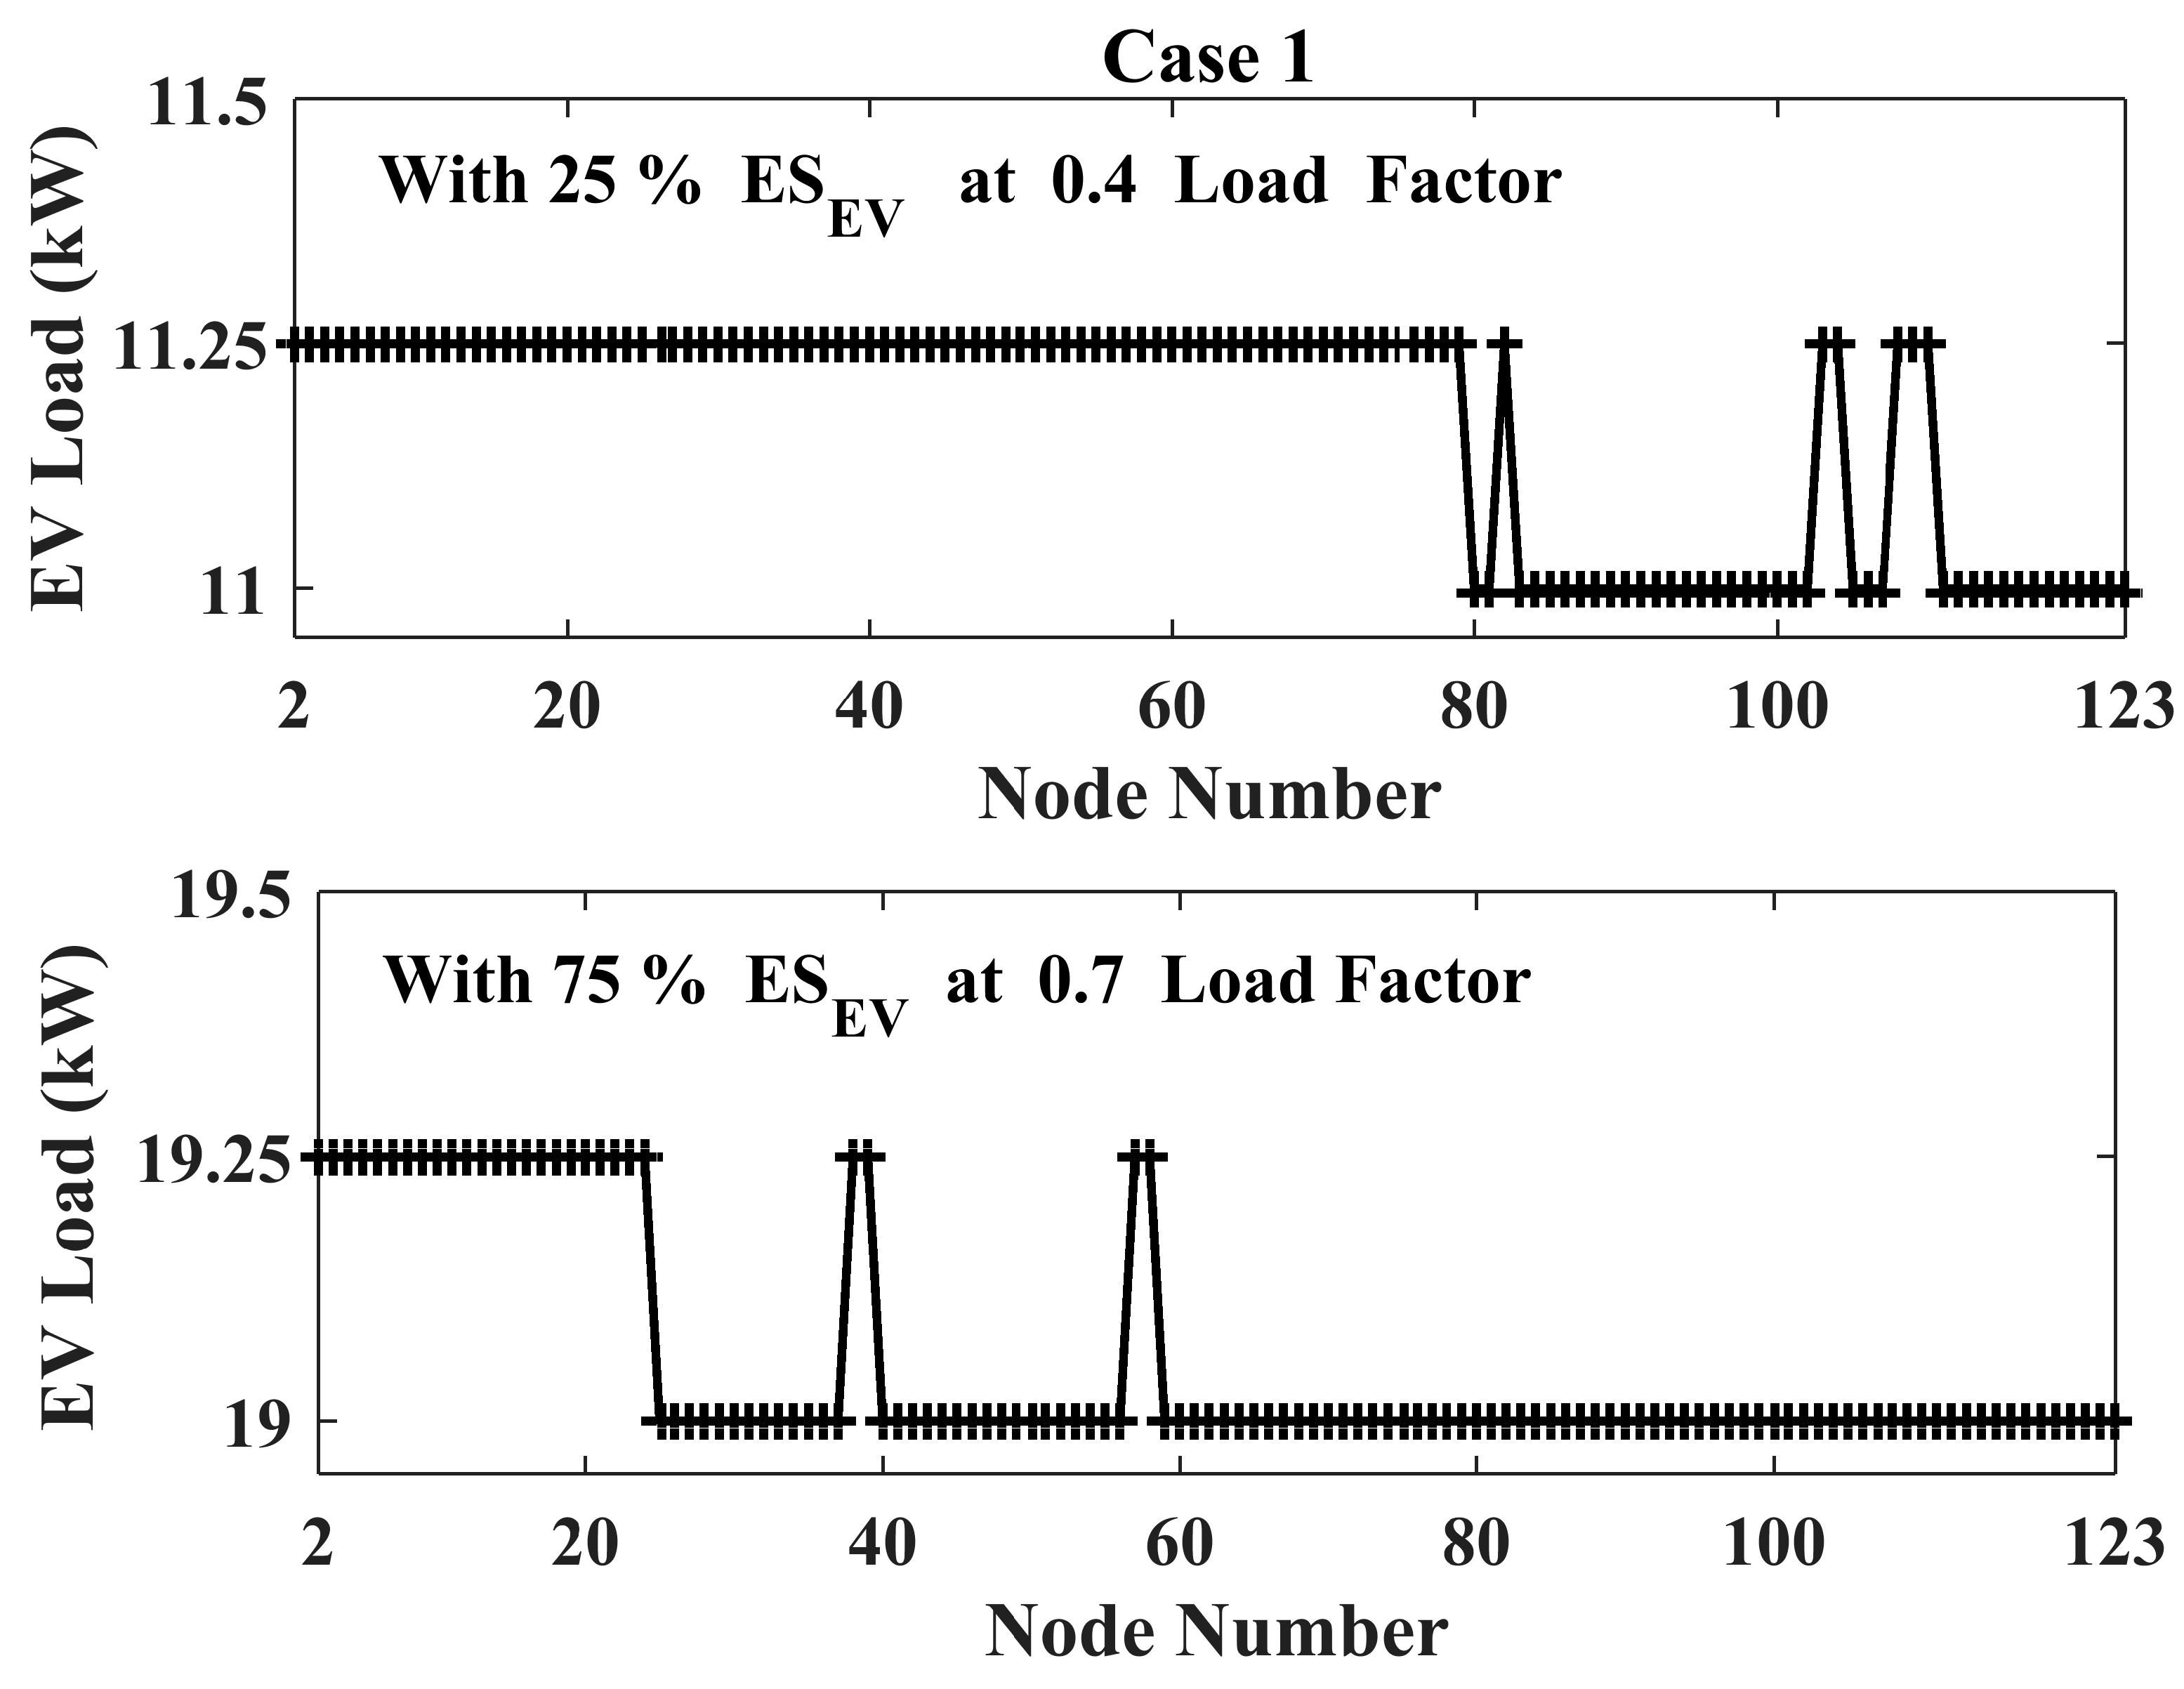
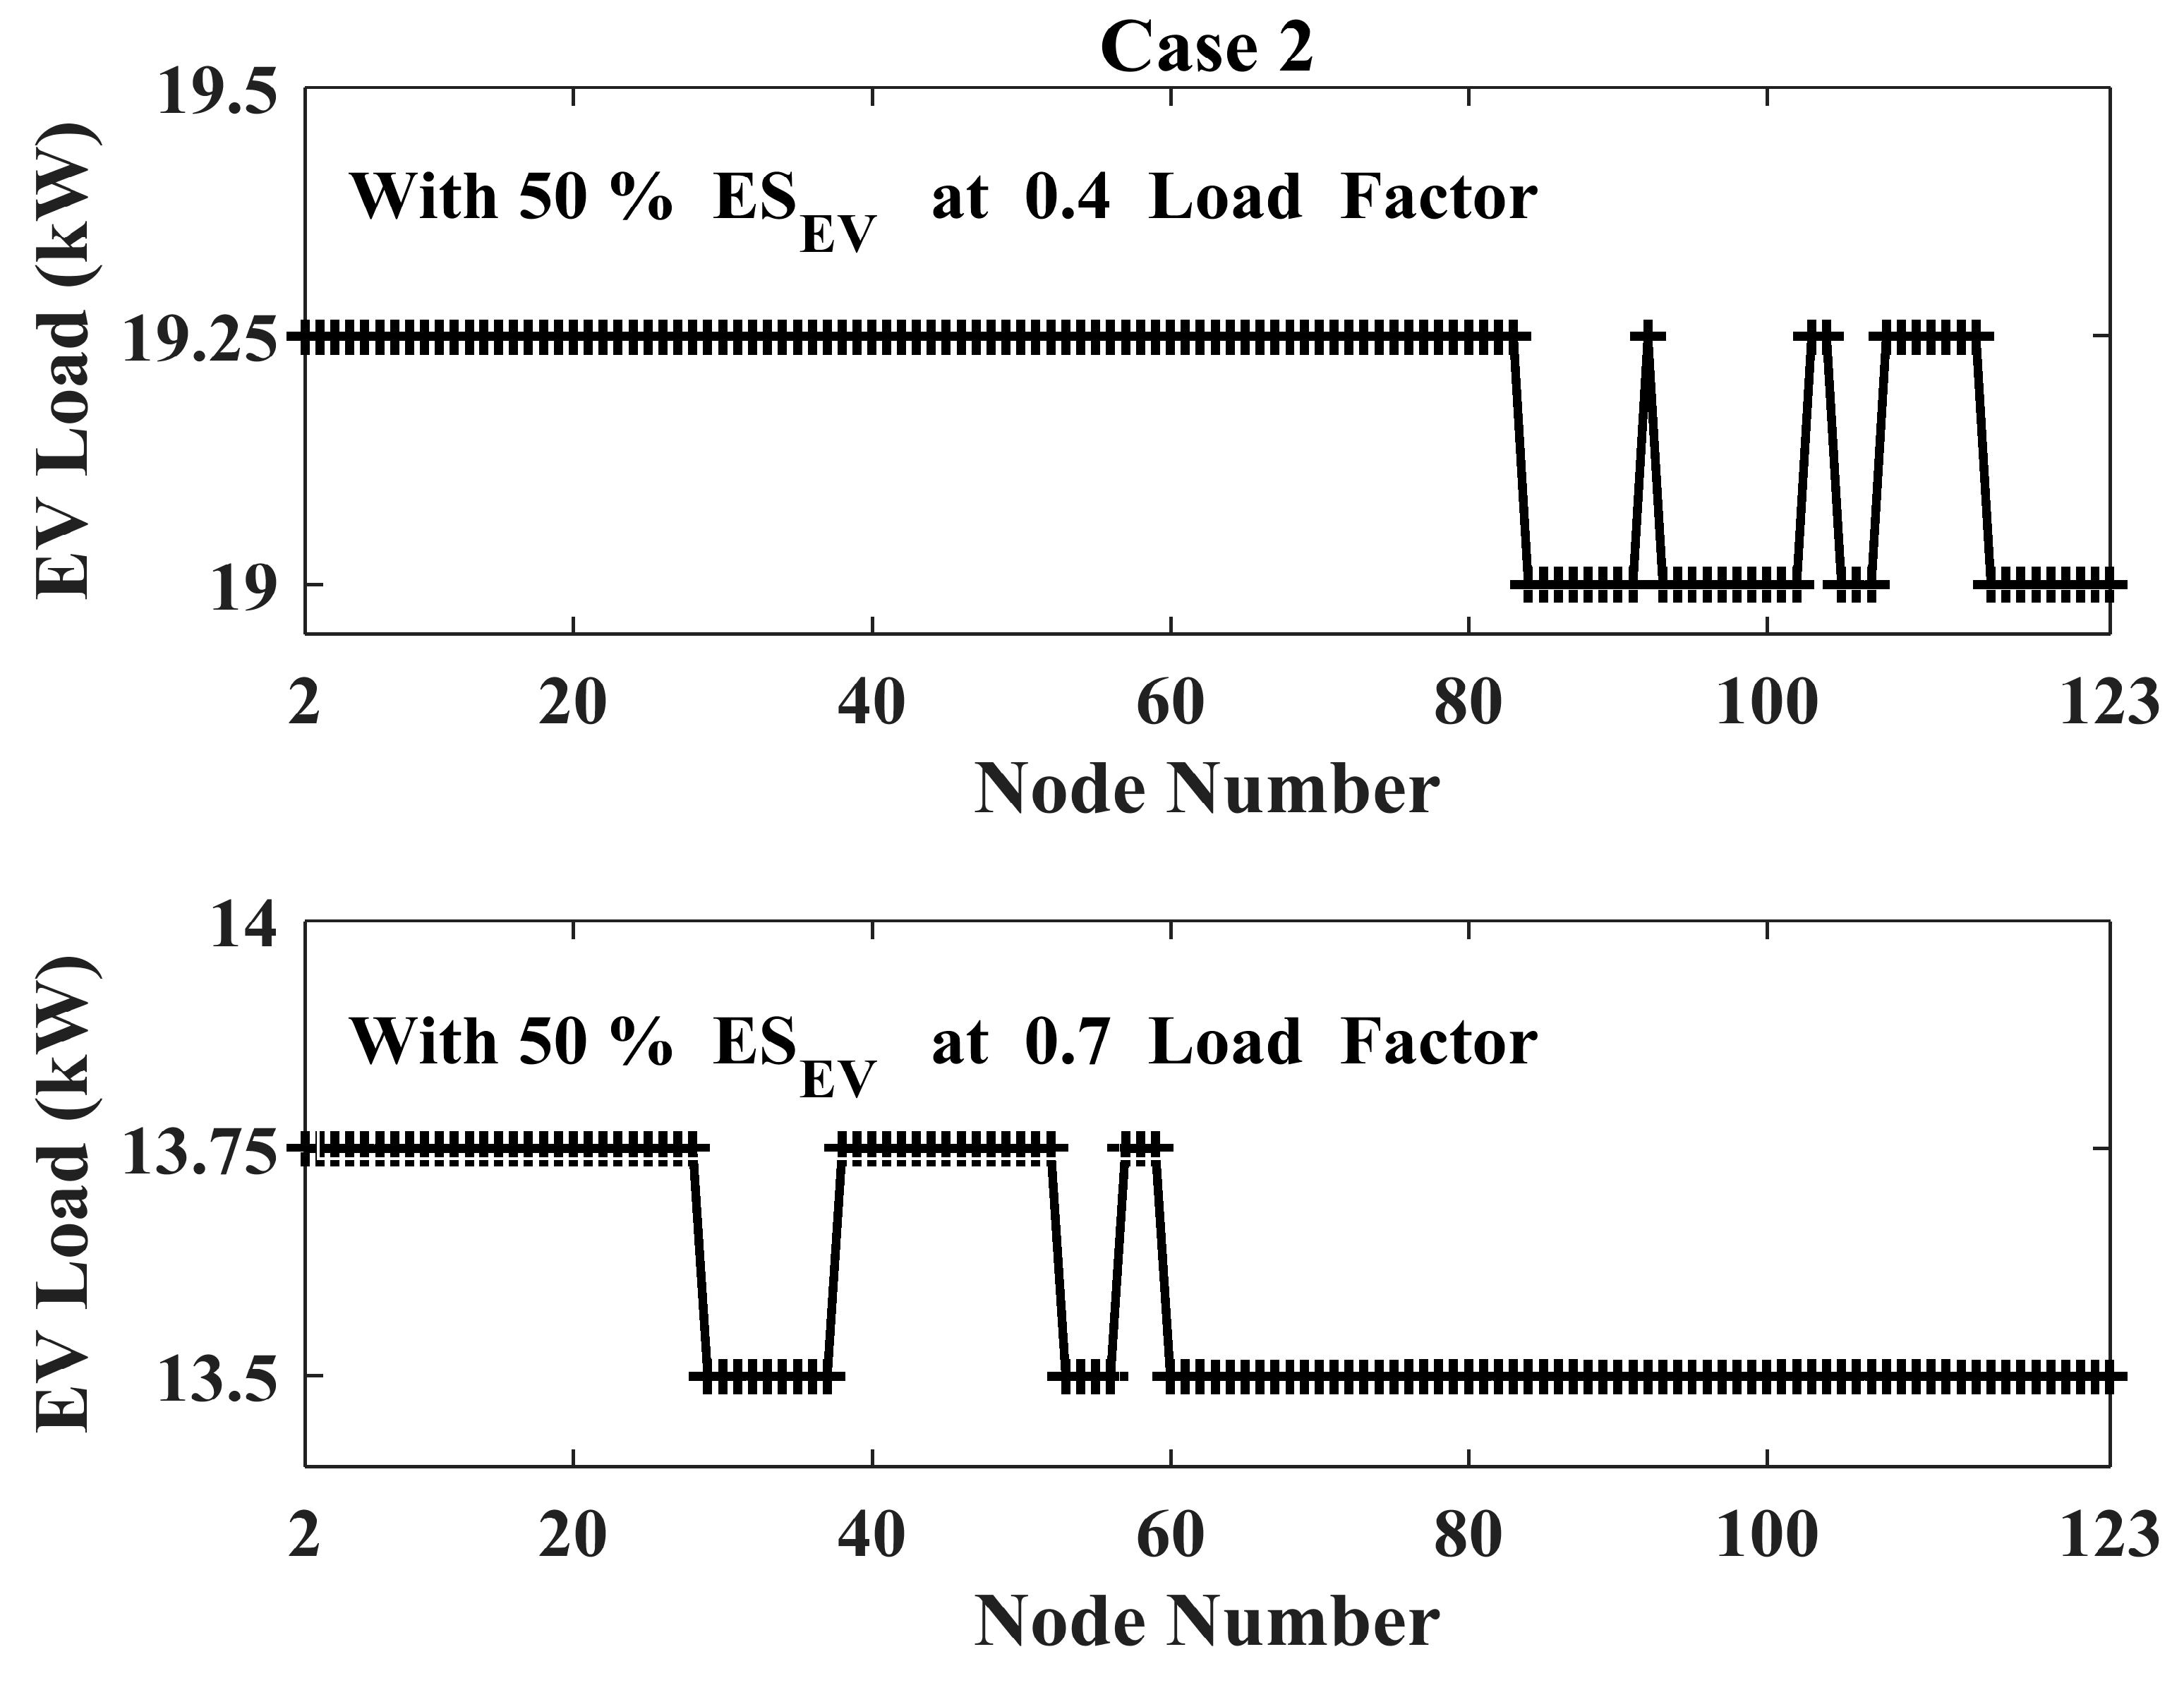
| 123 Bus | Load Factor | Number of Nodes | EV Load/ Node | /slot/ Node | /slot/ Node | /slot/ Node |
|---|---|---|---|---|---|---|
| Case-1 | 0.4 | 84 | 11.25 | 4 | 1 | 2 |
| 38 | 11 | 4 | 1 | 1 | ||
| 0.7 | 27 | 19.25 | 7 | 2 | 1 | |
| 95 | 19 | 7 | 2 | 0 | ||
| Case-2 | 0.4 | 92 | 19.25 | 7 | 2 | 1 |
| 30 | 19 | 7 | 2 | 0 | ||
| 0.7 | 45 | 13.75 | 5 | 1 | 2 | |
| 77 | 13.5 | 5 | 1 | 1 |
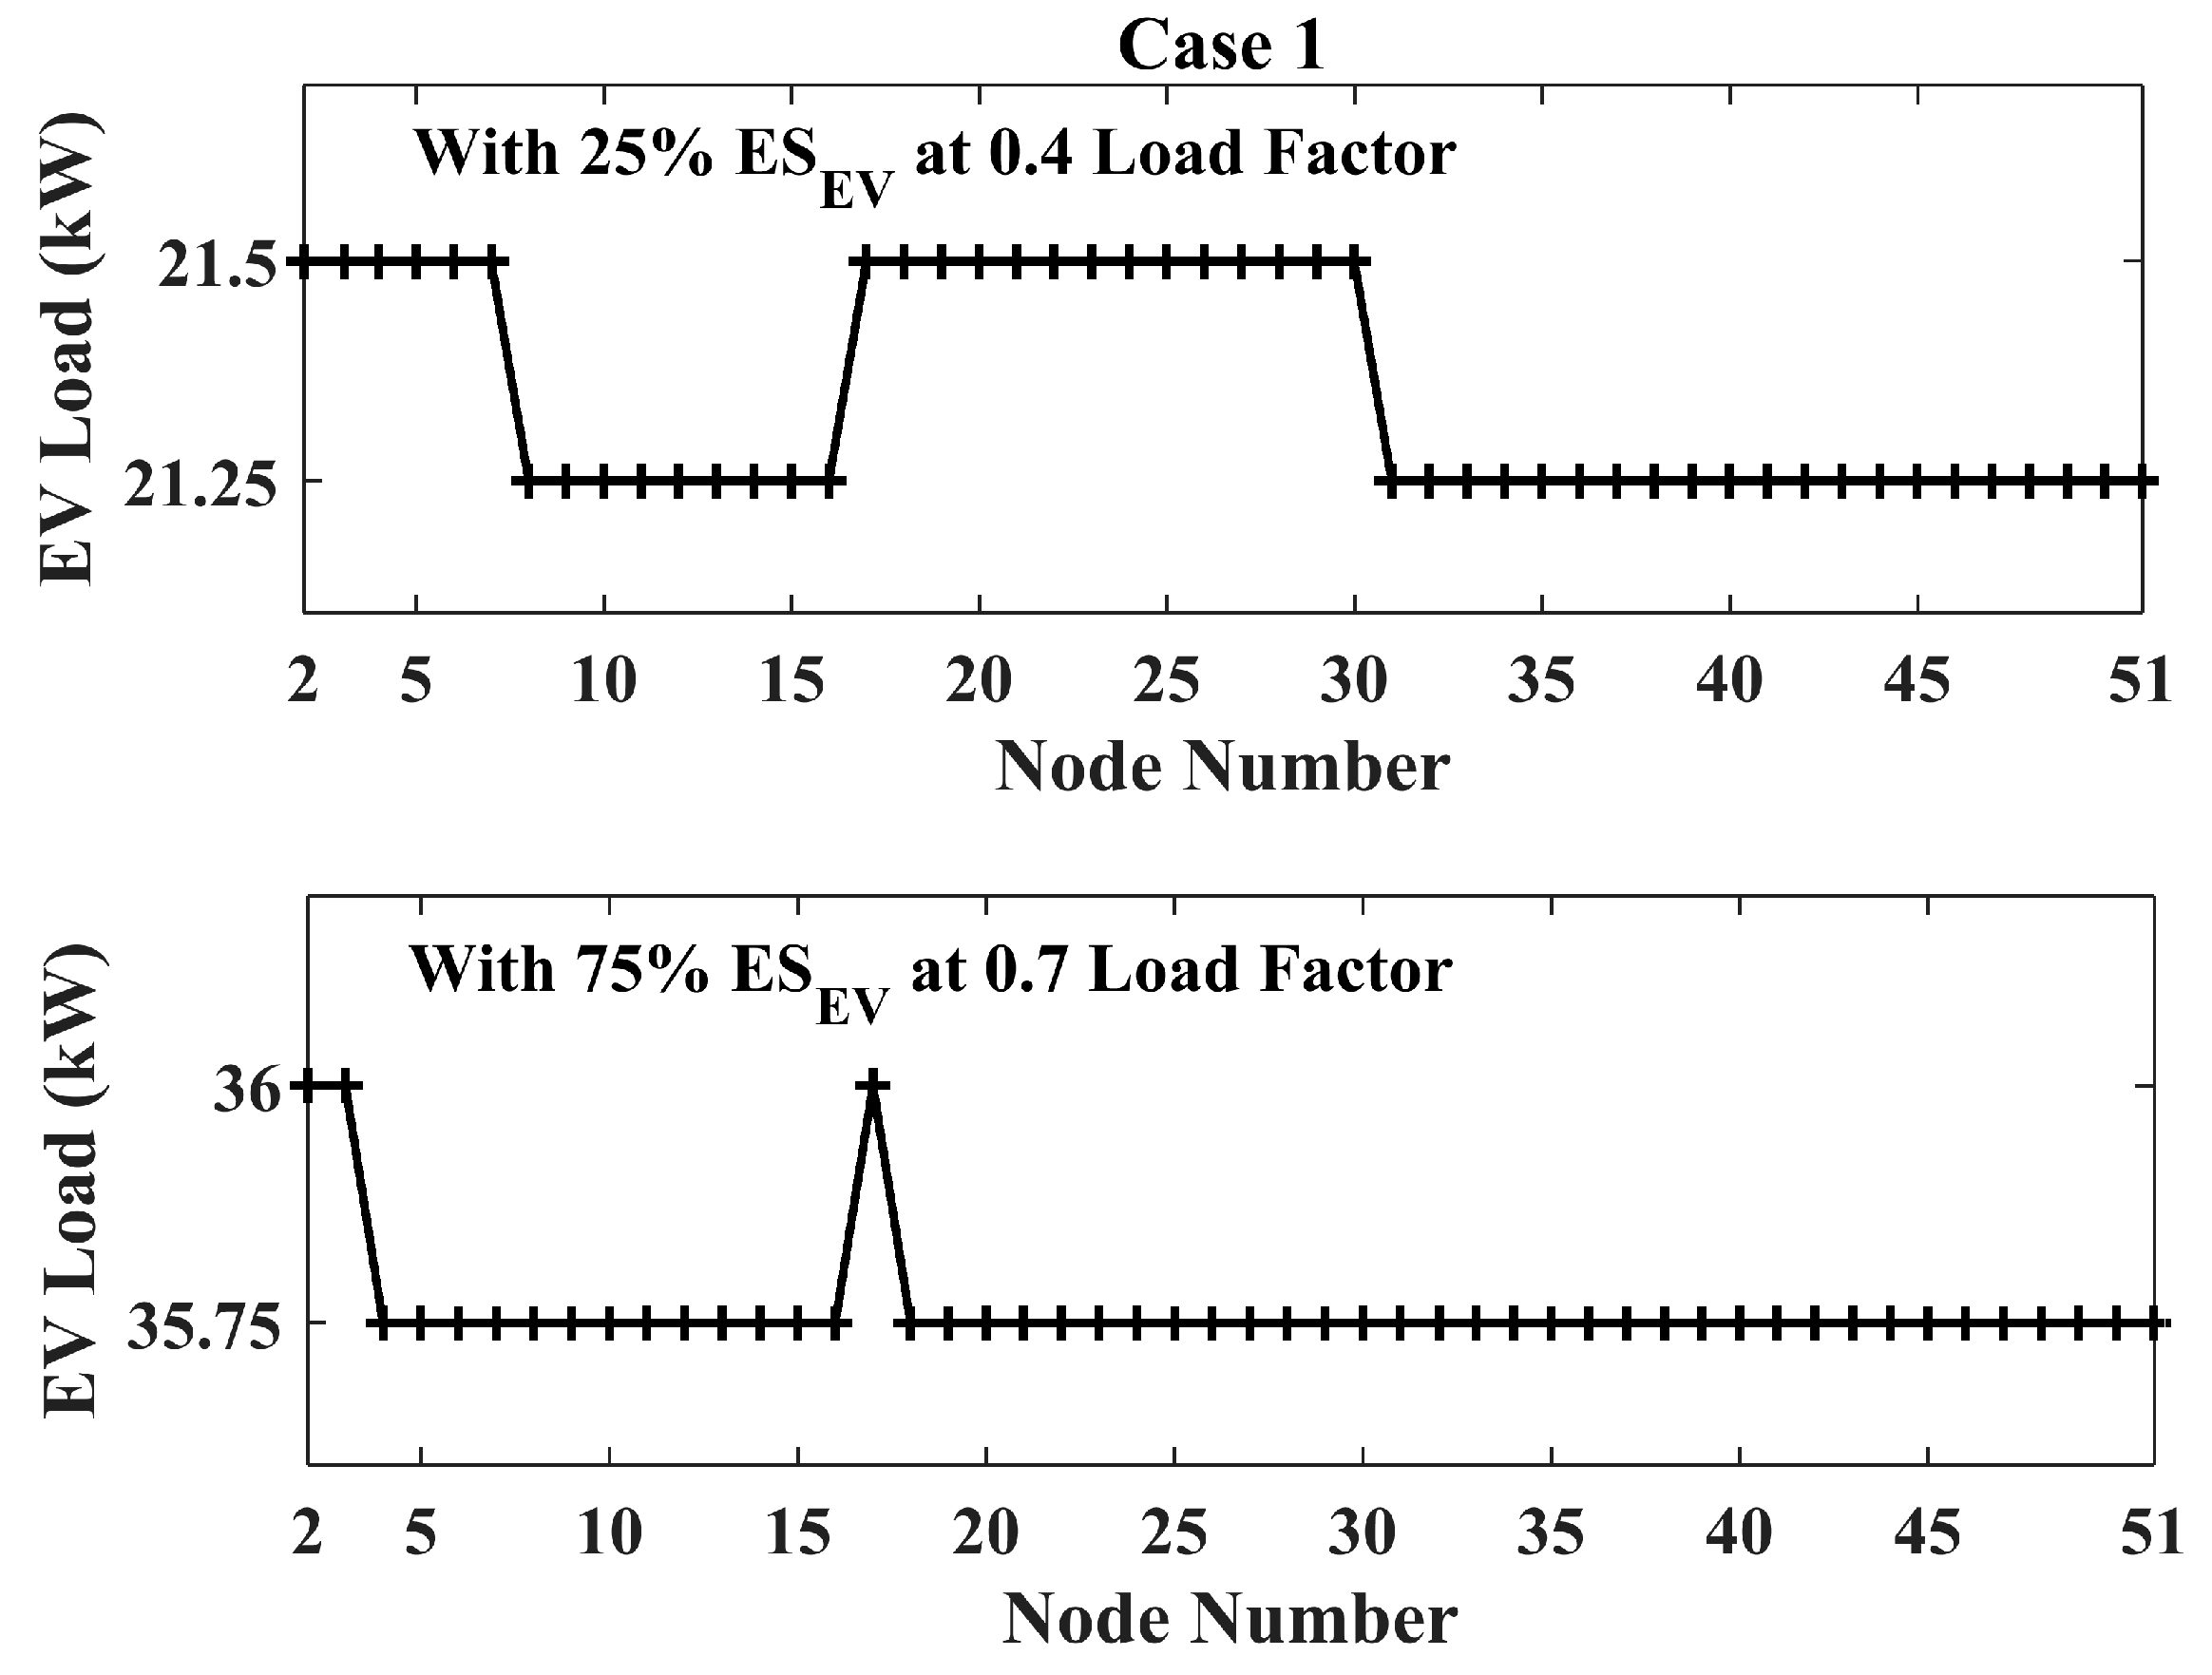
| 51 Bus | Load Factor | Number of Nodes | EV Load/ Node | /slot/ Node | /slot/ Node | /slot/ Node |
|---|---|---|---|---|---|---|
| Case-1 | 0.4 | 20 | 21.5 | 8 | 2 | 0 |
| 30 | 21.25 | 8 | 1 | 2 | ||
| 0.7 | 3 | 36 | 14 | 1 | 1 | |
| 47 | 35.75 | 14 | 1 | 0 | ||
| Case-2 | 0.4 | 19 | 35 | 14 | 0 | 0 |
| 31 | 34.75 | 13 | 3 | 0 | ||
| 0.7 | 44 | 25.75 | 10 | 1 | 0 | |
| 6 | 25.5 | 10 | 0 | 2 |
| 123 Bus | Load Factor | Total NO of Vehicles | ||
|---|---|---|---|---|
| 0.4 | 0.7 | |||
| Case-1 | /day | 976 | 1708 | 2684 |
| /day | 244 | 488 | 732 | |
| /day | 412 | 54 | 466 | |
| Case-2 | /day | 1708 | 1220 | 2928 |
| /day | 488 | 244 | 732 | |
| /day | 184 | 334 | 518 | |
| 51 Bus | Load Factor | Total NO of EVs | ||
|---|---|---|---|---|
| 0.4 | 0.7 | |||
| Case-1 | /day | 800 | 1400 | 2200 |
| /day | 140 | 100 | 240 | |
| /day | 120 | 6 | 126 | |
| Case-2 | /day | 1338 | 1000 | 2338 |
| /day | 186 | 88 | 274 | |
| /day | 0 | 24 | 24 | |
| 123 Bus | Case-1 | Case-2 | ||
|---|---|---|---|---|
| 0.4 Load Factor | 0.7 Load Factor | 0.4 Load Factor | 0.7 Load Factor | |
| EV load injection/slot (kW) | 1363 | 2324.75 | 2341 | 1658.25 |
| EV load injection/slot (%) | 27.28 | 46.43 | 46.86 | 33.19 |
| EV load charging capacity/day (kWh) | 29,502 | 31,994 | ||
| EV load charging capacity/day (%) | 35.15 | 38.12 | ||
| 51 Bus | Case-1 | Case-2 | ||
|---|---|---|---|---|
| 0.4 Load Factor | 0.7 Load Factor | 0.4 Load Factor | 0.7 Load Factor | |
| EV load injection/slot (kW) | 1067.50 | 1788.25 | 1742.25 | 1286.00 |
| EV load injection/slot (%) | 43.34 | 72.61 | 70.74 | 52.21 |
| EV load charging capacity/day (kWh) | 22,846 | 24,226 | ||
| EV load charging capacity/day (%) | 55.21 | 58.55 | ||
Publisher’s Note: MDPI stays neutral with regard to jurisdictional claims in published maps and institutional affiliations. |
© 2022 by the authors. Licensee MDPI, Basel, Switzerland. This article is an open access article distributed under the terms and conditions of the Creative Commons Attribution (CC BY) license (https://creativecommons.org/licenses/by/4.0/).
Share and Cite
Goli, P.; Jasthi, K.; Gampa, S.R.; Das, D.; Shireen, W.; Siano, P.; Guerrero, J.M. Electric Vehicle Charging Load Allocation at Residential Locations Utilizing the Energy Savings Gained by Optimal Network Reconductoring. Smart Cities 2022, 5, 177-205. https://0-doi-org.brum.beds.ac.uk/10.3390/smartcities5010012
Goli P, Jasthi K, Gampa SR, Das D, Shireen W, Siano P, Guerrero JM. Electric Vehicle Charging Load Allocation at Residential Locations Utilizing the Energy Savings Gained by Optimal Network Reconductoring. Smart Cities. 2022; 5(1):177-205. https://0-doi-org.brum.beds.ac.uk/10.3390/smartcities5010012
Chicago/Turabian StyleGoli, Preetham, Kiran Jasthi, Srinivasa Rao Gampa, Debapriya Das, Wajiha Shireen, Pierluigi Siano, and Josep M. Guerrero. 2022. "Electric Vehicle Charging Load Allocation at Residential Locations Utilizing the Energy Savings Gained by Optimal Network Reconductoring" Smart Cities 5, no. 1: 177-205. https://0-doi-org.brum.beds.ac.uk/10.3390/smartcities5010012