
Research Structure and Trends of Smart Urban Mobility


1
Chaire Entrepreneuriat Territoire Innovation (ETI), Groupe de Recherche en Gestion des Organisations (GREGOR), IAE Paris–Sorbonne Business School, Université Paris 1 Panthéon-Sorbonne, 75013 Paris, France
2
Live+Smart Research Lab, School of Architecture and Built Environment, Deakin University, Geelong 3220, Australia
3
Institute for Sustainable Futures, University of Technology Sydney, Sydney 2007, Australia
4
Graduate School of Humanities and Social Sciences & Network for Education and Research on Peace and Sustainability (NERPS), Hiroshima University, Hiroshima 739-8511, Japan
5
Center for Peaceful and Sustainable Futures (CEPEAS), IDEC Institute, Hiroshima University, Hiroshima 739-8529, Japan
*
Author to whom correspondence should be addressed.
Smart Cities 2022, 5(2), 539-561; https://0-doi-org.brum.beds.ac.uk/10.3390/smartcities5020029
Submission received: 22 March 2022
/
Revised: 11 April 2022
/
Accepted: 17 April 2022
/
Published: 18 April 2022
Abstract
:Mobility is a subject of increasing importance in a time when cities have gained prominence, as they are home to over 56% of the world’s population and generate over 80% of global GDP. Urban planning principles have traditionally been developed to promote urban efficiency and enhance productivity. The emergence of ‘Smart Mobility’ has provided researchers and policy practitioners new ways to understand and plan cities. With rapid urbanization growth and the sustained mobility challenges faced in most global cities, this paper sets forth to understand and map the evolution of the concept of ‘Smart Urban Mobility’ through a bibliometric analysis and science mapping techniques using VOSviewer. In total, 6079 articles were retrieved from the Web of Science database over 5 decades, from 1968 to 2021, and divided into four sub-periods, namely 1968 to 2010, 2011 to 2015, 2016 to 2019, and 2020 to 2021. The paper provides a better understanding of the thematic focus and associated trends of smart mobility beyond technical issues related to Intelligent Transport Systems (ITS), where due to diverse dynamics, such as unprecedented growth and advancement in technologies, attention has extended to incorporating the impacts of the application of different technologies in urban mobility as well as associated fields. This paper further identifies major sources, authors, publications, and countries that have made more contributions to the development of this field. The findings of this study can help researchers better understand the evolution of the subject, and help policymakers make better-informed decisions on investable infrastructures for better mobility outcomes in urban regeneration pursuits and future cities.
1. Introduction
After the Second World War (WW2), there was rapid and unprecedented growth of suburban areas, especially in the 1950s, and more so in the United States. This expansion was influenced by factors such as economic growth that prompted a rise in the standard of living, low inflation, and the availability of low-cost mortgages, among other factors. Increased disposable income coupled with the need to travel from different parts of suburban areas, as well as the increased marketing strategies deployed by car manufacturers, the acquisition of private cars increased, especially because public transportation was not that flexible nor efficient in last mile connections during that time [1]. However, the growth of the automobile industry has been among the key components that influenced numerous urban dynamics, especially planning, the emergence of new urban areas, gentrification, and sprawl [2,3]. Melosi [4] argues that the continued increase in the number of automobiles providing flexibility in the transportation industry could be associated with the emergence of new economic frontiers such as real estate, the rise of department stores, and many others.
The aforementioned dynamics in the mobility industry have since the 70s continued to generate interest in urban research, especially in view of diverse factors such as urbanization, economic growth, and changes in the social dimensions. Interest has also been triggered by emerging and rapidly increasing challenges such as traffic congestion that leads to billions of dollars in economic losses every year. For instance, in 2019 alone, it is reported that over $305 billion was lost due to traffic-related issues across the globe [5]; a figure similar to the GDP of Pakistan, ranked as the 40th country by GDP [6]. The issue of emissions from the transportation sector is another factor that causes interest in mobility, especially considering that the transport sector is responsible for approximately 25% of all the greenhouse gases emitted globally every year. With global attention directed toward the mitigation of climate change impacts [7], researchers have considerable interest in how the transport sector has been responsible and the alternatives available to minimize the emissions thereof. For instance, in a bid to reduce the carbon footprint from the transport sector, especially related to road transport, there is increased interest in electric mobility options, which are emerging gradually in cities [8]. On this, as of August 2021, it is reported that there were over 5.6 million electric vehicles globally, representing a 64% increase in growth of this mobility option compared with 2018 [9].
Urban planning in relation to available and emerging mobility options is another factor that has prompted research interest in mobility. On this, it has been documented that urban planning is influenced by diverse factors, but from the end of WW2, an increase in automobiles was seen to be a major consideration. As a result, most cities have been fashioned to allow for smooth vehicular flows, with human-centric dimensions such as social interactions coming second. However, over time it has become apparent that the auto-centric planning models are not sustainable and need to be reconsidered to give room to more human-oriented models. This is true as global urbanization rates have increased significantly, prompting a rapid growth of urban population which is currently approximately 55% of the total global population and is projected to rise to about 68% by 2030 [10]. Nevertheless, the numerous urban challenges that residents confront have triggered the need for a rethinking of the planning model to accommodate emerging planning models that more emphasize the human aspects and a reduction of car dependence. The realization of such planning approaches is now a viable reality following the extensive use of diverse technologies, evident in some cities worldwide, that have been gradually implementing the Smart City model, especially to inform enhanced mobility scenarios. On this, smart solutions enabled by Information and Communication Technologies (ICTs) and Internet of Things (IoT) are critical in providing a better understanding of mobility patterns. Such solutions can positively influence decisions made concerning the transport sector, such as the need to reduce automobile dependency and to increase safety through creating cycling lanes and improving pedestrian environment, amongst others.
Smart urban mobility has been identified as a key enabler for the vision of achieving the smart city concept, as expressed by Ningrum [11], especially since most conventional urban areas fashioned for the use of automobiles, are being given much attention. Therefore, in the pursuit to achieve ‘smartness’ in cities, it becomes paramount to reconsider the different mobility options, and make them ‘smarter’ in terms of sustainability. Smart Mobility is still arguably in its infancy, as the vision is very broad, leading to numerous definitions, and is expected to continue evolving as the availability of technology is more apparent via IoTs. However, all of the definitions converge to the use of ICT in modern transport technologies to improve urban traffic for increased sustainability and safety [12]. Porru, et al. [13] note that smart mobility solutions when enhanced in a coordinated manner between different public authorities, and supported by standardized technological metrics, have the capacity to bring diverse smart benefits to both smart cities and smart lands; hence, the need to pursue them. In a report by the World Bank in 2015 [14], it was clearly indicated that sustainability efforts cannot be achieved, especially in urban areas, without reconsideration of the existing mobility options, and one of the most probable solutions identified then, which still remains viable, is the adoption and pursuit of ‘smartness’. These technologically aligned solutions for increasing efficiency and performance are essential, especially if the challenges emanating from the car-centric approaches in urban areas are to be overcome.
With technology taking the center stage in urban planning, the subject of mobility is projected to continue attracting more research interest, more so with the attention in cities now focusing on transitioning to more sustainable and efficient planning models. The question as to how cities can sustainably transition to more smart and sustainable mobility options will soon arise, and there is an emerging volume of literature already attempting to respond to this. However, a comprehensive mapping of the evolutions and trends of the body of literature, which can help to comprehensively map the new research trends, evolution of the concept and the theoretical conceptualizations, is lacking. This paper thus sets forth to explore the evolving subject of mobility coupled with its use of smart technologies in urban areas. In this vein, a bibliometric analysis on terms associated with ‘Smart Urban Mobility’, expanded in the Appendix A, has been performed. The following section presents the methodology, Section 3 presents the results, and Section 4 presents a discussion and conclusion.
2. Materials and Methods
Various types of methods exist for literature reviews, including systematic reviews and metanalyses. While such methods are ideal for detailed analysis of the literature, the current pace of academic publication requires using other methods such as bibliometric reviews to understand the structure and trends of academic fields. Accordingly, bibliometric reviews have become popular in the last few years and many such reviews exist in the literature [15,16]. Input data for this overview analysis was obtained from the Web of Science (WoS), a widely known database for indexing peer-reviewed literature. Other databases such as Scopus also exist. However, WoS was selected as it only indexes quality peer-reviewed research, and also its bibliographic outputs allow more accurate bibliometric analysis. A broad-based search string was developed to retrieve relevant articles for inclusion in the analysis that included various terms related to smart urban mobility (see Appendix A). This search string was developed in an iterative manner to ensure the inclusion of as many relevant documents as possible. In other words, we started with an initial search string and updated it after checking the retrieved documents for other potentially relevant terms. We continued this until adding more terms to the string did not result in retrieving more documents. Using this search string, 6079 articles were retrieved from the WoS on 1 December 2021. Titles and abstracts of these articles were carefully checked, and in the end, 3643 articles that were in line with the scope of this study were selected for final analysis. Next, the full bibliographic details and cited references of these articles were downloaded from the WoS for bibliometric analysis.
Over the past two decades, different software tools have been developed that can be used to understand the overall structure of research fields. Tools such as SciMAT, Citespace, and VOSviewer have been used more frequently. VOSviewer has been used for this study as it has a more user-friendly interface, provides more informative outputs, and allows better analysis of trends using term co-occurrence maps [17]. The software enables various types of analyses, including term co-occurrence analysis, co-citation analysis, and bibliographic coupling analysis. Term co-occurrence analysis identifies and maps terms that have co-occurred more frequently in the selected documents. As expected, such terms can be used to understand what areas of research have received more attention. Terms that co-occur more frequently form clusters that can identify major thematic areas in the literature. For co-citation and bibliographic coupling, VOSviewers uses the full details of the bibliographic details (references) of the selected documents. According to Van Eck and Waltman [17] “a co-citation link is a link between two items that are both cited by the same document”. In bibliometric analysis, this is used to identify the most influential sources, references, and authors. Furthermore, “a bibliographic coupling link is a link between two items that both cite the same document” [17]. It can be used to identify, among other things, what countries or institutions have made more contributions to the advancement of the field.
To examine trends in the field of smart urban mobility, we divided the study period into four sub-periods based on the number of articles and major milestones that could have influenced the evolution of the field. It is worth noting that multiple milestones could be identified in this regard. However, we only selected three for this analysis. We have also identified the milestones in a manner that ensures a reasonable number of studies for bibliometric analysis. Therefore, although important milestones could be identified before 2010, due to the limited number of articles published until then, we decided to select 2010 as the first milestone as 2010 was when crowdsourcing apps were developed for use in the transportation sector. The second milestone is 2015, an important year due to the publication of important policies and guiding frameworks such as the Sustainable Development Goals and the New Urban Agenda that have provided guidelines for sustainable urban development. Finally, 2020 was selected as another major milestone given the significant impacts of the COVID-19 pandemic on urban development and its multiple implications for different sectors, including urban mobility. Accordingly, the following sub-periods were selected for analysis of the evolution of the field over time. 1968–2010, 2011–2015, 2016–2019, and 2020–now. For each sub-period, term co-occurrence analysis was conducted to understand the thematic focus and structure of the field.
In all cases, VOSviewer outputs are presented as networks of nodes and links, where node size is proportional to the frequency of occurrence and link width is proportional to the strength of the connection between two nodes. For instance, in the case of term co-occurrence analysis, larger nodes mean that a specific term has co-occurred more frequently with other terms. In addition, if the link between two terms is thicker, those two terms have stronger connections.
3. Results
3.1. Publication Trends
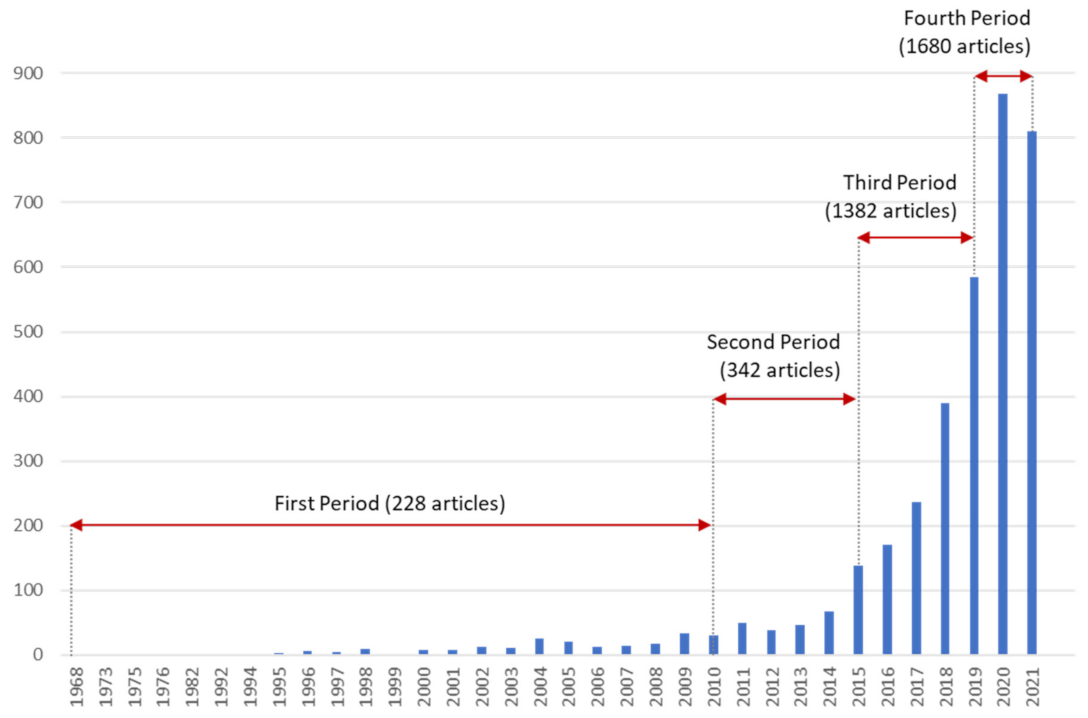
The global publications on the subject of smart urban mobility have been rising gradually since the end of WW2, as illustrated in Figure 1 below. The period between 1968 and 2021 provides a significant overview due to the numerous changes that have been witnessed globally during this period. However, the growth in these publications has not been uniform. For instance, it is evident from the figure that between 1968 and 1995 significantly few publications could be identified relating to the subject matter of mobility. According to U.S. Bureau of Transportation Statistics [18], by 1995, passenger car production was relatively low compared to current trends, due to low demand, fewer manufacturing companies, and insufficient supporting infrastructure in many geographical locations. For instance, in 1995, only 36,717,000 passenger cars were produced globally, with 17.5% of those based in the U.S. By the end of 1995, the global car population was only 670 million [19] compared with a global population of approximately 5.7 billion people [20], indicating that the ratio of passenger cars relative to human population was very small. Further, by this time, the impacts of climate change were not popularized, and the direct links to mobility were not apparent. Additionally, modernist planning ideologies established at the time promoted a heavy car-centric philosophy [4].
From 1996 onward, the global car population started to increase, with some regions such as the U.S. reporting a growth rate of 2.4% annually. This could explain why researchers started to gain some interest in mobility, though only a few publications (less than 100) appeared until 2014. By 2015, the number of cars (both commercial and passenger cars) had increased to over 1 billion [21], and this had started to elicit substantial research interest on the subject. As a result, publications increased exponentially, from around 140 in 2015 to a high of over 880 by 2020, as shown in Figure 1. During this period, climate change issues had gained traction, especially with the Paris Agreement and others focusing on ways to reduce global emissions, with the transport sector being amongst the targeted sectors. With the emergence of COVID-19 in early 2020, the number of publications continued to increase, with over 800 appearing in 2021.
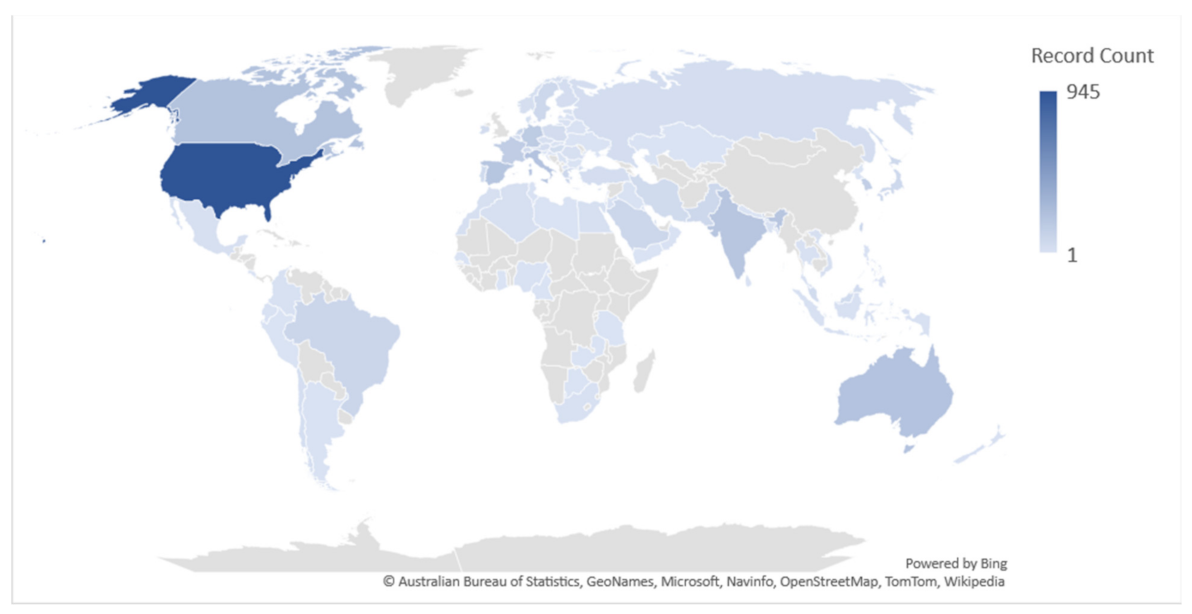
Figure 2 provides a clear picture of why there have been relatively few publications relating to the smart urban mobility subject, despite the continued increased number of issues related to urban mobility. The evidence, as depicted in Figure 2, shows that only a few regions, specifically in Northern America hosted researchers with considerable interest in the subject. The small number of publications, especially between 1968 and 1995, as seen in Figure 1 above, could be attributed to the fact that the ICT and smart technologies were not present then, and even today, they are still relatively new and continue to evolve. Particularly few publications were noted in large parts of Africa and Asia. Such dynamics by which most publications emanate from a few regions could be attributed to the emergence of the fourth industrial revolution, in which internet use and smart technologies are gradually becoming part of different urban dimensions, including mobility, especially in the regions of North America, Europe and Australia; hence, prompting the interest of the publications reported. However, it is surprising that the Asian region, which has had a rich history in mobility, especially with the high availability of road, air, rail and water transportation options, and also extensive internet use, has had very few publications.
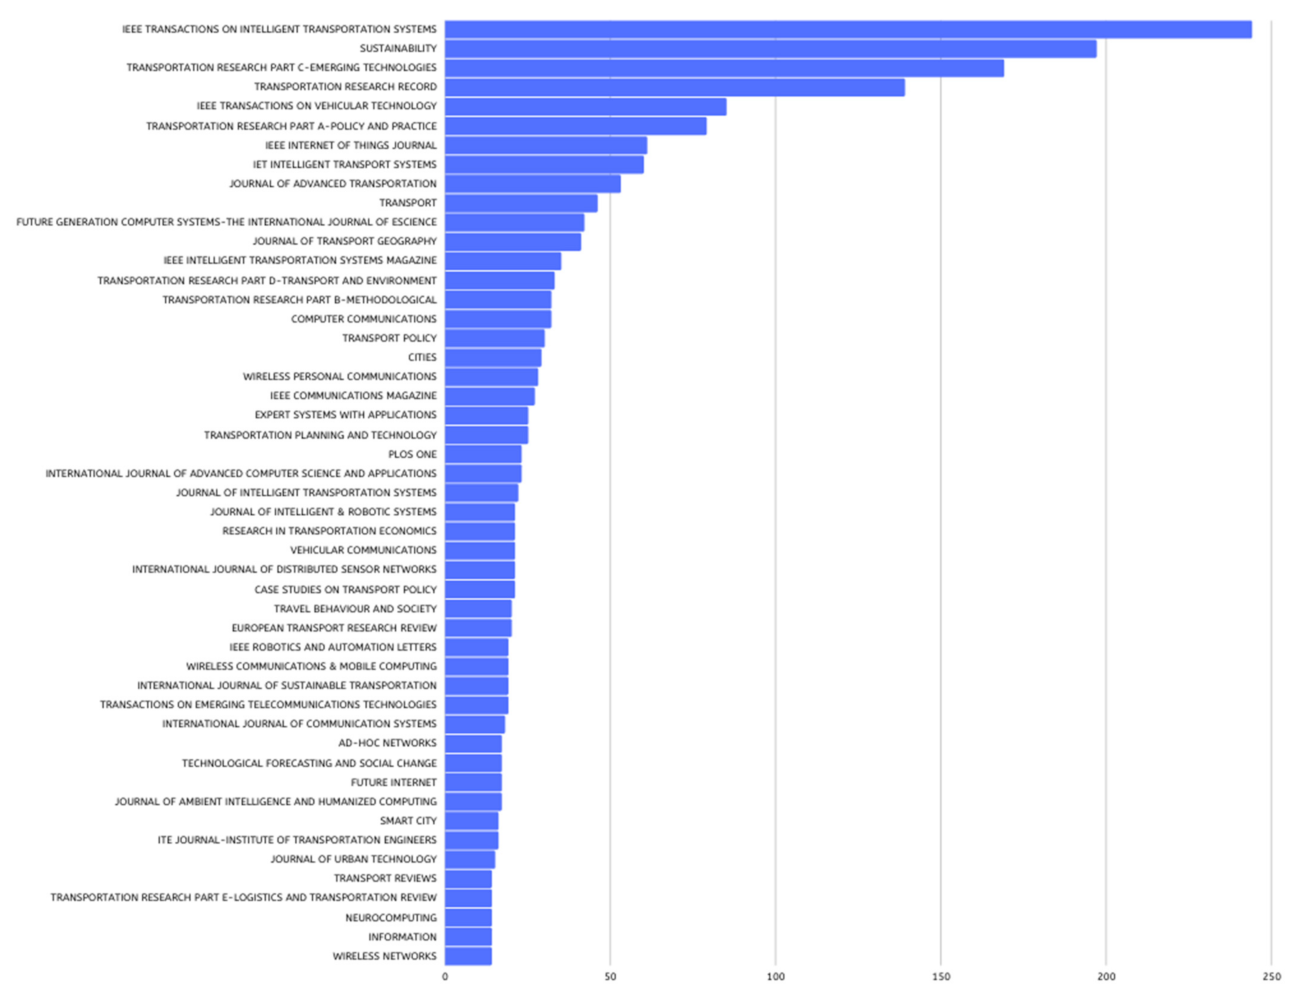
Out of the 6079 articles identified for this bibliometric analysis, it is evident from Figure 3 below that most of the publications on ‘smart’ mobility, were encouraged by only a few sources (journals). For instance, as highlighted in Figure 3 below, there were only 10 publications that had more than 50 published works by 2021, with IEEE Transactions on Intelligent Transportation and the IEEE Access having approximately 240 published works each.
While the visual representation in Figure 3 only shows sources with the highest number of contributions, Figure 4 below helps understand why there are such notable differences in the number of published works from each source. On this, it is evident that a majority of the research works were in the sub-disciplines of engineering and transportation (23% each), whereas computer science and telecommunications had 16% and 12%, respectively. Based on the literature review, the issue of mobility and its impacts especially on sustainability agendas, which gained traction from 2015, is most prominent; hence, explaining why engineering and transportation sub-disciplines had many published works. Moreover, in regard to engineering, research interest is diverse, but such research tends to converge on how engineers could improve machines (including automobiles) to reduce their carbon footprint, particularly machines that are not reliant on non-renewable fuels as electric vehicles are [22]. Similarly, in regard to smart urban mobility, research works on areas such as alternative means of transport, cycling, alternative urban planning models such as the ‘15-min city concept’ [23,24,25], the reduction of private cars in favor of public transport and other areas which would play a significant role in shaping the debate on overall emissions reduction in the transport sector.
3.2. Most Influential Sources
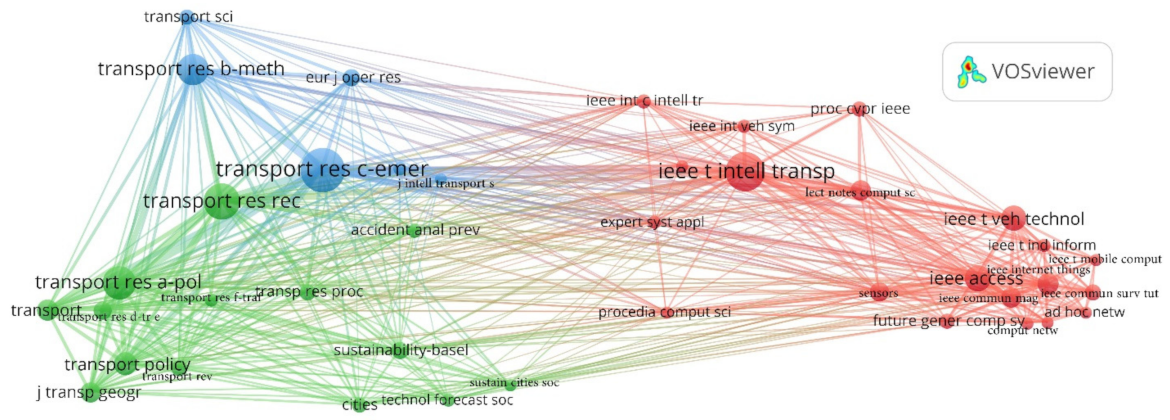
The number of publications on smart urban mobility has attracted interest from diverse fields of research across the globe, and some of the journals as depicted in Figure 5 below have become very influential in shaping discourses in this field. In Figure 5 below, those journals are clustered in three distinct categories. The Red category depicting journals focused on technology usage in transport is the most popular with 20 sources. It is followed by the green category (depicting general Transportation research) with 14 sources and the blue cluster, representing journals focused on ‘methodological and application’ of transportation, with 6 sources. The different sources, as shown in the diagram, have different linkages with each other, with those in the blue and green clusters being highly correlated compared with the red cluster. However, the different nodes in the red cluster are closely linked, which depicts how different aspects of technology use in the transportation sector are closely related to each other, such that it is not possible to discuss any one of them in isolation. In the green cluster, Transport Research Record and the Transport Research Part A Policy attracted a considerable number of research works, especially considering the size of their nodes. For the blue cluster, all of the nodes are closely linked, and despite there being few influential sources from this category, it is evident that there was substantial interest among researchers as depicted by the size of their nodes which are relatively bigger, compared with some in the green cluster.
The visual representations in Figure 3 and Figure 5 show that despite the subject of mobility gaining ground in the academic realm, there are a score of sources that have already cut a niche in the subject, and as such, have managed to publish substantial numbers of research works. Additionally, smart urban mobility, as a subject, came into the limelight more clearly after the emergence of internet use in 2010, and became even more pronounced due the increasing global attention to issues of climate change, especially after 2015, coinciding with the adoption of the Sustainable Development Goals. Considering this background, it is probable that only a few sources were interested in the topic due to its newness and a lack of expertise on the field, but with time, as more smart urban mobility technologies emerged, substantial interest in the subject matter started to gradually be drawn from other publication sources.
3.3. Influential References
During the entire period (1968–2021) covered in this study, a wide range of publications, as shown in Figure 2, have been produced across different geographical locations globally. Table 1 below highlights the key references published at different dates, and also examines different aspects of urban mobility. Out of these, the highest cited reference by Dijkstra [26] was published in 1959, far beyond the period being covered in the present study. However, in respect to those published within the timeframe in question, the paper, ‘Smart cities in Europe’ authored by Caragliu, et al. [27] is the most popular with over 4662 citations and is linked to 54 other publications. The popularity of this could be attributed to the fact that it focuses on a topic (smart city), that started gaining traction especially in Europe during this period. The second most popular reference, amongst the 20, was authored by Albino, et al. [28] in 2015 and also covered the topic of smart cities. The popularity of these articles is unsurprising as they are focused on fundamental principles that guide smart mobility, among other dimensions of smart cities.
However, besides those two articles on smart cities, it is evident that the most popular references during the period covered that addressed the theme of smart urban mobility are those that in different ways address issues related to the emerging trend of ride sharing. The popularity of this topic is not surprising as it has been established that since the end of WW2, private car ownership has been on the rise, especially in developed economies, and their rising numbers have been prompting numerous urban challenges. This phenomenon is well documented in the works of Jacobs [49] and Salingaros [50], which call for revised urban planning practices that are more responsive to human needs in cities and align with the need for more urban models hosting proximity at their core, such as the ‘15-Minute City’ model [24]. Therefore, in the course of looking for solutions, there have been proposals for reducing the numbers of private cars in urban areas, with ridesharing seen as one of the potential solutions; hence capturing the attention of researchers in the mobility dimension to render more human-centric cities.
3.4. Most Influential Authors
While the subject of mobility has been identified to have far reaching impacts, especially in regard to challenges facing urban areas such as climate change, urban traffic congestion, and urban planning approaches among others, the number of authors with interest in the subject has been growing over the years, albeit gradually. Table 2 below outlines the top 20 authors over the entire period (1968–2021) of concern for this study on the subject of smart urban mobility. It is also clear from the analysis that a majority of these authors are drawn from institutions in diverse locations However, as shown in Figure 2 above, the United States has not only produced the highest number of publications, but has also the highest number of influential authors pursuing different issues on smart urban mobility. The other country with a substantial number of authors is China. Earlier, it was mentioned that research on this topic is limited in Asia. However, China is an exception.
The inference that can be drawn from the list of influential authors listed in Table 2 and their affiliations is that universities have been in the forefront in research on matters of smart mobility compared to research institutes. It is also evident that regions such as Northern America and Asia (specifically China), which are reported to have experienced numerous urban challenges related to mobility, are leading in publications. For instance, in the U.S., as noted above, the number of private passenger cars has been rising significantly over the years, due to factors such as improved disposable income amongst its citizens, and improvement of their urban infrastructures which are more car-centric [51]. The two notable regions have also experienced substantial growth in urbanization, and this has prompted numerous challenges from the transport sector [52]; hence, the increased research as solutions for the challenges are being discoursed.
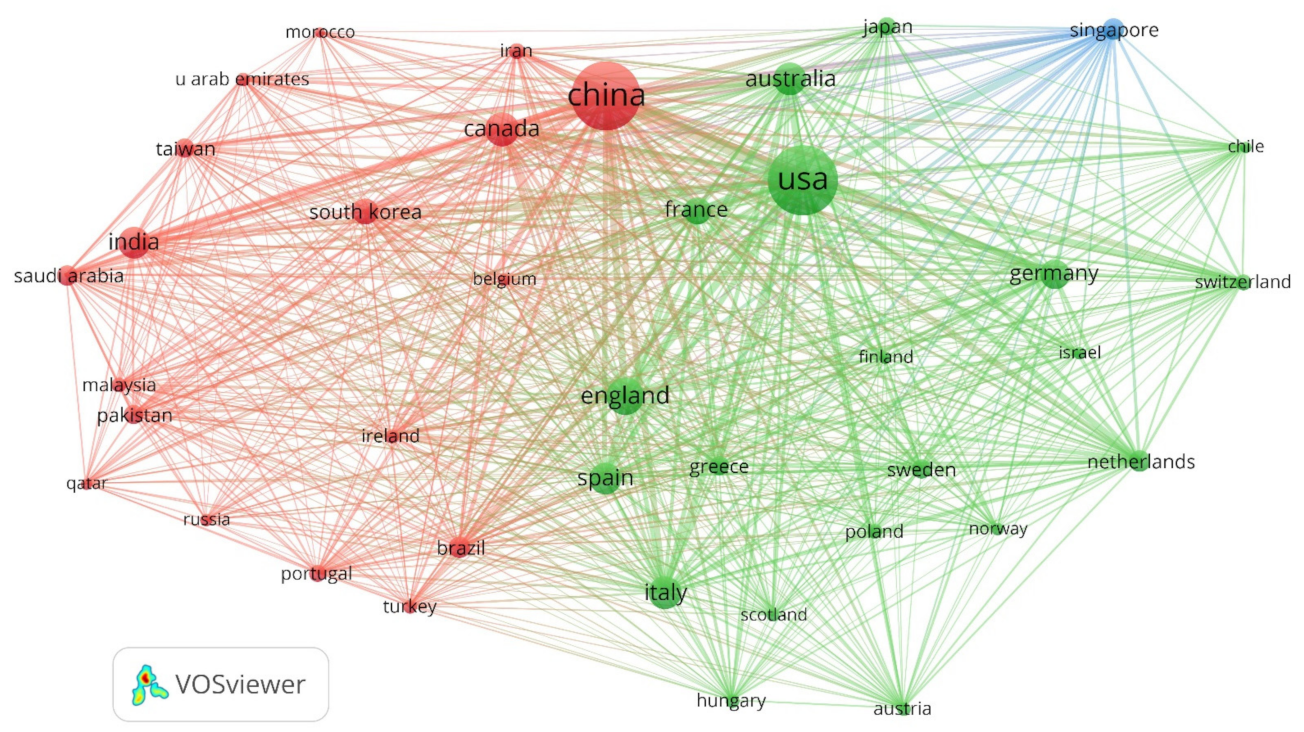
3.5. Countries with the Most Contributions
An analysis of the number of publications on the theme of Smart Urban Mobility, revealed the countries with the most contributions (illustrated in Figure 6), highlighting that China ranks first, with the United States and England coming up second and third, respectively. Other countries with high publication outputs are Italy, France, Australia, Spain, India, Canada, South Korea and Singapore. This adds weight to the notion that countries experiencing high urbanization rates, and its associated transportation challenges, are contributing more to the theme.
3.6. Overall Thematic Focus
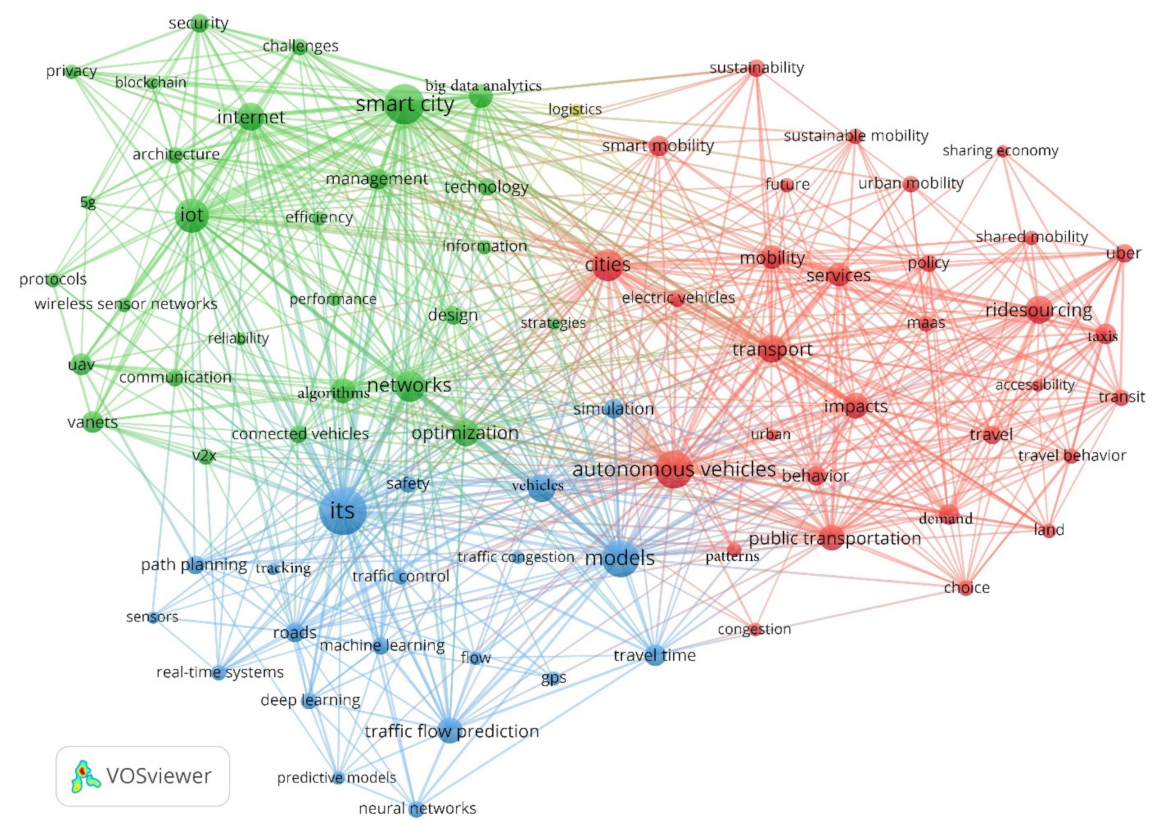
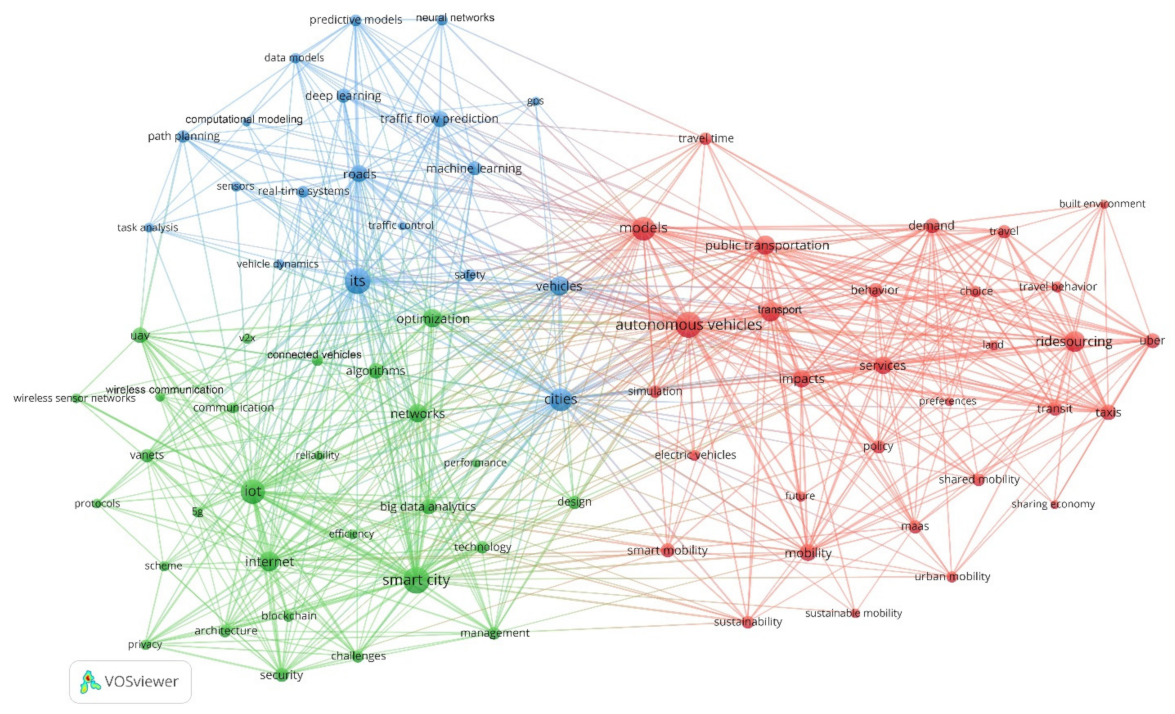
Results for the term co-occurrence analysis for the entire period (1968–2021) are captured in Figure 7 below, and are clustered into three categories. The red cluster, which also has the highest number of terms, represents research works focusing on the different aspects of transportation and mobility, with special emphasis on ride-sourcing, autonomous vehicles and cities. The green cluster focuses on different smart technologies and IoT and the methodologies and application of those technologies as enablers of smart urban mobility. The blue cluster, on the other hand, is mainly focused on the Intelligent Transportation Systems (ITS) and Models and the different way those are applied in the pursuit of smart urbanization.
From the diagram, it is evident that most terms are closely linked and cut across different clusters. In particular, terms such as Smart City, Cities, Autonomous Vehicles, Models, Networks, IoT and Internet are seen to be closely linked, highlighting how they are influencing other research works in this field. In contrast, it is clear that some terminologies such as Neural Networks, Protocols, Privacy, Land, Sharing Economy, Uber, Transit and others are still unpopular amongst researchers interested in smart urban mobility. However, as is clear from the available literature, the concept of smart mobility cannot be viewed in isolation as it is closely linked to emerging trends such as smart cities, internet use in urban areas, especially in facilitating connectivity, and also the Internet of Things, which is critical in enabling support of different smart devices such as sensors and cameras [53,54]. It is also clear the concept of smart urban mobility during the period in question is highly dominated by the use of technology, focusing on road transportation and facilitating emerging technologies such as ridesharing, traffic prediction, autonomous vehicles and others. During this period, Alonso-Mora, Samaranayake, Wallar, Frazzoli and Rus [34] note that technologies such as ridesharing have the capacity to address most urban mobility associated challenges, such as reduction in vehicular emissions, reduction in costs (both monetary and time) incurred in congestion, and provide relief to those without access to personal cars and/or those sensible to sustainability issues. On this, Dias, et al. [55], noted, unsurprisingly, that users of technologies such as ridesharing and ride-sourcing are the ‘young, well-educated, higher-income and working class demographic’. This is particularly interesting for the future of smart urban mobility as the highest number of global populations is this category, and their willingness to embrace these technologies mean that the use of smart technology in the mobility sector will continue to be embraced as this demographic is the highest consumer of emerging technologies.
3.7. Thematic Evolution
3.7.1. The First Period (1968–2010)
During the first period covering 1968 to 2010, as depicted in Figure 8 below, interest on the subject of mobility grew gradually, and increasing in pace after 2000 when the fourth industrial revolution emerged. As a result, the number of published works grew slowly, with only six categories of publications identified at the time, as shown in Figure 8. To be precise, a total of 32 key terminologies popular during this period were identified, and were distributed in the six distinct categories. The most popular cluster at the time is represented by the red cluster representing publications focusing on Intelligent Transport Systems and has nine terminologies, which are distantly linked. The green cluster focuses on issues pertaining to autonomous vehicles and associated technologies, such as, fuzzy control and telematics. The blue cluster represents terminologies touching on transportation and how these could be influenced by emerging technological options such as information technology, smart cities and internet. The fourth cluster represented by the color yellow captured research works on traffic matters, and has terminologies such as traffic control, traffic flow prediction, route guidance and others. The fifth cluster is represented by the bright blue color and represents issues of route planning. This cluster had attracted only two terminologies: navigation and path planning. Those were linked to terminologies such as autonomous vehicles from the green cluster and route guidance from the yellow cluster. The purple cluster is the last in the diagram and represents terminologies touching on infrastructures, with linked terminologies such as Models, GIS, Urban and Land.
From the analysis, it is not surprising that, though modern urban challenges such as climate change and traffic congestions were not a major issue, in the 1970s, 1980s and 1990s, researchers had started developing interest in subjects such as information technology and its possible application in promoting more efficient urban mobility. During this period, as highlighted in the previous discussion, the ratio of vehicles to global population was relatively small (compared with 2021 figures), but in some cities, especially in the U.S, some challenges such congestion were starting to arise, and local governments were asked for solutions [56]. In China, which has been identified as among the countries with highest number of publications, it is noted that during the identified period, the country was undergoing occupational mobility and demand for mobility was on the rise [57]. The country was also experiencing unprecedented population growth and urbanization and it was evident that the need for increased intelligent transportation systems was inevitable. The importation of goods was also rising, and while railways were most popular, road transport was also gaining traction. However, Speece and Kawahara [58] noted that transportation faced major bottlenecks; hence, such concerns could have attracted research works. However, as is evident in the analysis, research on mobility during this period was not primarily based on ‘smart’ technologies, but on diverse issues that were affecting urban areas that were also in their development stages. Technology, especially the internet, which was not advanced as it is today, and most supportive technologies and infrastructures for technologies such as ITS, VANETS, Smart Cities and others were non-existent or were still in their infancy.
3.7.2. The Second Period (2011–2015)
During this second period, as captured in Figure 9 below, the number of terminologies that were being researched increased significantly, proportionally to the developments in the urban areas and emerging technologies across the globe. Unlike in the first period when many issues were being researched, during this period, most research works had narrowed down to pertinent issues touching on mobility and are clustered in four categories. The Red category represents different aspects of intelligent transport systems, with terminologies such as vehicles, emissions, fuel consumption, urban mobility, smart city, mobility and others. In particular, it is evident that interest in subjects such as VANETS, Smart City, Mobility and Vehicles had increased following what could be argued as the maturation of technologies such ITS and autonomous vehicles. The green cluster with a considerable number (approximately 17) of terminologies denotes technology applications in different traffic scenarios. New terminologies for this cluster that were absent in the first period include Safety, Volume, Travel time, Intelligent Vehicles and Performance. The third cluster is represented by color blue and denotes methodologies used in the application of technology in the transport sector. This cluster has only eight terminologies that are closely linked to both the transportation and technology cluster. The last cluster is represented by yellow and has four terminologies denoting the application of technology in automobiles.
From the literature, it is not surprising that during this period, much research and publication attention on mobility was focused on the application of diverse technologies in the mobility sector, more so on ITS, models and autonomous vehicles. Globally, during this period, much attention was focused on the increasing impacts of climate change, how different aspects of urban design were contributing to its escalation, and how emerging technologies would contribute to the search of lasting solutions. Indeed, the global focus was on formulating a conventional policy framework that would help mitigate the impacts of climate change, fostering sustainable urban growth without compromising economic growth [59,60]. The transport sector during this period was experiencing significant growth, with road transport continuing to become very popular. For instance, the number of vehicles (both passenger and commercial) had increased from approximately 1.09 billion registered in 2011 to approximately 1.28 billion vehicles in 2015, with a majority of these being passenger cars [21]. Of the passenger cars, some were electric cars which had started to emerge in different global urban areas [61]. This explains how some terminologies such as Autonomous vehicles, Smart parking, UAV, Performance, Fuel consumption, VANETS and others had started to gain significant popularity amongst researchers. However, as depicted in the analysis, terminologies focused on smart mobility were still emerging and most of them were barely linked to each other. It is, however, evident that intelligent transport systems and associated technologies had become part of urban mobility planning, probably due to the global attention on emissions reduction, as well as to cater for the increasing urban demand for mobility options.
3.7.3. The Third Period (2016–2019)
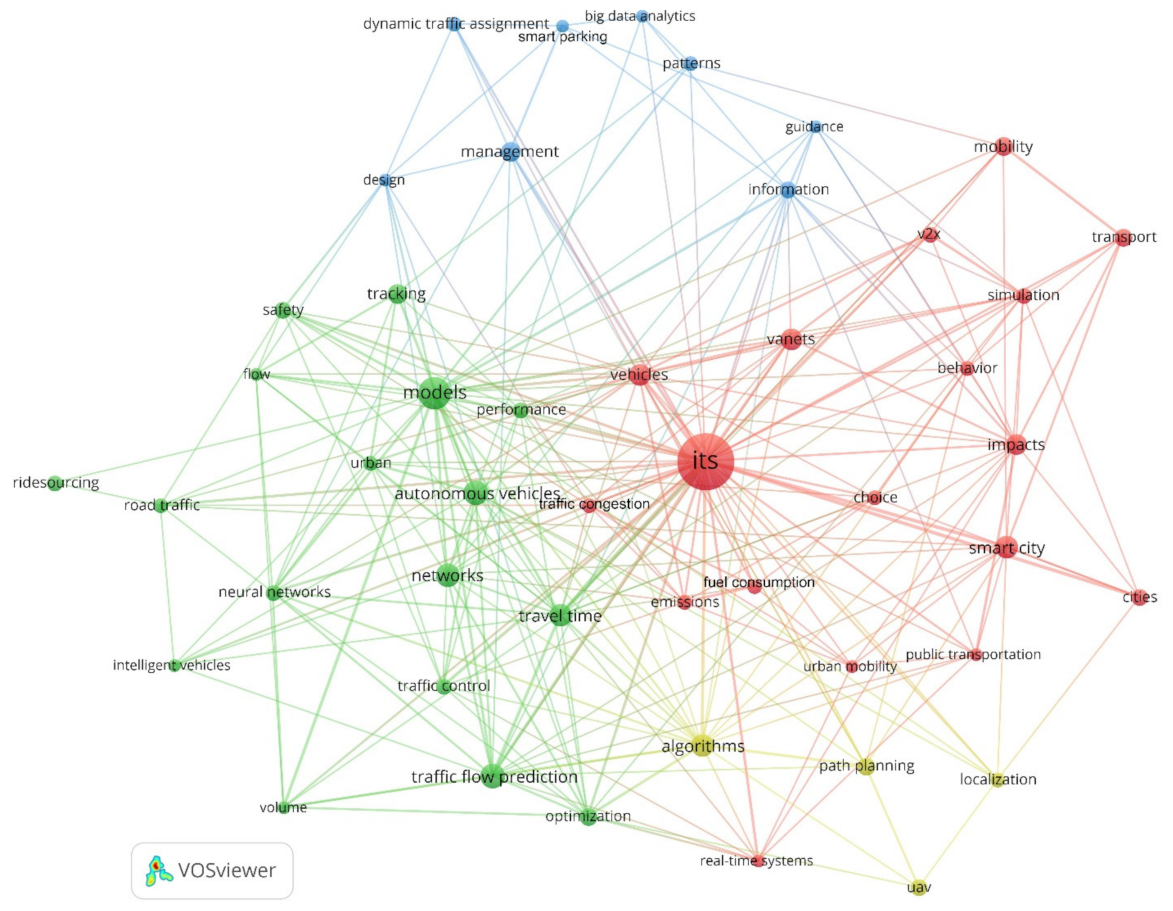
During this period (2016–2019), as depicted in Figure 10 below, the number of research terminologies increased significantly, and became closely linked. Unlike in the previous period, the terminologies were clustered in three distinct categories depicted in red, blue and green. The red cluster encompasses terminologies focused on automobiles, specifically vehicles, and it is observable that new terms such as Future, Sustainable mobility, Patterns and Travel behaviors emerged in mobility research works during this period. The green cluster, which represents technology and its applications with the term Intelligent Transport Systems (ITS), is still the most popular in most of the research work. In addition, during this period, it is evident that the concept of Smart City also attracted substantial research attention and it is highly linked to other research terminologies, especially those related to issues of automobiles. New terminologies showcasing the increase in publications on this subject in respect to technology include Architecture, Management, Wireless Sensor Networks, Machine learning and Frameworks. The third cluster is denoted by blue and it represents terminologies focused on different methodologies and technical application of technologies in the mobility sector.
From the literature, this period is characterized by a significant growth in technology use in different parts of the globe, especially in urban planning. The increased activities in urban areas focusing more on sustainability agendas that may be credited for prompting an increase in research work were stimulated by impacts of the different global agreements that came into force from 2015. These include the Sustainable Development Goals (SDGs) [62], the Paris Agreement [63], The New Urban Agenda [64], and the Glasgow Climate Pact [65]. Besides global accords, research in the field of mobility was also catalyzed by the increasing use of smart technologies such as wireless sensors, and other IoT devices in urban areas in sectors such as transport. In addition, as noted by Grelier [66], the number of automobiles in urban areas was increasing exponentially, prompting an unprecedented increase in emissions and placing sustained pressure on the transport sector. For instance, it is noted that in the European region, road transportation was responsible for over 72% of all emissions reported in the transport sector [67]; hence, prompting calls for alternative transport modes with reduced emissions, as envisioned in the Paris Agreement. Therefore, the widespread popularity of technologies such as ridesharing, autonomous vehicles and electric vehicles were not a surprise. For car manufacturers, producing cars that promoted the sustainability agenda was becoming a norm, especially with emerging advanced technologies that could facilitate the deployment of such products like autonomous vehicles on main public roads. Further, the large-scale attention on smart cities meant that there would be increased attention on IoT usage in transforming the urban infrastructure [68]. This had significant impacts on trends such as ridesharing and carpooling, with an increase in startups such as Uber, Lyft and others taking center stage in making these trends work, especially with the proliferation of mobile Apps, and increased internet connectivity and internet speed in most major cities across the globe.
3.7.4. The Fourth Period (2020–2021)
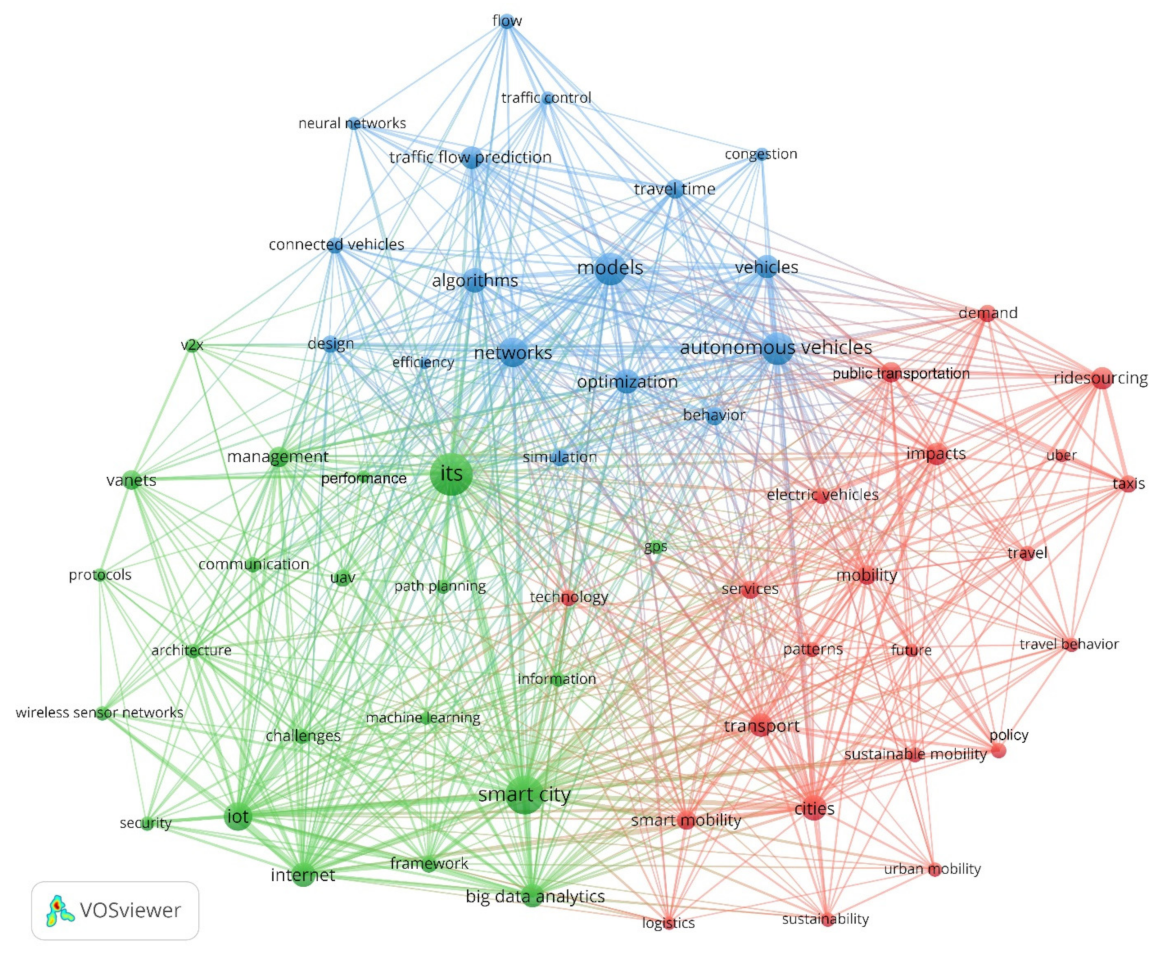
The period 2020–2021, as illustrated in Figure 11 below, also had substantial research and publishing activities on Smart Urban Mobility. This is clearly demonstrated by the increased number of terminologies pursued in different published works. These have been clustered into three categories depicted in green, blue and red depending on subject matter. On this, the green cluster encompasses all terminologies focusing on applications of different technology, while the blue cluster encompasses terminologies focusing on ‘smartness’ in urban areas, including mobility. The red cluster, on the other hand, represents all terminologies touching on the aspect of Smart Urban Mobility, in which terms such as Autonomous vehicles and Models are seen to have gained substantial attention. Terms such as Public Transportation, Transportation, Impacts, Mobility and Services have gained traction, especially in relation to Autonomous vehicles terminology. As in the previous period ending in 2019, most of the terminologies are seen to be closely linked which indicates the cross-cutting nature of most of the issues that have drawn the interest of researchers during this period.
From a wide scope of literature, this period was somehow unique and challenging for most researchers due to the impacts of COVID-19, not only in regard to human health but also on different economic activities [69,70]. The transportation sector experienced unprecedented challenges with grounding or significant scaling down of operation [71,72,73]. However, the period presented unique opportunities for researchers to draw parallels on the impacts of transport on different urban challenges, including congestion, climate change, planning and economic growth among others. On this, it was evident that with reduced activities in the transport sector, there were reduced emissions [74]; hence affirming the need for transformation of mobility to embrace sustainable approaches, especially in urban areas post-pandemic. The aspect of ‘smartness’ played a critical role in helping urban residents, especially in areas such as purchasing of groceries; and this can be confirmed by the increase in the number of terminologies related to technology application in cities. It is also evident that during this period, the aspect of ‘smartness’ in urban mobility decoupled from other issues that researchers were working on. This could be attributed to reduced activities in the sector, and it affirms that it is possible to shift the attention from car reliance to embrace human-oriented dimensions in urban areas as is proposed in the 15-minure city planning model [75]. However, there are also fears that social distancing triggered an overemphasis on the use of private cars as people avoided the use of public mobility options, including emerging ones such as ridesharing [70]. However, as expressed by Gil-García, García-Cascales, Dagher and Molina-García [22], restricted movement also prompted people to cycle, with others opting to walk, as most of their activities were within their neighborhoods. This foreshadows that in the foreseeable future, even with the pandemic, the aspect of smart urban mobility will still elicit some interest, particularly in micro mobility discourses. However, there are possibilities that the attention will extend to bicycles, as these provide people with the ability to abide by health protocols, pursue sustainable pathways, as well as avoid the use of private cars. This will further be influenced by the rethinking of urban planning models such as the aforementioned 15-min city concept [23,25,72].
4. Discussion and Conclusions
The analysis covered over five decades of research on the theme of smart urban mobility, establishing that research works have been growing exponentially with the changing urban realm. On this, it is expected that in both the near and distant future, research on smart urban mobility will continue to witness increasing interest, especially in view of the current dynamics in the transportation sector globally. For instance, in the analysis above, it was noted that most of the published works on the theme originated from regions dominated by developed economies such as North America. Such trends are correlated to the fact that these regions are far more developed in diverse urban areas, and have an increased number of different transportation modes; hence, these regions are already experiencing urban challenges associated with transport sectors. However, current reports from bodies such as UN-Habitat [76] and others highlight that in the coming years, most of the global population will be living in urban areas. For instance, it is projected that by 2030, following unprecedented rapid urbanization, over 68% of the global population will be living in urban areas [77]. Regions such as the African continent that had little contribution in the current research work on smart urban mobility are expected to have over 50% of the population residing in urban areas [76]; hence, they will also be experiencing urban challenges like other regions and this might prompt an increased research interest.
From the analysis, it has been established that a majority of research works emanating from different regions have been on various aspects of IT, and their applicability in the urban transportation realm. This is unsurprising in view of how IT has emerged as a field harboring some of the most novel urban solutions, including the Smart City planning principles that are being pursued to address endemic urban challenges such as traffic congestion, increased resource consumption, energy demand, sustainability concerns and climate change among others [54]. This has been possible particularly due to emergence and growth of different data mining technologies, which when coupled with different IoT devices and networks have been hailed as a potential way to provide new means of redefining cities [78,79]. In particular, these technologies are expected to feed into the concepts of Intelligent Transport Systems (ITS), Intelligent Traffic Management Systems and others, which as shown in the analysis, have attracted substantial interest from researchers. Going forward, especially post-pandemic, the increased use of different technologies in enhancing smart mobility will gain even further attention, as the pandemic has already prompted concepts such as social distancing, virtual communication, work-from-home that have not previously been part of urban lifestyles [80,81].
In addition to the role of technology in shaping future research, the increasing climate challenges, and the subsequent increased global attention as highlighted during the COP 26 summit are expected to shape future research on different areas including smart urban mobility. This will prompt changes in the entire transportation value chain from the manufacturing of vehicles and their accessories such as batteries to charging systems for electric vehicles and their use in the urban areas. As part of this trend, it is expected that there will be an increase in the production of autonomous vehicles (generating over $42 billion in revenue by 2030 [82]), which will not only increase human safety, which is of great concern in urban areas, but also help in accelerating the transition to electric vehicles and hybrid vehicles. In regard to battery technologies, it is expected that there will be increased attention on areas such as battery swapping and wireless charging systems to increase the attractiveness of EVs. The attention of researchers in this field will be further drawn to the increased number of tech companies such as Tesla, NIO, Ample and others that are expected to participate in the growth of EV vehicles. For instance, by September 2021, NIO Company had installed over 504 battery swap stations, which have allowed for over four million battery swaps [83].
The increased attention on phasing out combustion engines in automobiles and switching to EV and hybrid vehicles also emphasizes urban planning principles to shift from car-oriented to human-scale oriented cities. However, it must be noted that it not possible, especially in the near future, to completely phase out the use of automobiles in urban areas [84]. Another argument is that no-mobility scenarios may be more sustainable, and hence be the ‘smarter’ solution, but are rarely suitable for access to healthcare, education, and other urban services, which will always require some mobility, even if e-governance structures are established. This is why proximity-based concepts such as the ’15-Minute City’ are booming, by reducing the need for transport through the restructuring of urban typologies, particularly for reducing car dependency. While this may be the case in many European Cities, the concept is yet to gain more ground globally, but the narrative for reducing car-dependency is critical in order to achieve safer, more resilient, sustainable and inclusive cities, as per the goals of the Sustainable Development Goal 11 and the New Urban Agenda, and leads to the creation of more human-scale cities with higher vibrancy and quality of life. The quest, therefore, is to ensure that available transportation modes within the human-friendly cities adhere to the principles of sustainability and ‘smartness’, and warrants more efficiency for intra-city travels and high speed city-to-city models, as in the case of the hyperloop [85] and the Maglev trains [86].
In the end, it should be mentioned that despite covering different issues related to the structure and trends of smart mobility, this study has only considered literature indexed in the Web of Science. We suggest that an analysis of the grey literature is also needed to ensure a better coverage of the structure and trends of this field. This should be prioritized in the future research.
Author Contributions
Conceptualization, Z.A. and A.S.; methodology, software, validation, A.S.; writing—original draft preparation, Z.A. and A.S.; writing—review and editing, Z.A. and A.S. All authors have read and agreed to the published version of the manuscript.
Funding
This research received no external funding.
Institutional Review Board Statement
Not applicable.
Informed Consent Statement
Not applicable.
Data Availability Statement
Not applicable.
Conflicts of Interest
The authors declare no conflict of interest.
Appendix A
((((“smart” OR “intelligent” OR “digital” OR “digitali*ation” OR “digital technolog*” OR “Information and communication technolog*” OR “ict” OR “information technolog*” OR “internet of things” OR “iot” OR “artificial intelligence” or “AI” or “machine learning” OR “blockchain” OR “virtual reality” OR “VR” OR “augmented reality” OR “AR” OR “cloud computing” OR “big data” OR “5G” OR “6G” OR “industry 4*” OR “society 5*” OR “robotic*” OR “automation” OR “automated”) NEAR/5 (“mobility” OR “transportation” OR “transport”)) OR (“unmanned aerial vehicle*” OR “UAV*” OR “vehicle-to-vehicle communication” OR “Mobility as a service” OR “MaaS” OR “Vehicle-to-everything” OR “Vehicle to everything” OR “v2x” OR “Vehicle-to-Pedestrian” OR “Vehicle to Pedestrian” OR “v2p” OR “self-driving cars” OR “self driving cars” OR “autonomous vehicles” OR “intelligent roads” OR “connected vehicles” OR “smart intersection*” OR “smart road*” OR “smart highway*” Or “smart street*” OR “smart parking” OR “Transportation Network Companies” OR “ridesharing” OR “ride-sharing” OR “parataxis” OR “ride-hailing” OR “ridehailing” OR “on-demand rides” OR “Ridesourcing” OR “ride-sourcing”)) AND (“city” OR “cities” OR “urban”)).
References
- Newman, P.; Beatley, T.; Boyer, H. Resilient Cities: Overcoming Fossil Fuel Dependence, 2nd ed.; Island Press: Washington, DC, USA, 2017. [Google Scholar]
- Jarah, S.H.A.; Zhou, B.; Abdullah, R.J.; Lu, Y.; Yu, W. Urbanization and Urban Sprawl Issues in City Structure: A Case of the Sulaymaniah Iraqi Kurdistan Region. Sustainability 2019, 11, 485. [Google Scholar] [CrossRef] [Green Version]
- Duany, A.; Plater-Zyberk, E.; Speck, J. Suburban Nation: The Rise of Sprawl and the Decline of the American; Dream North Point: New York, NY, USA, 2000. [Google Scholar]
- Melosi, M.V. The Automobile Shapes the City. Available online: http://www.autolife.umd.umich.edu/Environment/E_Casestudy/E_casestudy5.htm (accessed on 4 December 2020).
- Moss, D. The True Cost of Congestion. Available online: https://internationalfleetworld.com/the-true-cost-of-congestion/ (accessed on 10 December 2021).
- International Monetary Fund. Projected GDP Ranking. Available online: https://statisticstimes.com/economy/projected-world-gdp-ranking.php (accessed on 10 December 2021).
- UN Environment Programme. Transport. Available online: https://www.unep.org/explore-topics/energy/what-we-do/transport (accessed on 10 December 2021).
- Anderson, E. Electric Vehicle Market Size 2021-2026: Share, Trends, Industry Analysis, Top Companies, and Outlook. Available online: https://www.einnews.com/pr_news/549338817/electric-vehicle-market-size-2021-2026-share-trends-industry-analysis-top-companies-and-outlook (accessed on 4 September 2021).
- Kopestinsky, A. Electric Car Statisticsin the US and Abroad. Available online: https://policyadvice.net/insurance/insights/electric-car-statistics/#:~:text=Well%2C%20the%20latest%20figures%20show,3.4%20million%20to%205.6%20million (accessed on 10 December 2021).
- Kaneda, T.; Greenbaum, C.; Kline, K. 2020 World Population Data Sheet; Population Reference Bureau (PRB): Washington, DC, USA, 2020; p. 22. [Google Scholar]
- Ningrum, T. Smart City: The main assist factor for smart cities. Int. J. Innov. Enterp. Syst. 2021, 5, 46–54. [Google Scholar] [CrossRef]
- Faria, R.; Brito, L.; Baras, K.; Silva, J. Smart mobility: A survey. In Proceedings of the 2017 International Conference on Internet of Things for the Global Community (IoTGC), Funchal, Portugal, 10–13 July 2017; pp. 1–8. [Google Scholar]
- Porru, S.; Misso, F.E.; Pani, F.E.; Repetto, C. Smart mobility and public transport: Opportunities and challenges in rural and urban areas. J. Traffic Transp. Eng. 2020, 7, 88–97. [Google Scholar] [CrossRef]
- Guislain, P.; Dasgupta, A. Who Needs Cars? Smart Mobility Can Make Cities Sustainable. Available online: https://blogs.worldbank.org/transport/who-needs-cars-smart-mobility-can-make-cities-sustainable (accessed on 10 December 2021).
- Leal Filho, W.; Will, M.; Shiel, C.; Paço, A.; Farinha, C.S.; Orlovic Lovren, V.; Avila, L.V.; Platje, J.; Sharifi, A.; Vasconcelos, C.R.P.; et al. Towards a common future: Revising the evolution of university-based sustainability research literature. Int. J. Sustain. Dev. World Ecol. 2021, 28, 503–517. [Google Scholar] [CrossRef]
- Leal Filho, W.; Sima, M.; Sharifi, A.; Luetz, J.M.; Salvia, A.L.; Mifsud, M.; Olooto, F.M.; Djekic, I.; Anholon, R.; Rampasso, I.; et al. Handling climate change education at universities: An overview. Environ. Sci. Eur. 2021, 33, 109. [Google Scholar] [CrossRef]
- Van Eck, N.J.; Waltman, L. VOSviewer manual. Leiden Univeristeit Leiden 2022, 1, 1–53. [Google Scholar]
- Bureau of Transportation Statistics. World Motor Vehicle Production, Selected Countries. Available online: https://www.bts.gov/archive/publications/national_transportation_statistics/table_01_23 (accessed on 10 December 2021).
- Petit, S. World Vehicle Population Rose 4.6% in 2016. Available online: https://wardsintelligence.informa.com/WI058630/World-Vehicle-Population-Rose-46-in-2016 (accessed on 10 December 2021).
- World Meter. World Population by Year. Available online: https://www.worldometers.info/world-population/world-population-by-year/ (accessed on 10 December 2021).
- Carlier, M. Number of Vehicles in Use Worldwide 2006–2015. Available online: https://0-www-statista-com.brum.beds.ac.uk/statistics/281134/number-of-vehicles-in-use-worldwide/#:~:text=In%202015%2C%20around%20947%20million,vehicles%20were%20in%20operation%20worldwide (accessed on 10 December 2021).
- Gil-García, I.C.; García-Cascales, M.S.; Dagher, H.; Molina-García, A. Electric Vehicle and Renewable Energy Sources: Motor Fusion in the Energy Transition from a Multi-Indicator Perspective. Sustainability 2021, 13, 3430. [Google Scholar] [CrossRef]
- Allam, Z.; Moreno, C.; Chabaud, D.; Pratlong, F. Proximity-Based Planning and the “15-Minute City”: A Sustainable Model for the City of the Future. In The Palgrave Handbook of Global Sustainability; Springer International Publishing: Cham, Switzerland, 2020; pp. 1–20. [Google Scholar] [CrossRef]
- Allam, Z.; Bibri, S.E.; Jones, D.S.; Chabaud, D.; Moreno, C. Unpacking the “15-Minute City” via 6G, IoT, and Digital Twins: Towards a New Narrative for Increasing Urban Efficiency, Resilience, and Sustainability. Sensors 2022, 22, 1369. [Google Scholar] [CrossRef]
- Allam, Z.; Nieuwenhuijsen, M.; Chabaud, D.; Moreno, C. The 15-minute city offers a new framework for sustainability, liveability, and health. Lancet Planet. Health 2022, 6, e181–e183. [Google Scholar] [CrossRef]
- Dijkstra, E.W. A note on two problems in connexion with graphs. Numer. Math. 1959, 1, 269–271. [Google Scholar] [CrossRef] [Green Version]
- Caragliu, A.; Del Bo, C.; Nijkamp, P. Smart Cities in Europe. J. Urban Technol. 2011, 18, 65–82. [Google Scholar] [CrossRef]
- Albino, V.; Berardi, U.; Dangelico, R.M. Smart Cities: Definitions, Dimensions, Performance, and Initiatives. J. Urban Technol. 2015, 22, 3–21. [Google Scholar] [CrossRef]
- Rayle, L.; Dai, D.; Chan, N.; Cervero, R.; Shaheen, S. Just a better taxi? A survey-based comparison of taxis, transit, and ridesourcing services in San Francisco. Transport Policy 2016, 45, 168–178. [Google Scholar] [CrossRef] [Green Version]
- Fagnant, D.J.; Kockelman, K. Preparing a nation for autonomous vehicles: Opportunities, barriers and policy recommendations. Transp. Res. Part A Policy Pract. 2015, 77, 167–181. [Google Scholar] [CrossRef]
- Fagnant, D.J.; Kockelman, K.M. The travel and environmental implications of shared autonomous vehicles, using agent-based model scenarios. Transp. Res. Part C: Emerg. Technol. 2014, 40, 1–13. [Google Scholar] [CrossRef]
- Clewlow, R.R.; Mishra, G.S. Disruptive Transportation: The Adoption, Utilization, and Impacts of Ride-Hailing in the United States; Institute of Transportation Studies: Davis, CA, USA, 2017. [Google Scholar]
- Krueger, R.; Rashidi, T.H.; Rose, J.M. Preferences for shared autonomous vehicles. Transp. Res. Part C: Emerg. Technol. 2016, 69, 343–355. [Google Scholar] [CrossRef]
- Alonso-Mora, J.; Samaranayake, S.; Wallar, A.; Frazzoli, E.; Rus, D. On-demand high-capacity ride-sharing via dynamic trip-vehicle assignment. Comput. Sci. 2017, 114, 462–467. [Google Scholar] [CrossRef] [Green Version]
- Agatz, N.; Erera, A.; Savelsbergh, M.; Wang, X. Optimization for dynamic ride-sharing: A review. Eur. J. Oper. Res. 2012, 223, 295–303. [Google Scholar] [CrossRef]
- Lv, Y.; Duan, Y.; Kang, W.; Li, Z.; Wang, F.-Y. Traffic flow prediction with big data: A deep learning approach. IEEE Trans. Intell. Transp. Syst. 2014, 16, 865–873. [Google Scholar] [CrossRef]
- Zanella, A.; Bui, N.; Castellani, A.; Vangelista, L.; Zorzi, M. Internet of things for smart cities. IEEE Internet Things J. 2014, 1, 22–32. [Google Scholar] [CrossRef]
- Furuhata, M.; Dessouky, M.; Ordóñez, F.; Brunet, M.-E.; Wang, X.; Koenig, S. Ridesharing: The state-of-the-art and future directions. Transp. Res. Part B Methodol. 2013, 57, 28–46. [Google Scholar] [CrossRef]
- Zhang, W.; Guhathakurta, S.; Fang, J.; Zhang, G. Exploring the impact of shared autonomous vehicles on urban parking demand: An agent-based simulation approach. Sustain. Cities Soc. 2015, 19, 34–45. [Google Scholar] [CrossRef]
- Santi, P.; Resta, G.; Szell, M.; Sobolevsky, S.; Strogatz, S.; Ratti, C. Taxi pooling in New York City: A network-based approach to social sharing problems. arXiv 2013, arXiv:1310.2963. [Google Scholar]
- Hall, J.D.; Palsson, C.; Price, J. Is Uber a substitute or complement for public transit? J. Urban Econ. 2018, 108, 36–50. [Google Scholar] [CrossRef] [Green Version]
- Milakis, D.; Van Arem, B.; Van Wee, B. Policy and society related implications of automated driving: A review of literature and directions for future research. J. Intell. Transp. Syst. 2017, 21, 324–348. [Google Scholar] [CrossRef]
- Henao, A.; Marshall, W.E. The impact of ride-hailing on vehicle miles traveled. Transportation 2019, 46, 2173–2194. [Google Scholar] [CrossRef]
- Fagnant, D.J.; Kockelman, K.M. Dynamic ride-sharing and fleet sizing for a system of shared autonomous vehicles in Austin, Texas. Transportation 2018, 45, 143–158. [Google Scholar] [CrossRef]
- Alemi, F.; Circella, G.; Handy, S.; Mokhtarian, P. What influences travelers to use Uber? Exploring the factors affecting the adoption of on-demand ride services in California. Travel Behav. Soc. 2018, 13, 88–104. [Google Scholar] [CrossRef]
- Haboucha, C.J.; Ishaq, R.; Shiftan, Y. User preferences regarding autonomous vehicles. Transp. Res. Part C Emerg. Technol. 2017, 78, 37–49. [Google Scholar] [CrossRef]
- Wadud, Z.; MacKenzie, D.; Leiby, P. Help or hindrance? The travel, energy and carbon impacts of highly automated vehicles. Transp. Res. Part A Policy Pract. 2016, 86, 1–18. [Google Scholar] [CrossRef] [Green Version]
- Bösch, P.M.; Becker, A.; Becker, H.; Axhausen, K.W. Cost-based analysis of autonomous vehicle services. In ETH IVV Seminar; IVT, ETH Zurich: Zurich, Switzerland, 2017. [Google Scholar]
- Jacobs, J. The Death and Life of Great American Cities; Random House: New York, NY, USA, 1961. [Google Scholar]
- Salingaros, N.A. A New Theory of Architecture; Sustasis Press: Portland, OR, USA, 2013. [Google Scholar]
- De Janosi, P.E. Factors Influencing the Demand for New Automobiles. J. Mark. 1959, 23, 412–418. [Google Scholar] [CrossRef]
- Wang, L.; Xue, X.; Zhao, Z.; Wang, Z. The Impacts of Transportation Infrastructure on Sustainable Development: Emerging Trends and Challenges. Int. J. Environ. Res. Public Health 2018, 15, 1172. [Google Scholar] [CrossRef] [Green Version]
- Allam, Z. Big Data, Artificial Intelligence and the Rise of Autonomous Smart Cities. In The Rise of Autonomous Smart Cities: Technology, Economic Performance and Climate Resilience; Springer International Publishing: Cham, Switzerland, 2021; pp. 7–30. [Google Scholar] [CrossRef]
- Sharifi, A.; Allam, Z.; Feizizadeh, B.; Ghamari, H. Three Decades of Research on Smart Cities: Mapping Knowledge Structure and Trends. Sustainability 2021, 13, 7140. [Google Scholar] [CrossRef]
- Dias, F.F.; Lavieri, P.S.; Garikapati, V.M.; Astroza, S.; Pendyala, R.M.; Bhat, C.R. A behavioral choice model of the use of car-sharing and ride-sourcing services. Transportation 2017, 44, 1307–1323. [Google Scholar] [CrossRef]
- Laetz, T.J. Predictions and perceptions: Defining the traffic congestion problem. Technol. Forecast. Soc. Chang. 1990, 38, 287–292. [Google Scholar] [CrossRef]
- Meng, X. Labor Market Outcomes and Reforms in China. J. Econ. Perspect. 2012, 26, 75–101. [Google Scholar] [CrossRef] [Green Version]
- Speece, M.W.; Kawahara, Y. Transportation in China in the 1990s. Int. J. Phys. Distrib. Logist. Manag. 1995, 25, 53–71. [Google Scholar] [CrossRef]
- Allam, Z.; Jones, D.; Thondoo, M. (Eds.) Climate Change Mitigation and Urban Liveability. In Cities and Climate Change: Climate Policy, Economic Resilience and Urban Sustainability; Springer International Publishing: Cham, Switzerland, 2020; pp. 55–81. [Google Scholar] [CrossRef]
- Allam, Z.; Jones, D.; Thondoo, M. Cities and Climate Change: Climate Policy, Economic Resilience and Urban Sustainability; Springer International Publishing: Cham, Switzerland, 2020. [Google Scholar]
- Soltani-Sobh, A.; Heaslip, K.; Stevanovic, A.; Bosworth, R.; Radivojevic, D. Analysis of the Electric Vehicles Adoption over the United States. Transp. Res. Procedia 2017, 22, 203–212. [Google Scholar] [CrossRef]
- United Nations Development Programme (UNDP). Sustainable Development Goals; UNDP: Geneva, Switzerland, 2015; p. 24. [Google Scholar]
- United Nations Framework Convention on Climate Change. Paris Agreement. Available online: https://unfccc.int/sites/default/files/english_paris_agreement.pdf (accessed on 8 August 2021).
- United Nations. New Urban Agenda; Habitat III: Quito, Ecuador, 17–20 October 2017; pp. 1–66. [Google Scholar]
- United Nations Framework Conventon on Climate Change. Glasgow Climate Pact; UNFCCC: Glasgow, UK, 2021. [Google Scholar]
- Grelier, F. CO2 Emissions from Cars: The Facts; Transport & Environment: Brussels, Belgium, 2018; p. 53. [Google Scholar]
- European Parliament. CO2 Emissions from Cars: Facts and Figures (Infographics). Available online: https://www.europarl.europa.eu/news/en/headlines/society/20190313STO31218/co2-emissions-from-cars-facts-and-figures-infographics (accessed on 11 December 2021).
- Allam, Z.; Jones, D.S. Future (post-COVID) digital, smart and sustainable cities in the wake of 6G: Digital twins, immersive realities and new urban economies. Land Use Policy 2021, 101, 105201. [Google Scholar] [CrossRef]
- Allam, Z.; Jones, D.S. Pandemic stricken cities on lockdown. Where are our planning and design professionals [now, then and into the future]? Land Use Policy 2020, 97, 104805. [Google Scholar] [CrossRef]
- Allam, Z. Surveying the COVID-19 Pandemic and Its Implications: Urban Health, Data Technology and Political Economy; Elsevier Science: Amsterdam, The Netherlands, 2020. [Google Scholar]
- Allam, Z. Chapter 1—The First 50 days of COVID-19: A Detailed Chronological Timeline and Extensive Review of Literature Documenting the Pandemic. In Surveying the COVID-19 Pandemic and Its Implications; Allam, Z., Ed.; Elsevier: Amsterdam, The Netherlands, 2020; pp. 1–7. [Google Scholar] [CrossRef]
- Allam, Z. Chapter 2—The Second 50 days: A Detailed Chronological Timeline and Extensive Review of Literature Documenting the COVID-19 Pandemic From Day 50 to Day 100. In Surveying the COVID-19 Pandemic and Its Implications; Allam, Z., Ed.; Elsevier: Amsterdam, The Netherlands, 2020; pp. 9–39. [Google Scholar] [CrossRef]
- Allam, Z. Chapter 3—The Third 50 Days: A Detailed Chronological Timeline and Extensive Review of Literature Documenting the COVID-19 Pandemic From Day 100 to Day 150. In Surveying the COVID-19 Pandemic and Its Implications; Allam, Z., Ed.; Elsevier: Amsterdam, The Netherlands, 2020; pp. 41–69. [Google Scholar] [CrossRef]
- Allam, Z. Chapter 7—Vital COVID-19 Economic Stimulus Packages Pose a Challenge for Long-Term Environmental Sustainability. In Surveying the COVID-19 Pandemic and Its Implications; Allam, Z., Ed.; Elsevier: Amsterdam, The Netherlands, 2020; pp. 97–105. [Google Scholar] [CrossRef]
- Moreno, C.; Allam, Z.; Chabaud, D.; Gall, C.; Pratlong, F. Introducing the “15-Minute City”: Sustainability, Resilience and Place Identity in Future Post-Pandemic Cities. Smart Cities 2021, 4, 93–111. [Google Scholar] [CrossRef]
- Guarneri, M.; Ramalho, T.; Straus, F.; Maitumbi, I.; Chiramba, T.; Ngomsi, C.; Muriithi, M. UN-Habitat Sub-Saharan Africa Atlas; UN-Habitat: Nairobi, Kenya, 2020; p. 53. [Google Scholar]
- Turok, I.; McGranahan, G. Urbanization and economic growth: The arguments and evidence for Africa and Asia. Environ. Urban. 2013, 25, 465–482. [Google Scholar] [CrossRef]
- Allam, Z. Data as the New Driving Gears of Urbanization. In Cities and the Digital Revolution: Aligning Technology and Humanity; Allam, Z., Ed.; Springer International Publishing: Cham, Switzerland, 2020; pp. 1–29. [Google Scholar] [CrossRef]
- Allam, Z. On Culture, Technology and Global Cities. In Cities and the Digital Revolution: Aligning Technology and Humanity; Allam, Z., Ed.; Springer International Publishing: Cham, Switzerland, 2020; pp. 107–124. [Google Scholar] [CrossRef]
- Allam, Z.; Jones, D.; Biyik, C.; Allam, Z.; Raisah Takun, Y. Rewriting city narratives and spirit: Post-pandemic urban recovery mechanisms in the shadow of the global ‘black lives matter’ movement. Res. Glob. 2021, 3, 100064. [Google Scholar] [CrossRef]
- Allam, Z.; Sharifi, A.; Giurco, D.; Sharpe, S.A. On the Theoretical Conceptualisations, Knowledge Structures and Trends of Green New Deals. Sustainability 2021, 13, 2529. [Google Scholar] [CrossRef]
- Carlier, M. Autonomous Driving Level 4—Projected Revenue by Major Market 2030. Available online: https://0-www-statista-com.brum.beds.ac.uk/statistics/472316/projected-autonomous-driving-revenue-by-major-market/#:~:text=Autonomous%20driving%20level%204%20%2D%20projected%20revenue%20by%20major%20market%202030&text=Level%204%20autonomous%20vehicle%20sales,scale%20market%20commercialization%20by%202022 (accessed on 11 December 2021).
- Kane, M. China: NIO Report 4 Millionth EV Battery Swap. Available online: https://insideevs.com/news/537644/nio-4-million-battery-swaps/ (accessed on 11 December 2021).
- Moss, S. End of Car Age: How Cities Are Outgrowing the Automobile. Available online: https://www.theguardian.com/cities/2015/apr/28/end-of-the-car-age-how-cities-outgrew-the-automobile (accessed on 11 December 2021).
- Majchrzak, A.; Griffith, T.L.; Reetz, D.K.; Alexy, O. Catalyst Organizations as a New Organization Design for Innovation: The Case of Hyperloop Transportation Technologies. Acad. Manag. Discov. 2018, 4, 472–496. [Google Scholar] [CrossRef]
- Yaghoubi, H. The Most Important Maglev Applications. J. Eng. 2013, 2013, 537986. [Google Scholar] [CrossRef] [Green Version]
Figure 1.
Publication count by year from 1968 to 2021. Illustration by Authors.

Figure 2.
Mapping publication outputs by countries. Illustration by Authors.

Figure 3.
Top 50 journals with published works on ‘Smart Urban Mobility’, with the x-axis representing the number of publications. Illustration by Authors.
Figure 3.
Top 50 journals with published works on ‘Smart Urban Mobility’, with the x-axis representing the number of publications. Illustration by Authors.

Figure 4.
Primary Research Areas for published works. Illustration by Authors.

Figure 5.
Most influential sources. Illustration by Authors.

Figure 6.
Countries with the most contributions. Illustration by Authors.

Figure 7.
Mapping term co-occurrence from 1968 to 2021. Illustration by authors.

Figure 8.
Mapping keywords output from 1968 to 2010. Illustration by authors.

Figure 9.
Mapping Keywords Output from 2011 to 2015. Illustration by authors.

Figure 10.
Mapping Keywords Output from 2016 to 2019. Illustration by authors.

Figure 11.
Mapping Keywords Output from 2020 to 2021. Illustration by Authors.


Table 1.
Influential references on the theme of Smart Urban Mobility.
| Title | Citations | Ref |
|---|---|---|
| Just a better taxi? A survey-based comparison of taxis, transit, and ridesourcing services in San Francisco | 177 | Rayle, et al. [29] |
| Preparing a nation for autonomous vehicles: opportunities, barriers and policy recommendations | 155 | Fagnant and Kockelman [30] |
| The travel and environmental implications of shared autonomous vehicles, using agent-based model scenarios | 124 | Fagnant and Kockelman [31] |
| Disruptive Transportation: The Adoption, Utilization, and Impacts of Ride-Hailing in the United States | 100 | Clewlow and Mishra [32] |
| Preferences for shared autonomous vehicles | 87 | Krueger, et al. [33] |
| On-demand high-capacity ride-sharing via dynamic trip-vehicle assignment | 83 | Alonso-Mora, et al. [34] |
| Optimization for dynamic ride-sharing: A review | 77 | Agatz, et al. [35] |
| Traffic flow prediction with big data: a deep learning approach | 75 | Lv, et al. [36] |
| Internet of things for smart cities | 75 | Zanella, et al. [37] |
| Ridesharing: The state-of-the-art and future directions | 70 | Furuhata, et al. [38] |
| Exploring the impact of shared autonomous vehicles on urban parking demand: An agent-based simulation approach | 70 | Zhang, et al. [39] |
| Taxi pooling in New York City: a network-based approach to social sharing problems | 68 | Santi, et al. [40] |
| Is Uber a substitute or complement for public transit? | 67 | Hall, et al. [41] |
| Policy and society related implications of automated driving: A review of literature and directions for future research | 63 | Milakis, et al. [42] |
| The impact of ride-hailing on vehicle miles traveled | 62 | Henao and Marshall [43] |
| Dynamic ride-sharing and fleet sizing for a system of shared autonomous vehicles in Austin, Texas | 61 | Fagnant and Kockelman [44] |
| What influences travelers to use Uber? Exploring the factors affecting the adoption of on-demand ride services in California | 60 | Alemi, et al. [45] |
| User preferences regarding autonomous vehicles | 60 | Haboucha, et al. [46] |
| Help or hindrance? The travel, energy and carbon impacts of highly automated vehicles | 60 | Wadud, et al. [47] |
| Cost-based analysis of autonomous vehicle services | 59 | Bösch, et al. [48] |
Table 2.
Top 20 most influential authors on Smart Urban Mobility.
| Author Name | Affiliation | Citations | Total Link Strength |
|---|---|---|---|
| Daniel J. Fagnant | The University of Texas at Austin | 394 | 2092 |
| Susan A. Shaheen | UC Berkeley | 372 | 1832 |
| Hai Yang | The Hong Kong University of Science and Technology | 205 | 639 |
| Lisa Rayle | UC Berkeley | 199 | 1044 |
| Robert Cervero | UC Berkeley | 185 | 692 |
| Todd Litman | Victoria Transport Policy Institute | 182 | 826 |
| Chao Chen | Tsinghua Unversity | 166 | 417 |
| Fei-Yue Wang | Chinese Academy of Sciences | 166 | 439 |
| Yang Liu | National University of Singapore | 163 | 543 |
| Carlos Daganzo | UC Berkeley | 157 | 417 |
| Tan Yigitcanlar | Queensland University of Technology | 152 | 579 |
| Ye Li | Tongji University | 149 | 420 |
| Yu Zheng | JD Technology, Beijin | 149 | 279 |
| Eleni I. Vlahogianni | National Technical University of Athens | 147 | 263 |
| prateek bansal | Imperial College London | 146 | 900 |
| Dimitris Milakis | German Aerospace Centre | 145 | 820 |
| Alejandro Henao | National Renewable Energy Laboratory | 137 | 836 |
| Alejandro Tirachini | Universidad de Chile | 137 | 851 |
| Farzad Alemi | 136 | 826 | |
| Junping Zhang | Fudan University | 132 | 363 |
Publisher’s Note: MDPI stays neutral with regard to jurisdictional claims in published maps and institutional affiliations. |
© 2022 by the authors. Licensee MDPI, Basel, Switzerland. This article is an open access article distributed under the terms and conditions of the Creative Commons Attribution (CC BY) license (https://creativecommons.org/licenses/by/4.0/).
Share and Cite
MDPI and ACS Style
Allam, Z.; Sharifi, A. Research Structure and Trends of Smart Urban Mobility. Smart Cities 2022, 5, 539-561. https://0-doi-org.brum.beds.ac.uk/10.3390/smartcities5020029
AMA Style
Allam Z, Sharifi A. Research Structure and Trends of Smart Urban Mobility. Smart Cities. 2022; 5(2):539-561. https://0-doi-org.brum.beds.ac.uk/10.3390/smartcities5020029
Chicago/Turabian StyleAllam, Zaheer, and Ayyoob Sharifi. 2022. "Research Structure and Trends of Smart Urban Mobility" Smart Cities 5, no. 2: 539-561. https://0-doi-org.brum.beds.ac.uk/10.3390/smartcities5020029