Article

Mother’s Partnership Status and Allomothering Networks in the United Kingdom and United States

1
Religion Programme, University of Otago, Dunedin 9016, New Zealand
2
Centre for Research of Evolution, Belief and Behaviour, University of Otago, Dunedin 9016, New Zealand
3
Department of Anthropology, Pennsylvania State University, State College, PA 16801, USA
4
Department of Population Health, London School of Hygiene and Tropical Medicine, London WC1E 7HT, UK
5
Department of Anthropology, University of Connecticut, Storrs, CT 06269, USA
*
Author to whom correspondence should be addressed.
Submission received: 1 April 2021 / Revised: 28 April 2021 / Accepted: 13 May 2021 / Published: 20 May 2021
(This article belongs to the Special Issue The Behavioral Ecology of the Family)

Abstract

:
In high-income, low-fertility (HILF) settings, the mother’s partner is a key provider of childcare. However, it is not clear how mothers without partners draw on other sources of support to raise children. This paper reports the findings from a survey of 1532 women in the United Kingdom and the United States, in which women described who provided childcare for a focal child and how frequently they did so. We use multivariate Bayesian regression models to explore the drivers of support from partners, maternal kin, and other allomothers, as well as the potential impact of allomothering on women’s fertility. Relative to mothers who are in a stable first marriage or cohabitation, mothers who are unpartnered rely more heavily on fewer maternal kin, use more paid help, and have networks which include more non-kin helpers. Repartnered mothers received less help from their partners in the UK and less help from maternal kin in both countries, which US mothers compensated for by relying on other helpers. While repartnered mothers had higher age-adjusted fertility than women in a first partnership, allomaternal support was not clearly related to the mother’s fertility. These findings demonstrate the importance of partners but also of allomothering more broadly in HILF settings.

1. Introduction

Compared to our closest primate relatives, human life history is unique in that it features an extended period of development and dependency (Bogin 1997; Hill and Kaplan 1999). During this time, human children require high amounts of care to survive and to learn the skills they need to thrive in adulthood. The demands of childcare and food acquisition for a mother and her children represent too much work for one mother to perform alone, particularly if she has multiple dependent children (Kramer 2010). Therefore, two key characteristics of human life history are that mothers receive a substantial amount of support for childrearing from allomothers and that the source of this support varies in response to socioecological conditions (Hill and Kaplan 1999). Allomothering (literally “other mothering”) is so crucial to the human story that humans are often classified as cooperative breeders; that is, we require the help of nonmaternal individuals to successfully reproduce (Hrdy 2009; Kramer 2010). Cooperative breeding, moreover, may have been a key driver behind the demographic success of humans by allowing mothers to have more surviving offspring at closer intervals than they would have without the support of allomothers (Kramer 2010, 2019).
In Western, educated, industrialized, rich, and democratic (WEIRD, see Henrich et al. (2010)) settings, the economically-independent nuclear family type is widely regarded as the traditional family type (Sear 2021). However, anthropological and evolutionary research demonstrates that this view is not accurate. Mothers across nonindustrialized societies obtain considerable support with childcare as well as food production from a range of extra-household individuals (Hewlett and Lamb 2005; Meehan 2009; Meehan et al. 2013; Ivey 2000; Crittenden and Marlowe 2008). Kin, and especially close kin, typically provide more childcare help than do non-kin (Ivey 2000; Crittenden and Marlowe 2008; Meehan et al. 2014), likely because helping closely related mothers and their children can increase inclusive fitness (Hamilton 1964). Despite an emphasis on biparental care in WEIRD societies, i.e., from mothers and fathers together, paternal investment in childcare cross-culturally is facultative and varies with social and ecological conditions (Geary 2000; Meehan 2005). For example, in three agrarian societies in Belize, Kenya, and Samoa included in the Standard Cross Cultural Sample, fathers were not observed holding their children at all (Marlowe 2000). On the other end of the spectrum, Aka fathers, a foraging group from central Africa, are well known for their high level of investment in childcare and spend up to nearly half of their days within arm’s reach of their infants (Hewlett 1993). Just as level of parenting by fathers vary across societies, so do the impact of paternal care on children’s health. In nonindustrialized settings, paternal presence or absence is only sometimes associated with child outcomes (Sear and Mace 2008; Sear and Coall 2011) in contrast to other allomaternal support which typically positively predicts both children’s health (Sear and Coall 2011) and maternal fertility (Sear and Coall 2011; Snopkowski and Sear 2016).
Processes of industrialization and modernization, however, have deeply shifted the relationship between mothers and their help networks. The increased mobility associated with industrialization and urbanization has physically dispersed kin networks (Zelinsky 1971; Newson et al. 2005; Emmott and Page 2019). Mothers often have fewer kin from whom to draw physical support, and thus, they may rely more upon non-kin for support (Newson et al. 2005; Sear and Coall 2011). The reduction in kin help with childcare may raise the financial and perceived costs of childcare, leading to hesitancy to have more children and the choice to invest more into each offspring, perhaps contributing to reductions in fertility associated with demographic transitions (Turke 1989; Kaplan et al. 2002; Newson et al. 2005; Sear and Coall 2011). Even in contemporary, less-kin-dense settings, kin continue to play an important role in childrearing. In modern high-income, low-fertility (HILF) nations, investments by kin, especially maternal kin, are generally are associated with more favorable educational and psychological child outcomes, although there is some variation in the magnitude of these associations (Sear and Coall 2011; Sadruddin et al. 2019; Sear 2021). In HILF settings, relationships between kin support and fertility are more variable, and different types of support from kin have been linked to both positive (Mathews and Sear 2013a, 2013b; Schaffnit and Sear 2017a) and negative (Sear and Coall 2011; Schaffnit and Sear 2014, 2017a) relationships with fertility outcomes, which may reflect that some mothers in these settings use childcare help to return to work rather than to have more children.
Alongside, and perhaps because of, the reduction in kin networks that occurred with industrialization, mothers increasingly rely upon their partners for help with childcare (Sear and Coall 2011; Emmott 2015; Pailhé et al. 2021). Paternal investment in children in HILF countries is consistently associated with better educational, behavioral, and psychological wellbeing outcomes for children (Harris et al. 1998; Flouri and Buchanan 2004; Nettle 2008; Jeynes 2014; Emmott and Mace 2020), though such findings may be confounded by socioeconomic position. Due to the importance of fathers and father figures in child outcomes, there is a rich body of anthropological, demographic, and sociological research on the drivers of paternal investment in HILF countries. Fathers tend to invest more in childcare if they are of higher socioeconomic position (Nettle 2008), if they have strong religious and/or traditional values (Wilcox 2002; Lynn et al. 2016), if they live with the child (Anderson 2000; Lancaster and Kaplan 2000), and if the child is a boy rather than a girl (Lundberg 2005; Nettle 2008), for example.
Although the nuclear family is regarded as the traditional family type in HILF countries, divorce and remarriage have become increasingly common over the last 50 years (Murphy 2008; Furstenberg et al. 2020, but see also Sussman 1959). This has driven research on how absentee fathers and stepfathers vary in their investments in children relative to biological fathers living with their children. Parental separation or ceasing to live with a child reduces the biological father’s physical and monetary investment in his child (Anderson 2000; Lancaster and Kaplan 2000; Pashos et al. 2016) and reduces paternal kin contact with the child (Jappens and Van Bavel 2016), resulting in a reduction or loss of these key sources of support for mothers. Nevertheless, some research suggests that the reduction of paternal investment after parental separation depends on context; nonresident fathers in the US, for example, have lower rates of contact and provide less financial support to their children than nonresident fathers in the UK (Clarke et al. 1998).
Faced with a loss in support, mothers who separate from their partners may turn to their kin to compensate for lost partner and paternal kin support (Schaffnit and Sear 2017a). A separated woman may remarry, after which her allomothering network may expand to include her new partner and his network, and/or she may lose the support of her former partner’s kin. The patterns and drivers of step-paternal investment in children is a topic of keen interest to many social scientists. New partners may invest in a mother’s children with a previous partner as a form of mating effort (Anderson 2000; Lancaster and Kaplan 2000). While many stepfathers care for their partner’s previous children, stepfathers tend to invest less intensively in stepchildren than in their biological children (Cooksey and Fondell 1996; Lancaster and Kaplan 2000; Lawson and Mace 2009; Emmott and Mace 2014), and stepfathers’ kin are also less likely to invest in stepchildren than they would in biological descendants (Coall et al. 2014; Gray and Brogdon 2017; Steinbach and Silverstein 2019). Therefore, repartnered mothers may experience shifts in their alloparental networks, which could conceivably include expansion of the network if both her previous partner and her new partner remain invested in childcare, or alternatively could include greater reliance on nonpartner sources of support if the new partner does not compensate for the reduction of investment from the previous partner.
Although divorce and remarriage are considered a relatively new phenomenon in WEIRD settings, serial monogamy is considered the most common form of mating systems across human societies (Schacht and Kramer 2019). In WEIRD settings, divorce and remarriage are considered departures from traditional family norms and have been on the rise in the last 50 years, when in fact divorce or widowhood and remarriage (or repartnering) appear to be a common feature of human mating and kinship systems. What is perhaps unique about divorce and remarriage in HILF countries is that, due to the nuclearization of the family, the loss of a partner is potentially also the loss of a significant source of childcare. Understanding how women navigate these pressures in HILF settings may help to shed light on dynamics in both contemporary HILF settings as well as other contemporary and past societies.
Currently, women in HILF countries frequently underachieve their fertility intentions (Morgan and Rackin 2010; Sear et al. 2016; Beaujouan and Berghammer 2019). Because humans are cooperative breeders, understanding how mothers’ support networks anticipate their reproductive outcomes is essential for identifying the conditions necessary to allow women to fulfil their reproductive goals. In this study, we analyze newly collected survey data from the United Kingdom and the United States to understand the structure of mothers’ support networks and how these affect her fertility outcomes. Given the known importance of partners in childrearing in HILF contexts and the increasing prevalence of reconstituted and alternative families in HILF countries (Furstenberg et al. 2020), we specifically consider how women’s partnership statuses (either marriage or cohabitation) are associated with patterns of support and fertility preferences. We investigate patterns in both the UK and the US to illustrate that HILF societies are not monolithic (Stulp et al. 2016). Although the UK and the US are socioculturally similar countries, variations in government support for individuals and families means that the socioecologies in these countries vary, and this could impact parental investment strategies and family relationships (Clarke et al. 1998).
Throughout these analyses, we evaluate the following five predictions. Based on research that finds that stepfathers invest less in childcare (e.g., Cooksey and Fondell 1996; Lancaster and Kaplan 2000; Lawson and Mace 2009; Emmott and Mace 2014), we predict that second partners provide less childcare than first partners to a woman’s children (P1). Given that mothers are flexible in whom they seek childcare from (Sear and Coall 2011), we predict that maternal kin invest more in childcare when mothers are unpartnered or repartnered than when mothers are partnered (P2), and that other (nonpartner or maternal kin) helpers may also provide more help to unpartnered and repartnered mothers (P3). Because having multiple partners is known to increase fertility (Balbo et al. 2013), we predict that repartnered mothers have higher fertility than unpartnered or partnered mothers (P4). Lastly, because the cooperative breeding hypothesis suggests that allomothering increases women’s fertility (Kramer 2010, 2019), we predict that the level of help received is also associated with mothers’ fertility (P5). Although we make no specific predictions about differences between the study countries, we anticipate that socioecological pressures and corresponding behaviors may vary between them, and therefore analyze them separately. This analysis is, to our knowledge, the first to document the impact of partnership status on the composition and level of investment of allomothers in a woman’s network.

2. Results

The data used to test predictions consist of responses to questionnaires collected through the Prolific online survey participant recruitment platform in August 2020. A total of 919 UK and 609 US women with children under 5 years of age answered questions about themselves, their families, and who helped them care for a focal child under the age of 5 years. Women were categorized as partnered if they indicated they were married or cohabitating with a partner and the current partner was the biological father of all of her children; repartnered if they were married or cohabitating with a partner and at least one of her children’s biological father was not her current partner; and unpartnered if she was not currently married or cohabitating with a partner. For further details on the survey, see Section 4 and the Supplementary Materials.
The descriptive statistics for the variables included in the models are presented in Table 1. In the countries combined, focal children received care from an average of 1.82 people besides the mother, and 1.09 people besides the mother and her partner. Children of partnered and repartnered mothers received similar levels of allomothering (mean score of 133 tasks per month for both groups), while children of unpartnered women received less (mean score of 80 tasks per month).

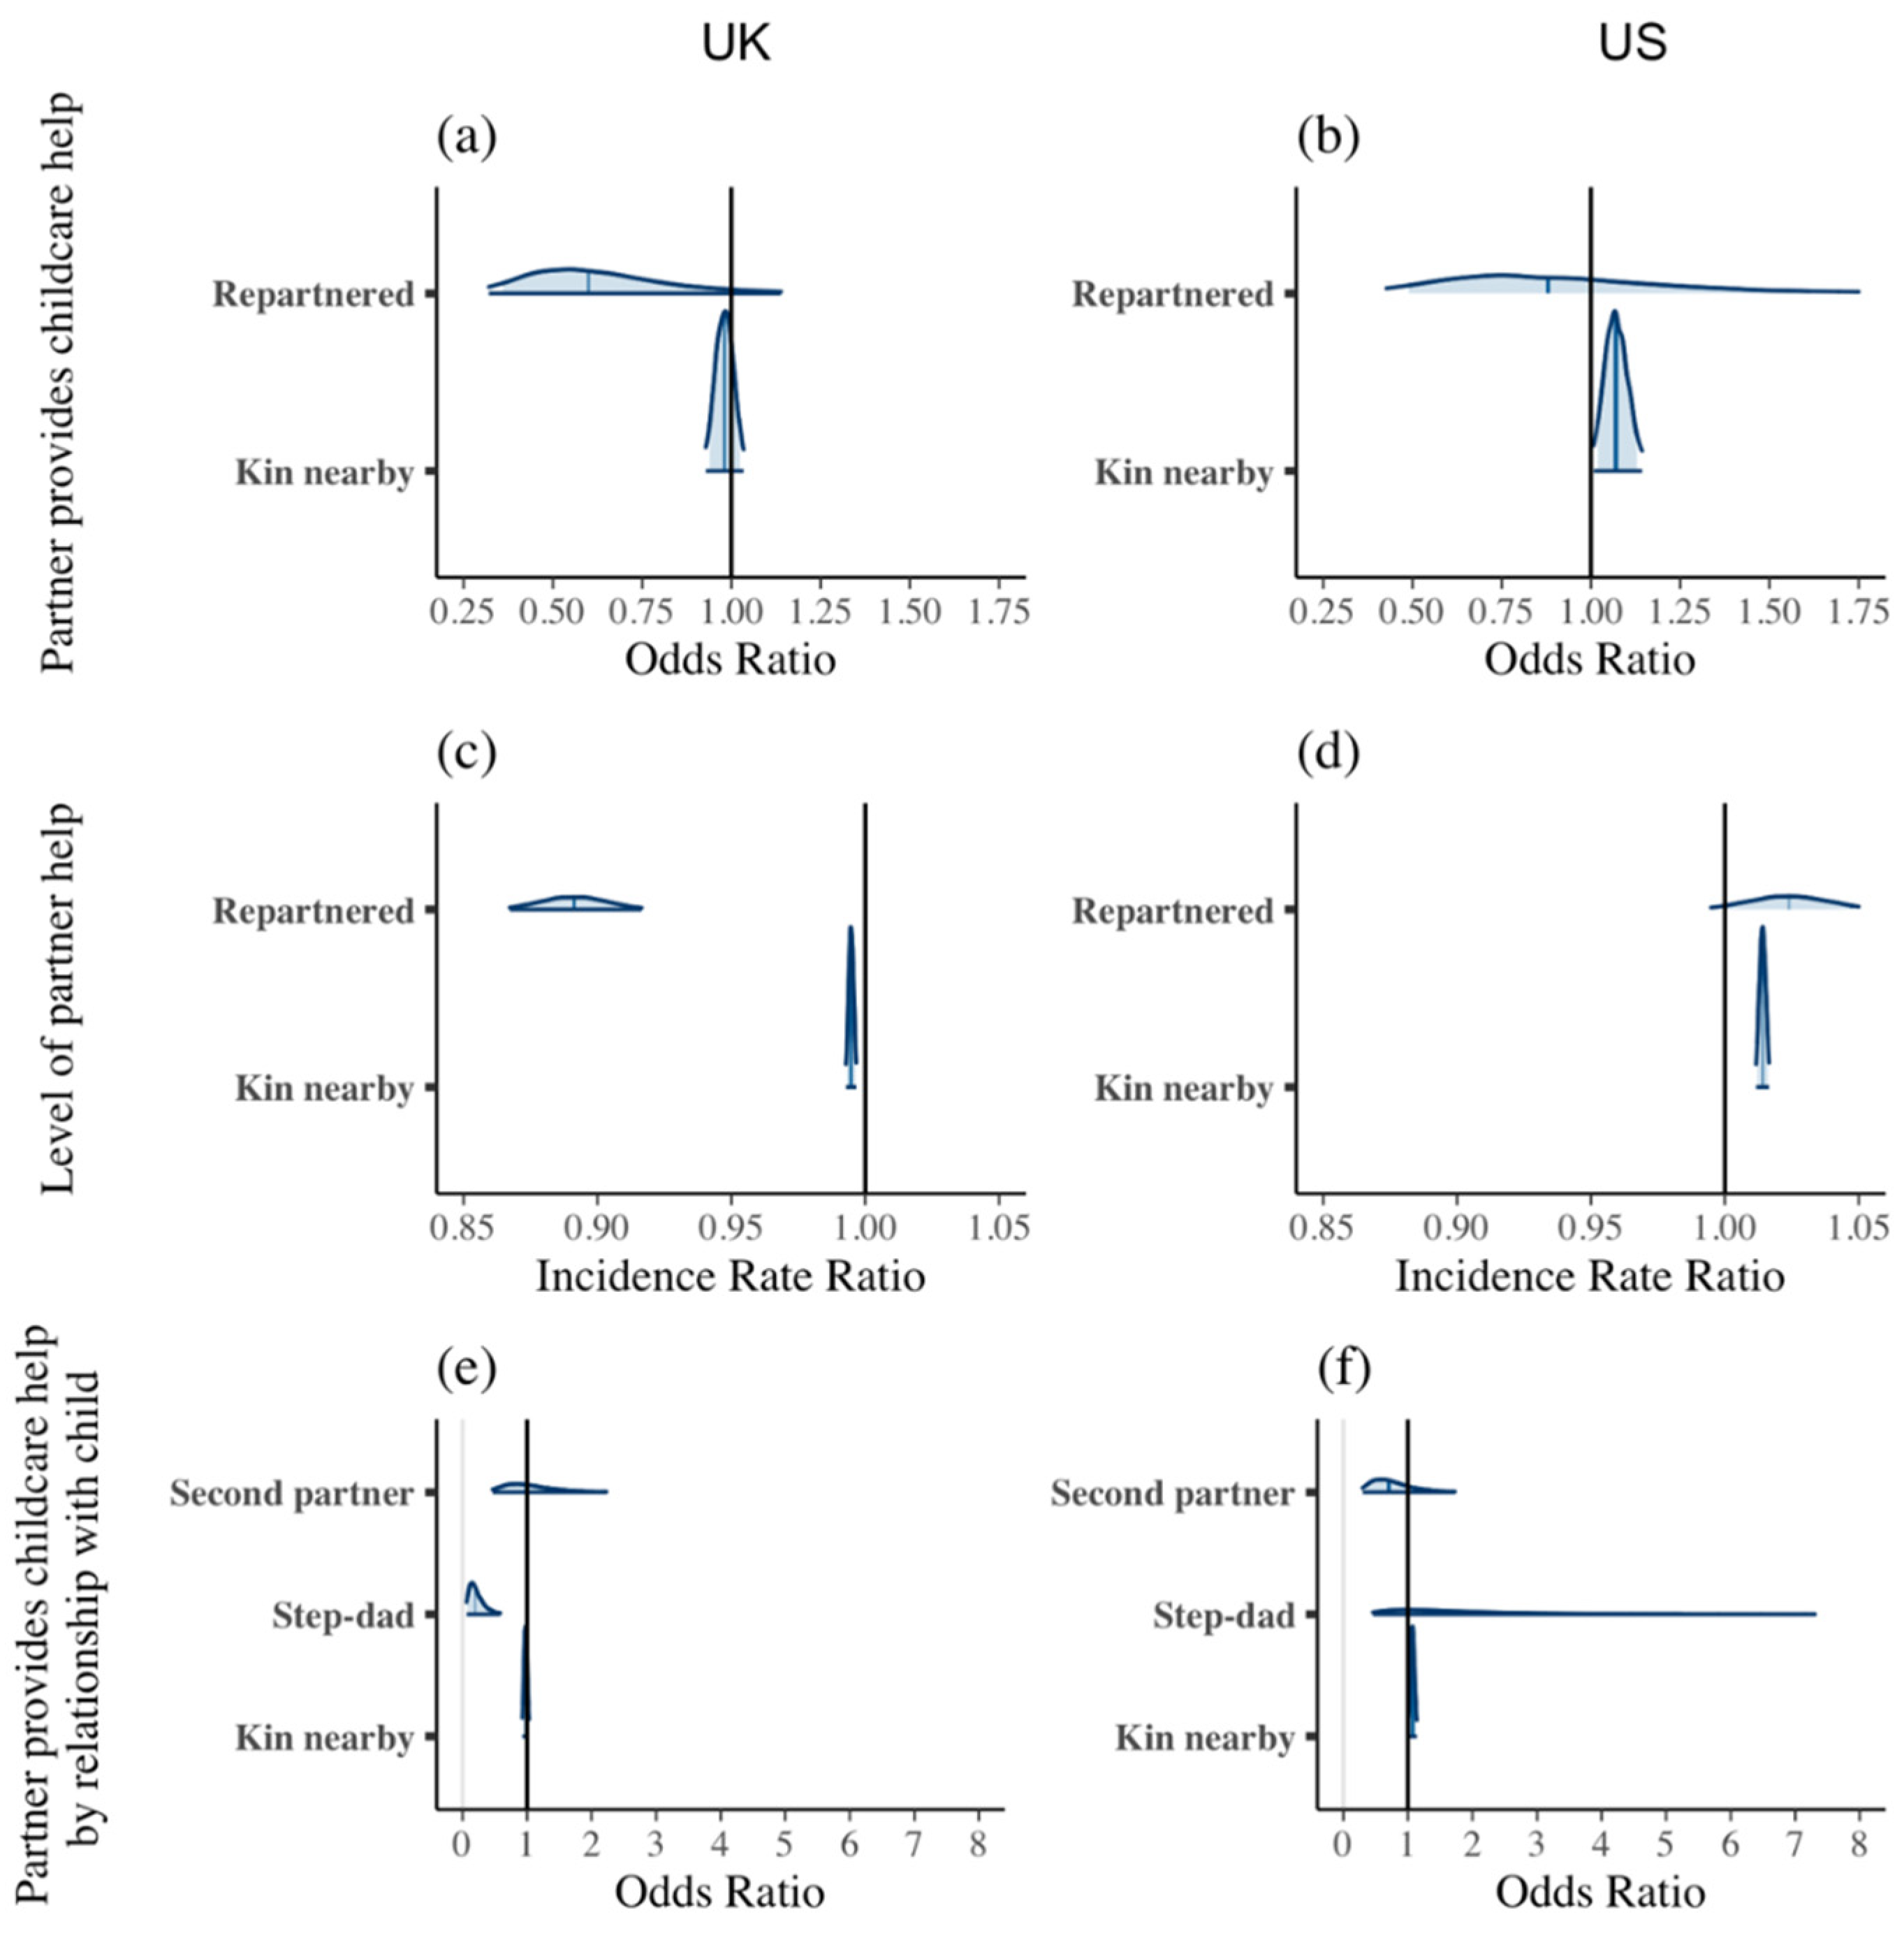
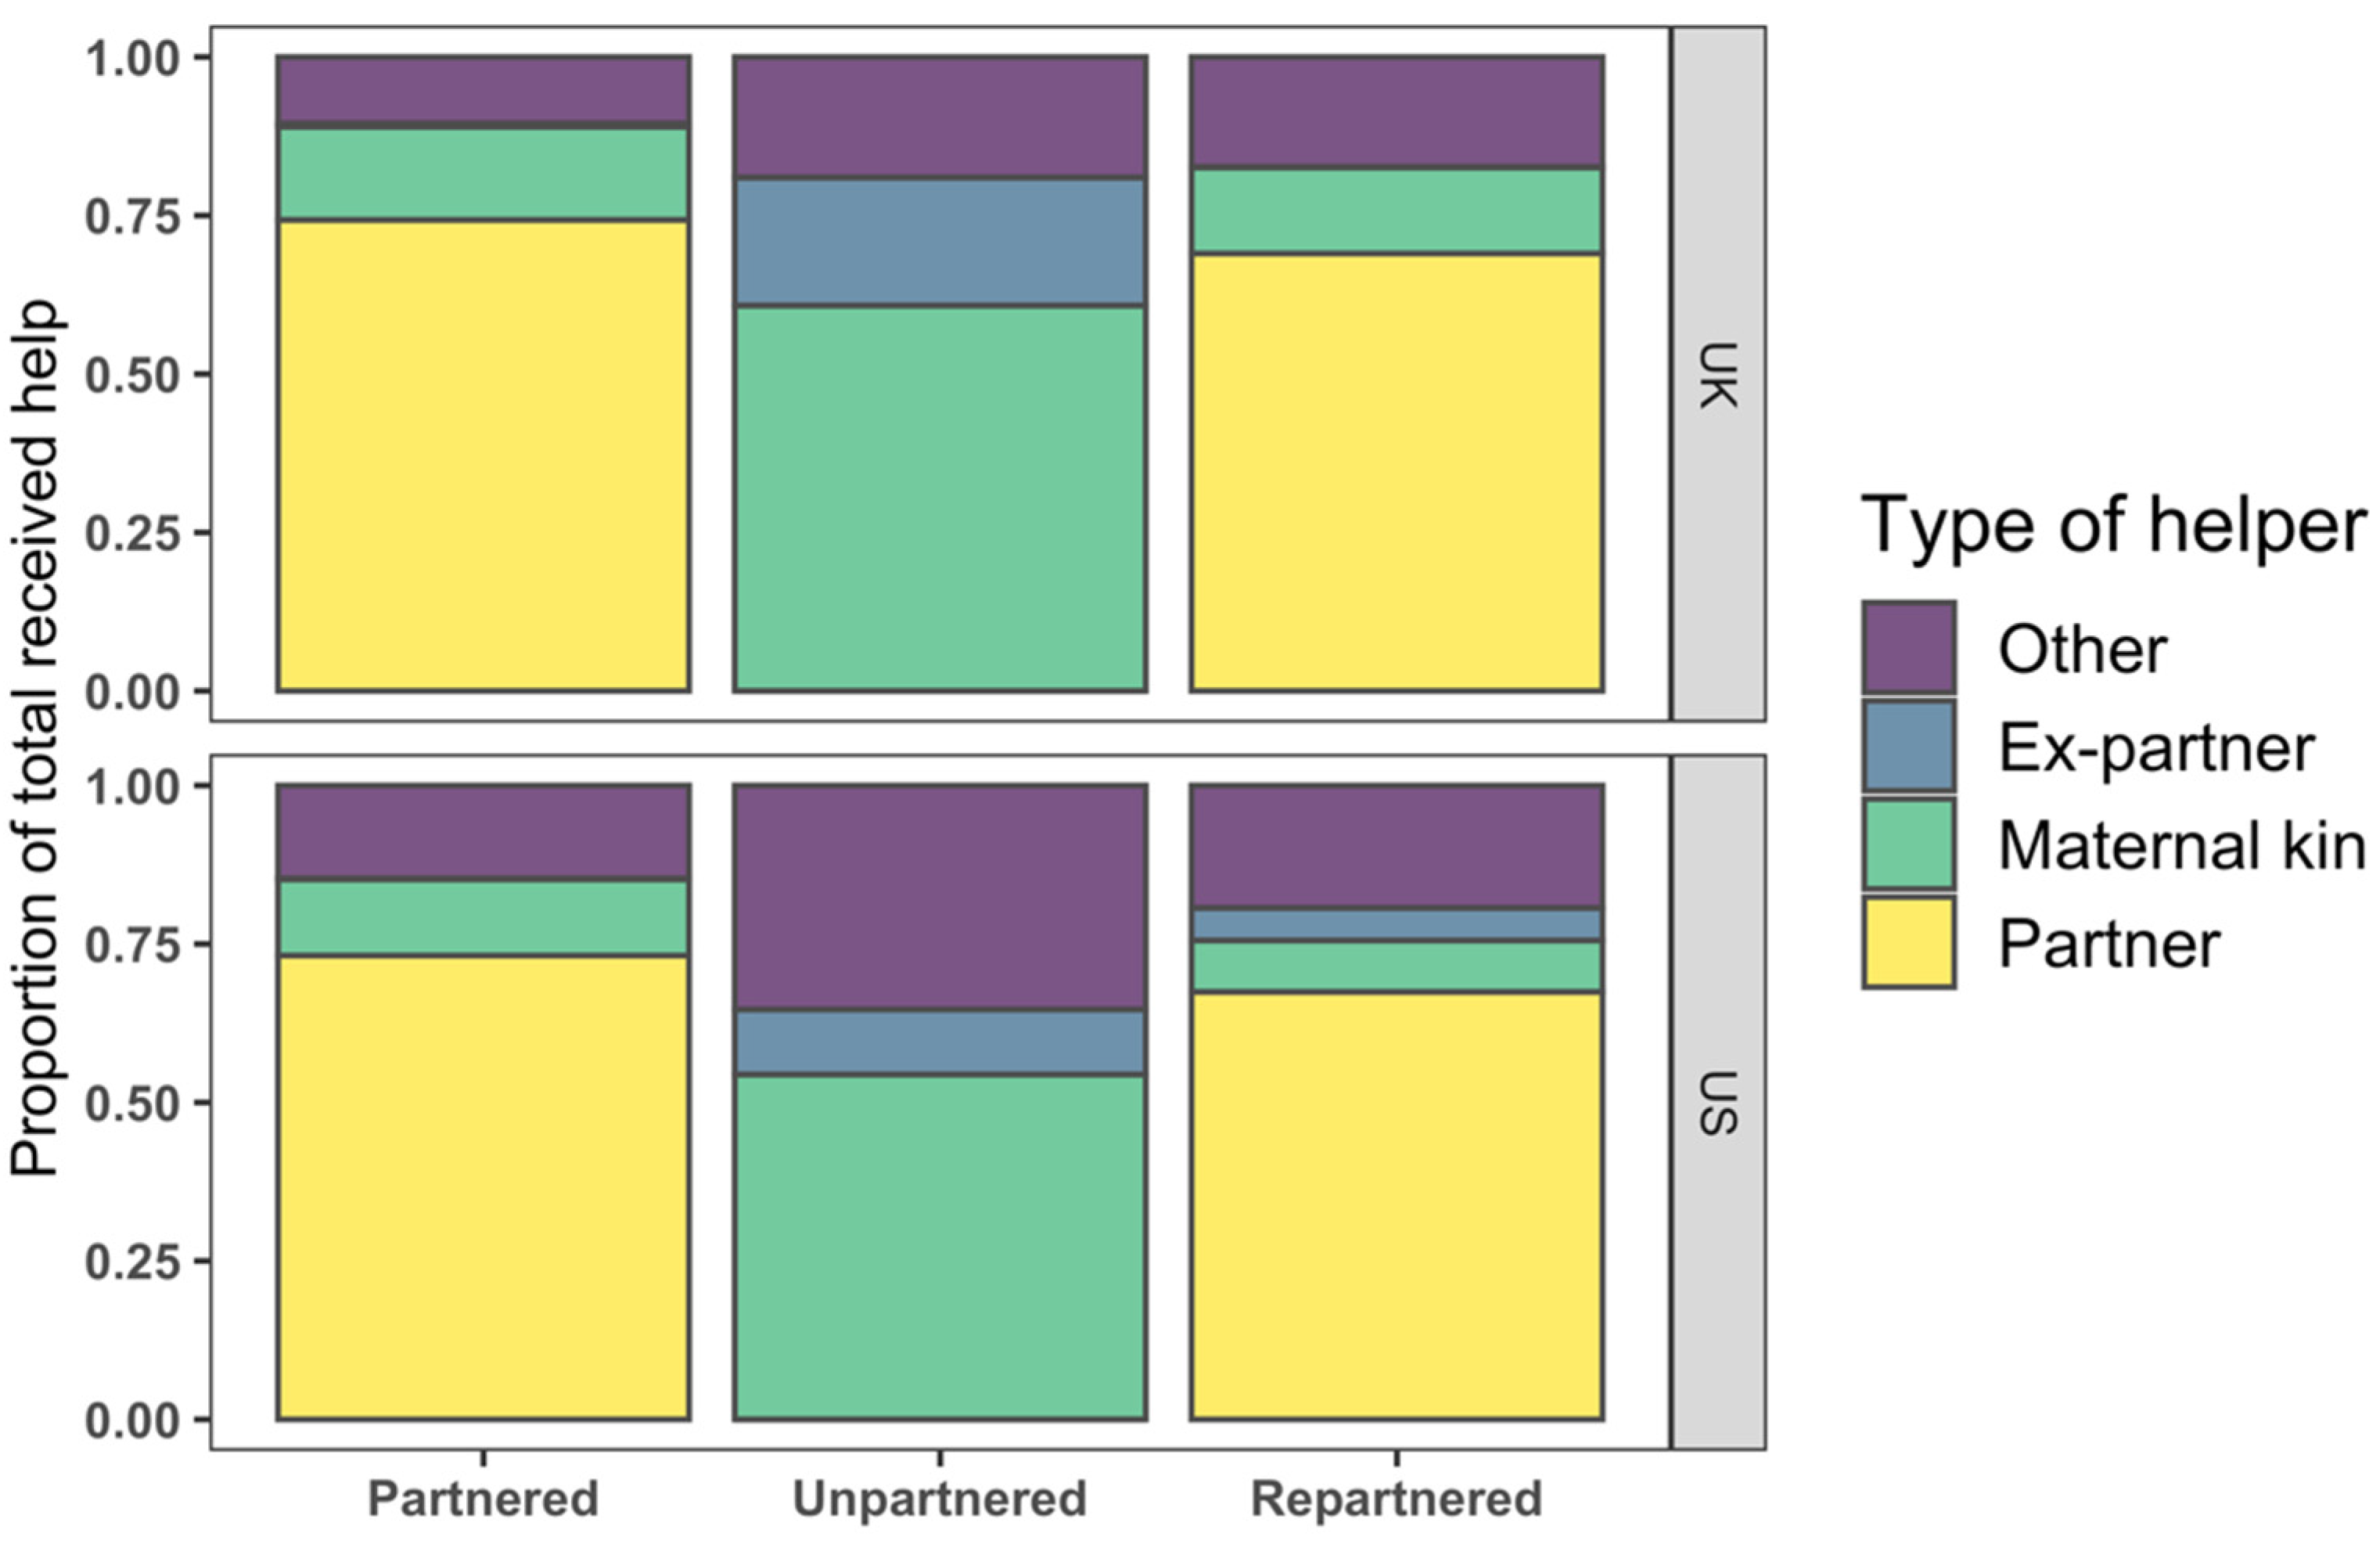
2.1. Partner Investment in Childcare (P1)

We firstly describe the contributions of women’s partners to raising her children (P1). Of the mothers who were either partnered or repartnered, 83% in the UK and 80% in the US reported ever receiving childcare help from their partners (Table 1). Of the partners who provided help with specified childcare tasks (see materials and methods), most were very involved: the average number of tasks performed daily by partners were 4.13 out of 5 possible tasks in the UK and 3.97 out of 5 in the US. In neither country were second partners more or less likely to provide any help at all with childcare than first partners (odds ratio (OR) (95% credibility interval (CI)), UK = 0.60 [0.32, 1.14], US = 0.88 [0.43, 1.87], Table 2 and Figure 1). However, in terms of the level of support (with higher levels indicating greater instances of support provided over the course of a month, see Section 4 for details), in the US, second partners provided similar levels of help as first partners (incidence rate ratio (IRR) [95% CI] = 1.02 [0.99, 1.05]), but the same was not true in the UK, where second partners provided less help than first partners (IRR [95% CI] = 0.89 [0.87, 0.92]). Results from similar models testing alternate operationalizations of the measure of involvement (a count of care tasks provided daily and the number of days of supervision provided per month, see Section 4) were consistent with the findings presented here (Supplementary Materials). Similarly, running the models without the kin proximity variable did not significantly change the impact of being repartnered (see Section 4 for details and Supplementary Materials for results).
We also examined differences in the likelihood of partner involvement and level of partner’s help with childcare help, differentiating between first partners, second partners who were caring for their biological child, and second partners who were caring for a stepchild. Results again differed between the UK and the US. In the UK, second partners were not more or less likely to provide any amount of childcare for their biological child (OR [95% CI] = 0.97 [0.47, 2.23]) but were less likely to care for their stepchild (OR [95% CI] = 0.19 [0.06, 0.59], Table 2 and Figure 1). In the US, however, there were no meaningful differences in second partners’ care toward their own child (OR [95% CI] = 0.70 [0.30, 1.73] and their stepchild (OR [95% CI] = 1.54 [0.46, 7.31]). Unfortunately, sample sizes for second partners caring for stepchildren were small (16 in the UK and 18 in the US).

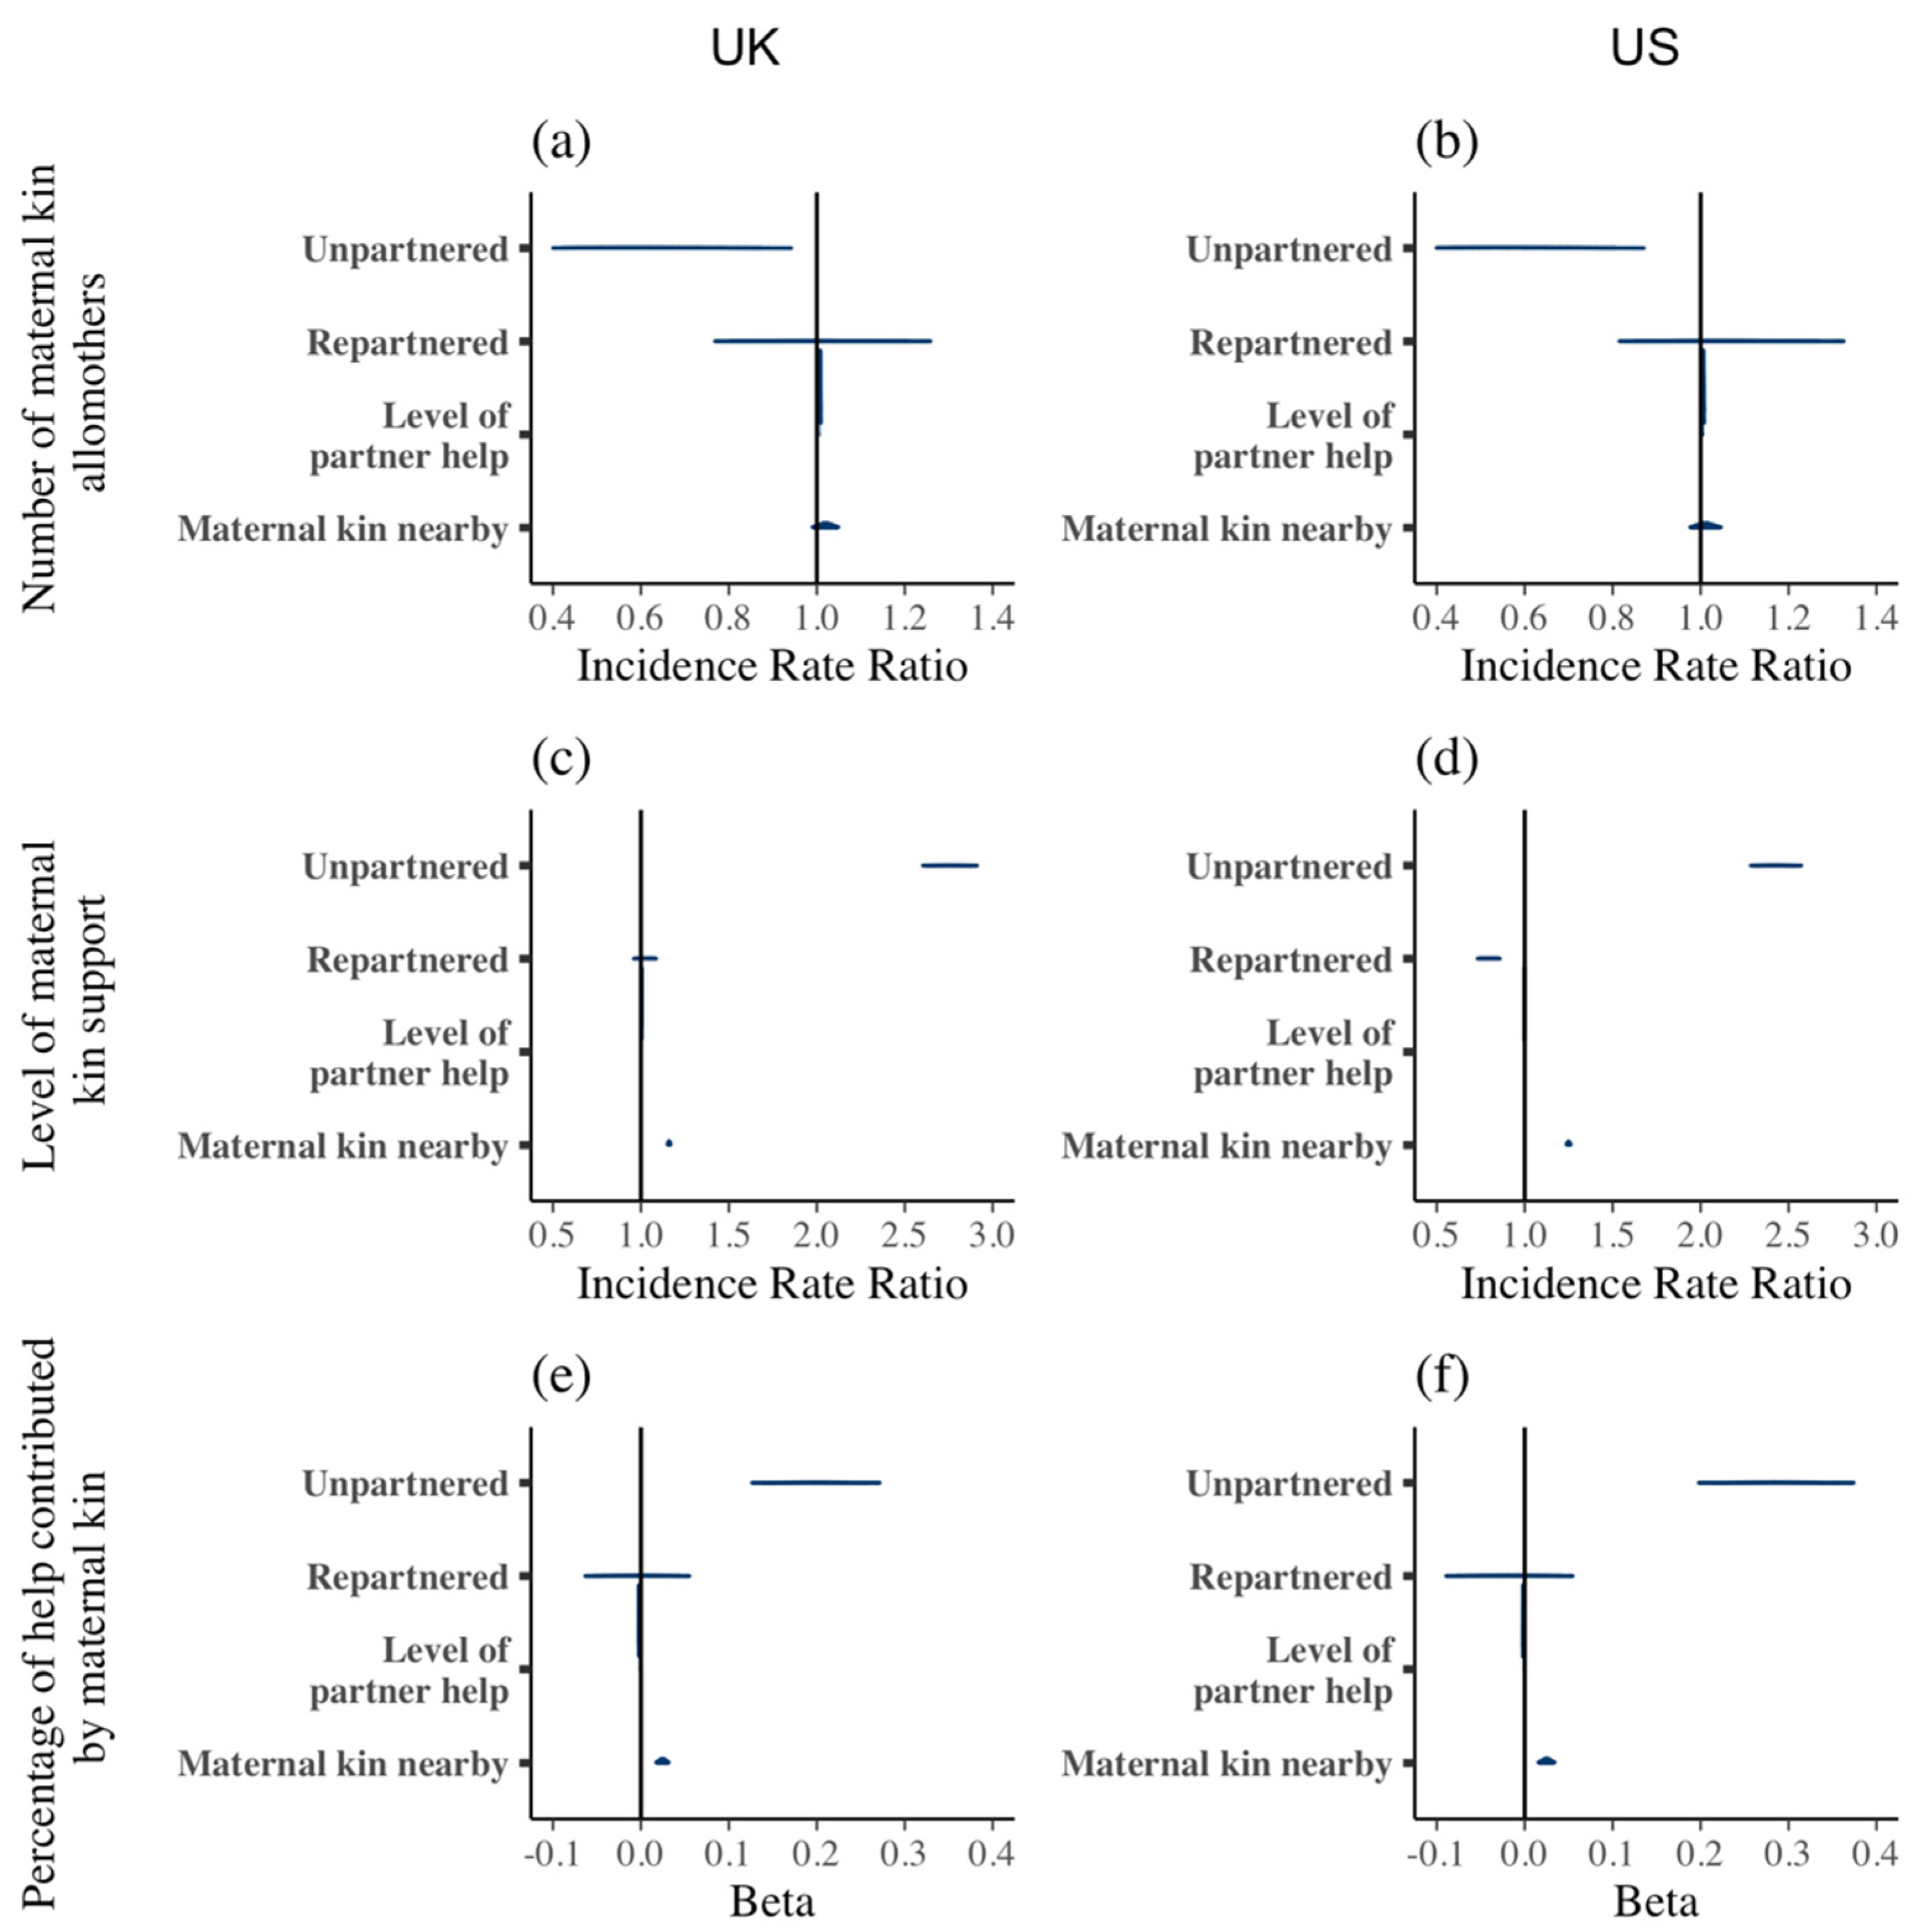
2.2. Maternal Kin Investment in Childcare (P2)

To examine the level of involvement of maternal kin in unpartnered and repartnered mothers’ allomaternal networks (P2 and P3), we built models predicting the number of maternal kin allomothers, their level of support, and the percentage of overall level of support provided by maternal kin (Table 3, Figure 2). After adjusting for level of partner help, number of maternal kin residing nearby, and sociodemographic covariates, both UK and US unpartnered mothers received help from fewer maternal kin than partnered women (IRR [95% CI], UK = 0.62 [0.38, 0.94]; US = 0.57 [0.36, 0.87]). Repartnered mothers in both the UK and the US did not differ from partnered women in the number of maternal kin from whom they received help (IRR [95% CI], UK = 0.99 [0.77, 1.26]; US = 1.04 [0.82, 1.33]). Considering the level of help received from maternal kin rather than number of helpers revealed a different pattern. In both the UK and the US, relative to partnered women, unpartnered women received a greater amount of help from maternal kin (IRR [95% CI], UK = 2.76 [2.60, 2.91]; US = 2.42 [2.29, 2.57]), and a greater percentage of their total help score came from maternal kin (Beta [95% CI], UK = 0.20 [0.13, 0.27]; US = 0.29 [0.20, 0.37]). In the US, repartnered women received less help from maternal kin (IRR [95% CI] = 0.79 [0.73, 0.85]), but in the UK, repartnered women received similar amounts of help from maternal kin as did partnered women (IRR [95% CI}: 1.02 [0.96, 1.09]). In both countries, repartnered women did not differ from partnered women in the percentage of overall help that was received from maternal kin (Beta [95% CI], UK = −0.00 [−0.06, 0.05]; US = −0.02 [−0.09, 0.05]).
Running the models without the kin proximity and partner help covariates increased the impact of being unpartnered but did not significantly change the impact of being repartnered (see Section 4 for more details and Supplementary Materials for results). The increased effect of being unpartnered occurred when removing the partner help covariate, suggesting that the lack of a contribution from a partner partially, but not completely, explains the impact of being unpartnered on a mother’s allomaternal network. Overall, these results suggest that unpartnered women receive a larger amount of help from, and rely much more on, fewer maternal kin allomothers. Repartnered women receive somewhat less help from a similar number of maternal kin allomothers as do partnered mothers and rely on them about as much as partnered mothers do.

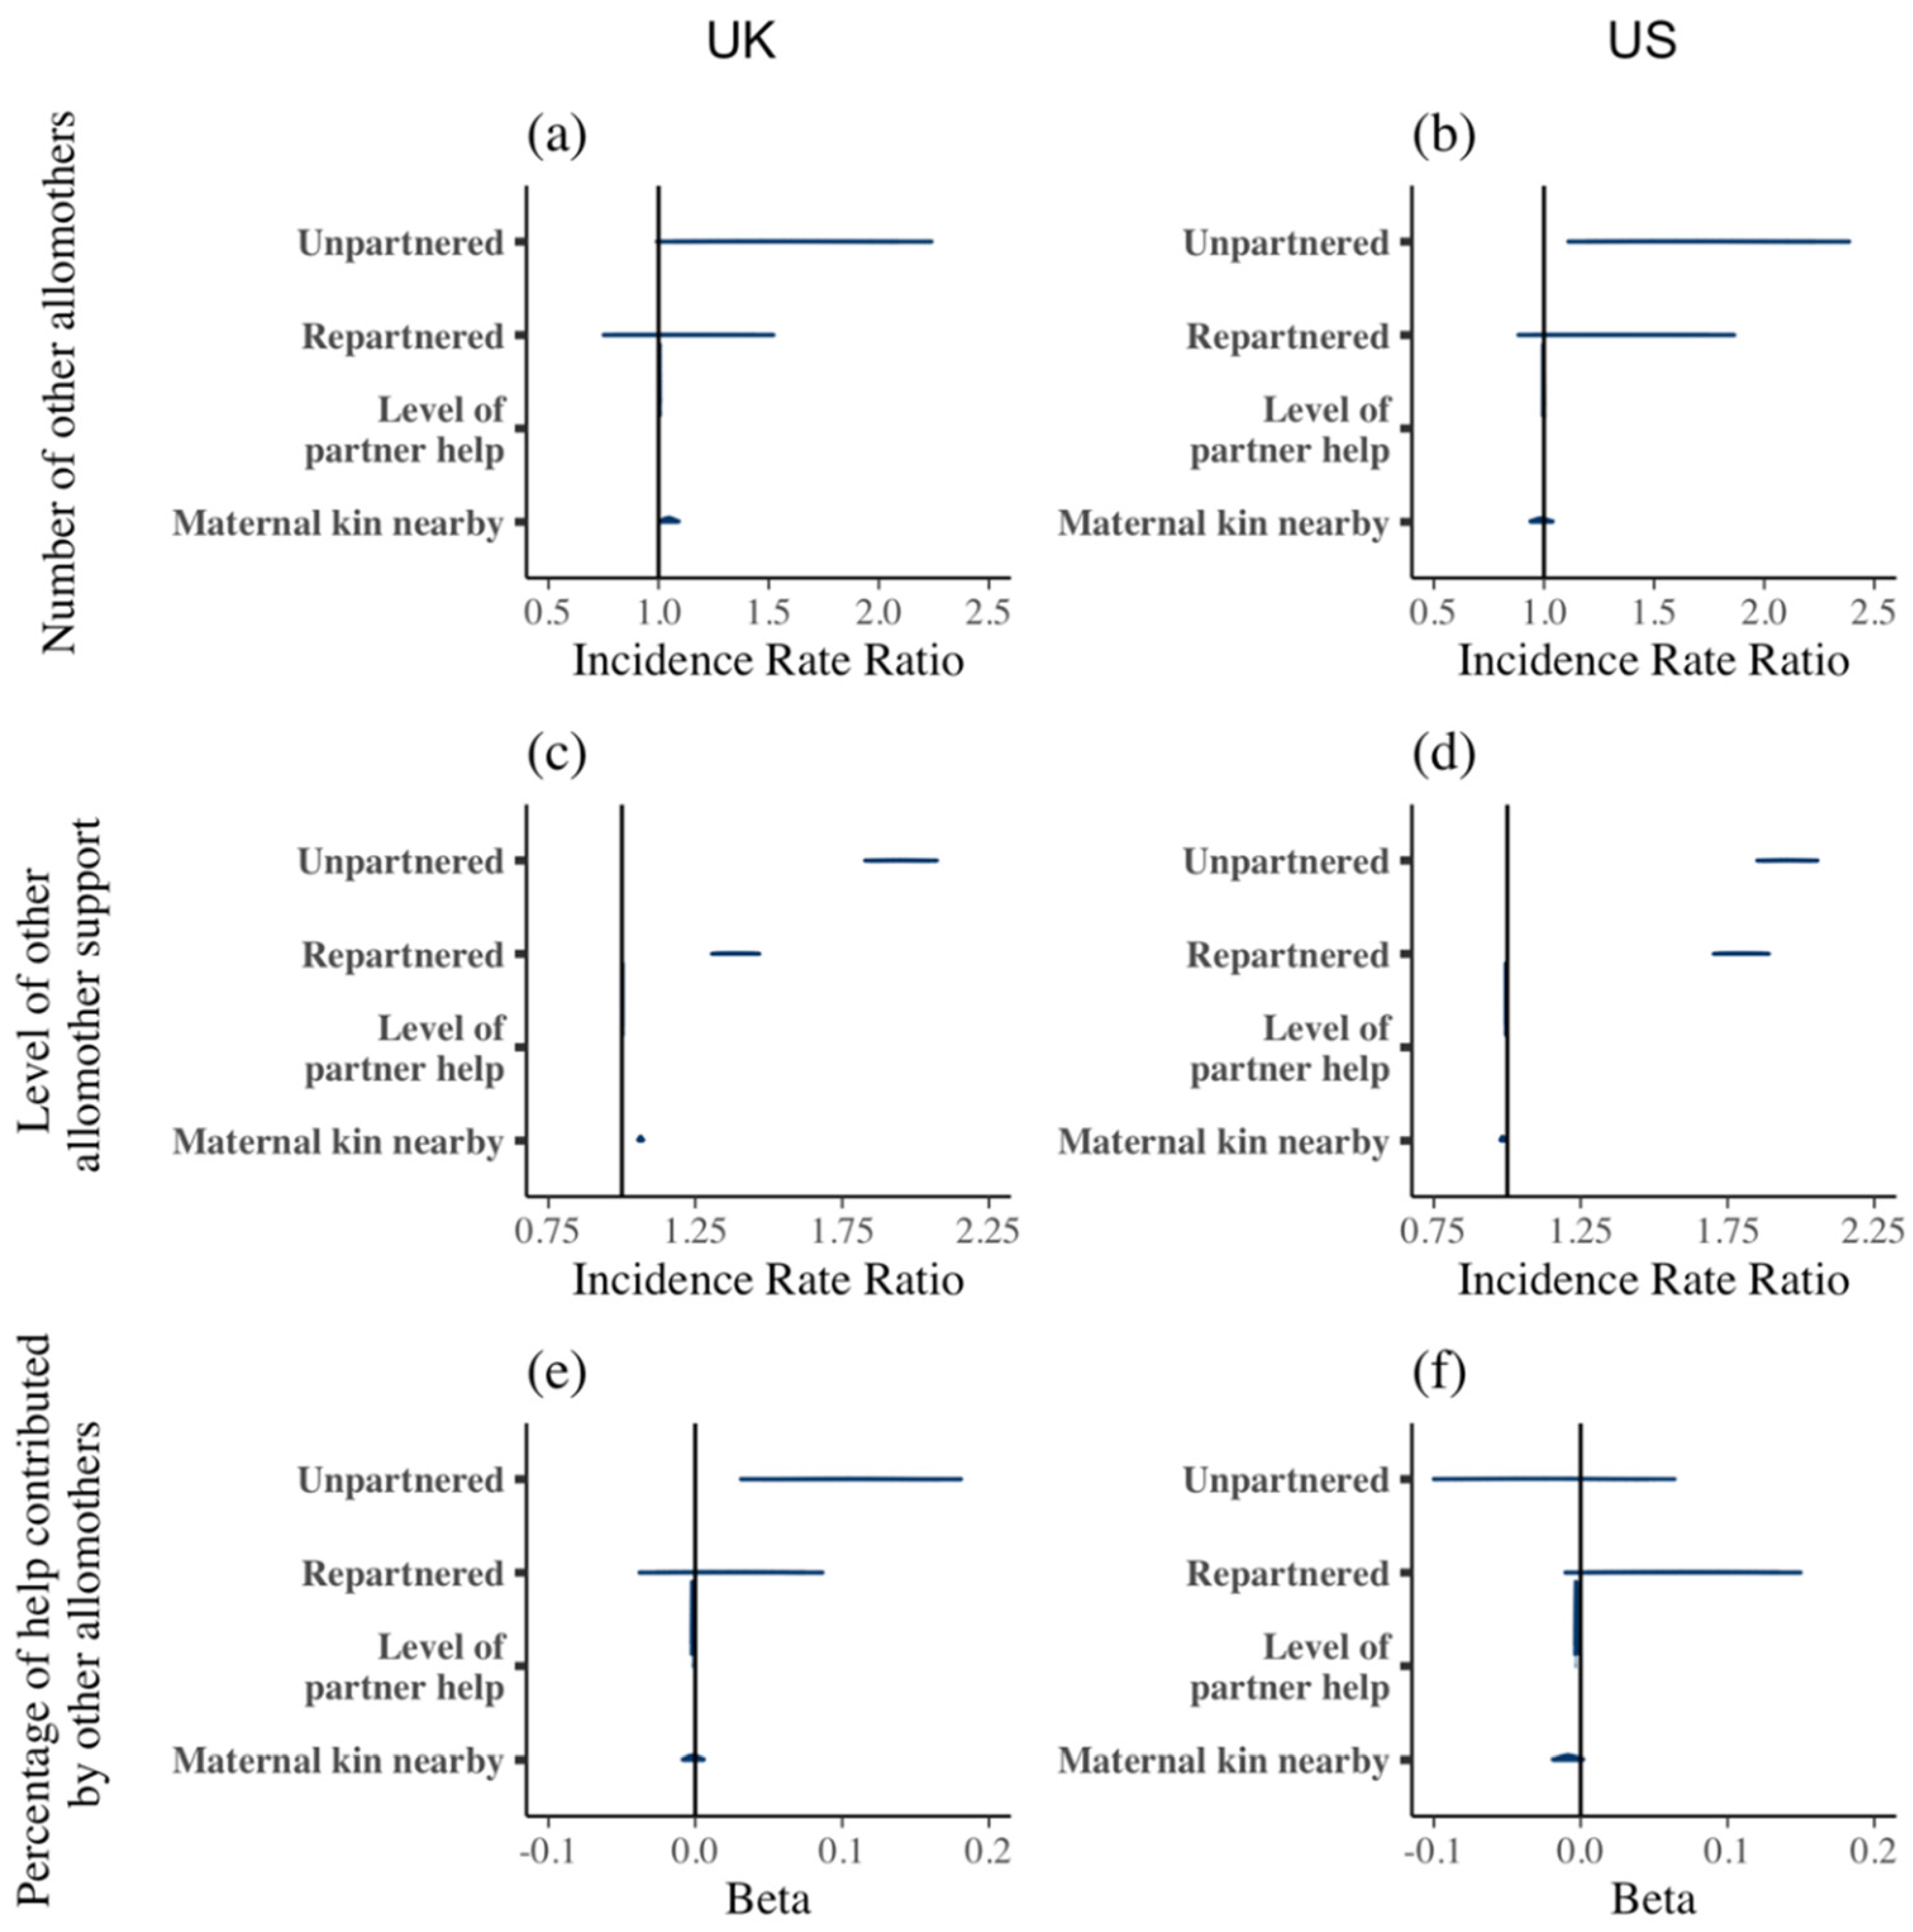
2.3. Other Allomother Investment in Childcare (P3)

We then considered how partnership status was related to help received from others, which comprised primarily non-kin but also the father or stepfather’s kin and any sibling helpers (P2 and P3). We again built models predicting the number of other allomothers, their level of support, and the percentage of overall level of support provided by other allomothers (Table 4, Figure 3). After adjusting for level of partner help and the number of maternal kin residing nearby, unpartnered mothers in both the UK and the US received help from a greater number of other allomothers than did partnered mothers (IRR [95% CI], UK = 1.49 [0.99, 2.24]; US = 1.64 [1.11, 2.39]). Repartnered mothers in both the UK and the US did not differ from partnered women in the number of other allomothers they received help from (IRR [95% CI], UK = 1.09 [0.75, 1.52]; US = 1.31 [0.88, 1.86]). In both countries, both unpartnered (IRR [95% CI], UK = 1.94 [1.83, 2.07]; US = 1.95 [1.85, 2.06]) and repartnered women (IRR [95% CI], UK = 1.38 [1.31, 1.47]; US = 1.79 [1.70, 1.89]) received greater amounts of help from other allomothers than partnered women. However, patterns in reliance on other allomothers were inconsistent across countries. Unpartnered women relied more on other allomothers than did partnered women in the UK (Beta [95% CI] = 0.11 [0.03, 0.18], but there was no difference in reliance on other allomothers between unpartnered and partnered women in the US (Beta [95% CI] = −0.03 [−0.13, 0.06]). Similarly, repartnered women relied on other allomothers more than did partnered women in the US (Beta [95% CI] = 0.07 [−0.01, 0.15]), although the effect was unclear, but no difference in reliance on other allomothers was found in the UK (Beta [95% CI] = 0.02 [−0.04, 0.09]).
Running the models without the kin proximity and partner help covariates increased the impact of being unpartnered but did not significantly change the impact of being repartnered (see Section 4 for more details and Supplementary Materials for results). The increased effect of being unpartnered occurred when removing the partner help covariate, suggesting that the lack of a contribution from a partner partially, but not completely, explains the impact of being unpartnered on a mother’s allomaternal network.
To account for additional sources of childcare support available in HILF countries, we also modeled the link between partnership status and paid childcare. In both the UK and US, unpartnered women used more hours of paid childcare on a weekly basis than did partnered women (Beta [95% CI], UK = 5.34 [2.43, 8.40]; US = 6.61 [2.69, 10.42], Table 4). Repartnered women did not differ from partnered women in the number of hours of paid childcare in either the UK of the US (Beta [95% CI], UK = 0.49 [−2.30, 3.18]; US = 0.11 [−3.52, 3.68]).

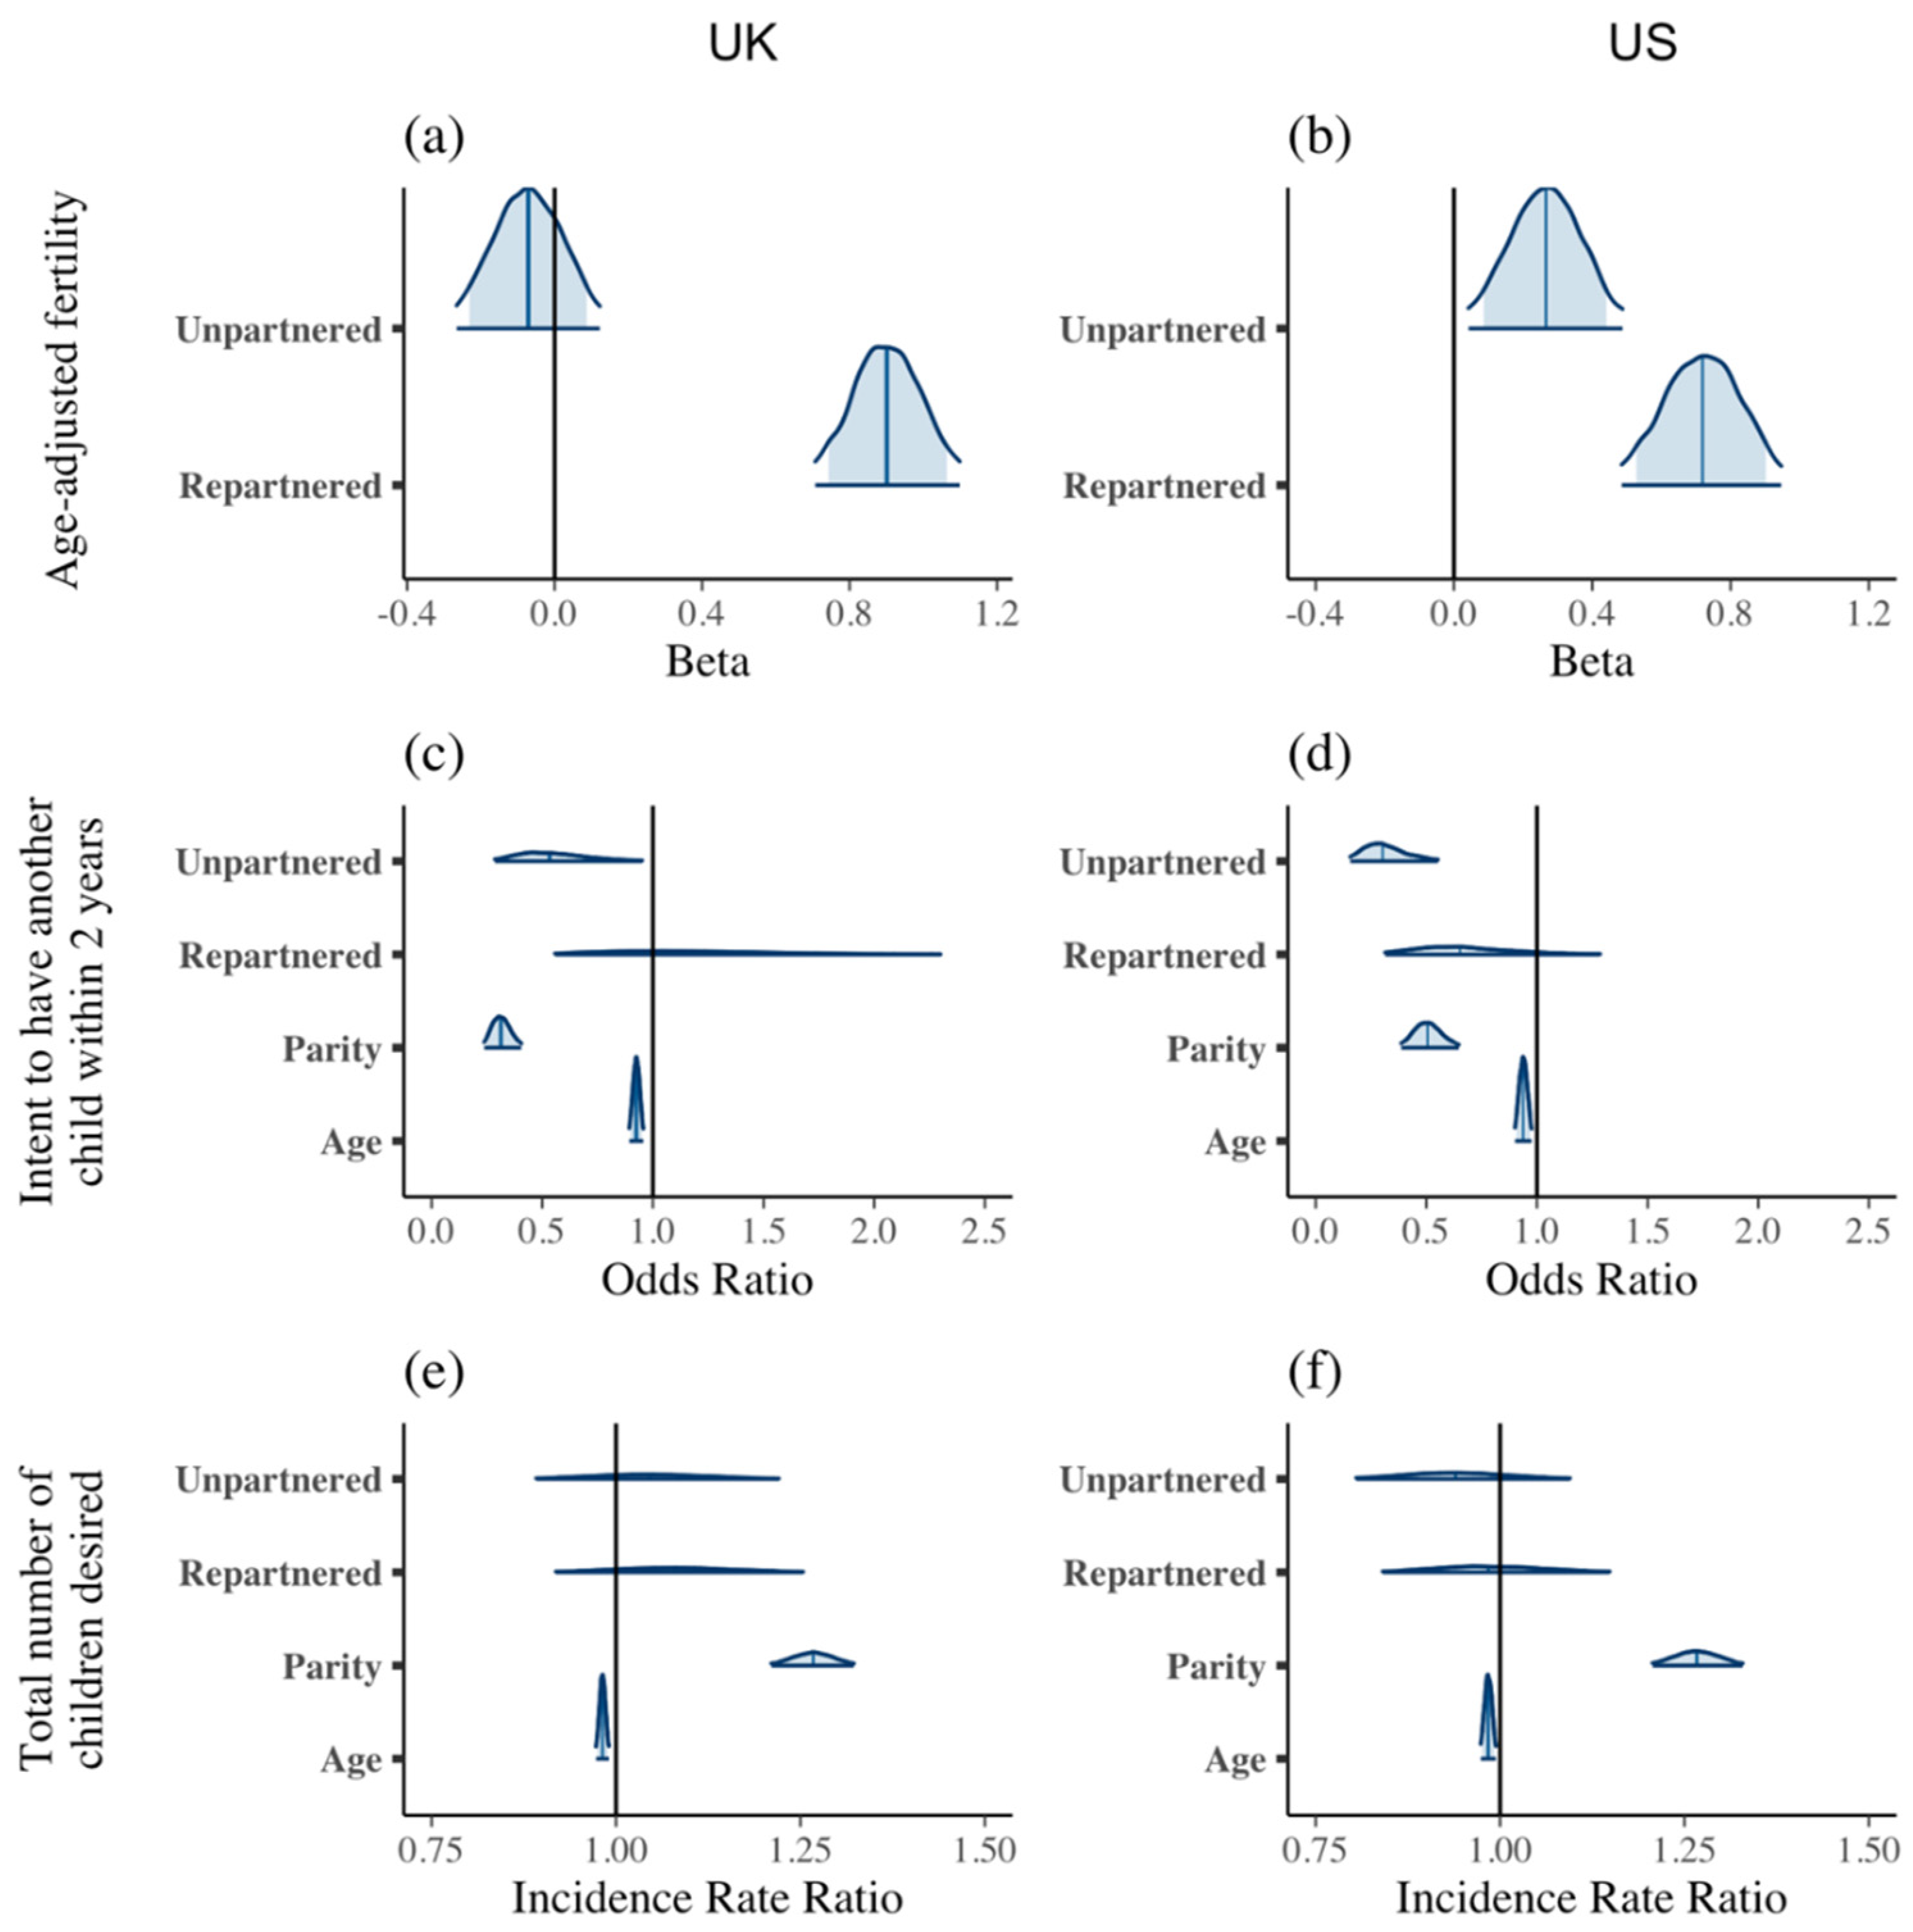
2.4. Partnership and Fertility (P4)

After describing support networks by women’s partnership status, we considered the link between partnership and fertility. In both the UK and the US, repartnered women had higher age-adjusted fertility (Beta [95% CI], UK = 0.90 [0.71, 1.10]; US = 0.72 [0.49, 0.95], Table 5, Figure 4). However, being unpartnered had no clear association with age-adjusted fertility in the UK (Beta [95% CI] = −0.07 [−0.27, 0.12]), while in the US unpartnered women had higher age-adjusted fertility (Beta [95% CI] = 0.27 [0.04, 0.49]). Unpartnered women were less likely to plan to have another baby within the next two years than partnered women in both countries (OR [95% CI], UK = 0.53 [0.29, 0.95]; US = 0.30 [0.16, 0.55]). Repartnered women were neither more nor less likely to plan to progress to the next birth within two years relative to partnered women (OR [95% CI], UK = 1.15 [0.56, 2.30]; US = 0.65 [0.31, 1.29]). When examining desired number of births, in both the UK and the US, neither unpartnered (IRR [95% CI], UK = 1.05 [0.89, 1.22]; US = 0.94 [0.80, 1.09]) nor repartnered (IRR [95% CI], UK = 1.08 [0.92, 1.25]; US = 0.98 [0.84, 1.15]) women seemed to differ from partnered women in fertility intentions.
Overall, unpartnered women showed somewhat higher age-adjusted fertility than partnered women in the US, and while in both countries unpartnered women were less likely to be planning a new child in the near future, they did not differ from partnered women in their total fertility desires. Repartnered women, however, had higher age-adjusted fertility relative to partnered women, although they did not differ from them in either their short- or long-term fertility intentions.

2.5. Allomothering and Fertility (P5)

Finally, we described the link between allomaternal support and fertility. The overall amount of childcare help received by the mother had no relationship with age-adjusted fertility in either the UK (Beta [95% CI] = 0.00 [0.00, 0.00], Table 6, Figure 5) or the US (Beta [95% CI] = 0.00 [0.00, 0.00]). The overall number of helpers (including the partner) did show a relationship with fertility and differed between the UK and the US. In the UK, the number of helpers was negatively associated with age-adjusted fertility (Beta [95% CI] = −0.04 [−0.08, −0.01]), while in the US, there was a slight positive relationship with age-adjusted fertility, although the effect was uncertain as the 95% credibility interval crossed zero ((Beta [95% CI] = 0.04 [−0.02, 0.10]).

3. Discussion

Our results emphasize the important contribution of partners to childcare in HILF settings and, in their absence, of maternal kin. Partners contribute nearly 75% of the nonmaternal care received by children when a mother has a partner (Figure 6). In the absence of a partner, unpartnered women rely heavily on a few high-investing maternal kin. Other helpers (the kin of the current or expartner, non-kin helpers) are also important for unpartnered mothers and contribute slightly more help for repartnered women than they do for partnered women. Even though mothers are flexible in the individuals from whom they obtain help, unpartnered women are not able to match the total level of help attained by currently partnered women. They may make up for this lower level of help by relying more heavily on paid sources of childcare. Lastly, while repartnership is associated with higher age-adjusted fertility, allomothering was not clearly associated with fertility: the number of helpers in the allomothering network was associated with fertility only in the UK, while the overall level of help was not associated with fertility in either country.
We predicted that second partners would invest less in childcare than first partners (P1). Results suggest that second partners were not less likely to be involved in childcare help in the home, but at least in the UK, they provided lower levels of help than did first partners in terms of instances of support in the past month. This was particularly the case when caring for a stepchild rather than a biological child. This pattern was not observed in the US, where levels of investments were similar for first and second partners, even when controlling for relationship to the child. It is possible that the similarity of partner investment levels between first and second partners in the US, even when differentiating between second partners caring for a biological child versus a stepchild, is due to the fact that these households include a mixture of biological and stepchildren. Studies in the US and St. Kitts have found that fathers in households with both biological children and stepchildren tend to invest similarly in both types of children, although they may feel less emotionally close to stepchildren (Cooksey and Fondell 1996; Gray and Brown 2015). Thus, if second partners caring for stepchildren in the US are living with both biological and stepchildren, there may be incentives to investing equally in both types of children. Small numbers of second partners caring for stepchildren (N = 16 in the UK and N = 18 in the US) prevent further differentiation between stepfathers caring for stepchildren in households where there are also biological children versus those where only stepchildren are present. While this could explain the similarity in partner investment in the US, it is not clear why the patterns of partner investment differ between the UK and the US. Stepfather investment in the UK is well studied from evolutionary perspectives, and studies consistently find that stepfathers tend to invest less than fathers (Lawson and Mace 2009; Emmott and Mace 2014). Our findings are consistent with this existing literature. It is possible that a greater degree of social support provided by the UK government means that the consequences of lower levels of partner investment are less important in the UK and thus that the incentives for second partner investment in childcare are not as strong as they are in the US.
We found some support for our prediction that unpartnered and repartnered women would receive more support from maternal kin (P2) and others (P3) than partnered women. Unpartnered, but not repartnered, mothers relied more heavily on maternal kin and on other helpers for childcare help than partnered women in both the UK and the US. The greater involvement of maternal kin in providing support to women following a divorce is consistent with the notion that family support is based on women’s needs, and has been demonstrated elsewhere (Scelza 2011; Coall et al. 2014; Snopkowski and Sear 2015). For unpartnered mothers, the most common maternal kin allomother was the child’s grandmother, and other helpers were most commonly nonrelated individuals or expartners. Allomothers who are unrelated to the mother, key helpers for unpartnered mothers, may be motivated to help with childcare if they can receive reciprocal help, childcare, or otherwise, in return (Denham 2015; Jaeggi et al. 2016; Page et al. 2019). While mothers are flexible in terms of the people from whom they seek out the help they need, the absence of the partner’s help is not completely offset by relying more heavily on other helpers: the mean help score for unpartnered women is 80, while both partnered and repartnered mothers had mean help scores above 130 (Table 1), meaning that partnered and repartnered mothers receive help with an average of 50 additional tasks per month than do unpartnered women. Coresidence of helpers may explain why mothers who are unpartnered receive less overall help, despite receiving higher levels of help from both maternal kin and other helpers. Studies have found that coresidence is correlated to higher likelihood that a grandparent, step-parent, or step-grandparent provides childcare help (Baydar and Brooks-Gunn 1998; Vandell et al. 2003; Pashos et al. 2016), and higher levels of investment from the biological father (Lancaster and Kaplan 2000; Pashos et al. 2016). Further, most childcare help to single mothers comes from household members (Clarke et al. 2017). In other words, partnered and repartnered mothers can leverage more regular help from a coresident and available helper such as the partner, whereas unpartnered mothers without coresident help are not able to mobilize helpers as regularly.
Again in partial support of P2 and P3, mothers who were repartnered reported lower levels of support from maternal kin but higher levels of support from other helpers in both the UK and the US relative to partnered mothers. The lower investment from maternal kin is unexpected, because the genetic relationship between maternal kin and the mother’s children from a first or second union remains the same, and inclusive fitness theory would suggest that maternal kin would show similar investment in children from first or second unions. However, the lower investments of maternal kin investment in repartnered mothers may be a response to their increased contribution during the time between partnerships. That is, maternal kin may see the mother’s new partner as a source of support for her, and accordingly readjust their level of support based on their new perception of her needs. The higher level of help obtained from other helpers for repartnered mothers relative to partnered mothers may reflect an expansion of the allomothering network during the unpartnered phase to rely more heavily on reciprocal relationships with non-kin, which persists into a second partnership. Alternatively, the higher level of help from other partners for repartnered mothers may also be due to the expansion of her allomothering network to include the new partner and his kin.
Our prediction that fertility behavior and intentions would be higher among repartnered women than unpartnered or partnered women was supported, as being repartnered was clearly associated with higher fertility (P4). However, repartnership was not predictive of fertility desires as measured by intent to progress to another child within two years nor by the total of number of children desired. This suggests that although repartnered women do not state a preference for more children than other women, they do in fact achieve a higher fertility for their age. Because our sample is still in an active reproductive phase, it is possible that the higher age-adjusted fertility of repartnered women reflects an earlier schedule of reproduction (i.e., starting and completing reproduction earlier in life) rather than a higher complete fertility. However, other studies from HILF countries find that repartnering increases fertility (Balbo et al. 2013), and that remarried couples desire a child together regardless of pre-existing children (Vikat et al. 1999). While research in lower- and middle-income countries suggests that remarriage increases fertility desires (John 2018; Elleamoh and Dake 2019; Akinyemi et al. 2021), there is little recent research on the impact of repartnership on fertility desires in HILF countries. If repartnering does in fact increase completed fertility, as our data and other studies suggest, the lack of difference in stated fertility preferences could mean either that repartnered women have more children than they desire to, perhaps because men tend to state similar or higher fertility preferences than women (Sear and Coall 2011), or because women with only one partner underachieve their fertility desires, as has been documented elsewhere (Morgan and Rackin 2010; Sear et al. 2016; Beaujouan and Berghammer 2019). It is not possible to tell from our data whether the higher fertility of repartnered women is due to women who have more children being more likely to repartner upon becoming single, or because women who repartner go on to have additional children with their new partner. In the case of the former, single mothers with more children may seek to repartner, in part, because a new partner may contribute childcare or other forms of support. On the other hand, partners may be willing to perform these duties as a form of mating investment (Anderson 2000; Lancaster and Kaplan 2000), and mothers may be motivated to cement their new relationship by having a baby, both of which could result in the latter possibility (i.e., that repartnering causes more children). The latter is at least partially supported by our findings: 77% of repartnered women had at least one child with a second partner, suggesting their higher fertility was partially influenced by post-repartnering births.
Finally, we found no clear evidence for our prediction that receiving childcare help or the size of the allomothering network is positively correlated with fertility (P5). A positive relationship between help and fertility is predicted by the cooperative breeding hypothesis, but studies in less market integrated settings have found both positive (Forrester 2020) or no relationship (Kramer and Veile 2018) between allomothering and fertility outcomes. However, this does not necessarily mean that allomothering does not increase fertility in the UK or the US. We did not assess interbirth intervals in this analysis and thus cannot conclude as to whether allomothering does or does not shorten interbirth intervals, a key prediction of the cooperative breeding hypothesis in non-industrialized settings. There may also be a nonlinear relationship between allomothering and fertility that was not captured in this analysis. For example, it is possible that receiving less than a certain level of support may suppress fertility but that receipt of additional support beyond that threshold does not substantially affect fertility levels. Additionally, all of the respondents to our survey had children under the age of 5 years and were thus still in the reproductive periods of their lives; therefore, it is possible that those receiving more allomothering support may still progress to higher order births. Alternatively, the relationship between allomothering and fertility may be altered in HILF settings relative to traditional societies because of an overall lower fertility rate following the demographic transition. For example, Schaffnit and Sear (2017a, 2017b) suggested that in their analyses of data from the Netherlands and the United Kingdom, emotional support for the mother was more important than physical support in determining progression to a next birth perhaps because practical support is more likely to be needs based. Further, across HILF countries, women may use allomaternal support to return to work rather than to have another child (Sear and Coall 2011; Schaffnit and Sear 2017a). Lastly, and importantly, our study looked at cross-sectional measures of allomothering for a single focal child. It is conceivable that shifts in allomothering over time or in cumulative help over several children may reveal a clearer relationship between allomothering and fertility.
In HILF settings, paid allomothers such as babysitters and government sources of care (e.g., subsidized daycares and schools) are important sources of support for mothers (Allen 2003). Unfortunately, due to our data collection procedures we could not integrate our data on paid care with those for the allomothering network. However, analyses indicate that unpartnered mothers, who receive less total allomaternal support than either partnered or repartnered women, use a mean of about 5 and 6 more hours of paid care a week than do partnered women in the UK and the US, respectively. Our model also suggests that higher household income quintile and higher education are associated with greater use of paid care. Given that unpartnered women are actually more likely to report lower household incomes and lower levels of education, the fact that they report using more paid care suggests that they are doing so out of need for childcare help, rather than because they have the economic means to do so. It is important to note that the focal children in this study were all under the age of 5 years, meaning that none of them were yet attending primary school.
While our discussion has focused on the association of partnership status with allomothering and fertility, our models also controlled for several sociodemographic indicators that may be of interest to other researchers. Importantly, in our sample unpartnered women tended to be part of lower household income quintiles and have lower level of educational attainment relative to partnered women. These differences in socioeconomic status, combined with lower overall childcare help scores, suggest that unpartnered women may be carrying a double burden of performing a greater amount of care work while having fewer socioeconomic resources to do so.
Women in this study reported similar allomothering networks sizes as studies from low-income settings including Bangladesh (Lynch et al. Forthcoming) and urban Nairobi (Clarke et al. 2017). Respondents in this survey reported an average of 1.81 helpers (median = 1), and 171 of them (11%) reported receiving help from no one. Mothers in Matlab, Bangladesh, a rural agricultural region undergoing market transition and fertility decline, reported receiving childcare help from an average of 1.97 people (median = 2), with 10.5% of women receiving childcare help from no others (Lynch et al. Forthcoming). Mothers residing in urban slums in Nairobi received childcare help from an average of 1.4 kin helpers, with 31% receiving no help from kin at all (Clarke et al. 2017). The Nairobi study is not completely comparable to ours, since data were only collected on care provided by kin, but overall, both studies show sizes of allomothering networks that are roughly comparable to ours. Support networks in these studies are drastically different than those in forager populations where children can expect to be cared by anywhere from 5 to 20 caregivers besides their mothers (Hewlett and Lamb 2005; Meehan 2009; Meehan et al. 2013; Ivey 2000). It is possible that this difference is due to the method of data collection, which typically consists of observed interaction in foraging groups, whereas it is recalled through survey questions in our study as well as those in Bangladesh and Nairobi. However, the similarity in the size of allomaternal networks in Bangladesh and Nairobi versus the US and the UK, contexts that vary in terms of state-provided childcare options and market integration, is surprising. Emmott (2016) has suggested that a shift to agricultural subsistence strategies shifted a greater burden of childcare to mothers, and this appears to be exemplified by the Bangladeshi data. However, it could be that communal living in foraging societies and decreased market integration, rather than subsistence strategy, are the drivers behind larger allomaternal networks. Indeed, Ngandu farmers tend to have smaller allomothering networks than nearby foragers; however, infants still have access to an average of 10.9 alloparents (Meehan 2009), and Sidama infants, an agropastoralist group in Ethiopia, are documented to average 10.8 caretakers (Helfrecht et al. 2020). Quantification of allomothering networks and crosscultural exploration of the drivers affecting their size and composition merits greater study.
In this analysis, we demonstrate the key roles played by fathers and partners in contemporary families by showing that when they are available, partners provide the bulk of nonmaternal care received by children. However, we also show that mothers continue to draw on childcare help from allomothers outside of the pair-bond, particularly from their kin. As Sear (2021) has argued, the notion of the traditional family as a nuclear independent economic unit is inaccurate cross-culturally and historically. The narrative that the modern mother should be able to balance work duties with caring for their families effortlessly can be harmful. The impact of partnership on allomaternal support is of interest not only for understanding family dynamics in HILF countries but also for understanding these in any society past or present where serial monogamy exists. Applying a human behavioral ecological lens to studies on family dynamics in HILF countries helps shed light on how human reproduction responds to socioecological pressures both past and present.

4. Materials and Methods

Data from this study were collected from an online survey of women conducted in August of 2020 through Prolific, an online platform connecting researchers with participants. Due to its focus on connecting researchers and participants, ease of use, and clear rules for compensation, Prolific has been argued to achieve more naïve and diverse participant pools and yield higher data quality compared to similar platforms such as MTurk (Peer et al. 2017; Palan and Schitter 2018). Women were eligible for participating in the survey if they resided in either the UK or the US and had at least one child under the age of five at the time of survey. Mothers were asked about their residential proximity to kin, close social networks, and reproductive history, as well as questions regarding who provides them with help in taking care of a focal child. Helpers were defined as anyone providing help, including the child’s biological father and/or the mother’s current partner, but excluding any paid or state-provided help such as nannies, teachers, or care-aids. For each helper, the mother provided her relationship to the helper, and the frequency with which they performed several childcare tasks (daily, weekly, monthly, less than monthly, or never). Mothers were asked to provide an average number of hours weekly that the child spent in paid childcare. In all cases, we asked mothers to describe their practices prior to the onset of the COVID-19 pandemic, five or six months prior to the survey, in order to minimize the impact of closures and restrictions on our results. Mothers were compensated 1.25 GBP, or roughly 1.63 USD for completing the questionnaire, the Prolific-suggested rate for roughly 10 min of participation time. The survey and sampling strategies were approved by the University of Otago Human Ethics Committee (reference number: D20/242). A copy of the survey administered is available in the Supplementary Materials. We excluded responses where the mother indicated her first birth had occurred prior to 15 years of age (n = 4), responses where the mother failed the attention-check question (n = 159), and responses that showed low effort, for example not completing demographic questions (n = 6). After exclusions, the final sample available for analysis consisted of 1528 women, 919 from the UK, and 609 from the US.
Help provided to mothers was assessed with the following measures calculated from the responses: the number of people of each type (partners, maternal kin, and others, see below) she received help from, the frequency of help they provided (referred to as “level” of support), and the percentage of total help that was received from that type of helper. Paternal kin help could not be examined separately because the survey did not clearly differentiate between paternal and step-paternal kin; thus, these helpers are included in the category of “other helpers”. The level of help was operationalized using mothers’ reports of how often (daily, weekly, monthly, less than monthly, or never) each person helped with five childcare tasks (changing/washing, feeding, playing, supervising, and unspecified other tasks), which were adapted from the Avon Longitudinal Study of Parents and Children (Golding et al. 2001; Lawson and Mace 2009). These were converted to an estimate of the number of days per month each type of help was provided. We estimated that daily help with a task would be provided almost every day (score of 28 days per month); that weekly help could be provided as much as twice a week (score of 8 days per month); that monthly help could be provided up to twice a month (score of 2 days per month); and that less than monthly or never would not be provided regularly (score of 0 days per month). These scores are roughly analogous to scoring the help frequency on a scale from 1 to 5, which has been used in other analyses (Lawson and Mace 2009). The level-of-help scores were then summed across categories of helpers to create an overall support score—higher scores represented higher levels of support from allomothers. To ensure that our results were robust to our operationalization scheme, we also tested two alternative measures of support. First, we used the same scoring scheme but used only the frequency of supervision, as supervision could theoretically include instances of other types of care. Second, we tried a different operationalization scheme, categorizing a type of help as either occurring daily (1) or not (0). These alternative models are reported in the Supplementary Materials and provide substantively similar results to those presented below.
Three measures were used to assess fertility behavior: age-adjusted fertility, intent to have another child within the next two years, and total number of children desired. Age-adjusted fertility was calculated as the residual of a linear regression of number of births on age. Age-adjusted fertility, rather than raw number of births, was used as the primary measure of fertility because the average age of the respondents was in the early thirties (mean = 32.5, SD = 5.3), meaning that a substantial proportion of the study sample may not have completed their fertility.
The main predictor used in the models was partnership status. We categorized this as partnered, unpartnered, and repartnered. If women indicated that they were currently married or cohabiting with a partner, they were categorized as either partnered or repartnered, and if not, they were categorized as unpartnered. If a woman indicated that she was currently married or cohabiting with a partner and all of her children’s biological fathers were her current partner, she was categorized as partnered, and otherwise she was categorized as repartnered. All analyses considered partnered women as the reference category, and effects for unpartnered and repartnered women were relative to partnered women. Models predicting likelihood and level of partner involvement were restricted to partnered and repartnered women. In analyzing partner involvement, we included one model evaluating the impact of biological relatedness to the child on likelihood of partner involvement. In this case, second partners were categorized as either biological fathers or stepfathers, and effects for these categories were relative to first partners who were also biological fathers. In all analyses, we included the following sociodemographic covariates for the mother: age, whether she indicated a religious affiliation, highest educational attainment, whether she was born in the country of residence (nativity), ethnicity (coded as white or other), household income quintile, and level of urbanization (village, town, or urban center). All models for partner, maternal kin, and other allomother investment controlled for age of the focal child, the number of hours weekly that the child spent in paid care, and the total number of children (biological or not) residing in the mother’s home. Models for partner investment controlled for the number of kin residing within an hour’s travel of the mother’s residence. Models for maternal kin and other allomother investment controlled for the level of partner help and the number of maternal kin residing within an hour’s travel from the mother’s residence. Since the level of partner help and the number of maternal kin residing nearby were likely related to partnership status, we also ran the partner, maternal kin, and other allomother models without these covariates and report the results in the Supplementary Materials. In the models analyzing intent to have another child and total number of children desired, we adjusted for maternal age and parity.
Data were modeled with multivariate Bayesian regression models using the brms package (Bürkner 2017) in R (R Core Team 2020). Models were built with a Gaussian distribution for age-adjusted fertility, a Poisson distribution for the total number of children desired and for models estimating both the number of helpers and level of help provided to the mother, and a Bernoulli distribution for the desire to have a child within the next two years and for models examining the likelihood of partner help. These were created for the countries separately, as the US and UK are known to differ in their fertility patterns and have different levels of state-provided childcare support for families. Full model specifications are available in the Supplementary Materials, and the data and scripts used in this analysis are available on the project OSF page at: https://osf.io/zpu5f/ (accessed on 17 May 2021).

Supplementary Materials

Supplementary Materials are available online at https://0-www-mdpi-com.brum.beds.ac.uk/article/10.3390/socsci10050182/s1. Data and scripts are available on the project OSF page at https://osf.io/zpu5f/ (accessed on 17 May 2021).

Author Contributions

Conceptualization, L.S., J.H.S., S.B.S., R.S. (Rebecca Sear), M.K.S., R.S. (Richard Sosis); methodology, L.S., J.H.S., S.B.S.; formal analysis, L.S.; data curation, L.S.; writing—original draft preparation, L.S., J.H.S.; writing—review and editing, L.S., J.H.S., S.B.S., R.S. (Rebecca Sear), M.K.S., R.S. (Richard Sosis); supervision, J.H.S.; project administration, R.S. (Rebecca Sear), M.K.S., R.S. (Richard Sosis), J.H.S.; funding acquisition, R.S. (Rebecca Sear), J.H.S., M.K.S., R.S. (Richard Sosis). All authors have read and agreed to the published version of the manuscript.

Funding

This research was funded by the John Templeton Foundation, grant number 61426.

Data Availability Statement

The data used in this study are publicly available at: https://osf.io/zpu5f/ (accessed on 17 May 2021).

Acknowledgments

The authors would like to thank Anushé Hassan and Joseph Watts for providing feedback during survey design; Anne-Cathrine Petersen for administrative support of this project; and Robert Lynch for providing summary statistics for the size of allomothering networks in Bangladesh.

Conflicts of Interest

The authors declare no conflict of interest. The funders had no role in the design of the study; in the collection, analyses, or interpretation of data; in the writing of the manuscript, or in the decision to publish the results.

References

  1. Akinyemi, Joshua O., Rotimi F. Afolabi, Olutosin A. Awolude, and E. Afolabi Bamgboye. 2021. Demography of remarriage and fertility desire among women receiving antiretroviral therapy in South West Nigeria. African Journal of AIDS Research 20: 15–24. [Google Scholar] [CrossRef] [PubMed]
  2. Allen, Susan F. 2003. Working parents with young children: Cross-national comparisons of policies and programmes in three countries. International Journal of Social Welfare 12: 261–73. [Google Scholar] [CrossRef]
  3. Anderson, Kermyt G. 2000. The life histories of American stepfathers in evolutionary perspective. Human Nature 11: 307–33. [Google Scholar] [CrossRef] [PubMed]
  4. Balbo, Nicoletta, Francesco C. Billari, and Melinda Mills. 2013. Fertility in advanced societies: A review of research. European Journal of Population 9: 1–38. [Google Scholar] [CrossRef] [Green Version]
  5. Baydar, Nazli, and Jeanne Brooks-Gunn. 1998. Profiles of grandmothers who helps care for their grandchildren in the United States. Family Relations 47: 385–93. [Google Scholar] [CrossRef]
  6. Beaujouan, Eva, and Caroline Berghammer. 2019. The gap between lifetime fertility intentions and completed fertility in Europe and the United States: A cohort approach. Population Research and Policy Review 38: 507–35. [Google Scholar] [CrossRef] [Green Version]
  7. Bogin, Barry. 1997. Evolutionary hypotheses for human childhood. Yearbook of Physical Anthropology 40: 62–89. [Google Scholar] [CrossRef] [Green Version]
  8. Bürkner, Paul C. 2017. Brms: An R package for Bayesian multilevel models using Stan. Journal of Statistical Software 80: 1–28. [Google Scholar] [CrossRef] [Green Version]
  9. Clarke, Lynda, Elizabeth C. Cooksey, and Georgia Verropoulou. 1998. Fathers and absent fathers: Sociodemographic similarities in Britain and the United States. Demography 35: 217–28. [Google Scholar] [CrossRef]
  10. Clarke, Shelley, Sangeetha Madhavan, Cassandra Cotton, Donatien Beguy, and Caroline Kabru. 2017. Who helps single mothers in Nairobi? The role of kin support. Journal of Marriage and Family 79: 1186–204. [Google Scholar] [CrossRef] [Green Version]
  11. Coall, David A., Sonja Hilbrand, and Ralph Hertwig. 2014. Predictors of grand-parental investment decisions in contemporary Europe: Biological relatedness and beyond. PLoS ONE 9: e84082. [Google Scholar] [CrossRef]
  12. Cooksey, Elizabeth C., and Michelle M. Fondell. 1996. Spending time with his kids: Effects of family structure on fathers’ and children’s lives. Journal of Marriage and the Family 58: 693–707. [Google Scholar] [CrossRef]
  13. Crittenden, Alyssa N., and Frank W. Marlowe. 2008. Allomaternal care among the Hadza of Tanzania. Human Nature 19: 249–62. [Google Scholar] [CrossRef] [PubMed]
  14. Denham, Woodrow W. 2015. Alyawarra kinship, infant carrying, and alloparenting. Mathematical Anthropology and Culture Theory 8: 101. [Google Scholar]
  15. Elleamoh, Gertrude E., and Fidelia A. A. Dake. 2019. “Cementing” marriages through childbearing in subsequent unions: Insight into fertility differentials among first-time married and remarried women in Ghana. PLoS ONE 14: e0222994. [Google Scholar] [CrossRef]
  16. Emmott, Emily H. 2015. Allomaternal Investments and Child Outcomes in the United Kingdom. Ph.D. dissertation, University College of London, London, UK. [Google Scholar]
  17. Emmott, Emily H. 2016. Access to alloparents. In Encyclopedia of Evolutionary Psychological Science. Edited by Todd Shackelford and Viviana Weekes-Shackelford. Berlin and Heidelberg: Springer. [Google Scholar] [CrossRef]
  18. Emmot, Emily H., and Ruth Mace. 2014. Direct investment by stepfathers can mitigate effects on educational outcomes but does not improve behavioural difficulties. Evolution and Human Behavior 35: 438–44. [Google Scholar] [CrossRef] [Green Version]
  19. Emmott, Emily H., and Ruth Mace. 2020. Why the Son-bias in Caregiving? Testing Sex-differences in the Associations Between Paternal Caregiving and Child Outcomes in England. Journal of Family Issues 42: 1354–83. [Google Scholar] [CrossRef]
  20. Emmott, Emily H., and Abigail E. Page. 2019. Alloparenting. In Encyclopedia of Evolutionary Psychological Science. Edited by Todd Shackelford and Viviana Weekes-Shackelford. Berlin and Heidelberg: Springer. [Google Scholar]
  21. Flouri, Eirini, and Ann Buchanan. 2004. Early father’s and mother’s involvement and child’s later educational outcomes. British Journal of Educational Psychology 74: 141–53. [Google Scholar] [CrossRef] [Green Version]
  22. Forrester, Deanna L. 2020. The Value of Children: Alloparenting in Samoa. Ph.D. dissertation, University of Lethbridge, Lethbridge, AB, Canada. [Google Scholar]
  23. Furstenberg, Frank F., Lauren E. Harris, Luca Maria Pesando, and Megan N. Reed. 2020. Kinship practices among alternative family forms in Western industrialized societies. Journal of Marriage and Family 82: 1403–30. [Google Scholar] [CrossRef]
  24. Geary, David C. 2000. Evolution and the proximate expression of human paternal investment. Psychological Bulletin 126: 55–77. [Google Scholar] [CrossRef] [PubMed] [Green Version]
  25. Golding, Jean, Marcus Pembrey, Richard Jones, and ALSPAC Study Team. 2001. ALSPAC—The Avon Longitudinal Study of Parents and Children I. Study methodology. Paediatric and Perinatal Epidemiology 15: 74–87. [Google Scholar] [CrossRef]
  26. Gray, Peter B., and Elizabeth Brogdon. 2017. Do step- and biological grandparents show differences in investment and emotional closeness with their grandchildren? Evolutionary Psychology 15: 1–9. [Google Scholar] [CrossRef] [Green Version]
  27. Gray, Peter B., and Eulynis Brown. 2015. Fatherhood in St. Kitts: Patterns and predictors of partnership and paternal dynamics in a Caribbean Island. Fathering 13: 18–35. [Google Scholar]
  28. Hamilton, William D. 1964. The genetical evolution of social behavior I. Journal of Theoretical Biology 7: 1–16. [Google Scholar] [CrossRef]
  29. Harris, Kathleen M., Frank F. Furstenberg, and Jeremy K. Marmer. 1998. Paternal involvement with adolescents in intact families: The influence of fathers over the life course. Demography 35: 201–16. [Google Scholar] [CrossRef]
  30. Helfrecht, Courtney, Jennifer W. Roulette, Avery Lane, Birhanu Sintayehu, and Courtney L. Meehan. 2020. Life history and socioecology of infancy. American Journal of Physical Anthropology 173: 619–29. [Google Scholar] [CrossRef] [PubMed]
  31. Henrich, Joseph, Steven J. Heine, and Ara Norenzayan. 2010. The weirdest people in the world? Behavoral and Brain Sciences 33: 61–83. [Google Scholar] [CrossRef]
  32. Hewlett, Barry S. 1993. Intimate Fathers: The Nature and Context of Aka Pygmy Paternal Infant Care. Ann Arbor: University of Michigan Press. [Google Scholar]
  33. Hewlett, Barry S., and Michael E. Lamb. 2005. Hunter-Gatherer Childhoods: Evolutionary, Developmental, and Cultural Perspectives. London: Routledge. [Google Scholar]
  34. Hill, Kim, and Hillard Kaplan. 1999. Life history traits in humans: Theory and empirical studies. Annual Review of Anthropology 28: 397–430. [Google Scholar] [CrossRef] [Green Version]
  35. Hrdy, Sarah Blaffer. 2009. Mothers and Others: The Evolutionary Origins of Mutual Understanding. Cambridge: Harvard UP. [Google Scholar]
  36. Ivey, Paula K. 2000. Cooperative Reproduction in Ituri Forest Hunter-Gatherers: Who Cares for Efe infants? Current Anthropology 41: 856–66. [Google Scholar] [CrossRef]
  37. Jaeggi, Adrian V., Paul L. Hooper, Bret A. Behein, Hillard Kaplan, and Michael Gurven. 2016. Reciprocal exchange patterned by market forces helps explain cooperation in a small-scale society. Current Biology 26: 2180–87. [Google Scholar] [CrossRef] [PubMed] [Green Version]
  38. Jappens, Maaike, and Jan Van Bavel. 2016. Parental divorce, residence arrangements, and contact between grandchildren and grandparents. Journal of Mariage and Family 78: 451–67. [Google Scholar] [CrossRef]
  39. Jeynes, William H. 2014. A meta-analysis: The relationship between father involvement and student academic achievement. Urban Education 50: 387–423. [Google Scholar] [CrossRef]
  40. John, Benson. 2018. On Marriage Dynamics and Fertility in Malawi: How Does Remarriage Affect Fertility Preferences and Childbearing Behaviour? Master’s thesis, University of Cape Town, Cape Town, South Africa. [Google Scholar]
  41. Kaplan, Hillard, Jane B. Lancaster, W. Troy Tucker, and Kermyt G. Anderson. 2002. Evolutionary approach to below replacement fertility. American Journal of Human Biology 14: 233–56. [Google Scholar] [CrossRef] [PubMed]
  42. Kramer, Karen L. 2010. Cooperative breeding and its significance to the demographic success of humans. Annual Review of Anthropology 39: 417–36. [Google Scholar] [CrossRef] [Green Version]
  43. Kramer, Karen L. 2019. How there got to be so many of us: The evolutionary story of population growth and a life history of cooperation. Journal of Anthropological Research 75: 472–97. [Google Scholar] [CrossRef]
  44. Kramer, Karen L., and Amanda Veile. 2018. Infant allocare in traditional societies. Physiology and Behavior 193A: 117–26. [Google Scholar] [CrossRef]
  45. Lancaster, Jane B., and Hillard S. Kaplan. 2000. Parenting other men’s children: Costs, benefits, and consequences. In Adaptation and Human Behavior. Edited by Lee Cronk, Napoleon Chagnon and William Irons. London: Routledge, pp. 179–201. [Google Scholar]
  46. Lawson, David W., and Ruth Mace. 2009. Trade-offs in modern parenting: A longitudinal study of sibling competition for parental care. Evolution and Human Behavior 30: 170–83. [Google Scholar] [CrossRef]
  47. Lundberg, Shelley. 2005. Sons, daughters, and parental behavior. Oxford Review of Economic Policy 21: 340–56. [Google Scholar] [CrossRef]
  48. Lynch, Robert F., Susan B. Schaffnit, and Mary K. Shenk. Forthcoming. Religiosity increases the size and kin density of women’s social networks in a country undergoing rapid market integration. In preparation.
  49. Lynn, Mark G., John H. Grych, and Gregory M. Fosco. 2016. Influences on father involvement: Testing for unique contribution of religion. Journal of Child and Family Studies 25: 3247–59. [Google Scholar] [CrossRef]
  50. Marlowe, Frank. 2000. Paternal investment and the human mating system. Behavioural Processes 51: 45–61. [Google Scholar] [CrossRef]
  51. Mathews, Paul, and Rebecca Sear. 2013a. Does the kin orientation of a British woman’s social network influence her entry into motherhood? Demographic Research 28: 313–40. [Google Scholar] [CrossRef]
  52. Mathews, Paul, and Rebecca Sear. 2013b. Family and fertility: Kin influence on the progression to a second birth in the British Household Panel Study. PLoS ONE 8: e5691. [Google Scholar] [CrossRef] [PubMed]
  53. Meehan, Courtney L. 2005. The effects of residential locality on parental and alloparental investment among the Aka foragers of the Central African Republic. Human Nature 16: 58–80. [Google Scholar] [CrossRef] [Green Version]
  54. Meehan, Courtney L. 2009. Maternal time allocation in two cooperative childrearing societies. Human Nature 20: 375–93. [Google Scholar] [CrossRef]
  55. Meehan, Courtney L., Robert Quinland, and Courtney D. Malcolm. 2013. Cooperative breeding and maternal energy expenditure among Aka foragers. American Journal of Human Biology 25: 42–57. [Google Scholar] [CrossRef] [PubMed]
  56. Meehan, Courtney L., Courtney Helfrecht, and Courtney D. Malcolm. 2014. Implication of lengthy development and maternal life history: Allomaternal investment, peer relationships, and social networks. In Childhood: Origins, Evolution, & Implications. Edited by Courtney L. Meehan and Alyssa N. Crittenden. Santa Fe: School for Advanced Research Press. [Google Scholar]
  57. Morgan, S. Philip, and Heather Rackin. 2010. The correspondence between fertility intentions and behavior in the United States. Population and Development Review 36: 91–118. [Google Scholar] [CrossRef] [Green Version]
  58. Murphy, Michael. 2008. Variations in kinship networks across geographic and social space. Population and Development Review 34: 19–49. [Google Scholar] [CrossRef]
  59. Nettle, Daniel. 2008. Why do some dads get more involved than others? Evidence from a large British cohort. Evolution and Human Behavior 29: 416–23.e1. [Google Scholar] [CrossRef]
  60. Newson, Lesley, Tom Postmes, S. E. G. Lea, and Paul Webley. 2005. Why are modern families small? Toward an evolutionary and cultural explanation for the demographic transition. Personality and Social Psychology Review 9: 360–75. [Google Scholar] [CrossRef]
  61. Page, Abigail E., Matthew G. Thomas, Daniel Smith, Mark Dyble, Sylvain Viguier, Nikhil Chaudhary, Gul Deniz Salali, James Thompson, Ruth Mace, and Andrea B. Migliano. 2019. Testing adaptive hypotheses of alloparenting in Agta foragers. Nature Human Behaviour 3: 1154–63. [Google Scholar] [CrossRef]
  62. Pailhé, Ariane, Anne Solaz, and Maria Stanfors. 2021. The great convergence: Gender and unpaid work in Europe and the United States. Population and Development Review 47: 181–217. [Google Scholar] [CrossRef]
  63. Palan, Stefan, and Christian Schitter. 2018. Prolific.ac—A subject pool for online experiments. Journal of Behavioral and Experimental Finance 17: 22–27. [Google Scholar] [CrossRef]
  64. Pashos, Alexander, Sascha Schwarz, and David F. Bjorklund. 2016. Kin investment by step-grandparents—More than expected. Evolutionary Psychology 14: 1474704916631213. [Google Scholar] [CrossRef] [Green Version]
  65. Peer, Eyal, Laura Brandimarte, Sonam Samat, and Alessandro Acquisti. 2017. Beyond the Turk: Alternative platforms for crowdsourcing behavioral research. Journal of Experimental Social Psychology 70: 153–63. [Google Scholar] [CrossRef] [Green Version]
  66. R Core Team. 2020. R: A Language and Environment for Statistical Computing. Vienna: R Foundation for Statistical Computing, Available online: https://www.R-project.org/ (accessed on 17 May 2021).
  67. Sadruddin, Aalyia F. A., Liliana A. Ponguta, Anna L. Zonderman, Kyle S. Wiley, Alyssa Grimshaw, and Catherine Panter-Brick. 2019. How do grandparents influence child health and development? A review. Social Science & Medicine 239: 112476. [Google Scholar] [CrossRef]
  68. Scelza, Brooke A. 2011. Female Mobility and Postmarital Kin Access in a Patrilocal Society. Human Nature 22: 377–93. [Google Scholar] [CrossRef]
  69. Schacht, Ryan, and Karen L. Kramer. 2019. Are we monogamous? A review of the evolution of pair-bonding in humans and its contemporary variation cross-culturally. Frontiers in Ecology and Evolution 7: 230. [Google Scholar] [CrossRef] [Green Version]
  70. Schaffnit, Susan B., and Rebecca Sear. 2014. Wealth modifies relationships between kin and women’s fertility in high-income countries. Behavioral Ecology 25: 834–42. [Google Scholar] [CrossRef] [Green Version]
  71. Schaffnit, Susan B., and Rebecca Sear. 2017a. Supportive families versus support from families: The decision to have a child in the Netherlands. Demographic Research 37: 414–54. [Google Scholar] [CrossRef] [Green Version]
  72. Schaffnit, Susan B., and Rebecca Sear. 2017b. Support for new mothers and fertility in the United Kingdom: Not all support is equal in the decision to have a second child. Population Studies 71: 345–61. [Google Scholar] [CrossRef]
  73. Sear, Rebecca. 2021. The male breadwinner nuclear family is not the ‘traditional’ human family, and promotion of this myth may have adverse health consequences. Philosophical Transactions of the Royal Society: Biological Sciences 376: 20200020. [Google Scholar] [CrossRef]
  74. Sear, Rebecca, and David Coall. 2011. How much does family matter? Cooperative breeding and the demographic transition. Population and Development Review 37: 81–112. [Google Scholar] [CrossRef] [PubMed]
  75. Sear, Rebecca, and Ruth Mace. 2008. Who keeps children alive? A review of the effects of kin on child survival. Evolution and Human Behavior 29: 1–18. [Google Scholar] [CrossRef] [Green Version]
  76. Sear, Rebecca, David Lawson, Hillard Kaplan, and Mary K. Shenk. 2016. Understanding variation in human fertility: What can we learn from evolutionary demography? Philosophical Transactions of the Royal Society B 371: 20150144. [Google Scholar] [CrossRef] [PubMed] [Green Version]
  77. Snopkowski, Kristin, and Rebecca Sear. 2015. Grandparental help in Indonesia is directed preferentially towards needier descendants: A potential confounder when exploring grandparental influences on child health. Social Science & Medicine 128: 105–14. [Google Scholar] [CrossRef]
  78. Snopkowski, Kristin, and Rebecca Sear. 2016. Does grandparental help mediate the relationship between kin presence and fertility? Demographic Research 34: 467–98. Available online: http://0-www-jstor-org.brum.beds.ac.uk/stable/26332043 (accessed on 17 May 2021). [CrossRef] [Green Version]
  79. Steinbach, Anja, and Merril Silverstein. 2019. Step-grandparent-step-grandchild relationships: Is there a “grand step-gap” in emotional closeness and contact? Journal of Family Issues 41: 1137–60. [Google Scholar] [CrossRef] [Green Version]
  80. Stulp, Gert, Rebecca Sear, and L. Barrett. 2016. The reproductive ecology of industrial societies, Part I: Why measuring fertility matters. Human Nature 27: 422–44. [Google Scholar] [CrossRef] [Green Version]
  81. Sussman, Marvin B. 1959. The Isolated Nuclear Family: Fact or Fiction. Social Problems 6: 333–40. [Google Scholar] [CrossRef]
  82. Turke, Paul W. 1989. Evolution and the demand for children. Population and Development Review 15: 61–90. [Google Scholar] [CrossRef]
  83. Vandell, Deborah L., Kathleen McCartney, Margaret Tresch Owen, Cathryn Booth, and Alison Clarke-Stewart. 2003. Variations in child care by grandparents during the first three years. Journal of Marriage and Family 65: 375–81. [Google Scholar] [CrossRef]
  84. Vikat, Andres, Elizabeth Thomson, and Jan M. Hoem. 1999. Stepfamily fertility in contemporary Sweden: The impact of childbearing before the current union. Population Studies 53: 211–55. [Google Scholar] [CrossRef]
  85. Wilcox, W. Bradford. 2002. Religion, convention, and paternal involvement. Journal of Marriage and Family 64: 780–92. [Google Scholar] [CrossRef]
  86. Zelinsky, Wilbur. 1971. The hypothesis of the mobility transition. Geographical Review 61: 219–49. [Google Scholar] [CrossRef]
Figure 1. Plots showing the posterior distributions (95% credibility intervals) for the major predictors and control variables in the models for partner investment in each country, using the following measures: (a,b) likelihood of partner involvement in childcare; (c,d) level of childcare help from the partner; and (e,f) likelihood of providing childcare help based on partner’s relationship to child. Reference category for repartnered is partnered women; reference category for women with a second partner or a step-dad (second partner caring for a step-child) is women with a first partner; kin nearby is entered as a continuous predictor.
Socsci 10 00182 g001
Figure 2. Plots showing the posterior distributions (95% credibility intervals) for the major predictors and control variables in the models for maternal kin allomother investment in each country, using the following measures: (a,b) number of maternal kin providing childcare; (c,d) total level of childcare help provided by maternal kin; and (e,f) percentage of total childcare help contributed by maternal kin. Reference category for unpartnered and repartnered women is partnered women; level of partner help and maternal kin nearby are entered as continuous predictors.
Socsci 10 00182 g002
Figure 3. Plots showing the posterior distributions (95% credibility intervals) for the major predictors and control variables in the models for other allomother investment in each country, using the following measures: (a,b) number of other allomothers providing childcare; (c,d) total level of childcare help provided by other allomothers; and (e,f) percentage of total childcare help contributed by other allomothers. Reference category for unpartnered and repartnered women is partnered women; level of partner help and maternal kin nearby are entered as continuous predictors.
Socsci 10 00182 g003
Figure 4. Plots showing the posterior distributions (95% credibility intervals) for the major predictors and control variables in the models for fertility outcomes using the following measures: (a,b) age-adjusted fertility; (c,d) intent to have another child within two years; and (e,f) total number of children desired. Reference category for unpartnered and repartnered women is partnered women; parity and age are entered as continuous predictors.
Socsci 10 00182 g004
Figure 5. Plots showing the posterior distributions (95% credibility intervals) for the major predictors and control variables in the models of age-adjusted fertility as a function of: (a,b) total level of childcare help received and (c,d) total number of allomothers in the allomaternal network. Reference category for unpartnered and repartnered women is partnered women; level of help and number of allomothers are entered as continuous predictors.
Socsci 10 00182 g005
Figure 6. Proportion of total childcare help received (as a number of tasks performed over the course of a month) by type of allomother, according to partnership status of the mother, for each country separately.
Socsci 10 00182 g006
Table 1. Participant characteristics by country of residence and partnership status. See Materials and Methods for details on calculating age-adjusted fertility and level of alloparental support.
UKUS
Partnered
(N = 768)
Unpartnered
(N = 82)
Repartnered
(N = 69)
Partnered
(N = 468)
Unpartnered
(N = 78)
Repartnered
(N = 63)
Age
Mean (SD)33.3 (5.07)32.0 (6.23)33.6 (5.99)31.1 (4.77)31.0 (6.81)33.5 (5.91)
Number of births
Mean (SD)1.59 (0.753)1.62 (0.911)2.61 (1.34)1.69 (0.819)1.96 (1.24)2.63 (1.22)
Age-adjusted fertility
Mean (SD)−0.185 (0.716)−0.0871 (0.854)0.816 (1.28)0.0321 (0.780)0.305 (1.15)0.845 (1.13)
Intent to have another child within two years
No473 (61.6%)60 (73.2%)53 (76.8%)234 (50.0%)60 (76.9%)48 (76.2%)
Yes295 (38.4%)22 (26.8%)16 (23.2%)234 (50.0%)18 (23.1%)15 (23.8%)
Total number of births desired
Mean (SD)2.37 (0.882)2.57 (1.10)3.30 (1.47)2.84 (1.18)2.90 (1.37)3.35 (1.38)
Receipt of any childcare help from partner
No127 (16.5%)82 (100%)18 (26.1%)96 (20.5%)78 (100%)13 (20.6%)
Yes641 (83.5%)0 (0%)51 (73.9%)372 (79.5%)0 (0%)50 (79.4%)
Number of maternal kin allomothers
Mean (SD)1.24 (0.883)0.317 (0.494)1.14 (0.912)1.10 (0.779)0.359 (0.738)1.32 (0.964)
Number of other allomothers
Mean (SD)0.518 (0.995)0.549 (0.688)0.551 (0.948)0.449 (0.793)0.808 (0.981)0.619 (1.07)
Total amount of childcare help
Mean (SD)136 (77.6)65.8 (63.7)127 (88.2)127 (78.4)94.5 (87.2)139 (80.0)
Amount of childcare help—partner
Mean (SD)101 (52.8)0 (0)87.6 (58.9)93.1 (55.9)0 (0)93.7 (56.5)
Amount of childcare help—maternal kin
Mean (SD)20.0 (37.5)40.0 (54.7)17.2 (33.2)15.3 (38.0)51.4 (62.2)11.3 (29.2)
Amount of childcare help—other helpers
Mean (SD)15.0 (35.6)25.8 (40.3)22.1 (48.3)18.9 (42.6)43.1 (69.3)34.0 (66.3)
Number of maternal kin residing nearby
Mean (SD)2.82 (2.34)3.68 (2.36)3.51 (2.51)2.22 (2.31)3.22 (1.92)2.44 (2.35)
Number of partner’s kin residing nearby
Mean (SD)2.68 (2.34)0 (0)2.71 (2.39)2.19 (2.29)0 (0)2.32 (2.15)
Age of focal child
Mean (SD)2.68 (1.28)2.88 (1.21)2.65 (1.27)2.72 (1.34)3.04 (1.13)2.90 (1.24)
Hours spent in paid care weekly
Mean (SD)11.9 (12.8)11.6 (12.2)8.61 (12.5)9.88 (14.3)12.2 (15.9)7.39 (14.1)
Missing0 (0%)0 (0%)0 (0%)2 (0.4%)0 (0%)1 (1.6%)
Number of children in home
Mean (SD)1.61 (0.767)1.57 (0.770)2.42 (1.08)1.73 (0.855)1.68 (0.919)2.25 (1.19)
Mother has a religious affiliation
No430 (56.0%)44 (53.7%)40 (58.0%)157 (33.5%)29 (37.2%)28 (44.4%)
Yes338 (44.0%)38 (46.3%)29 (42.0%)311 (66.5%)49 (62.8%)35 (55.6%)
Household income quintile
1 (lowest)20 (2.6%)34 (41.5%)1 (1.4%)17 (3.6%)16 (20.5%)8 (12.7%)
2116 (15.1%)27 (32.9%)25 (36.2%)81 (17.3%)35 (44.9%)12 (19.0%)
3198 (25.8%)14 (17.1%)21 (30.4%)153 (32.7%)15 (19.2%)26 (41.3%)
4363 (47.3%)6 (7.3%)19 (27.5%)108 (23.1%)10 (12.8%)10 (15.9%)
5 (highest)71 (9.2%)1 (1.2%)3 (4.3%)109 (23.3%)2 (2.6%)7 (11.1%)
Mother’s ethnicity
White684 (89.1%)63 (76.8%)65 (94.2%)353 (75.4%)45 (57.7%)49 (77.8%)
Other or mixed84 (10.9%)19 (23.2%)4 (5.8%)115 (24.6%)33 (42.3%)14 (22.2%)
Mother born in country of residence
No115 (15.0%)8 (9.8%)3 (4.3%)25 (5.3%)4 (5.1%)3 (4.8%)
Yes653 (85.0%)74 (90.2%)66 (95.7%)443 (94.7%)74 (94.9%)60 (95.2%)
Mother’s educational attainment
Primary1 (0.1%)2 (2.4%)0 (0%)3 (0.6%)1 (1.3%)0 (0%)
Secondary66 (8.6%)12 (14.6%)13 (18.8%)91 (19.4%)24 (30.8%)20 (31.7%)
Junior college207 (27.0%)35 (42.7%)30 (43.5%)56 (12.0%)17 (21.8%)22 (34.9%)
Undergraduate326 (42.4%)28 (34.1%)21 (30.4%)207 (44.2%)30 (38.5%)16 (25.4%)
Postgraduate168 (21.9%)5 (6.1%)5 (7.2%)111 (23.7%)6 (7.7%)5 (7.9%)
Urbanization of place of residence
City221 (28.8%)30 (36.6%)11 (15.9%)272 (58.1%)51 (65.4%)31 (49.2%)
Town366 (47.7%)36 (43.9%)44 (63.8%)168 (35.9%)23 (29.5%)22 (34.9%)
Village181 (23.6%)16 (19.5%)14 (20.3%)28 (6.0%)4 (5.1%)10 (15.9%)
Table 2. Results of Bayesian regression models predicting partner involvement in the US and in the UK.
Likelihood of Partner InvolvementLevel of Partner InvolvementLikelihood of Partner Involvement (Based on Relationship to Child)
UKUSUKUSUKUS
N = 836N = 528N = 836N = 528N = 836N = 528
OR
[95% CI]
OR
[95% CI]
IRR
[95% CI]
IRR
[95% CI]
OR
[95% CI]
OR
[95% CI]
Intercept3.63
[0.70, 19.79]
0.23
[0.02, 2.11]
97.23
[91.30, 103.61]
42.67
[48.78, 46.92]
4.27
[0.80, 23.37]
0.20
[0.02, 1.82]
Partner status
Repartnered0.60
[0.32, 1.14]
0.88
[0.43, 1.87]
0.89
[0.87, 0.92]
1.02
[0.99, 1.05]
--
Partner relation to child
Second partner and biological dad----0.97
[0.47, 2.23]
0.70
[0.30, 1.73]
Stepfather----0.19
[0.06, 0.59]
1.54
[0.46, 7.31]
Mother’s age1.01
[0.97, 1.05]
1.09
[1.04, 1.16]
1.00
[1.00, 1.00]
1.02
[1.02, 1.02]
1.00
[0.96, 1.04]
1.10
[1.04, 1.16]
Religious0.79
[0.53, 1.16]
1.08
[0.65, 1.78]
0.96
[0.94, 0.97]
0.94
[0.92, 0.96]
0.77
[0.52, 1.15]
1.10
[0.66, 1.82]
Number of kin residing nearby0.98
[0.93, 1.03]
1.07
[1.01, 1.14]
0.99
[0.99, 1.00]
1.01
[1.01, 1.02]
0.98
[0.93, 1.03]
1.07
[1.01, 1.14]
Focal child’s age0.92
[0.77, 1.10]
0.90
[0.74, 1.08]
0.97
[0.96, 0.97]
0.95
[0.95, 0.96]
0.94
[0.78, 1.11]
0.88
[0.73, 1.06]
Hours weekly in paid care1.01
[0.99, 1.03]
1.02
[1.00, 1.04]
1.00
[1.00, 1.00]
1.00
[1.00, 1.00]
1.01
[0.99, 1.03]
1.02
[1.00, 1.04]
Number of children in home0.97
[0.76, 1.25]
1.03
[0.78, 1.38]
0.99
[0.98, 1.00]
0.98
[0.97, 0.99]
0.91
[0.71, 1.17]
1.06
[0.80, 1.42]
Education1.40
[1.13, 1.77]
1.07
[0.83, 1.38]
1.07
[1.06, 1.07]
1.06
[1.05, 1.07]
1.45
[1.16, 1.83]
1.05
[0.82, 1.37]
Nativity1.38
[0.78, 2.40]
1.32
[0.48, 3.37]
1.11
[1.08, 1.13]
1.13
[1.08, 1.18]
1.39
[0.78, 2.43]
1.38
[0.48, 3.52]
Ethnicity0.80
[0.44, 1.52]
0.85
[0.49, 1.46]
0.95
[0.93, 0.98]
0.96
[0.94, 0.98]
0.81
[0.45, 1.58]
0.87
[0.52, 1.50]
Household quintile0.83
[0.66, 1.03]
0.83
[0.66, 1.05]
0.97
[0.96, 0.98]
1.00
[0.99, 1.01]
0.82
[0.65, 1.03]
0.84
[0.67, 1.07]
Urbanization0.86
[0.65, 1.11]
1.01
[0.70, 1.46]
0.98
[0.97, 0.99]
1.03
[1.02, 1.05]
0.85
[0.65, 1.11]
1.00
[0.69, 1.44]
Table 3. Results of Bayesian regression models predicting childcare involvement of maternal kin in the US and in the UK.
Number of Maternal Kin Providing Childcare HelpLevel of Help from Maternal KinPercentage of Nonpartner Help Received Contributed by Maternal Kin
UKUSUKUSUKUS
N = 918N = 606N = 918N = 606N = 809N = 537
IRR
[95% CI]
IRR
[95% CI]
IRR
[95% CI]
IRR
[95% CI]
Beta
[95% CI]
Beta
[95% CI]
Intercept0.32
[0.18, 0.57]
0.25
[0.11, 0.54]
17.74
[15.53, 20.38]
5.20
[4.38, 6.16]
0.35
[0.22, 0.49]
0.28
[0.08, 0.48]
Partner status
Unpartnered0.62
[0.38, 0.94]
0.57
[0.36, 0.87]
2.76
[2.60, 2.91]
2.42
[2.29, 2.57]
0.20
[0.13, 0.27]
0.29
[0.20, 0.37]
Repartnered0.99
[0.77, 1.26]
1.04
[0.82, 1.33]
1.02
[0.96, 1.09]
0.79
[0.73, 0.86]
−0.00
[−0.06, 0.05]
−0.02
[−0.09, 0.05]
Level of partner involvement1.01
[1.01, 1.01]
1.01
[1.00, 1.01]
1.00
[1.00, 1.00]
1.00
[1.00, 1.00]
0.00
[0.00, 0.00]
0.00
[0.00, 0.00]
Mother’s age1.01
[1.00, 1.03]
1.02
[1.01, 1.04]
0.95
[0.95, 0.95]
0.99
[0.98, 0.99]
−0.01
[−0.01, 0.00]
0.00
[0.00, 0.00]
Religious1.09
[0.96, 1.24]
0.99
[0.83, 1.17]
1.10
[1.07, 1.13]
0.75
[0.73, 0.78]
0.01
[−0.02, 0.04]
−0.03
[−0.08, 0.01]
Number of maternal kin residing nearby1.02
[0.99, 1.05]
1.01
[0.98, 1.05]
1.16
[1.15, 1.17]
1.25
[1.24, 1.26]
0.02
[0.02, 0.03]
0.03
[−0.02, 0.03]
Focal child’s age1.00
[0.94, 1.06]
0.99
[0.93, 1.06]
1.10
[1.08, 1.12]
1.06
[1.04, 1.07]
0.00
[−0.01, 0.02]
0.00
[−0.02, 0.02]
Hours weekly in paid care1.00
[0.99, 1.01]
1.00
[1.00, 1.01]
0.98
[0.98, 0.98]
1.01
[1.01, 1.01]
0.00
[0.00, 0.00]
0.00
[0.00, 0.00]
Number of children in home0.97
[0.89, 1.06]
1.10
[1.00, 1.20]
0.81
[0.79, 0.83]
0.96
[0.93, 0.98]
−0.02
[−0.04, 0.00]
−0.02
[−0.04, 0.01]
Education1.01
[0.93, 1.09]
0.94
[0.86, 1.04]
1.19
[1.16, 1.21]
1.20
[1.17, 1.23]
0.02
[0.00, 0.04]
0.01
[−0.02, 0.03]
Nativity1.10
[0.89, 1.36]
1.06
[0.73, 1.61]
1.36
[1.28, 1.44]
0.43
[0.41, 0.46]
0.04
[0.00, 0.09]
−0.08
[−0.18, 0.01]
Ethnicity0.90
[0.72, 1.12]
0.96
[0.79, 1.17]
0.86
[0.81, 0.90]
1.24
[1.19, 1.30]
−0.03
[−0.08, 0.02]
0.01
[−0.04, 0.06]
Household quintile1.02
[0.95, 1.10]
0.99
[0.91, 1.08]
1.12
[1.10, 1.14]
1.03
[1.01, 1.05]
0.02
[0.00, 0.03]
0.00
[−0.02, 0.03
Urbanization0.95
[0.87, 1.04]
1.07
[0.94, 1.22]
0.98
[0.96, 1.00]
1.43
[1.38, 1.48]
0.00
[−0.02, 0.02]
0.03
[−0.02, 0.05]
Table 4. Results of Bayesian regression models predicting childcare involvement of other (nonpartner, nonmaternal kin) allomothers and reliance on paid care in the US and in the UK.
Number of Other Helpers Providing Childcare HelpLevel of Help from Other HelpersPercentage of Nonpartner Help Received Contributed by Other HelpersNumber of Hours Weekly Spent in Paid Care
UKUSUKUSUKUSUKUS
N = 918N = 606N = 918N = 606N = 809N = 537N = 918N = 606
IRR
[95% CI]
IRR
[95% CI]
IRR
[95% CI]
IRR
[95% CI]
Beta
[95% CI]
Beta
[95% CI]
Beta
[95% CI]
Beta
[95% CI]
Intercept0.17
[0.07, 0.412]
0.06
[0.02, 0.17]
3.01
[2.59, 3.51]
3.79
[3.22, 4.47]
0.24
[0.11, 0.38]
0.25
[0.03, 0.48]
−18.85
[−24,85, −12.95]
−27.01
[−37.12, −17.09]
Partner status
Unpartnered1.49
[0.99, 2.24]
1.71
[1.18, 2.47]
1.94
[1.83, 2.07]
1.95
[1.85, 2.06]
0.11
[0.03, 0.18]
−0.03
[−0.13, 0.06]
5.34
[2.43, 8.40]
6.61
[2.69, 10.42]
Repartnered1.09
[0.75, 1.52]
1.40
[0.96, 1.96]
1.38
[1.31, 1.47]
1.79
[1.70, 1.89]
0.02
[−0.04, 0.09]
0.07
[−0.01, 0.15]
0.49
[−2.30, 3.18]
0.11
[−3.52, 3.68]
Level of partner involvement1.00
[1.00, 1.01]
1.00
[1.00, 1.00]
1.00
[1.00, 1.00]
1.00
[1.00, 1.00]
0.00
[0.00, 0.00]
0.00
[0.00, 0.00]
0.01
[0.00, 0.03]
0.02
[0.00, 0.04]
Mother’s age1.03
[1.01, 1.05]
1.03
[1.01, 1.05]
1.05
[1.04, 1.05]
1.00
[0.99, 1.00]
0.00
[0.00, 0.01]
0.00
[−0.01, 0.00]
−0.05
[−0.20, 0.09]
0.16
[−0.06,0.38]
Religious1.32
[1.09, 1.60]
0.93
[0.73, 1.19]
1.51
[1.46, 1.57]
0.95
[0.92, 0.99]
0.01
[−0.02, 0.04]
−0.01
[−0.06, 0.04]
−0.18
[−1.52, 1.22]
−3.67
[−5.88, −1.37]
Number of maternal kin residing nearby1.05
[1.00, 1.09]
0.99
[0.94, 1.04]
1.06
[1.06, 1.07]
0.98
[0.98, 0.99]
−0.01
[−0.01, 0.01]
−0.01
[−0.02, 0.00]
−0.06
[−0.39, 0.26]
0.38
[−0.08, 0.86]
Focal child’s age0.95
[0.87, 1.04]
0.97
[0.88, 1.07]
0.86
[0.85, 0.88]
0.99
[0.97, 1.00]
−0.01
[−0.03, 0.00]
0.00
[−0.02, 0.02]
5.44
[4.88, 5.99]
1.92
[1.03, 2.79]
Hours weekly in paid care1.01
[1.00, 1.01]
1.01
[1.00, 1.02]
1.01
[1.01, 1.01]
1.01
[1.00, 1.01]
0.00
[0.00, 0.00]
0.00
[0.00, 0.00]
--
Number of children in home0.89
[0.78, 1.01]
1.24
[1.09, 1.40]
0.97
[0.95, 0.99]
1.39
[1.37, 1.42]
0.01
[−0.01, 0.03]
0.03
[0.00, 0.05]
−0.98
[−1.90, −0.05]
−0.79
[−2.07, 0.55]
Education0.92
[0.83, 1.03]
1.00
[0.88, 1.14]
0.95
[0.93, 0.97]
1.07
[1.05, 1.09]
−0.01
[−0.02, 0.01]
0.02
[−0.01, 0.05]
1.73
[0.92, 2.54]
2.57
[1.39, 3.81]
Nativity1.16
[0.85, 1.59]
1.44
[0.82, 2.72]
1.36
[1.28, 1.44]
0.88
[0.82, 0.95]
0.01
[−0.04, 0.06]
0.07
[−0.03, 0.18]
−0.33
[−2.48, 1.83]
2.94
[−1.87, 7.72]
Ethnicity0.77
[0.55, 1.06]
0.95
[0.73, 1.24]
0.88
[0.83, 0.93]
0.89
[0.86, 0.93]
0.01
[−0.04, 0.06]
−0.01
[−0.06, 0.05]
2.43
[0.21, 4.60]
2.33
[−0.13, 4.80]
Household quintile1.02
[0.92, 1.14]
1.14
[1.01, 1.28]
1.02
[1.00, 1.04]
1.14
[1.12, 1.16]
0.00
[−0.02, 0.01]
0.02
[−0.01, 0.04]
3.18
[2.41, 3.95]
2.85
[1.74, 3.92]
Urbanization0.90
[0.79, 1.02]
1.26
[1.04, 1.54]
0.93
[0.91, 0.95]
1.43
[1.39, 1.47]
−0.01
[−0.03, 0.01]
0.02
[−0.02, 0.06]
0.41
[−0.54, 1.36]
2.13
[0.41, 3.89]
Table 5. Results of Bayesian regression models predicting fertility outcomes in the US and in the UK.
Age-Adjusted FertilityIntent to Have Another Child in Next 2 YearsTotal Number of Children Desired
UKUSUKUSUKUS
N = 918N = 609N = 918N = 609N = 918N = 609
Beta
[95% CI]
Beta
[95% CI]
OR
[95% CI]
OR
[95% CI]
IRR
[95% CI]
IRR
[95% CI]
Intercept0.35
[0.02, 0.68]
0.52
[0.01, 1.03]
11.02
[3.19, 38.63]
6.22
[1.20, 33.98]
2.46
[1.74, 3.47]
2.72
[1.76, 4.19]
Partner status
Unpartnered−0.07
[−0.27, 0.12]
0.27
[0.04, 0.49]
0.53
[0.29, 0.95]
0.30
[0.16, 0.55]
1.05
[0.89, 1.22]
0.94
[0.80, 1.09]
Repartnered0.90
[0.71, 1.10]
0.72
[0.49, 0.95]
1.15
[0.56, 2.30]
0.65
[0.31, 1.29]
1.08
[0.92, 1.25]
0.98
[0.84, 1.15]
Parity--0.31
[0.24, 0.41]
0.51
[0.39, 0.65]
1.27
[1.21, 1.32]
1.27
[1.21, 1.33]
Mother’s age--0.93
[0.89, 0.96]
0.94
[0.90, 0.98]
0.98
[0.97, 0.99]
0.98
[0.97, 0.99]
Religious0.13
[0.03, 0.24]
0.13
[−0.02, 0.28]
1.65
[1.19, 2.27]
2.00
[1.35, 2.95]
1.06
[0.98, 1.16]
1.09
[0.99, 1.21]
Education−0.14
[−0.20, −0.08]
−0.18
[−0.26, −0.10]
1.16
[0.96, 1.40]
1.15
[0.94, 1.41]
1.03
[0.98, 1.09]
1.01
[0.96, 1.07]
Nativity0.09
[−0.06, 0.24]
0.27
[−0.04, 0.59]
1.21
[0.78, 1.93]
0.68
[0.29, 1.55]
1.01
[0.90, 1.15]
1.00
[0.81, 1.25]
Ethnicity0.11
[−0.06, 0.27]
0.00
[−0.16, 0.17]
1.21
[0.78, 1.93]
1.11
[0.72, 1.67]
1.06
[0.93, 1.21]
1.08
[0.97, 1.20]
Household quintile−0.05
[−0.11, 0.00]
0.06
[−0.01, 0.13]
1.26
[0.77, 2.05]
1.09
[0.90, 1.31]
1.00
[0.95, 1.05]
1.01
[0.96, 1.06]
Urbanization0.01
[−0.06, 0.08]
−0.15
[−0.26, −0.03]
1.11
[0.93, 1.32]
1.16
[0.85, 1.57]
1.01
[0.96, 1.07]
0.99
[0.92, 1.07]
Table 6. Results of Bayesian regression models predicting age-adjusted fertility in the US and in the UK.
Age-Adjusted FertilityAge-Adjusted Fertility
UKUSUKUS
N = 918N = 609N = 918N = 609
Beta
[95% CI]
Beta
[95% CI]
Beta
[95% CI]
Beta
[95% CI]
Intercept0.42
[0.08, 0.76]
0.48
[−0.02, 0.97]]
0.41
[0.08, 0.75]
0.49
[−0.02, 0.99]]
Partner status
Unpartnered−0.12
[−0.32, 0.08]
0.27
[0.06, 0.49]
−0.10
[−0.30, 0.09]
0.25
[0.03, 0.48]
Repartnered0.90
[0.70, 1.09]
0.71
[0.48, 0.94]
0.89
[0.70, 1.09]
0.71
[0.48, 0.94]
Total amount of childcare help0.00
[0.00]
0.00
[0.00, 0.00]
--
Number of helpers--−0.04
[−0.08, −0.01]
0.04
[−0.02, 0.10]
Religious0.14
[0.03, 0.24]
0.13
[−0.02, 0.28]
0.14
[0.04, 0.25]
0.13
[−0.02, 0.28]
Education−0.14
[−0.20, −0.08]
−0.18
[−0.26, −0.10]
−0.14
[−0.20, −0.08]
−0.18
[−0.26, −0.10]
Nativity0.11
[−0.04, 0.26]
0.28
[−0.03, 0.60]
0.12
[−0.03, 0.28]
0.27
[−0.05, 0.60]
Ethnicity0.10
[−0.07, 0.27]
0.00
[−0.16, 0.17]
0.10
[−0.07, 0.26]
0.00
[−0.16, 0.16]
Household quintile−0.05
[−0.11, 0.01]
0.05
[−0.02, 0.12]
−0.05
[−0.11, 0.01]
0.05
[−0.02, 0.12]
Urbanization0.01
[−0.06, 0.08]
−0.15
[−0.26, −0.04]
0.01
[−0.06, 0.08]
−0.15
[−0.26, −0.04]
Publisher’s Note: MDPI stays neutral with regard to jurisdictional claims in published maps and institutional affiliations.

